Supply Chain Management: Assessing Costs and Linkages in the ...

Assessing the Costs Attributed to Project Delays
Texas Transportation Institute
The Texas A&M University System College Station, Texas
September 2011
0-6581

Assessing the Costs Attributed to Project Delays
by
Curtis Beaty, P.E.
Associate Research Engineer
David Ellis, Ph.D.
Research Scientist
Jon Epps, Ph.D., P.E.
Executive Associate Director
Brianne Glover
Associate Transportation Researcher
Nicolas Norboge
Assistant Transportation Researcher
and
Bill Stockton, Ph.D., P.E.
Executive Associate Agency Director
Project 0‐6581
Performed in cooperation with the
Texas Department of Transportation
September 2011
TEXAS TRANSPORTATION INSTITUTE
The Texas A&M University System
College Station, Texas 77843‐3135

P a g e | 1
EXECUTIVE SUMMARY
All departments of transportation (DOTs) face delays on highway projects. They often have anecdotal accounts of
the significant financial impact that the delay of a highway project had on project costs, local businesses and
commuters, and other users of the highway. But in many cases hard data on the financial impact are lacking. This
project for the Texas Department of Transportation (TxDOT) aims to develop a simple but sound methodology for
estimating the cost of delaying most types of highway projects. The project draws on two main resources to
produce reliable estimates of impacts:
Existing data from projects completed in fiscal year (FY) 2009 and reported in TxDOT’s Design Construction
Information System (DCIS).
Methodologies developed for other applications that can be applied to estimating the cost of project delay.
DelayduringProjectPhases
Delay can occur in any phase in the project:
Planning/scoping phase: Delay can be significant when litigation is initiated.
Development phase: Permitting (environmental, fish and wildlife, railroad, etc.), right‐of‐way acquisition, and
utility agreements can be significant causes of delay.
Contracting phase: Generally, this phase has less incidence of delay but can still have issues.
Construction phase: This phase has numerous opportunities for delay and is often the delay most visible to
the public.
Project delay almost always has costs associated with it, which is not to say that all project delay is a waste of time
and public money. In many instances of project delay initiated by TxDOT, the reason for the delay is to make an
improvement in the design or construction of the project that will ultimately deliver better value to the public.
EstimationModel
This project developed a simplified model that incorporates 16 user‐controlled variables and produces estimates of
the effect of project delay on personal and commercial travel and the cost to the general economy. Three projects
of varying size were used as examples:
The “small project” illustrates delay to an $11.4 million, four‐lane roadway project in a rural setting. The
project’s 33‐month delay produced an additional $3.5 million cost to the economy, or $96,000 for every
month of delay.
The “medium project” illustrates delay to a $49.6 million, urban freeway project. The project’s 58‐month
delay produced an additional $17.8 million cost to the economy, or almost $300,000 for every month of
delay.
The “large project” illustrates delay to an $82.2 million interstate highway improvement in a large metro
area. The project’s 11‐month delay produced an additional $5.1 million cost to the economy, or $447,000
for each month of delay.

ASSESSING THE COSTS ATTRIBUTED TO PROJECT DELAYS
CaseStudies
Finally, the report includes three atypical case studies that demonstrate a range of delay issues, all with costs
attached including litigation costs and termination fees paid to contractors. These costs are in addition to the types
of costs calculated in the model discussed above.

ASSESSING THE COSTS ATTRIBUTED TO PROJECT DELAYS
PURPOSE AND SCOPE OF THE REPORT
This report helps identify the costs of delays to completing roadway projects, and a methodology for estimating
those additional costs to the state and to users. The report also addresses three basic elements related to project
delay:
Definitions and types of project delay.
Methodology for estimating project‐specific delay costs.
Case studies that demonstrate the application of the methodology.
For this report, the Texas Transportation Institute (TTI) examined recent TxDOT projects that meet the following
requirements:
Construction projects (e.g., new construction, reconstruction, and rehabilitation).
Projects that had sufficient data requirements in order to be analyzed (e.g., projects in metropolitan
planning organization [MPO] jurisdictions with readily available travel demand data).
The following types of transportation projects were excluded from this analysis:
Projects that experienced delays due to lack of funding.
Transportation projects with a total project investment of less than $7 million.
Maintenance projects.
In most cases examined in this study, delay occurred because the project missed a milestone according to the project schedule dates established by the project engineer and the respective TxDOT district. This study did not examine the scheduling process that occurs during the planning/scoping phase of the project life cycle to see if that aspect of a project (i.e., overly optimistic schedules) might be an inherent source of delay.
TERMINOLOGY
The following glossary defines certain terms and phrases used within this report. It also clarifies what is and is not
included in the various types of costs associated with project delays. Appendix A contains a list of acronyms used in
this document.
Direct Costs of Project Delay—actual out‐of‐pocket costs borne by any stakeholder affected by a delay in project
delivery. Most of the direct costs accrue to TxDOT and, therefore, are passed on to the public in the form of less‐
efficient use of taxpayer resources.
Indirect Costs of Project Delay—hidden costs that are borne by stakeholders, often a much greater amount than
the direct costs of project delay. Indirect costs include:
Wasted traveler fuel and time.
Economic impacts in the vicinity of the project.
Loss of business efficiency for those businesses that rely on the transportation system for their
productivity.
ASSESSING THE COSTS ATTRIBUTED TO PROJECT DELAYS
Project Delay—In estimating the difference in planned and actual project completion date, this report assumes
that the planned completion date is the date from the notice to proceed plus the number of days allowed for
construction. The actual completion date is when the project is open for public use.
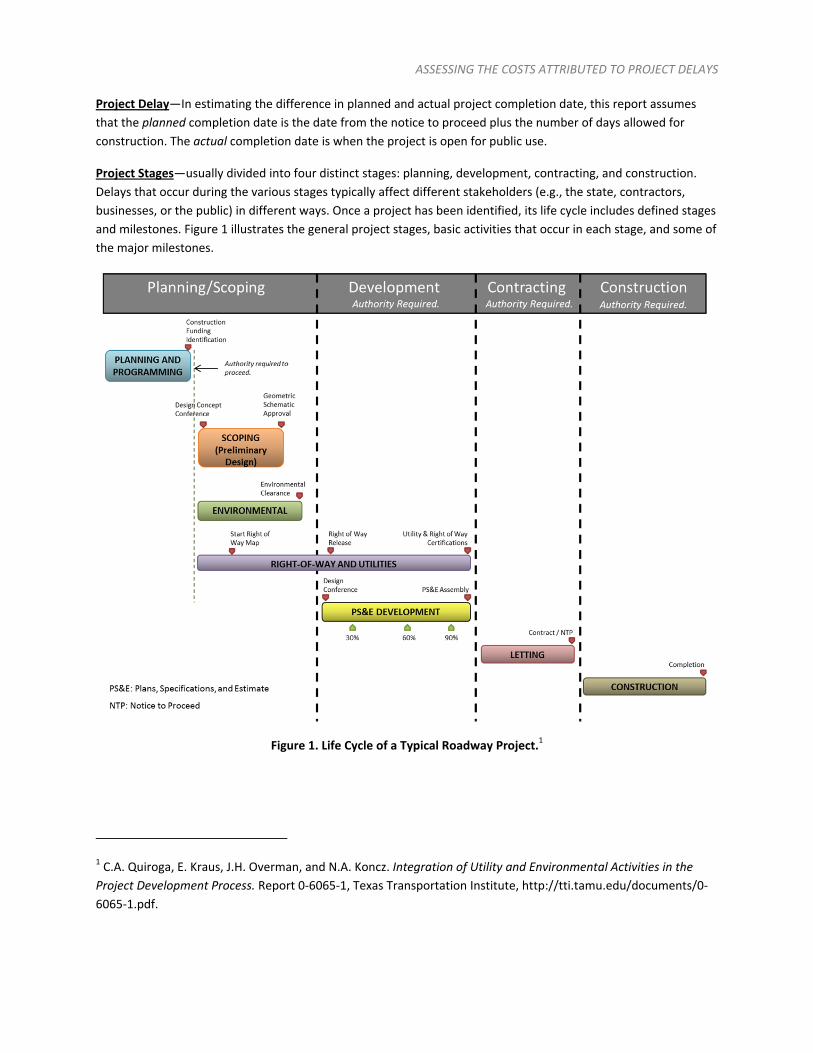
Project Stages—usually divided into four distinct stages: planning, development, contracting, and construction.
Delays that occur during the various stages typically affect different stakeholders (e.g., the state, contractors,
businesses, or the public) in different ways. Once a project has been identified, its life cycle includes defined stages
and milestones. Figure 1 illustrates the general project stages, basic activities that occur in each stage, and some of
the major milestones.
Figure 1. Life Cycle of a Typical Roadway Project.1
1 C.A. Quiroga, E. Kraus, J.H. Overman, and N.A. Koncz. Integration of Utility and Environmental Activities in the
Project Development Process. Report 0‐6065‐1, Texas Transportation Institute, http://tti.tamu.edu/documents/0‐
6065‐1.pdf.
ASSESSING THE COSTS ATTRIBUTED TO PROJECT DELAYS
P a g e | 5
WHO BEARS THE COST OF PROJECT DELAY?
Ultimately, the public bears the cost of project delay.
Three major groups of stakeholders are affected by project delay:
The agency.
The public.
Contractors (and their suppliers).
Figure 2 provides a conceptual schematic diagram of how direct and indirect costs at various stages of the project
timeline can affect these stakeholders.
The costs of project delays can be classified as either direct or indirect costs to the public, the agency, or
contractors. Some costs to the agency or contractors associated with contract delay are recoverable by the entity
incurring the cost; others are not. As shown in Figure 2, ultimately, all costs are eventually borne by the public.
Direct costs are divided into three categories:
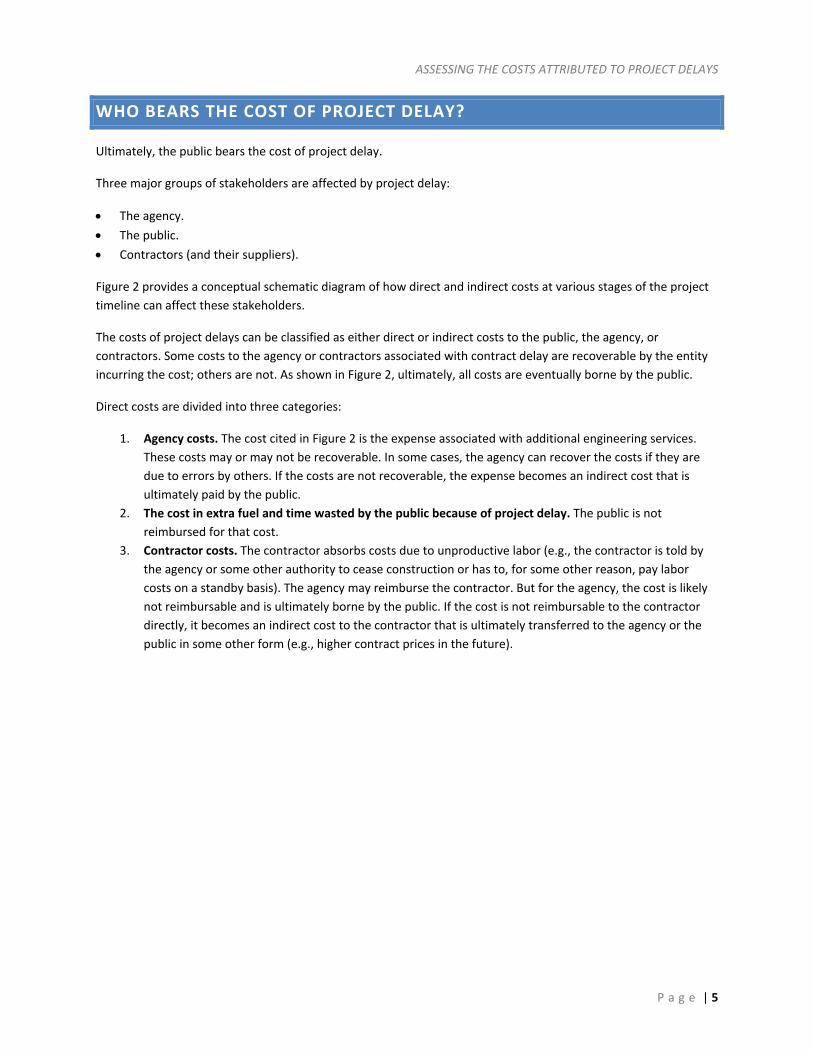
1. Agency costs. The cost cited in Figure 2 is the expense associated with additional engineering services.
These costs may or may not be recoverable. In some cases, the agency can recover the costs if they are
due to errors by others. If the costs are not recoverable, the expense becomes an indirect cost that is
ultimately paid by the public.
2. The cost in extra fuel and time wasted by the public because of project delay. The public is not
reimbursed for that cost.
3. Contractor costs. The contractor absorbs costs due to unproductive labor (e.g., the contractor is told by
the agency or some other authority to cease construction or has to, for some other reason, pay labor
costs on a standby basis). The agency may reimburse the contractor. But for the agency, the cost is likely
not reimbursable and is ultimately borne by the public. If the cost is not reimbursable to the contractor
directly, it becomes an indirect cost to the contractor that is ultimately transferred to the agency or the
public in some other form (e.g., higher contract prices in the future).

ASSESSING THE COSTS ATTRIBUTED TO PROJECT DELAYS
P a g e | 6
Figure 2. Stakeholder Impacts of Direct and Indirect Project Costs.
Who Pays?Is it Reimbursable?Who Pays?Is it
Reimbursable?Who Pays?Is it Reimbursable?Who Pays?Type of Cost
Cost of Project Delay
Direct Cost
Public (Fuel/Time)
No
Agency (Engineering
Costs)
Yes Contractor Yes, Indirectly Agency No Public
No, Becomes Indirect
Public
Contractor (Unproductive
Labor)
Yes Agency No Public
No, Becomes Indirect
Agency No Public
Indirect Cost
Public (Economic Loses)
No
Agency (Reallocation of Funds)
No Public
Contractor (Opportunity
Cost)Yes Agency No Public

ASSESSING THE COSTS ATTRIBUTED TO PROJECT DELAYS
P a g e | 7
CoststothePublic
Direct and indirect costs paid initially by the agency are ultimately borne by the public. For example, when a
project is delayed early in the process, engineering, right‐of‐way, material, labor, or other cost elements may
increase because of the delay. This is a direct cost of project delay that is ultimately paid by the public.
Additionally, because TxDOT has a finite supply of funds with which to operate in a given year, the increased costs
will likely mean that other previously scheduled and budgeted projects will have to be postponed and their
benefits delayed. These are considered indirect costs to the public.
CoststoTravelersintheAffectedCorridor
Two of the most recognized costs to the public are associated with wasted time and fuel cost. We all place a value
on our time. When a project is delayed and improvements to the particular corridor postponed, the benefits
associated with that improvement (e.g., higher speeds and shorter commute times) are not realized. Furthermore,
with the slower commute speeds, fuel efficiency may be reduced, resulting in higher fuel costs for travelers.
CoststoBusinessesandTheirConsumers
One of the most important cost aspects of project delay is the impact on businesses and consumers. Businesses
are affected by roadway congestion in much the same way as motorists. As speeds are reduced, operating costs
(i.e., driver time, vehicle operating costs, fuel costs, etc.) are increased. Ultimately, these costs are passed on to
the consumer. But there can be other, more pervasive impacts as well.
Almost all surveys that ask businesses about factors that influence location decisions show similar results. They
indicate that businesses most value the following when deciding where to locate a facility:
A fair and reasonable tax system.
An educated and available workforce.
Access to markets.
Reduced mobility affects businesses in two ways: it reduces the supply of qualified workers who live within a
reasonable commute distance, and it increases the cost of accessing markets, causing increased shipping costs for
both raw materials and finished products.
With respect to labor markets, as mobility is reduced and commute times lengthen, the labor pool within a
one‐hour commute to a particular location is reduced. To attract a wider number of potential employees, some
companies may find it necessary to offer higher wages to offset the higher costs of commuting. If they do, those
higher wages are potentially reflected in higher finished product cost, hindering the company’s ability to compete
in a market. If the costs of higher wages are not reflected in higher product costs, then income to the company’s
shareholders is reduced.
Similarly, reduced mobility affects the cost of finished goods when fuel cost, driver time, and vehicle‐operating
costs are increased because of lower speeds on the roadways.
CoststoContractors
Contractor costs also increase because of project delay. If a project is delayed after a contractor has mobilized a
workforce and obtained equipment, consumables, and other materials, the contractor must often absorb those

ASSESSING THE COSTS ATTRIBUTED TO PROJECT DELAYS
P a g e | 8
costs. This reduces income to the company and to its shareholders. To the extent that those costs are recoverable,
they are passed on to consumers during a subsequent project.
In addition, the uncertainty associated with project delays can impede a contractor from bidding on other projects.
These lost opportunities can reduce competition, which may result in higher construction bids on other projects.
Conclusion
With few exceptions, the public ultimately bears the cost of delays—traveler costs, added transportation costs in
retail products, loss of business efficiency (resulting in higher costs and lower profits), and fewer public (TxDOT)
dollars available to spend on a variety of project needs.
SAMPLE METHODOLOGY FOR ESTIMATING COST IMPACTS
OF PROJECT DELAY
TypesofExampleProjects
Table 1 shows three different example projects:
“Small projects” range in cost from $7 million to $20 million.
“Medium projects” range in cost from $20 million to $80 million.
“Large projects” cost more than $80 million.
The small project illustrates the costs associated with a four‐lane roadway in a rural setting. In this example, the
roadway is a 2.7‐mile‐long widening project on FM 1488 in the Houston District. The project stretched from just
east of SH 242 to just west of IH 45. The two‐lane roadway was widened to a four‐lane divided roadway. The
project began in March 2009 after 33.5 months of delay. The cost associated with this delay is estimated at
$96,000 per month, or a total of more than $3.5 million.
The medium project depicts the cost associated with an urban freeway project, in this instance a 2.6‐mile‐long
widening project on US 59 in the Houston District. The project segment stretched north of FM 1314 to just north of
Northpark Drive. The freeway was widened to consist of eight main lanes with two three‐lane frontage roads. After
almost five years of delay, the project began in August 2002. The estimated cost of delay per month was $297,000
per month, or a total of $17.8 million over the entire delay period.
The final example is the large project, showing costs associated with an interstate project in a large metro area—
an interchange reconstruction project at IH 10 and IH 410 in the San Antonio District. The 1.5‐mile‐long project was
from south of Callaghan Road to south of North Crossroads. This project began in July 2002 and experienced an
11‐month delay during construction. The cost of delay per month was an estimated $447,000 per month, or
$5.1 million for the entire 11‐month period.

ASSESSING THE COSTS ATTRIBUTED TO PROJECT DELAYS
P a g e | 9
Table 1. Sample Costs to the Public Resulting from Project Delays.
Estimated Cost of Project Delay
Project Description
Project‐Related Variables
Small Project Medium Project Large Project
Project Cost (Millions) $11.4 $49.6 $82.2
Total Months Project Was Delayed 33.5 58.8 11.1
Change in Highway Cost Index (HCI) (during Delay) 11% 29% 3%
Travel‐Related Variables
Length of Project 2.7 2.6 1.5
Average Daily Traffic—Before Improvement 21,000 91,000 158,000
Average Daily Traffic—After Improvement 26,000 99,000 196,000
Travel Speed—Before Improvement 46 58 59
Travel Speed—After Improvement 50 60 61
Percent Trucks—Before Improvement 4.5% 10.0% 3.9%
Percent Trucks—After Improvement 4.5% 10.5% 3.9%
Commonly Used Assumptions
Persons per Vehicle 1.25 1.25 1.25
Value of Time—Cars $16.28 $16.28 $16.28
Value of Time—Trucks $107.42 $107.42 $107.42
Cost of Fuel—Cars $3.78 $3.78 $3.78
Cost of Fuel—Trucks $3.95 $3.95 $3.95
Return on Investment Associated with Economic Impacts
8.0% 8.0% 8.0%
Monthly Cost of Project Delay
Wasted Time from Project Delay—Personal $26,363 $31,248 $63,902
Wasted Fuel from Project Delay—Personal $19,260 $8,510 $7,421
Wasted Time from Project Delay—Commercial $6,557 $18,410 $13,689
Wasted Fuel from Project Delay—Commercial $1,094 $3,334 $1,413
Total Direct Cost to Travelers $52,180 $58,167 $85,012
Construction Cost Increase per Month (based on HCI) $32,957 $191,956 $283,624
Sub‐total, Direct Costs $85,137 $250,123 $368,636
Economic Impact of Project Delay $10,841 $47,170 $78,172
Total Cost of Project Delay per Month $95,978 $297,293 $446,808
Total Cost of Project Delay $3,551,431 $17,764,387 $5,127,080

ASSESSING THE COSTS ATTRIBUTED TO PROJECT DELAYS
P a g e | 10
DiscussionofMediumProjectExample
Using the medium project as an example illustrates how project delays can ultimately cost the public. In this
example, a $49.6 million project was delayed a total of 58.8 months. The following conditions on the roadway
were present:
91,000 vehicles in average daily traffic.
Commercial trucks making up 10 percent of vehicles.
1.25 persons per automobile.
58 miles per hour average speed before the improvements.
60 miles per hour average speed after the improvements.
a 29 percent increase in the price of construction during the time the project was delayed.2
The medium project, as shown in Table 1, demonstrates that when applying standard values of time for both
individuals and commercial vehicles—and assuming a conservative 8 percent return on investment in roadway
infrastructure3 (national studies indicate the return is more likely in the 10 to 12 percent range)—the 58.8‐month
delay had a total cost of $17.8 million, or almost $300,000 per month.
Of that cost, slightly over $250,000 per month was the result of construction price increases estimated by using the
HCI. Almost all of this increase resulted from the significant increases in commodity prices (e.g., cement, base
material, steel, asphalt, and fuel) experienced during the period. Almost $50,000 per month was the result of
delays in commuter and business delivery times, while almost $12,000 per month was the result of increased fuel
costs associated with higher consumption at slower speeds. Finally, almost $50,000 per month was associated with
the economic impact of delay.
The expansion of the roadway allowed substantially more throughput, though only modest changes in speed.
Because of the induced demand associated with expanded roadways, speeds can actually stay the same or slightly
decrease as more vehicles use the freeway. When that occurs, vehicles are drawn to the new/expanded facility
from other highways and/or arterial streets, thereby improving travel times, reducing wasted fuel, and generating
a positive economic effect on those particular roadways. In general, however, the magnitude of the impact of
project delay depends on traffic volume and speed, percent trucks, spikes in construction costs, and duration of
delay.
Also, because of the number of variables involved (and their relative importance depending upon roadway
location, roadway type, availability of transportation alternatives, traffic mix, cost of materials, etc.), in almost
every instance where a project is delayed, the cost of delay can vary significantly. As a result, every instance of
construction delay, even on roadways that appear to be similar in nature, can result in a different cost of delay
estimate. See Appendix B for a description of the variables and methodology used for the cost calculations.
2 Project inflation calculations taken from the Highway Cost Index produced by the Texas Department of
Transportation (http://ftp.dot.state.tx.us/pub/txdot‐info/cst/hci_binder.pdf).
3 M. Ishaq Nadiri and Theofanis P. Mamuneas. “Contribution of Highway Capital to Output and Productivity Growth
in the US Economy and Industries.” http://www.fhwa.dot.gov/policy/gro98cvr.htm.

ASSESSING THE COSTS ATTRIBUTED TO PROJECT DELAYS
P a g e | 11
SUMMARY
This brief research project examined the costs that result when a roadway project is delayed. It examined both
direct and indirect impacts of project delays and found that the public almost always bears the costs, either
directly through wasted fuel and time or indirectly through less‐efficient use of the limited supply of roadway
funds. This project did not directly examine the value of any of the delays, though it was evident while examining
the data that many delays actually produced benefits that equaled or exceeded the cost of the delay.
The simple methodology developed in this project allows TxDOT to quickly estimate the cost of delay to a roadway
project. Using that methodology, researchers examined three actual projects. The smallest of the three resulted in
project delay costs of $96,000 per month, while the largest project resulted in project delay costs of $447,000.
While the methodology is simple, there is no rule of thumb because project delay costs depend on several
variables, primarily location, traffic, construction costs, and travel speeds.
The methodology also includes a monthly local economic impact component, which for the three examples ranged
from $10,000 per month to $78,000 per month.
The appendices to this report contain data, terminology, and methodologies developed in this research:
Appendix A—List of Acronyms.
Appendix B—Description of Calculations Used in Estimating Project Delay Costs.
Appendix C—General Information Regarding Delays.
Appendix D—Additional Examples of Project Delay.
Appendix E—Typical Causes of Delay.
Appendix F—Delayed Projects Studied.
Appendix D illustrates case examples of projects or circumstances that either have a largely undefined impact or
are too complex for this straightforward methodology to assess the delay impacts.

ASSESSING THE COSTS ATTRIBUTED TO PROJECT DELAYS
P a g e | A ‐ 1
APPENDIX A—LIST OF ACRONYMS
AGUA Aquifer Gardens for Urban Areas
CAMPO Capital Area Metropolitan Planning Organization
CE Categorical Exclusion
DCIS Design Construction Information System
DEIS Draft Environmental Impact Statement
EA Environmental Assessment
EIS Environmental Impact Statement
FEIS Final Environmental Impact Statement
FHWA Federal Highway Administration
FONSI Finding of No Significant Impact
FY Fiscal Year
HCI Highway Cost Index
MPO Metropolitan Planning Organization
NEPA National Environmental Policy Act
PS&E Plan, Specification, and Estimation
RMA Regional Mobility Authority
ROD Record of Decision
ROW Right of Way
TTI Texas Transportation Institute
TURF Texans United for Reform and Freedom
TxDOT Texas Department of Transportation

ASSESSING THE COSTS ATTRIBUTED TO PROJECT DELAYS
P a g e | B ‐ 1
APPENDIX B—DESCRIPTION OF CALCULATIONS USED IN ESTIMATING
PROJECT DELAY COSTS
Variables
The output of the model provides both direct and indirect cost estimates. Direct cost estimates include wasted
time and fuel for both personal and commercial travel. Indirect cost includes the economic impact of project delay.
The spreadsheet‐based model uses 17 variables divided into three categories to calculate direct and indirect costs
associated with project delay. Those variables include the following.
CalculationsTab
Project Cost—in millions of dollars. This is the contracted amount.
Average Annual Daily Traffic before the Improvement—determined for the segment that most closely
represents the roadway segment under construction.
Average Annual Daily Traffic after the Improvement—determined for the segment that most closely
represents the roadway segment under construction.
Percent of Trucks before Improvement—determined for the segment that most closely represents the
roadway segment under construction.
Percent of Trucks after Improvement—determined for the segment that most closely represents the
roadway segment under construction.
Persons per Vehicle—a default value of 1.25 persons per personal vehicle.
Average Speed before Improvement—determined for the segment that most closely represents the
roadway segment under construction.
Average Speed after Improvement—determined for the segment that most closely represents the
roadway segment under construction.
Length of Segment in Miles—determined from the construction contact.
Personal Value of Time—determined by using the value of personal time used in the most recent Urban
Mobility Report published by TTI.
Commercial Value of Time—determined by using the value of personal time used in the most recent
Urban Mobility Report published by TTI.
Return on Investment—the default is 8 percent annually, based on a Federal Highway Administration
report by Nadiri and Mamuneas.3
Percent of Increase in Highway Cost Index—determined by using the Highway Cost Index published
monthly by TxDOT.
Total Months of Delay—determined using the dataset of highway construction projects furnished for this
study by TxDOT.
FuelTab
Fuel Price—the current fuel price.

ASSESSING THE COSTS ATTRIBUTED TO PROJECT DELAYS
P a g e | B ‐ 2
EconomicImpactTab
Multiplier—an estimate of the general multiplier for economic activity based on the state’s economic
profile.
Percent Profit—the average profit margin across all business based on the state’s economic profile.
Calculations
The following general steps are used in calculating an estimate of the cost of project delay:
1. Convert daily traffic into monthly traffic volume.
2. Calculate the travel time for the segment under construction for both before the improvement was
started and after it was completed.
3. Calculate the total hours of travel over the segment for both before the improvement was started and
after it was completed.
4. Calculate the total personal hours of travel using the number of personal vehicles traveling the segment
multiplied by average occupancy. Calculations are performed for both before and after the improvement.
5. Calculate the total vehicle hours of travel for commercial vehicles. Calculations are performed for both
before and after the improvement.
6. Calculate the net hours of delay by subtracting the “before” and “after” delay for both personal and
commercial travel.
7. Multiply the excess hours of delay for personal and commercial travel by the respective value of time to
obtain the delay cost associated with the construction delay.
8. Determine the net cost of fuel for commercial vehicles using a fuel/speed curve developed for use in TTI’s
Urban Mobility Report, comparing the amount of fuel consumed at the “before” speed versus the “after”
speed, and using the respective volumes for the two periods.
9. Multiply the difference in fuel consumption at the “before” speed and the “after” speed by the prevailing
retail fuel price to obtain the fuel cost for personal and commercial travel associated with the
construction delay.
10. Calculate the economic impact by multiplying the capital investment by the rate of return (assumed to be
8 percent per annum) plus the annual return multiplied by the assumed rate returned to profit.
11. Calculate the cost of construction inflation by taking the difference between the contract amount at the
date the project begins minus the discounted value of the contract at the date the project was originally
scheduled to begin. Use the HCI to calculate the discount rate.

ASSESSING THE COSTS ATTRIBUTED TO PROJECT DELAYS
P a g e | C ‐ 1
APPENDIX C—GENERAL INFORMATION REGARDING DELAYS
This appendix contains a general explanation of three typical areas in which projects can be delayed: regulatory
delays, environmental review delays, and legal actions. Because of the statutory nature of these processes, TxDOT
must follow defined procedures throughout each area until the final resolution.
RegulatoryDelays
The National Environmental Policy Act (NEPA) requires federal agencies to outline the environmental impact their
proposed actions will have and to assess the impacts of alternative actions.4 TxDOT projects funded in any part by
federal monies are required to gain environmental approval through the NEPA regulatory process defined by three
levels of analysis as shown in Table C‐1.
Table C‐1. NEPA Levels of Analysis.
NEPA Level Description
Categorical Exclusion (CE)
This status is given to those projects that do not significantly impact the environment.
Environmental Assessment (EA)
An EA must be conducted when the environmental significance is unknown. The results of an EA can lead to one of the following:
Finding of No Significant Impact (FONSI).
Environmental Impact Statement.
Environmental Impact Statement (EIS)
An EIS is a more in‐depth report that must include consideration of alternatives and public involvement. The EIS consists of four steps: 1. Notice of Intent (NOI). 2. Draft EIS (DEIS). 3. Final EIS (FEIS). 4. Record of Decision (ROD).
If a final EIS is not submitted within three years from the date of the draft EIS, or there have been no major steps
to advance the action three years after a final EIS (e.g., authority to begin final design or to acquire right of way), a
written evaluation should be prepared to determine if a supplemental EIS is warranted.5 A supplemental EIS is
necessary if considerable changes have been made to the project, or there is significant new information available.
A supplemental EIS is developed like any other EIS, excluding the need for scoping. Furthermore, once a project
4 U.S. Environmental Protection Agency. Environmental Impact Statement Process.
http://www.epa.gov/compliance/nepa/eisdata.html.
5 CFR Title 23, §771.129. http://ecfr.gpoaccess.gov/cgi/t/text/text‐
idx?c=ecfr&tpl=/ecfrbrowse/Title23/23cfr771_main_02.tpl.

ASSESSING THE COSTS ATTRIBUTED TO PROJECT DELAYS
P a g e | C ‐ 2
has received an ROD, FONSI, or CE, a verification that the designation remains in place should be made prior to any
major approvals or grants.5
EnvironmentalReviewDelays
Projects that do not necessarily fall under NEPA regulations may still have environmental impacts that must be
addressed. The safety of roadway users and the cost of avoiding environmental impacts are factors that must be
weighed against environmental and aesthetic interests. A concerned citizen or environmental group may delay the
project by requesting changes that mitigate the harm or by bringing suit in a state court (as opposed to a NEPA suit
in federal court).
LegalActions
When a lawsuit is filed in reference to a proposed or active project, the party bringing suit may seek an injunction
to bring current work to a halt regardless of the stage of progress. If the court grants the injunction, the project will
be suspended in its entirety or in part until a court can hear arguments from both sides and rule on the matter. If
the injunction is denied, the opposing party can still file suit with the hope of either receiving a favorable ruling
before damage has been done or TxDOT addressing the problem to avoid the additional cost and delay.

ASSESSING THE COSTS ATTRIBUTED TO PROJECT DELAYS
P a g e | D ‐ 1
APPENDIX D—ADDITIONAL EXAMPLES OF PROJECT DELAY
TTI selected three additional projects as examples to illustrate the different causes of delay, costs associated with
the delay, and potential complexity in estimating delay costs from one project to another. The following projects
were selected:
• US 281 (Bexar County) in the San Antonio District (major highway expansion delayed several years).
• SH 45 Southeast (Travis County) in the Austin District (new connector highway delayed several years).
• SH 16 (Bandera County) in the San Antonio District (safety improvements delayed several months).
Each case study examines the type of delay incurred, a timeline of actions taken, and the ultimate result of the
delay, as of 2009. Researchers did not select projects because they represent the typical delayed project or signify
usual resolutions to overcome delays. Rather, researchers chose these projects because they illustrate the
magnitude and complexity of actions taken to resolve the issues that cause project delay. Project delays examined
in these cases fit into one or more of the following categories: regulatory, environmental, and/or legal. Appendix C
contains a general description of the processes associated with each category and how they can cause project
delays.
US281—SanAntonio
The US 281 project is an example of an initially straightforward project that became very complex because of
multiple and fractured delays. TxDOT employed a variety of improvements to reduce the impacts of the various
delays.
The segment of US 281 in San Antonio studied stretches north from Bitters Road (south of Loop 1604) to Borgfeld
Road (Figure D‐1).6 Major intersections included in this improvement are Loop 1604, Sonterra Boulevard, Encino
Rio Road, Evans Road, Stone Oak Parkway, and Marshall Road.
6 Map source: Alamo Regional Mobility Authority, http://www.alamorma.org/index.cfm/projects/us‐281‐eis/.

ASSESSING THE COSTS ATTRIBUTED TO PROJECT DELAYS
P a g e | D ‐ 2
Figure D‐1. Map of US 281 Expansion Project.
While the project involved multiple legal battles, this study focuses primarily on delays caused by the
environmental regulatory process. Lawsuits filed by citizens’ groups required the environmental studies to be
repeated and, at times, restarted the regulatory process required to gain environmental clearance.
Because of the delays, several short‐term fixes have been proposed as separate projects requiring no
environmental analysis to help alleviate the congestion. Improvements to the US 281/Loop 1604 interchange were
eventually developed as one of these separate projects, independent of the sizeable US 281 North expansion
project.
Timeline
OriginalEnvironmentalAssessment
In 1984, the US 281 North expansion from Bitters Road to Evans Road was given environmental clearance after an
EA was conducted.
In the early 1990s, a segment of this project was constructed from Bitters Road to Sonterra Boulevard.
In 2000, the environmental clearance for construction from Sonterra Boulevard to Evans Road was reevaluated
because more than 15 years had passed since the first EA was conducted.
In 2001, development from Loop 1604 to Evans Road was approved by the MPO. The MPO dedicated about half of
the estimated needed funds ($42 million) in its 2002–2004 Transportation Improvement Program.
In 2003 and 2004, the US 281 North project was studied to determine whether tolling new lanes would be a
practical funding solution, and the following year the MPO voted to construct the new lanes as privately funded
toll facilities.
In 2005, TxDOT received unsolicited bids for a privatized toll project. That same year environmental clearance was
granted for the segment stretching from Evans Road to Borgfeld Road.

ASSESSING THE COSTS ATTRIBUTED TO PROJECT DELAYS
P a g e | D ‐ 3
2005:FirstLawsuit
Construction of an $80 million expansion segment from Loop 1604 to Marshall Road was halted at the end of 2005
when local environmental groups—Aquifer Guardians for Urban Areas (AGUA) and Texans Uniting for Reform and
Freedom (TURF)—sought a court order enjoining the continuation of construction. The Federal Highway
Administration (FHWA) withdrew environmental approval because of the lawsuit, and a new EA commenced.
2007:SecondEnvironmentalAssessment7
In 2007, TxDOT completed a two‐year, $2 million EA that combined all projects on US 281 from Loop 1604 to
Borgfeld Road. As a result, FHWA published a FONSI that ended the construction moratorium. That same year,
Texas passed legislation that changed the way privatized transportation tolling operated, and the Alamo Regional
Mobility Authority (RMA) took control of the US 281 project.
2008:SecondLawsuit
In 2008, AGUA and TURF once again brought suit to question the environmental clearances that were currently in
place. During the suit, TxDOT requested a 60‐day stay to review the records. During this period of review, TxDOT
found irregularities in the procurement of scientific services, leading FHWA to retract the previously issued
environmental clearance. Any future expansion projects in the US 281 corridor would be required to prepare a
more complex EIS. Three weeks after the FHWA pronouncement, the Alamo RMA began pursuing an EIS that they
estimated would take three to five years to complete. Consequently, the district judge administratively closed the
second lawsuit.
2009:CategoricalExclusions
With the US 281 North expansion projects on hold awaiting a new EIS, the Alamo RMA continued to search for new
ways to relieve congestion and improve safety within the limits of the law. In March 2009, the Texas
Transportation Commission approved $80 million in federal stimulus funding to aid a separately proposed
$130 million improvement project at the US 281/Loop 1604 interchange. The project would include construction of
four direct connectors from Loop 1604 to US 281. The Alamo RMA conducted new biological surveys of the area
and held two public hearings. In February 2010, FHWA and the U.S. Fish and Wildlife Service approved a CE by
granting the interchange project environmental clearance. A portion of the federal stimulus funds must be spent
by 2015.
In the fall of 2009, another project to transform a segment of US 281 into a “Super Street” received environmental
clearance through a CE. This conversion will aid in congestion relief without the addition of new lanes until the EIS
is completed.
7 Alamo RMA. Alamo RMA Responds to Latest Lawsuit Filed by TURF, February 26, 2008. Memorandum, FY 06
Lettings, Dianna F. Noble, P.E., January 3, 2007.

ASSESSING THE COSTS ATTRIBUTED TO PROJECT DELAYS
P a g e | D ‐ 4
2010:ThirdLawsuit
In August 2010, AGUA filed suit claiming that the US 281/Loop 1604 interchange project violates the Endangered
Species Act and endangers the Edwards Aquifer. In December, AGUA filed an injunction to stop the impending
construction for the duration of the suit.
CurrentStatus
A district judge issued an advisory in February 2011 stating that he would rule on the injunction to halt the
interchange project within six months. On March 2, 2011, construction began on the US 281/Loop 1604
interchange and will continue while awaiting the court’s ruling. Furthermore, the EIS for the US 281 North
expansion project is underway, and final approval is estimated for 2013. Figure 7 displays the project timeline,
when the original delay began, and when the short‐term projects were implemented to help reduce congestion. In
addition to the project timeline, Figure D‐2 also shows the length of delay the agency and the public encountered
because of the project.
Figure D‐2. Historical Timeline of US 281 North Expansion Project Delay.
Costs
US281NorthExpansionProject
Before the first lawsuit in 2005, the low bid to construct the expansion was $83,653,101. The cost to terminate the
project that same year was $7 million excluding litigation expenses. Today, the low bid for the same scope of work
is estimated to be $2.5 million more than the 2005 bid.
1984 1989 1994 1999 2004 2009
Project
Agency
Travelers
Timeline of Delay
Project in Progress
Delay
Short‐Term Projects

ASSESSING THE COSTS ATTRIBUTED TO PROJECT DELAYS
P a g e | D ‐ 5
US281/Loop1604InterchangeProject
The Loop 1604 interchange project was a short‐term project created to help relieve congestion while the US 281
North expansion project was put on hold. The interchange, which is not a tolled project, was partially funded with
federal stimulus dollars. The Alamo RMA stated that if the injunction is granted, the delay could cost them up to
$30,000 a day.8
In addition to the $9.5 million costs specifically mentioned above, additional personal, business, and economic
costs are also associated with the project delay.
SH45Southeast—Austin
The SH 45 Southeast project is an example of a project on a new alignment, which is generally not suitable for a
simplified analysis. This project connects two major highways in a growing network. In the absence of “before”
conditions for comparison, a delay impact analysis on a project of this type would require the use of the local
travel demand model maintained by the MPO to identify the number of prospective users.
The segment of SH 45 in Austin studied is a 7.4‐mile stretch running east/west between IH 35 at FM 1327 and the
junction of SH 130 and US 183 (Figure D‐3).9 Major intersections along the four‐lane tolled highway include IH 35,
North Turnersville Road, FM 1625, and SH 130/US 183. The roadway was proposed as an alternate route for
through traffic that would aid in relieving congestion on other major routes (such as IH 35 through downtown
Austin). This project encountered delays involving a lawsuit based upon the NEPA’s EIS requirements.
8 Vianna Davilla, quoting RMA Director of Community Development Leroy Alloway. “Interchange Work Starts in
Face of Controversy.” San Antonio Express‐News, March 3, 2011.
9 Map source: TxDOT, http://www.texastollways.com/austintollroads/english/map.htm.

ASSESSING THE COSTS ATTRIBUTED TO PROJECT DELAYS
P a g e | D ‐ 6
Figure D‐3. Map of SH 45 Southeast Project.
Timeline
OriginalSchedule
In 2003, the DEIS required by NEPA was completed, and a public hearing was held that summer. That fall, the FEIS
was submitted, and FHWA granted the project environmental clearance in 2004. That same year, TxDOT awarded a
contract to design and build the highway in the following two years to Zachry Construction Company.
2004:Lawsuit
In 2004, local environmental groups Save Our Springs Alliance and Save Barton Creek Association brought suit in
federal district court to stop the project. Together the membership of these two groups totals approximately
4,500 people. They claimed the EIS failed to consider an adequate range of alternate routes and did not fully
examine the impacts (direct, indirect, secondary, and cumulative). They argued that to completely assess the
secondary and cumulative impacts of the southeast project, the future southwest project would need to be
analyzed in conjunction. The future southwest segment (segment 3) would cross the Edwards Aquifer recharge
zone. The suit and project were put on hold so a new environmental study of the southeast segment could be
performed.

ASSESSING THE COSTS ATTRIBUTED TO PROJECT DELAYS
P a g e | D ‐ 7
2007:ProjectRestarted
The new environmental study was completed two years later, reaching the same conclusions as the previous
analysis. FHWA approved the new study in the summer of 2006, and the federal court dismissed the case. In April
2007, a new contract was awarded to Balfour Beatty Infrastructure, Inc., and T.J. Lambrecht Construction, Inc., and
construction began the following July. SH 45 Southeast opened in June 2009. Figure D‐4 illustrates the project
timeline including when the delay began and when the project restarted. Also shown is the length of delay
encountered by the agency and the public because of the lawsuit.
Figure D‐4. Historical Timeline of SH 45 Southeast Project Delay.
Costs
The project was originally estimated at $154.3 million as part of a $2.2 billion toll road package approved by the
Capital Area Metropolitan Planning Organization (CAMPO). The estimate included $137.4 million for construction
costs. TxDOT paid $1.6 million to terminate the project in 2004. The ensuing environmental analysis cost an
additional $300,000. During the two years the environmental analysis was being conducted, the cost to acquire
right of way rose roughly $5.2 million. Since the project was originally awarded as a design/build project as
opposed to design/bid/build, the engineering plans remained incomplete. This meant that an additional $950,000
had to be spent to finalize the engineering plans.10 The new low bid for the construction portion of the project was
$139.7 million—$2.3 million more than the original estimate.
10 Texas Department of Transportation. Draft Testimony, “Accelerating the Project Delivery Process: Eliminating
Bureaucratic Red Tape and Making Every Dollar Count.” House Transportation and Infrastructure Committee
Subcommittee on Highways and Transit, February 15, 2011.
2003 2004 2005 2006 2007 2008 2009
Project
Agency
Travelers
Timeline of Delay
Project in Progress
Delay
New Schedule

ASSESSING THE COSTS ATTRIBUTED TO PROJECT DELAYS
P a g e | D ‐ 8
Additionally, a project under construction on SH 130 was impacted by the SH 45 Southeast delay, and expenses to
settle the matter with the developer cost TxDOT approximately $15.5 million.
In total, the costs associated with project delay on this project exceed an estimated $22.6 million plus an
uncalculated amount of commercial and personal delay and economic costs.
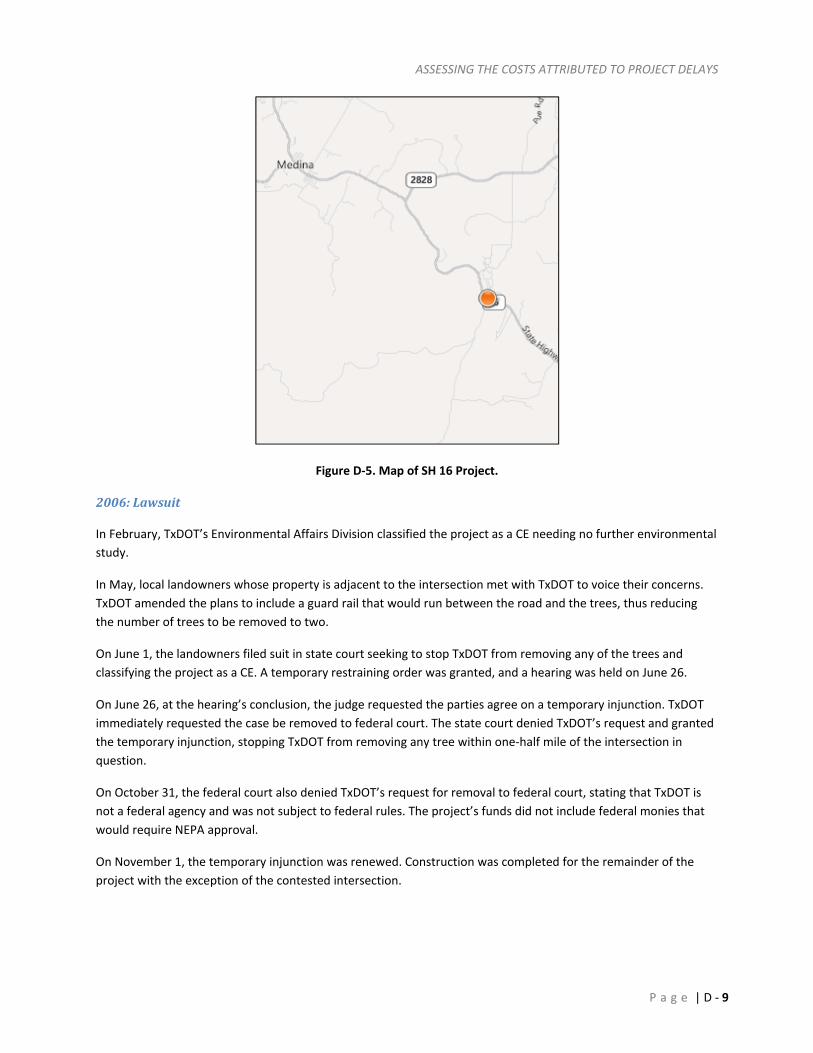
SH16—Bandera
This SH 16 road safety improvement project runs 8 miles from Winans Crossing toward Medina in Bandera County
(Figure D‐5).11 The rural state highway originally consisted of two 10‐foot‐wide lanes with no shoulders. The
improvements would widen the existing lanes to 12 feet and add 5‐foot shoulders to each side. The current TxDOT
standards call for 7 feet of clear zone. The clear zone provides a safe area for drivers to stop or recover their
vehicle after veering off the travel lane and is measured from the edge of the travel lane.12 This project was
challenged with a state lawsuit concerning the removal of five mature pecan and black walnut trees located at the
intersection of SH 16 and Kyle Ranch Road. These trees, estimated to be 180 to 310 years old, sit directly adjacent
to the original road and were scheduled for removal to facilitate the widening of the road.
Timeline13
2005:RuralTransportationMeeting
In late 2005, a rural transportation meeting was held to present local projects to the community. TxDOT had
performed an environmental study that identified these trees on state property. The original proposal called for
removal of five trees, with TxDOT planting 10 new trees in the surrounding grove on state land.
11 Copyright 2010 Navteq; copyright 2010 Microsoft.
12 TxDOT Glossary. http://onlinemanuals.txdot.gov/txdotmanuals/glo/c.htm.
13 Texas Department of Transportation v. Kyle, No. 04‐06‐00762‐CV, May 9, 2007.
ASSESSING THE COSTS ATTRIBUTED TO PROJECT DELAYS
P a g e | D ‐ 9
Figure D‐5. Map of SH 16 Project.
2006:Lawsuit
In February, TxDOT’s Environmental Affairs Division classified the project as a CE needing no further environmental
study.
In May, local landowners whose property is adjacent to the intersection met with TxDOT to voice their concerns.
TxDOT amended the plans to include a guard rail that would run between the road and the trees, thus reducing
the number of trees to be removed to two.
On June 1, the landowners filed suit in state court seeking to stop TxDOT from removing any of the trees and
classifying the project as a CE. A temporary restraining order was granted, and a hearing was held on June 26.
On June 26, at the hearing’s conclusion, the judge requested the parties agree on a temporary injunction. TxDOT
immediately requested the case be removed to federal court. The state court denied TxDOT’s request and granted
the temporary injunction, stopping TxDOT from removing any tree within one‐half mile of the intersection in
question.
On October 31, the federal court also denied TxDOT’s request for removal to federal court, stating that TxDOT is
not a federal agency and was not subject to federal rules. The project’s funds did not include federal monies that
would require NEPA approval.
On November 1, the temporary injunction was renewed. Construction was completed for the remainder of the
project with the exception of the contested intersection.

ASSESSING THE COSTS ATTRIBUTED TO PROJECT DELAYS
P a g e | D ‐ 10
2007:StateAppeal
In early 2007, TxDOT filed an appeal stating that the state trial court was not the correct court to decide the
matter. TxDOT argued that it has sovereign immunity. However, sovereign immunity does not exist if the state is
depriving the other party of a vested property right. The court agreed with TxDOT that the landowners do not have
a vested interest because the trees are located on state land. The Fourth Court of Appeals of Texas reversed the
decision of the trial court and removed the injunction, thus allowing TxDOT to proceed. On August 1, 2007, the two
trees in question were removed. Figure D‐6 illustrates the project timeline showing when the delay began and
when the project was allowed to resume in the contested area. Additionally, Figure D‐6 shows the length of delay
the agency and the public encountered.
Figure D‐6. Historical Timeline of SH 16 Project Delay.
Costs
The project was originally estimated at $5.4 million, funded from the sale of $600 million in bonds in 2004 for
safety projects across the state.14 There was also additional cost to TxDOT that could not be explicitly identified by
this research project. In addition to those unidentified costs, the public was denied the additional safety benefits
provided by wider lanes and paved shoulders while awaiting the court’s ruling.
14 Jessica Hawley. “Trees Cause Debate in Root of Community.” The Bandera Bulletin, May 9, 2006.
2004 2005 2006 2007 2008
Project
Agency
Travelers
Timeline of Delay
Project in Progress
Delay
New Schedule

ASSESSING THE COSTS ATTRIBUTED TO PROJECT DELAYS
P a g e | E ‐ 1
APPENDIX E—TYPICAL CAUSES OF DELAY
During each stage of a project, numerous events can cause project delays. Table E‐1 summarizes the typical causes
of delay for a roadway construction project during the four major phases of a project. While the nature of delays
can vary among the four stages of a project (planning, development, contracting, and construction), the results are
quite similar: impacts on travelers and businesses.
First, with respect to delays during the planning/scoping phase, while the number of potential reasons for delay is
relatively small, the length of delay associated with these reasons can be significant. This is particularly the case if
the project becomes the subject of litigation.
Although delays during the project development phase can have numerous causes, they are typically invisible to
the public unless they have been told a project would start construction by a certain time (e.g., summer 2012). If
the construction has not started as anticipated, local stakeholders, citizens, and local media may want to know the
causes of the delay. One exception to the concept that delays during development are invisible to the public is
when litigation occurs. Such litigation mostly occurs during a statutory review process (e.g., environmental
clearance or U.S. Corps of Engineers clearance) or during right‐of‐way acquisition.
Delay during the contracting phase is typically minimal, with a project only being delayed one or two months from
the original letting date due to last‐minute procedural missteps and/or project management inefficiencies.
The public generally understands that once a project begins construction, there will be a period of inconvenience
while the project is underway. As TxDOT and local media announce the anticipated duration of construction, the
public takes a grin‐and‐bear‐it attitude, looking forward to the completion of the project. Delays during
construction, however, are the most visible and draw substantial attention.

ASSESSING THE COSTS ATTRIBUTED TO PROJECT DELAYS
P a g e | E ‐ 2
Table E‐1. Typical Causes of Project Delay.15
Planning/Scoping • Project priority changes in relationship to other projects • Federal/state legislation • Interagency coordination • Project management issues:
o Poor project definition o Lack of documentation of assumptions o Missed milestones
• Funding • Litigation
Development • Project management issues:
o Poor project definition o Lack of documentation of assumptions o Missed milestones
• Railroad permits not obtained as anticipated • Acquisition of necessary right of way (ROW) not completed as anticipated • Utility accommodation agreements not completed as anticipated • Mandatory review processes (e.g., environmental and fish and wildlife) not completed as anticipated • U.S. Corps of Engineers permits not obtained as anticipated • Local funding agreements not executed as anticipated • Delay in plan, specification, and estimation (PS&E) preparation (either in‐house or by consultant) • Litigation
Contracting • Unanticipated letting events (e.g., bids greatly exceeding engineer’s estimate) • Delayed assembly of PS&E/letting package • Projects pulled from letting schedule • Bid protests • Litigation
15 The information contained it Table E‐1 is a compilation of data from multiple sources:
Meeting with TxDOT, Associated General Contractors of Texas, and Highway Contractors in Austin, Texas,
June 8, 2011.
R.D. Ellis and H.R. Thomas. “The Root Causes of Delays in Highway Construction.” Transportation Research
Board 82nd Annual Meeting, Washington, D.C., January 2003.
J. Ahn and R.E. Minchin, Jr. “Identifying Causes for Delay in Highway Construction Projects.”
Transportation Research Board 87th Annual Meeting, Washington, D.C., January 2007.
ASSESSING THE COSTS ATTRIBUTED TO PROJECT DELAYS
P a g e | E ‐ 3
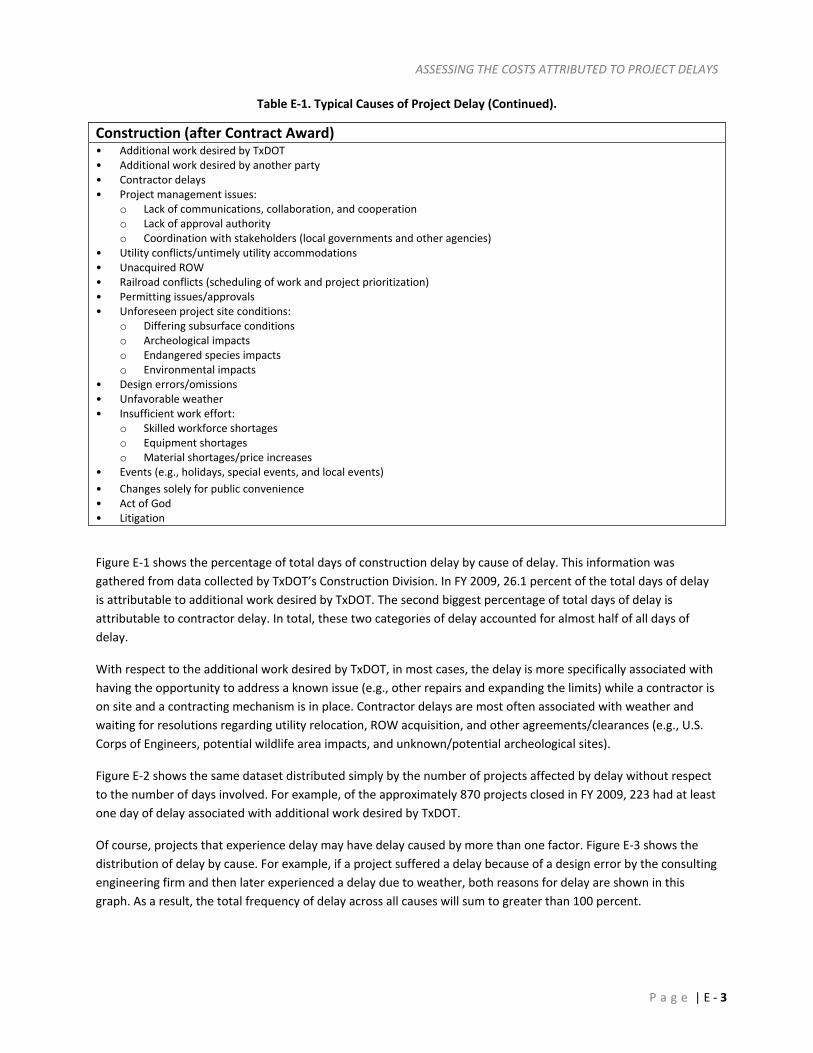
Table E‐1. Typical Causes of Project Delay (Continued).
Construction (after Contract Award) • Additional work desired by TxDOT • Additional work desired by another party • Contractor delays • Project management issues:
o Lack of communications, collaboration, and cooperation o Lack of approval authority o Coordination with stakeholders (local governments and other agencies)
• Utility conflicts/untimely utility accommodations • Unacquired ROW • Railroad conflicts (scheduling of work and project prioritization) • Permitting issues/approvals • Unforeseen project site conditions:
o Differing subsurface conditions o Archeological impacts o Endangered species impacts o Environmental impacts
• Design errors/omissions • Unfavorable weather • Insufficient work effort:
o Skilled workforce shortages o Equipment shortages o Material shortages/price increases
• Events (e.g., holidays, special events, and local events)
• Changes solely for public convenience • Act of God • Litigation
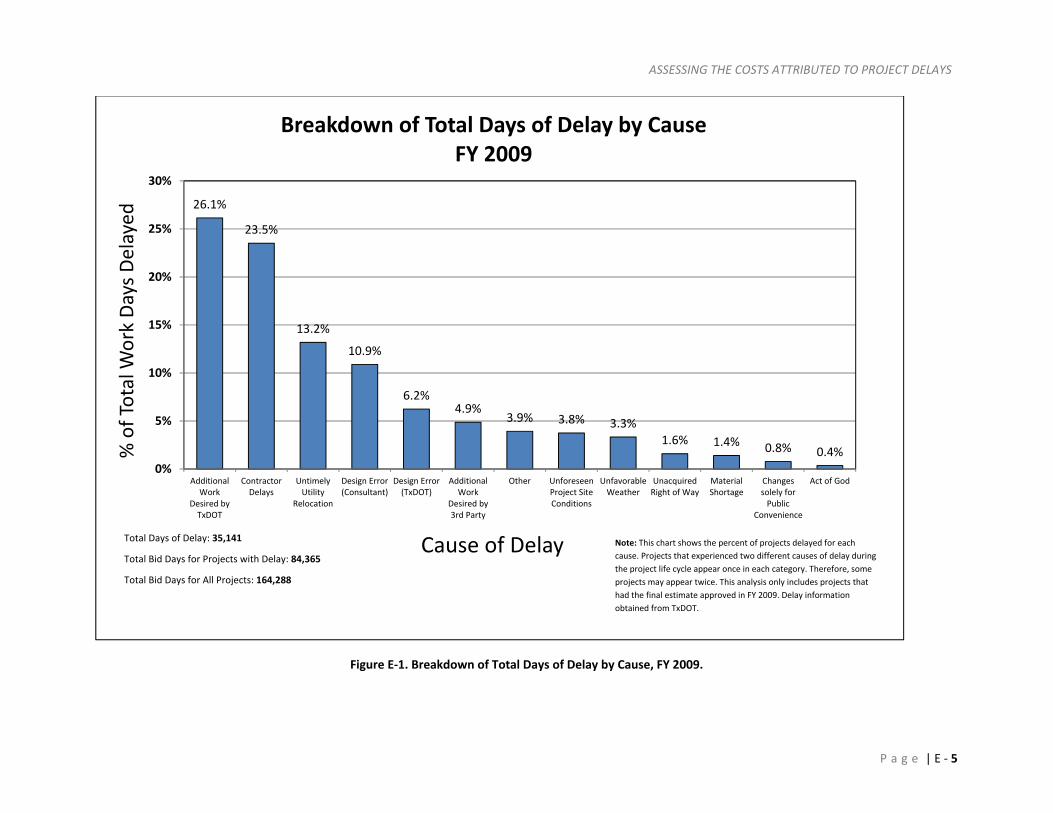
Figure E‐1 shows the percentage of total days of construction delay by cause of delay. This information was
gathered from data collected by TxDOT’s Construction Division. In FY 2009, 26.1 percent of the total days of delay
is attributable to additional work desired by TxDOT. The second biggest percentage of total days of delay is
attributable to contractor delay. In total, these two categories of delay accounted for almost half of all days of
delay.
With respect to the additional work desired by TxDOT, in most cases, the delay is more specifically associated with
having the opportunity to address a known issue (e.g., other repairs and expanding the limits) while a contractor is
on site and a contracting mechanism is in place. Contractor delays are most often associated with weather and
waiting for resolutions regarding utility relocation, ROW acquisition, and other agreements/clearances (e.g., U.S.
Corps of Engineers, potential wildlife area impacts, and unknown/potential archeological sites).
Figure E‐2 shows the same dataset distributed simply by the number of projects affected by delay without respect
to the number of days involved. For example, of the approximately 870 projects closed in FY 2009, 223 had at least
one day of delay associated with additional work desired by TxDOT.
Of course, projects that experience delay may have delay caused by more than one factor. Figure E‐3 shows the
distribution of delay by cause. For example, if a project suffered a delay because of a design error by the consulting
engineering firm and then later experienced a delay due to weather, both reasons for delay are shown in this
graph. As a result, the total frequency of delay across all causes will sum to greater than 100 percent.

ASSESSING THE COSTS ATTRIBUTED TO PROJECT DELAYS
P a g e | E ‐ 4
Finally, while project delay almost always has cost associated with it, not all project delay is a waste of time and
public money. In many instances of project delay initiated by TxDOT, the reason for the delay is to make an
improvement in the design or construction of the project that will ultimately deliver better value to the public.
ASSESSING THE COSTS ATTRIBUTED TO PROJECT DELAYS
P a g e | E ‐ 5
Figure E‐1. Breakdown of Total Days of Delay by Cause, FY 2009.
26.1%
23.5%
13.2%
10.9%
6.2%4.9%
3.9% 3.8% 3.3%
1.6% 1.4% 0.8% 0.4%
0%
5%
10%
15%
20%
25%
30%
AdditionalWork
Desired byTxDOT
ContractorDelays
UntimelyUtility
Relocation
Design Error(Consultant)
Design Error(TxDOT)
AdditionalWork
Desired by3rd Party
Other UnforeseenProject SiteConditions
UnfavorableWeather
UnacquiredRight of Way
MaterialShortage
Changessolely forPublic
Convenience
Act of God
% of Total W
ork Days Delayed
Cause of Delay
Breakdown of Total Days of Delay by CauseFY 2009
Note: This chart shows the percent of projects delayed for each cause.
Projects that experienced two different causes of delay during the
project life cycle appear once in each category. Therefore, some
projects may appear twice. This analysis only includes projects that
had the Final Estimate approved in FY 2009. Delay information
obtained from TxDOT.
Total Days of Delay: 35,141
Total Bid Days for Projects with Delay: 84,365
Total Bid Days for All Projects: 164,288
Note: This chart shows the percent of projects delayed for each
cause. Projects that experienced two different causes of delay during
the project life cycle appear once in each category. Therefore, some
projects may appear twice. This analysis only includes projects that
had the final estimate approved in FY 2009. Delay information
obtained from TxDOT.

ASSESSING THE COSTS ATTRIBUTED TO PROJECT DELAYS
P a g e | E ‐ 6
Figure E‐2. Number of Delayed Projects by Cause, FY 2009.
223
201
72 70 70 70
50 50
3324
186 4
0
50
100
150
200
250
AdditionalWork
Desired byTxDOT
ContractorDelays
UntimelyUtility
Relocation
Design Error(TxDOT)
Design Error(Consultant)
UnforeseenProject SiteConditions
UnfavorableWeather
Other AdditionalWork
Desired by3rd Party
MaterialShortage
Changessolely forPublic
Convenience
Act of God UnacquiredRight of Way
Number of Projects
Cause of Delay
Number of Delayed Projects by Cause in FY 2009
Note: This chart shows the number of projects delayed for each cause. Projects
that experienced two different causes of delay during the project life cycle
appear once in each category. Therefore, some projects may appear twice. This
analysis only includes projects with the final estimate approved in FY 2009.
Delay information obtained from TxDOT.
Total Projects Delayed: 424
Total Projects: 868
Percentage of Projects with Delay: 49%

ASSESSING THE COSTS ATTRIBUTED TO PROJECT DELAYS
P a g e | E ‐ 7
Figure E‐3. Percent of Delayed Projects by Cause, FY 2009.
52.5%
47.3%
16.9% 16.5% 16.5% 16.5%
11.8% 11.8%
7.8%5.6%
4.2%1.4% 0.9%
0%
10%
20%
30%
40%
50%
60%
AdditionalWork Desiredby TxDOT
ContractorDelays
UntimelyUtility
Relocation
Design Error(TxDOT)
Design Error(Consultant)
UnforeseenProject SiteConditions
UnfavorableWeather
Other AdditionalWork Desiredby 3rd Party
MaterialShortage
Changessolely forPublic
Convenience
Act of God UnacquiredRight of Way
Percent of Projects
Cause of Delay
Percent of Total Delayed Projects by Cause in FY 2009
Note: This chart shows the percent of project delayed for each cause.
Projects that experienced two different causes of delay during the project
life cycle appear once in each category. Therefore, some projects may
appear twice. This analysis only includes projects with the final estimate
approved in FY 2009. Delay information obtained from TxDOT.
Total Projects Delayed: 424
Total Projects: 868
Percentage of Projects with Delay: 49%

ASSESSING THE COSTS ATTRIBUTED TO PROJECT DELAYS
P a g e | F ‐ 1
APPENDIX F—DELAYED PROJECTS STUDIED
Project location information, before‐and‐after average vehicle speed, and other information were required to
determine both direct and indirect costs associated with project delay. Therefore, TTI researchers analyzed
projects in the Austin, San Antonio, El Paso, Houston, and the Dallas/Fort Worth areas only because the MPOs in
these regions provided the minimum data requirements needed for a robust analysis. The list of projects examined
is included in Table F‐1.
TTI researchers obtained travel demand data provided by large MPOs to calculate speed differentials from
improved vehicle movements. Researchers used travel demand data obtained from these projects to develop total
cost of delay scenarios for small, medium, and large projects. The specific projects with reported delays used in
this analysis were obtained from DCIS, TxDOT’s Construction Division, and select TxDOT districts. Note that “TTA”
in Table F‐1 refers to the Texas Turnpike Authority.

ASSESSING THE COSTS ATTRIBUTED TO PROJECT DELAYS
P a g e | F ‐ 2
Table F‐1. List of 26 Delayed Projects Studied by Total Bid.
Rank District CSJ Highway Length (Miles)
Project Description Bid (Total Obligated Amount)
Project Phase When Delay Occurred
Total Days of Delay
1 TTA 3136‐01‐126 LP 1 1.7 Convert non‐freeway to freeway $107,960,584 Construction 99
2 TTA 0683‐06‐015 SH 45 1 Convert non‐freeway to freeway $103,017,730 Construction 528
3 TTA 0683‐01‐069 SH 45 2.5 Widen non‐freeway $101,577,358 Construction 187
4 Dallas 1068‐04‐083 IH 30 4.7 Widen from six to eight lanes and add interchanges $96,841,618 Construction 156
5 San Antonio 0072‐12‐159 IH 10 1.5 Reconstruct IH 10 410 Interchange (crossroads) (Phase 2) $82,237,875 Construction 332
6 Dallas 0048‐08‐037 IH 35E 9.8 Upgrade to standards freeway $62,597,022 Construction 273
7 San Antonio 0072‐12‐130 IH 10 3.1 Upgrade to standards freeway $61,990,150 Construction 256
8 Houston 0177‐05‐057 US 59 2.6 Widen to eight main lanes and two three‐lane frontage roads $49,231,631 Design
9 Houston 0177‐05‐057 US 59 2.6 Widen to eight main lanes and two three‐lane frontage roads $49,231,631 Construction
10 Houston 0027‐08‐108 US 90A 0.9 Widen to eight‐lane divided with improvements at ditch H $39,243,649 Construction 51
11 Fort Worth 0134‐08‐030 US 380 10.5 Reconstruct two lanes to four‐lane divided rural $36,540,038 Design
12 Houston 0027‐08‐144 US 90A 1.3 Widen to eight‐lane divided with diamond interchange at Dulles $21,881,454 Construction 86
13 Houston 0179‐03‐024 SH 35 7.7 Widen to four‐lane divided rural $19,702,202 Construction 201
14 Fort Worth 0902‐48‐708 CS 3.4 Widen from two‐lane to four‐lane divided urban highway $19,069,431 Design
15 Fort Worth 0081‐02‐045 US 377 2.9 Reconstruct to four‐lane divided urban $12,983,276 Construction
16 San Antonio 0521‐06‐124 IH 410 3.7 Rehab existing main lanes and reconstruct shoulders $12,388,367 Construction 243
17 Houston 0523‐10‐033 FM 1488 2.7 Widen two lanes to four‐lane divided (Pass Through Financing) $11,463,848 Design
18 Houston 0179‐01‐028 SH 35 4 Widen to four‐lane divided, widen bridges, and install new bridges $10,716,917 Design
19 Houston 0179‐01‐028 SH 35 4 Widen to four‐lane divided, widen bridges, and install new bridges $10,716,917 Construction
20 Austin 0114‐04‐048 US 290 3.8 Widen to four‐lane divided rural section $10,716,016 Construction 162
21 Fort Worth 3125‐01‐010 FM 3029 1.1 Reconstruct and widen from five to six lanes with raised median $9,873,767 Construction
22 Austin 0204‐01‐049 US 79 1.5 Widen non‐freeway $9,351,883 Construction 384
23 Houston 0027‐08‐108 US 90A 0.9 Widen to eight‐lane divided with improvements at ditch H $9,238,220 Design
24 Fort Worth 1068‐01‐187 IH 30 1.6 Reconstruct to four‐lane divided with raised median $8,559,000 Construction 434
25 Dallas 2374‐04‐046 IH 20 12.3 Rehab existing freeway $7,870,576 Construction 69
26 Fort Worth 0718‐02‐025 FM 156 1 Widen to four lanes with continuous left‐turn lane $7,502,998 Construction