Assessing the Age and Growth of Chondrichthyan Fishes · 423 14 Assessing the Age and Growth of...
29
423 14 Assessing the Age and Growth of Chondrichthyan Fishes Kenneth J. Goldman, Gregor M. Cailliet, Allen H. Andrews, and Lisa J. Natanson CONTENTS 14.1 Introduction ................................................................................................................................................................. 423 14.2 Methodology ............................................................................................................................................................... 425 14.2.1 Structures ....................................................................................................................................................... 425 14.2.1.1 Vertebrae ....................................................................................................................................... 425 14.2.1.2 Spines ............................................................................................................................................ 425 14.2.1.3 Neural Arches .............................................................................................................................. 426 14.2.1.4 Caudal Thorns and Other Structures ....................................................................................... 426 14.2.2 Sampling and Processing Specimens ......................................................................................................... 427 14.2.2.1 Taking Samples ............................................................................................................................ 427 14.2.2.2 Centrum Cleaning and Sample Preparation ........................................................................... 428 14.2.2.3 Centrum Staining ........................................................................................................................ 429 14.2.2.4 Histology....................................................................................................................................... 429 14.3 Age Determination ..................................................................................................................................................... 430 14.3.1 Ageing Protocols ........................................................................................................................................... 432 14.3.2 Precision and Bias ......................................................................................................................................... 433 14.3.3 Back-Calculation............................................................................................................................................ 435 14.4 Verification and Validation ........................................................................................................................................ 435 14.4.1 Size Mode Analysis ....................................................................................................................................... 436 14.4.2 Tag–Recapture ............................................................................................................................................... 436 14.4.3 Marking, Field Tag–Recapture, and Laboratory Studies ......................................................................... 436 14.4.4 Centrum Edge and Relative Marginal Increment Analysis.................................................................... 437 14.4.5 Captive Rearing ............................................................................................................................................. 438 14.4.6 Bomb Radiocarbon Dating........................................................................................................................... 438 14.5 Growth Models ........................................................................................................................................................... 443 14.6 Implication of Growth, Longevity, and Demography to Fisheries Management.............................................. 444 Acknowledgments ................................................................................................................................................................. 444 References................................................................................................................................................................................ 445 14.1 Introduction The ability to perform age determinations based on the examination of hard anatomical parts is of fundamental importance in fisheries research. Precise and accurate age information is the key to obtaining quality esti- mates of growth and other vital rates such as natural mortality and longevity and is essential for success- ful fisheries management. The effect of inaccurate age determinations on our understanding of population dynamics can lead to serious errors in stock assessment, often resulting in overexploitation (Beamish et al., 2006; Cailliet and Andrews, 2008; Campana, 2001; Heppell et al., 2005; Hoenig and Gruber, 1990; Hoff and Musick, 1990; Longhurst, 2002; Musick, 1999; Officer et al., 1996). Fish age and growth are also critical correlates with which to evaluate many other biological (and pathologi- cal) processes, such as productivity, yield per recruit, prey availability, habitat suitability, and even feeding kinematics (Campana, 2001; DeVries and Frie, 1996; Robinson and Motta, 2002). Whereas age and growth are usually used together in phraseology, it is important to remember that each term has its own distinct mean- ing, which was eloquently stated by DeVries and Frie (1996): © 2012 Taylor & Francis Group, LLC
Transcript of Assessing the Age and Growth of Chondrichthyan Fishes · 423 14 Assessing the Age and Growth of...

423
14Assessing the Age and Growth of Chondrichthyan Fishes
Kenneth J. Goldman, Gregor M. Cailliet, Allen H. Andrews, and Lisa J. Natanson
CONTENTS
14.1 Introduction ................................................................................................................................................................. 42314.2 Methodology ............................................................................................................................................................... 425
14.2.1 Structures ....................................................................................................................................................... 42514.2.1.1 Vertebrae ....................................................................................................................................... 42514.2.1.2 Spines ............................................................................................................................................ 42514.2.1.3 Neural Arches .............................................................................................................................. 42614.2.1.4 Caudal Thorns and Other Structures ....................................................................................... 426
14.2.2 Sampling and Processing Specimens ......................................................................................................... 42714.2.2.1 Taking Samples ............................................................................................................................ 42714.2.2.2 Centrum Cleaning and Sample Preparation ........................................................................... 42814.2.2.3 Centrum Staining ........................................................................................................................ 42914.2.2.4 Histology ....................................................................................................................................... 429
14.3 Age Determination ..................................................................................................................................................... 43014.3.1 Ageing Protocols ........................................................................................................................................... 43214.3.2 Precision and Bias ......................................................................................................................................... 43314.3.3 Back-Calculation ............................................................................................................................................ 435
14.4 Verification and Validation ........................................................................................................................................ 43514.4.1 Size Mode Analysis ....................................................................................................................................... 43614.4.2 Tag–Recapture ............................................................................................................................................... 43614.4.3 Marking, Field Tag–Recapture, and Laboratory Studies ......................................................................... 43614.4.4 Centrum Edge and Relative Marginal Increment Analysis .................................................................... 43714.4.5 Captive Rearing ............................................................................................................................................. 43814.4.6 Bomb Radiocarbon Dating........................................................................................................................... 438
14.5 Growth Models ........................................................................................................................................................... 44314.6 Implication of Growth, Longevity, and Demography to Fisheries Management .............................................. 444Acknowledgments ................................................................................................................................................................. 444References ................................................................................................................................................................................ 445
14.1 Introduction
The ability to perform age determinations based on the examination of hard anatomical parts is of fundamental importance in fisheries research. Precise and accurate age information is the key to obtaining quality esti-mates of growth and other vital rates such as natural mortality and longevity and is essential for success-ful fisheries management. The effect of inaccurate age determinations on our understanding of population dynamics can lead to serious errors in stock assessment, often resulting in overexploitation (Beamish et al., 2006;
Cailliet and Andrews, 2008; Campana, 2001; Heppell et al., 2005; Hoenig and Gruber, 1990; Hoff and Musick, 1990; Longhurst, 2002; Musick, 1999; Officer et al., 1996). Fish age and growth are also critical correlates with which to evaluate many other biological (and pathologi-cal) processes, such as productivity, yield per recruit, prey availability, habitat suitability, and even feeding kinematics (Campana, 2001; DeVries and Frie, 1996; Robinson and Motta, 2002). Whereas age and growth are usually used together in phraseology, it is important to remember that each term has its own distinct mean-ing, which was eloquently stated by DeVries and Frie (1996):
© 2012 Taylor & Francis Group, LLC
424 Biology of Sharks and Their Relatives
Age refers to some quantitative description of the length of time that an organism has lived, whereas growth is the change in body or body part size between two points in time, and growth rate is a measure of change in some metric of fish size as a function of time.
It is important to understand the ages, growth char-acteristics, maturation processes, and longevity of fishes to assess their current population status and to predict how their populations will change in time (Cailliet et al., 1986a; Ricker, 1975). Fishery biologists have used age, length, and weight data as important tools for their age-based population models. Especially important are details about growth and mortality rates, age at maturity, and life span (Beamish et al., 2006; Cailliet and Andrews, 2008; Cortés, 1997; Heppell et al., 2005; Longhurst, 2002; Ricker, 1975). Over the past several decades, it has become obvious that many fisheries for chondrichthyan fishes are not sustainable at current exploitation rates or at all. As early as 1974, Holden suggested that these fishes had life histories, including late age at maturity, few offspring, and lengthy gestation periods, that made them vulnerable to overexploitation. Since then, fishing mortality on elasmobranchs, both as directed and as non-target catch in fisheries has increased (Baum et al., 2003; Bonfil, 1994; Casey and Myers, 1998; Stevens et al., 2000), and discards at sea are either underestimated or unknown (Camhi, 1999). These facts make the study of their life histories, including age, growth, and reproduc-tion, even more important.
In the first review of elasmobranch ageing by Cailliet et al. (1986a), the age verification studies were relatively few. They included some statistical analyses, direct measurements of growth; marking anatomical fea-tures, such as vertebrae or spines, with oxytetracycline (OTC) and then describing their location over time in both laboratory and field studies; and several relatively new chemical studies of calcified structures (Welden et al., 1987). In a second review, Cailliet (1990) updated progress made and showed that many additional stud-ies had derived age estimates based on opaque and translucent band pairs in calcified structures and that more studies were attempting to verify the periodicity with which these band pairs were deposited. Sufficient information to validate banding patterns in chon-drichthyan hard parts was only available for six spe-cies at that time. In some cases, poor calcification and only partially verified band patterns prevented a full understanding of growth patterns. One species, the Pacific angel shark, Squatina californica, did not deposit any predictable growth bands in their vertebral centra (Natanson and Cailliet, 1990).
In the most recent review of age determination and validation studies in chondrichthyan fishes by Cailliet and Goldman (2004; see also Cailliet et al., 2006), which updated progress since the Cailliet (1990) review, 115 publications on at least 91 species of chondrichthyans had been produced using some form of age verifica-tion or validation, and approximately 68 were new to the list. Roughly 70% of the studies reviewed used vertebrae, either whole or sectioned, some of which were stained in one way or another; however, dorsal spines, jaws, and neural arches were also used. Other techniques, not necessarily involving calcified struc-tures, were also employed to calculate growth coeffi-cients or annual increments of growth. These include captive growth, field tag–recapture, and embryonic growth methodologies. In many cases, combinations of techniques were used. Cailliet and Goldman (2004) showed that precision analyses were beginning to become more common, as 21 studies calculated some form of reader precision estimates, such as average per-cent error (APE), Chang’s (1982) APE value (D), percent agreement (PA), or coefficient of variation (CV); how-ever, they felt it was still not a high proportion of the studies they reviewed and that greater efforts should be undertaken by researchers to conduct these types of analyses. There had also been an increase in the use of both verification and validation methodologies. The most common method employed was some form of marginal increment analysis or ratio and centrum edge analysis. Even though they are not very robust meth-ods, some authors retained the use of size-frequency modal analysis and back-calculation techniques. Tag–recapture and laboratory growth studies were also used to provide growth estimates, and 18 studies used OTC to attempt age validation. It was apparent in many studies, and advocated for by Cailliet and Goldman (2004), that using combinations of verification and vali-dation approaches is most likely to produce statistical results that provide biological meaning.
With such thorough recent reviews (Cailliet and Goldman, 2004; Cailliet et al., 2006), the purpose of this chapter is not to further update and summarize results from age and growth studies, but to instead provide a concise description of the processes, methodologies, and statistical analyses that can be used to quantify, ver-ify, and validate age estimates in chondrichthyan fishes, with particular attention to emerging technologies being applied to both age determination and validation studies (e.g., histological processing and bomb radiocar-bon dating, respectively). Finally, we briefly touch on the implications of growth rate, age at maturity, longev-ity, and the demographic traits of chondrichthyan fishes relative to their management and conservation.
© 2012 Taylor & Francis Group, LLC

425Assessing the Age and Growth of Chondrichthyan Fishes
14.2 Methodology
The age determination process consists of the follow-ing steps: collection of hard part samples, preparation of the hard part for age determination, examination (age reading), assessment of the validity and reliabil-ity of the resulting data, and interpretation (modeling growth). This section briefly discusses the hard parts that have been used to age chondrichthyan fishes and how to collect and prepare them for age determination. The examination of hard parts and assessment of valid-ity and reliability of age estimates and modeling growth are discussed later in this chapter.
14.2.1 Structures
14.2.1.1 Vertebrae
Whole vertebral centra, as well as transverse and sag-ittally (i.e., longitudinally) sectioned centra, have been used for ageing elasmobranchs (Figure 14.1). Transverse sectioning will prevent bands on opposing halves from obscuring each other when illuminated from below. However, determining the age of older animals can still be problematic as bands become more tightly grouped at the outer edge of vertebrae and may be inadvertently grouped and counted together if transverse sections or whole centra are used for ageing, thereby caus-ing underestimates of age (Cailliet, 1990; Cailliet et al., 1983a, 1986a). As such, sagittally sectioned vertebrae should be used for ageing unless it can be unequivo-cally demonstrated that identical ages can repeatedly be obtained from a given species using whole centra (Campana, 2001; Goldman, 2005). Because vertebral centra vary in shape from species to species, along the
column and sometimes within an individual centum, a variety of investigatory sagittal cuts should be made (e.g., top to bottom, side to side) in order to reduce the potential for introducing error in centrum radius mea-surements, which could result in poor centrum radius to body length correlations, and to identify which type of sagittal cut provides intermedialia to assist with iden-tifying annuli.
14.2.1.2 Spines
Dorsal fin spines (Figure 14.2) have been another useful hard part for ageing some elasmobranchs, most nota-bly dogfish sharks (Family Squalidae) (Ketchen, 1975; McFarlane and Beamish, 1987a; Nammack et al., 1985; Tribuzio, 2010; Tribuzio et al., 2010). As dorsal fin spines become increasingly popular as an ageing structure, we recommend that Clarke and Irvine’s (2006) guide to spine ageing terminology be used. Spines from the sec-ond dorsal fin are preferred for ageing, as the tips of first dorsal fin spines tend to be more worn down, leading to an underestimation of age. Correction factors can be cal-culated to estimate ages of individuals with worn spines (Ketchen, 1975; Sullivan, 1977). Additionally, a cautious approach should be used, as spines may have different growth internally and externally (Cotton, 2010; Irvine, 2006a,b).
Spines can be read whole (without further prepara-tion) by wet-sanding the enamel and pigment off the surface and polishing the spine or from the exposed surface resulting from a longitudinal cut (Ketchen, 1975; McFarlane and Beamish, 1987a). Cross-sectioned dorsal fin spines have also proved useful in assessing ages in some squaloids and chimaeras (Calis et al., 2005; Clarke et al., 2002a,b; Freer and Griffiths, 1993; Sullivan, 1977).
Longitudinalor sagittal
Transverse
Figure 14.1The two sectioning planes that can be used on vertebral centra. (Courtesy of G.M. Cailliet, Moss Landing Marine Laboratories, California State University.)
Annuli
Figure 14.2Spiny dogfish, Squalus acanthias, second dorsal fin spines show-ing annuli. First spine was aged at 42 years; second spine was aged at 46 years. (Courtesy of G.A. McFarlane, Pacific Biological Station, Nanaimo, British Columbia, Canada.)
© 2012 Taylor & Francis Group, LLC
426 Biology of Sharks and Their Relatives
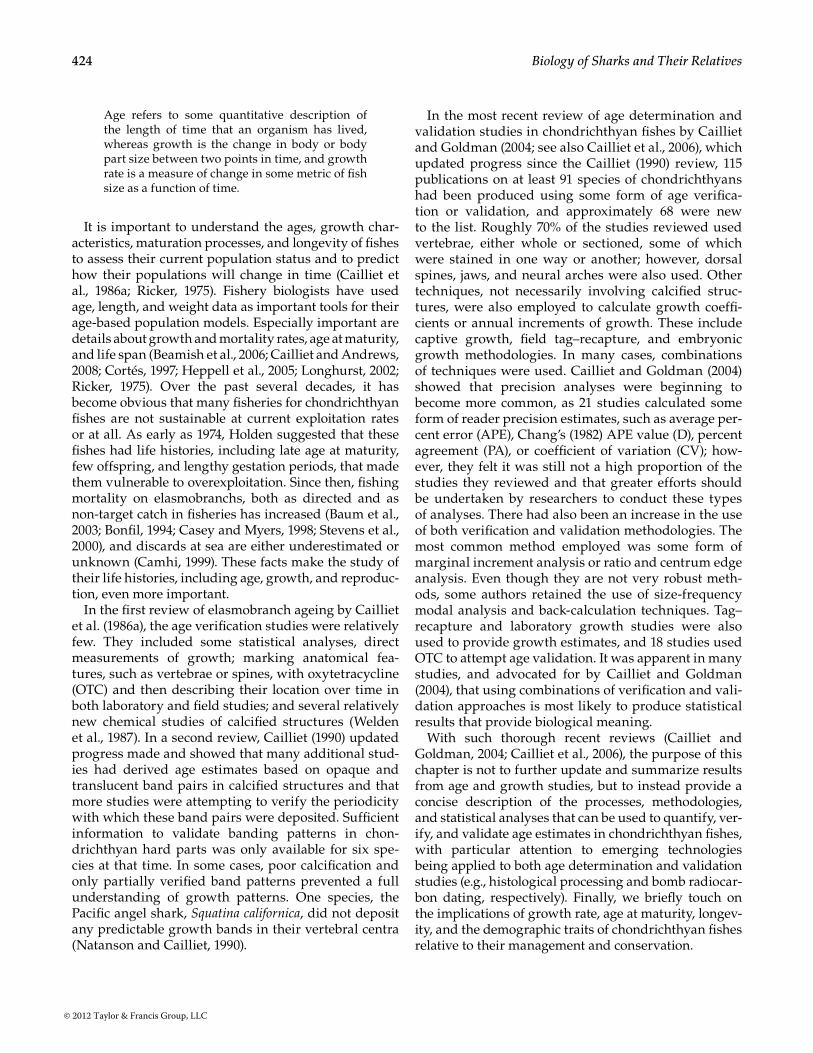
14.2.1.3 Neural Arches
Calcium deposits have been documented in the neural arches of elasmobranch fishes (Cailliet, 1990; Peignoux-Deville et al., 1982), but they had not been used for age-ing. In 2002, McFarlane and colleagues introduced the first attempt to use this structure for ageing elasmo-branchs by silver nitrate staining the neural arches of sixgill sharks, Hexanchus griseus. The results from that preliminary study indicate that neural arches may pro-vide another ageing structure for elasmobranch species with poorly calcified vertebral centra, but the method has not been followed up on or validated (Figure 14.3).
14.2.1.4 Caudal Thorns and Other Structures
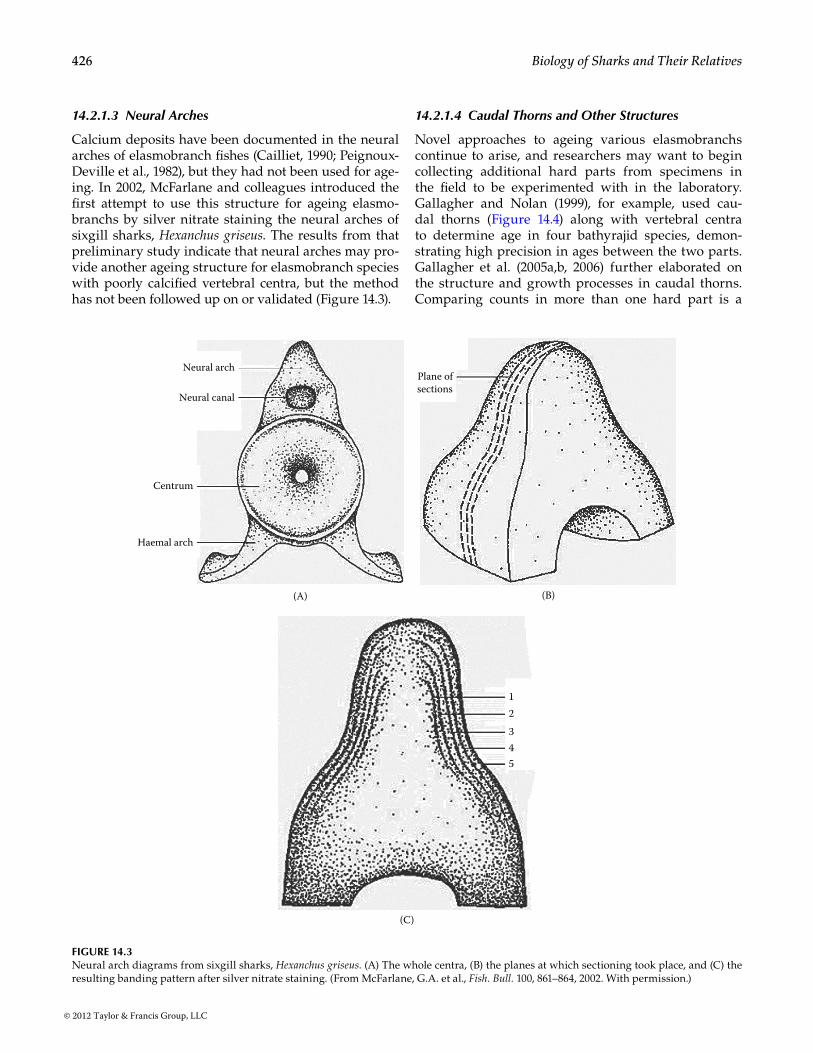
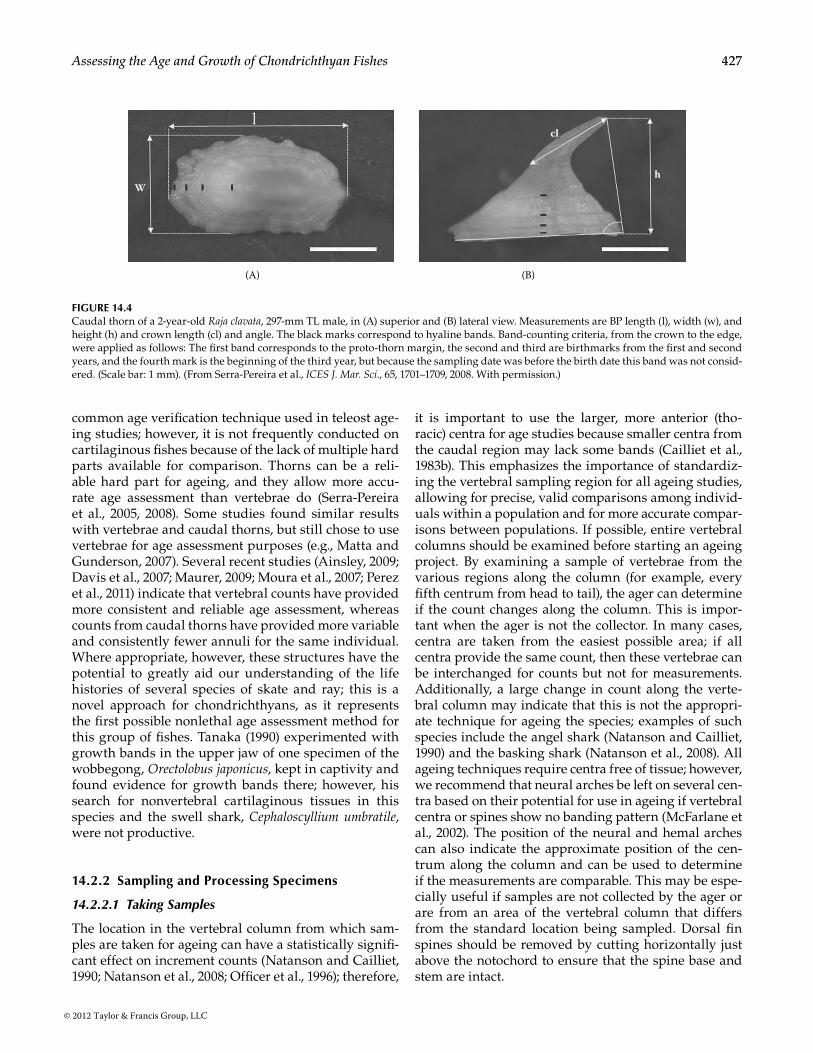
Novel approaches to ageing various elasmobranchs continue to arise, and researchers may want to begin collecting additional hard parts from specimens in the field to be experimented with in the laboratory. Gallagher and Nolan (1999), for example, used cau-dal thorns (Figure 14.4) along with vertebral centra to determine age in four bathyrajid species, demon-strating high precision in ages between the two parts. Gallagher et al. (2005a,b, 2006) further elaborated on the structure and growth processes in caudal thorns. Comparing counts in more than one hard part is a
Neural arch
Neural canal
Centrum
Haemal arch
(A)
Plane ofsections
(B)
12345
(C)
Figure 14.3Neural arch diagrams from sixgill sharks, Hexanchus griseus. (A) The whole centra, (B) the planes at which sectioning took place, and (C) the resulting banding pattern after silver nitrate staining. (From McFarlane, G.A. et al., Fish. Bull. 100, 861–864, 2002. With permission.)
© 2012 Taylor & Francis Group, LLC
427Assessing the Age and Growth of Chondrichthyan Fishes
common age verification technique used in teleost age-ing studies; however, it is not frequently conducted on cartilaginous fishes because of the lack of multiple hard parts available for comparison. Thorns can be a reli-able hard part for ageing, and they allow more accu-rate age assessment than vertebrae do (Serra-Pereira et al., 2005, 2008). Some studies found similar results with vertebrae and caudal thorns, but still chose to use vertebrae for age assessment purposes (e.g., Matta and Gunderson, 2007). Several recent studies (Ainsley, 2009; Davis et al., 2007; Maurer, 2009; Moura et al., 2007; Perez et al., 2011) indicate that vertebral counts have provided more consistent and reliable age assessment, whereas counts from caudal thorns have provided more variable and consistently fewer annuli for the same individual. Where appropriate, however, these structures have the potential to greatly aid our understanding of the life histories of several species of skate and ray; this is a novel approach for chondrichthyans, as it represents the first possible nonlethal age assessment method for this group of fishes. Tanaka (1990) experimented with growth bands in the upper jaw of one specimen of the wobbegong, Orectolobus japonicus, kept in captivity and found evidence for growth bands there; however, his search for nonvertebral cartilaginous tissues in this species and the swell shark, Cephaloscyllium umbratile, were not productive.
14.2.2 Sampling and Processing Specimens
14.2.2.1 Taking Samples
The location in the vertebral column from which sam-ples are taken for ageing can have a statistically signifi-cant effect on increment counts (Natanson and Cailliet, 1990; Natanson et al., 2008; Officer et al., 1996); therefore,
it is important to use the larger, more anterior (tho-racic) centra for age studies because smaller centra from the caudal region may lack some bands (Cailliet et al., 1983b). This emphasizes the importance of standardiz-ing the vertebral sampling region for all ageing studies, allowing for precise, valid comparisons among individ-uals within a population and for more accurate compar-isons between populations. If possible, entire vertebral columns should be examined before starting an ageing project. By examining a sample of vertebrae from the various regions along the column (for example, every fifth centrum from head to tail), the ager can determine if the count changes along the column. This is impor-tant when the ager is not the collector. In many cases, centra are taken from the easiest possible area; if all centra provide the same count, then these vertebrae can be interchanged for counts but not for measurements. Additionally, a large change in count along the verte-bral column may indicate that this is not the appropri-ate technique for ageing the species; examples of such species include the angel shark (Natanson and Cailliet, 1990) and the basking shark (Natanson et al., 2008). All ageing techniques require centra free of tissue; however, we recommend that neural arches be left on several cen-tra based on their potential for use in ageing if vertebral centra or spines show no banding pattern (McFarlane et al., 2002). The position of the neural and hemal arches can also indicate the approximate position of the cen-trum along the column and can be used to determine if the measurements are comparable. This may be espe-cially useful if samples are not collected by the ager or are from an area of the vertebral column that differs from the standard location being sampled. Dorsal fin spines should be removed by cutting horizontally just above the notochord to ensure that the spine base and stem are intact.
W
cl
h
(A) (B)
Figure 14.4Caudal thorn of a 2-year-old Raja clavata, 297-mm TL male, in (A) superior and (B) lateral view. Measurements are BP length (l), width (w), and height (h) and crown length (cl) and angle. The black marks correspond to hyaline bands. Band-counting criteria, from the crown to the edge, were applied as follows: The first band corresponds to the proto-thorn margin, the second and third are birthmarks from the first and second years, and the fourth mark is the beginning of the third year, but because the sampling date was before the birth date this band was not consid-ered. (Scale bar: 1 mm). (From Serra-Pereira et al., ICES J. Mar. Sci., 65, 1701–1709, 2008. With permission.)
© 2012 Taylor & Francis Group, LLC

428 Biology of Sharks and Their Relatives
Vertebral samples are typically individually bagged, labeled, and stored frozen until ready for preparation. If freezing is not an option, vertebrae can be fixed in 10% formalin for 24 hr and then preserved in alcohol. Second dorsal fin spines are typically bagged, labeled, and frozen until returned to the laboratory or are placed immediately in 70 to 95% ethyl alcohol or 95% isopropyl alcohol.
14.2.2.2 Centrum Cleaning and Sample Preparation
It is important to the age-determination process that the majority of vertebral sections include the calcified radials of the intermedialia, but this is not always easy. The radi-als of the intermedialia of carcharhinid sharks, for exam-ple, are relatively hard, robust, and numerous, making centra nearly solid; in contrast, the radials of the interme-dialia in lamnoid sharks are less numerous, softer, and quite fragile. Large interstitial spaces between radials can prevent intermedialia from being present in a sec-tioned centrum. Conducting several preliminary “test cuts” should reveal the best location to make a sagittal cut that will include intermedialia. When the best loca-tion has been found, all cuts must be consistent (i.e., made in the same location on each centrum) to minimize error in centrum measurements, which are critically impor-tant for centrum edge analyses and back-calculations. In the experience of the authors, the best cut to obtain the radials of the intermedialia has most frequently been a side-to-side cut from the vertebral centrum vs. a top-to-bottom one. Additionally, this cut provides sym-metrical sides (relative to the focus), which provides four corpus calcarea to use for ageing; for example, as the girth greatly expands with age in the large lamnids, the vertebra also become wider in response. Along with this growth, the vertebra widens at the bottom, thus a top-to-bottom cut results in a wide “V” from the focus to the bottom of the section and a thin “V” from the focus to the top of the section. This nonsymmetrical type of sag-ittal section does not allow for measurements from each half of the sample to be compared, thereby relegating the ager to choosing either the top or bottom part of the section and limiting analyses to two corpus calcareum arms from which to age the sample.
The following provides a synopsis of methods for cleaning vertebral centrum; however, parts or all of the recommendations below may or may not be necessary depending on species and condition of the samples at the time of preparation. Vertebral samples need to be thawed if frozen or washed if preserved in alcohol, cleaned of excess tissue, and separated into individual centra. Tissue-removal techniques vary with species. For many, soaking the centrum in distilled water for 5 min followed by air-drying allows the connective tissue to be peeled away. Soaking in bleach may be required
for other species. Bleaching time is proportional to cen-trum size and ranges from 5 to 30 min. After bleach-ing, the centrum is rinsed thoroughly in water. Another simple and effective method is to soak vertebral sec-tions in a 5% sodium hypochlorite solution. Soak times can range from 5 min to 1 hr depending on the size of the vertebrae and should be followed by soaking cen-tra in distilled water for 30 to 45 min (Johnson, 1979; Schwartz, 1983). This method also assists in removal of the vertebral fascia between centra and does not affect the staining process. Centra are typically permanently stored in 70 to 95% ethyl alcohol or 95% isopropyl alco-hol; however, we recommend that a subsample of centra be permanently stored in a freezer in case it is needed for staining and because long-term exposure to alcohol may reduce the resolution of the banding pattern (Allen and Wintner, 2002; Wintner et al., 2002).
Vertebrae can be analyzed whole or sectioned, but sectioning is typically ideal. Vertebral sectioning is often done with a low-speed, diamond-blade saw; how-ever, a wide variety of saws are available that can be used for this purpose. Each centrum should be sagit-tally sectioned immediately adjacent to the center of its focus (so the center of the focus is at the edge of the cut) and then cut again approximately 1.5 mm off-center. Accuracy and precision in these cuts (i.e., always includ-ing the center point of the focus) will reduce centrum measurement error among individuals. A double-blade saw can be used to eliminate the problem of cutting a small section off of half of a vertebral centrum (spac-ing between blades should be no less than 0.6 mm to allow for some sanding or polishing). Large vertebrae can be handheld for cutting, whereas imbedding small vertebrae in resin (thermoplastic cement) and then cut-ting may prove easier. If a rotary saw is not used, small vertebrae can be sanded in half, mounted, sanded thin, and polished. A grinder may be used to section large vertebrae, which can then be mounted, sanded thin, and polished. If necessary, sections can be cut with small handsaws and even scalpels when working with very small centra, or half of the centrum can be worn away with aluminum-oxide wheel points and fine sandpaper attachments for the same tool (Cailliet et al., 1983a,b). Large vertebrae may be handheld or secured in a vise and cut with a small circular saw attachment on a jew-eler’s drill or even ground in half with a grinder.
If working with vertebrae with small numbers of radi-als (e.g., lamniform), pressing the sagittally cut (bow-tie-shaped) sections between two pieces of Plexiglas® and placing weight on the top sheet during drying will prevent warping, which can effect increment and cen-trum radius measurements. Sectioned vertebrae should be air-dried for 12 to 24 hr (under a ventilation hood, if possible), and then mounted onto microscope slides. The focus side of the vertebral section must consistently
© 2012 Taylor & Francis Group, LLC
429Assessing the Age and Growth of Chondrichthyan Fishes
be placed face down on the slide when mounting in order to avoid adding to centrum measurement error that will lead to subsequent analysis error. Any typical slide-mounting medium will suffice for attaching ver-tebral sections. After mounting the sections to slides, they should be sanded with wet fine-grit sandpaper in a series (grades 320, 400, and finally 600 for pol-ishing) to approximately 0.3 to 0.5 mm and air-dried. Alternatively, sections can be stored in 70% EtOH and subsequently viewed under a microscope submerged in a small amount of water or EtOH. It may be prudent to attempt both wet and dry reads on vertebral samples as one way may provide easier band interpretation for a given species. A binocular dissecting microscope with transmitted light is generally used for identification of growth rings and image analysis.
14.2.2.3 Centrum Staining
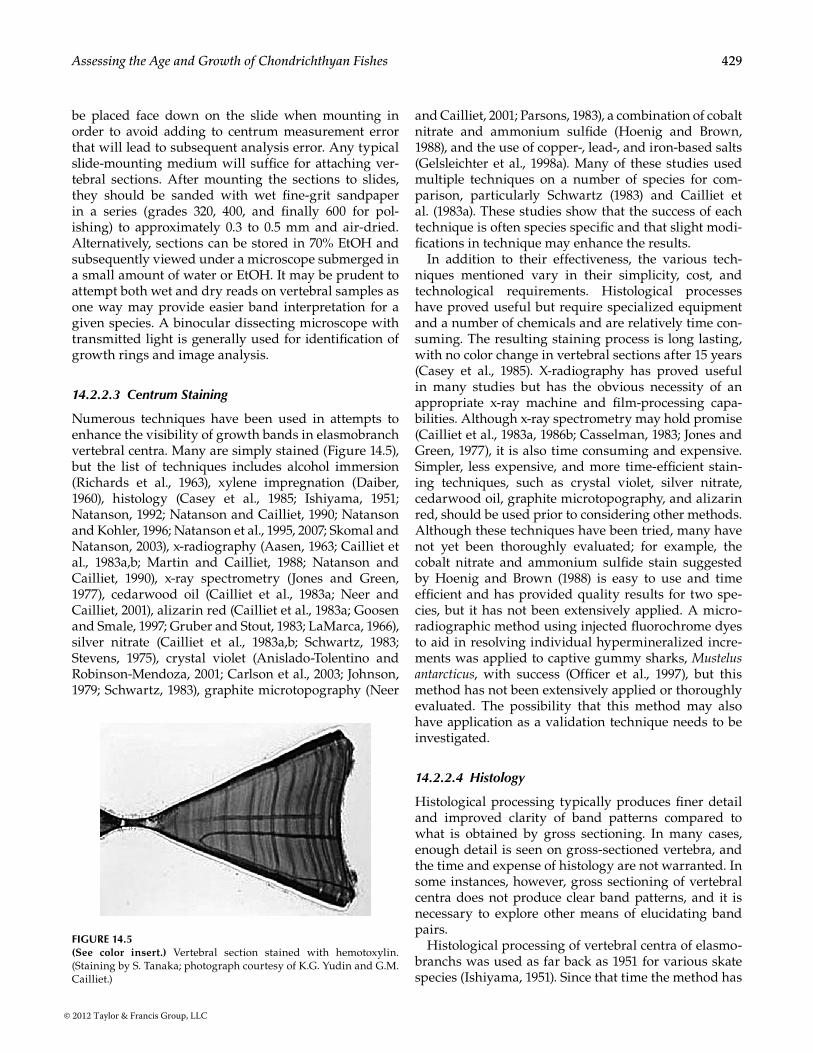
Numerous techniques have been used in attempts to enhance the visibility of growth bands in elasmobranch vertebral centra. Many are simply stained (Figure 14.5), but the list of techniques includes alcohol immersion (Richards et al., 1963), xylene impregnation (Daiber, 1960), histology (Casey et al., 1985; Ishiyama, 1951; Natanson, 1992; Natanson and Cailliet, 1990; Natanson and Kohler, 1996; Natanson et al., 1995, 2007; Skomal and Natanson, 2003), x-radiography (Aasen, 1963; Cailliet et al., 1983a,b; Martin and Cailliet, 1988; Natanson and Cailliet, 1990), x-ray spectrometry (Jones and Green, 1977), cedarwood oil (Cailliet et al., 1983a; Neer and Cailliet, 2001), alizarin red (Cailliet et al., 1983a; Goosen and Smale, 1997; Gruber and Stout, 1983; LaMarca, 1966), silver nitrate (Cailliet et al., 1983a,b; Schwartz, 1983; Stevens, 1975), crystal violet (Anislado-Tolentino and Robinson-Mendoza, 2001; Carlson et al., 2003; Johnson, 1979; Schwartz, 1983), graphite microtopography (Neer
and Cailliet, 2001; Parsons, 1983), a combination of cobalt nitrate and ammonium sulfide (Hoenig and Brown, 1988), and the use of copper-, lead-, and iron-based salts (Gelsleichter et al., 1998a). Many of these studies used multiple techniques on a number of species for com-parison, particularly Schwartz (1983) and Cailliet et al. (1983a). These studies show that the success of each technique is often species specific and that slight modi-fications in technique may enhance the results.
In addition to their effectiveness, the various tech-niques mentioned vary in their simplicity, cost, and technological requirements. Histological processes have proved useful but require specialized equipment and a number of chemicals and are relatively time con-suming. The resulting staining process is long lasting, with no color change in vertebral sections after 15 years (Casey et al., 1985). X-radiography has proved useful in many studies but has the obvious necessity of an appropriate x-ray machine and film-processing capa-bilities. Although x-ray spectrometry may hold promise (Cailliet et al., 1983a, 1986b; Casselman, 1983; Jones and Green, 1977), it is also time consuming and expensive. Simpler, less expensive, and more time-efficient stain-ing techniques, such as crystal violet, silver nitrate, cedarwood oil, graphite microtopography, and alizarin red, should be used prior to considering other methods. Although these techniques have been tried, many have not yet been thoroughly evaluated; for example, the cobalt nitrate and ammonium sulfide stain suggested by Hoenig and Brown (1988) is easy to use and time efficient and has provided quality results for two spe-cies, but it has not been extensively applied. A micro-radiographic method using injected fluorochrome dyes to aid in resolving individual hypermineralized incre-ments was applied to captive gummy sharks, Mustelus antarcticus, with success (Officer et al., 1997), but this method has not been extensively applied or thoroughly evaluated. The possibility that this method may also have application as a validation technique needs to be investigated.
14.2.2.4 Histology
Histological processing typically produces finer detail and improved clarity of band patterns compared to what is obtained by gross sectioning. In many cases, enough detail is seen on gross-sectioned vertebra, and the time and expense of histology are not warranted. In some instances, however, gross sectioning of vertebral centra does not produce clear band patterns, and it is necessary to explore other means of elucidating band pairs.
Histological processing of vertebral centra of elasmo-branchs was used as far back as 1951 for various skate species (Ishiyama, 1951). Since that time the method has
Figure 14.5(See color insert.) Vertebral section stained with hemotoxylin. (Staining by S. Tanaka; photograph courtesy of K.G. Yudin and G.M. Cailliet.)
© 2012 Taylor & Francis Group, LLC

430 Biology of Sharks and Their Relatives
been used sporadically (Casey et al., 1985; Natanson, 1993; Natanson and Kohler, 1996; Natanson et al., 1995), due in part to few laboratories having the equipment and training and the expense in terms of both funds and time. The current method for processing vertebra for histology follows methods developed by Casey et al. (1985) for the sandbar shark and has evolved slightly as more species are being aged. The method for skates was described in detail in Natanson et al. (2007).
The band pairs of various skate species and many carcharhinid species have been more easily interpreted using histology. Recently, with an increase in the num-ber of ageing studies on skate species and the diffi-culty surrounding the band pair clarity, histology has become an increasingly important tool for assessing age (Ainsley, 2009; Maurer, 2009; Natanson et al., 2007). Maurer (2009) found that band pair clarity was more distinct and more uniform using the histologically pre-pared sections vs. those prepared with gross sectioning (Figure 14.6). Additionally, band-pair counts using the histologically prepared samples showed less reader bias than those with gross sectioning. This typically led to older ages being assessed due to band elucidation and provided better repeatable age assessments, thus lead-ing to higher reader precision.
An overview of the process follows: Vertebra should be cleaned of muscle but do not have to be soaked or otherwise scraped before processing. Vertebra need to be preserved in 70% ethanol (EtOH), which can be done when they are whole or after the initial sectioning. In general, one vertebra is sectioned along the lateral plane and around the focus of the vertebra using a rough saw to 3- to 5-mm thickness (larger vertebra may need to be cut thicker). Cut sections are then stored in 70% EtOH. Sections are decalcified with RDO (Dupage Kinetics Laboratories; Plainfield, IL), a rapid bone decalcifier,
though other products can be used and embedded in paraffin. When the sections are in paraffin “blocks,” they are sectioned to approximately 80 to 100 µm using a sledge microtome. The final sections used for age assess-ment are those that are cut directly through the focus. These are placed in xylene and must be stained within 24 hr or less. After staining, sections are mounted on glass slides using an aqueous mounting media and a coverslip. Chemicals, standard embedding, and staining times are modified for use with the vertebra (Natanson et al., 2007). Processing times may have to be adjusted based on the size of the sections and the strengths of the solutions (i.e., older stain may take longer). Once final sections are mounted, they can be examined under a bin-ocular microscope or photographed for image analysis.
14.3 Age Determination
Although concentric growth bands have been docu-mented in the vertebral centra of chondrichthyans for more than 90 years (Ridewood, 1921), ageing these fishes has proved a slow and difficult process. Counts of opaque and translucent banding patterns in vertebrae, dorsal fin spines, caudal thorns, and neural arches have provided the only means of obtaining information on growth rates in these fishes, as they lack the hard parts, such as otoliths, scales, and bones, typically used in age and growth studies of teleost fishes (Cailliet, 1990; Cailliet et al., 1986a,b; Gallagher and Nolan, 1999; McFarlane et al., 2002). Unfortunately, the vertebral centra of many elas-mobranch species (such as numerous deepwater spe-cies) are too poorly calcified to provide information on age, most species have no dorsal spines, and there may
Birthmark Birthmark
Figure 14.6(See color insert.) Comparison showing gross sectioned vertebral centrum vs. histologically prepared vertebral section of vertebrae from the same individual Commander skate, Bathyraja lindbergi. (Photograph courtesy of J. Maurer.)
© 2012 Taylor & Francis Group, LLC
431Assessing the Age and Growth of Chondrichthyan Fishes
be no tangible relationship between observed banding patterns and growth (Cailliet, 1990; Cailliet et al., 1986b; McFarlane et al., 2002; Natanson and Cailliet, 1990). These circumstances continue to cause difficulties in making age estimates for many species.
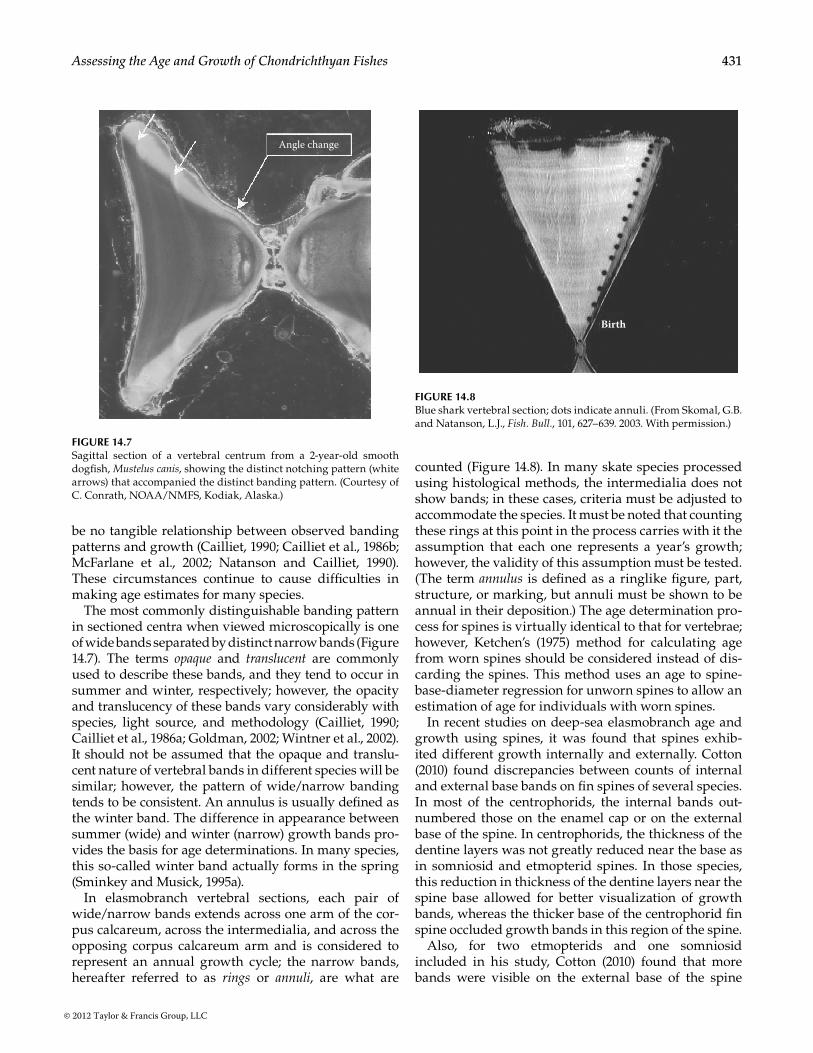
The most commonly distinguishable banding pattern in sectioned centra when viewed microscopically is one of wide bands separated by distinct narrow bands (Figure 14.7). The terms opaque and translucent are commonly used to describe these bands, and they tend to occur in summer and winter, respectively; however, the opacity and translucency of these bands vary considerably with species, light source, and methodology (Cailliet, 1990; Cailliet et al., 1986a; Goldman, 2002; Wintner et al., 2002). It should not be assumed that the opaque and translu-cent nature of vertebral bands in different species will be similar; however, the pattern of wide/narrow banding tends to be consistent. An annulus is usually defined as the winter band. The difference in appearance between summer (wide) and winter (narrow) growth bands pro-vides the basis for age determinations. In many species, this so-called winter band actually forms in the spring (Sminkey and Musick, 1995a).
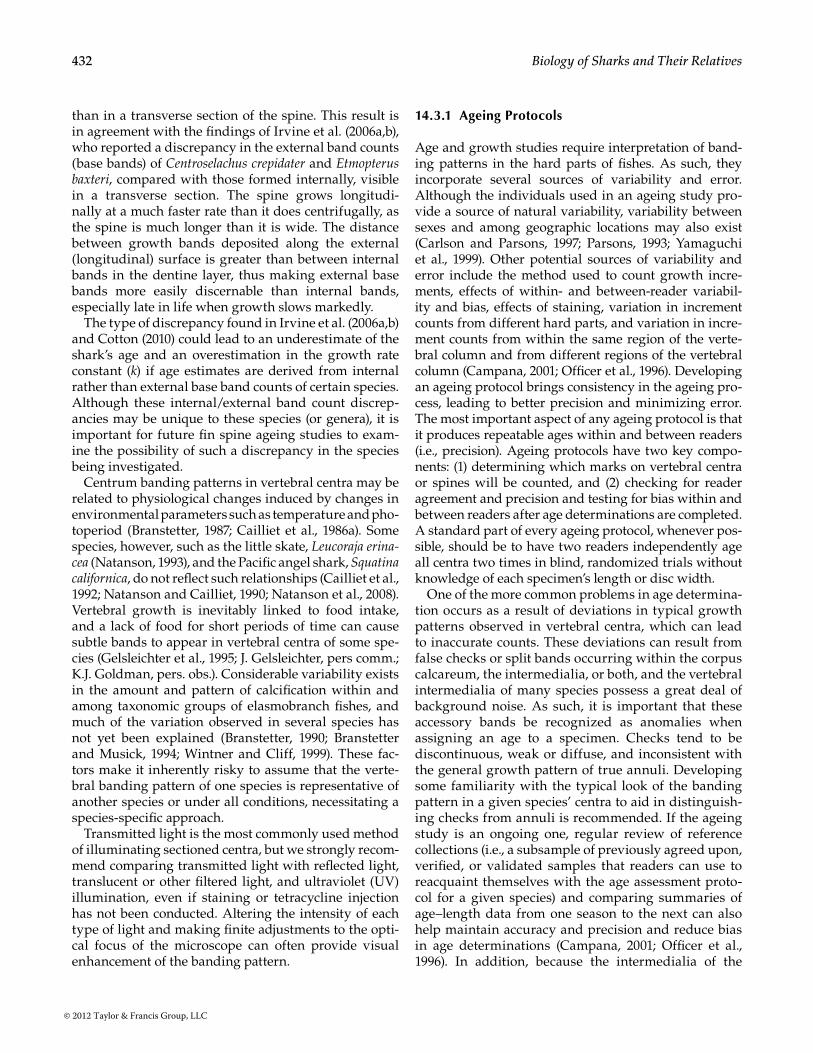
In elasmobranch vertebral sections, each pair of wide/narrow bands extends across one arm of the cor-pus calcareum, across the intermedialia, and across the opposing corpus calcareum arm and is considered to represent an annual growth cycle; the narrow bands, hereafter referred to as rings or annuli, are what are
counted (Figure 14.8). In many skate species processed using histological methods, the intermedialia does not show bands; in these cases, criteria must be adjusted to accommodate the species. It must be noted that counting these rings at this point in the process carries with it the assumption that each one represents a year’s growth; however, the validity of this assumption must be tested. (The term annulus is defined as a ringlike figure, part, structure, or marking, but annuli must be shown to be annual in their deposition.) The age determination pro-cess for spines is virtually identical to that for vertebrae; however, Ketchen’s (1975) method for calculating age from worn spines should be considered instead of dis-carding the spines. This method uses an age to spine-base-diameter regression for unworn spines to allow an estimation of age for individuals with worn spines.
In recent studies on deep-sea elasmobranch age and growth using spines, it was found that spines exhib-ited different growth internally and externally. Cotton (2010) found discrepancies between counts of internal and external base bands on fin spines of several species. In most of the centrophorids, the internal bands out-numbered those on the enamel cap or on the external base of the spine. In centrophorids, the thickness of the dentine layers was not greatly reduced near the base as in somniosid and etmopterid spines. In those species, this reduction in thickness of the dentine layers near the spine base allowed for better visualization of growth bands, whereas the thicker base of the centrophorid fin spine occluded growth bands in this region of the spine.
Also, for two etmopterids and one somniosid included in his study, Cotton (2010) found that more bands were visible on the external base of the spine
Angle change
Figure 14.7Sagittal section of a vertebral centrum from a 2-year-old smooth dogfish, Mustelus canis, showing the distinct notching pattern (white arrows) that accompanied the distinct banding pattern. (Courtesy of C. Conrath, NOAA/NMFS, Kodiak, Alaska.)
Birth
Figure 14.8Blue shark vertebral section; dots indicate annuli. (From Skomal, G.B. and Natanson, L.J., Fish. Bull., 101, 627–639. 2003. With permission.)
© 2012 Taylor & Francis Group, LLC
432 Biology of Sharks and Their Relatives
than in a transverse section of the spine. This result is in agreement with the findings of Irvine et al. (2006a,b), who reported a discrepancy in the external band counts (base bands) of Centroselachus crepidater and Etmopterus baxteri, compared with those formed internally, visible in a transverse section. The spine grows longitudi-nally at a much faster rate than it does centrifugally, as the spine is much longer than it is wide. The distance between growth bands deposited along the external (longitudinal) surface is greater than between internal bands in the dentine layer, thus making external base bands more easily discernable than internal bands, especially late in life when growth slows markedly.
The type of discrepancy found in Irvine et al. (2006a,b) and Cotton (2010) could lead to an underestimate of the shark’s age and an overestimation in the growth rate constant (k) if age estimates are derived from internal rather than external base band counts of certain species. Although these internal/external band count discrep-ancies may be unique to these species (or genera), it is important for future fin spine ageing studies to exam-ine the possibility of such a discrepancy in the species being investigated.
Centrum banding patterns in vertebral centra may be related to physiological changes induced by changes in environmental parameters such as temperature and pho-toperiod (Branstetter, 1987; Cailliet et al., 1986a). Some species, however, such as the little skate, Leucoraja erina-cea (Natanson, 1993), and the Pacific angel shark, Squatina californica, do not reflect such relationships (Cailliet et al., 1992; Natanson and Cailliet, 1990; Natanson et al., 2008). Vertebral growth is inevitably linked to food intake, and a lack of food for short periods of time can cause subtle bands to appear in vertebral centra of some spe-cies (Gelsleichter et al., 1995; J. Gelsleichter, pers comm.; K.J. Goldman, pers. obs.). Considerable variability exists in the amount and pattern of calcification within and among taxonomic groups of elasmobranch fishes, and much of the variation observed in several species has not yet been explained (Branstetter, 1990; Branstetter and Musick, 1994; Wintner and Cliff, 1999). These fac-tors make it inherently risky to assume that the verte-bral banding pattern of one species is representative of another species or under all conditions, necessitating a species-specific approach.
Transmitted light is the most commonly used method of illuminating sectioned centra, but we strongly recom-mend comparing transmitted light with reflected light, translucent or other filtered light, and ultraviolet (UV) illumination, even if staining or tetracycline injection has not been conducted. Altering the intensity of each type of light and making finite adjustments to the opti-cal focus of the microscope can often provide visual enhancement of the banding pattern.
14.3.1 ageing Protocols
Age and growth studies require interpretation of band-ing patterns in the hard parts of fishes. As such, they incorporate several sources of variability and error. Although the individuals used in an ageing study pro-vide a source of natural variability, variability between sexes and among geographic locations may also exist (Carlson and Parsons, 1997; Parsons, 1993; Yamaguchi et al., 1999). Other potential sources of variability and error include the method used to count growth incre-ments, effects of within- and between-reader variabil-ity and bias, effects of staining, variation in increment counts from different hard parts, and variation in incre-ment counts from within the same region of the verte-bral column and from different regions of the vertebral column (Campana, 2001; Officer et al., 1996). Developing an ageing protocol brings consistency in the ageing pro-cess, leading to better precision and minimizing error. The most important aspect of any ageing protocol is that it produces repeatable ages within and between readers (i.e., precision). Ageing protocols have two key compo-nents: (1) determining which marks on vertebral centra or spines will be counted, and (2) checking for reader agreement and precision and testing for bias within and between readers after age determinations are completed. A standard part of every ageing protocol, whenever pos-sible, should be to have two readers independently age all centra two times in blind, randomized trials without knowledge of each specimen’s length or disc width.
One of the more common problems in age determina-tion occurs as a result of deviations in typical growth patterns observed in vertebral centra, which can lead to inaccurate counts. These deviations can result from false checks or split bands occurring within the corpus calcareum, the intermedialia, or both, and the vertebral intermedialia of many species possess a great deal of background noise. As such, it is important that these accessory bands be recognized as anomalies when assigning an age to a specimen. Checks tend to be discontinuous, weak or diffuse, and inconsistent with the general growth pattern of true annuli. Developing some familiarity with the typical look of the banding pattern in a given species’ centra to aid in distinguish-ing checks from annuli is recommended. If the ageing study is an ongoing one, regular review of reference collections (i.e., a subsample of previously agreed upon, verified, or validated samples that readers can use to reacquaint themselves with the age assessment proto-col for a given species) and comparing summaries of age–length data from one season to the next can also help maintain accuracy and precision and reduce bias in age determinations (Campana, 2001; Officer et al., 1996). In addition, because the intermedialia of the
© 2012 Taylor & Francis Group, LLC

433Assessing the Age and Growth of Chondrichthyan Fishes
centrum in many species is not very robust, it may warp in a concave manner during the drying process. When this occurs, the rings near the outer edge of the intermedialia bunch up and become indistinguish-able. The rings on the corpus calcareum also become more tightly grouped at the outer edge, particularly in larger or older animals; however, they have a tendency to remain distinguishable due to the stronger (more robust) nature of the structure. For these reasons, the corpus calcareum should always be used as the pri-mary counting and measuring surface, with the distinct rings in the intermedialia and any additional features (see below) used as confirmation of a ring or annulus. Ageing from digital photographs and image analysis has become more common in recent years. Sections can be photographed under a microscope and examined in a much larger capacity on a screen. Advantages include the ability of several readers to interact when counts are being compared. Additionally, sections such as the difficult-to-read edge can be enhanced and enlarged with computer software. Measurements can be taken more easily, as a cursor is simply placed on the band in question and the measurement calculated. It is often helpful to have the actual section available to compare, as sometimes the photographs are not as distinct as the actual section.
Additional difficulties in ageing elasmobranch fishes can include determining the birthmark and first growth ring. Birthmarks are usually represented by an angle change along the centrum face of whole vertebrae or along the intermedialia–corpus calcareum interface with an associated ring on the corpus calcareum in sectioned centra, but this feature may not be distinct in either. The birthmark usually can be found on the whole centrum surface (i.e., the outside wall of the corpus cal-careum), but the variability in this mark is such that it may appear distinctly only within the sagittally cut sec-tion. Additionally, pre-birth rings have been reported in some species (Branstetter and Musick, 1994; Casey et al., 1985; Goldman, 2002; Goldman et al., 2006; Nagasawa, 1998). Once the angle change is located, pre-birth rings can easily be distinguished from the first growth ring. The first growth ring may consist of minimal growth around the focus of a vertebra, can be faint relative to other annuli (Campana, 2001), and can also differ in its opacity or translucency (Allen and Wintner, 2002; Wintner and Dudley, 2000). Being able to consistently locate a birthmark and (particularly) the first annulus are obviously of critical importance to accurate age assessment. Knowledge of the pupping (or hatching) time of a given species can help in determining if the first annulus is expected to be very small (first winter is soon after birth) or large (first winter is a considerable time after birth).
The vertebral centra of some species may also pos-sess features that can assist in ageing specimens. For example, sagittally cut vertebral sections of some species reveal distinct notches along either the inside or outside edge of the corpus calcareum at each ring, providing an additional ageing feature (Goldman and Musick, 2006; Goldman et al., 2006). This can be particularly useful in ageing vertebral sections where the cut has excluded the radials of the intermedialia and in distinguishing growth checks from annuli. If examination of vertebral centra reveals no discernable banding patterns or reveals rings that are difficult to interpret, centra (either whole or sectioned) can be stained or histologically processed to attempt enhancement of growth bands for enumeration.
14.3.2 Precision and bias
Precise and accurate age estimation is a critical com-ponent of any ageing study. It is important to keep in mind that the consistent reproducibility of age esti-mates from vertebral centra will achieve high precision but these age estimates may not be accurate (i.e., reflect the true or absolute age), and precision should never be used as a substitute for accuracy. Accurate age determi-nation requires validation of absolute age, not just the frequency of increment formation in vertebral centra or spines (Beamish and McFarlane, 1983; Cailliet, 1990; Campana, 2001).
Two readers independently ageing all centra two times in blind, randomized trials without knowledge of each specimen’s length or disc width allows two calcu-lations of between-reader agreement and precision and helps prevent reader bias that can be caused by prede-termination of age based on knowledge of length (i.e., prevent subjectivity). It also allows for within-reader comparisons, which may be critical if only one reader is assessing ages and no between-reader comparisons are possible. When there is a disagreement between readers, a final age determination should be made by the two readers viewing the ageing structure together, as a single age is needed from each specimen for input into growth models. If no consensus can be reached, the sample should be eliminated from the study.
The most commonly used methods for evaluating pre-cision among age determinations have been the average percent error (APE) technique of Beamish and Fournier (1981) and the modification of their method by Chang (1982). Hoenig et al. (1995) and Evans and Hoenig (1998), however, demonstrated that there can be differences in precision that these methods obscure because the APE assumes that the variability among observations of individual fish can be averaged over all age groups, and this variability can be expressed in relative terms. Also, APE does not result in values that are independent of
© 2012 Taylor & Francis Group, LLC
434 Biology of Sharks and Their Relatives
the age estimates. APE indices do not test for systematic differences, do not distinguish all sources of variability (such as differences in precision with age), and do not take experimental design into account (i.e., number of times each sample was read in each study) (Hoenig et al., 1995). Within a given ageing study, however, APE indices may serve as good relative indicators of preci-sion within and between readers provided that each reader ages each vertebra the same number of times. Even this, though, appears to tell us only which reader was less variable, not which was better or if either was biased, which is more critical to discern in ageing data. Comparing precision between studies would seem to hold importance only if the study species is the same, but caution should be used if samples are from different geographic areas or if samples were prepared using dif-ferent methods.
Goldman (2005) provided a simple and accurate approach to estimating precision: (1) calculate the per-cent reader agreement (PA), which is equal to the (No. agreed/No. read) × 100, within and between readers for all samples; (2) calculate the percent agreement plus or minus one year (PA ± 1 year) within and between readers for all samples; (3) calculate the percent agree-ment within and between readers, with individuals divided into appropriate length or disk-width groups (e.g., 5- to 10-cm increments) as an estimate of precision (this should be done with sexes separate and together); and (4) test for bias using one or more of the methods discussed below. The criticism of percent agreement as a measure of precision has been that it varies widely
among species and ages within a species (Beamish and Fournier, 1981; Campana, 2001). Precision estimates of percent agreement varying among species is not a valid concern, as there is no purpose in comparing PA esti-mates between studies or species. We are not aware of any literature where this has been done. A more valid concern about percent agreement is the variation among ages within a species, because the ages used to obtain percent agreement are typically only assessed and not validated. Age could be used if, and only if, validation of absolute age for all available age classes had been achieved. There is, however, validity in using percent agreement with individuals grouped by length as a test of precision because it does not rely on ages (which have been estimated), but rather on lengths, which are empir-ical values (Cailliet and Goldman, 2004; Goldman, 2005; Goldman and Musick, 2006; Goldman et al., 2006).
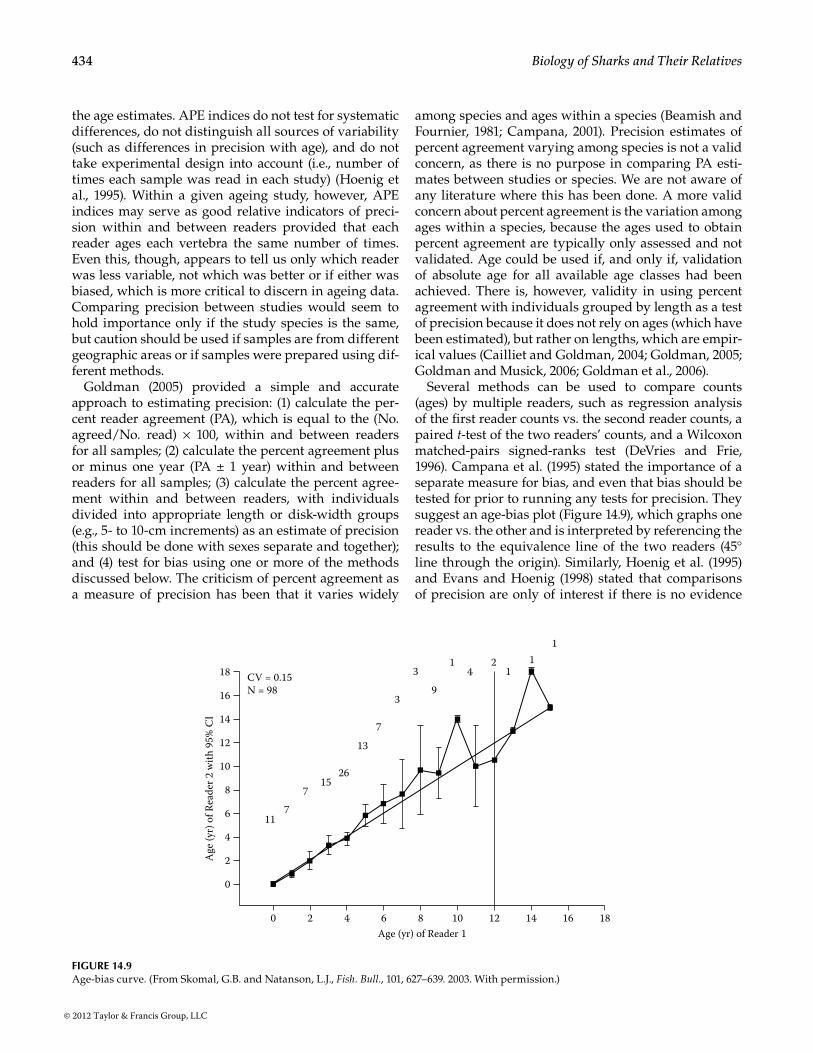
Several methods can be used to compare counts (ages) by multiple readers, such as regression analysis of the first reader counts vs. the second reader counts, a paired t-test of the two readers’ counts, and a Wilcoxon matched-pairs signed-ranks test (DeVries and Frie, 1996). Campana et al. (1995) stated the importance of a separate measure for bias, and even that bias should be tested for prior to running any tests for precision. They suggest an age-bias plot (Figure 14.9), which graphs one reader vs. the other and is interpreted by referencing the results to the equivalence line of the two readers (45° line through the origin). Similarly, Hoenig et al. (1995) and Evans and Hoenig (1998) stated that comparisons of precision are only of interest if there is no evidence
117
715
26
13
7
3
39
14
21
11
CV = 0.15N = 98
18
16
14
12
10
8
6
4
2
0
0 2 4 6 8 10Age (yr) of Reader 1
12 14 16 18
Age
(yr)
of R
eade
r 2 w
ith 9
5% C
I
Figure 14.9Age-bias curve. (From Skomal, G.B. and Natanson, L.J., Fish. Bull., 101, 627–639. 2003. With permission.)
© 2012 Taylor & Francis Group, LLC

435Assessing the Age and Growth of Chondrichthyan Fishes
of systematic disagreement among readers or meth-ods; they suggested testing for systematic differences between readers using chi-square tests of symmetry, such as Bowker’s (1948), McNemar’s (1947), or their Evans–Hoenig test, to determine whether differences between and within readers were systematic (biased) or due to random error. This is of particular importance if initial percent agreement and precision estimates are low. We recommend these tests of symmetry for test-ing for bias regardless of precision because they place all age values in contingency tables and test the hypoth-esis that values in a given table are symmetrical about the main diagonal, and because they can be set up to test among all individual age classes or groups of age classes. The test statistic (the chi-square variable) will tend to be large if a systematic difference exists between the two readers.
14.3.3 back-Calculation
Back-calculation is a method for describing the growth history of each individual sampled, and numerous variations in methodology exist (for a thorough review, see Francis, 1990; for a description and application to elasmobranchs, see Goldman, 2005). Back-calculations estimate lengths at previous ages for each individual and should be used if sample sizes are small and if samples have not been obtained from each month. Back-calculation formulas that follow a hard part or body proportion hypothesis are recommended (Campana, 1990; Francis, 1990; Ricker, 1992). The proportional rela-tionship between animal length or disk width and the radius of the vertebral centrum among different length animals within a population is used as a basis for empir-ical relationships regarding population and individual growth, as is the distance from the focus to each annu-lus within a given centrum. Centrum radius (CR) and distance to each ring should be measured as a straight line from the central focus to the outer margin of the corpus calcareum to the finest scale possible. Lengths or disk widths should then be plotted against CR to deter-mine the proportional relationship between somatic and vertebral growth, which will assist in determining the most appropriate back-calculation method.
Providing biological and statistical reasoning behind the choice of a back-calculation method is extremely important for obtaining accurate life-history parameter estimates from a growth function (e.g., Gompertz) when using back-calculated data. Although one method may prove to be more statistically appropriate for back-cal-culation, researchers should conduct several methods for comparison to available sample length-at-age data to verify that statistical significance equates to biologi-cal accuracy. Biological accuracy can be determined by plotting the sample mean length-at-age data against
the difference between mean back-calculated length-at-age estimates and the sample mean length-at-age data to see which method provides results that most accu-rately reflect sample data (Goldman and Musick, 2006; Goldman et al., 2006). Although the most commonly used back-calculation method has been the Dahl–Lea direct proportions method (Carlander, 1969), linear and quadratic modified Dahl–Lea methods (Francis, 1990) and the Frazer–Lee birth-modified back-calcu-lation method (Campana, 1990; Ricker, 1992) should be conducted, where appropriate, and compared to sample length-at-age data (Goldman and Musick, 2006; Goldman et al., 2006).
14.4 Verification and Validation
Cailliet (1990) stated that the process of evaluating growth zone deposition in fishes can be categorized as verification or validation. Verification is defined as “con-firming an age estimate by comparison with other inde-terminate methods,” and validation as “proving the accuracy of age estimates by comparison with a deter-minate method.” These definitions are used throughout this discussion.
Estimates of age, growth rate, and longevity in chon-drichthyans assume that the growth rings are an accu-rate indicator of age. Although this is probably true for most species, few studies on elasmobranch growth have validated the temporal periodicity of band deposi-tion in vertebral centra, and even fewer have validated the absolute age (Cailliet, 1990; Cailliet et al., 1986a; Campana, 2001).
Validation can be achieved via several methods, such as chemically tagging wild fish, conducting mark–recapture studies of known-age individuals, and bomb radiocarbon dating (the latter two can also be used to validate absolute age). A combination of using known-aged individuals, tag and recapture, and chemical marking is probably the most robust method for achiev-ing complete validation (Beamish and McFarlane, 1983; Cailliet, 1990; Campana, 2001; Natanson et al., 2002). Although this is a rather daunting task to accomplish with most elasmobranch species, the current neces-sity to obtain age–growth data for fisheries manage-ment purposes dictates that it be attempted. The most frequently applied method used with elasmobranchs has been chemical marking of wild fish, even though recaptures can be difficult to obtain for many species. Because validation has proved difficult in elasmo-branchs, verification methods such as centrum edge analysis and relative marginal increment analysis are frequently employed.
© 2012 Taylor & Francis Group, LLC
436 Biology of Sharks and Their Relatives
Obtaining the absolute age of individual fish (com-plete validation) is the ultimate goal of every ageing study, yet it is the frequency of growth ring formation for which validation is typically attempted. The distinc-tion between validating absolute age and validating the periodicity of growth-ring formation is important (Beamish and McFarlane, 1983; Cailliet, 1990; Campana, 2001). Validation of the frequency of growth-ring for-mation must prove that the mark being considered an annulus forms once a year (Beamish and McFarlane, 1983); however, it is the consistency of the marks in “number per year” that really matters, be it one or more than one. Two or more marks (rings) may make up an annulus if, and only if, consistent multiple marks per year can be proved. Strictly speaking, validation of absolute age is only complete when it has been done for all age classes available, with validation of the first growth ring being the critical component for obtaining absolute ages (Beamish and McFarlane, 1983; Cailliet, 1990; Campana, 2001).
In the following sections, both verification and vali-dation are discussed. It is important to remember that some techniques, especially if used in conjunction with others, can be verification and/or validation.
14.4.1 Size Mode analysis
This technique monitors the progression of discrete length modes of fish over time. Although commonly considered a basic approach to studying age composi-tion and even growth, its use as a growth tool is pri-marily verification; that is, if the size modes seen in data from a presumed random sample of all sizes of fish in a population appear to coincide with the mean or median sizes in an age class (as determined by ageing studies or other means), then this lends support to the contention that these age classes are real. Kusher et al. (1992), for example, used this method to show that young leopard sharks, Triakis semifasciata, in Elkhorn Slough, CA, fol-lowed growth patterns that would have been predicted by the von Bertalanffy growth function determined by size at age patterns from vertebral sections. Similarly, Natanson et al. (2002) determined growth rates for age 0 and 1 porbeagle sharks, Lamna nasus, by monitoring the progression of those two discrete length modes across months within a year.
14.4.2 Tag–recapture
In addition to size mode analysis, tag–recapture data are often used to produce growth curves. This usually involves capturing, measuring, weighing, and tagging specimens in the field and then releasing them. Through recaptures obtained from either dedicated surveys or recreational or commercial fishers, tagged specimens
provide information on growth (length or weight) over a distinct period of time. This has been done in many studies; for example, in the Pacific angel shark, Squatina californica, the von Bertalanffy growth functions are based on size at capture and recapture but not oxytetra-cycline (OTC) (Cailliet et al., 1992). A significant amount of literature exists on the procedures of estimating growth parameters from tag–recapture data (Cailliet et al., 1992; Gulland and Holt, 1959; Fabens, 1965). The method developed by Gulland and Holt (1959) is fairly straightforward; however, efforts should be made to use several methods, such as GROTAG (Francis, 1988; Natanson et al., 2002) when analyzing growth incre-ment data.
14.4.3 Marking, Field Tag–recapture, and laboratory Studies
Validation of absolute age is extremely difficult to achieve with elasmobranch fishes; hence, the (few) stud-ies that have attempted validation in these fishes have focused on validating the temporal periodicity of ring (growth increment) formation. The oxytetracycline vali-dation method is a standard among fisheries biologists for marking free-swimming individuals (Cailliet, 1990; Campana, 2001; DeVries and Frie, 1996; Smith et al., 2003) to test the assumption of annual periodicity of growth rings. OTC, a general antibiotic that can be purchased through veterinary catalogs, binds to calcium and is subsequently deposited at sites of active calcification. It is typically injected intramuscularly at a dose of 25 mg kg–1 body weight (Gelsleichter et al., 1998b; Tanaka, 1990), and an external identification tag is simultaneously attached to each injected animal. OTC produces highly visible marks in vertebral centra and dorsal fin spines of recaptured sharks when viewed under ultraviolet light (Beamish and McFarlane, 1985; Branstetter, 1987; Brown and Gruber, 1988; Gelsleichter et al., 1998b; Goldman, 2002; Goldman et al., 2006; Gruber and Stout, 1983; Holden and Vince, 1973; Kusher et al., 1992; McFarlane and Beamish, 1987a,b; Natanson, 1993; Natanson and Cailliet, 1990; Natanson et al., 2002; Simpfendorfer et al., 2002; Skomal and Natanson, 2003; Smith, 1984; Tanaka, 1990; Wintner and Cliff, 1999).
The combination of body growth information and a discrete mark in the calcified structure permits direct comparison of time at liberty with growth band depo-sition, such that the number of rings deposited in the vertebra or spine since the OTC injection can be counted and related to the time at liberty. Although there may be problems associated with using captive growth as a surrogate to growth in the wild and with recapturing animals that have been at large for a sufficiently long period of time, this method has been used on a num-ber of species in the laboratory and field (Cailliet, 1990;
© 2012 Taylor & Francis Group, LLC

437Assessing the Age and Growth of Chondrichthyan Fishes
Cailliet et al., 1986a; Goldman et al., 2006). The use of OTC in a laboratory setting was an instrumental compo-nent in showing that vertebral banding was not annual but related to somatic growth in Pacific angel sharks, Squatina californica (Natanson and Cailliet, 1990), and in showing that temperature had no effect on annual band deposition in mature little skates, Raja erinacea (Natanson, 1993).
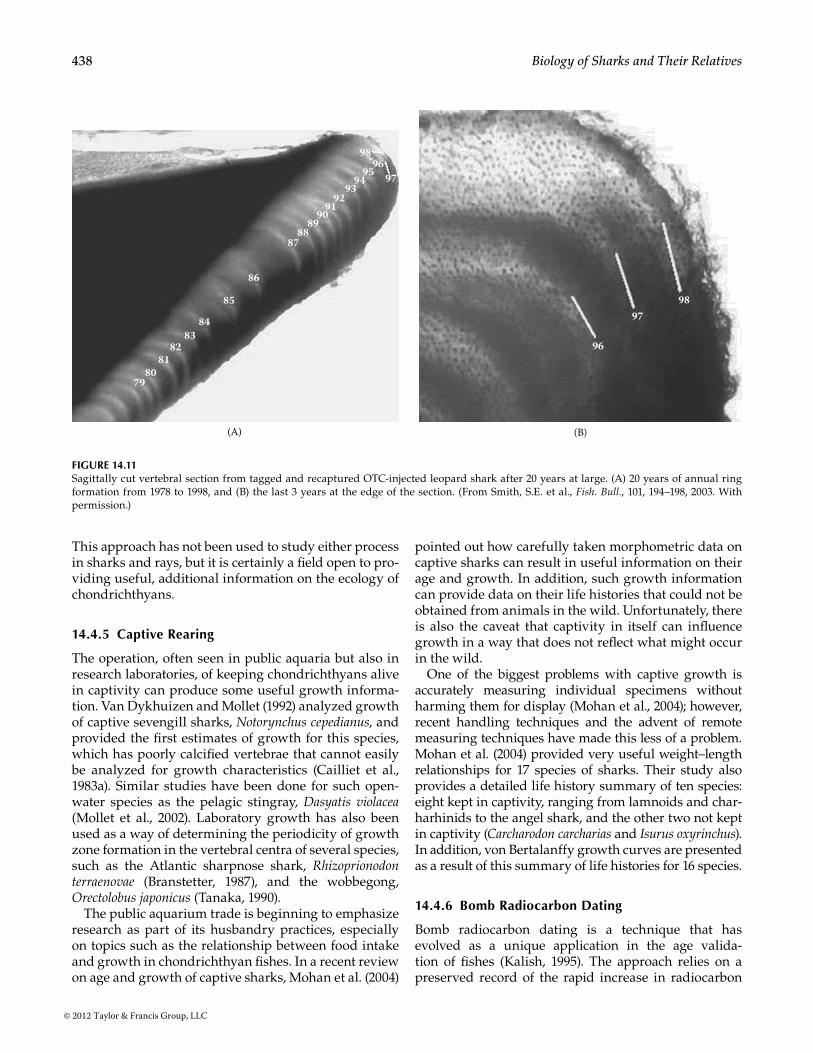
Nevertheless, this technique, when successful, has proved to be invaluable at validating growth charac-teristics of chondrichthyans. The best recent examples are tag–recaptures, some with OTC, of the blue shark, Prionace glauca, by Skomal and Natanson (2003) (Figure 14.10) and the 20-year tag return of a leopard shark, Triakis semifasciata, reported by Smith et al. (2003) (Figure 14.11). In both cases, it was possible to define birth years and to identify individual growth characteristics for individual years from zones on sections of the verte-brae, relative to the OTC mark from the original release.
Several other chemical markers such as fluorescein and calcein have been used to validate growth ring periodicity in teleost otoliths, but very few studies have evaluated these in elasmobranchs (Gelsleichter et al., 1997; Officer et al., 1997). Gelsleichter et al. (1997) found that doses of 25 mg kg–1 body weight (typical dose for teleosts) induced physiological stress and mortality in the nurse shark, Ginglymostoma cirratum, but doses of 5 to 10 mg kg–1 body weight produced suitable marks without causing physiological trauma or death. Based on this evaluation, any alternative chemical markers tested should consider that doses for teleosts might be too high for elasmobranchs. Calcein, however, has been successfully used in the field to validate ages in sand-bar sharks, Carcharhinus plumbeus, in Western Australia (McAuley et al., 2006).
14.4.4 Centrum edge and relative Marginal increment analysis
Centrum edge analysis compares the opacity and trans-lucency (width and density) of the centrum edge over time in many different individuals to discern seasonal changes in growth. The centrum edge is categorized as opaque or translucent, and the bandwidth is measured or graded, then compared to season or time of year (Kusher et al., 1992; Wintner and Dudley, 2000; Wintner et al., 2002). A more detailed centrum edge analysis can be conducted by analyzing the levels of calcium and phosphorus at the centrum edge using x-ray or elec-tron microprobe spectrometry (Cailliet and Radtke, 1987; Cailliet et al., 1986a). This technique has only been applied in a single study on recaptured nurse sharks that had been injected with tetracycline (Carrier and Radtke, 1988, as cited in Cailliet, 1990).
Relative marginal increment (RMI) analysis, some-times referred to as marginal increment ratio (MIR) analysis, is a useful, direct technique with which to assess seasonal band and ring deposition (Figure 14.12). The margin, or growth area of a centrum from the last growth ring to the centrum edge, is divided by the width of the last (previously) fully formed annulus (Branstetter and Musick, 1994; Conrath et al., 2002; Goldman, 2002; Natanson et al., 1995; Smith et al., 2007; Wintner et al., 2002). Resulting RMI values are then plotted against month of capture to determine temporal periodicity of band formation. Age 0 animals cannot be used in this analysis because they have no fully formed increments.
Recently, ecologists have employed stable isotope com-position to trace the early life histories of fishes, includ-ing analyses of habitats and environments occupied, as well as biochronologies (Campana and Thorrold, 2001).
OTC
B536Birth
BirthB116452
OTC
Figure 14.10Sagittally cut vertebral section from tagged and recaptured OTC-injected blue sharks. (From Skomal, G.B. and Natanson, L.J., Fish. Bull., 101, 627–639. 2003. With permission.)
© 2012 Taylor & Francis Group, LLC
438 Biology of Sharks and Their Relatives
This approach has not been used to study either process in sharks and rays, but it is certainly a field open to pro-viding useful, additional information on the ecology of chondrichthyans.
14.4.5 Captive rearing
The operation, often seen in public aquaria but also in research laboratories, of keeping chondrichthyans alive in captivity can produce some useful growth informa-tion. Van Dykhuizen and Mollet (1992) analyzed growth of captive sevengill sharks, Notorynchus cepedianus, and provided the first estimates of growth for this species, which has poorly calcified vertebrae that cannot easily be analyzed for growth characteristics (Cailliet et al., 1983a). Similar studies have been done for such open-water species as the pelagic stingray, Dasyatis violacea (Mollet et al., 2002). Laboratory growth has also been used as a way of determining the periodicity of growth zone formation in the vertebral centra of several species, such as the Atlantic sharpnose shark, Rhizoprionodon terraenovae (Branstetter, 1987), and the wobbegong, Orectolobus japonicus (Tanaka, 1990).
The public aquarium trade is beginning to emphasize research as part of its husbandry practices, especially on topics such as the relationship between food intake and growth in chondrichthyan fishes. In a recent review on age and growth of captive sharks, Mohan et al. (2004)
pointed out how carefully taken morphometric data on captive sharks can result in useful information on their age and growth. In addition, such growth information can provide data on their life histories that could not be obtained from animals in the wild. Unfortunately, there is also the caveat that captivity in itself can influence growth in a way that does not reflect what might occur in the wild.
One of the biggest problems with captive growth is accurately measuring individual specimens without harming them for display (Mohan et al., 2004); however, recent handling techniques and the advent of remote measuring techniques have made this less of a problem. Mohan et al. (2004) provided very useful weight–length relationships for 17 species of sharks. Their study also provides a detailed life history summary of ten species: eight kept in captivity, ranging from lamnoids and char-harhinids to the angel shark, and the other two not kept in captivity (Carcharodon carcharias and Isurus oxyrinchus). In addition, von Bertalanffy growth curves are presented as a result of this summary of life histories for 16 species.
14.4.6 bomb radiocarbon Dating
Bomb radiocarbon dating is a technique that has evolved as a unique application in the age valida-tion of fishes (Kalish, 1995). The approach relies on a preserved record of the rapid increase in radiocarbon
79
(A)
8081
8283
84
85
86
8788
8990
9192
9394
9596
97
98
96
9798
(B)
Figure 14.11Sagittally cut vertebral section from tagged and recaptured OTC-injected leopard shark after 20 years at large. (A) 20 years of annual ring formation from 1978 to 1998, and (B) the last 3 years at the edge of the section. (From Smith, S.E. et al., Fish. Bull., 101, 194–198, 2003. With permission.)
© 2012 Taylor & Francis Group, LLC
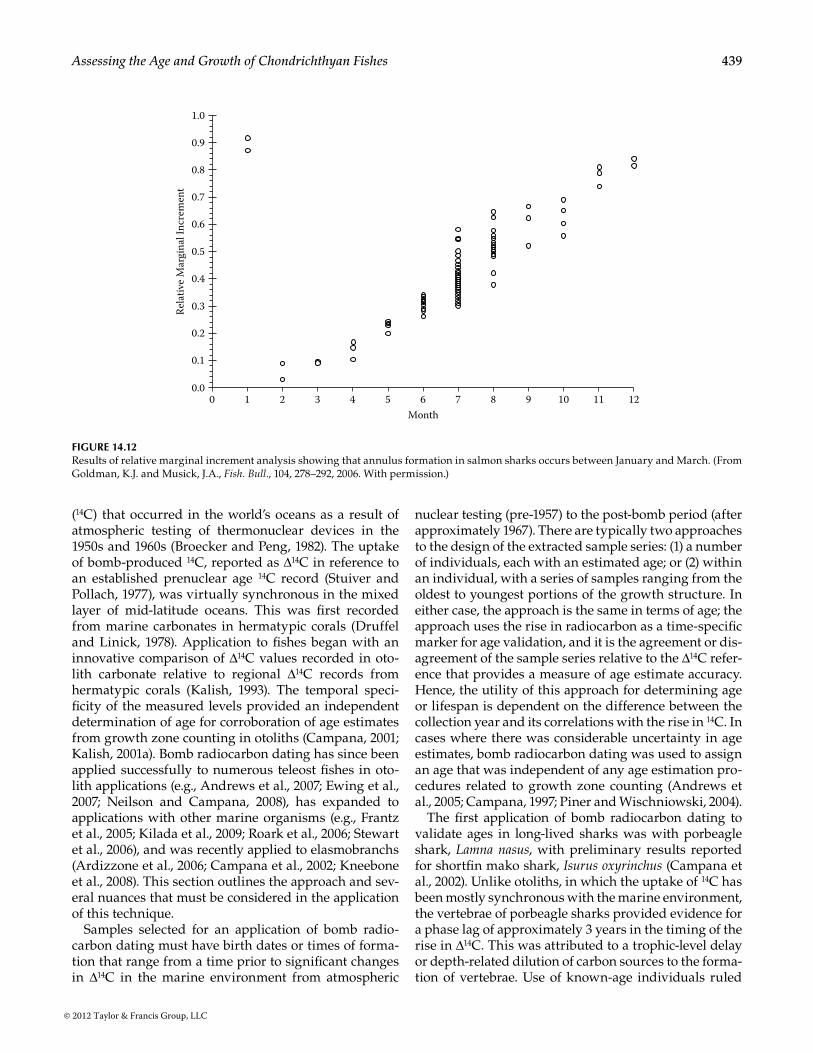
439Assessing the Age and Growth of Chondrichthyan Fishes
(14C) that occurred in the world’s oceans as a result of atmospheric testing of thermonuclear devices in the 1950s and 1960s (Broecker and Peng, 1982). The uptake of bomb-produced 14C, reported as Δ14C in reference to an established prenuclear age 14C record (Stuiver and Pollach, 1977), was virtually synchronous in the mixed layer of mid-latitude oceans. This was first recorded from marine carbonates in hermatypic corals (Druffel and Linick, 1978). Application to fishes began with an innovative comparison of Δ14C values recorded in oto-lith carbonate relative to regional Δ14C records from hermatypic corals (Kalish, 1993). The temporal speci-ficity of the measured levels provided an independent determination of age for corroboration of age estimates from growth zone counting in otoliths (Campana, 2001; Kalish, 2001a). Bomb radiocarbon dating has since been applied successfully to numerous teleost fishes in oto-lith applications (e.g., Andrews et al., 2007; Ewing et al., 2007; Neilson and Campana, 2008), has expanded to applications with other marine organisms (e.g., Frantz et al., 2005; Kilada et al., 2009; Roark et al., 2006; Stewart et al., 2006), and was recently applied to elasmobranchs (Ardizzone et al., 2006; Campana et al., 2002; Kneebone et al., 2008). This section outlines the approach and sev-eral nuances that must be considered in the application of this technique.
Samples selected for an application of bomb radio-carbon dating must have birth dates or times of forma-tion that range from a time prior to significant changes in Δ14C in the marine environment from atmospheric
nuclear testing (pre-1957) to the post-bomb period (after approximately 1967). There are typically two approaches to the design of the extracted sample series: (1) a number of individuals, each with an estimated age; or (2) within an individual, with a series of samples ranging from the oldest to youngest portions of the growth structure. In either case, the approach is the same in terms of age; the approach uses the rise in radiocarbon as a time-specific marker for age validation, and it is the agreement or dis-agreement of the sample series relative to the Δ14C refer-ence that provides a measure of age estimate accuracy. Hence, the utility of this approach for determining age or lifespan is dependent on the difference between the collection year and its correlations with the rise in 14C. In cases where there was considerable uncertainty in age estimates, bomb radiocarbon dating was used to assign an age that was independent of any age estimation pro-cedures related to growth zone counting (Andrews et al., 2005; Campana, 1997; Piner and Wischniowski, 2004).
The first application of bomb radiocarbon dating to validate ages in long-lived sharks was with porbeagle shark, Lamna nasus, with preliminary results reported for shortfin mako shark, Isurus oxyrinchus (Campana et al., 2002). Unlike otoliths, in which the uptake of 14C has been mostly synchronous with the marine environment, the vertebrae of porbeagle sharks provided evidence for a phase lag of approximately 3 years in the timing of the rise in Δ14C. This was attributed to a trophic-level delay or depth-related dilution of carbon sources to the forma-tion of vertebrae. Use of known-age individuals ruled
1.0
0.9
0.8
0.7
0.6
0.5
0.4
0.3
0.2
0.1
0.0
Rela
tive M
argi
nal I
ncre
men
t
0 1 2 3 4 5 6Month
7 8 9 10 11 12
Figure 14.12Results of relative marginal increment analysis showing that annulus formation in salmon sharks occurs between January and March. (From Goldman, K.J. and Musick, J.A., Fish. Bull., 104, 278–292, 2006. With permission.)
© 2012 Taylor & Francis Group, LLC

440 Biology of Sharks and Their Relatives
out other possible violations of the system requirements that would obfuscate the technique (e.g., reworking of vertebral carbon through the life of the fish); hence, age validation was achieved for porbeagle shark, and the reported preliminary results for shortfin mako shark were well supported. In a follow-up study to the mako shark work by Campana et al. (2002), age and growth were further described and validated using bomb radio-carbon dating (Ardizzone et al., 2006). The hypothesis of two growth bands per year through the life of mako shark was not supported by the reference bomb radio-carbon time series (Ardizzone et al., 2006; Pratt and Casey, 1983) (Figure 14.13). Age estimates approaching 30 years were consistent with the measured Δ14C values, as well as other age validation studies (Natanson et al., 2002).
A factor in bomb radiocarbon dating that was initially described by Campana et al. (2002) and has become an even greater consideration is the variability in uptake of 14C through time. Further study of the mako shark provided additional evidence that 14C-depleted sources of carbon were making their way into the diet of these sharks and ultimately being measured in the vertebrate (Ardizzone et al., 2006). This represents a potential com-plication for assigning ages because the time specific-ity of bomb radiocarbon dating becomes less certain. In general, age validation for sharks must be initially qual-ified with an unknown level of age estimate uncertainty
due to this factor; however, in most cases there is empiri-cal evidence to support the temporal correlation and to conclude that the age estimate uncertainty is a few years.
Perhaps the most evident case of how this complication can affect the results of bomb radiocarbon dating was with a study performed on white sharks, Carcharodon carcharias, from the eastern North Pacific Ocean (Kerr et al., 2006). In the study, age could not be validated because of highly variable Δ14C values for any given estimated year of formation (Figure 14.14). Initially, the approach was to consider the age estimation procedure as invalid and that age is actually greater because of the unexpect-edly attenuated values assigned to years of formation well after the rise in Δ14C. However, measurements from vertebral edge material (constrained in time by the col-lection date) and juvenile white sharks (age less in ques-tion) prevented what might have been a logical shift of those data to older ages. Hence, a phase lag was observed relative to a regional carbonate reference chronology of approximately 10 to 15 years—considerably greater than the 3-year phase lag observed by Campana et al. (2002) for porbeagle sharks in the North Atlantic Ocean. The cause of the phase-lagged Δ14C measurements was attrib-uted to some combination of dietary carbon sources (e.g., Tricas and McCosker, 1984), large-scale ontogenetic movement patterns on and off shore (e.g., Boustany et al., 2002), and precipitous Δ14C gradients with depth in the
180
150
120
90
60
30
0
–30
–60
–90
–120
–150
∆14C
(%)
1945 1955 1965 1975Year of Formation
1985 1995 2005
Shortfin mako (Campana et al. 2002)Shortfin mako (Ardizzone et al. 2006)Porbeagle sharkFlorida coralBermuda coral
Figure 14.13Radiocarbon data from two studies on shortfin mako shark revealing support for one band pair per year based on an alignment with the por-beagle shark Δ14C reference record. This plot provides both the underestimated age scenario (connected diamonds on right) from Campana et al. (2002) and the age-validated scenario supplemented with additional data points (connected circles and diamonds on left) from Ardizzone et al. (2006) for the same shark. Plotted as an upper limit for the rapid rise in Δ14C are two hermatypic coral records from the region (Druffel, 1989; Druffel and Linick, 1978).
© 2012 Taylor & Francis Group, LLC
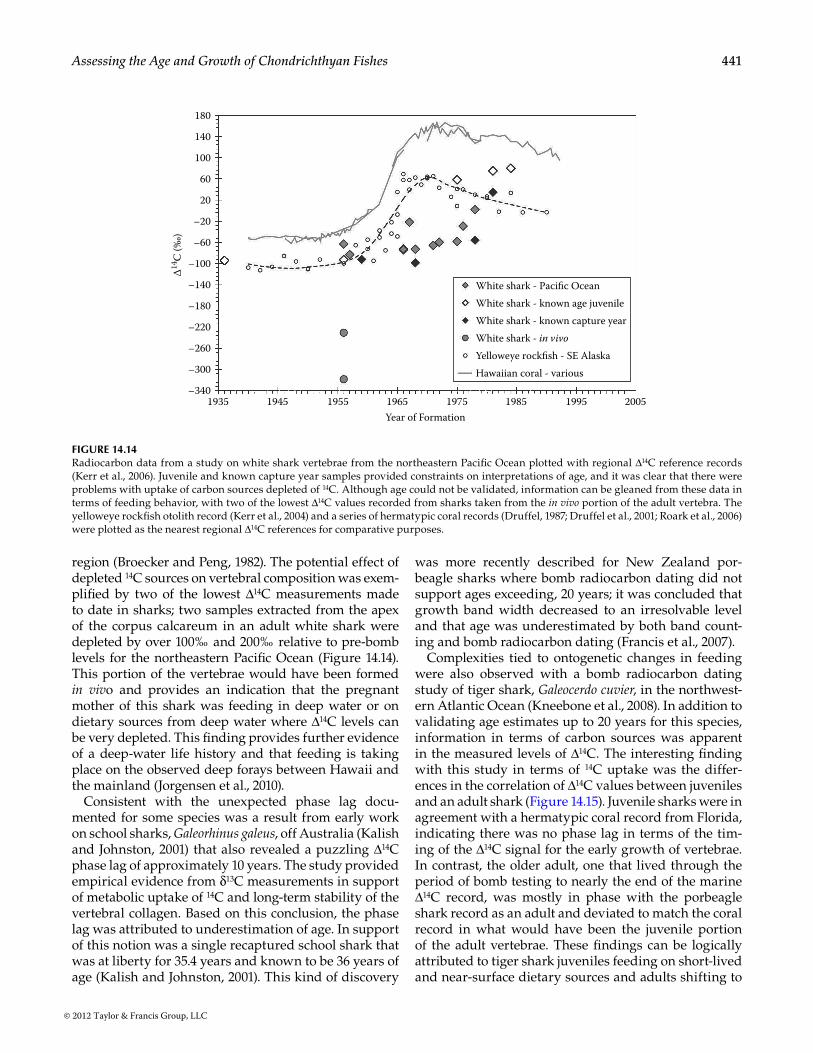
441Assessing the Age and Growth of Chondrichthyan Fishes
region (Broecker and Peng, 1982). The potential effect of depleted 14C sources on vertebral composition was exem-plified by two of the lowest Δ14C measurements made to date in sharks; two samples extracted from the apex of the corpus calcareum in an adult white shark were depleted by over 100‰ and 200‰ relative to pre-bomb levels for the northeastern Pacific Ocean (Figure 14.14). This portion of the vertebrae would have been formed in vivo and provides an indication that the pregnant mother of this shark was feeding in deep water or on dietary sources from deep water where Δ14C levels can be very depleted. This finding provides further evidence of a deep-water life history and that feeding is taking place on the observed deep forays between Hawaii and the mainland (Jorgensen et al., 2010).
Consistent with the unexpected phase lag docu-mented for some species was a result from early work on school sharks, Galeorhinus galeus, off Australia (Kalish and Johnston, 2001) that also revealed a puzzling Δ14C phase lag of approximately 10 years. The study provided empirical evidence from δ13C measurements in support of metabolic uptake of 14C and long-term stability of the vertebral collagen. Based on this conclusion, the phase lag was attributed to underestimation of age. In support of this notion was a single recaptured school shark that was at liberty for 35.4 years and known to be 36 years of age (Kalish and Johnston, 2001). This kind of discovery
was more recently described for New Zealand por-beagle sharks where bomb radiocarbon dating did not support ages exceeding, 20 years; it was concluded that growth band width decreased to an irresolvable level and that age was underestimated by both band count-ing and bomb radiocarbon dating (Francis et al., 2007).
Complexities tied to ontogenetic changes in feeding were also observed with a bomb radiocarbon dating study of tiger shark, Galeocerdo cuvier, in the northwest-ern Atlantic Ocean (Kneebone et al., 2008). In addition to validating age estimates up to 20 years for this species, information in terms of carbon sources was apparent in the measured levels of Δ14C. The interesting finding with this study in terms of 14C uptake was the differ-ences in the correlation of Δ14C values between juveniles and an adult shark (Figure 14.15). Juvenile sharks were in agreement with a hermatypic coral record from Florida, indicating there was no phase lag in terms of the tim-ing of the Δ14C signal for the early growth of vertebrae. In contrast, the older adult, one that lived through the period of bomb testing to nearly the end of the marine Δ14C record, was mostly in phase with the porbeagle shark record as an adult and deviated to match the coral record in what would have been the juvenile portion of the adult vertebrae. These findings can be logically attributed to tiger shark juveniles feeding on short-lived and near-surface dietary sources and adults shifting to
180
140
100
60
20
–20
–60
–100
–140
–180
–220
–260
–300
–3401935 1945 1955 1965
Year of Formation1975 1985 1995 2005
White shark - Pacific OceanWhite shark - known age juvenileWhite shark - known capture yearWhite shark - in vivoYelloweye rockfish - SE AlaskaHawaiian coral - various
∆14C
(%)
Figure 14.14Radiocarbon data from a study on white shark vertebrae from the northeastern Pacific Ocean plotted with regional Δ14C reference records (Kerr et al., 2006). Juvenile and known capture year samples provided constraints on interpretations of age, and it was clear that there were problems with uptake of carbon sources depleted of 14C. Although age could not be validated, information can be gleaned from these data in terms of feeding behavior, with two of the lowest Δ14C values recorded from sharks taken from the in vivo portion of the adult vertebra. The yelloweye rockfish otolith record (Kerr et al., 2004) and a series of hermatypic coral records (Druffel, 1987; Druffel et al., 2001; Roark et al., 2006) were plotted as the nearest regional Δ14C references for comparative purposes.
© 2012 Taylor & Francis Group, LLC

442 Biology of Sharks and Their Relatives
older dietary sources, represented as a phase lag that can be attributed to trophic level changes (Kneebone et al., 2008). A similar scenario was measured for great hammerheads, Sphyrna mokarran, where there was close agreement with a coral Δ14C record, yet some years of formation provided an indication there was an attenu-ation of the Δ14C signal (Passerotti et al., 2010). These studies highlight the necessity for understanding: (1) ontogenetic changes in feeding, and (2) the 14C content of dietary sources in an application of bomb radiocar-bon dating to sharks.
Bomb radiocarbon dating of elasmobranchs was also applied to the vertebrae of skates and dorsal fin spines of Atlantic and Pacific spiny dogfish: Squalus acanthias in the north Atlantic and Squalus suckleyi in the north Pacific (see Ebert et al., 2010). An application to three species of skate from off the eastern coast of Canada provided con-firmation of age, as well as some degree of age estimate calibration (McPhie and Campana, 2009). An offset of a measured value in the thorny skate, Amblyraja radiata, led to the conclusion of underestimated age. Based on knowl-edge of its depth distribution and trophic level, phase-lagged Δ14C and depleted 14C sources could not explain the apparent offset of approximately 5 years; hence, the porbeagle shark reference series was used to substanti-ate an increase in the growth-zone-counting age of 23 years to at least 28 years. In an innovative application
of bomb radiocarbon dating, age was validated for two populations of spiny dogfish (North Atlantic and North Pacific) using dorsal spine enamel (Campana et al., 2006). Growth bands from known-age fish corroborated most of the age determinations with an agreement, on aver-age, of estimated age with expected Δ14C levels. In this case, the expected Δ14C levels correlated well with car-bonate-based Δ14C references and no phase lag was mea-sured (Campana et al., 2006). Once again, the importance of understanding the depth distribution and feeding behavior of the species in question was an important fac-tor in securing the temporal specificity of the rise in Δ14C. Although there was some limitation to the degree of age validation because of a lack of known age spine mate-rial from the North Pacific for the pre-nuclear period, agreement was good relative to other regional carbon-ate records (Kerr et al., 2004; Piner and Wischniowski, 2004). The North Atlantic portion of the study provided a more comprehensive record, and age estimates were consistent with both carbonate and known age spine material. The study provided conclusive evidence that: (1) age estimation procedures were accurate, with per-haps a minor amount of imprecision; (2) spiny dogfish in the north Pacific Ocean (Squalus suckleyi) possess a slower growth rate and live longer than S. acanthias in the north Atlantic; and (3) longevity is confirmed to exceed 45 years in the northwestern Pacific Ocean (maximum
180
150
120
90
60
30
0
–30
–60
–90
–120
–1501945 1955 1965 1975
Year of Formation1985 1995 2005
∆14C
(%)
Tiger shark - juvenilesTiger shark - adult individualPorbeagle sharkFlorida coralBermuda coral
Figure 14.15Radiocarbon data from a study on tiger shark vertebrae from the northwestern Atlantic Ocean plotted with regional Δ14C reference records (Kneebone et al., 2008). Inference of these data is the importance of understanding ontogenetic changes in dietary sources of carbon and its affect on Δ14C stored in vertebrae through time. Juvenile tiger shark samples provided a record that was in synch with hermatypic coral Δ14C records, an indication of the most rapid rise in Δ14C for the region (Druffel, 1998; Druffel and Linick, 1978). In contrast, an adult tiger shark shifted away from food sources in synch with corals to a more depleted record, similar to the porbeagle shark Δ14C record (Campana et al., 2002).
© 2012 Taylor & Francis Group, LLC
443Assessing the Age and Growth of Chondrichthyan Fishes
estimated age was over 100 years, but bomb radiocarbon dating is limited to the difference in collection date and the mid-1950s).
Bomb radiocarbon dating is a proven and reliable technique in age validation of elasmobranchs, with an imperative admonition in terms of defining regional specificity and dietary carbon uptake. While it is appar-ent from numerous carbonate Δ14C records throughout the marine environment that the timing of the first rise in 14C is consistent in much of the world’s oceans, the mag-nitude of the rise and the manner in which the signal declines vary considerably (Druffel, 2002; Druffel and Linick, 1978). Proper age validation using Δ14C values from skeletal structures requires confidence in the com-parison of measured values with a reference series. The greatest confidence can be gained by having known age material from the species being studied that covers the period of nuclear testing (i.e., Campana et al., 2002; Piner and Wischniowski, 2004); however, this is often not pos-sible due to a lack of sample availability. The second best application is to resort to other regional records with the necessary assumptions on the uptake of 14C (Kalish, 1993). Bomb radiocarbon dating of elasmobranchs has added another facet to the technique with greater consideration for dietary carbon sources. It has been documented that bomb radiocarbon dating of otoliths from deep-sea or southern ocean fishes can be confounded by uptake of depleted 14C from the water column—for example, in the Patagonian toothfish, Dissostichus eleginoides (Kalish et al., 2001b), and orange roughy, Hoplostethus atlanticus (Andrews et al., 2009). However, the addition of meta-bolic pathways and a potential trophic-level phase lag makes elasmobranch age validation more complicated and potentially unsuccessful (Kerr et al., 2006). Despite the potential complications, proper application with full consideration for the factors described herein holds promise as a unique tool for determining and validating the age and growth of elasmobranchs.
14.5 Growth Models
A number of models and variations of models exist for estimating growth parameters in fishes, of which the von Bertalanffy and Gompertz growth models are the most commonly applied (for thorough reviews, see Haddon, 2001; Ricker, 1979; Summerfelt and Hall, 1987). The von Bertalanffy growth function (VBGF) is most often used to describe fish growth through ontogeny, and the Gompertz curve is often used to describe larval and early life growth of fishes and growth in many inver-tebrates (Ricker, 1979; Zweifel and Lasker, 1976). These functions, though, are flexible in application; weight can be used in place of length in the VBGF, and length may
be substituted for weight in the Gompertz model. Many statistical packages include modules (i.e., functions) that can be used to calculate the best-fitting growth parame-ters for the available length-at-age or weight-at-age data pairs. A nonlinear least-squares regression algorithm (e.g., “nls” in S-Plus) (Mathsoft, Inc., 2000), a maximum-likelihood function, or the PROC NLIN function in SAS (SAS Institute, Inc., 1999) can be used to fit the von Bertalanffy and Gompertz curves to the data, and pro-grams such as PC-YIELD (Punt and Hughes, 1989) can calculate a wide range of growth models for comparison (Wintner et al., 2002). Additionally, FISHPARM (Prager et al., 1987), a fishery-based statistics program, is simple to use and provides quality statistical results for the two models presented here. Both models can also be fit to data on a spreadsheet via a nonlinear regression using the “solver” function in Microsoft Excel.
The von Bertalanffy growth function has been widely used since its introduction into fisheries by Beverton and Holt (1957). Although the VBGF has received much criticism over the years (e.g., Roff, 1982), it is the most widely used growth function in fisheries biology today (Haddon, 2001). It maintains its attractiveness, in part, because its approach to modeling growth is based on the biological premise that the size of an organism at any moment depends on the resultant of two oppos-ing forces: anabolism and catabolism. Additionally, it is convenient to use and allows for much easier compari-son between populations, but several alternative forms of the model can be fit to the age–length data. Haddon (2001) presented a variety of growth models, including generalized models, as possible alternatives to VBGF.
Small sample size, particularly of the smallest or larg-est individual sizes (and hence age classes) can cause poor parameter estimates using the VBGF (Cailliet and Tanaka, 1990; Francis and Francis, 1992). In lieu of using t0 due to its lack of biological meaning, it is suggested that an estimate of length at birth (L0) is a more robust approach (Cailliet et al., 2006; Carlson et al., 2003; Goosen and Smale, 1997). This method was first introduced by Fabens (1965) as an alternative equation to the VBGF. Although only a few studies have used the equation published by Fabens (1965) to estimate growth parameters in elasmo-branchs, it has provided growth parameter estimates for some species that appear to be more realistic when the sample size was small (Goosen and Smale, 1997). Also, growth estimates were very similar to those obtained using VBGF when sample size was adequate (Carlson et al., 2003). This appears to be an excellent alternative to the von Bertalanffy model and should be applied where appropriate for comparison to other models.
From a mathematical point of view, it does not matter whether L0 or t0 is used as the third parameter; for math-ematical manipulations, it may even be advantageous to use t0 as the third parameter (Cailliet et al., 2006). From
© 2012 Taylor & Francis Group, LLC

444 Biology of Sharks and Their Relatives
a biological point of view, however, and in particular for elasmobranchs, the size at birth (L0) is often well defined and has biological meaning and significance, whereas t0 has no biological meaning. Holden (1974) originally proposed t0 to be an estimate of gestation time, which unreasonably implies that embryonic growth is gov-erned by the same growth parameters as postnatal or posthatch growth. The use of L0 as the third parameter allows an easy evaluation of the growth curve. If L0 is needed for comparison with published data, it can eas-ily be calculated from reported L∞, k, and t0 using the for-mula L0 = L∞[1 – exp(k × t0)]. This would indicate whether previously reported results were reasonable, because L0 is often the best-known parameter.
The Gompertz growth function is an S-shaped model function similar to the logistic function; for use of the logistic function and several alternatives to the Gompertz function, see Ricker (1975, 1979). The estimated instanta-neous growth rate in the Gompertz function is propor-tional to the difference between the logarithms of the asymptotic disk width or length and the actual disk width or length (Ricker, 1975, 1979). This growth function has been used most often for skates and stingrays (Mollet et al., 2002) and may be better suited to elasmobranchs that hatch from eggs, but it may also be the most appropriate model for some shark species (Wintner et al., 2002). This model may offer a better option when the volume of an organism greatly expands with age, such as myliobati-form rays, where considerable thickness is added to the animal over time but not so much disk width or length (Smith et al., 2007). The body mass may be distributed dif-ferently than would be readily detectable by length mea-surement and by the von Bertalanffy model. Additionally, captive growth rates (particularly when starting with young, small animals) may be better estimated by this function, as newly captured specimens may not grow in their typical fashion due to physiological stress or a reduc-tion in feeding that often accompanies that stress, which may cause growth rates to slow (Mollet et al., 2002).
14.6 Implication of Growth, Longevity, and Demography to Fisheries Management
As stated in the introduction, a better understanding of age and growth processes and associated life history and demographic vital rates will lead to better estimates of the potential for chondrichthyan populations to grow or remain stable, particularly in response to additional sources of mortality from fisheries, and to rebuild overexploited populations and stocks (Beamish et al., 2006; Cailliet and Andrews, 2008; Heppell et al., 2005; Longhurst, 2002; Restrepo et al., 1998; also see Chapter 15 of this volume). In particular, parameters such as age
at first reproduction and longevity of these organisms are necessary to foster effective management strategies. Organisms that have high intrinsic rates of population growth often also have early ages at first reproduction and low longevities, resulting in population turnover times that may be able to respond to fishing mortality better than populations with low intrinsic rates of popu-lation growth, late age at first reproduction, and high longevity. One of the largest remaining gaps in model-ing population and stock dynamics of elasmobranchs is a paucity of age and growth data, including intraspecific variation in growth rates. As new techniques continue to be employed and refined, the next several years should see a substantial increase in our understanding of age and growth processes and patterns in elasmobranchs.
The demographic consequences of these age and growth studies are, therefore, very important and have stimulated numerous authors to apply the results of these studies to their demographic analyses and stock assessments. This has been done with specific spe-cies, such as the leopard shark, Triakis semifasciata (Au and Smith, 1997), and the Atlantic sharpnose shark, Rhizoprionodon terraenovae (Cortés, 1994). It also has been done with different populations of the same species, such as the bonnethead shark, Sphyrna tiburo, by Cortés and Parsons (1996) and Carlson and Parsons (1997), and sandbar sharks, Carcharhinus plumbeus, before and after fishery depletion (Sminkey and Musick, 1995a,b). It also has been more broadly applied to many species of sharks using matrix and life-table demographic approaches (Cortés, 1997, 2000, 2002; Frisk et al., 2001; Goldman, 2002) and a related approach, called the intrinsic rebound potential, by Smith et al. (1998). This approach was also recently used for deep-sea chondrichthyans (Kyne and Simpfendorfer, 2007; Simpfendorfer and Kyne, 2009). Deep-sea fishes, especially chondrichthyans, appear to be quite susceptible to overfishing. Thus, solid esti-mates of their age, growth, longevity, and age-specific reproductive output are essential. Providing precise and accurate life-history parameters is essential to the ability of demographic and stock assessment models to accurately assess population status and provide for sus-tainable fisheries. Population dynamics, demography, and stock assessment are reviewed and elaborated on in detail in Chapter 15 of this book.
Acknowledgments
We thank all the authors who published papers in the past two decades for doing such a good job of starting to fill the gaps in knowledge about the life histories of chondrichthyan fishes. We thank Susan Smith, Jasmine Maurer, Bárbara Serra-Pereira, Katherine Yudin, Sho
© 2012 Taylor & Francis Group, LLC

445Assessing the Age and Growth of Chondrichthyan Fishes
Tanaka, Gregory Skomal, and their coauthors for let-ting us use the figures illustrating bomb radiocarbon dating, tag–recapture age validation, and histology/sec-tion comparison, and Gordon (Sandy) McFarlane, and Christina Conrath for other images. Finally, we thank Jack Musick and Michael Heithaus for their reviews and comments on the manuscript, and Chip Cotton and Sarah Irvine for their contribution to the section on spines as ageing tools. This is contribution PP-268 of the Commercial Fisheries Division of the Alaska Department of Fish and Game.
References
Aasen, O. (1963). Length and growth of the porbeagle (Lamna nasus Bonnaterre) in the North West Atlantic. Fiskeridir. Skr. Ser. Havunders. 13(6):20–37.
Ainsley, S.M. (2009). Age, Growth and Reproduction of the Bering Skate, Bathyraja interrupta (Gill and Townsend, 1897), from the eastern Bering Sea and Gulf of Alaska, master’s thesis, California State University, Monterey Bay.
Allen, B.R. and Wintner, S.P. (2002). Age and growth of the spinner shark Carcharhinus brevipinna (Muller and Henle, 1839) off the KwaZulu-Natal coast, South Africa. S. Afr. J. Mar. Sci. 24:1–8.
Andrews, A.H., Burton, E.J., Kerr, L.A., Cailliet, G.M., Coale, K.H., Lundstrom, C.C., and Brown, T.A. (2005). Bomb radiocarbon and lead–radium disequilibria in otoliths of bocaccio rockfish (Sebastes paucispinis): a determina-tion of age and longevity for a difficult-to-age fish. Mar. Freshw. Res. 56:517–528.
Andrews, A.H., Kerr, L.A., Cailliet, G.M., Brown, T.A., Lundstrom, C.C., and Stanley, R.D. (2007). Age valida-tion of canary rockfish (Sebastes pinniger) using two independent otolith techniques: lead–radium and bomb radiocarbon dating. Mar. Freshw. Res. 58:531–541.
Andrews, A.H., Tracey, D.M., and Dunn, M.R. (2009). Lead–radium dating of orange roughy (Hoplostethus altanticus): validation of a centenarian life span. Can. J. Fish. Aquat. Sci. 66:1130–1140.
Anislado-Tolentino, V. and Robinson-Mendoza, C. (2001). Age and growth for the scalloped hammerhead shark, Sphyrna lewini (Griffith and Smith, 1834), along the cen-tral Pacific coast of Mexico. Cien. Mar. 27:501–520.
Ardizzone, D.A., Cailliet, G.M., Natanson, L.J., Andrews, A.H., Kerr, L.A., and Brown, T.A. (2006). Application of bomb radiocarbon chronologies to shortfin mako (Isurus oxy-rinchus) age validation. In: Carlson, J.K. and Goldman, K.J. (Eds.), Age and Growth of Chondrichthyan Fishes: New Methods, Techniques and Analysis. Springer, Dordrecht, pp. 355–366.
Au, D.W. and Smith, S.E. (1997). A demographic method with population density compensation for estimating produc-tivity and yield per recruit of the leopard shark (Triakis semifasciata). Can. J. Fish. Aquat. Sci. 54:415–420.
Baum, J.K., Myers, R.A., Kehler, D.G., Worm, B., Harley, S.J., and Doherty, P.A. (2003). Collapse and conservation of shark populations in the northwest Atlantic. Science 299:389–392.
Beamish, R.J. and Fournier, D.A. (1981). A method for compar-ing the precision of a set of age determinations. Can. J. Fish. Aquat. Sci. 38:982–983.
Beamish, R.J. and McFarlane, G. (1983). The forgotten require-ment for validation in fisheries biology. Trans. Am. Fish. Soc. 112:735–743.
Beamish, R.J. and McFarlane, G. (1985). Annulus development on the second dorsal spines of the spiny dogfish (Squalus acanthias) and its validity for age determinations. Can. J. Fish. Aquat. Sci. 42:1799–1805.
Beamish, R.J., McFarlane, G.A., and Benson, A. (2006). Longevity overfishing. Prog. Oceanogr. 68:289–302.
Beverton, R.J.H. and Holt, S.J. (1957). On the Dynamics of Exploited Fish Populations, Fisheries Investigations Series II, Vol. 19. Ministry of Agriculture, Fisheries, and Food, London.
Bonfil, R. (1994). Overview of world elasmobranch fisheries. FOA Fish. Tech. Pap. 341:119.
Boustany, A.M., Davis, S.F., Pyle, P., Anderson, S.D., Le Boef, B.J., and Block, B.A. (2002). Satellite tagging: expanded niche for white sharks. Nature 415:35–36.
Bowker, A.H. (1948). A test for symmetry in contingency tables. J. Am. Stat. Assoc. 43:572–574.
Branstetter, S. (1987). Age and growth validation of new-born sharks held in laboratory aquaria, with comments on the life history of the Atlantic sharpnose shark, Rhizoprionodon terraenovae. Copeia 1987:291–300.
Branstetter, S. (1990). Early life-history implications of selected carcharhinoid and lamnoid sharks of the northwest Atlantic. In: Pratt, Jr., H.L., Gruber, S.H., and Taniuchi, T. (Eds.), Elasmobranchs as Living Resources: Advances in the Biology, Ecology, Systematics, and Status of the Fisheries, NOAA Tech. Rep. NMFS 90. U.S. Department of Commerce, Washington, D.C., pp. 17–28.
Branstetter, S. and Musick, J.A. (1994). Age and growth esti-mates for the sand tiger in the Northwestern Atlantic Ocean. Trans. Am. Fish. Soc. 123:242–254.
Broecker, W.S. and Peng, T.H. (1982). Tracers in the Sea. Lamont-Doherty Geological Observatory, Palisades, New York, 690 pp.
Brown, C.A. and Gruber, S.H. (1988). Age assessment of the lemon shark, Negaprion brevirostris, using tetracycline validated vertebral centra. Copeia 1988:747–753.
Cailliet, G.M. (1990). Elasmobranch age determination and verification: an updated review. In: Pratt, Jr., H.L., Gruber, S.H., and Taniuchi, T. (Eds.), Elasmobranchs as Living Resources: Advances in the Biology, Ecology, Systematics, and Status of the Fisheries, NOAA Tech. Rep. NMFS 90. U.S. Department of Commerce, Washington, D.C., pp. 157–165.
Cailliet, G.M. and Andrews, A.H. (2008). Age-validated lon-gevity of fishes: its importance for sustainable fisheries. In: Tsukamoto, K., Kawamura, T., Takeuchi, T., Beard, Jr., T.D., and Kaiser, M.J. (Eds.), Fisheries for Global Welfare and Environment: Memorial Book of the 5th World Fisheries Congress. TERRAPUB, Tokyo, Japan, pp. 103–120.
© 2012 Taylor & Francis Group, LLC
446 Biology of Sharks and Their Relatives
Cailliet, G.M. and Goldman, K.J. (2004). Age determination and validation in chondrichthyan fishes. In: Carrier, J., Musick, J.A., and Heithaus, M. (Eds.), Biology of Sharks and Their Relatives. CRC Press, Boca Raton, FL, pp. 399–447.
Cailliet, G.M. and Radtke, R.L. (1987). A progress report on the electron microprobe analysis technique for age determi-nation and verification in elasmobranchs. In: Summerfelt, R.C. and Hall, G.E. (Eds.), The Age and Growth of Fish, Iowa State University Press, Ames, pp. 359–369.
Cailliet, G.M. and Tanaka, S. (1990). Recommendations for research needed to better understand the age and growth of elasmobranchs. In: Pratt, Jr., H.L., Gruber, S.H., and Taniuchi, T. (Eds.), Elasmobranchs as Living Resources: Advances in the Biology, Ecology, Systematics, and Status of the Fisheries, NOAA Tech. Rep. NMFS 90. U.S. Department of Commerce, Washington, D.C., pp. 505–507.
Cailliet, G.M., Martin, L.K., Harvey, J.T., Kusher, D., and Welden, B.A. (1983a). Preliminary studies on the age and growth of blue (Prionace glauca), common thresher (Alopias vulpinus), and shortfin mako (Isurus oxyrinchus) sharks from California waters. In: Prince, E.D. and Pulos, L.M. (Eds.), Proceedings of the International Workshop on Age Determination of Oceanic Pelagic Fishes: Tunas, Billfishes, Sharks, NOAA Tech. Rep. NMFS 8. U.S. Department of Commerce, Washington, D.C., pp. 179–188.
Cailliet, G.M., Martin, L.K., Kusher, D., Wolf, P., and Welden, B.A. (1983b). Techniques for enhancing vertebral bands in age estimation of California elasmobranchs. In: Prince, E.D. and Pulos, L.M. (Eds.), Proceedings of the International Workshop on Age Determination of Oceanic Pelagic Fishes: Tunas, Billfishes, Sharks, NOAA Tech. Rep. NMFS 8. U.S. Department of Commerce, Washington, D.C., pp. 157–165.
Cailliet, G.M., Radtke, R.L., and Welden, B.A. (1986a). Elasmobranch age determination and verification: a review. In: Uyeno, T., Arai, R., Taniuchi, T., and Matsuura, K. (Eds.), Indo-Pacific Fish Biology: Proceedings of the Second International Conference on Indo-Pacific Fishes. Ichthyological Society of Japan, Tokyo, pp. 345–359.
Cailliet, G.M., Love, M.S., and Ebeling, A.W. (1986b). Fishes: A Field and Laboratory Manual on Their Structure, Identification, and Natural History. Wadsworth, Belmont, CA.
Cailliet, G.M., Mollet, H.F., Pittenger, G.G., Bedford, D., and Natanson, L.J. (1992). Growth and demography of the Pacific angel shark (Squatina californica), based on tag returns off California. Aust. J. Mar. Freshwater Res. 43:1313–1330.
Cailliet, G.M., Smith, W.D., Mollet, H.F., and Goldman, K.J. (2006). Chondrichthyan growth studies: an updated review, stressing terminology, sample size sufficiency, validation, and curve fitting. In: Carlson, J.K. and Goldman, K.J. (Eds.), Age and Growth of Chondrichthyan Fishes: New Methods, Techniques and Analysis. Springer, Dordrecht, pp. 211–228.
Calis, E., Jackson, E.H., Nolan, C.P., and Jeal, F. (2005). Preliminary age and growth estimates of the rabbitfish, Chimaera monstrosa, with implications for future resource management. J. Northw. Atl. Fish. Sci. 35:15–26.
Camhi, M. (1999). Sharks on the Line. II. An Analysis of Pacific State Shark Fisheries. National Audubon Society, Washington, D.C., 114 pp.
Campana, S.E. (1990). How reliable are growth back-cal-culations based on otoliths? Can. J. Fish. Aquat. Sci. 47:2219–2227.
Campana, S.E. (1997). Use of radiocarbon from nuclear fallout as a dated marker in the otoliths of haddock Melanogrammus aeglefinus. Mar. Ecol. Prog. Ser. 150:49–56.
Campana, S.E. (2001). Accuracy, precision and quality control in age determination, including a review of the use and abuse of age validation methods. J. Fish Biol. 59:197–242.
Campana, S.E. and Thorrold, S.R. (2001). Otoliths, increments, and elements: keys to a comprehensive understanding of fish populations? Can. J. Fish. Aquat. Sci. 58:30–38.
Campana, S.E., Annand, M.C., and McMillan, J.I. (1995). Graphical and statistical methods for determining the consistency of age determinations. Trans. Am. Fish. Soc. 124:131–138.
Campana, S.E., Natanson, L.J., and Myklevoll, S. (2002). Bomb dating and age determination of large pelagic sharks. Can. J. Fish. Aquat. Sci. 59:450–455.
Campana, S.E., Jones, C., McFarlane, G.A., and Myklevoll, S. (2006). Bomb dating and age validation using the spines of spiny dogfish (Squalus acanthias). In: Carlson, J.K. and Goldman, K.J. (Eds.), Age and Growth of Chondrichthyan Fishes: New Methods, Techniques and Analysis. Springer, Dordrecht, pp. 327–336.
Carlander, K.D. (1969). Handbook of Freshwater Fishery Biology, Vol. 1. Iowa University Press, Ames.
Carlson, J.K. and Parsons, G.R. (1997). Age and growth of the bonnethead shark, Sphyrna tiburo, from northwest Florida, with comments on clinal variation. Environ. Biol. Fish. 50:331–341.
Carlson, J.K., Cortés, E., and Bethea, D.M. (2003). Life his-tory and population dynamics of the finetooth shark (Carcharhinus isodon) in the northeastern Gulf of Mexico. Fish. Bull. 101:281–292.
Carrier, J.C. and Radtke, R. (1988). Preliminary evaluation of age and growth in juvenile nurse sharks (Ginglymostoma cirratum) using visual and electron microprobe assess-ment of tetracycline-labeled vertebral centra, unpub-lished paper available from author, Biology Department, Albion College, Albion, MI 49224.
Casey, J.G., Pratt, Jr., H.L., and Stillwell, C. (1985). Age and growth of the sandbar shark (Carcharhinus plumbeus) from the western North Atlantic. Can. J. Fish. Aquat. Sci. 42(5):963–975.
Casey, J.M. and Myers, R.A. (1998). Near extinction of a large, widely distributed fish. Science 281:690–692.
Casselman, J.M. (1983). Age and growth assessments of fish from their calcified structures & techniques and tools. In: Prince, E.D. and Pulos, L.M. (Eds.), Proceedings of the International Workshop on Age Determination of Oceanic Pelagic Fishes: Tunas, Billfishes, Sharks, NOAA Tech. Rep. NMFS 8. U.S. Department of Commerce, Washington, D.C., pp. 1–17.
Chang, W.Y.B. (1982). A statistical method for evaluating the reproducibility of age determination. Can. J. Fish. Aquat. Sci. 39:1208–1210.
© 2012 Taylor & Francis Group, LLC
447Assessing the Age and Growth of Chondrichthyan Fishes
Clarke, M.W. and Irvine, S.B. (2006). Terminology for the age-ing of chondrichthyan fish using dorsal-fin spines. In: Carlson, J.K. and Goldman, K.J. (Eds.), Age and Growth of Chondrichthyan Fishes: New Methods, Techniques and Analysis. Springer, Dordrecht, pp. 273–277.
Clarke, M.W., Connolly, P.L., and Bracken, J.J. (2002a). Catch, discarding, age estimation, growth and maturity of the squalid shark Deania calceus west and north of Ireland. Fish. Res. 56:139–153.
Clarke, M.W., Connolly, P.L., and Bracken, J.J. (2002b). Age estimation of the exploited deepwater shark Centrophorus squamosus from the continental slopes of the Rockall Trough and Porcupine Bank. J. Fish Biol. 60:501–514.
Conrath, C.L., Gelsleichter, J., and Musick, J.A. (2002). Age and growth of the smooth dogfish (Mustelus canis) in the northwest Atlantic. Fish. Bull. 100:674–682.
Cortés, E. (1994). Demographic analysis of the Atlantic sharpnose shark, Rhizoprionodon terraenovae, in the Gulf of Mexico. Fish. Bull. 93:57–66.
Cortés, E. (1997). Demographic analysis as an aid in shark stock assessment and management. Fish. Res. 39:199–208.
Cortés, E. (2000). Life history patterns and correlations in sharks. Rev. Fish. Sci. 8(4):299–344.
Cortés, E. (2002). Incorporating uncertainty into demographic modeling: application to shark populations. Conserv. Biol. 16(4):1048–1062.
Cortés, E. and Parsons, G.R. (1996). Comparative demography of two populations of the bonnethead shark (Sphyrna tiburo). Can. J. Fish. Aquat. Sci. 53:709–718.
Cotton, C. (2010). Age, Growth, and Reproductive Biology of Deep-Water Chondrichthyans, doctoral dissertation, College of William and Mary, Virginia Institute of Marine Science, Williamsburg.
Daiber, F.C. (1960). A technique for age determination in the skate Raja eglantaria. Copeia 1960:258–260.
Davis, C.D., Cailliet, G.M., and Ebert, D.A. (2007). Age and growth of the roughtail skate, Bathyraja trachura (Gilbert, 1892). Environ. Biol. Fish. 80(2–3):325–336.
DeVries, D.R. and Frie, R.V. (1996). Determination of age and growth. In: Murphy, B.R. and Willis, D.W. (Eds.), Fisheries Techniques, 2nd ed. American Fisheries Society, Bethesda, MD, pp. 483–512.
Druffel, E.R.M. (1987). Bomb radiocarbon in the Pacific: annual and seasonal timescale variations. J. Mar. Res. 45:667–698.
Druffel, E.R.M. (1989). Decadal time scale variability of ven-tilation in the North Atlantic: high-precision measure-ments of bomb radiocarbon in banded corals. J. Geophys. Res. 94:3271–3285.
Druffel, E.R.M. (2002). Radiocarbon in corals: records of the car-bon cycle, surface circulation and climate. Oceanography 15:122–127.
Druffel, E.R.M. and Linick, T.W. (1978). Radiocarbon in annual coral rings of Florida. Geophys. Res. Lett. 5:913–916.
Druffel, E.R.M., Griffin, S., and Guilderson, T.P. (2001). Changes of subtropical north Pacific radiocarbon and correlation with climate variability. Radiocarbon 43(1):15–25.
Ebert, D., White, W.T., Goldman, K.J., Compagno, L.J.V., Daly-Engel, T.S., and Ward, R.D. (2010). Resurrection and redescription of Squalus suckleyi (Girard, 1854) from the North Pacific, with comments on the Squalus acanthias subgroup (Squaliformes: Squalidae). Zootaxa 2612:22–40.
Evans, G.T. and Hoenig, J.M. (1998). Testing and viewing sym-metry in contingency tables, with application to readers of fish ages. Biometrics 54:620–629.
Ewing, G.P., Lyle, J.M., Murphy, R.J., Kalish, J.M., and Ziegler, P.E. (2007). Validation of age and growth in a long-lived temperate reef fish using otolith structure, oxytetracy-cline and bomb radiocarbon methods. Mar. Freshw. Res. 58:944–955.
Fabens, A.J. (1965). Properties and fitting of the von Bertalanffy growth curve. Growth 29:265–289.
Francis, M.P. and Francis, R.I.C.C. (1992). Growth rate esti-mates for New Zealand rig (Mustelus lenticulatus). Aust. J. Mar. Freshw. Res. 43:1157–1176.
Francis, M.P., Campana, S.E., and Jones, C.M. (2007). Age under-estimation in New Zealand porbeagle sharks (Lamna nasus): is there an upper limit to ages that can be deter-mined from shark vertebrae? Mar. Freshw. Res. 58:10–23.
Francis, R.I.C.C. (1988). Maximum likelihood estimation of growth and growth variability from tagging data. N.Z. J. Mar. Freshw. Res. 22:43–51.
Francis, R.I.C.C. (1990). Back-calculation of fish length: a criti-cal review. J. Fish Biol. 36:883–902.
Frantz, B.R., Foster, M.S., and Riosmensa-Rodriguez, R. (2005). Clathromorphum nereostratum (Corralinales, Rhodophyta): the oldest alga? J. Phycol. 41:770–773.
Freer, D.W.L. and Griffiths, C.L. (1993). Estimation of age and growth in the St. Joseph Callorhinchus capensis (Dumeril). S. Afr. J. Mar. Sci. 13:75–82.
Frisk, M.G., Miller, T.J., and Fogarty, M.J. (2001). Estimation and analysis of biological parameters in elasmobranch fishes: a comparative life history study. Can. J. Fish. Aquat. Sci. 58:969–981.
Gallagher, M. and Nolan, C.P. (1999). A novel method for the estimation of age and growth in rajids using caudal thorns. Can. J. Fish. Aquat. Sci. 56:1590–1599.
Gallagher, M.J., Nolan, C.P., and Jeal, F. (2005a). Age, growth and maturity of the commercial ray species from the Irish Sea. J. Northw. Atl. Fish. Sci. 35:47–66.
Gallagher, M.J., Nolan, C.P., and Jeal, F. (2005b). The structure and growth processes of caudal thorns. J. Northw. Atl. Fish. Sci. 35:125–129.
Gallagher, M.J., Green, M.J., and Nolan, C.P. (2006). The poten-tial use of caudal thorns as a non-invasive ageing struc-ture in the thorny skate (Amblyraja radiata Donovan, 1808). In: Carlson, J.K. and Goldman, K.J. (Eds.), Age and Growth of Chondrichthyan Fishes: New Methods, Techniques and Analysis. Springer, Dordrecht, pp. 265–272.
Gelsleichter, J., Musick, J.A., and Van Veld, P. (1995). Proteoglycans from vertebral cartilage of the clearnose skate, Raja eglentaria: inhibition of hydroxyapetite forma-tion. Fish. Physiol. Biochem. 14:247–251.
Gelsleichter, J., Cortés, E., Manire, C.A., Hueter, R.E., and Musick, J.A. (1997). Use of calcein as a fluorescent marker for elasmobranch vertebral cartilage. Trans. Am. Fish. Soc. 126:862–865.
© 2012 Taylor & Francis Group, LLC
448 Biology of Sharks and Their Relatives
Gelsleichter, J., Cortés, E., Manire, C.A., Hueter, R.E., and Musick, J.A. (1998a). Evaluation of toxicity of oxytetracy-cline on growth of captive nurse sharks, Ginglymostoma cirratum. Fish. Bull. 96:624–627.
Gelsleichter, J., Piercy, A., and Musick, J.A. (1998b). Evaluation of copper, iron, and lead substitution techniques in elas-mobranch age determination. J. Fish Biol. 53:465–470.
Goldman, K.J. (2002). Aspects of Age, Growth, Demographics and Thermal Biology of Two Lamniform Shark Species, doctoral dissertation, College of William and Mary, School of Marine Science, Virginia Institute of Marine Science, Williamsburg, 220 pp.
Goldman, K.J. (2005). Age and growth of elasmobranch fishes. In: Musick, J.A. and Bonfil, R. (Eds.), Management Techniques for Elasmobranch Fisheries, FAO Fisheries Tech. Paper 474. Food and Agriculture Organization, Rome, pp. 97–132.
Goldman, K.J. and Musick, J.A. (2006). Growth and maturity of salmon sharks in the eastern and western North Pacific, and comments on back-calculation methods. Fish. Bull. 104:278–292.
Goldman, K.J., Branstetter, S., and Musick, J.A. (2006). A re-examination of the age and growth of sand tiger sharks, Carcharias taurus, in the western North Atlantic. In: Carlson, J.K. and Goldman, K.J. (Eds.), Age and Growth of Chondrichthyan Fishes: New Methods, Techniques and Analysis. Springer, Dordrecht, pp. 241–252.
Goosen, A.J.J. and Smale, M.J. (1997). A preliminary study of age and growth of the smoothhound shark Mustelus mustelus (Triakidae). S. Afr. J. Mar. Sci. 18:85–92.
Gruber, S.H. and Stout, R.G. (1983). Biological materials for the study of age and growth in a tropical marine elas-mobranch, the lemon shark, Negaprion brevirostris (Poey). In: Prince, E.D. and Pulos, L.M. (Eds.), Proceedings of the International Workshop on Age Determination of Oceanic Pelagic Fishes: Tunas, Billfishes, Sharks, NOAA Tech. Rep. NMFS 8. U.S. Department of Commerce, Washington, D.C., pp. 193–205.
Gulland, J.A. and Holt, S.J. (1959). Estimation of growth parameters for data at unequal time intervals. J. Cons. Int. Explor. Mer 25:47–49.
Haddon, M. (2001). Modelling and Quantitative Measures in Fisheries. Chapman & Hall/CRC Press, Boca Raton, FL, pp. 197–246.
Heppell, S.S., Heppell, S.A., Read, A.J., and Crowder, L.B. (2005). Effects of fishing on long-lived marine organ-isms. In: Norse, E.A. and Crowder, L.B. (Eds.), Marine Conservation Biology: The Science of Maintaining the Sea’s Biodiversity. Marine Conservation Biology Institute, Island Press, Washington, D.C., pp. 211–231.
Hoenig, J.M. and Brown, C.A. (1988). A simple technique for staining growth bands in elasmobranch vertebrae. Bull. Mar. Sci. 42(2):334–337.
Hoenig, J.M. and Gruber, S.H. (1990). Life-history patterns in elasmobranchs: implications for fisheries management. In: Pratt, Jr., H.L., Gruber, S.H., and Taniuchi, T. (Eds.), Elasmobranchs as Living Resources: Advances in the Biology, Ecology, Systematics, and Status of the Fisheries, NOAA Tech. Rep. NMFS 90. U.S. Department of Commerce, Washington, D.C., pp. 1–16.
Hoenig, J.M., Morgan, M.J., and Brown, C.A. (1995). Analyzing differences between two age determination methods by tests of symmetry. Can. J. Fish. Aquat. Sci. 52:364–368.
Hoff, T.B. and Musick, J.A. (1990). Western North Atlantic shark-fishery management problems and infor-mational requirements. In: Pratt, Jr., H.L., Gruber, S.H., and Taniuchi, T. (Eds.), Elasmobranchs as Living Resources: Advances in the Biology, Ecology, Systematics, and Status of the Fisheries, NOAA Tech. Rep. NMFS 90. U.S. Department of Commerce, Washington, D.C., pp. 455–472.
Holden, M.J. (1974). Problems in the rational exploitation of elasmobranch populations and some suggested solu-tions. In: Jones, F.R. (Ed.), Sea Fisheries Research. Halstead Press/John Wiley & Sons, New York, pp. 117–138.
Holden, M.J. and Vince, M.R. (1973). Age validation studies on the centra of Raja clavata using tetracycline. J. Cons. Int. Explor. Mer. 35:13–17.
Ishiyama, R. (1951). Studies on the rays and skates belong-ing to the family Rajidae, found in Japan and adjacent regions. 2. On the age determination of Japanese black-skate Raja fusca Garman (preliminary report). Bull. Jpn. Soc. Sci. Fish. 16(12):112–118.
Irvine, S.B., Stevens, J.D., and Laurenson, L.J.B. (2006a). Surface bands on deepwater squalid dorsal-fin spines: an alter-native method for ageing Centroselachus crepidater. Can. J. Fish. Aquat. Sci. 63:617–627.
Irvine, S.B., Stevens, J.D., and Laurenson, L.J.B. (2006b). Comparing external and internal dorsal-spine bands to interpret the age and growth of the giant lantern shark, Etmopterus baxteri (Squaliformes: Etmopteridae). In: Carlson, J.K. and Goldman, K.J. (Eds.), Age and Growth of Chondrichthyan Fishes: New Methods, Techniques and Analysis. Springer, Dordrecht, pp. 253–264.
Johnson, A.G. (1979). A simple method for staining the centra of teleosts vertebrae. Northeast. Gulf Sci. 3:113–115.
Jones, B.C. and Green, G.H. (1977). Age determination of an elasmobranch (Squalus acanthias) by x-ray spectrometry. J. Fish. Res. Bd. Can. 34:44–48.
Jorgensen, S.J., Reeb, C.A., Chapple, T.K., Anderson, S., Perle, C. et al. (2010). Philopatry and migration of Pacific white sharks. Proc. R. Soc. B Biol. Sci. 277:679–688.
Kalish, J.M. (1993). Pre and post bomb radiocarbon in fish oto-liths. Earth Planet. Sci. Lett. 114:549–554.
Kalish, J.M. (1995). Radiocarbon and fish biology. In: Secor, D.H., Dean, J.M., and Campana, S.E. (Eds.), Recent Developments in Fish Otolith Research. University of South Carolina Press, Columbia, pp. 637–653.
Kalish, J.M. and Johnston, J. (2001). Determination of school shark age based on analysis of radiocarbon in verte-bral collagen. In: Kalish, J.M. (Ed.), Use of the Bomb Radiocarbon Chronometer to Validate Fish Age: Final Report, FDRC Project 93/109. Fisheries Research and Development Corporation, Canberra, Australia, pp. 116–122.
Kalish, J.M., Nydal, R., Nedreaas, K.H., Burr, G.S., and Eine, G.L. (2001a). A time history of pre- and post-bomb radio-carbon in the Barents Sea derived from Arcto-Norwegian cod otoliths. Radiocarbon 43:843–855.
© 2012 Taylor & Francis Group, LLC
449Assessing the Age and Growth of Chondrichthyan Fishes
Kalish, J.M., Timmiss, T., Pritchard, J., Johnstone, J., and Dunhamel, G. (2001b). Validation and direct estimation of age and growth of Patagonian toothfish Dissostichus eleginoides based on otoliths. In: Kalish, J.M. (Ed.), Use of the Bomb Radiocarbon Chronometer to Validate Fish Age: Final Report, FDRC Project 93/109. Fisheries Research and Development Corporation, Canberra, Australia, pp. 164–182.
Kerr, L.A., Andrews, A.H., Frantz, B.R., Coale, K.H., Brown T.A., and Cailliet, G.M. (2004). Radiocarbon in otoliths of yelloweye rockfish (Sebastes ruberrimus): a reference time series for the coastal waters of southeast Alaska. Can. J. Fish. Aquat. Sci. 61:443–451.
Kerr, L.A., Andrews, A.H., Cailliet, G.M., Brown, T.A., and Coale, K.H. (2006). Investigations of Δ14C, δ15N, and δ13C in vertebrae of white shark (Carcharodon carcharias) from the eastern Pacific Ocean. In: Carlson, J.K. and Goldman, K.J. (Eds.), Age and Growth of Chondrichthyan Fishes: New Methods, Techniques and Analysis. Springer, Dordrecht, pp. 337–353.
Ketchen, K.S. (1975). Age and growth of dogfish (Squalus acan-thias) in British Columbia waters. J. Fish. Res. Bd. Can. 32:13–59.
Kilada, R., Campana, S.E., and Roddick, D. (2009). Validated age, growth and mortality estimates of the ocean quahog (Arctica islandica) in the western Atlantic. ICES J. Mar. Sci. 64:31–38.
Kneebone, J., Natanson, L.J., Andrews, A.H., and Howell, H. (2008). Using bomb radiocarbon analyses to validate age and growth estimates for the tiger shark, Galeocerdo cuvier, in the western North Atlantic. Mar. Biol. 154:423–434.
Kusher, D.I., Smith, S.E., and Cailliet, G.M. (1992). Validated age and growth of the leopard shark, Triakis semifasciata, from central California. Environ. Biol. Fish. 35:187–203.
Kyne, P.M. and Simpfendorfer, C.A. (2007). A Collation and Summarization of Available Data on Deepwater Chondrichthyans: Biodiversity, Life History and Fisheries, prepared by the IUCN Shark Specialist Group for the Marine Conservation Biology Institute, Bellevue, WA (http://www.flmnh.ufl.edu/fish/organizations/ssg/deepchondreport.pdf).
LaMarca, M.J. (1966). A simple technique for demonstrating calcified annuli in the vertebrae of large elasmobranchs. Copeia 1966:351–352.
Longhurst, A. (2002). Murphy’s law revisited: longevity as a factor in recruitment to fish populations. Fish. Res. 56:125–131.
Martin, L.K. and Cailliet, G.M. (1988). Age and growth of the bat ray, Myliobatis californica, off central California. Copeia 1988:762–773.
Mathsoft, Inc. (2000). S-Plus 2000 Professional Release 1. Mathsoft, Seattle, WA.
Matta, M.E. and Gunderson, D.R. (2007). Age, growth, matu-rity, and mortality of the Alaska skate, Bathyraja par-mifera, in the eastern Bering Sea, Environ. Biol. Fish. 80(2–3):309–323.
Maurer, J.R. (2009). Life History of Two Bering Sea Slop Skates: Bathyraja lindbergi and B. maculata, master’s thesis, Moss Landing Marine Laboratories and California State University, Monterey Bay.
McAuley, R.B., Simpfendorfer, C.A., Hyndes, G.A., Allison, R.R., Chidlow, J.A., Newman, S.J., and Lenanton, R.C.J. (2006). Validated age and growth of the sandbar shark, Carcharhinus plumbeus (Nardo 1827) in the waters off Western Australia. In: Carlson, J.K. and Goldman, K.J. (Eds.), Age and Growth of Chondrichthyan Fishes: New Methods, Techniques and Analysis. Springer, Dordrecht, pp. 385-400.
McFarlane, G.A. and Beamish, R.J. (1987a). Validation of the dorsal spine method of age determination for spiny dog-fish. In: Summerfelt, R.C. and Hall, G.E. (Eds.), The Age and Growth of Fish, Iowa State University Press, Ames, pp. 287–300.
McFarlane, G.A. and Beamish, R.J. (1987b). Selection of dos-ages of oxytetracycline for age validation studies. Can. J. Fish. Aquat. Sci. 44:905–909.
McFarlane, G.A., King, J.R., and Saunders, M.W. (2002). Preliminary study on the use of neural arches in the age determination of bluntnose sixgill sharks (Hexanchus gri-seus). Fish. Bull. 100:861–864.
McNemar, Q. (1947). Note on the sampling error of the dif-ference between correlated proportions or percentages. Psychometrika 12:153–157.
McPhie, R.P. and Campana, S.E. (2009). Bomb dating and age determination of skates (family Rajidae) off the eastern coast of Canada. ICES J. Mar. Sci. 66:546–560.
Mohan, P.J., Clar, S.T., and Schmid, T.H. (2004). Age and growth of captive sharks. In: Smith, M., Warmolts, D., Thoney, D., and Hueter, R. (Eds.), Elasmobranch Husbandry Manual: Captive Care of Sharks, Rays and Their Relatives. Ohio Biological Survey, Columbus, OH, pp. 201–226.
Mollet, H.F., Ezcurra, J.M., and O’Sullivan, J.B. (2002). Captive biology of the pelagic stingray, Dasyatis violacea (Bonaparte, 1830). Mar. Freshw. Res. 53:531–541.
Moura, T., Figueiredo, I., Farias, I., Serra-Pereira, B., Coelho, R., Erzini, K., Neves, A., and Serrano Gordo, L. (2007). The use of caudal thorns for ageing Raja undulata from the Portuguese continental shelf, with comments on its reproductive cycle. Mar. Freshw. Res. 58:983–992.
Musick, J.A. (1999). Ecology and conservation of long-lived marine animals. In: Musick, J.A. (Ed.), Life in the Slow Lane: Ecology and Conservation of Long-Lived Marine Animals. American Fisheries Society, Bethesda, MD, pp. 1–10.
Nagasawa, K. (1998). Predation by salmon sharks (Lamna dit-ropis) on Pacific salmon (Oncorhynchus spp.) in the North Pacific Ocean. Bull. N. Pac. Anadromous Fish Comm. 1: 419–433.
Nakano, H. (1994). Age, reproduction and migration of blue shark in the North Pacific Ocean. Bull. Nat. Res. Inst. Far Seas Fish. 31:141–256.
Nammack, M.F., Musick, J.A., and Colvocoresses, J.A. (1985). Life history of spiny dogfish off the northeastern United States. Trans. Am. Fish. Soc. 114:367–376.
Natanson, L.J. (1993). Effect of temperature on band deposi-tion in the little skate, Raja erinacea. Copeia 1993:199–206.
Natanson, L.J. and Cailliet, G.M. (1990). Vertebral growth zone deposition in Pacific angel sharks. Copeia 1990:1133–1145.
© 2012 Taylor & Francis Group, LLC

450 Biology of Sharks and Their Relatives
Natanson, L.J. and Kohler, N.E. (1996). A preliminary estimate of age and growth of the dusky shark Carcharhinus obscu-rus from the south-west Indian Ocean, with comparisons to the western North Atlantic population. S. Afr. J. Mar. Sci. 17:217–224.
Natanson, L.J., Casey, J.G., and Kohler, N.E. (1995). Age and growth estimates for the dusky sharks, Carcharhinus obscurus, in the western North Atlantic Ocean. Fish. Bull. 93:116–126.
Natanson, L.J., Mello, J.J., and Campana, S.E. (2002). Validated age and growth of the porbeagle shark (Lamna nasus) in the western North Atlantic Ocean. Fish. Bull. 100:266–278.
Natanson, L.J., Kohler, N.E., Ardizzone, D., Cailliet, G.M., Wintner, S.P., and Mollet, H.F. (2006). Validated age and growth estimates for the shortfin mako, Isurus oxyrin-chus, in the North Atlantic Ocean. In: Carlson, J.K. and Goldman, K.J. (Eds.), Age and Growth of Chondrichthyan Fishes: New Methods, Techniques and Analysis. Springer, Dordrecht, pp. 367–383.
Natanson, L.J., Sulikowski, J.A., Kneebone, J.R., and Tsang, P.C. (2007). Age and growth estimates for the smooth skate, Malacoraja senta, in the Gulf of Maine. Environ. Biol. Fish. 80:293–308.
Natanson, L.J., Wintner, S.P., Johansson, F., Piercy, A., Campbell, P. et al. (2008). Ontogenetic vertebral growth patterns in the basking shark Cetorhinus maximus. Mar. Ecol. Prog. Ser. 361:267–278.
Neer, J.A. and Cailliet, G.M. (2001). Aspects of the life his-tory of the Pacific electric ray, Torpedo californica (Ayers). Copeia 2001:842–847.
Neilson, J.D. and Campana, S.E. (2008). A validated descrip-tion of age and growth of western Atlantic bluefin tuna (Thunnis thynnus). Can. J. Fish. Aquat. Sci. 65:1523–1527.
Officer, R.A., Gason, A.S., Walker, T.I., and Clement, J.G. (1996). Sources of variation in counts of growth increments in vertebrae from gummy shark, Mustelus antarcticus, and school shark, Galeorhinus galeus: implications for age determination. Can. J. Fish. Aquat. Sci. 53:1765–1777.
Officer, R.A., Day, R.W., Clement, J.G., and Brown, L.P. (1997). Captive gummy sharks, Mustelus antarcticus, for hypermineralized bands in their vertebrae during win-ter. Can. J. Fish. Aquat. Sci. 54:2677–2683.
Parsons, G.R. (1983). An examination of the vertebral rings of the Atlantic sharpnose shark, Rhizopriodon terraenovae. Northeast. Gulf Sci. 6:63–66.
Parsons, G.R. (1993). Age determination and growth of the bonnethead shark Sphyrna tiburo: a comparison of two populations. Mar. Biol. 117:23–31.
Passerotti, M.S., Carlson, J.K., Piercy, A.N., and Campana, S.E. (2010). Age validation of great hammerhead shark (Sphyrna mokarran), determined by bomb radiocarbon analysis. Fish. Bull. 108:346–351.
Peignoux-Deville, J., Lallier, F., and Vidal, B. (1982). Evidence for the presence of osseous tissue in dogfish vertebrae. Cell Tissue Res. 222:605–614.
Perez, C.R., Cailliet, G.M., and Ebert, D.A. (2011). Age and growth of the sandpaper skate, Bathyraja kincaidii, using vertebral centra, with an investigation of caudal thorns. J. Mar. Biol. Assoc. U.K. 91(6):1149–1156.
Piner, K.R. and Wischniowski, S.G. (2004). Pacific halibut chronology of bomb radiocarbon in otoliths from 1941 to 1981 and a validation of ageing methods. J. Fish Biol. 64:1060–1071.
Prager, M.H., Saila, S.B., and Recksick, C.W. (1987). FISHPARM: A Microcomputer Program for Parameter Estimation of Nonlinear Models in Fishery Science, Tech. Rep. 87-10. Department of Oceanography, Old Dominion University, Norfolk, VA.
Pratt, H.L. and Casey, J.G. (1983). Age and growth of the short-fin mako, Isurus oxyrinchus, using four methods. Can. J. Fish. Aquat. Sci. 40:1944–1957.
Punt, A.E. and Hughes, G.S. (1989). PC-YIELD II User’s Guide, Benguela Ecology Programme Report 18. Foundation for Research and Development, University of Natal, Pietermaritzburg, South Africa, 55 pp.
Restrepo, V.R., Thompson, G.G., Mace, P.M., Gabriel, W.L., Low, L.L. et al. (1998). Technical Guidance on the use of Precautionary Approaches to Implementing National Standard 1 of the Magnuson–Stevens Fishery Conservation and Management Act, NOAA Tech. Memo. NMFS-F/SPO. U.S. Department of Commerce, Washington, D.C., 54 pp.
Richards, S.W., Merriman, D., and Calhoun, L.H. (1963). Studies of the marine resources of southern New England. IX. The biology of the little skate, Raja erinacea Mitchell. Bull. Bingham Oceanogr. Collect. Yale Univ. 18(3):5–67.
Ricker, W.E. (1975). Computation and interpretation of bio-logical statistics of fish populations. Bull. Fish. Res. Board Can. 191:1–382.
Ricker, W.E. (1979). Growth Rates and Models. Academic Press, San Diego, CA, pp. 677–743.
Ricker, W.E. (1992). Back-calculation of fish lengths based on proportionality between scale and length increments. Can. J. Fish. Aquat. Sci. 49:1018–1026.
Ridewood, W.G. (1921). On the calcification of the vertebral centra in sharks and rays. Phil. Trans. R. Soc. B Biol. 210:311–407.
Roark, E.B., Guilderson, T.P., Dunbar, R.B., and Ingram, B.L. (2006). Radiocarbon based ages and growth rates: Hawaiian deep sea corals. Mar. Ecol. Prog. Ser. 327:1–14.
Robinson, M.P. and Motta, P.J. (2002). Patterns of growth and the effects of scale on the feeding kinematics of the nurse shark (Ginglymostoma cirratum). J. Zool. (Lond.) 256(4):449–462.
Roff, D.A. (1982). The Evolution of Life Histories: Theory and Analysis. Chapman & Hall, New York.
SAS Institute, Inc. (1999). SAS/ETS User’s Guide, Version 8.0. Statistical Analysis Systems Institute, Inc., Cary, NC.
Schwartz, F.J. (1983). Shark ageing methods and age estimates of scalloped hammerhead, Sphyrna lewini, and dusky, Carcharhinus obscurus, sharks based on vertebral ring counts. In: Prince, E.D. and Pulos, L.M. (Eds.), Proceedings of the International Workshop on Age Determination of Oceanic Pelagic Fishes: Tunas, Billfishes, Sharks, NOAA Tech. Rep. NMFS 8. U.S. Department of Commerce, Washington, D.C., pp. 167–174.
Serra-Pereira, B., Figueiredo, I., Bordalo-Machado, P., Farias, I., Moura, T., and Gordo, L.S. (2005). Age and growth of Raja clavata Linnaeus, 1758: evaluation of ageing preci-sion using different types of caudal denticles. ICES CM Documents 2005 17:1–10.
© 2012 Taylor & Francis Group, LLC
451Assessing the Age and Growth of Chondrichthyan Fishes
Serra-Pereira, B., Figueiredo, I., Farias, I., Moura, T., and Gordo, L.S. (2008). Description of dermal denticles from the caudal region of Raja clavata and their use for the esti-mation of age and growth. ICES J. Mar. Sci. 65:1701–1709.
Simpfendorfer, C.A. and Kyne, P.M. (2009). Limited potential to recover from overfishing raises concerns for deep-sea sharks, rays and chimaeras. Environ. Conserv. 36:97–103.
Simpfendorfer, C.A., McAuley, R.B., Chidlow, J., and Unsworth, P. (2002). Validated age and growth of the dusky shark, Carcharhinus obscurus, from Western Australia waters. Mar. Freshw. Res. 53:567–573.
Skomal, G.B. and Natanson, L.J. (2003). Age and growth of the blue shark, Prionace glauca, in the North Atlantic Ocean. Fish. Bull. 101:627–639.
Sminkey, T.R. and Musick, J.A. (1995a). Age and growth of the sandbar shark, Carcharhinus plumbeus, before and after population depletion. Copeia 1995:871–883.
Sminkey, T.R. and Musick, J.A. (1995b). Demographic analysis of the sandbar shark, Carcharhinus plumbeus, in the west-ern North Atlantic. Fish. Bull. 94:341–347.
Smith, S.E. (1984). Timing of vertebral band deposition in tet-racycline injected leopard sharks. Trans. Am. Fish. Soc. 113:308–313.
Smith, S.E., Au, D.W., and Show, C. (1998). Intrinsic rebound potentials of 26 species of Pacific sharks. Mar. Freshw. Res. 49:663–678.
Smith, S.E., Mitchell, R.A., and Fuller, D. (2003). Age, valida-tion of a leopard shark (Triakis semifasciata) recaptured after 20 years. Fish. Bull. 101:194–198.
Smith, W.D., Cailliet, G.M., and Melendez, E.M. (2007). Maturity and growth characteristics of a commercially exploited stingray, Dasyatis dipterura. Mar. Freshw. Res. 58:54–66.
Stevens, J.D. (1975). Vertebral rings as a means of age deter-mination in the blue shark (Prionace glauca). J. Mar. Biol. Assoc. U.K. 55:657–665.
Stevens, J.D., Bonfil, R., Dulvey, N.K., and Walker, P.A. (2000). The effects of fish on sharks, rays, and chimaeras (chon-drichthyans), and the implications for marine ecosys-tems. ICES J. Mar. Sci. 57:476–494.
Stewart, R.E.A., Campana, S.E., Jones, C.M., and Stewart, B.E. (2006). Bomb radiocarbon dating calculated beluga (Delphinapterus leucas) age estimates. Can. J. Zool. 84:1840–1852.
Stuiver, M. and Polach, H.A. (1977). Discussion: reporting of 14C data. Radiocarbon 19:355–363.
Sullivan, K.J. (1977). Age and growth of the elephant fish Callorhinchus milii (Elasmobranchii: Callorhynchidae). N.Z. J. Mar. Freshw. Res. 11(4):745–753.
Summerfelt, R.C. and Hall, G.E. (1987). Age and Growth of Fish. Iowa State University Press, Ames.
Tanaka, S. (1990). Age and growth studies on the calci-fied structures of newborn sharks in laboratory aquaria using tetracycline. In: Pratt, Jr., H.L., Gruber, S.H., and Taniuchi, T. (Eds.), Elasmobranchs as Living Resources: Advances in the Biology, Ecology, Systematics, and Status of the Fisheries, NOAA Tech. Rep. NMFS 90. U.S. Department of Commerce, Washington, D.C., pp. 189–202.
Tribuzio, C.A. (2010). Life History, Demography, and Ecology of the Spiny Dogfish (Squalus acanthias) in the Gulf of Alaska, doctoral dissertation, University of Alaska Fairbanks, 183 pp.
Tribuzio, C.A., Kruse, G.H., and Fujioka, J.T. (2010). Age and growth of spiny dogfish (Squalus acanthias) in the Gulf of Alaska: analysis of alternative growth models. Fish. Bull. 108:119–135.
Tricas, T.C. and McCosker, J.E. (1984). Predatory behavior of the white shark (Carcharodon carcharias), with notes on its biology. Proc. Calif. Acad. Sci. 43:221–238.
Van Dykhuizen, G. and Mollet, H.F. (1992). Growth, age estima-tion and feeding of captive sevengill sharks, Notorynchus cepedianus, at the Monterey Bay Aquarium. Aust. J. Mar. Freshw. Res. 43:297–318.
Welden, B.A., Cailliet, G.M., and Flegal, A.R. (1987). Comparison of radiometric with vertebral band age esti-mates in four California elasmobranchs. In: Summerfelt, R.C. and Hall, G.E. (Eds.), The Age and Growth of Fish, Iowa State University Press, Ames, pp. 301–315.
Wintner, S.P. and Cliff, G. (1999). Age and growth determina-tion of the white shark, Carcharodon carcharias, from the east coast of South Africa. Fish. Bull. 97:153–169.
Wintner, S.P. and Dudley, S.F.J. (2000). Age and growth esti-mates for the tiger shark, Galeocerdo cuvier, from the east coast of South Africa. Mar. Freshw. Res. 51:43–53.
Wintner, S.P., Dudley, S.F.J., Kistnasamy, N., and Everett, B. (2002). Age and growth estimates for the Zambezi shark, Carcharhinus leucas, from the east coast of South Africa. Mar. Freshw. Res. 53:557–566.
Yamaguchi, A., Huang, S.Y., Chen, C.T., and Taniuchi, T. (1999). Age and growth of the starspotted smooth-hound, Mustelus manazo (Chondrichthyes: Triakidae) in the waters of north-eastern Taiwan. In: Séret, B. and Sire, J.Y. (Eds.), Proceedings of the 5th Indo-Pacific Fishes Conference, Noumea, Society of French Ichthyologists, Paris, pp. 505–513.
Zweifel, J.R. and Lasker, R. (1976) Prehatch and posthatch growth of fishes: a general model. Fish. Bull. 74:609–621.
© 2012 Taylor & Francis Group, LLC