Katalog Usluga Enterprises and Cooperatives Enterprises, Cooperatives
University of Nebraska - LincolnDigitalCommons@University of Nebraska - Lincoln
Faculty Publications: Agricultural Economics Agricultural Economics Department
8-1-2016
Assessing the Ability of Rural Electric Cooperativesto Retire Capital CreditsJeffrey S. RoyerUniversity of Nebraska-Lincoln, [email protected]
Follow this and additional works at: http://digitalcommons.unl.edu/ageconfacpub
Part of the Agricultural and Resource Economics Commons
This Article is brought to you for free and open access by the Agricultural Economics Department at DigitalCommons@University of Nebraska -Lincoln. It has been accepted for inclusion in Faculty Publications: Agricultural Economics by an authorized administrator ofDigitalCommons@University of Nebraska - Lincoln.
Royer, Jeffrey S., "Assessing the Ability of Rural Electric Cooperatives to Retire Capital Credits" (2016). Faculty Publications:Agricultural Economics. 132.http://digitalcommons.unl.edu/ageconfacpub/132
Assessing the Ability of Rural Electric
Cooperatives to Retire Capital Credits
Jeffrey S. Royer
This paper assesses the ability of rural electric cooperatives to retire member equity
under three strategies: (1) replacing equity with term debt to provide for an immediate one-
time retirement of capital credits, (2) reducing the rate at which equity is accumulated and
relying more on term debt to finance asset growth so margins can be used to accelerate the
retirement of capital credits, and (3) adjusting the electric rate to generate additional mar-
gins for retiring capital credits. Analyses suggest that the average distribution cooperative
could employ these strategies to expand capital credits retirement substantially without
weakening its financial condition.
Keywords: Rural electric cooperatives, capital credits, equity financing, equity retirement,
financial ratios, Goodwin formula
Introduction
Cooperatives are an important component of the U.S. electric utility industry.
Electric cooperatives serve an estimated 42 million people by providing power to
18.5 million businesses, homes, schools, churches, farms, irrigation systems, and
other customers. They deliver 11 percent of the electric power sold in the United
States, operating in 47 states and 80 percent of all counties. Electric cooperatives
serve their members through the generation, transmission, and distribution of elec-
tricity. Power supply cooperatives (also called generation and transmission or G&T
cooperatives) are engaged in the generation or purchase of electricity and the trans-
mission of wholesale electricity to distribution cooperatives. Distribution cooper-
atives carry electricity to retail customers. Power supply cooperatives are owned
and financed by the distribution cooperatives they supply in the same manner dis-
tribution cooperatives are owned and financed by their customers. There are 840
distribution cooperatives and 65 power supply cooperatives in the United States,
and they own combined assets of $140 billion.1
Jeffrey S. Royer is professor, Department of Agricultural Economics, University of Nebraska–Lin-
coln.
The author appreciates the contributions of Philip Kenkel, Gregory McKee, and journal re-
viewers. This paper also benefited from comments and suggestions by several individuals in finan-
cial institutions and other organizations associated with the rural electric industry who prefer to
remain anonymous. Having resisted some of the recommended changes, the author accepts sole
responsibility for any remaining errors.
This work was supported by the USDA National Institute of Food and Agriculture, Hatch pro-
ject 1009207.

Vol. 31 [2016] 33
The Rural Utilities Service (RUS) of the U.S. Department of Agriculture, the
National Rural Utilities Cooperative Finance Corporation (CFC), and CoBank are
important sources of borrowed funds for electric cooperatives. RUS provides fi-
nancing for the construction of electric generation, transmission, and distribution
facilities, including system improvements and replacement, necessary for provid-
ing and improving electric service in rural areas. It currently serves almost 700
borrowers and maintains a loan portfolio of approximately $46 billion. Through its
guaranteed loan program, credit is provided by the Federal Financing Bank at in-
terest rates set 12.5 basis points over U.S. Treasury rates and for terms of up to 35
years, depending on the useful life of the facilities that are financed.2 CFC is a
cooperatively organized corporation created by electric cooperatives to raise funds
from capital markets. It has total loans outstanding of nearly $22 billion.3 CoBank
is a national cooperative bank and a member of the Farm Credit System. It makes
loans to agribusinesses and providers of rural power, water, and communications
and serves several hundred rural electric generation, transmission, and distribution
cooperatives.4 It has an average loan volume of about $83 billion.5
Equity capital is an essential part of the financial structure of any business be-
cause it provides a buffer against unexpected expenses or losses and reduces the
risk that loans cannot be repaid. To raise equity capital, electric cooperatives must
rely on net margins allocated to members in the form of capital credits. Capital
credits are allocated to individual members based on their purchase of electricity
from a cooperative. Those margins are retained for use by the cooperative until the
credits are eventually replaced by new allocations and redeemed in cash. Capital
credits are usually retired according to the first-in/first-out (FIFO) method.6 Under
the FIFO method, a cooperative retires, or rotates, capital credits in the order they
were allocated as the oldest allocations are replaced by new ones. The rotation
period or cycle refers to the length of time between when a capital credit is allocated
and when it is retired.
During the early years of the U.S. rural electric program, cooperatives generally
were unable to retire capital credits held by members because the continued accu-
mulation of equity capital was required to serve member needs and build financial
strength. Yet, as equity began to rise beyond necessary levels, many electric coop-
eratives continued to accumulate capital credits without establishing plans for re-
tiring them. By the 1970s, the level of equity in the average distribution cooperative
approached 35 percent of total assets. However, only 127 of 1,050 borrowers re-
ported to the Rural Electrification Administration (now RUS) that they had retired
capital credits (Capital Credits Task Force 2005). Without a systematic plan for
retiring capital credits, a cooperative cannot ensure that members are financing the
organization in proportion to the benefits they receive or that each generation of
members is carrying its own weight.

34 Journal of Cooperatives
Given the situation that existed in the 1970s, the National Rural Electric Coop-
erative Association (NRECA) and CFC appointed a committee of representatives
from the nation’s electric cooperatives to examine various issues related to member
equity and make recommendations that could be used by cooperatives to expand
their retirement of capital credits. In its 1976 report, the committee recommended
that each distribution cooperative should develop long-range plans to achieve eq-
uity levels of at least 30 percent and rotate equity on a reasonable fixed-period basis.
The committee suggested that distribution cooperatives should rotate equity ac-
cording to a 10- to 20-year rotation period when possible and that the rotation pe-
riods for power cooperatives should be shorter, along the lines of 3 to 10 years. The
committee also recommended that each distribution cooperative should adopt an
approach for determining retail electric rates that took the costs of both debt and
equity into account and enabled the generation of margins adequate for both build-
ing and retiring equity (Capital Credits Study Committee 1976).
By 2003, the average equity level of distribution cooperatives was over 40 per-
cent, and 84 percent of those cooperatives with adequate levels of equity were re-
tiring capital credits totaling more than $300 million annually. However, questions
had arisen concerning the practices of some cooperatives that had continued to ac-
cumulate substantial amounts of equity without retiring capital credits. In response,
NRECA and CFC established a second committee of electric cooperative repre-
sentatives to reexamine issues related to capital credits. In 2005, that committee
recommended that every electric cooperative should have a policy for retiring cap-
ital credits on an annual basis subject to the discretion of its board of directors and
its financial condition. The committee also recommended that every cooperative
should have an equity management plan that included setting electric rates to gen-
erate cash flows sufficient for retiring capital credits (Capital Credits Task Force
2005).
In recent years, the topic of capital credits retirement has gained the attention
of at least one member of Congress. In a 2008 article highly critical of electric
cooperatives, Jim Cooper, U.S. representative from Tennessee, complained that
some cooperatives had held member capital credits for more than 20 years without
retiring them. He argued that electric cooperatives were overcapitalized by 10 to
30 percent and had unused borrowing capacity that would allow them to retire $3
billion to $9 billion of capital credits on a one-time basis without threatening their
financial stability (Cooper 2008).
Despite the importance of these issues to rural electric cooperatives and their
members, little attention has been given to assessing the financial ability of electric
cooperatives to adopt more aggressive equity retirement programs. While several
studies, including Cobia et al. 1982, Royer 1983, and Royer 1993, have included
quantitative analyses of the financial impact of various equity retirement programs
on agricultural cooperatives, similar studies for rural electric cooperatives have not

Vol. 31 [2016] 35
been conducted. Research specific to electric cooperatives is needed because they
differ from agricultural cooperatives in important ways.
For one, there are differences in the federal income tax treatment of agricultural
and electric cooperatives, and those differences have implications for how cooper-
atives are financed and margins are returned to members. The tax treatment of
agricultural cooperatives is defined by Subchapter T of the U.S. Internal Revenue
Code, which consists of sections 1381–88 of the code. It applies to farmer cooper-
atives described in section 521 of the code as well as any corporations operating on
a cooperative basis except mutual savings banks, insurance companies, coopera-
tives engaged in furnishing electricity or providing telephone service to rural areas,
and organizations exempt from federal taxation. Electric cooperatives operating in
either rural or urban areas may be exempt from federal taxation under section
501(c)(12) of the code. In most circumstances, Subchapter T requires cooperative
members to include both cash and noncash patronage dividends in their taxable
income. In turn, a cooperative can exclude patronage dividends from its taxable
income as long as it pays at least 20 percent in cash. Most agricultural cooperatives
pay a higher proportion of patronage dividends in cash to ensure members have
cash adequate for paying tax on them. Electric cooperatives generally do not pay
cash patronage dividends because they are not subject to Subchapter T.
There also are important functional differences between agricultural and elec-
tric cooperatives, and studies of U.S. agricultural cooperatives have shown that the
financial structure of cooperatives varies substantially across principal product and
function (Eversull 2011). In addition, agricultural cooperatives are subject to
changes in market conditions to a greater extent than electric cooperatives, which
are associated with comparatively stable rates and demand for electricity. For all
these reasons, measures of financial structure and condition are likely to take on
substantially different values when applied to electric cooperatives than when ap-
plied to agricultural cooperatives.
This paper seeks to address the need for additional knowledge on the ability of
rural electric cooperatives to retire member capital credits by examining the finan-
cial impact on cooperatives of three equity retirement strategies:
1. Replacing equity with term debt—Acquiring additional long-term debt
to replace equity capital so the cooperative can undertake an immediate
one-time retirement of capital credits in the manner suggested by
Cooper.
2. Reducing the rate of equity accumulation—Lowering the rate at which
equity is accumulated and relying more on long-term debt to finance
growth in assets so the cooperative’s margins can be used to accelerate
the retirement of capital credits.

36 Journal of Cooperatives
3. Adjusting the electric rate—Raising the electric rate so the cooperative
can generate additional margins for retiring capital credits and shift a
greater share of financing to those members who currently benefit most
from its use in a manner similar to that suggested in the NRECA-CFC
reports.
The ability of rural electric cooperatives to retire capital credits under each of
these strategies is analyzed in the next three sections. For each strategy, the ability
of the average distribution cooperative to retire equity is assessed using a spread-
sheet model and data on RUS electric borrowers to examine the effects of equity
retirement on several important financial indicators such as interest coverage, the
rate of return on equity, and the length of the rotation cycle. The following analyses
suggest that rural electric cooperatives can on average employ one or more of these
strategies to substantially expand or accelerate the retirement of capital credits.
Replacing Equity with Term Debt
To assess the ability of rural electric cooperatives to retire capital credits by
replacing equity capital with long-term debt, a spreadsheet model of the average
distribution cooperative was constructed from RUS data for the 2006–11 period
during which data are available (Rural Utilities Service 2013, and earlier). Selected
balance sheet and operating statement data for the average distribution cooperative
during the 2006–11 period are presented in table 1. On average, 581 distribution
cooperatives were included in the RUS data.
Table 1. Selected data for average distribution cooperative, 2006–11
Net utility plant $64,080,460 Electric sales (kWh) 466,342,400
Total assets $85,071,404 Operating revenue $43,576,771
Operating expenses −40,084,707
RUS long-term debt $29,317,341 ────────
Other long-term debt 9,374,272 Operating income $3,492,064
────────
Total long-term debt $38,691,613 Nonoperating income $313,319
Total equity $34,443,849 Interest expense $1,919,838
Total capital $73,135,462 Net income $2,603,439
Balance sheet Operating statement

Vol. 31 [2016] 37
The ability of the average distribution cooperative to retire equity was evaluated
by incrementally replacing equity with long-term debt in the spreadsheet model and
recalculating the balance sheet and operating statement values. In addition to af-
fecting the levels of equity capital and long-term debt on the balance sheet, the
replacement of equity affects the operating statement by increasing interest expense
and decreasing net income.
Although RUS provides financing only for construction of facilities, other lend-
ers have indicated a willingness to make unsecured loans for the retirement of cap-
ital credits. The interest rate used here to calculate the increase in interest expense
due to new long-term debt was set at 5.34 percent, the average rate rural electric
cooperatives might have been expected to pay for unsecured term debt during the
2006–11 period. This rate was determined by adding 200 basis points to the aver-
age seven-year U.S. Department of the Treasury yield curve rate for the period.7
In particular, this analysis tracked the values of seven variables related to the
cooperative’s financial structure and condition. Those variables are the ratio of
equity to total assets, the ratio of equity to total capital, the average interest rate, the
times-interest-earned ratio, the rate of return on equity, the weighted average cost
of capital, and the length of the rotation cycle.
The equity/total assets ratio is equivalent to the proportion of total assets fi-
nanced by equity capital. The 2005 NRECA-CFC report recommended that distri-
bution cooperatives maintain an equity level of 30 to 50 percent, what would be
appropriate for an investment grade rating according to Fitch Ratings, one of the
three nationally recognized statistical rating organizations designated by the U.S.
Securities and Exchange Commission. The equity/total capital ratio measures eq-
uity as a proportion of total capital, i.e., the sum of long-term debt and equity cap-
ital. This ratio provides a convenient metric for the replacement of equity by debt.
The average interest rate represents the average cost of term debt after the cost of
new debt used to replace equity is taken into account. It will increase with addi-
tional long-term borrowing if the interest rate on new debt is greater than the aver-
age interest rate on existing loans.
The times-interest-earned ratio (TIER) is a measure of interest coverage or the
ability of a cooperative to cover principal and interest payments. It is calculated by
dividing the sum of net income and total interest expense by total interest expense.
Provisions in RUS loan agreements require a minimum TIER of 1.25 for distribu-
tion cooperatives. However, financial experts have cautioned that TIERs at that
level cannot be counted on to provide the margins necessary for electric coopera-
tives to meet their needs in private capital markets and retire capital credits on a
systematic and reasonable basis. Fitch Ratings recommends that distribution coop-
eratives maintain a TIER of 1.5 to 2.0 or higher (Capital Credits Task Force 2005,
38 Journal of Cooperatives
62). In an equity management model based on TIER values, Phillips (2001) sug-
gested that most electric cooperatives need to maintain a TIER between 1.5 and 3.0
to generate the margins and cash flows necessary to achieve their financial goals.
The rate of return on equity (ROE) determines how quickly a cooperative can
accumulate equity or retire capital credits. The rate of return on equity required for
a cooperative to maintain a constant equity share for a given growth rate and rota-
tion cycle can be calculated from the Goodwin formula (also called the modified
Goodwin formula). In simplified form, the formula can be expressed as
for 01 (1 )
e T
gr g
g
(1)
where er is the rate of return on equity, g is the growth rate, and T is the length of
the rotation cycle (Royer 2015, 276). An alternative interpretation of the rate of
return in equation (1) is that it represents the cost to the cooperative of maintaining
a particular growth rate and rotation cycle. As such, it has been used to represent
the cost of equity in various applications related to electric cooperatives, including
discount calculations (Capital Credits Task Force 2005, 48–50) and Phillips’s eq-
uity management model. Because the rate of return on capital before interest ex-
pense is assumed constant in the spreadsheet model used here, the rate of return on
equity increases as equity/total capital is reduced. The relationship between the
rate of return on equity and the share of total capital provided by equity can be
expressed
(1 )kb
e
r i pr
p
(2)
where kbr is the rate of return on capital before interest expense, i is the average
interest rate, and p is equity/total capital (Royer 2015, 273–75). For given values
of kbr and i, it is clear that 0edr dp if kbi r .
The weighted average cost of capital (WACC) represents the cost of capital in
present value calculations used in capital budgeting decisions. It is determined by
weighting the average interest rate and the cost of equity by the respective amounts
of long-term debt and equity:
(1 ).ek r p i p (3)
In this analysis, the rate of return on equity is used to represent the cost of equity
capital. It is important for a cooperative to assign an appropriate cost to equity.
Vol. 31 [2016] 39
Otherwise, it may rely too much on equity and underestimate overall capital costs,
resulting in an overinvestment in assets and actual capital costs that are unneces-
sarily high. If the cooperative does not assign an appropriate cost to equity, it also
is less likely to retire capital credits in a timely manner. Because the rate of return
on capital before interest expense is assumed constant in the spreadsheet model, the
weighted average cost of capital is invariant with respect to changes in equity/total
capital. This can be shown quite easily by substituting er from equation (2) into
equation (3). That change results in kbk r irrespective of the values of p and i.
The length of the rotation cycle a cooperative can maintain is used to represent
the ability of the cooperative to retire capital credits. The rotation cycle depends
on the cooperative’s rate of return on equity and growth rate. Derived from equa-
tion (1), the following expression can be used to calculate its length:
log 1
for , 0.log 1
e
e
g
rT r g g
g
(4)
For a given growth rate, the rotation cycle will decrease as the rate of return in-
creases. Based on the recommendations in the 1976 NRECA-CFC report, a 10- to
20-year rotation cycle is used here as a benchmark.
Results
The effects the replacement of equity with term debt would have had on the
average distribution cooperative are represented in table 2. In that table, the base-
line column represents the values that would have existed without changes in the
equity level. Those columns to the right of that indicate the values that would have
accompanied reductions in the equity level, as measured by the proportion of equity
retired, according to the spreadsheet calculations. Without a reduction in equity,
the average cooperative could have maintained a rotation cycle of 28.2 years, much
longer than the 10- to 20-year benchmark. On the other hand, the average equity
share and TIER value are respectively 40.5 percent and 2.36, considerably greater
than their benchmark values, suggesting that the average cooperative would have
had a substantial capacity to lower its equity level by taking on additional debt.
A 5 percent reduction in equity only would have reduced the equity share to
38.5 percent and the TIER value to 2.25 but would have allowed the cooperative to
shorten its rotation cycle by about a year. As the proportion of equity replaced by
term debt is increased, both equity/total assets and equity/total capital decline as
expected. Up to 25 percent of equity can be replaced by debt before equity/total

40 Journal of Cooperatives
Ta
ble
2.
Reti
ring
ca
pit
al cr
edit
s by
repla
cing
equit
y w
ith t
erm
debt
(20
06
–11
avera
ge inte
rest
ra
te)
0.0
50
.10
0.1
50
.20
0.2
50
.30
0.3
50
.40
Long-t
erm
debt
38,6
92
40,4
14
42,1
36
43,8
58
45,5
80
47,3
03
49,0
25
50,7
47
52,4
69
Equity
34,4
44
32,7
22
30,9
99
29,2
77
27,5
55
25,8
33
24,1
11
22,3
89
20,6
66
──
──
──
──
──
──
──
──
──
──
──
──
──
──
──
──
──
──
Tota
l capital
73,1
35
73,1
35
73,1
35
73,1
35
73,1
35
73,1
35
73,1
35
73,1
35
73,1
35
Capital cre
dits
retire
d1,7
22
3,4
44
5,1
67
6,8
89
8,6
11
10,3
33
12,0
55
13,7
78
Incom
e b
efo
re inte
rest
expense
4,5
23
4,5
23
4,5
23
4,5
23
4,5
23
4,5
23
4,5
23
4,5
23
4,5
23
Inte
rest
expense
1,9
20
2,0
12
2,1
04
2,1
96
2,2
88
2,3
80
2,4
71
2,5
63
2,6
55
──
──
──
──
──
──
──
──
──
──
──
──
──
──
──
──
──
──
Net
incom
e2,6
03
2,5
11
2,4
20
2,3
28
2,2
36
2,1
44
2,0
52
1,9
60
1,8
68
Equity/t
ota
l ass
ets
0.4
053
0.3
850
0.3
648
0.3
445
0.3
242
0.3
040
0.2
837
0.2
634
0.2
432
Equity/t
ota
l capital
0.4
710
0.4
474
0.4
239
0.4
003
0.3
768
0.3
532
0.3
297
0.3
061
0.2
826
TIE
R2.3
62.2
52.1
52.0
61.9
81.9
01.8
31.7
61.7
0
Avera
ge inte
rest
rate
0.0
496
0.0
498
0.0
499
0.0
501
0.0
502
0.0
503
0.0
504
0.0
505
0.0
506
Rate
of
retu
rn o
n e
quity
0.0
756
0.0
768
0.0
781
0.0
795
0.0
811
0.0
830
0.0
851
0.0
875
0.0
904
Weig
hte
d a
vera
ge c
ost
of
capital
0.0
618
0.0
618
0.0
618
0.0
618
0.0
618
0.0
618
0.0
618
0.0
618
0.0
618
Rota
tion c
ycle
28.2
27.1
26.0
24.9
23.8
22.7
21.5
20.3
19.1
Ra
tes
Yea
rs
Base
lin
eP
rop
ort
ion
of
eq
uit
y r
eti
red
Th
ou
san
d d
oll
ars
Vol. 31 [2016] 41
assets drops to below the 30 to 50 percent range recommended in the 2005 NRECA-
CFC report. As the equity level declines, the TIER value also falls. However, even
with a 25 percent reduction in equity, the TIER is 1.90, still considerably greater
than the 1.25 minimum required by RUS loan agreements or the 1.5 level recom-
mended by both Fitch Ratings and Phillips.
Given the 5.34 percent interest rate assumed for new debt is greater than the
4.96 percent average interest rate on existing debt, the average interest rate in-
creases with additional debt. However, the increase is fairly small; the average rate
associated with a 25 percent reduction in equity is only 5.03 percent. Meanwhile,
the rate of return on equity rises rather substantially because of the increased finan-
cial leverage. As a result of the higher rate of return, the cooperative could have
reduced its rotation cycle 5.5 years by lowering equity 25 percent. Thus, in addition
to the immediate benefit from the one-time retirement of capital credits, the replace-
ment of equity capital with debt provides an important secondary benefit by reduc-
ing the rotation cycle so remaining capital credits can be retired more rapidly. Con-
sistent with the discussion of equation (3), the weighted average cost of capital is
invariant with respect to reductions in equity. Therefore, capital budgeting deci-
sions would not have been affected.
Because neither the equity level nor TIER value are reduced to below their
benchmark values, it appears that the average distribution cooperative would have
been financially capable of undertaking a one-time retirement of up to 25 percent
of its equity.8 However, it is unlikely that lenders would have been willing to pro-
vide unsecured loans sufficient for replacing that much equity. Instead, it seems
reasonable to expect that the average cooperative only would have been able to
obtain financing to replace between 5 and 15 percent of its equity under this strat-
egy. Individual cooperatives would have differed in their ability to acquire financ-
ing based on the collateral value of existing hard assets and expected cash flows.
In general, the ability of a particular cooperative to employ this strategy also would
have depended on its capital requirements, financial performance, and competitive
situation.9
Effects of Lower Interest Rates
The results of this analysis are sensitive to the interest rate used to calculate the
interest expense on new debt. The interest rate affects net income, the TIER value,
and the rate of return on equity among other variables. In turn, the TIER value
plays an important role in determining how much equity can be replaced, and the
rate of return determines the rotation cycle that can be maintained. The sensitivity
of the results in table 2 is of relevance given interest rates fell substantially between
2006 and 2011. The average seven-year Treasury yield curve rate for 2011 was
2.16 percent, which represented a 55 percent decline from the 2006 rate of 4.76
percent.
42 Journal of Cooperatives
Table 3 reports the results of replicating the analysis in table 2 while assuming
that the interest rate on new debt was 4.16 percent, 200 basis points over the average
2011 Treasury rate. Net income and the TIER value both decline as the proportion
of equity replaced increases but less rapidly than in table 2. Because the interest
rate for new debt is less than that for existing debt, the average interest rate declines
as more equity is replaced. In addition, the rate of return on equity rises more
quickly and the rotation cycle falls more quickly. At 25 percent equity replacement,
the TIER value is almost 5 percent greater than in table 2. The rate of return on
equity is only slightly higher, but it is associated with a two-year reduction in the
rotation cycle.
Interest rates continued to decline after 2011. The average seven-year Treasury
rate for 2012–15 was 1.75 percent, 19 percent lower than in 2011. With even lower
interest rates, the ability of the average distribution cooperative to replace equity
with term debt would have been further enhanced.
Reducing the Rate of Equity Accumulation
An alternative strategy for a cooperative is to reduce the rate at which it accu-
mulates equity so a larger share of new assets is financed with borrowed capital. In
this way, more of current earnings can be used to retire capital credits while the
cooperative’s equity share is gradually reduced. An advantage of this method is
that as long as increases in hard assets exceed new debt, new assets may provide a
source of collateral for new loans, thus providing the cooperative greater access to
financing and at lower interest rates than it would face with unsecured debt.
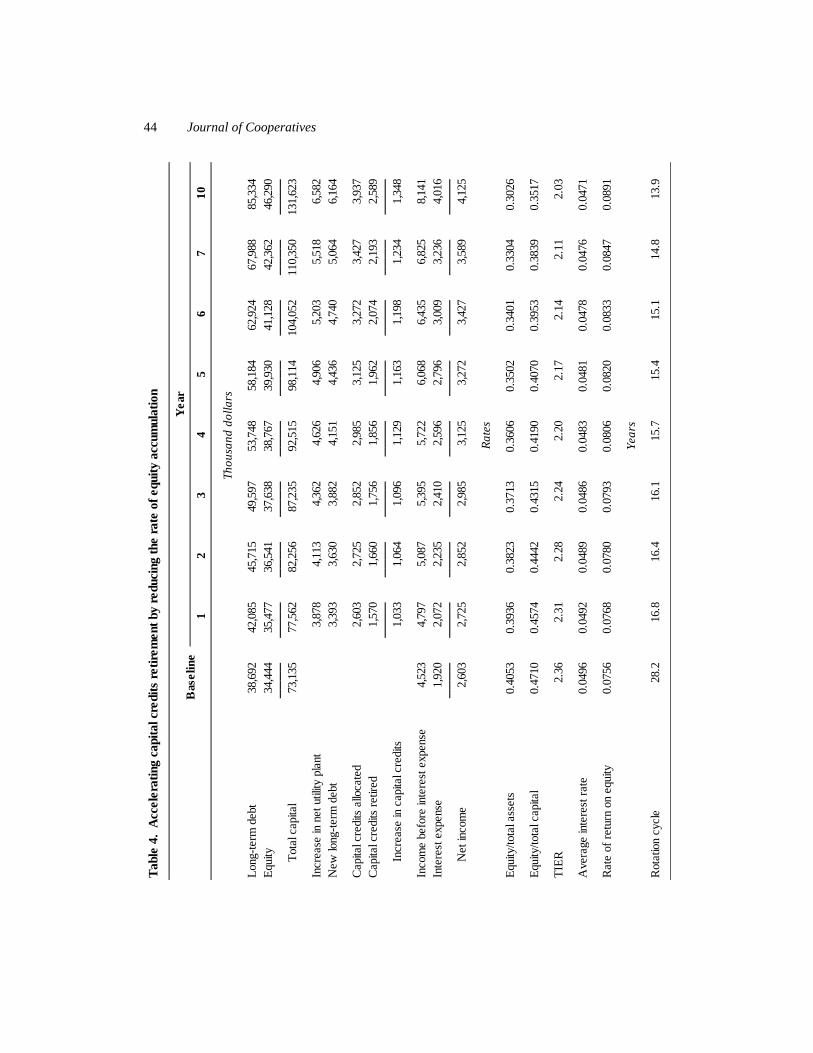
Table 4 illustrates this strategy applied to the average distribution cooperative
based on a second spreadsheet model. Both assets and equity capital of the average
cooperative grew at about 6.1 percent per annum during the 2006–11 period. Most
balance sheet items shown in the table, including total assets and total capital, are
assumed to grow at a 6.1 percent rate. However, it is assumed that the cooperative
has chosen to reduce the rate at which it accumulates equity to 3 percent as a means
of accelerating the retirement of capital credits. As a consequence, the cooperative
must rely on borrowed capital to finance a greater share of the growth in assets.
In this analysis, increases in net utility plant (assets employed for electric gen-
eration, transmission, or distribution, less accumulated depreciation) are considered
a source of collateral. The interest rate used to calculate the increase in interest
expense due to new long-term debt was set at 4.49 percent, the average rate RUS
would have charged during the 2006–11 period on loans for electric facilities, in-
cluding system improvements and replacement. This rate was determined by add-
ing 12.5 basis points to the average 30-year Treasury yield curve rate for 2006–11.
During the 10-year period represented in table 4, both long-term debt and equity
increase. However, debt must rise at an average annual rate of 8.3 percent if asset

Vol. 31 [2016] 43
Ta
ble
3.
Reti
ring
ca
pit
al cr
edit
s by
repla
cing
equit
y w
ith t
erm
debt
(20
11
avera
ge inte
rest
ra
te)
0.0
50
.10
0.1
50
.20
0.2
50
.30
0.3
50
.40
Long-t
erm
debt
38,6
92
40,4
14
42,1
36
43,8
58
45,5
80
47,3
03
49,0
25
50,7
47
52,4
69
Equity
34,4
44
32,7
22
30,9
99
29,2
77
27,5
55
25,8
33
24,1
11
22,3
89
20,6
66
──
──
──
──
──
──
──
──
──
──
──
──
──
──
──
──
──
──
Tota
l capital
73,1
35
73,1
35
73,1
35
73,1
35
73,1
35
73,1
35
73,1
35
73,1
35
73,1
35
Capital cre
dits
retire
d1,7
22
3,4
44
5,1
67
6,8
89
8,6
11
10,3
33
12,0
55
13,7
78
Incom
e b
efo
re inte
rest
expense
4,5
23
4,5
23
4,5
23
4,5
23
4,5
23
4,5
23
4,5
23
4,5
23
4,5
23
Inte
rest
expense
1,9
20
1,9
91
2,0
63
2,1
35
2,2
06
2,2
78
2,3
49
2,4
21
2,4
93
──
──
──
──
──
──
──
──
──
──
──
──
──
──
──
──
──
──
Net
incom
e2,6
03
2,5
32
2,4
60
2,3
89
2,3
17
2,2
45
2,1
74
2,1
02
2,0
31
Equity/t
ota
l ass
ets
0.4
053
0.3
850
0.3
648
0.3
445
0.3
242
0.3
040
0.2
837
0.2
634
0.2
432
Equity/t
ota
l capital
0.4
710
0.4
474
0.4
239
0.4
003
0.3
768
0.3
532
0.3
297
0.3
061
0.2
826
TIE
R2.3
62.2
72.1
92.1
22.0
51.9
91.9
31.8
71.8
1
Avera
ge inte
rest
rate
0.0
496
0.0
493
0.0
490
0.0
487
0.0
484
0.0
482
0.0
479
0.0
477
0.0
475
Rate
of
retu
rn o
n e
quity
0.0
756
0.0
774
0.0
794
0.0
816
0.0
841
0.0
869
0.0
902
0.0
939
0.0
983
Weig
hte
d a
vera
ge c
ost
of
capital
0.0
618
0.0
618
0.0
618
0.0
618
0.0
618
0.0
618
0.0
618
0.0
618
0.0
618
Rota
tion c
ycle
28.2
26.6
25.0
23.5
22.0
20.6
19.2
17.8
16.5
Base
lin
eP
rop
ort
ion
of
eq
uit
y r
eti
red
Th
ou
san
d d
oll
ars
Ra
tes
Yea
rs
44 Journal of Cooperatives
Table
4. A
ccele
rati
ng c
apit
al cr
edit
s re
tire
ment
by r
educi
ng t
he r
ate
of
equit
y a
ccum
ula
tion
12
34
56
71
0
Long-t
erm
debt
38,6
92
42,0
85
45,7
15
49,5
97
53,7
48
58,1
84
62,9
24
67,9
88
85,3
34
Equity
34,4
44
35,4
77
36,5
41
37,6
38
38,7
67
39,9
30
41,1
28
42,3
62
46,2
90
──
──
──
──
──
──
──
──
──
──
──
──
──
──
──
──
──
──
Tota
l capital
73,1
35
77,5
62
82,2
56
87,2
35
92,5
15
98,1
14
104,0
52
110,3
50
131,6
23
Incre
ase
in n
et
utilit
y p
lant
3,8
78
4,1
13
4,3
62
4,6
26
4,9
06
5,2
03
5,5
18
6,5
82
New
long-t
erm
debt
3,3
93
3,6
30
3,8
82
4,1
51
4,4
36
4,7
40
5,0
64
6,1
64
Capital cre
dits
allo
cate
d2,6
03
2,7
25
2,8
52
2,9
85
3,1
25
3,2
72
3,4
27
3,9
37
Capital cre
dits
retire
d1,5
70
1,6
60
1,7
56
1,8
56
1,9
62
2,0
74
2,1
93
2,5
89
──
──
──
──
──
──
──
──
──
──
──
──
──
──
──
──
Incre
ase
in c
apital cre
dits
1,0
33
1,0
64
1,0
96
1,1
29
1,1
63
1,1
98
1,2
34
1,3
48
Incom
e b
efo
re inte
rest
expense
4,5
23
4,7
97
5,0
87
5,3
95
5,7
22
6,0
68
6,4
35
6,8
25
8,1
41
Inte
rest
expense
1,9
20
2,0
72
2,2
35
2,4
10
2,5
96
2,7
96
3,0
09
3,2
36
4,0
16
──
──
──
──
──
──
──
──
──
──
──
──
──
──
──
──
──
──
Net
incom
e2,6
03
2,7
25
2,8
52
2,9
85
3,1
25
3,2
72
3,4
27
3,5
89
4,1
25
Equity/t
ota
l ass
ets
0.4
053
0.3
936
0.3
823
0.3
713
0.3
606
0.3
502
0.3
401
0.3
304
0.3
026
Equity/t
ota
l capital
0.4
710
0.4
574
0.4
442
0.4
315
0.4
190
0.4
070
0.3
953
0.3
839
0.3
517
TIE
R2.3
62.3
12.2
82.2
42.2
02.1
72.1
42.1
12.0
3
Avera
ge inte
rest
rate
0.0
496
0.0
492
0.0
489
0.0
486
0.0
483
0.0
481
0.0
478
0.0
476
0.0
471
Rate
of
retu
rn o
n e
quity
0.0
756
0.0
768
0.0
780
0.0
793
0.0
806
0.0
820
0.0
833
0.0
847
0.0
891
Rota
tion c
ycle
28.2
16.8
16.4
16.1
15.7
15.4
15.1
14.8
13.9
Yea
rs
Ye
ar
Th
ou
san
d d
oll
ars
Base
lin
e
Ra
tes

Vol. 31 [2016] 45
growth is to remain at 6.1 percent while equity growth is restricted to 3 percent. As
a result, equity/total assets declines throughout the period. By the tenth year, it is
quickly approaching the 30 percent recommended minimum. New long-term debt
continues to increase throughout the period, but by the tenth year, the increase in
net utility plant still exceeds new debt. Thus, increases in net utility plant provide
a steady source of collateral for new debt. Both capital credits allocated and retired
increase, resulting in a net increase in capital credits over time. Similarly, income
before interest expense, interest expense, and net income all rise. As interest ex-
pense increases relative to net income, the TIER value gradually declines, but it
still exceeds 2.0 in the tenth year.
Due to the increased leverage resulting from the reduced growth in equity, the
rate of return on equity rises throughout the period. Given the greater rate of return,
the rotation cycle the cooperative can maintain is reduced. In the first year, an
immediate and substantial reduction in the rotation cycle occurs because the coop-
erative can accelerate equity retirement simply by reducing the rate of equity
growth from 6.1 percent to 3 percent (see equation (4)). However, the rotation
cycle decreases further as the rate of return on equity continues to climb.
Adjusting the Electric Rate
Cooperatives often may have flexibility in determining the rates they charge
members for electricity.10 A third strategy for accelerating the retirement of capital
credits is for a cooperative to generate additional margins by raising its electric rate.
In this analysis, we assess the ability of the average distribution cooperative to
shorten its rotation cycle by applying this strategy. Using the RUS data for the
2006–11 period and a model described in Royer (2015), we calculate the electric
rates that would be required for the cooperative to maintain several target rotation
cycles and examine the effects of rate changes on net income, various rates of re-
turn, and the TIER value.
Let *T represent the target rotation cycle. From equation (1), the rate of return
on equity required to rotate equity according to *T is
*
*
1 (1 )e T
gr
g
(5)
for a given growth rate and constant equity/total capital ratio. The required rate of
return on capital can be determined from the required rate of return on equity:
* *
k er pr (6)
where p is once again equity/total capital.
46 Journal of Cooperatives
In general, the rate of return on capital can be calculated from the ratio of net
income to total capital, which can be expressed as
k
ES ER OIr
K
(7)
where ES represents electric sales, ER represents the electric rate, and K represents
total capital. The product ES ER is operating revenue. The OI term consists of
the sum of several other components of net income, including operating expenses
(−), nonoperating income (+), and interest expense (−). Setting equation (7) equal
to *
kr and solving for ER yields the electric rate necessary to rotate equity according
to the target rotation cycle *T :
*
* .kr K OIER
ES
(8)
The average distribution cooperative could have maintained a 28.2-year rota-
tion cycle given the baseline electric rate of 9.34 ct./kWh. Table 5 shows that the
cooperative could have reduced its rotation cycle to 25 years by raising the electric
rate by only 0.03 ct./kWh or 0.30 percent. Shorter rotation cycles would have re-
quired greater rate increases, but the cooperative could have shortened its rotation
cycle substantially with less than a 5 percent rate increase. With a 4.84 percent
increase, the cooperative could have maintained a 10-year rotation cycle, well
within the range recommended in the 1976 NRECA-CFC report.
Raising the electric rate also would have increased the rates of return and TIER
value. By raising the electric rate by 4.84 percent, the rate of return on equity would
have risen to 0.1369, which is considerably greater than the baseline value. With
any increase in the rate of return on equity, there would have been a corresponding
increase in the cost of equity capital relative to debt. That increase in the relative
cost of equity would have encouraged the cooperative to retire additional capital
credits in an effort to reduce its equity share. The corresponding increase in the
rate of return on capital would have implied that higher returns would be required
for decisions to invest in new capital projects.11
Conclusions
During the 2006–11 period, the average distribution cooperative would have
been capable of replacing up to 25 percent of its equity with term debt without
reducing its equity share or TIER value below recommended levels. In addition to
the one-time benefit members would have received from the retirement of capital

Vol. 31 [2016] 47
Ta
ble
5.
Acc
ele
rati
ng
ca
pit
al cr
edit
s re
tire
ment
by
adju
stin
g t
he e
lect
ric
rate
25
20
15
10
5
Ele
ctr
ic r
ate
(ct.
/kW
h)
9.3
49.3
79.4
49.5
59.8
010.5
5
Incre
ase
(perc
ent)
0.3
01.0
02.2
54.8
412.8
7
Opera
ting r
evenue
43,5
77
43,7
08
44,0
15
44,5
56
45,6
88
49,1
85
Opera
ting incom
e3,4
92
3,6
93
3,9
30
4,4
71
5,6
03
9,1
00
Net
incom
e2,6
03
2,7
35
3,0
41
3,5
83
4,7
15
8,2
12
Rate
of
retu
rn o
n e
quity
0.0
756
0.0
794
0.0
883
0.1
040
0.1
369
0.2
384
Rate
of
retu
rn o
n c
apital
0.0
356
0.0
374
0.0
416
0.0
490
0.0
645
0.1
123
Rate
of
retu
rn o
n a
ssets
0.0
306
0.0
321
0.0
357
0.0
421
0.0
554
0.0
965
TIE
R2.3
62.4
22.5
82.8
73.4
65.2
8
Base
lin
eT
arg
et
rota
tio
n c
ycle
(ye
ars
)
Th
ou
san
d d
oll
ars
Ra
tes

48 Journal of Cooperatives
credits, the reduction of equity would have created an important secondary benefit
by raising the rate of return on equity due to increased financial leverage. That
higher rate of return would have improved the cooperative’s ability to retire addi-
tional equity in a timely manner. In general, by taking steps to accelerate the re-
tirement of capital credits, a rural electric cooperative can help ensure that its mem-
bers are financing the organization in proportion to the benefits they receive and
that each generation of members carries its own weight.
Despite the advantages, a cooperative that seeks to use this strategy to acceler-
ate the retirement of capital credits may face limitations on its ability to acquire
necessary financing. Because RUS provides financing only for constructing facil-
ities, a cooperative employing this strategy would need to acquire unsecured loans
from other lenders at higher interest rates. In addition, lenders may restrict equity
replacement to within the range of 5 to 15 percent. Individual cooperatives will
differ in their ability to acquire financing based on the collateral value of existing
hard assets and expected cash flows. In general, the ability of a particular cooper-
ative to employ this strategy also will depend on its capital requirements, financial
performance, and competitive situation.
An alternative strategy for a cooperative is to reduce the rate at which it accu-
mulates equity so a larger share of new assets is financed with borrowed capital. In
this way, more of current earnings can be used to retire capital credits while the
cooperative’s equity share is gradually reduced. An advantage of this strategy is
that as long as increases in hard assets exceed new debt, new assets may provide a
source of collateral for new loans, thus providing the cooperative greater access to
financing and at lower interest rates than it would face with unsecured debt. Simply
by lowering the rate at which it accumulates equity, a cooperative will be able to
shorten the length of its rotation cycle. In addition, as the equity share declines
over time, the rate of return on equity will rise, further reducing the rotation cycle.
Analysis presented here demonstrates that the average distribution cooperative
could have substantially reduced its rotation cycle by halving its rate of equity
growth.
Cooperatives also may benefit from exploring higher electric rates as a means
of expanding the retirement of capital credits. A third analysis shows that the av-
erage distribution cooperative could have reduced its rotation cycle to 25 years with
only a minimal increase in its electric rate. Shorter rotation cycles would have
required greater rate increases, but the cooperative could have shortened its rotation
cycle substantially with less than a 5 percent increase. Raising the electric rate also
would have increased the rates of return and the TIER value.
Vol. 31 [2016] 49
Notes
1. “Co-op Facts & Figures,” National Rural Electric Cooperative Association, accessed July 25,
2016, http://www.nreca.coop/about-electric-cooperatives/co-op-facts-figures/.
2. “Electric Programs,” U.S. Department of Agriculture, Rural Development, accessed July 25,
2016, http://www.rd.usda.gov/programs-services/all-programs/electric-programs.
3. “Overview,” National Rural Utilities Cooperative Finance Corporation, accessed July 25, 2016,
https://www.nrucfc.coop/content/cfc/about_cfc/overview.html.
4. “About CoBank,” CoBank, accessed July 25, 2016, http://www.cobank.com/About-CoBank.
aspx.
5. “CoBank Reports Full Year Financial Results for 2015,” CoBank, accessed July 25, 2016, http:
//www.cobank.com/Newsroom-Financials/CoBank-News-Feed-2/2016/March/CoBank-Reports-
Full-Year-Financial-Results-For-2015.aspx.
6. A 2003 survey of distribution cooperatives indicated that 43 percent used the FIFO method
exclusively and an additional 36 percent used FIFO in combination with another method (Capital
Credits Task Force 2005, 41).
7. “Daily Treasury Yield Curve Rates,” U.S. Department of the Treasury, accessed July 25, 2016,
https://www.treasury.gov/resource-center/data-chart-center/interest-rates/Pages/TextView.aspx?
data=yield. The interest rate on new debt is assumed constant over the relevant range. At some
point, when leverage increases (i.e., equity/total assets decreases), the interest rate charged on new
loans may begin to rise as the risk to lenders grows because of the probability of bankruptcy or
default.
8. The ability of the average distribution cooperative to replace 25 percent of its equity is con-
sistent with the range of 10 to 30 percent by which Cooper maintained cooperatives were overcapi-
talized based on 2005 and 2006 data (Cooper 2008, 364–65). However, he did not take into account
limitations on the ability of cooperatives to acquire necessary financing.
9. An analysis of the average power supply cooperative indicated that it would not have been able
to rotate equity during the 2006–11 period. Although its TIER value was 1.58, higher than the 1.25
minimum recommended by Fitch Ratings, the equity level was 14.5 percent, well below the 20
percent usually expected for an A rating (Capital Credits Task Force 2005, 62). Consequently, it
appears that power supply cooperatives on average were not in a good position to replace equity
with term debt.
10. According to the Capital Credits Task Force report (2005, 61), electric cooperatives in 24 states
are subject to some statutory authority over rates. However, Cooper (2008, 342) contended that
cooperative electric rates are regulated in only 13 states and cooperative rates are regulated in a
manner similar to those of investor-owned utilities in only 7 of those states.
11. RUS data on the electric sales and operating revenue of power supply cooperatives necessary
for this type of analysis are not available. A similar analysis of a mid-size power supply cooperative
with a record of not recently retiring capital credits showed that the cooperative could maintain a
50 Journal of Cooperatives
rotation cycle of 25 years with a 1.41 percent rate increase and a rotation cycle of 10 years with a
3.84 percent rate increase (Royer 2015, 275–77).
References
Capital Credits Study Committee. 1976. Final Report and Recommendations. National Rural Elec-
tric Cooperative Association and National Rural Utilities Cooperative Finance Corporation,
Feb.
Capital Credits Task Force. 2005. Capital Credits Task Force Report: A Distribution Cooperative’s
Guide to Making Capital Credits Decisions. Arlington and Herndon, Va.: National Rural Elec-
tric Cooperative Association and National Rural Utilities Cooperative Finance Corporation,
Jan.
Cobia, D.W., J.S. Royer, R.A. Wissman, D.P. Smith, D.R. Davidson, S.D. Lurya, J.W. Mather, P.F.
Brown, and K.P. Krueger. 1982. Equity Redemption: Issues and Alternatives for Farmer Co-
operatives. Washington, D.C.: U.S. Department of Agriculture, ACS Res. Rep. 23, Oct.
Cooper, J. 2008. “Electric Co-operatives: From New Deal to Bad Deal?” Harvard Journal on Leg-
islation 45:335–75.
Eversull, E.E. 2011. Cooperative Financial Profile, 2008. Washington, D.C.: U.S. Department of
Agriculture, RBS Res. Rep. 222, June.
Phillips, C. 2001. “Revisiting Equity Management: The Art of Wise Compromise.” Management
Quarterly 42:24–34.
Rural Utilities Service. 2013. 2011 Statistical Report: Rural Electric Borrowers. Washington, D.C.:
U.S. Department of Agriculture, RUS Info. Pub. 201-1, Apr.
Royer, J.S. 1983. “Financial Impact of Mandatory Equity Programs on Farmer Cooperatives.” Ag-
ricultural Finance Review 43:30–40.
———. 1993. “Patronage Refunds, Equity Retirement, and Growth in Farmer Cooperatives.” Ag-
ricultural Finance Review 53:42–54.
———. 2015. “An Equity Management and Planning Tool for Cooperatives.” Agricultural Finance
Review 75:267–81.