
Assessing Learning and Innovation Skills
49
Panel Presentation: Assessing Learning and Innovation Skills At the May 2013 quarterly Governing Board meeting, members engaged in a “blue sky” brainstorming session to explore topics the Board and NAEP might pursue. Among the ideas presented was one that focused on whether NAEP should examine how to measure 21 st Century Skills, which are sometimes referred to as learning and innovation skills, work readiness skills, and other titles. In August 2013, Board members discussed several of the “blue sky” ideas in more depth. To provide additional background information on measuring 21 st century skills, it was suggested that a panel of experts present information on the latest research and work in this area. On Friday December 6, Chairman Driscoll will moderate a panel discussion on the assessment of learning and innovation skills (a.k.a. 21 st Century Skills). The panel members are listed below. Biographical inform Steven Paine, Partnership for 21 ation and background m • Century Skills aterials are included on the following pages. • st • Martin West, Harvard Graduate School of Education • Deirdre Knapp, Human Resources Research Organization (HumRRO) James Pellegrino, University of Illinois at Chicago
Transcript of Assessing Learning and Innovation Skills

Panel Presentation: Assessing Learning and Innovation Skills At the May 2013 quarterly Governing Board meeting, members engaged in a “blue sky” brainstorming session to explore topics the Board and NAEP might pursue. Among the ideas presented was one that focused on whether NAEP should examine how to measure 21st Century Skills, which are sometimes referred to as learning and innovation skills, work readiness skills, and other titles. In August 2013, Board members discussed several of the “blue sky” ideas in more depth. To provide additional background information on measuring 21st century skills, it was suggested that a panel of experts present information on the latest research and work in this area. On Friday December 6, Chairman Driscoll will moderate a panel discussion on the assessment of learning and innovation skills (a.k.a. 21st Century Skills). The panel members are listed below. Biographical informSteven Paine, Partnership for 21ation and background m
• Century Skills aterials are included on the following pages.
• st
•
Martin W est, Harvard Graduate School of Education •
Deirdre Kn app, Human Resources Research Organization (HumRRO) James Pellegrino, University of Illinois at Chicago
Dr. Steven Paine is President of the Partnership for 21st Century Skills. A consummate life-long educator, Dr. Paine has held numerous positions of leadership in the private and public sectors. Prior to joining P21, he served as Senior Advisor to the McGraw-Hill Education Research Foundation and as Senior level Vice President for CTB/McGraw-Hill, the assessment company within McGraw-Hill Education.
From July, 2005 to January, 2011, he served as West Virginia’s 25th state superintendent of schools. Under his leadership, West Virginia was internationally and nationally recognized for its 21st century learning program entitled Global21: Students deserve it. The world demands it. Led by Paine, West Virginia transformed the rigor and relevance of its public school instructional program with the goal of providing all West Virginia children the skills that would enable them to excel in a fiercely competitive global world. West Virginia's Global21 program specifically focused on the development of internationally rigorous and relevant curriculum standards; a balanced assessment strategy; research and performance based instructional practices; an accountability system based on multiple measures of student performance; aligned teacher preparation and professional development programs; establishment of a 21st century leadership development continuum; emphasis on high quality pre-K programs; and integration of technology tools and skills in every classroom.
While state superintendent, Dr. Paine was active in national education policy discussions as past president and board member of the Council of Chief State School Officers, as a member of the National Commission on Teaching and America's Future (NCTAF) Board of Directors and as a member of the National Assessment Governing Board and High School Readiness Commission.
He joined the West Virginia Department of Education in 2003 as the Deputy State Superintendent of Schools after serving as Superintendent of Morgan County Schools in West Virginia. He has also served as principal, assistant principal, teacher, and curriculum director in Upshur and Harrison County School Systems. As a result of his work as principal, he was named a recipient of the prestigious Milken Family Foundation National Educator Award. Dr. Paine is concurrently serving as the Chief Academic Officer for Engrade, an education technology company based in Santa Monica, California.
Dr. Paine earned his undergraduate degree from Fairmont State University, in Fairmont, West Virginia. He furthered his education by attending West Virginia University in Morgantown, West Virginia, where he received his master’s degree in educational administration and his doctorate in educational leadership and curriculum and instruction.
1
Steven Paine
1 Massachusetts Avenue NW, Suite 700 ▪ Washington, DC 20001 (202) 312-6429 ▪ www.p21.org
2
Key P21 Resources
• P21 Common Core Toolkit www.P21.org/P21Toolkit
• Assessment of 21st Century Skills http://www.p21.org/storage/documents/Assessment092806.pdf
• P21 Mile Guide: Milestones for Improving Learning & Education http://www.p21.org/our-work/resources/for-educators/800
Executive Summaries of P21 Surveys
• AMA 2012 Critical Skills Survey http://www.amanet.org/uploaded/2012-Critical-Skills-Survey.pdf
• Key Findings: Are They Really Ready To Work? 2006 Survey http://www.p21.org/storage/documents/key_findings_joint.pdf
• Voter Attitudes on 21st Century Skills http://www.p21.org/storage/documents/P21_pollreport_singlepg.pdf

Martin West is Associate Professor of Education at the Harvard Graduate School of Education, Deputy Director of the Harvard Kennedy School’s Program on Education Policy and Governance, and Executive Editor of Education Next, a journal of opinion and research on education policy. His research examines the effects of education policy choices on student achievement and non-cognitive skills, as well as the politics of American education. His current projects include a federally-funded randomized trial of the use of interim assessment data to improve instruction and studies of the causal effect of grade retention on educational attainment, charter school impacts on cognitive and non-cognitive skills, and the views of teachers and the general public on education policy. West is currently on leave to work as Senior Education Policy Advisor to the ranking member of the Senate Committee on Health, Education, Labor, and Pensions. He has also taught at Brown University and served as a research fellow in Governance Studies at the Brookings Institution, where he is now a Non-resident Senior Fellow. A 1998 graduate of Williams College, he received his M.Phil. in Economic and Social History from Oxford University in 2000 and his Ph.D. in Government and Social Policy from Harvard in 2006.
Martin West
3

Promise and Paradox:
Measuring Non-Cognitive Traits of Students and the Impact of Schooling
Martin R. West, Harvard Graduate School of Education
Matthew A. Kraft, Brown University
Chris Gabrieli, Mass2020
Angela L. Duckworth, University of Pennsylvania
November 2013
Draft – Please do not cite or circulate without permission.
Abstract
We used surveys to gather information on a broad set of non-cognitive traits from 1,368 8th-grade students attending Boston public schools and linked this information to administrative data on their demographics and test scores. Scales measuring students’ Conscientiousness, Self-control and Grit are positively correlated with test-score growth between 4th- and 8th-grade. Yet students who attend over-subscribed charter schools with higher test-score growth score lower, on average, on these scales than students attending district schools. Exploiting admissions lotteries, we replicate previous findings indicating positive impacts of charter school attendance on math achievement but find negative impacts on these non-cognitive traits. We provide suggestive evidence that this paradoxical result is an artifact of reference bias, or the tendency for survey responses to be influenced by social context. Our results therefore highlight the importance of improved measurement of non-cognitive traits in order to capitalize on their promise as a tool for informing education practice and policy.
4

Introduction
Recent evidence from economics and psychology highlights the importance of traits other
than general intelligence for success in school and in life (Almlund et al. 2011; Borghans et al.
2008; Moffitt et al. 2011). Disparities in so-called non-cognitive skills appear to contribute to the
academic achievement gap separating wealthy from disadvantaged students (Evans and
Rosenbaum, 2008). Further, non-cognitive skills may be more malleable than cognitive ability,
particularly beyond infancy and early childhood (Borghans et al. 2008; Cunha and Heckman
2009). Understandably, popular interest in measuring and developing students’ non-cognitive
skills has escalated (see, e.g., Tough 2012).
Non-cognitive is, of course, a misnomer. Every psychological process is cognitive in the
sense of relying on the processing of information of some kind. Characteristic patterns of
attending to and interpreting information underlie many if not most personality traits (Bandura
1999; Mischel and Shoda 1999). Moreover, emotion and personality certainly influence the
quality of one’s thinking (Baron 1982) and how much a child learns in school (Duckworth and
Seligman 2005).
Why, then, does the term non-cognitive persist? Cognitive in this context is shorthand for
cognitive ability and knowledge, constructs that can be validly measured by standardized
intelligence and achievement tests. Non-cognitive, therefore, has become a catchall term for
skills and traits not captured by assessments of cognitive ability and knowledge. Many educators
prefer the umbrella term “social and emotional learning,” whereas some psychologists and
philosophers embrace the moral connotations of “character” and “virtue.”
Educators are increasingly interested in developing students’ non-cognitive skills in
support of academic success and long-term life outcomes. For example, several high-performing
5

charter management organizations have implemented comprehensive discipline systems aimed at
molding student behavior in school and beyond (e.g. homework completion) in pro-social and
pro-academic directions (Lake et al. 2012). KIPP Academies goes so far as to issue a regular
“Character Report Card” for each student that tracks the development of various non-cognitive
skills. Related efforts include the movement to address social and emotional learning needs of
students alongside traditional academic goals (Durlak et al. 2011). One indication of this
movement’s growing policy influence is the U.S. Department of Education’s August 2013
approval of waiver of federal accountability requirements requested by a consortium of eight
school districts known as the California Office to Reform Education (CORE). The CORE
districts, which collectively serve more than one million students, proposed a new school
accountability metric that weights achievement test outcomes as only 60 percent of overall
performance, with the balance assigned evenly to measures of school climate and student social-
emotional development.
As practice and policy race forward, however, research on the measurement of non-
cognitive traits remains in its infancy. There is little agreement on which non-cognitive traits are
most important and limited evidence on their relative malleability. There are neither widely
accepted standards for the application of extant measures nor evidence on their susceptibility to
gaming if used for high-stakes purposes. Absent consensus on these points, educators cannot rely
on available measures of non-cognitive traits or their underlying theories of personal
development to assess and support individual students or to evaluate the success of schools,
teachers, or interventions. As if to illustrate this dilemma, the CORE waiver request noted only
that the specific social-emotional measures to be incorporated into school evaluations would be
determined at a later time.
6

In this paper, we draw on cross-sectional data from an unusually large sample of students
in the city of Boston to examine the strengths and limitations of extant survey-based measures of
four prominent non-cognitive traits as tools for practice and policy. We used survey instruments
to gather self-reported information on non-cognitive traits from a sample of more than 1,300 8th-
grade students across a wide range of the city’s public schools and linked this information to
administrative data on the students’ demographics and test score performance. The schools
attended by students in our sample included both open-enrollment public schools operated by the
local school district and over-subscribed charter schools that have been shown to have large
positive impacts on student achievement as measured by state math and English language arts
tests (Abdulkadiroglu et al. 2011; Angrist et al. 2013).
The non-cognitive traits we measured and focus on in this paper include
Conscientiousness, Self-Control, Grit, and Implicit Theory of Intelligence (ITI). Of the many
non-cognitive traits that psychologists have studied, Conscientiousness and Self-Control have
arguably the strongest evidence of predictive power over long-term outcomes even when
controlling for cognitive skills and demographics (Almlund et al. 2011). We also consider two
newer measures, Grit and ITI, because of their current salience among educators seeking to
influence non-cognitive traits to support immediate academic success and long-term life
outcomes. Grit refers to the tendency to sustain interest in and effort toward very long-term goals
(Duckworth et al. 2007), while ITI is a measure of students’ academic mindset – in particular the
extent to which they believe that their academic ability can improve with effort, rather than being
fixed by factors outside of their control (Blackwell et al. 2007).
Our results highlight both the potential value of these measures in explaining the
proximate outcome of academic success and a less discussed paradox that may be inherent to
7

many available measures of non-cognitive traits. The promise is illustrated by the fact that the
non-cognitive traits we measure through student self-reports are generally correlated with both
the level at which students perform on standardized tests and the growth in their test scores over
the previous four years. The paradox is illustrated by the fact that differences in the mean levels
of three of the four non-cognitive traits between district and charter schools are in the opposite
direction of what would be expected based on these student-level correlations. Students who
attend over-subscribed charter schools score lower, on average, on measures of
Conscientiousness, Self-Control, and Grit than students attending open-enrollment district
schools. Exploiting data from the admissions lotteries for these schools, we replicate previous
findings indicating positive impacts of charter school attendance on math achievement within the
students in our sample but find large and statistically significant negative impacts on these non-
cognitive traits. This pattern is especially puzzling in light of the emphasis the over-subscribed
charter schools in our study place on behavior management and character development as a
means to foster academic success (Angrist et al. 2013; Seider 2012).1
Two competing hypotheses could explain this paradox. One is that the measures of non-
cognitive traits are accurate and that the charter schools, contrary to their goals, and despite their
success in raising test scores, reduce students’ non-cognitive abilities along crucial dimensions
such as Conscientiousness and Self-Control. An alternative hypothesis is that the measures, all
self-reported by students, are misleading because they are prone to reference bias – the tendency
for survey responses to be influenced by the context in which the survey is administered. We
find suggestive evidence supporting this alternative hypothesis, highlighting the importance of
1 In contrast with these outcomes, we find that students in over-subscribed charter schools score higher on ITI. Our lottery-based analysis, however, shows no effect of charter school attendance on ITI.
8

improved measurement of non-cognitive traits in order to capitalize on their promise as a tool for
informing education practice and policy.
Measurement of Non-Cognitive Traits and the Perils of Reference Bias
Recognition of the importance of non-cognitive traits has, with few exceptions, preceded
the development of valid and reliable measures thereof. Whereas performance tasks to assess
how well children can read, write, and cipher are widely available, non-cognitive skills are
typically assessed using self-report and, less frequently, informant-report questionnaires. Like
standardized achievement tests, questionnaires have the advantage of quick, cheap, and easy
administration.
Like all measures, questionnaires have limitations. Most obviously, questionnaires are
subject to social desirability bias (to seem more attractive to observers or to oneself) and faking.
When endorsing a survey item such as “I am a hard worker” a child (or her teacher or parent)
might be inclined to choose higher ratings. To the extent that social desirability bias is uniform
within a population under study, it can alter the absolute level of individual responses but not
their rank order. If some individuals are more influenced by social pressure than others, however,
their relative placement within the overall distribution of responses can change.
Less obvious but possibly more pernicious is reference bias, or the extent to which
responses are influenced by implicitly held standards of comparison. When considering whether
“I am a hard worker” should be marked “very much like me,” a child must conjure up mental
image of “a hard worker” to which she can then compare her own habits. A child with very high
standards might consider a hard worker to be someone who does all of her homework, well
before bedtime and, in addition, organizes and reviews all of her notes from the day’s classes.
9

Another child may consider a hard worker to be someone who attempts to bring home her
assignments, even if most of them remain unfinished by the next day.
Reference bias was first documented in cross-cultural psychology, and, indeed, culturally
shared standards are a primary influence on implicit standards of comparison. In studies of
distinct ethnic groups, cultural experts have often drawn conclusions which were not borne out
by self-report questionnaires. For instance, self-report questionnaires of values (e.g., living an
exciting life, honoring parents and elders, respect for tradition) by Chinese and Americans hardly
converge with judgments by cultural experts (Peng, Nisbett, & Wong, 1997). Likewise, among
56 nations in a cross-cultural study of self-reported personality, East Asian countries including
Japan, China, and Korea rated far lower in conscientiousness than any other region (Schmitt et
al., 2007). In a separate cross-cultural study by Heine et al. (2008), self-reported
conscientiousness at the country level (i.e., the average self-reported conscientiousness rating for
citizens of a particular country) was inversely correlated with several objective proxies for
conscientiousness, including postal workers’ speed, accuracy of clocks, walking speed, and
longevity.
The cultural heterogeneity of the United States allows similar reference bias effects to
operate within the same country. In fact, some evidence for reference group bias among
American students already exists. Naumann and John (2013) found that European-American
undergraduates at UC Berkeley rated themselves higher in conscientiousness than did their
Asian-American classmates, despite earning lower GPAs. The paradoxical finding disappeared
when both groups are asked to complete the same questions with an explicit referent group of
“typical Asian-American Berkeley student.”
10
Other than ethnicity, what are likely influences on implicit frames of reference? Because
children (like adults) are far from omniscient, unable to see the full distribution of human
functioning, their peer groups and other aspects of their social context are likely to shape how
they evaluate themselves when considering statements such as “I am a hard worker.” It follows
that the environment of the school in which they spend much of their waking lives could exert a
powerful influence on students’ perspectives on their own attributes. At a low-performing
school, where the implicit standard for “hard worker” may be considerably more lax than at a
high-performing school, reference bias might even be so severe as to reverse the expected pattern
of student responses.
Data and Measures Sample To shed light on the extent to which survey-based measures of key non-cognitive traits
are subject to reference bias in a policy-relevant setting, we collected data from a large sample of
8th-grade students attending 32 of the 49 public schools in the city of Boston with an 8th-grade
cohort in the spring semester of the 2010-11 school year. The schools that agreed to participate
in the study included 22 open-enrollment district schools, 5 over-subscribed charter schools, 2
test-in exam schools, and 3 charter schools which were not over-subscribed at the time the
students in our study entered middle school. Within those schools, we sampled all students for
whom we were able to obtain parental consent to participate in the study and who were in
attendance on the day we collected our data.
We obtained school enrollment and demographic information, data on attendance and
suspensions, and math and ELA test scores on the Massachusetts Comprehensive Assessment
11

System (MCAS) for the students in our sample from databases maintained by the Massachusetts
Department of Elementary and Secondary Education. MCAS scores were standardized to have
mean zero and unit variance by grade, subject, and year across all tested students in
Massachusetts. We limit our analysis to the 1,368 of a total of 1,852 students who participated in
the non-cognitive data collection for whom a MCAS math and ELA scores were available in
2007 (when most students were in 4th grade) and 2011, making it possible to track their academic
progress and school enrollment since they entered middle school.
Table 1 compares the demographic characteristics and academic indicators of students in
our analytic sample to those of all 8th-grade students attending public schools in Boston, as well
as to those of 8th-graders attending schools participating in the study. The demographic
characteristics of sampled students are quite similar to those of all 8th-grade students attending
public schools in the city and to those of 8th-graders attending the same schools. However, the
8th-grade test scores of sampled students are 0.26 standard deviations and 0.19 standard
deviations higher in math and ELA, respectively. Comparing the test scores of the sampled
students to those of 8th-graders attending the same schools reveals that more than half of this
difference reflects positive selection into the study sample within participating schools.
Much of our analysis focuses on comparisons between sampled students attending open-
enrollment district and over-subscribed charter schools. Looking separately at these two groups
of schools, we see that this positive selection with respect to academic indicators is somewhat
more pronounced within the district schools. Specifically, the 8th-grade test scores of sampled
students in district schools exceeded those of all students by 0.15 (math) and 0.11 (ELA)
standard deviations, while the analogous differences in the over-subscribed charter schools were
0.05 (math) and 0.01 (ELA). This difference does not appear to stem from substantially higher
12

rates of participation in the study within the charter schools: the share of all 8th-graders
participating in the study was 63 percent in the over-subscribed charter schools, as compared
with 61 percent in the open-enrollment district schools.
Table 1 also reveals that the 8th-grade test scores of sampled students are considerably
higher in the over-subscribed charter schools. The test scores of students in these schools
exceeded the statewide mean by 0.27 (math) and 0.37 (ELA) standard deviations, while students
in open-enrollment district schools trailed the statewide average by -0.69 (math) and -0.33 (ELA)
standard deviations. The students in our sample attending over-subscribed charter schools also
experienced larger gains in test scores (relative to the statewide average) between 4th and 8th
grade, especially in math. Charter students gained 0.72 standard deviations relative to the state
average over those four years, while their district peers lost 0.07 standard deviations. The
difference in ELA gains was less pronounced, with charter and district students making positive
gains of 0.92 and 0.72 standard deviations, respectively. Sampled students in over-subscribed
charter schools were also 10 percentage points more likely to be white, 16 percentage points less
likely to be Hispanic, and 21 percentage points less likely to be eligible for a free or reduced
price lunch than their counterparts in open-enrollment district schools.
Non-cognitive Measures
All students participating in our study completed a battery of surveys designed to
measure their cognitive and non-cognitive abilities along various dimensions. These surveys,
which were administered in the students’ regular classrooms, included questionnaires probing
students’ Conscientiousness, Self-Control, Grit, and ITI that have been validated for adolescents.
After scoring student responses to these questionnaires based on the appropriate rubrics, we then
standardized the scores to have a zero mean and unit variance within our analytic sample.
13

To assess students’ Conscientiousness, we administered the Big Five Inventory (John and
Srivastava 1999), a well-established 44-item questionnaire measuring the “Big Five” personality
traists: Neuroticism, Extraversion, Openness to Experience, Agreeableness, and
Conscientiousness. Students endorsed items (e.g., “I think I am someone who is a reliable
worker”) using a 5-category Likert scale, where 1= strongly disagree and 5 = strongly agree.
Each student’s Conscientiousness score is calculated as the average of their response the 9 items
that comprise the Conscientiousness scale. Among the students in our data, this Conscientious
scale had an internal reliability of 0.76.
Our Self-Control scale is based on an 8-item questionnaire developed to measure school-
age students’ impulsivity (its obverse), which is defined as “inability to regulate behavior,
attention, and emotions in the service of valued goals, impulsivity” (Tsukayama et al. 2013).
This questionnaire asked students to indicate how often during the past school year they
exhibited each of a set of behaviors indicative of a lack of self-control, with 5 response options
ranging from “almost never” to “at least once a day.” Importantly, the use of response categories
specifying objective, discrete time periods was motivated by a desire to “avoid reference bias” in
students’ responses (Tsukayama et al. 2013, p. 881). The questionnaire included 4 items
measuring inter-personal self-control (e.g., “I interrupted other students while they were
talking”) and 4 items measuring intra-personal self-control (e.g., “I forgot something I needed for
class”). We calculated an overall Self-Control score for each student as the average of their
(reverse-coded) responses to all 8 items. This scale had an internal reliability of 0.83.
Students also completed the 8-item Short Grit Scale (Grit-S) developed by Duckworth
and Quinn (2009) to measure trait-level persistence toward long-term goals.2 Students endorsed
2 Duckworth and Quinn (2009) demonstrate that adolescents’ Grit-S scores predict future GPA independently of IQ and are inversely related to the number of hours of television watched.
14

a series of items (e.g., “New ideas and projects sometimes distract me from old ones” and “I
finish whatever I begin”) using a 5-category Likert Scale, where 1 = not like me at all and 5 =
very much like me. Student’s Grit score was then calculated as their mean response across all 8
items. This scale had a somewhat lower internal reliability among the students in our sample than
our Conscientiousness and Self-Control scales (0.64).
Finally, to probe students’ Implicit Theory of Intelligence, we administered a set of 3
items measuring the extent to which students view intelligence as a fixed trait rather than one
which can improved with effort (Dweck, 1999). For example, students were asked to rate their
agreement with the claim that “You have a certain amount of intelligence, and you really can’t
do much to change it.” Following Blackwell et al. (2007), we used a 6-category Likert scale,
where 1 = strongly disagree and 6 = strongly agree. After reverse coding, we calculated each
student’s mean response across these three items to create a scale with an internal reliability of
0.86. Following recent work (see, e.g., Yeager et al. 2013), we refer to this scale as measuring
the extent to which students have a Growth Mindset (as opposed to a Fixed Mindset).3
Student Perceptions of School Climate
The battery of surveys students completed also included a set of 10 items probing the
disciplinary climate at their school. These items were drawn from a survey developed over the
past decade by Ron Ferguson and the Tripod Project for School Improvement to measure various
aspects of school or classroom climate. Each item asked students to respond to a descriptive
statement about their school using a 5-category Likert scale, where 1 = totally untrue and 5 =
totally true. The overall set included two items on each of five dimensions of school climate:
High Expectations (e.g., “Teachers at this school demand that students work hard”); Teacher
3 Blackwell et al. (2007) show that adolescent students who exhibit a Growth Mindset have significantly higher rates of math test score growth than students who view intelligence as fixed.
15

Strictness (e.g., “Teachers are very strict here”); Clear Rules (e.g., “Students understand what
will happen to them if they break a rule”); Negative Peer Effects (e.g., “In this school, some
students try to keep others from working hard”); and Student Input (e.g., “Students in this school
have a say in how things work”). We use the average of each student’s responses to the two
items within each pair as a measure of his or her perception of the relevant aspect of the school’s
climate.
Achievement Gains
We also used our administrative data to estimate measures of each student’s test score
growth in math and English language arts between 4th- and 8th-grade. Specifically, we regressed
students’ 8th-grade MCAS test scores in the relevant subject on a cubic polynomial of their 4th-
grade test scores in both subjects and calculated the residual from that regression for each
student. We use these residualized gain scores, which capture the extent to which a student’s 8th-
grade performance in math and English language arts exceeded expectations based on their
performance four years earlier, to examine the relationship between non-cognitive traits and
improvements in test score performance over time.
Results
Correlations of Non-cognitive Traits and Academic Indicators
Table 2 reports student-level Pearson product-moment correlations among the full set of
non-cognitive traits and academic indicators included in our analysis. Given that
Conscientiousness, Self-Control, and Grit are closely related constructs, it is unsurprising that
they are highly inter-related, with correlations ranging from .43 to .66. Growth Mindset is also
positively and significantly correlated with each of these measures, but at lower levels ranging
from .08 (Conscientiousness) to .18 (Grit).
16

Among these four non-cognitive measures, Growth Mindset is most strongly related to
test score levels in 8th grade (r = 0.32 in math; r = .36 in ELA). Self-Control is also significantly
related to test scores, but the correlations are .13 in math and .10 in ELA. The correlations
between both Conscientiousness and Grit and test score levels are positive but small and
statistically insignificant.
Of greater interest are the relationships between the non-cognitive measures and
residualized test score gains, which measure students’ academic progress relative to expectations
based on their performance in 4th grade. Each of the four non-cognitive measures is positively
correlated with test score gains in both math and ELA; all of these correlations except that
between Self-Control and ELA gains are statistically significant. The relationships are strongest
for Growth Mindset, which has correlations with test score gains of .21 and .17 in math and
ELA, respectively.
There is also some evidence that these non-cognitive measures are related to suspensions
and absences, the two behavioral indicators available in our administrative data. All four non-
cognitive measures are negatively correlated with the total number of suspensions or absences a
student accumulated in 8th grade. Those correlations that are statistically significant include Self-
Control with both suspensions (-.14) and absences (-.12), Grit with suspensions (-.12), and
Growth Mindset with absences (-.10).
Mean Non-cognitive Traits and Academic Indicators by School Type
Table 3 compares the mean test-score gains and non-cognitive traits for students
attending the 22 open-enrollment district and 5 over-subscribed charter schools included in our
sample. Consistent with the descriptive statistics in Table 1, mean residualized test score gains
between 4th and 8th grade are higher among students attending charter schools. The differences
17
are substantial, at 0.72 standard deviations in mathematics and 0.42 standard deviations in ELA,
though it is important to note that they could reflect the selection of students into the application
process for over-subscribed charter schools rather than differences in school quality.
Despite the fact that sampled students attending charter schools experienced larger test
score gains than sampled students in district schools, the same students exhibit markedly lower
levels of Self-Control as measured by student self-reports. This statistically significant difference
of -0.23 standard deviations is in the opposite direction of that expected based on the positive
student-level correlations between Self-Control and achievement gains evident in Table 2. The
differences between the charter and district students in Conscientiousness (-0.09) and Grit (-
0.13), although statistically insignificant, run in the same counter-intuitive direction.
Interestingly, the difference in mean Growth Mindset between charter school and district school
students follows a different pattern than the other three non-cognitive traits. Charter school
students score 0.38 standard deviations higher, on average, which is consistent with the student-
level correlation between Growth Mindset and test score gains within the sample as a whole.
Lottery-Based Estimates of the Effect of Charter School Attendance
Simple comparisons of the outcomes of students attending charter and traditional public
schools, such as those presented in Table 3, capture both any effects of attending a charter school
on those outcomes and selection into charter schools based on characteristics correlated with the
outcome. Although over-subscribed charter schools must admit students via lottery, applicants
who seek to enroll in an academically demanding charter school are likely to differ from those
who do not along both observed and unobserved dimensions. To better isolate the causal effect
of attendance at the five over-subscribed charter schools represented in our sample, we exploit
the lottery admissions process to these schools to restrict our analysis to students who entered the
18

admissions lottery of one or more of the over-subscribed charter schools and compare those
students who were randomly offered admission to those who were not.
We acquired records from the lotteries used to admit the students in our sample directly
from the charter schools and matched these records to state administrative data on all public
school students using names, year, and grade of application. Of 702 verified lottery participants
(481 of whom were offered a seat in one or more of the five schools), 497 appeared in the
administrative data and had valid demographic data and test scores for both subjects in 2007 and
2011. A smaller subset of 200 students met those requirements and participated in the non-
cognitive data collection. Although we can produce lottery-based estimates of charter school
impacts on non-cognitive traits only in the latter sample, we present estimated impacts on test
scores for both groups in order to be able to compare the results. To the extent that our estimated
impacts on test scores are similar across the two groups, this should reduce concerns that our
results are biased due to non-random sampling of successful and unsuccessful applicants.
Table 4 examines whether the demographic characteristics and 4th-grade test scores of
students offered and not offered a seat in a charter school were balanced within these two
subsamples of lottery participants. We first note that within both subsamples the share of
applicants who were offered a seat (32 percent in the administrative data sample and 29 percent
in the non-cognitive sample) is very similar to the share among all lottery applicants (31
percent). F-tests nonetheless reveal that students’ observed characteristics are jointly significant
predictors of whether they were offered a seat in a charter school in both subsamples.
In the larger sample of students matched to the administrative data, students receiving an
offer are significantly more likely to be male and eligible for a free or reduced price lunch. The
4th-grade test scores of students offered a seat are also modestly lower in both math and ELA,
19

though these differences are not statistically significant. Within the smaller non-cognitive
sample, the differences in 4th-grade test scores are substantial in both subjects and marginally
statistically significant in math (p<0.09). These differences, which favor students not offered a
charter school seat, may reflect the fact that positive selection into the non-cognitive sample was
less pronounced in over-subscribed charter schools (see Table 1). Given the imbalances between
students offered and not offered a seat in a charter in both samples, we control for students’
observed characteristics throughout our lottery-based analysis of the effects of charter school
attendance.
Following (Abdulkadiroglu et al. 2011), we implement the lottery-based analysis via a
Two Stage Least Squares (2SLS) regression model in which we first predict charter attendance
for each student based on whether they were offered admission and use those predictions to
generate an estimate of the effect of charter attendance on our outcomes of interest. The first-
stage model is:
𝑌𝐸𝐴𝑅𝑆𝑖 = 𝛾𝑐𝑂𝐹𝐹𝐸𝑅𝑖𝑐 + 𝜃𝐴𝑖,𝑡−4 + 𝜏𝑋𝑖+�𝜌𝑗𝑑𝑖𝑗𝑗
+ 𝜉𝑖𝑠
where 𝑌𝐸𝐴𝑅𝑆𝑖 measures the number of years between 5th and 8th grade student i attended an
over-subscribed charter school and 𝑂𝐹𝐹𝐸𝑅𝑖𝑐 represents a vector of dummy variables indicating
that the student was or was not offered a seat at over-subscribed charter school c. We include as
controls a cubic polynomial of lagged 4th-grade scores in math and ELA (𝐴𝑖,𝑡−4) and a vector of
student demographic characteristics (𝑋𝑖,) including gender, race, age, free and reduced-priced
lunch status, limited English proficiency, and special education status. The set of indicator
variables 𝑑𝑖𝑗 controls for lottery “risk sets,” or the unique combination of lotteries to which each
student applied, indexed by j.
20

Within the administrative data sample, students offered a seat in at least one of the five
over-subscribed charter schools spent 2.1 years between 5th and 8th grade in one of those schools,
as compared with 0.39 years of charter attendance among students not initially offered a seat.
Among students in the non-cognitive sample, students offered and not offered a seat spent 2.4
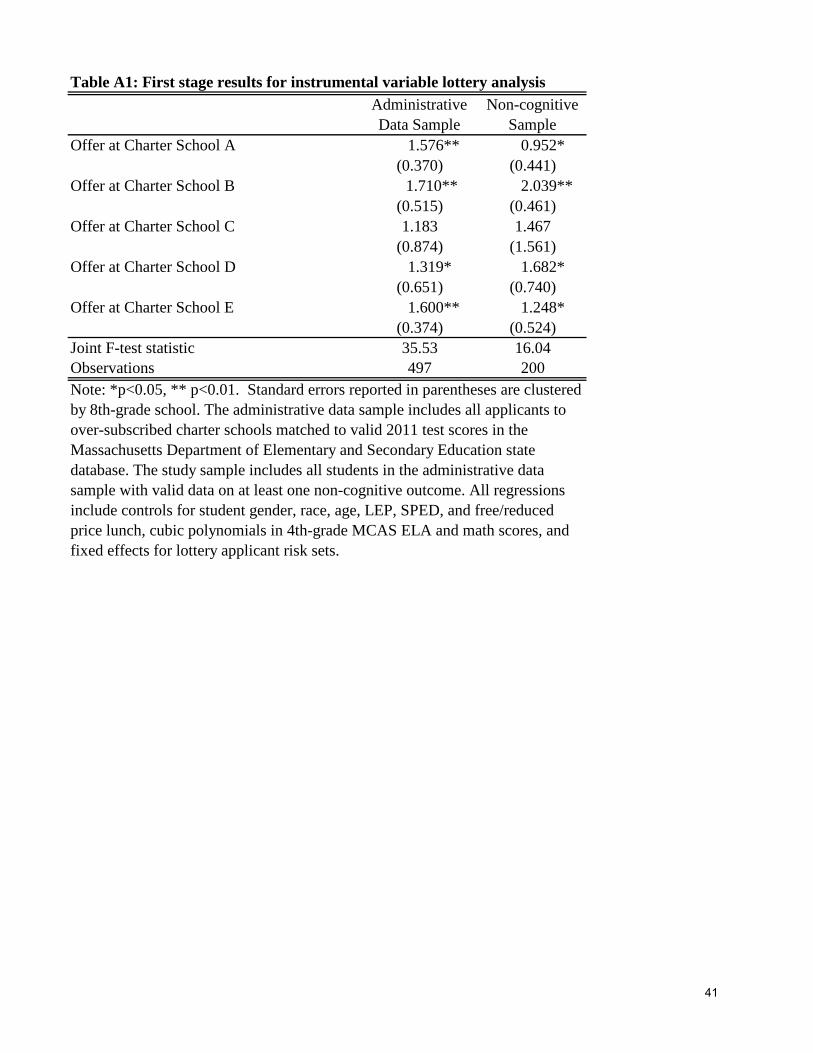
and 0.6 years in charter schools, respectively. Appendix Table A2, which presents the first-stage
regression results, confirms that the 𝑂𝐹𝐹𝐸𝑅𝑖𝑐 indicators are relevant instruments for predicting
variation in years of attendance, with joint F-test statistics of 35.5 and 16.0 for the administrative
data and non-cognitive samples, respectively.
We implement the second stage of our 2SLS model as follows:
𝑌𝑖𝑠 = 𝛽𝑌𝑒𝑎𝑟𝑠� 𝑖+ 𝛼𝐴𝑖,𝑡−4 + 𝜆𝑋𝑖 + �𝛿𝑗𝑑𝑖𝑗𝑗
+ 𝜖𝑖𝑠
where 𝑌𝑖𝑠 represents a given test score or non-cognitive outcome for student i in school s,
𝑌𝐸𝐴𝑅𝑆� 𝑖𝑠 captures each student’s predicted years of charter attendance based on the first-stage
regression, and all other variables are as above. Parameter 𝛽 represents the quantity of interest:
the effect of one year’s attendance at one of the five over-subscribed charter schools.
Table 5 presents the results. Consistent with Abdulkadiroglu et al. (2011), the first two
columns show that, among the students in the administrative data sample, each additional year of
charter attendance is estimated to increase 8th-grade math scores by 0.14 standard deviations. The
estimated effect for ELA scores is positive and of non-negligible magnitude, but too imprecisely
estimated to achieve statistical significance. We replicate these analyses in our non-cognitive
sample and find very similar point estimates in both math and ELA; the math effect is
statistically significant at the p< 0.1 confidence level. The similarity of results across the two
samples suggests that our lottery-based effect estimates on non-cognitive skills are unlikely to
21

suffer from substantial biased due to non-random sampling of students who participated in our
non-cognitive data collection.
Within that sample, we estimate that one year’s attendance at an over-subscribed charter
school had a statistically significant negative effect on students’ self-reported Conscientiousness,
Self-Control, and Grit. The estimated effect sizes are in the opposite direction of the achievement
effects and of similar or even larger magnitude, ranging between -0.117 (Grit) and -0.212 (Self-
Control) standard deviations. These results are consistent with the descriptive patterns in Table 3,
which show students in over-subscribed charter schools making larger achievement gains despite
lower scores on these non-cognitive measures, and suggest that those patterns are not due merely
to selection. Rather, it would appear that attending one of these charter schools adversely affects
students’ non-cognitive abilities along these dimensions as assessed by self-reports. We discuss
our interpretation of this unexpected finding in detail below.
Intriguingly, we estimate a near zero effect of attending an over-subscribed charter
schools on the degree to which a student in our non-cognitive sample has a Growth Mindset,
despite the fact that Table 3 showed students in over-subscribed charter schools scoring notably
higher on this measure. The null result for this outcome in the lottery analysis suggests that the
descriptive difference favoring charter schools may be an artifact of selection. In other words, it
may be that students who believe that their intelligence can be improved with effort are more
likely to seek out a school with a demanding environment, but that attendance at such a school
has no causal effect on their implicit theory of intelligence.
Longitudinal Trends in Non-Cognitive Traits
We supplement our lottery analysis with longitudinal measures of students’ non-cognitive
traits among a cohort of students who attended two over-subscribed charter schools and one
22

open-enrollment district school. Starting in fall 2009, we administered a similar battery of non-
cognitive measures to the entering student cohorts at three middle schools. We then re-
administered these batteries at the end of that school year and the two that followed. One of the
charter schools and the district school are both included in our larger study sample, while the
second charter school is located in another school district but shares a similar academic and
disciplinary orientation to the over-subscribed charters in our sample.
In Table 6, we present average scores for the 2009 entering cohort of students in each
school for whom we have complete data across four time points.4 Consistent with our lottery-
based estimates of the negative effects of attending a charter school on non-cognitive skills as
assessed by self-reports, we observe a steady decline in students’ Conscientiousness, Self-
Control, and Grit. Among students attending the district school, scores on these scales decline at
a more moderate pace; in two cases, the changes between the first and final time points are not
statistically significant. Also consistent with our lottery-based estimates, we observe a gradual
increase in Growth Mindset among oversubscribed charter school students which is mirrored by
a similarly large increase among students at the district school.
Evidence of Reference Bias
The results presented thus far contain divergent evidence concerning the relationship
between non-cognitive traits and achievement gains among the 8th-grade students in our sample,
particularly with respect to the related constructs of Conscientiousness, Self-Control, and Grit.
Student-level correlations indicate significant positive correlations between these non-cognitive
traits and test score growth – a pattern consistent with a large body of research using the same or
similar measures. However, we find that students in over-subscribed charter schools with large
positive impacts on student test scores rate themselves more critically along each of these
4 Appendix Table A2 reports the same averages using all available data; the patterns are substantively identical.
23

dimensions. Our lottery-based analysis indicates that these same charter schools have large
negative “effects” on students’ self-reported levels of Conscientiousness, Self-Control, and Grit,
suggesting the descriptive findings are not explained by the selection into charter schools of less
conscientious or more impulsive students. It is of course possible that the over-subscribed charter
schools in our sample improve student test scores at the expense of cultivating students’ non-
cognitive capacities in these areas. Yet it is seems more likely that the apparent negative effects
of charter school attendance on these non-cognitive traits are an artifact of reference bias.
We present two additional analyses intended to establish the plausibility of reference bias
as an explanation for these counter-intuitive findings. First, we compare students’ perceptions of
the academic and disciplinary climate in open-enrollment district and over-subscribed charter
schools to see whether those perceptions differ in a way that could influence students’ self-
ratings of their non-cognitive capacities. It could be that students are more likely to use a higher
bar when assessing their own Conscientiousness, Self-Control, and Grit when they attend schools
that establish high expectations for student effort and a “no-excuses” disciplinary culture.
Second, we examine how the strength of the relationship between our non-cognitive measures
and achievement growth changes if we use school fixed effects to limit the analysis to variation
occurring within specific schools. If the environment of the school students attended and in
which they completed our survey influenced their responses so as to produce the counter-
intuitive findings concerning the effects of charter school attendance, the within-school
correlations between non-cognitive measures and achievement growth should be stronger than
the analogous correlations that capture both between- and within-school variation.
Table 7 confirms that students attending over-subscribed charter schools perceive their
schools as having very different academic and disciplinary climates than students attending
24

open-enrollment district schools. Students in over-subscribed charter schools rate the work ethic
expected of students, teacher strictness, and the clarity of rules in their school substantially
higher do students in district schools. For example, charter students’ ratings of High
Expectations exceed those of their district counterparts by 0.57 on the 5-point scale used for
these items, or 63 percent of a standard deviation of district students’ responses. The analogous
differences observed for Teacher Strictness and Clear Rules are of comparable magnitude.
Students in the over-subscribed charter schools also reported substantially lower levels of
Negative Peer Effects and modestly lower levels of Student Input in their schools.
Table 8 in turn confirms that the relationships between Conscientiousness, Self-Control,
and Grit and test score growth among students attending the same school are consistently
stronger than the same relationships across the sample as a whole. For example, the magnitude of
the relationship between Self-Control and test score growth increases by 61 percent in math and
93 percent in ELA. Importantly, the same pattern is not evident for Growth Mindset, the one
non-cognitive measure in which we did not find counter-intuitive evidence of adverse effects of
attending an over-subscribed charter school. The relationship between Growth Mindset and test
score growth is essentially unchanged in ELA and becomes weaker in math when between-
school variation is excluded.
Discussion
Generations of parents have sought to instill in their children the virtues of self-discipline,
diligence, and perseverance, and self-discipline. These qualities are at the core of legends and
fables that societies around the world have developed to cultivate the traits most essential for
human flourishing. In recent decades, scholars have begun to confirm this common wisdom by
25

developing measures for these non-cognitive traits and examining their relationship with
children’s success in school and in life. We add to this literature evidence that four prominent
and widely used measures of non-cognitive traits are positively correlated with achievement
gains on standardized tests among a large and diverse sample of 8th-grade students attending
distinctly different types of schools. Measures of Conscientiousness, Self-Control, Grit, and
Growth Mindset were all correlated with math and ELA test score gains from 4th to 8th grade.
Higher non-cognitive ability along the dimensions captured by these measures therefore may
help explain why 8th-grade students score higher or lower than predicted by their 4th-grade
achievement levels.
However, a paradox emerges when we juxtapose these results with two additional
findings: 1) that students in a set of over-subscribed charter schools, where students are
experience large test score gains, report lower average levels of Conscientiousness, Self-Control,
Grit than students in open-enrollment district schools; and 2) that lottery-based analyses of the
causal impact of attending these charter schools indicate negative “effects” on these non-
cognitive traits. How can non-cognitive skills that are positively correlated with test score gains
within our sample have deteriorated among students in schools where they were simultaneously
achieving large test score improvements?
Two competing hypotheses could explain the paradox. One is that these measures are
accurate and that the charter schools’ actions actually reduce students’ non-cognitive abilities
along crucial dimensions such as conscientiousness and self-control. In that case, the academic
gains posted by these schools occur in spite of their negative effects on these non-cognitive
measures.
26

An alternative hypothesis is that these measures, all based on student self-reports, are
misleading because they are prone to reference bias—the tendency for individuals responding to
questionnaires to rate themselves based on the varying localized sample of people with whom
they are familiar, not the broad sample of all respondents to whom their responses are being
compared. Put specifically for these circumstances, students attending academically intense
charter schools may redefine upward their notion of what it means to demonstrate strong self-
control or a conscientious work ethic and thus rate themselves more critically, even if they are in
fact improving on the underlying behavior. In theory, such reference bias could be so severe as to
distort the magnitude of any changes in the underlying traits and even to invert their sign.
We find support for this alternative hypothesis not only in our data set, but also in other
recent evaluations of high-performing charter middle schools. In their recent evaluation of KIPP
Academy middle schools, Tuttle et al. (2013) find large positive effects of attending a KIPP
school on student test scores and time spent on homework, but find no effects on student-
reported measures of self-control and effort or persistence in school and negative effects on
student-reported measures of undesirable behavior. Similarly, Dobbie and Fryer’s (2013) find
that attending the Harlem Promise Academy reduced student-reported Grit despite having
positive effects on test scores college enrollment and negative effects on teenage pregnancy (for
females) and incarceration (for males).5 These parallel findings from research in similar settings
strengthen our conclusion that reference bias provides the most likely explanation for the
unexpected patterns we document.
5 Reference bias also may help explain seemingly paradoxical results in other areas of education research. For example, Robbins et al. (2006), report that first-year students at two-year colleges rate themselves higher in an ACT-developed measure of academic self-discipline that is predictive of college GPA and persistence than do seniors bound for four-year colleges, despite having lower ACT scores, high school GPAs, and subsequent rates of persistence.
27

Conclusion
Our results suggest three things: (1) that existing measures of non-cognitive traits based
on self-reports help to explain important, proximate academic outcomes – test score gains over
the middle school years – beyond what previous test scores predict and therefore show promise
as traits for schools to learn to measure and influence; (2) that schools can have significant, even
if initially surprising, impacts on these measures; and (3) that conclusions about the nature of
those impacts may be misleading due to reference bias. The challenges posed by reference bias
may grow more severe to the extent that schools explicitly work to change students’ traits and
thereby change their reference frames.
Our study has important limitations. First, our evidence of the importance of reference
bias is circumstantial rather than direct. Second, we have documented the potential problem
posed by reference bias without providing a solution to overcome it. In particular, we have not
examined whether teacher or parent ratings of students’ non-cognitive traits may be less prone to
reference bias. Alternative solutions could include the use of anchoring vignettes within surveys
to establish consistent reference points (King et al. 2004) or the development of behavioral
indicators of non-cognitive traits that render reference points irrelevant (Jackson et al. 2010).
Additional research that documents the conditions under which reference bias exists and
validates strategies to address it is critical.
The current policy environment demands accountability, and accountability requires
assessment. In the rush to embrace non-cognitive skills as the missing piece in American
education, policymakers may overlook limitations of extant measures of non-cognitive skills.
Our results raise important questions about the practice of assessing students’ non-cognitive
traits based on the existing instruments that rely on student self-reported data. In particular,
28

studies of the effects of teacher, school, and family influences on non-cognitive skills could lead
to false conclusions if the assessments used are biased by distinct frames of reference. Biased
measures could similarly misguide scientific investigation of non-cognitive skills.
If we are correct that these measures show both promise and peril, it is imperative that the
nascent field of measuring and seeking to improve non-cognitive traits through schooling
develop new, better measures that are less susceptible to reference bias and therefore more likely
to be robust enough to play a constructive role in managing and evaluating students, programs,
and schools. We can and should measure students’ non-cognitive traits, but we should do so in
full recognition of the flaws in our measures.
29

References
Abdulkadiroglu, Atila, Joshua D. Angrist, Susan M. Dynarski, Thomas J. Kane, and Parag A. Pathak. 2011. “Accountability and Flexibility in Public Schools: Evidence from Boston's Charters And Pilots.” Quarterly Journal of Economics 126(2): 699-748.
Almlund, Mathilde, Angela Lee Duckworth, James J. Heckman, and Tim D. Kautz. 2011. “Personality Psychology and Economics.” In Handbook of the Economics of Education. Vol. 4, edited by Eric A. Hanushek, Stephen Machin, and Ludger Woessmann, 1-181. Amsterdam: Elsevier, North-Holland.
Angrist, Joshua D., Parag A. Pathak, and Christopher R. Walters. 2013. “Explaining Charter School Effectiveness.” American Economic Journal: Applied Economics 5(4): 1-27.
Bandura, Albert. 1999. “Social Cognitive Theory of Personality.” In Handbook of Personality
Psychology, 2nd ed., edited by Lawrence A. Pervin & Oliver P. John, 154-196. New York: Guilford Publications.
Baron, Jonathan. 1982. “Personality and Intelligence.” In Handbook of Human Intelligence,
edited by Robert J. Sternberg, 308-351. Cambridge, Cambridgeshire, and New York: Cambridge University Press.
Blackwell, Lisa S., Kali H. Trzesniewski, and Carol Sorich Dweck. 2007. “Implicit Theories of Intelligence Predict Achievement Across an Adolescent Transition: A Longitudinal Study and an Intervention.” Child Development 78(1): 246-263.
Borghans, Lex, Angela Lee Duckworth, James J. Heckman, and Bas ter Weel. 2008. “The Economics and Psychology of Personality Traits.” Journal of Human Resources 43(1): 9722-1059.
Cunha, Flavio and James J. Heckman. 2008. “Formulating, Identifying and Estimating the Technology of Cognitive and Noncognitive Skill Formation.” Journal of Human Resources 43(4): 738-782.
Dobbie, Will and Roland G. Fryer Jr. 2013. “The Medium-Term Impacts of High-Achieving Charter Schools on Non-Test Score Outcomes.” NBER Working Paper No. 19581. Cambridge, MA: National Bureau of Economic Research.
Duckworth, Angela Lee and Martin E. P. Seligman. 2005. “Self-Discipline Outduels IQ in Predicting Academic Performance of Adolescents.” Psychological Science 16(12): 939-944.
Duckworth, Angela Lee, Christopher Peterson, Michael D. Matthews, and Dennis R. Kelly. 2007. “Grit: Perseverance and passion for long-term goals. Journal of Personality and Social Psychology 92(6): 1087-1101.
30

Duckworth, Angela Lee and Patrick D. Quinn. 2009. “Development and Validation of the Short Grit Scale (Grit-S).” Journal of Personality Assessment 91(2): 166-174.
Durlak, Joseph A., Alyson B. Dymnicki, Rebecca Taylor, Roger P. Weissberg, and Kristen B. Schellinger. 2011. “The Impact of Enhancing Students’ Social and Emotional Learning: A Meta-Analysis of School-Based Universal Interventions.” Child Development 82(1): 405-432.
Dweck, Carol. 1999. Self-Theories: Their role in personality, motivation, and development. Philadelphia: Psychology Press.
Evans, Gary W. and Jennifer Rosenbaum. 2008. “Self-Regulation and the Income-Achievement Gap.” Early Childhood Research Quarterly 23(4): 504-514.
Heckman, James, Rodrigo Pinto, and Peter Savelyev. 2013. “Understanding the Mechanisms Through Which an Influential Early Childhood Program Boosted Adult Outcomes.” American Economic Review 103(6): 2052-2086.
Heine, Steven J., Emma E. Buchtel, and Ara Norenzayan. 2008. “What do cross-national comparisons of personality traits tell us? The case of conscientiousness.” Psychological Science 19(4): 309–313.
Jackson, Joshua J., Dustin Wood, Tim Bogg, Kate E. Walton, Peter D. Harms, and Brent W. Roberts. 2010. “What do conscientious people do? Development and validation of the Behavioral Indicators of Conscientiousness (BIC).” Journal of Research in Personality 44(4): 501-511.
John, Oliver P. and Srivastava, S. (1999). The Big Five trait taxonomy: History, measurement, and theoretical perspectives. In L. A. Pervin & O. P. John (Eds.). Handbook of Personality: Theory and Research (2nd ed.) (pp. 102-138). New York: Guilford Press.
King, Gary, Christopher J. L. Murray, Joshua A. Salomon, and Ajay Tandon. 2004. “Enhancing the validity and cross-cultural comparability of measurement in survey research.” American Political Science Review 98(1): 191–205.
Lake, Robin, Melissa Bowen, Allison Demeritt, Moira McCullough, Joshua Haimson, and Brian
Gill. 2012. “Learning from charter school management organizations: Strategies for student behavior and teacher coaching.” Washington DC: Center on Reinventing Public Education and Mathematica Policy Research.
Moffitt, Terrie E., Louise Arseneaultb, Daniel Belsky, Nigel Dicksonc, Robert J. Hancox, HonaLee Harrington, Renate Houts, Richie Poulton, Brent W. Roberts, Stephen Ross, Malcolm R. Searse, W. Murray Thomson, and Avshalom Caspi. 2011. “A Gradient of
31

Childhood Self-Control Predicts Health, Wealth, and Public Safety.” Proceedings of the National Academy of Sciences 108(7): 2693-2698.
Naumann, Laura P. and Oliver P. John. 2013. “Toward a Domain-Specific Approach to Cultural Differences: The Influence of Cultural Values and Reference-Group Standards on Self-Reported Personality.” Unpublished manuscript.
Peng, Kaiping, Richard E. Nisbett, and Nancy Y. C. Wong. 1997. “Validity Problems Comparing Values across Cultures and Possible Solutions.” Psychological Methods 2(4): 329-344.
Robbins, Steven B., Jeff Allen, Alex Casillas, Christina Hamme Peterson, and Huy Le. 2006. “Unraveling the Differential Effects of Motivational and Skills, Social, and Self-Management Measures from Traditional Predictors of College Outcomes.” Journal of Educational Psychology 98(3): 598-616.
Schmitt, David P., Robert R. McRae, and Veronica Benet-Martinez. 2007. “The Geographic Distribution of Big Five Personality Traits: Patterns and Profiles of Human Self-Description across 56 Nations.” Journal of Cross-Cultural Psychology 38(2):173-212.
Seider, Scott. 2012. Character Compass: How Powerful School Culture Can Point Students Toward Success. Cambridge, MA: Harvard Education Press.
Tough, Paul. 2012. How Children Succeed: Grit, Curiosity, and The Hidden Power of Character. New York: Houghton Mifflin Harcourt.
Tsukayama, Eli, Angela L. Duckworth, and Betty Kim. 2013. “Domain‐specific impulsivity in school‐age children.” Developmental Science 16(6): 879-893.
Tuttle, Christina Clark, Brian Gill, Philip Gleason, Virginia Knechtel, Ira Nichols-Barrer,
Alexandra Resch. 2013. “KIPP Middle Schools: Impacts on Achievement and Other Outcomes.” Washington DC: Mathematica Policy Research.
Yeager, David S., Dave Paunesku, Gregory M. Walton, and Carol Dweck. 2013. “How Can We
Instill Productive Mindsets at Scale? A Review of the Evidence and an Initial R&D Agenda.” A White Paper prepared for the White House meeting on Excellence in Education: The Importance of Academic Mindsets.
32

All Students
All Students in Sampled Schools
Sampled Students
All Students in Sampled Schools
Sampled Students
All Students in Sampled Schools
Sampled Students
Male 0.52 0.51 0.47 0.53 0.49 0.43 0.43African-American 0.41 0.40 0.38 0.41 0.39 0.53 0.50White 0.12 0.12 0.13 0.08 0.08 0.17 0.18Asian 0.09 0.07 0.09 0.03 0.05 0.02 0.01Hispanic 0.37 0.39 0.39 0.46 0.46 0.27 0.30Free/Reduced Price Lunch 0.79 0.78 0.77 0.86 0.87 0.66 0.66Limited English Proficient 0.12 0.12 0.11 0.17 0.16 0.00 0.00Special Education 0.22 0.22 0.19 0.27 0.23 0.16 0.188th-Grade Math -0.52 -0.42 -0.26 -0.84 -0.69 0.22 0.278th-Grade ELA -0.23 -0.15 -0.04 -0.44 -0.33 0.37 0.384th-Grade Math -0.45 -0.45 -0.35 -0.70 -0.62 -0.41 -0.374th-Grade ELA -0.82 -0.80 -0.71 -1.10 -1.05 -0.68 -0.66Suspensions 0.25 0.22 0.19 0.19 0.16 0.39 0.31Absences 11.85 11.03 9.00 12.95 10.61 7.88 7.14Number of schools 49 32 32 22 22 5 5Number of students 3151 2121 1368 1483 906 234 148
Public Schools in BostonOpen-enrollment District Schools
Over-subscribed Charter Schools
Table 1: Mean student demographic characteristics and academic indicators by school type among all public schools in Boston, sampled schools, and sampled students
Note: All samples are restricted to students with valid 2011 and 2007 MCAS scores. Sampled schools are schools participating in non-cognitive trait data collection; sampled students are those with valid data on at least one non-cognitive trait. Math and ELA test scores are standardized to have a mean zero and unit variance statewide.
33

Consc. Self-Cont. Grit Growth Mindset
8th-Grade Math
8th-Grade ELA
4th-8th Math Gain
4th-8th ELA Gain Susp. Abs.
Conscientiousness 1.00Self-Control 0.47 1.00Grit 0.66 0.43 1.00Growth Mindset 0.08 0.10 0.18 1.008th-Grade MCAS Math 0.05 0.13 0.03 0.32 1.008th-Grade MCAS ELA 0.05 0.10 0.04 0.36 0.69 1.004th-8th Grade Math Gain 0.10 0.08 0.12 0.21 0.63 0.38 1.004th-8th Grade ELA Gain 0.09 0.04 0.08 0.17 0.26 0.62 0.44 1.00Suspensions -0.06 -0.14 -0.12 -0.04 -0.10 -0.11 -0.01 -0.03 1.00Absences -0.06 -0.12 -0.03 -0.10 -0.29 -0.25 -0.17 -0.11 0.13 1.00
Table 2: Correlation matrix of non-cognitive traits and academic indicators
Note: Sample restricted to students with complete data on each indicator (N=1,340); bolded entries are statistically significant at p<0.1.
34

Open-enrollment District School
Over-subscribed Charter School Difference
MCAS Math Gain (4th-8th) -0.015 0.708 0.723**(0.712) (0.699) (0.122)[906] [148]
MCAS ELA Gain (4th-8th) -0.017 0.407 0.424**(0.684) (0.697) (0.120)[906] [148]
Conscientiousness 0.022 -0.069 -0.091(0.994) (0.981) (0.078)[890] [145]
Self-ontrol 0.001 -0.225 -0.226*(1.017) (0.969) (0.116)[891] [145]
Grit 0.034 -0.099 -0.133(0.986) (1.009) (0.093)[888] [145]
Growth Mindset -0.121 0.260 0.381**(1.016) (0.95) (0.104)[887] [144]
Note: +p<0.1, *p<0.05, ** p<0.01; statistical significance is for difference in mean for over-subscribed charter schools and traditional public schools. In the first two columns, standard deviations are reported in parentheses and sample sizes in brackets. Standard errors reported in parentheses in the third column are adjusted for clustering by school. MCAS scores are standardized to have mean zero and unit variance statewide; non-cognitive traits are standardized to have mean zero and unit variance in the study sample.
Table 3: Mean test-score gains and non-cognitive traits by school type
35

Offer No OfferRegression-
Adjusted Difference
P-value Offer No OfferRegression-
Adjusted Difference
P-value
Male 0.501 0.437 0.100 0.099 0.420 0.368 0.054 0.532African-American 0.590 0.513 0.013 0.779 0.517 0.544 -0.124 0.145White 0.100 0.171 0.008 0.828 0.112 0.211 0.001 0.980Asian 0.009 0.025 -0.016 0.312 0.014 0.018 0.007 0.691Hispanic 0.277 0.278 -0.016 0.760 0.350 0.228 0.107 0.140Free/Reduced Price Lunch 0.687 0.563 0.107 0.022 0.657 0.579 0.007 0.926Limited English Proficient 0.032 0.070 -0.049 0.129 0.021 0.035 -0.022 0.530Special Education 0.195 0.209 -0.003 0.956 0.140 0.123 0.009 0.8844th Grade MCAS Math -0.498 -0.395 -0.074 0.310 -0.334 -0.100 -0.172 0.0914th grade MCAS ELA -0.784 -0.615 -0.134 0.220 -0.617 -0.178 -0.307 0.110Joint F-test statistic 0.003 0.000Observations 339 158 143 57
Administrative Data Sample Non-cognitive Sample
Note: Administrative data sample includes all applicants to over-subscribed charter schools matched to valid 2011 and 2007 test scores in the Massachusetts Department of Elementary and Secondary Education state database. Study sample includes students in the administrative data sample with valid data on at least one non-cognitive outcome. The first two columns for each sample provide the mean of each variable for students receiving at least one and no offers of admission to an over-subscribed charter school. Regression-adjusted differences control for fixed effects for lottery applicant risk sets used to estimate charter attendance effects. P-values are for the regression-adjusted difference.
Table 4: Balance of observed characteristics in admissions lotteries for over-subscribed charter schools
36

Administrative Data Sample
Non-cognitive Sample
8th Grade MCAS Math 0.138** 0.118+(0.039) (0.062)
8th Grade MCAS ELA 0.039 0.048(0.043) (0.048)[497] [200]
Conscientiousness -0.153+(0.075)[196]
Self-Control -0.212*(0.095)[196]
Grit -0.117*(0.053)[195]
Growth Mindset -0.03(0.092)[195]
Notes: +p<0.1, *p<0.05, ** p<0.01. Standard errors reported in parentheses are clustered by 8th-grade school. Sample sizes for each outcome are in brackets. Each cell presents results from a separate regression. Administrative data sample includes all applicants to over-subscribed charter schools matched to valid 2011 test scores in the Massachusetts Department of Elementary and Secondary Education state database. Study sample includes students in the administrative data sample with valid data on at least one non-cognitive outcome. All regressions control for student gender, race, age, LEP, SPED, and free/reduced price lunch, cubic polynomials in 4th-grade MCAS ELA and math scores, and fixed effects for lottery applicant risk sets.
Table 5: Instrumental variables estimates of the effects of a year's attendance at an over-subscribed charter school
37

Fall Y1 Spring Y1 Spring Y2 Spring Y3
Charter School 1 3.83 3.69 3.55 3.40Charter School 2 3.70 3.70 3.49 3.34District School 3.79 3.67 3.64 3.68
Charter School 1 3.48 3.22 3.08 2.91Charter School 2 3.42 3.31 3.12 2.96District School 3.46 3.31 3.22 3.26
Charter School 1 3.62 3.41 3.31 3.23Charter School 2 3.58 3.44 3.20 3.24District School 3.42 3.42 3.32 3.36
Charter School 1 3.74 4.25 4.50 4.40Charter School 2 3.71 4.67 4.42 4.42District School 3.74 4.30 4.26 4.44Note: Sample restricted to students with valid data in each year. N=61 for Charter School 1; N=43 for Charter School 2; N=65 for District School. See Appendix Table A2 for data on all sampled students. Conscientiousness, Self-Control, and Grit are measured on a 5-point scale; Growth Mindset is measured on a 6-point scale. Years 1-3 correspond to grades 5-7 in Charter School 1 and grades 6-8 in Charter School 2 and District School.
Time Point
Table 6: Mean student non-cognitive traits in three middle schools over time, stable sample
Conscientiousness
Self-Control
Grit
Growth Mindset
38

Open-enrollment District School
Over-subscribed Charter School Difference
High Expectations 3.929 4.496 0.567** 0.63(0.900) (0.669) (0.149)[885] [112]
Teacher Strictness 3.526 4.107 0.581* 0.65428(0.888) (0.904) (0.211)[878] [112]
Clear Rules 3.789 4.186 0.397* 0.42324(0.938) (0.854) (0.154)[881] [110]
Negative Peer Effects 2.738 2.252 -0.486** 0.5052(0.962) (0.796) (0.122)[878] [112]
Student Input 2.514 2.264 -0.250* 0.10065(0.924) (0.851) (0.093)[882] [111]
Table 7: Student perceptions of school climate by school type
Note: *p<0.05, ** p<0.01; statistical significance is of difference in mean for over-subsribed charter and traditional public schools. In the first two columns, standard deviations are reported in parentheses and sample sizes in brackets. Standard errors reported in parentheses in the third column are adjusted for clustering by school.
39

Overall Within Schools Overall Within SchoolsConscientiousness .100** .144** .078** .107**
(0.028) (0.032) (0.025) (0.027)Self-Control 0.076* 0.122** 0.042 0.081**
(0.034) (0.029) (0.025) (0.025)Grit .110** .155** .073* .096**
(0.032) (0.031) (0.033) (0.035)Growth Mindset 0.198** .155** .151** .148**
(0.036) (0.040) (0.037) (0.032)
4th-8th MCAS Math Gains 4th-8th MCAS ELA Gains
Note: *p<0.05, ** p<0.01. Each cell presents results from a separate regression of math or ELA MCAS gains on the relevant non-cognitive trait. Within-school regressions include fixed effects for schools. Standard errors reported in parentheses are clustered by 8th-grade school. Non-cognitive traits are standardized to have mean zero and unit variance in the study sample
Table 8: Relations of non-cognitive traits and test-score gains, overall and within schools
40
Administrative Data Sample
Non-cognitive Sample
Offer at Charter School A 1.576** 0.952* (0.370) (0.441)
Offer at Charter School B 1.710** 2.039**(0.515) (0.461)
Offer at Charter School C 1.183 1.467(0.874) (1.561)
Offer at Charter School D 1.319* 1.682* (0.651) (0.740)
Offer at Charter School E 1.600** 1.248* (0.374) (0.524)
Joint F-test statistic 35.53 16.04Observations 497 200Note: *p<0.05, ** p<0.01. Standard errors reported in parentheses are clustered by 8th-grade school. The administrative data sample includes all applicants to over-subscribed charter schools matched to valid 2011 test scores in the Massachusetts Department of Elementary and Secondary Education state database. The study sample includes all students in the administrative data sample with valid data on at least one non-cognitive outcome. All regressions include controls for student gender, race, age, LEP, SPED, and free/reduced price lunch, cubic polynomials in 4th-grade MCAS ELA and math scores, and fixed effects for lottery applicant risk sets.
Table A1: First stage results for instrumental variable lottery analysis
41

Fall Y1 Spring Y1 Spring Y2 Spring Y3 Fall Y1 Spring Y1 Spring Y2 Spring Y3
Charter School 1 3.83 3.58 3.52 3.43 3.46 3.20 3.06 2.92[98] [95] [86] [71] [100] [95] [86] [71]
Charter School 2 3.76 3.64 3.50 3.35 3.44 3.17 3.12 2.97[86] [89] [61] [49] [95] [90] [61] [49]
District School 3.70 3.58 3.55 3.60 3.36 3.19 3.13 3.17[169] [138] [117] [116] [169] [138] [117] [116]
Charter School 1 3.53 3.32 3.25 3.20 3.73 4.20 4.47 4.38[99] [95] [86] [71] [100] [95] [86] [71]
Charter School 2 3.58 3.44 3.24 3.21 3.71 4.62 4.53 4.50[90] [89] [61] [49] [95] [90] [61] [49]
District School 3.40 3.29 3.20 3.29 3.58 4.16 4.11 4.23[169] [138] [117] [116] [170] [138] [117] [116]
Note: Brackets report sample size by outcome, year, and school. Conscientiousness, Self-Control, and Grit are measured on a 5-point scale; Growth Mindset is measured on a 6-point scale. Years 1-3 correspond to grades 5-7 in Charter School 1 and grades 6-8 in Charter School 2 and District School.
Table A2: Mean student non-cognitive traits in three middle schools over time, all sampled students
Conscientiousness Self-Control
Grit Growth Mindset
Time Point Time Point
42

Deidre J. Knapp
Dr. Deirdre J. Knapp is Vice President of HumRRO’s Research and Consulting Operations Division. She earned her doctorate in industrial-organizational psychology from Bowling Green State University in 1984 and has been at HumRRO since 1987. Dr. Knapp’s primary area of expertise is in performance measurement. She has developed performance measures for use in professional certification programs and as outcome measures in large-scale criterion-related validation research studies in employment settings. Dr. Knapp has experience with a wide range of measurement methods, including selected response, oral interviews, live and computer-based simulations, experience records, and observer ratings.
Dr. Knapp served on the National Research Council (NRC) committee that evaluated the impact of the National Board of Professional Teaching Standards and helped organize and presented at an NRC workshop on the assessment of 21st century skills in K-12 educational settings. Dr. Knapp has authored multiple book chapters, technical reports, and articles on job analysis, performance measurement, and various professional practice topics.
See Assessing 21st Century Skills, Summary of Workshop (2011) at http://www.nap.edu/catalog.php?record_id=13215
43

James W. Pellegrino
Dr. James W. Pellegrino is Liberal Arts and Sciences Distinguished Professor and Distinguished Professor of Education at the University of Illinois (UIC) at Chicago. He also serves as Co-director of UIC’s interdisciplinary Learning Sciences Research Institute. His research and development interests focus on children's and adult's thinking and learning and the implications of cognitive research and theory for assessment and instructional practice. He has published over 275 books, chapters and articles in the areas of cognition, instruction and assessment. His current research on learning, instruction, and assessment is funded by the U.S. National Science Foundation and the U.S. Institute of Education Sciences. He has served as the head of several U.S. National Academy of Sciences study committees, including co-chair of the Committee on Learning Research and Educational Practice, and co-chair of the Committee on the Foundations of Assessment which issued the report Knowing What Students Know: The Science and Design of Educational Assessment. Most recently he served as a member of the Committee on Science Learning: Games, Simulations and Education, as chair of the Committee on Defining Deeper Learning and 21st Century Skills, and co-chair of the Committee on Developing Assessments of Science Proficiency in K-12. He is a past member of the Board on Testing and Assessment of the National Research Council and a lifetime member of the U.S. National Academy of Education. He currently serves on the Technical Advisory Committees (TAC) of several states as well as the TACs of multiple state consortia funded under the U.S. Department of Education’s Race to the Top assessment initiative. See Education for Life and Work at http://www.nap.edu/catalog.php?record_id=13398
44

National Academy of Sciences • National Academy of Engineering • Institute of Medicine • National Research Council
Business, political, and educational leaders are increas-ingly asking schools to integrate development of skills such as problem solving, critical thinking, and collaboration into the teaching and learning of academic subjects. These skills are often referred to as “21st century skills” or “deeper learning.”
At the request of several foundations, the National Research Council appointed a committee of experts in education, psy-chology, and economics to more clearly define “deeper learn-ing” and “21st century skills,” consider these skills’ impor-tance for positive outcomes in education, work, and other areas of life, address how to teach them, and examine re-lated issues.
The committee’s findings and recommendations are detailed in its report Education for Life and Work: Developing Transfer-able Knowledge and Skills in the 21st Century.
First steps toward ClariFying termsDeeper learning is the process through which a person becomes capable of taking what was learned in one situation and applying it to new situations – in other words, learning for “transfer.” Through deeper learning, students develop expertise in a particular discipline or subject area.
Suppose a student learns about means, medians and modes in mathematics. Deeper learning would mean that the student would learn not only how to calculate these values, but also under-stand how and when each is best used. For example, if the student later worked at a store that tracked average daily sales each month, he or she would recognize that a special sale on the first day of a particular month could skew the mean and that an alternative measure like the median might be more representative of daily sales for that month.
Through the process of deeper learning, students develop 21st century competencies – transferable knowledge and skills. In contrast to a view of “21st century skills” as general
R e p o R t B R i e f • J u LY 2 0 1 2
BoARD oN TeSTINg AND ASSeSSmeNT • BoaRd on science education
Education for LifE and Work dEvELoping transfErabLE knoWLEdgE and skiLLs in thE 21st cEntury
Educationat thE national REsEaRch councilwww.nationalacademies.org/dbasse
45
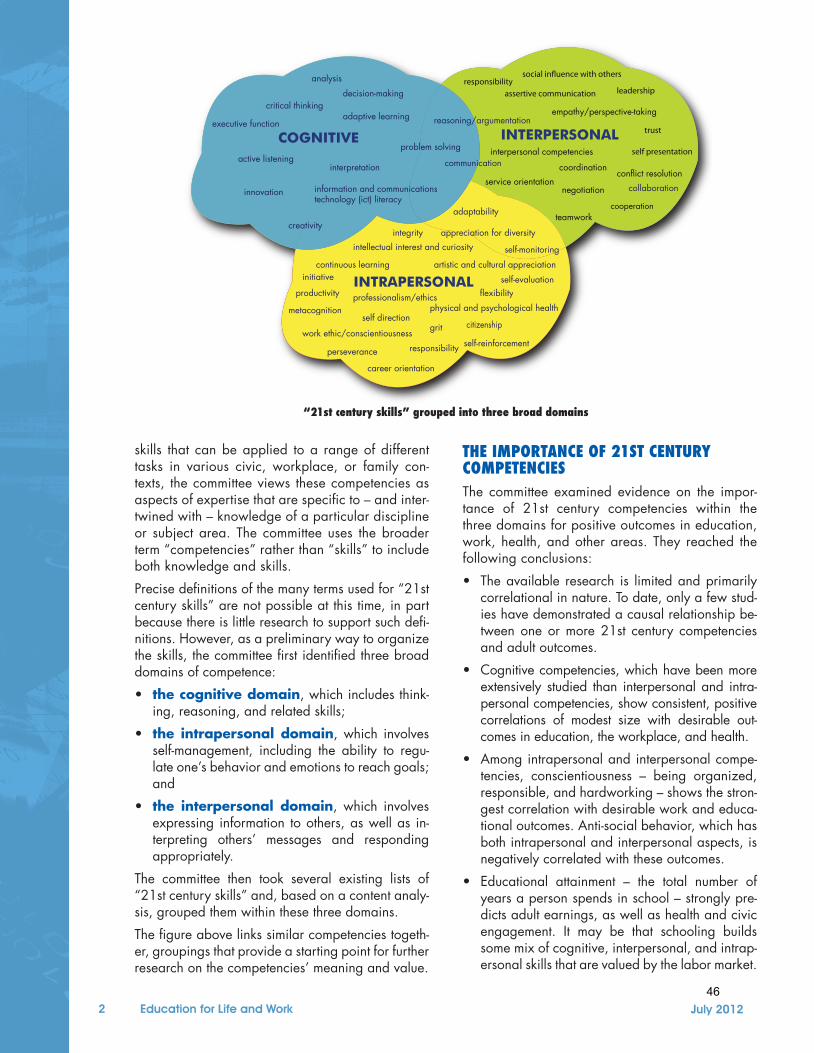
2 Education for Life and Work July 2012
skills that can be applied to a range of different tasks in various civic, workplace, or family con-texts, the committee views these competencies as aspects of expertise that are specific to – and inter-twined with – knowledge of a particular discipline or subject area. The committee uses the broader term “competencies” rather than “skills” to include both knowledge and skills.
Precise definitions of the many terms used for “21st century skills” are not possible at this time, in part because there is little research to support such defi-nitions. However, as a preliminary way to organize the skills, the committee first identified three broad domains of competence:
• the cognitive domain, which includes think-ing, reasoning, and related skills;
• the intrapersonal domain, which involves self-management, including the ability to regu-late one’s behavior and emotions to reach goals; and
• the interpersonal domain, which involves expressing information to others, as well as in-terpreting others’ messages and responding appropriately.
The committee then took several existing lists of “21st century skills” and, based on a content analy-sis, grouped them within these three domains.
The figure above links similar competencies togeth-er, groupings that provide a starting point for further research on the competencies’ meaning and value.
the importanCe oF 21st Century CompetenCiesThe committee examined evidence on the impor-tance of 21st century competencies within the three domains for positive outcomes in education, work, health, and other areas. They reached the following conclusions:
• the available research is limited and primarily correlational in nature. To date, only a few stud-ies have demonstrated a causal relationship be-tween one or more 21st century competencies and adult outcomes.
• cognitive competencies, which have been more extensively studied than interpersonal and intra-personal competencies, show consistent, positive correlations of modest size with desirable out-comes in education, the workplace, and health.
• among intrapersonal and interpersonal compe-tencies, conscientiousness – being organized, responsible, and hardworking – shows the stron-gest correlation with desirable work and educa-tional outcomes. Anti-social behavior, which has both intrapersonal and interpersonal aspects, is negatively correlated with these outcomes.
• educational attainment – the total number of years a person spends in school – strongly pre-dicts adult earnings, as well as health and civic engagement. It may be that schooling builds some mix of cognitive, interpersonal, and intrap-ersonal skills that are valued by the labor market.
COGNITIVE INTERPERSONAL
INTRAPERSONAL
critical thinking
analysis
reasoning/argumentation
interpretation
problem solving
decision-making
adaptive learning executive function
information and communicationstechnology (ict) literacy
communication active listening
creativity
innovation
adaptability
artistic and cultural appreciation
appreciation for diversity
continuous learning
intellectual interest and curiosity
initiative
work ethic/conscientiousness
metacognitionself direction
responsibility perseverance
productivity
grit
flexibilityprofessionalism/ethics
integrity
citizenship
career orientation
self-monitoring
self-evaluation
self-reinforcement
physical and psychological health
collaboration
teamwork cooperation
coordination
interpersonal competencies
empathy/perspective-taking
service orientation conflict resolution
negotiation
leadership
trust
responsibility assertive communication
self presentation
social in�uence with others
027505 DBASSE CLOUD GRAPHIC
“21st century skills” grouped into three broad domains
46

Education for Life and Work 3July 2012
If so, making it possible for students to get more education may itself be a useful complementary way to develop 21st century competencies.
more research is needed to increase our under-standing of the relationships between particular twenty-first century competencies and desired adult outcomes.
over a century of research on transfer has yielded little evidence that teaching can develop general cognitive competencies that are transferable to any new discipline, problem or context, in or out of school. much of the research has been carried out in the cognitive domain and it shows that transfer does occur but is limited in scope. Studies of inter-ventions to teach social and emotional skills suggest that these also support transfer beyond the imme-diate context in which they were acquired, affect-ing students’ behavior throughout the school day. more research is needed to illuminate whether, and to what extent, competencies learned in one disci-pline or context of application can generalize and transfer to other disciplines or contexts.
The committee found not only that deeper learning develops 21st century competencies, but also that the relationship flows both ways: 21st century com-petencies can aid the process of deeper learning in a discipline or subject area. For example, deeper learning to develop expertise in a discipline or sub-ject area requires months of sustained, deliberate practice – a process supported by the intrapersonal competency of conscientiousness.
teaChing For deeper learning emerging evidence indicates that cognitive, intraper-sonal, and interpersonal competencies can be taught and learned in ways that support transfer. Research in the cognitive domain has also identified features of instruction that are likely to support transfer within a given subject area. For example, transfer is sup-ported when instruction helps learners understand the general principles underlying the specific ex-amples included in their original learning. Teaching that emphasizes not only content knowledge, but also how, when, and why to apply this knowledge is essential to transfer. Instruction should follow these research-based teaching methods:
• Use multiple and varied representations of concepts and tasks, such as diagrams, numerical and mathematical representations, and simulations, along with support to help stu-dents interpret them.
• Encourage elaboration, questioning, and explanation – for example, by prompt-ing students who are reading a history text to explain the material aloud to themselves or oth-ers as they read.
• Engage learners in challenging tasks, while also supporting them with guidance, feed-back, and encouragement to reflect on their own learning processes.
• Teach with examples and cases, such as modeling step-by-step how students can carry out a procedure to solve a problem while ex-plaining the reason for each step.
• Prime student motivation by connecting topics to students’ personal lives and interests, engaging students in problem solving, and draw-ing attention to the knowledge and skills students are developing and their relevance, rather than grades or scores.
• Use “formative” assessments, which con-tinuously monitor students’ progress and provide feedback to teachers and students for use in ad-justing their teaching and learning strategies.
deeper learning in standards doCumentsThe committee found important areas where goals for deeper learning and 21st century competencies overlap with the new Common Core State Standards in english language arts and mathematics and the NRC Framework for K-12 Science education. All three documents highlight the importance of helping students understand the general principles underly-ing specific content, a hallmark of deeper learn-ing. A cluster of cognitive competencies—including critical thinking, nonroutine problem solving, and constructing and evaluating evidence-based argu-ments—is included in all three disciplines. Cover-age of other competencies—especially those in the intrapersonal and interpersonal domains—is uneven. Developing the full range of 21st century competencies within the disciplines will require sys-tematic instruction and sustained practice, a change from current practice that will require additional in-structional time and resources.
moving ForwardBecause 21st century competencies support deeper learning of school subjects, their widespread acqui-sition could potentially reduce disparities in educa-tional attainment, preparing a broader swathe of
47
4 Education for Life and Work July 2012
young people for successful adult outcomes in work and other areas of life.
However, important challenges remain in two major areas. First, research and development is needed to create and evaluate new curricula based on the research-based instructional meth-ods described above, and to find valid ways to assess cognitive, intrapersonal, and interperson-al skills. Second, at the level of education sys-tems and policies, new approaches to teacher preparation and professional development will be needed to help instructors acquire a deep understanding of the role of 21st century compe-tencies in learning core academic content and create environments that support students’ learn-ing of these competencies.
To help address these systemic issues, the states and the federal government should establish pol-icies and programs -- in the areas of assessment, accountability, curriculum and materials, and teacher education -- to support students’ acquisi-tion of transferable knowledge and skills.
researCh needs
Far more research is needed to fill gaps in the evidence base on deeper learning and 21st century competencies. Foundations and feder-al agencies should support research aimed at:
• establishing agreed-upon definitions of 21st century competencies and ways to measure and assess them.
• Better illuminating the relationships – par-ticularly any causal relationships -- between 21st century competencies and desired outcomes.
• Gaining a better understanding of whether, and to what extent, teaching for transfer within an academic discipline (such as mathematics) can facilitate the transfer of competencies across disciplines (for exam-ple, from mathematics to history).
For MorE InForMaTIon . . . This brief was pre-pared by the Board on Testing and Assessment based on the report Education for Life and Work: Developing Transferrable Knowledge and Skills in the 21st Century. The study was sponsored by the Carnegie Corporation of new York, the William & flora Hewlett foundation, the John d. & catherine t. Macarthur foundation, the National Science Foundation, the Nellie mae education Foundation, the Pearson Foundation, SCe, the Stupski Foundation and the Raikes Foundation. Any opinions, findings, conclusions, or recommendations expressed in this publication are those of the authors and do not reflect those of the sponsoring organizations. Copies of the report are available from the National Academies press, 500 fifth street, n.W., Washington, dc 20001; (800) 624-6242; http://www.nap.edu.
Committee on deFining deeper learning and 21st Century sKillsJaMES W. PELLEGrIno (Chair), Learning sciences Research institute, university of illinois–chicago; GrEG J. DUnCan, university of california, irvine; Joan L. HErMan, National Center for Research on evaluation, standards, and student testing, university of california, Los angeles; MarGarET a. HonEY, new York Hall of science, Queens; PaTrICK C. KYLLonEn, Center for New Constructs, educational Testing Service; HEnrY M. LEVIn, teachers college, columbia university; CHrISTInE MaSSEY, institute for Research in cognitive science, university of pennsylvania; rICHarD E. MaYEr, university of California, Santa Barbara; KEnT MCGUIrE, Southern education Foundation, Atlanta, georgia P. DaVID PEarSon, Graduate school of education, university of california, Berkeley; EDWarD a. SILVEr, university of Michigan; MarGarET L. HILTon, Study Director
48


