
Assessing Intervention Timing in Computer Based … · ... online and computer-based learning...
11
Abstract— Background: The use of computer-based and online education systems has made new data available that can describe the temporal and process-level progression of learning. To date, machine learning research has not considered the impacts of these properties on the machine learning prediction task in educational settings. Machine learning algorithms may have applications in supporting targeted intervention approaches. Purpose/Hypothesis: The goals of this paper are to 1) determine the impact of process- level information on machine learning prediction results, and 2) establish the effect of type of machine learning algorithm used on prediction results. Design/Method: Data were collected from a university level course in human factors engineering (n=35), which included both traditional classroom assessment and computer-based assessment methods. A set of common regression and classification algorithms were applied to the data to predict final course score. The overall prediction accuracy as well as the chronological progression of prediction accuracy was analyzed for each algorithm. Results: Simple machine learning algorithms (linear regression, logistic regression) had comparable performance to more complex methods (SVMs, ANNs). Process-level information was not useful in post-hoc predictions, but contributed significantly to allowing for accurate predictions to be made earlier in the course. Conclusions: Process level information provides useful prediction features for development of targeted intervention techniques, as it allows more accurate predictions to be made earlier in the course. For small course data sets, the prediction accuracy and simplicity of linear regression and logistic regression make these methods preferable to more complex algorithms. Index Terms—Machine learning, Training, Decision support systems, Educational technology, Statistical learning I. INTRODUCTION HE modern ubiquity of computer use and internet access have dramatically impacted many facets of education, including engineering education [1]. There has been a rapid rise over the last decade in the use of computer-based or online formats either to facilitate (e.g. online distribution of materials) or conduct higher-education courses, and enrollment among all students in at least one online course is now at 32% [2]. Many universities now include online programs, and online publisher resources have also grown correspondingly. This movement is matched in the field of training, with more than 60% of the 5.7 million hours of training given in 2007 by The Boeing Company were partially or totally online [3]. The use of these technologies has created many opportunities for higher student access and novel methods for student engagement. Online and computer-based learning have also had equally great impacts on learning assessment. In traditional classroom settings, recording of student's progress is often a combination of subjective performance reviews and paper records [4]. The resultant data available for analysis are typically "summative assessments", which are a measure of cumulative knowledge accumulated (e.g. examinations). These are often only available at discrete points in the course progression [5]. By contrast, online and computer-based learning settings typically create an electronic log of a wide array of interactions between the student and the learning system, such as individual question responses (such as multiple choice or text- based) over an often more prolific set of homework, quizzes, and examinations. Data collection, both in depth and quantity that would be impractical for traditional classroom settings, is easily recorded through electronic venues. From a practical perspective, in these settings there is greater access to data at a finer temporal scale, since logs are typically recorded at every student interaction with the system. Additionally, the increased level of detail contained in the logs also often allows interpretation of process-level data. Rather than only being able to access the end result of each student's effort, intermediate pieces of information can provide insights into the progression of learning. There are many objectives of assessment, though one of high utility to educators is the prediction of future performance of students. This type of "formative assessment" focuses on providing information to evaluate student learning during the learning This work was supported in part by The Boeing Company under Grant #6925184. The opinions expressed in this paper are those of the authors and do not necessarily reflect the opinions of the sponsoring agency. Alexander J. Stimpson is with the Department of Aeronautics and Astronautics, Massachusetts Institute of Technology, Cambridge, MA 02139 USA (e-mail: [email protected]). Mary L. Cummings is with the Mechanical Engineering Department, Duke University, Durham, NC 27708 USA (e-mail: [email protected]). Assessing Intervention Timing in Computer- Based Education Using Machine Learning Algorithms Alexander J. Stimpson and Mary L. Cummings, Senior Member, IEEE T
Transcript of Assessing Intervention Timing in Computer Based … · ... online and computer-based learning...

Abstract— Background: The use of computer-based and online education systems has made new data available that can describe the temporal and process-level progression of learning. To date, machine learning research has not considered the impacts of these properties on the machine learning prediction task in educational settings. Machine learning algorithms may have applications in supporting targeted intervention approaches. Purpose/Hypothesis: The goals of this paper are to 1) determine the impact of process-level information on machine learning prediction results, and 2) establish the effect of type of machine learning algorithm used on prediction results. Design/Method: Data were collected from a university level course in human factors engineering (n=35), which included both traditional classroom assessment and computer-based assessment methods. A set of common regression and classification algorithms were applied to the data to predict final course score. The overall prediction accuracy as well as the chronological progression of prediction accuracy was analyzed for each algorithm. Results: Simple machine learning algorithms (linear regression, logistic regression) had comparable performance to more complex methods (SVMs, ANNs). Process-level information was not useful in post-hoc predictions, but contributed significantly to allowing for accurate predictions to be made earlier in the course. Conclusions: Process level information provides useful prediction features for development of targeted intervention techniques, as it allows more accurate predictions to be made earlier in the course. For small course data sets, the prediction accuracy and simplicity of linear regression and logistic regression make these methods preferable to more complex algorithms.
Index Terms—Machine learning, Training, Decision support systems, Educational technology, Statistical learning
I. INTRODUCTION HE modern ubiquity of computer use and internet access have dramatically impacted many facets of education, including engineering education [1]. There has been a rapid rise over the last decade in the use of computer-based or online formats
either to facilitate (e.g. online distribution of materials) or conduct higher-education courses, and enrollment among all students in at least one online course is now at 32% [2]. Many universities now include online programs, and online publisher resources have also grown correspondingly. This movement is matched in the field of training, with more than 60% of the 5.7 million hours of training given in 2007 by The Boeing Company were partially or totally online [3]. The use of these technologies has created many opportunities for higher student access and novel methods for student engagement. Online and computer-based learning have also had equally great impacts on learning assessment. In traditional classroom settings, recording of student's progress is often a combination of subjective performance reviews and paper records [4]. The resultant data available for analysis are typically "summative assessments", which are a measure of cumulative knowledge accumulated (e.g. examinations). These are often only available at discrete points in the course progression [5]. By contrast, online and computer-based learning settings typically create an electronic log of a wide array of interactions between the student and the learning system, such as individual question responses (such as multiple choice or text-based) over an often more prolific set of homework, quizzes, and examinations. Data collection, both in depth and quantity that would be impractical for traditional classroom settings, is easily recorded through electronic venues. From a practical perspective, in these settings there is greater access to data at a finer temporal scale, since logs are typically recorded at every student interaction with the system. Additionally, the increased level of detail contained in the logs also often allows interpretation of process-level data. Rather than only being able to access the end result of each student's effort, intermediate pieces of information can provide insights into the progression of learning. There are many objectives of assessment, though one of high utility to educators is the prediction of future performance of students. This type of "formative assessment" focuses on providing information to evaluate student learning during the learning
This work was supported in part by The Boeing Company under Grant #6925184. The opinions expressed in this paper are those of the authors and do not
necessarily reflect the opinions of the sponsoring agency. Alexander J. Stimpson is with the Department of Aeronautics and Astronautics, Massachusetts Institute of Technology, Cambridge, MA 02139 USA (e-mail:
[email protected]). Mary L. Cummings is with the Mechanical Engineering Department, Duke University, Durham, NC 27708 USA (e-mail: [email protected]).
Assessing Intervention Timing in Computer-Based Education Using Machine Learning
Algorithms Alexander J. Stimpson and Mary L. Cummings, Senior Member, IEEE
T

process, such that the process of instruction can be adapted to achieve maximal effectiveness [3], [5]. For courses conducted entirely online, feedback based on formative assessment can be used to modify the content or presentation of instruction. In addition, for courses supplemented by technology, similar predictive feedback can provide insight into the appropriate timing and content of targeted interventions for struggling students.. Interventions could include individual meetings between the student and instructor, extra instruction on particular topics, or recommendations of study techniques and preparation methods. Such interventions are typically intended to improve the learning of students, either individually or as a group. For such a targeted intervention approach, it is not only important to have high-accuracy predictions of students, but also to obtain these predictions as early as possible in the course, so that any interventions can be as impactful as possible in the student's understanding throughout the course. Traditionally, an instructor might create predictions through the application of statistical techniques such as linear regression to analyze whether the formative metric values for a particular student are indicative of a good or poor final performance (as measured by "summative assessment", such as examinations). These techniques fall under another burgeoning field, that of machine learning. Machine learning (or data mining) is a branch of artificial intelligence that focuses on algorithms that identify and learn the relationships between data. These algorithms generally fall under the categories of unsupervised, which attempt to identify underlying structure in data, and supervised, which infer a function to relate input data to a "target" variable. The rise in popularity of these techniques can be attributed in part to their flexibility and capacity to process large, high-dimensional data sets [6]. The application of these techniques to educational datasets has risen dramatically in recent years, and has been given the designation of Educational Data Mining (EDM) (see [4], [7] for a review of EDM literature). Much of the focus of this work has been on the increasing use of online education (e.g. [8], [9]), which generates enormous datasets that machine learning approaches are well-equipped to process. However, to date there has not been an in-depth analysis of the nature of data generated in educational settings, and the impacts of data from these settings on machine learning applicability and results. In particular, the characteristics of finer temporal resolution and process-level data provided by online and computer-based course environments have not been investigated for their contribution to machine learning models utilizing these features. Additionally, there is a wide range of machine learning techniques with varying capabilities that may have varying utility on these data sets. With this in mind, there are two primary goals of this research. The first is to determine the usefulness of temporal and process-level information in addition to traditional metrics as features in machine learning prediction models. The second is to determine whether the type of machine learning technique used has an impact on prediction performance in classroom settings that incorporate computer-based data.
II. METHODS In selecting a data set to answer this research question, it is important to use an environment that includes both traditional features, such as "summative assessment" examinations, in addition to technology-driven features that include temporal and process-level information. This way, machine learning prediction models can be constructed both with and without the additional features. For clarity, models that include only the traditional features are referred to as "traditional models", while models that also include process-level information are referred to as "process-level models". There are two primary metrics for the comparison of these models, given the assessment-oriented utility of prediction models discussed above. First, the prediction accuracy is analyzed, as more accurate predictions allow for greater confidence in the application of targeted interventions. Second, the chronological progression of prediction accuracy is examined, to determine whether the finer temporal scale in the computer-based features allows for accurate predictions of final performance to be made earlier in the course.
A. Data Collection De-identified data was obtained from a mixed graduate and undergraduate Human Computer Interaction (HCI) course. Most of the course was conducted in a traditional classroom format, however a set of online daily quizzes were incorporated to assess comprehension of the reading material prior to each class. For the purposes of this study, the quiz data are utilized for its temporal and process-level information. As such, the process-level models include these features, while the traditional models created only utilize the summative features. The students that completed the course for a grade included 9 graduate students and 31 undergraduate students (40 total). A variety of student assessment data were collected in the course and a full list is presented in Table I. All data in Table I were graded on a scale of 0-100, aside from the case study and course evaluation, which were on scales of 0-10 and 0-3 respectively. The final grade was available both as a raw numeric score on a scale of 0-100, as well as on an ordinal scale (A,B,C, etc.). The course included opportunities to obtain up to three extra credit commendations, which would not change the final average score, but could improve the final letter grade in cases where the student was close to the grade cutoff (90% for A, 80% for B, etc). For the prediction models created in this study, these extra credit opportunities were not considered. The grades associated with the miscellaneous category only had peripheral importance to the subject matter, and therefore were also excluded from use in the machine learning analysis. The graduate project information was only available for a small subset of the students, and therefore was also not used in the prediction process.

TABLE I ASSESSMENT TECHNIQUES USED ON COURSE DATA
Metric Description Number of Instances in Course
Total Contribution to Final Course Grade
Daily Quizzes Quiz questions regarding comprehension of the reading homework assignments, multiple choice (10 questions)
19 10%,7%*
Projects Projects that focused on the understanding and application of course concepts 3 33%, 27%*
Problem Sets (Psets)
Quantitative homework problem sets 2 12%, 8%*
Tests Cumulative examinations covering all prior course material 2 40%, 25%* Graduate Project Additional project for graduate students 2 30%* Miscellaneous Case Study presentation and Course Evaluation 2 5%, 3%* Final Grade Calculated based on contributions of other metrics, available as both numerical
and converted to ordinal scale (A,B,C) 1 N/A
* indicates grade contribution for graduate students By summing over the column of instances in Table I and excluding metrics as discussed above, the collected dataset represents 27 individual metrics for use in machine learning. For the machine learning prediction algorithms, the final grade (either numerical or ordinal) represents the primary prediction target. The remaining 26 metrics were available to be used directly as features in the machine learning models to predict final grade. Additionally, for each category an agglomerative feature was created by taking the average of that category (e.g. "project average"), resulting in 5 additional features. Records were also available for excused and unexcused absences for each student. Excused and unexcused absences resulted in a number of scores of "0" for the daily quizzes. The excused absences were not included in the calculation of the final grade, and therefore should not be included in the model predictions. One option would be to exclude those specific quiz values from the analysis, but some methods (e.g. linear regression) are unable to model datasets with missing values. Since all 5 students with excused absences had multiple excused cases, it was preferable to exclude those students from the analysis, leaving 35 students in the dataset. For these remaining students, the grade distribution for the elements in Table I that were included in the machine learning analysis is shown in Fig. 1. There are still a number of absences for the daily quizzes that resulted in a "0" score, however these were unexcused and were factored into the final grade.
Fig 1: Boxplot of dataset after removing excused absentees. Median values are shown as central marks, edges of the box represent 25th-75th percentile. Whiskers are shown for data up to 1.5 times the interquartile range. Outliers are plotted individually with a "+".

The resultant total possible features for machine learning (31, from 26 individual metrics plus 5 agglomerative metrics) is nearly equivalent to the number of individual students (35). This scenario of high number of features to data points poses significant challenges to the machine learning approach [10]. For small datasets, the primary concern is the tendency for machine learning models to overfit training data. Consider a case with 100 unique features and 100 students in the training set. In a linear regression model, a single feature for each student could be used to perfectly predict the final grade. However, the weights associated with these fits would be specifically tailored for the training data, and would have difficulty in predicting previously unseen student data. To counter this tendency to overfit data, feature selection methods can be utilized to reduce the number of features. In cases where domain knowledge is available, ad-hoc feature selection or reduction can be an effective method [11]. In this case, it is apparent by the number of instances that the largest contributor to feature vector size are the daily quizzes (19 instances). Therefore, we can approach the feature selection by creating reduced feature sets of quizzes. To this end, a downselected quiz feature set was generated by selecting the quizzes that showed the highest average error across all students. These quizzes tended to have the largest variability in scores across students, and therefore may have greater discriminability in a prediction task than other quizzes. Briefly, these "high-error" quizzes were selected by applying a simple K-means clustering algorithm with 2 clusters based on quiz error rate. The quizzes that were assigned to the cluster with higher error were designated as "high-error" quizzes. The quizzes assigned to this "high-error" group were quizzes 2,3,5,6,10, and 14. The corresponding topics for these quizzes were Vision, Research Methods, Vestibular / Spatial Disorientation, Displays, Error, and Controls, respectively. Overall, these topic areas may have represented more technical and calculation-intensive areas than the topics quizzes in the low-error group (such as workload, decision making, and situation awareness). By utilizing a subset of the most influential quizzes, we can limit the size of the feature space used in the machine learning models.
B. Machine Learning Techniques Machine learning algorithms generally fall under two paradigms: supervised and unsupervised learning [12]. Supervised algorithms infer a function that relates a set of input features to labels (also called "targets"). Supervised learning is directly related to prediction tasks, and for the classroom dataset presented here can be used to identify the relationship between formative assessment measure such as quizzes to the final course grade. Unsupervised learning does not require labels, and investigates internal patterns or structure within a dataset. While unsupervised techniques could be useful in a course setting to provide clusters of student performance, these algorithms do not directly allow for predictions, and are therefore outside the scope of this paper. For this analysis, a set of commonly used supervised learning techniques were selected and are shown in Table II, listed roughly in order of increasing complexity of the models constructed by the algorithm. These supervised algorithms can generally be divided based on the nature of the target variables; regression algorithms predict continuous target variables, while classification algorithms that predict discrete target variables. For the regression techniques presented in Table II, the numeric final course grade was used as the target for prediction. For the classification techniques listed, the letter grade (A,B,C) instead used as the prediction target.
TABLE II MACHINE LEARNING TECHNIQUES APPLIED TO COLLECTED DATASET
Technique Usage Description
Linear Regression Regression Identifies linear parameters relating features to continuous target variables Logistic Regression Classification Identifies parameters of logistic function relating features to binary target variables Support Vector Machines (SVM)
Classification Identifies maximum-margin hyperplane separator, most commonly used in classification
Artificial Neural Network (ANN)
Regression / Classification
Creates predictive models using layers of neurons that utilize weighted connections and activation functions to predict continuous or discrete targets
An accurate prediction of continuous measures (such as the numeric course grade) has a higher level of precision over discrete measures such as the letter grade. However, it may not be possible to achieve accurate prediction of the continuous numeric grade using regression techniques. Additionally, it could be argued that from an intervention perspective, the educator does not care about the exact numeric grade, and only cares whether the student falls into a category of "needs intervention" or "does not need intervention". Thus for the purposes of informing intervention, the classification approach may be preferable. Due to these considerations, both regression and classification techniques were included in the analysis. The particular methods chosen represent some of the most common and flexible methods used in machine learning, and have been used successfully in a wide variety of domains [12]. Generalization performance was assessed for all methods using a 60%:20%:20% data split for training, validation, and test set sizes, respectively. Due to the small dataset available (35 students), the concern arises that the data may not fairly represent the distribution of scores for all data splits. To address this issue, students were ordered by final grade score divided into groups of 5 students based on this ordering. For each group, 3 students were randomly assigned to the training set, and 1 student was

assigned to each the validation and tests sets. With this strategy, the risk that the validation or test set may contain only good or poor students is reduced. Both SVMs and ANNs have model aspects that must be considered in the creation of these models. In SVM models, the choice of kernel (such as linear, polynomial, or Gaussian) can impact the capability to fit functions. In this analysis, the standard linear kernel was implemented to maximize the simplicity of the resultant models. For determining the structure of the ANN models, several heuristics can be used. For nearly all mappings of the input space into the output space, one hidden layer is sufficient to characterize the mapping [13], and therefore was selected to be used for the ANNs created in this study. The optimal number of neurons in the hidden layer depends on several variables including the size of the training set, the complexity of the underlying function, the noise, and the activation function selected [14]. However, general heuristics have been suggested (e.g. [15]) that the number of training data should be between 2 and 10 times the sum of the size of the input, hidden, and output layers. In this study, given the number of data available and the general range of the input layer, a moderate network size of 10 hidden neurons was selected.
III. RESULTS The results section is divided into four subsections. The first two report the overall prediction results and temporal prediction
results for regression techniques. The latter two report the equivalent results for classification techniques.
A. Regression Results- Post-hoc Prediction The selected regression methods (linear regression and ANN regression) were compared based on the model fit of the data on
the test set, as measured by R2. Table III shows the average performance results on the test set over 10 runs of using a variety of combinations of features with each technique, including both agglomerative and individual metrics. Cumulative grade percentages of features used in model construction are presented in the third column. The difference between linear and ANN regression performance was tested using a paired two-sample Students t-test, and significance values for the test are shown in Table III. Additionally, significance of the regression fits were tested using the associated t-statistic, and significant correlation coefficients (using a Bonferroni correction α=0.05/18=0.0028) are marked in Table III.
TABLE III
POST-HOC REGRESSION RESULTS
Features Used Number of Features
Grade Percentage
Linear Regression r2
ANN Regression r2
Quiz Average 1 10% 0.296±0 0.271±0.054 Test Average 1 40% 0.874±0 0.779±0.051 Project Average 1 33% 0.187±0 0.153±0.042 Problem Set Average 1 12% 0.399±0 0.372±0.062 Quiz Average + Test Average + Project Average + Problem Set Average
4 95% 0.956±0.001 0.873±0.021
Quiz Scores 19 10% 0.038±0.018 0.286±0.046 Quiz Scores + Test Scores + Project Scores + Problem Set Scores 26 95% 0.627±0.076 0.826±0.025 Quiz Scores (*) 6 3.2% 0.189±0.019 0.245±0.047 Quiz Scores (*) + Test Scores + Project Scores + Problem Set Scores 13 88.2% 0.976±0.003 0.915±0.013
Comparisons across methods for each feature set were calculated by Bonferroni-corrected paired t-test, faimily-wise α=0.05. Shading indicates methods with the lowest error for each feature set (only considering differences that are significant)
(*) indicates only "high-error" quizzes used for model features + indicates multiple feature types used for model
The data in Table III reveal several relationships about the feature sets and the machine learning techniques used. By comparing r2 values within a column, the relative contribution of different feature sets to final grade prediction can be observed. The test metrics provide the greatest predictive fits for the final grade relative to the other individual metrics. It also appears that for each agglomerative metric, there is little difference in model performance compared to models that utilize the equivalent individual metric values (e.g. quiz average compared to quiz scores for ANN models). The results indicate that the linear regression models (r2 = 0.038, 0.189) have greater difficulty than ANN models (r2 = 0.286, 0.245) in creating fits using only the quiz score data as compared to the quiz average. This may result from the higher flexibility of ANN models in fitting non-linearities, which may be more pronounced across all quizzes but not observed in the quiz average. However, this advantage is unobservable in the other (lower dimensional) metrics, and for the feature sets that include most of the grade contribution, linear regression actually outperforms ANN regression. Additionally, models from quiz score data alone explain relatively little of the final grade under either method, and so the few advantages of using ANNs on this dataset may be limited. An additional important insight that can be drawn from Table III is the relative grade contribution of the feature set in comparison to the model fit using those features. Since the target variable is a function of the input variables, certain model predictions may be more useful than others by providing additional information about the final grade over the inherent grade contribution. Consider the feature set that includes all the average metrics, which has a grade contribution of 95%. While models

created on this data have a very high fit value (0.956 and 0.873 for linear and ANN regression, respectively), the explanation of these models is similar to the contribution of the features to the final grade. In other words, these models do not provide major benefits beyond simply calculating the final grade based on using the averages of the input features. This is not the case for some of the other feature sets. Consider the models created from using only test average. The model fits (0.874 and 0.779 for linear and ANN regression, respectively) are considerably higher than the actual grade contribution of the tests (40%). In this case, the models have been able to create a much better prediction of final grade than would be directly implied by the grade contribution of the tests alone. The subset of “high error” quizzes shows the highest proportion of explanatory power to grade contribution among all feature sets. This is an important finding for several reasons. First, this indicates that these "high-error" quizzes are able to capture most of the information contained in the quiz scores while reducing the number of features from 19 to 6, which reduces the potential for the model to overfit the data. Second, since the "high-error" quizzes comprise a smaller percentage of the final grade, this indicates that the relative explanatory power of these features (r2~0.2 for 6% contribution) is high compared to the superset of all quizzes (r2~0.2 for 10% contribution). However, given the low explanatory power of models based on either set of quiz scores alone, while the quizzes may provide a high explanatory power relative to their grade contribution, a successful model will include other features (e.g. tests, problem sets) in addition to the quiz scores. Predictions of performance have greater value the earlier they can be obtained. Thus, an investigation of the usefulness of process-level information over time is conducted in the next section. As discussed previously, there appear to be few advantages of ANN models over linear models. There are also disadvantages in utilizing ANNs over linear regression models due to the difficulty in determining a clear link between the created model and the contribution of each input. This is a particularly important consideration for this application, as targeted interventions rely on the educator's understanding of which topics or areas are difficult for students. In ANN models, the relationship between individual features and final grade prediction may be difficult to ascertain, and may limit the usefulness of ANNs in a targeted intervention approach. Therefore, for the temporal analysis presented in the following section, linear regression models were selected for the further analysis.
B. Regression Results- Temporal Results A second investigation was conducted to analyze the capacity of regression models to make predictions of the final grades as early as possible in the course. At each class session of the course, additional assignments or examinations are completed and thus more information is available to the models. Table IV shows the number of quizzes, projects, problem sets, and test scores assigned at each class session.
TABLE IV DATA POINTS AVAILABLE THROUGH EACH CLASS SESSION
Class Number Quizzes Projects Problem Sets Tests
1 0 0 0 0 2 1 0 0 0 3 2 0 0 0 4 3 0 0 0 5 4 0 0 0 6 5 0 0 0 7 6 0 1 0 8 6 0 1 0 9 7 0 1 0
10 8 0 1 0 11 9 1 1 0 12 10 1 1 0 13 10 1 1 1 14 11 2 1 1 15 12 2 1 1 16 13 2 1 1 17 14 2 1 1 18 15 3 1 1 19 16 3 1 1 20 17 3 1 1 21 18 3 2 1 22 19 3 2 1 23 19 3 2 2
When considering the temporal progression of the class, quiz grades are accumulated far earlier in the course progression than the other measures. Therefore, this information may be of assistance in making early predictions relative to those based on the traditional classroom measures. To test the predictive assistance provided by quiz scores, three sets of models were created: 1) a model that only utilized the traditional discrete classroom measures (projects, problem sets, and tests), 2) a model that

> REPLACE THIS LINE WITH YOUR PAPER IDENTIFICATION NUMBER (DOUBLE-CLICK HERE TO EDIT) <
7
incorporated all quiz scores as features, and 3) a model that incorporated the "high error" quizzes. Fig. 2 below shows the comparison in performance between the two models. In Fig. 2, the performance of the models is objectively assessed by Sum-Squared Error (SSE) of the model prediction, given in (1).
SSE = (y! − y!)!!
!!!
(1)
where y is the predicted final grade by the model, and y is the actual final grade. Lower SSE indicates closer predictions to the actual values, and thus better model performance. The timing of the problem sets, projects, and tests are labeled on Fig. 2, and it can be seen that for the traditional model (without quiz data), model performance stays constant until new information from one of these sources is available.
Fig 2: Comparison of performance of linear prediction models using varying levels of quiz information. Error based on predicted final grade compared to actual final grade. Several observations can be made based on these results. First, the process-level models (that include quiz data) exhibit a lower SSE than the traditional model, which is expected since the feature sets of the process-level models are a superset of that of the traditional model. Second, it is apparent that the improvement in performance varies over time (as measured by the vertical distance between the traditional and process-level SSE), which is indicative that not all quizzes contribute equally to prediction performance. Consider the change in model performances for the all-quiz model between classes 2 and 3. At class 2, the performance is nearly identical to the other two models, and thus the quiz data available at that time (quiz 1) does not make a major contribution to reducing prediction error. By contrast, at class 3 this model improves considerably in performance, indicating that the new set of quiz information (quizzes 1 and 2) allows the model to achieve a much more accurate prediction of final grade. Interestingly, this effect is not solely the result of quiz 2, as the model of high-error quizzes does not see similar improvement at the availability of quiz 2 data. This indicates that it is not merely quiz 2, but the combination of the information from quizzes 1 and 2 that allow the all-quiz model to outperform the others. There are several interesting conclusions arising from the comparison of the two models that include quiz data in Fig. 2. As expected, the model with all quizzes is able to achieve a better fit of the data than the model that includes only the "high error" quizzes. For some time periods of the class (e.g., classes 4-6) the two models have very similar prediction performance. However, there are other time periods (e.g., class 11) where the model that includes all quizzes has a much lower SSE than the "high-error" model. Based on the results in Fig. 2, we can also begin to answer the question of when accurate predictions of grade can be made with each of these models. The figure demonstrates that the quiz information improves the prediction over the traditional model, but does this allow for accurate predictions to be made earlier? The determination of how much accuracy is necessary to make a prediction is a complex topic. As has been stated earlier, prediction information has greater value the earlier it is available, but predictions become more accurate with time. Therefore the concepts of model accuracy and time are highly intertwined. Early, accurate predictions have great value for informing targeted intervention approaches. However, the nature of the intervention, cost, and efficacy over time will also play a role in choosing the appropriate model accuracy.

> REPLACE THIS LINE WITH YOUR PAPER IDENTIFICATION NUMBER (DOUBLE-CLICK HERE TO EDIT) <
8
Therefore, the exact performance level necessary to inform intervention is domain dependent. However, we can still draw useful conclusions about the results of the specific temporal analysis in Fig. 2. A horizontal line on the graph in Fig. 2 indicates the time at which each model reaches any particular performance threshold. Consider the performance level represented by an SSE of 800. The all-quiz model achieves this level of performance by class 11, while the other two models do not reach this performance level until class 13, just after the first test. There are important implications of this timing difference. The prediction accuracy level that can be achieved after the first test with the traditional and "high-error" models can be achieved prior to the first test with the all-quiz model. This is very valuable from a targeted intervention approach, as an intervention prior to the first test could improve test performance for struggling students (such as through an extra study session, etc.). In the consideration of both the accuracy and temporal advantages provided by the process-level information, it is clear that this information provides considerable benefits to educators and students.
C. Classification Results- Post-hoc Prediction As previously discussed, prediction results of ordinal grade (A,B,C) may be as informative as predictions of continuous grade for the purposes of targeted intervention. If higher accuracy can be achieved through a discrete classification approach on course datasets, this method may be a useful alternative to regression. A similar approach was taken to classification as the regression analysis presented earlier. An overall analysis was conducted to determine the best techniques for classification using a variety of feature sets. Table V shows the results of using a variety of combinations of features with each classification method used, using 10 data splits to reduce the importance of random assignment to training, validation, and test sets. In Table V, the standard classification algorithm performance measure of classification error is used. Note, however, that since this is a measure of error, lower values represent better performance. Additionally, since there are 3 classes with the largest class containing 16 students, we expect a "naive" error rate of around 54%. This calculation is based on the assumption of assigning all students to the most frequent class, thus misclassifying 19 of 35 students.
TABLE V POST-HOC CLASSIFICATION RESULTS
Features Used Number of Features
Grade Percentage
Logistic Regression Classification Error (%)
SVM Classification Error (%)
ANN Classification Error (%)
Quiz Average 1 10% 55.14±0.56a 50.00±0.65b 50.86±1.44ab Test Average 1 40% 19.43±0.20a 23.71±0.23b 23.14±1.68ab Project Average 1 33% 53.43±0.91ab 55.43±0.57a 50.29±0.76b Problem Set Average 1 12% 44.57±1.05a 50.00±0.25b 39.14±2.25a Quiz Average + Test Average + Project Average + Problem Set Average
4 95% 6.29±0.78a 18.00±1.05b 12.00±1.65ab
Quiz Scores 19 10% 27.71±0.65a 34.00±0.66b 55.43±0.97c Quiz Scores (*) 6 3.2% 43.71±0.85a 52.00±0.68b 50.29±1.63ab Quiz Scores (*) + Test Scores + Project Scores + Problem Set Scores
13 88.2% 13.14±0.69a 10.00±0.80a 11.14±2.00a
For each feature set, matching superscripts indicate no significant difference between the corresponding machine learning techniques (Bonferroni-corrected paired t-test, family-wise α=0.05). Shading indicates methods with the lowest error for each feature set (only considering differences that are significant)
(*) indicates only "high-error" quizzes used for model features + indicates multiple feature types used for model
Several conclusions are apparent from the results in Table V. First, no single method appears to be consistently superior in prediction performance to the other two. Both logistic regression and ANNs tended to outperform SVM models across most feature sets. This may be due to the use of the standard linear kernel in the SVM algorithm, which will have difficulties modeling non-linearities in the data. For any particular feature set, the resultant ANN model will have a higher complexity than the corresponding logistic regression model. As with regression analysis, the increased complexity and difficulty in drawing connections between inputs and outputs makes ANNs less desirable for informing targeted intervention. Based on the similar classification performance between ANNs and logistic regression models and the greater interpretability of logistic regression, logistic regression was selected for further temporal analysis.
D. Classification Results- Temporal Results For the classification approach, the same set of features over time was used from Table IV. At each point in time, three models were constructed: a model without process-level quiz data, a model including all quiz data, and a model including only the "high-error" quizzes. Fig. 3 compares the logistic regression model performances over time through classification error. In Fig. 3, we can see that prior to the introduction of the first problem set, the behavior of the models is erratic and is near the naive error rate (54%) for all three models. This is largely due to the difficulty in the convergence of the maximum likelihood estimation calculations, and all of the models in this time range exceeded the iteration limit specified (10,000 iterations). This is an important result as well, as the indication is that for few features without high correlation to the targets, the classification approach may not be reasonable.
> REPLACE THIS LINE WITH YOUR PAPER IDENTIFICATION NUMBER (DOUBLE-CLICK HERE TO EDIT) <
9
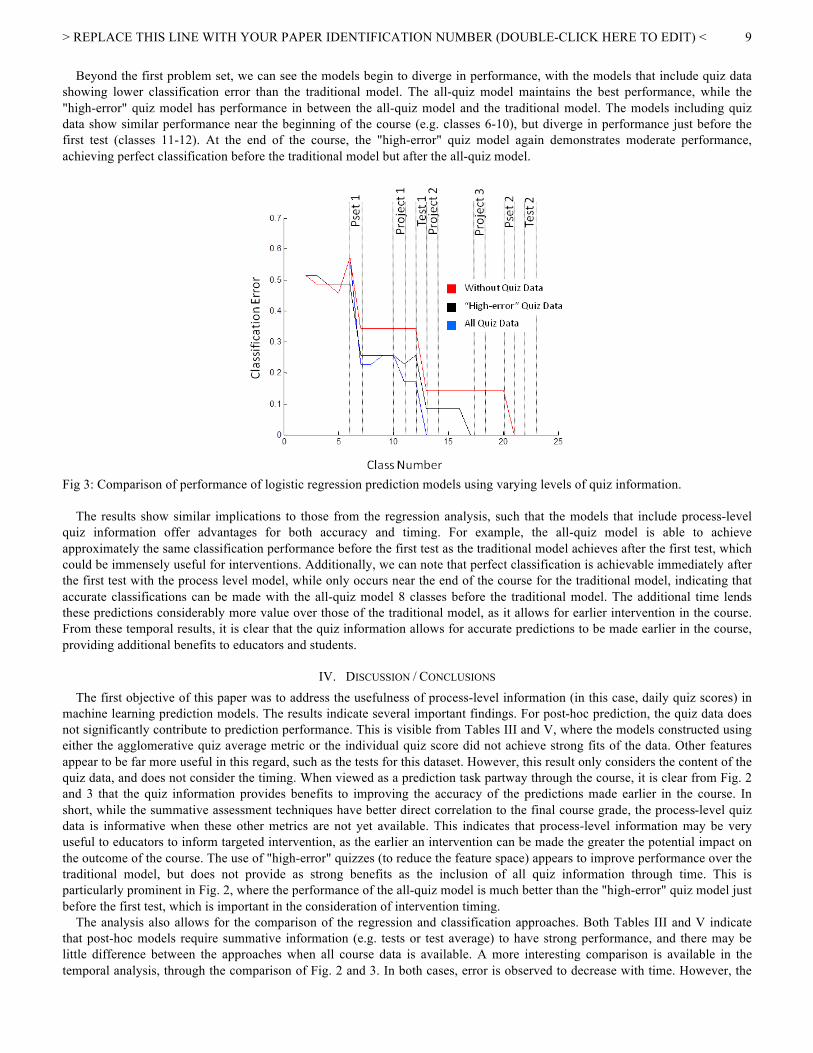
Beyond the first problem set, we can see the models begin to diverge in performance, with the models that include quiz data showing lower classification error than the traditional model. The all-quiz model maintains the best performance, while the "high-error" quiz model has performance in between the all-quiz model and the traditional model. The models including quiz data show similar performance near the beginning of the course (e.g. classes 6-10), but diverge in performance just before the first test (classes 11-12). At the end of the course, the "high-error" quiz model again demonstrates moderate performance, achieving perfect classification before the traditional model but after the all-quiz model.
Fig 3: Comparison of performance of logistic regression prediction models using varying levels of quiz information. The results show similar implications to those from the regression analysis, such that the models that include process-level quiz information offer advantages for both accuracy and timing. For example, the all-quiz model is able to achieve approximately the same classification performance before the first test as the traditional model achieves after the first test, which could be immensely useful for interventions. Additionally, we can note that perfect classification is achievable immediately after the first test with the process level model, while only occurs near the end of the course for the traditional model, indicating that accurate classifications can be made with the all-quiz model 8 classes before the traditional model. The additional time lends these predictions considerably more value over those of the traditional model, as it allows for earlier intervention in the course. From these temporal results, it is clear that the quiz information allows for accurate predictions to be made earlier in the course, providing additional benefits to educators and students.
IV. DISCUSSION / CONCLUSIONS The first objective of this paper was to address the usefulness of process-level information (in this case, daily quiz scores) in
machine learning prediction models. The results indicate several important findings. For post-hoc prediction, the quiz data does not significantly contribute to prediction performance. This is visible from Tables III and V, where the models constructed using either the agglomerative quiz average metric or the individual quiz score did not achieve strong fits of the data. Other features appear to be far more useful in this regard, such as the tests for this dataset. However, this result only considers the content of the quiz data, and does not consider the timing. When viewed as a prediction task partway through the course, it is clear from Fig. 2 and 3 that the quiz information provides benefits to improving the accuracy of the predictions made earlier in the course. In short, while the summative assessment techniques have better direct correlation to the final course grade, the process-level quiz data is informative when these other metrics are not yet available. This indicates that process-level information may be very useful to educators to inform targeted intervention, as the earlier an intervention can be made the greater the potential impact on the outcome of the course. The use of "high-error" quizzes (to reduce the feature space) appears to improve performance over the traditional model, but does not provide as strong benefits as the inclusion of all quiz information through time. This is particularly prominent in Fig. 2, where the performance of the all-quiz model is much better than the "high-error" quiz model just before the first test, which is important in the consideration of intervention timing. The analysis also allows for the comparison of the regression and classification approaches. Both Tables III and V indicate that post-hoc models require summative information (e.g. tests or test average) to have strong performance, and there may be little difference between the approaches when all course data is available. A more interesting comparison is available in the temporal analysis, through the comparison of Fig. 2 and 3. In both cases, error is observed to decrease with time. However, the

> REPLACE THIS LINE WITH YOUR PAPER IDENTIFICATION NUMBER (DOUBLE-CLICK HERE TO EDIT) <
10
progression of prediction errors is quite different. Consider the prediction values for the all-quiz model just before and after the first test. In the classification approach, the error drops from 17.14 (misclassifying 6 students) to 0. Qualitatively this seems to be a large change in prediction accuracy. In the regression approach, the SSE drops from 751 to 483. If we extract the average error from this value (by dividing by 35 students and taking the square root), we can see the average error per student change from 4.63 to 3.71. This difference seems far less important, as it seems unlikely that this average error change would drastically affect the educator's targeted intervention planning. This indicates that the classification approach experiences greater changes in prediction accuracy through time, and more rapidly approaches perfect prediction. Regression, on the other hand, progresses more slowly in prediction accuracy, and this reflects a generally useful prediction even earlier in the course. Therefore, it appears that there may be advantages to the classification approach later in the course, while regression may be more consistent in performance earlier in the course. However, there are several important caveats to these results: the determination of what model accuracy is needed and the exact timing and nature of any intervention is dependent upon the domain. Therefore, it is necessary to have subject-matter experts (ideally, the educators themselves) provide interpretation to the prediction results. These experts have knowledge of the potential benefits and costs associated with an intervention, and can apply this knowledge to the rates of model accuracy over time. Consider the data shown in Fig. 3. If the cost of an intervention is very high relative to the cost of a failed student or trainee, it would be appropriate to wait until the model is able to achieve perfect classification prior to performing an intervention. This would result in the earliest possible intervention timing to be class 13 with the all-quiz model, class 17 with the "high-error" quiz model, and class 21 with the traditional model. Under different assumptions of the cost/benefit properties of intervention and the costs associated with having a student finish the course with poor performance, the appropriate time for intervention requires interpretation. However for this dataset, under all circumstances, the process-level quiz data allowed for greater certainty in intervention earlier in the course. The second objective of this paper was to determine the impact of type of machine learning algorithm on prediction performance. For both regression and classification analysis on this dataset, simpler models (linear regression and logistic regression) were able to achieve similar prediction performance to more complex models (ANNs and SVMs). This may indicate simpler (or in particular, linear) relationships between the features and the targets for this dataset. For more complex datasets, it is yet to be shown whether models such as ANNs that can handle non-linearities will perform stronger in a similar prediction task. In the selection of particular methods for regression and classification on the presented dataset, it is important to remember that one of the primary goals of modeling work is to preserve parsimony, hearkening back to principles such as "Occam's Razor". With this in mind and the similar performance of linear and logistic regression to more complex models, the results clearly recommend the use of linear regression for regression analysis, and logistic regression for classification. In summary, this research has demonstrated that process-level information in an educational course setting does not improve summative prediction benefits when all other metrics are available, but does provide greater prediction accuracy earlier, especially in the absence of summative assessment measures. Additionally, for these types of datasets, simpler machine learning algorithms are able to achieve similar generalization performance to more complex models. One area of future research could investigate whether these properties hold for larger or more complex datasets. Additionally, the details of transforming prediction results into targeted intervention approaches through the interpretation of subject matter experts should be further investigated.
REFERENCES [1] J. Bourne, D. Harris, and F. Mayadas, "Online engineering education: Learning anywhere, anytime", Journal of Engineering Education, vol. 94, no. 1, pp
131-146. 2005. [2] I.E. Allen and J. Seaman, Changing Course: Ten Years of Tracking Online Education in the United States, Newburyport, MA: Sloan Consortium, 2013. [3] D. Lawton, N. Vye, J. Bransford, E. Sanders, M. Richey, D. French and R. Stephens, "Online Learning Based on Essential Concepts and Formative
Assessment," Journal of Engineering Education, vol. 101, no. 2, pp 244-287, 2012. [4] C. Romero and S. Ventura, "Educational data mining: A survey from 1995 to 2005," Expert Systems with Applications, vol. 33, pp 135-146, 2007. [5] D. William and M. Thompson, "Integrating assessment with instruction: What will it take to make it work?" in The future of assessment: Shaping teaching
and learning, Mahwah, NJ: Erlbaum, 2007, pp 53-82. [6] J. Foulds and E. Frank, "A review of multi-instance learning assumptions." Knowledge Engineering Review, vol. 25, no.1, pp 1-25, 2010. [7] R. Baker and K. Yacef, "The state of educational data mining in 2009: A review and future visions," Journal of Educational Data Mining , vol. 1, no. 1, pp
3-17, 2009. [8] J. Mostow and J. Beck, "Some useful tactics to modify, map and mine data from intelligent tutors," Natural Language Engineering, vol. 12, no. 2, pp 195-
208, 2006. [9] F. Castro, A. Vellido, A. Nebot, and F. Mugica, "Applying data mining techniques to e-learning problems," Evolution of teaching and learning paradigms
in intelligent environment, pp 183-221, 2007.
[10] X. Chen and J.C. Jeong, "Minimum reference set based feature selection for small sample classifications," Proceedings of the 24th international conference on Machine learning, Corvallis, OR, 2007, pp 153-160.
[11] I. Guyon and A. Elisseeff, "An introduction to variable and feature selection," The Journal of Machine Learning Research, vol. 3, pp 1157-1182, 2003. [12] C.M. Bishop and N.M. Nasrabadi, Pattern recognition and machine learning, New York: Springer, 2006. [13] J. Heaton, Introduction to neural networks with Java. St Louis: Heaton Research, 2005. [14] J.P. Resop, "A comparison of artificial neural networks and statistical regression with biological resources applications," M.S. Thesis, University of
Maryland, 2006. [15] C. Feng and X. Wang, "Surface roughness predictive modeling: neural networks versus regression," IIE Transactions, vol. 35, no. 1, pp 11-27, 2003.

> REPLACE THIS LINE WITH YOUR PAPER IDENTIFICATION NUMBER (DOUBLE-CLICK HERE TO EDIT) <
11
Alexander J. Stimpson received the B.S. degree in biological engineering from the University of Florida, Gainesville, FL, USA, in 2007, and the S.M. degree in Aeronautics and Astronautics from the Massachusetts Institute of Technology (MIT), Cambridge, MA, USA, in 2011. He is currently pursuing the Ph.D. degree at the Department of Aeronautics and Astronautics, MIT. His dissertation work focuses on the application of machine learning models to inform training assessment and intervention.
His current research interests include human supervisory control, decision support systems, artificial intelligence, and data mining. Mary L. Cummings (SM'03) received the B.S. degree in mathematics from the United States Naval Academy, Annapolis, MD, USA, in 1988, the M.S. degree in space systems engineering from the Naval Postgraduate School, Monterey, CA, USA, in 1994, and the Ph.D. degree in systems engineering from the University of Virginia, Charlottesville, VA, USA, in 2004. A naval officer and military pilot from 1988 to 1999, she was one of the Navy's first female fighter pilots. She is was an Associate Professor with the Department of Aeronautics and Astronautics, Massachusetts Institute of Technology, Cambridge, MA, USA from 2004 to 2013. She is currently a Visiting Associate Professor with the Department of Mechanical Engineering at Duke University, Durham, NC, USA. Her current research interests include human supervisory control, human-unmanned vehicle interaction, collaborative human-computer decision making, decision support, human performance modeling, and the
ethical and social impact of technology.