Assessing HVDC Transmission for Impacts of Non ... · Assess ing HVDC . Transmission for Impacts of...
74
Assessing HVDC Transmission for Impacts of Non‐Dispatchable Generation June 2018 Independent Statistics & Analysis www.eia.gov U.S. Department of Energy Washington, DC 20585
Transcript of Assessing HVDC Transmission for Impacts of Non ... · Assess ing HVDC . Transmission for Impacts of...
Assessing HVDC Transmission for Impacts of Non‐Dispatchable Generation
June 2018
Independent Statistics & Analysis
www.eia.gov
U.S. Department of Energy
Washington, DC 20585
June 2018
U.S. Energy Information Administration | Assessing HVDC Transmission for Impacts of Non‐Dispatchable Generation 1
Assessing HVDC Transmission for Impacts of Non‐Dispatchable Generation Given the increase in renewable generation in recent years, it has become increasingly important to understand the manner in which operational challenges arising from intermittency may be mitigated with other technologies or operating procedures. One such technology is high‐voltage direct current (HVDC) transmission lines. To help better inform the U.S. Energy Information Administration’s (EIA) long‐term planning models and projections, EIA commissioned a study from ICF Incorporated, LLC (ICF) to assess the role that HVDC transmission lines may play as additional renewable generation sources become integrated into electrical grids.
More specifically, ICF was asked to review the extent to which they believed HVDC lines may mitigate challenges resulting from additional renewable generation, the advantages and disadvantages of using HVDC lines to transmit the electricity generated from renewable sources, and the potential costs of constructing additional HVDC lines in a formal analysis based on many sources of information.
To provide some background, electricity generated by renewable resources can be categorized into two types—dispatchable and non‐dispatchable generation. Dispatchable generation sources include conventional hydroelectric, geothermal, and biomass. Non‐dispatchable (or intermittent or variable) generation sources like solar and wind, however, depend on the resource availability, such as when the sun is shining or the wind is blowing. As a result, these technologies have limited capability to respond to generation dispatch signals.
The increasing deployment and penetration of non‐dispatchable renewable generation from resources like solar and wind can lead to electrical system operational issues, which include under‐ or over‐generation during times of high or low electricity demand. Such conditions could potentially require additional grid services to accommodate the associated fluctuations in generation delivered from these resources.
Power transmission lines facilitate the bulk transfer of electricity from a generating station to a local distribution network. The U.S. electric transmission network consists of around 700,000 circuit miles of lines. Most of these lines operate with alternating current, which is how power is typically generated and delivered to the end‐use customers.
HVDC lines have typically been used to transfer large amounts of power over long distances. They are now being proposed as a way to move electricity generated from wind in high‐quality wind resource regions to other parts of the country. If properly configured, direct current transmission could also help mitigate operational issues with wind and solar generation such as a mismatch in generation in relation to the need for increased ancillary services associated with renewable generation. This can be accomplished by effectively moving electricity generated from wind or solar resources from areas of high penetration to areas with lower penetration.
It should be noted that challenges associated with increased penetration of generation from wind and solar resources may also be mitigated using a variety of other technologies or practices, including smart grid technologies, energy storage, or other flexible generating technologies. However, the role that HVDC lines may play in mitigating some of the potential challenges imposed by the growth in non‐dispatchable renewable generation on electric grids is an important consideration.

June 2018
U.S. Energy Information Administration | Assessing HVDC Transmission for Impacts of Non‐Dispatchable Generation 2
APPENDIX
Assessment of the Potential for High‐Voltage Direct Current Transmission to Mitigate Impacts of Non‐Dispatchable Generation Technologies
FINAL REPORT
March 2018
Submitted to:
United States Energy Information
Administration (EIA)
Washington, DC
Submitted by:
ICF Incorporated, LLC
Fairfax, VA

i
Table of Contents
List of Figures ....................................................................................................................................... ii
List of Tables ........................................................................................................................................ ii
List of Abbreviations, Acronyms, and Initialisms ................................................................................. iii
1. Summary of Findings ....................................................................................................................... 1
2. Introduction and Background .......................................................................................................... 3
2.1. Objectives of Report ........................................................................................................................ 3
2.1.1. Review of questions to be answered .................................................................................. 3
2.1.2. Discussion of approach ....................................................................................................... 4
2.1.3. Report structure.................................................................................................................. 4
2.2. Overview of HVDC Technology ........................................................................................................ 4
2.2.1. History of HVDC technology ............................................................................................... 4
2.2.2. Modern HVDC lines deployment trends ............................................................................. 5
2.2.3. HVDC deployment in the United States .............................................................................. 6
2.2.4. Technical features of HVDC technology ............................................................................. 7
2.2.5. Advantages and disadvantages of HVDC transmission technology .................................... 9
3. Analysis and Results ...................................................................................................................... 13
3.1. Role of HVDC in Mitigating Non‐Dispatchable Generation Impacts .............................................. 13
3.1.1. Impact of large‐scale non‐dispatchable generation on system operation ....................... 13
3.1.2. Potential HVDC solutions application ............................................................................... 15
3.2. Summary and Insights on Costs from HVDC Project Case Studies ................................................ 17
3.3. Cost Trends in HVDC Lines/Technologies in the United States ..................................................... 23
3.3.1. Cost Estimates from specific case studies of HVDC projects (publicly available) ............. 23
3.3.1. Summary and insights on HVDC cost trends .................................................................... 25
4. Conclusions ................................................................................................................................... 28
5. References .................................................................................................................................... 29
Appendices ....................................................................................................................................... A‐1
A.1. Case Studies of Potential Implementation of HVDC Solutions ...................................................... A‐1
A.1.1. TransWest Express Project in CAISO................................................................................... A‐1
A.1.2. MISO Conceptual HVDC Network Case Study.................................................................. A‐6
A.1.3. SPP’s Clean Line Project Case Study ................................................................................. A‐11
A.2. Literature Survey on Applicability of HVDC for Renewable Integration ..................................... A‐18
A.3. Literature Review on HVDC Project Costs ................................................................................... A‐27
A.4. List of Existing and Proposed HVDC Projects in the United States .............................................. A‐30
A.5. Glossary ....................................................................................................................................... A‐32
ii
List of Figures
Figure 1. Existing and planned HVDC lines and interties in North America ................................................. 7
Figure 2. Schematic of an HVDC line ............................................................................................................. 9
Figure 3. Comparison of HVDC to HVAC lines (losses and typical configuration) ....................................... 10
Figure 4. Cost comparison curves for HVDC and AC lines (generic estimates) ........................................... 12
Figure 5. Generation capacity in the United States by fuel type (existing and planned) ........................... 14
Figure 6. Wind and solar generation capacity in the United States (existing and planned)....................... 14
Figure 7. Net generation trends in the United States (by fuel type) .......................................................... 15
Figure 8. Installed capacity trends for CAISO (existing and planned) ....................................................... A‐1
Figure 9. Recent net generation trends in California (GWh) .................................................................... A‐2
Figure 10. Proposed TransWest project in Western Interconnect ........................................................... A‐4
Figure 11. Installed capacity trends in MISO ............................................................................................ A‐7
Figure 12. Recent historical net generation trends in MISO (GWh) ......................................................... A‐7
Figure 13. Conceptual HVDC network assessed by MISO study ............................................................... A‐9
Figure 14. Square Butte HVDC line ......................................................................................................... A‐10
Figure 15. Installed capacity trends in SPP ............................................................................................. A‐12
Figure 16. Recent historical net generation trends in SPP ...................................................................... A‐13
Figure 17. Nodal and hub pricing trends in SPP “Wind Alley” region ..................................................... A‐14
Figure 18. Average net generation profile curve for SPP by the hour of the day (a typical spring week in
March) ..................................................................................................................................................... A‐15
Figure 19. Overview of proposed clean line HVDC line .......................................................................... A‐17
Figure 20. Unit cost estimates of HVDC technology .............................................................................. A‐29
List of Tables
Table 1. Penetration levels corresponding to historic market initiatives ................................................... 20
Table 2. Maximum renewable penetration in select ISO/RTOs .................................................................. 20
Table 3. Changes in penetration levels for alternative mitigation solutions .............................................. 21
Table 4. NREL JEDI project cost data for a hypothetical 500 kV, 100‐mile bi‐pole HVDC line .................... 25
Table 5. Summary of recent literature on HVDC and its application in solving renewable intermittency
.............................................................................................................................................................. …A‐23
Table 6. Cost estimates of HVDC projects (based on literature review)................................................. A‐27
Table 7. Transmission and infrastructure cost estimates (for a hypothetical HVDC line) ...................... A‐29
Table 8. Existing HVDC projects .............................................................................................................. A‐30
Table 9. Proposed HVDC projects in the United States (selected) ......................................................... A‐31
iii
List of Abbreviations, Acronyms, and Initialisms
AC Alternating current
BLM Bureau of Land Management
BPA Bonneville Power Administration
CAISO California Independent System Operator
CCC Capacitor‐commutated converter
CFE Comisión Federal de Electricidad
CIGRE Council on Large Electric Systems
CREZ Competitive Renewable Energy Zone
DC Direct current
DIR Dispatchable intermittent resource
DOE Department of Energy
EI Eastern Interconnect
EIM Energy Imbalance Market
EIA Energy Information Administration
EPRI Electric Power Research Institute
ERCOT Electricity Reliability Council of Texas
ETSAP Energy Technology Systems Analysis Programme
FCA Forward capacity auction
FERC Federal Energy Regulatory Commission
FOSG Friends of Supergrid
FRT Fault ride through
GTO Gate turn‐off
HVAC High‐voltage alternating current
HVDC High‐voltage direct current
HTP Hudson Transmission Project
IEEE Institute of Electrical and Electronics Engineers
IGBT Insulated‐gate bipolar transistor
IGCT Integrated gate‐commutated thyristor
IOU Investor‐owned utility
IRENA International Renewable Energy Agency
iv
List of Abbreviations, Acronyms, and Initialisms
ISO‐NE Independent System Operator – New England
JEDI Jobs and Economic Development Impact
LADWP Los Angeles Department of Water and Power
LCC Line‐commutated converter
LCOE Levelized cost of energy
MI Mass impregnated
MISO Midcontinent Independent System Operator
MMC Modular multilevel converter
MVP Multi‐value projects
NREL National Renewable Energy Laboratory
NTTG Northern Tier Transmission Group
PES Power & Energy Society
PMU Phasor measurement unit
QTR Quadrennial Technology Review
RMS Root‐mean square
ROW Right‐of‐way
RPS Renewable portfolio standard
SPP Southwest Power Pool
TSO Transmission system operator
TVA Tennessee Valley Authority
TWE TransWest Express
UHVDC Ultra‐high‐voltage direct current
VER Variable energy resource
VSC Voltage‐source converter
WECC Western Electricity Coordinating Council
XLPE Cross‐linked polyethylene
HVDC and Non‐Dispatchable Generation
1
1. Summary of Findings
Worldwide, there has been a renewed resurgence and interest in developing high‐voltage direct current
(HVDC) transmission projects for economic interregional transfer of electric power (Patel 2017). In the
United States, several HVDC projects are in the planning pipeline to facilitate integration of renewable
resources in remote host regions to distant load centers. This study examines the role of HVDC lines in
mitigating the impacts of non‐dispatchable renewable generation technologies. Non‐dispatchable
technologies (or intermittent or variable generation technologies), like solar and wind, operate based on
resource availability, thereby creating dispatchability challenges for system operators. The report
addresses a number of specific questions raised by the U.S. Energy Information Administration (EIA)
designed to examine the circumstances under which HVDC lines play a role in integrating renewables, the
extent to which HVDC lines can mitigate the impact of non‐dispatchable renewable generation, the
configurations of HVDC suited for renewable integration, potential grid issues in using HVDC lines for
renewables integration, and the potential costs of constructing these lines based on experiences to date.
This study is based on a three‐pronged approach. First, ICF reviewed several publicly available sources to
assess the suitability of HVDC technology in addressing grid integration issues related to the development
of renewable energy. Second, ICF compiled and summarized the recent trends in HVDC project costs
based on publicly available sources to address questions related to cost‐effectiveness of deploying HVDC
solutions for renewable integration. Third, ICF relied on three detailed case studies—TransWest Express
(TWE) Project interconnecting Wyoming and California, Plains & Eastern’s Clean Line Project in Southwest
Power Pool (SPP) and the Tennessee Valley Authority (TVA) service territory, and Midcontinent
Independent System Operator’s (MISO’s) conceptual HVDC network—to address the questions outlined
in the project scope. The key findings from the study are summarized below.
The negative impacts of non‐dispatchable renewable generation include generation curtailment,
depressed or negative energy prices, system stability issues because of mismatch of generation and
demand, increased need for ancillary services, and inefficient unit commitment and dispatch. Increased
grid interconnection through HVDC transmission would enable more flexibility in power transmission from
regions with excess renewable resources (host) to regions with high electricity demand (client). Since
HVDC is decoupled from the alternating current (AC) system, the transfer from the host to client regions
can be achieved with minimal impact on the underlying AC transmission system of the host region.
Further, because HVDC has relatively low losses over long distances, the distance between the host and
client regions does not affect the ability to derive the renewable integration benefits.
Without a detailed modeling of HVDC projects, it is difficult to ascertain if there would be any reliability
implications of using an AC network of the host region to interconnect renewable resources in the host
region. The renewable penetration levels at which HVDC solutions are likely to be deployed (that is, in lieu
of AC solutions) to mitigate non‐dispatchable generation impacts tend to vary across bulk power system.
Factors such as the robustness of the underlying transmission network, the mix of generation resources,
availability of flexible resources, and the nature of the ties to neighboring systems will all affect the level
at which HVDC solutions will be deployed. Nevertheless, the current consensus from a review of available
literature is that HVDC lines make economic sense at higher penetration levels of renewables.

HVDC and Non‐Dispatchable Generation
2
The cost of an HVDC transmission system depends on many factors such as power capacity to be
transmitted, type of transmission medium (submarine or land‐based), environmental considerations,
access to easements rights‐of‐way (ROWs), and cost of converter stations and associated equipment. A
lack of recent HVDC projects in the United States makes it difficult to ascertain typical project costs. Based
on a review of recent proposals and relevant regulatory filings, the cost of HVDC projects ranges between
$1.17 million per mile and $8.62 million per mile (2017$).
HVDC and Non‐Dispatchable Generation
3
2. Introduction and Background
EIA is interested in assessing the potential for HVDC transmission networks to mitigate the impacts of
non‐dispatchable generation technologies. Non‐dispatchable technologies (or intermittent or variable
generation technologies), like solar and wind, operate when the indigenous resources are available,
thereby creating dispatchability challenges for system operators.
Some of the key operational issues associated with variable or intermittent generation include lack of
sufficient generation resources during the times of high system demand, excess generation resources
during times of low system demand, and increased need for ancillary services (like spinning or non‐
spinning reserves) to meet the ramping requirements associated with fluctuations in intermittent
generation. One application of HVDC lines suggested in the literature is the use of these transmission lines
to interconnect different regional power markets. These interconnections help to deliver power from a
power surplus region (host region) to that of a power deficient region (client region). The HVDC terminals
function as a point‐source generation injection to balance variations in intermittent renewables
generation in a given regional network.
The goal of the project is to assess the technical potential challenges in deploying HVDC interconnections
to mitigate the impacts of variable generation, and evaluate recent cost trends associated with these
types of projects. As outlined in the project scope document, ICF addresses the following questions in this
report:
How and to what extent HVDC transmission may be used to mitigate non‐dispatchable generation
impacts?
Are direct current (DC) tie lines between balancing authorities sufficient to transfer system
impacts from host to client regions, or must the non‐dispatchable generator(s) be directly
connected to the client region, bypassing any interaction with the host region?
Are some system configurations and topologies of AC and DC interfaces more effective at
mitigating some or all impacts from non‐dispatchable generation?
At what penetration levels of non‐dispatchable generation would we expect these solutions to be
deployed?
How does the penetration level change based on the type of non‐dispatchable technology
deployed, the share of conventional generation technologies, and/or other regional
characteristics?
What other parameters influence and/or determine the deployment of HVDC?
Are there limits to how well HVDC can mitigate intermittency impacts?
What are estimates of the cost of deploying HVDC for these purposes at various levels of supply?
The report addresses the following questions in relation to estimating the cost and rate of return on
investment of deploying HVDC:
What has been the historical cost per mile or cost per MW‐mile in developing HVDC transmission
facilities in the United States?

HVDC and Non‐Dispatchable Generation
4
What are the cost components, specifically fixed (costs that are independent of line length) and
variable costs (costs that are a function of line length)?
What factors influence these costs (such as regional labor costs, geography, population density,
and so forth)?
What cost‐related factors may constrain HVDC deployment?
To address these questions, ICF reviewed several publicly available sources, mainly focusing on renewable
energy grid integration and HVDC line costs. Except for a few merchant HVDC projects, there have been
few HVDC line projects in recent years in the United States. As a result, a lot of the current available
research on this topic originates from Europe, where many HVDC projects are being proposed and are
currently being implemented for renewable integration. The sources discussed are mostly peer‐reviewed
journal articles, research reports, industry newsletters, or case studies published by industry vendors,
research labs, and other reputed transmission industry stakeholders. The HVDC cost trends were also
extracted from publicly available sources. The National Renewable Energy Laboratory (NREL) JEDI 2017
report contains the most detailed cost breakdown of HVDC transmission including annual operation and
management (O&M) costs for hypothetical HVDC projects. ICF also relied on the Transmission Expansion
Planning Tool used by the Western Electricity Coordinating Council (WECC) since 2014, which provides
capital and other miscellaneous costs relating to HVDC transmission projects. The full list of resources
examined is included in the bibliography.
The remainder of this section provides a brief historical background on HVDC technology. The third section
examines the main issues posed by EIA—examining the impacts of HVDC lines in mitigating the system
impacts of variable energy generation from renewables. The report also examines three case studies—
the TWE project interconnecting Wyoming and California, Plains & Eastern’s Clean Line Project in SPP and
TVA, and MISO’s conceptual HVDC network—to highlight the challenges and issues related to HVDC and
renewable integration. This section includes a summary of insights from the three case studies in a
question‐and‐answer format designed to address the questions raised in the project scope. The study also
examines the cost trends for recent HVDC projects to address the cost‐related questions in the project
scope. The Appendix includes five sections: a summary of recent reports and articles on utilizing HVDC
technology to address renewable intermittency issues, detailed discussions of the shortlisted case studies,
an inventory of existing and proposed HVDC projects in the United States, and a glossary of technical
terms used in the report.
Power plants are often located near an energy source, such as a coal mine, to minimize fuel transportation
costs. These power plants often are located away from heavily populated load‐centers; therefore,
transporting the electricity generated economically is important. This is accomplished by transmitting the
generated power at a high voltage (stepping up at the power plant and stepping down at the substation
using a transformer at both ends). Early pioneers like Thomas Edison who first began to harness electricity
HVDC and Non‐Dispatchable Generation
5
for useful purposes did this by placing generators right next to the equipment that used the electricity.
These early generating stations delivered electricity over copper wires using DC, a method so inefficient
that the power plants had to be within a mile of the load they served.
The first commercial power station was installed at Pearl Station in lower Manhattan, New York, in 1882
(DOE 2014). In the late 1880s, George Westinghouse and others developed cost‐effective transformers to
step up and step down the voltage of AC electricity. With the development of transformers, AC power
could be sent over long distances using relatively smaller wires at a higher voltage. However, by the 1890s
other inventors like Nikola Tesla further refined and commercialized the AC power distribution system.
Cities across the world started constructing high‐voltage power transmission lines that used AC
technology, thereby firmly establishing the prominence of AC technology for transmission purposes.
Typically, transmission of electric power is accomplished at high voltages where the transmission losses
are minimized. For a given quantity of power, doubling the voltage will deliver the same amount of power
at half the current flow. Doubling the voltage reduces the power losses by a factor of four.1
Most of the early attempts to transform the DC voltage to higher or lower levels relied on mechanical
devices, which were not cost‐effective on a commercial scale. The early research on HVDC technology and
potential converter technologies was pioneered by Sweden’s ASEA (Long and Nilsson 2007).2 Dr. Uno
Lamm of ASEA first patented low‐pressure mercury‐arc converters for HVDC applications in 1929. There
were other technical and manufacturing issues before the first practical mercury‐arc valves could be built.
Early demonstrations of HVDC technology was also tested and implemented in the Soviet Union (now
Russia) in 1951 between Moscow and the nearby city of Kashira (Long and Nilsson 2007). The first
commercial HVDC link, developed by ASEA, was constructed in 1954 for carrying power between mainland
Sweden and the island of Gotland. The line was rated at 100 (kilovolt) kV and had the capacity to deliver
20 megawatt (MW) of power.
In the 1970s, HVDC lines were constructed with solid‐state converter devices like thyristor valves. HVDC
that uses thyristor valves is also known as line‐commutated converter (LCC) HVDC (Long and Nilsson
2007). In the mid‐1990s, voltage‐source converters (VSCs) were commercialized for HVDC applications. In
recent years, power electronics devices like insulated‐gate bipolar transistors (IGBTs), gate turn‐off (GTO)
thyristors, and integrated gate‐commutated thyristors (IGCTs), have made smaller HVDC systems more
economical (Rudervall, Charpentier and Sharma 2000). Currently, the longest HVDC line in the world is
the Rio Madeira link in Brazil, which connects hydropower plants in the Madeira River in the Amazon basin
to major urban load centers like Sao Paulo and Rio de Janeiro in southeastern part of Brazil (ABB n.d. a).
This HVDC link consists of two bipolar 600 kV DC transmission lines with a line length of 2400 kilometers
(km) and a transmission capacity of 3150 MW on each pole. China currently leads in the construction of
HVDC transmission lines in the world today. China has also successfully implemented ultra‐high‐voltage
direct current (UHVDC) transmission lines in recent years (rated at 800 kV and above) (ABB 2016). China
1 Power P = V*I. Doubling of voltage (V), reduces the current (I) by half. Power loss L =I2*r= (P/V)2*r. Doubling of voltage, reduces the losses (L) by a factor of four. 2Allmänna Svenska Elektriska Aktiebolaget (ASEA) (General Swedish Electric Company) was a Sweden‐based engineering
company. In 1988, it merged with the Swiss company Brown, Boveri & Cie (BBC), which then became the ABB (ASEA Brown Boveri) Group. ASEA is now the holding company of ABB Group.
HVDC and Non‐Dispatchable Generation
6
is currently planning to build the Changji‐Guquan UHVDC link between Xinjiang regions in the northwest
to Anhui province in the eastern region of China. The UHVDC line is expected to be rated at 1100 kV
voltage, 3000 km in length, and 12 gigawatt (GW) of transmission capacity. When completed, this project
is expected to set world records for HVDC lines in terms of voltage level, transmission capacity, and line
length.
In the United States, the first commercial HVDC project was the 500 kV Pacific DC Intertie connecting
Bonneville Power Administration’s (BPA) service territory in the Pacific Northwest to Los Angeles
Department of Water and Power (LADWP) service territory in California (Bonneville Power Administration
2010). The project was completed in 1970 and was undertaken as a collaborative effort between General
Electric of the United States and ASEA of Sweden. The line was built to deliver low‐cost hydropower from
BPA region to load centers in southern California. The other important HVDC line in the Western
Interconnection region is the Intermountain HVDC Transmission link (or Path 27) between Adelanto
Converter Station in LADWP service territory in California and Intermountain Converter Station in Delta,
Utah. The line is a bipolar line capable of operating at ±500 kV and can transmit up to 2400 MW of power.
In the Eastern Interconnection, the longest‐operating HVDC link is the Quebec – New England
Transmission that connects Radisson, Quebec and Sandy Point in Ayer, Massachusetts (in ISO‐NE service
territory). The line is capable of operating at ±450 kV and can transmit up to 2000 MW. This line was built
to deliver low‐cost hydropower from the Hydro Quebec region to load centers in Boston area of
Massachusetts.
In addition to these utility‐developed HVDC links, numerous merchant HVDC links have also been
developed in recent years. These projects are primarily submarine cable systems that interconnect
adjacent ISO/RTOs or supply power to large urban demand centers. These include Trans Bay Cable in San
Francisco (±200 kV, 400 MW); Cross Sound Cable (± 150 kV, 330 MW); Neptune Cable (550 kV, 660 MW);
and Hudson Transmission Partners (660 MW). In addition, there are more than 15 HVDC facilities or AC‐
DC interties between the grid networks in North America, including the Eastern Interconnect, Western
Interconnect, Electricity Reliability Council of Texas (ERCOT), and Comisión Federal de Electricidad (CFE)
Mexico.
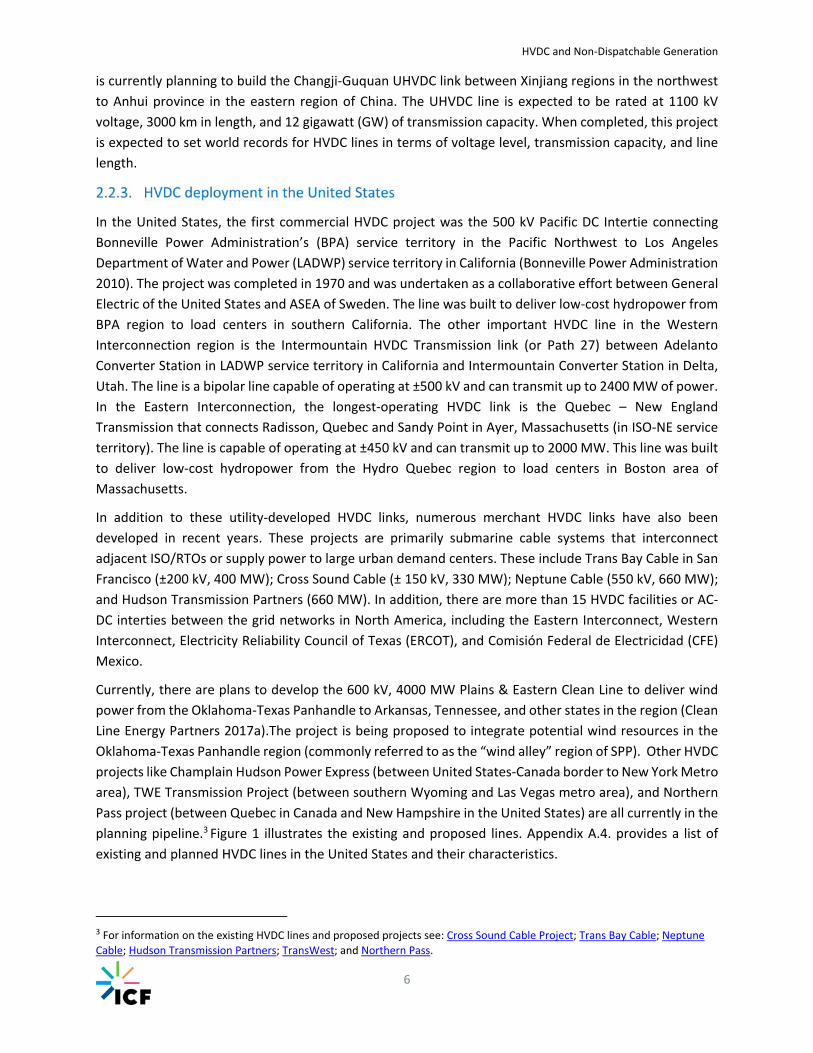
Currently, there are plans to develop the 600 kV, 4000 MW Plains & Eastern Clean Line to deliver wind
power from the Oklahoma‐Texas Panhandle to Arkansas, Tennessee, and other states in the region (Clean
Line Energy Partners 2017a).The project is being proposed to integrate potential wind resources in the
Oklahoma‐Texas Panhandle region (commonly referred to as the “wind alley” region of SPP). Other HVDC
projects like Champlain Hudson Power Express (between United States‐Canada border to New York Metro
area), TWE Transmission Project (between southern Wyoming and Las Vegas metro area), and Northern
Pass project (between Quebec in Canada and New Hampshire in the United States) are all currently in the
planning pipeline.3 Figure 1 illustrates the existing and proposed lines. Appendix A.4. provides a list of
existing and planned HVDC lines in the United States and their characteristics.
3 For information on the existing HVDC lines and proposed projects see: Cross Sound Cable Project; Trans Bay Cable; Neptune
Cable; Hudson Transmission Partners; TransWest; and Northern Pass.
HVDC and Non‐Dispatchable Generation
7
Figure 1. Existing and planned HVDC lines and interties in North America
Source: Created by ICF using ABB Velocity Suite Note: Dashed lines represent planned HVDC projects.
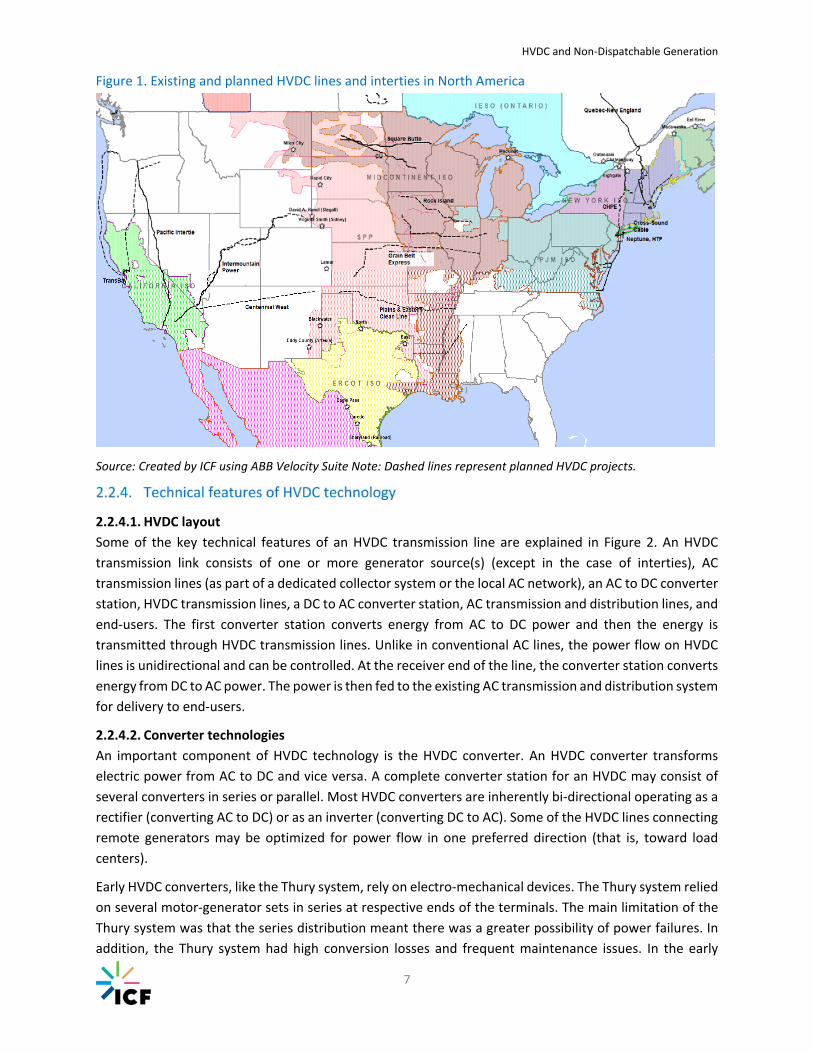
2.2.4.1. HVDC layout
Some of the key technical features of an HVDC transmission line are explained in Figure 2. An HVDC
transmission link consists of one or more generator source(s) (except in the case of interties), AC
transmission lines (as part of a dedicated collector system or the local AC network), an AC to DC converter
station, HVDC transmission lines, a DC to AC converter station, AC transmission and distribution lines, and
end‐users. The first converter station converts energy from AC to DC power and then the energy is
transmitted through HVDC transmission lines. Unlike in conventional AC lines, the power flow on HVDC
lines is unidirectional and can be controlled. At the receiver end of the line, the converter station converts
energy from DC to AC power. The power is then fed to the existing AC transmission and distribution system
for delivery to end‐users.
2.2.4.2. Converter technologies
An important component of HVDC technology is the HVDC converter. An HVDC converter transforms
electric power from AC to DC and vice versa. A complete converter station for an HVDC may consist of
several converters in series or parallel. Most HVDC converters are inherently bi‐directional operating as a
rectifier (converting AC to DC) or as an inverter (converting DC to AC). Some of the HVDC lines connecting
remote generators may be optimized for power flow in one preferred direction (that is, toward load
centers).
Early HVDC converters, like the Thury system, rely on electro‐mechanical devices. The Thury system relied
on several motor‐generator sets in series at respective ends of the terminals. The main limitation of the
Thury system was that the series distribution meant there was a greater possibility of power failures. In
addition, the Thury system had high conversion losses and frequent maintenance issues. In the early

HVDC and Non‐Dispatchable Generation
8
1930s, mercury‐arc valves were developed and it took well over two decades for the technology to be
incorporated in a commercial HVDC line. Mercury valves rely on line voltage of the AC system to which
the converter is connected to force the current to zero and turn off the valve. Therefore, converters built
with mercury‐arc valves are known as line‐commutated converters (LCCs). Mercury‐arc converters were
used until the early 1970s. In North America, the Nelson River DC Transmission System in Canada was the
largest operating HVDC line with mercury‐arc valves.
Since the 1970s, many of the HVDC lines with mercury valves were replaced with thyristor or other
converter technology. Thyristor valves are solid‐state semiconductor devices that require external an AC
circuit to turn them off or on. Like mercury‐arc valves, even HVDC lines using thyristor are referred to as
LCC HVDCs. Thyristor valves have a breakdown voltage of a few kilovolts each. For a commercial HVDC
converter station, thyristor converters are constructed using a large number of thyristors connected in
series. Additional passive components like grading capacitors and resistors are connected in parallel with
each thyristor to ensure the voltage is shared between the thyristors. In a typical converter station, there
could be hundreds of thyristor circuits. An incremental improvement to the thyristor‐based commutation
are capacitor‐commutated converters (CCCs). The CCCs use a commutation capacitor inserted in series
between the converter transformer and the thyristor valves. Most of the operating HVDCs lines in the
world today rely on thyristor‐based converter technology for conversion.
Since thyristor‐based converters can only be turned on by control action and require external AC line
supply to switch them off, they cannot feed power into a passive system. To overcome this shortcoming,
VSCs using semiconductor devices were developed (Flourentzou, Agelidis and Demetriades 2009). Such
converters have the ability not only to turn on but also to turn off. Two types of semiconductors are
typically used in VSCs: GTO thyristors or IGBTs (Rudervall, Charpentier and Sharma 2000). These
converters have additional advantages, such as the fact that they can switch on and off many times to
improve harmonic performance and they are not dependent on synchronous machines in the AC system
for its operation. A VSC‐HVDC can also feed power to an AC network containing only passive load. VSC
converters are also much more compact and are preferred for applications where converter station space
is at a premium (for example, submarine cables near urban centers). The VSC converter consists of two‐
level or multilevel converters, phase‐reactors, and AC filters. Each single valve element is built up with a
number of series‐connected IGBTs together with associated power electronics devices. The valves, control
equipment, and cooling equipment are usually in enclosures (typically the size of a shipping container),
which make the installation and transportation easy.
2.2.4.3. Other HVDC components
In addition to converters, other components are part of a typical HVDC converter station (see Figure 2).
Transformers at the HVDC converter station adapt the AC voltage level to the high DC voltage level. AC
filters and capacitor banks are installed to limit the amount of harmonics to the level required by the
network. In an HVDC conversion process, the converter consumes reactive power, which is compensated
in part by filter banks and the rest by capacitor banks. In the case of a CCC, the reactive power is
compensated by the series capacitor installed in series between the converter valves and the converter
transformer. With VSC converters, there is no need to compensate any reactive power consumed by the
converter itself. Therefore, the number of filters required for this this type of converters is reduced
drastically.

HVDC and Non‐Dispatchable Generation
9
Figure 2. Schematic of an HVDC line
Source: ABB (2014b) (left) and Retzmann (2012) (right).
2.2.4.4. HVDC cables
For HVDC transmission, the transmission lines can be overhead lines or submarine cables. The overhead
line is typically bipolar, that is, two conductors with different polarity. If one pole or line fails, half of power
capacity could still be delivered. Some of the HVDC projects are also used for submarine/underground
transmission. The HVDC cables are typically of two types: solid and oil‐filled. (Rudervall, Charpentier and
Sharma 2000) The solid cables are more prevalent and economical. In this type, insulating paper
impregnated with high viscosity insulating oil is used. No length or depth limitations are applicable for
solid‐type HVDC cables. Over the years, the oil‐impregnated paper‐insulated cables (MI‐PPL) have been
the mainstay of HVDC cables worldwide. The technology was developed in response to demand for higher
voltage, larger capacity (large conductors), and longer transmission line length. This technology is not
limited by converter technology. However, its limited service experience and unsuitability for land cable
applications (because of its higher weight) may limit the use of this technology to just sub‐
sea/underground projects. The oil‐filled type of HVDC cable are completely filled with a low viscosity oil
and work under pressure. These cables are typically used for HVDC applications for less than 60 km
(Rudervall, Charpentier and Sharma 2000). In recent years, cross‐linked polyethylene cables (XLPE) have
also been developed for HVDC applications (Murata, Sakamaki and Abe et al. 2013).
On a point‐to‐point basis for longer distances, the HVDC transmission scheme is generally cost‐effective
when compared to an equivalent AC transmission scheme. HVDC lines are also used in niche applications
like interties between asynchronous grid networks and submarine cables. The advantages of HVDC
applications are summarized below:
Superior economics for long‐distance application. HVDC lines are used to evacuate power
economically from large power generators located away from demand centers. This could be large
hydropower plants (like Madeira Project in Brazil) or a collection of renewable resources in a local
area (like the proposed Clean Line HVDC Project for wind resources in the Oklahoma‐Texas
HVDC and Non‐Dispatchable Generation
10
Panhandle). HVDC lines are more economical in comparison to equivalent high‐voltage
alternating current (HVAC) lines because of lower losses and installation costs.
Lower reactive and “skin effect” losses: The power‐carrying capability of AC lines is affected by
the reactive power component of AC power, and the “skin effect” losses, which cause a non‐
uniform distribution of current over the cross‐sectional area of the conductor. HVDC lines are not
affected by reactive power components nor do they experience any losses because of “skin
effect.”
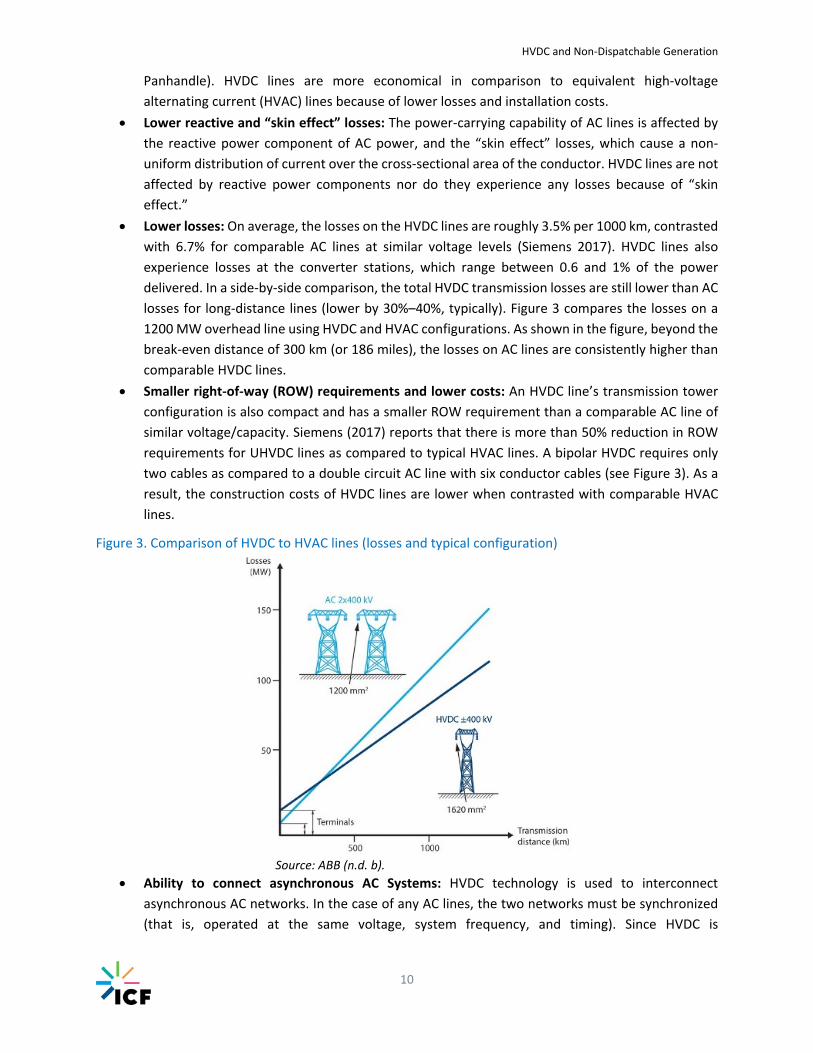
Lower losses: On average, the losses on the HVDC lines are roughly 3.5% per 1000 km, contrasted
with 6.7% for comparable AC lines at similar voltage levels (Siemens 2017). HVDC lines also
experience losses at the converter stations, which range between 0.6 and 1% of the power
delivered. In a side‐by‐side comparison, the total HVDC transmission losses are still lower than AC
losses for long‐distance lines (lower by 30%–40%, typically). Figure 3 compares the losses on a
1200 MW overhead line using HVDC and HVAC configurations. As shown in the figure, beyond the
break‐even distance of 300 km (or 186 miles), the losses on AC lines are consistently higher than
comparable HVDC lines.
Smaller right‐of‐way (ROW) requirements and lower costs: An HVDC line’s transmission tower
configuration is also compact and has a smaller ROW requirement than a comparable AC line of
similar voltage/capacity. Siemens (2017) reports that there is more than 50% reduction in ROW
requirements for UHVDC lines as compared to typical HVAC lines. A bipolar HVDC requires only
two cables as compared to a double circuit AC line with six conductor cables (see Figure 3). As a
result, the construction costs of HVDC lines are lower when contrasted with comparable HVAC
lines.
Figure 3. Comparison of HVDC to HVAC lines (losses and typical configuration)
Source: ABB (n.d. b).
Ability to connect asynchronous AC Systems: HVDC technology is used to interconnect
asynchronous AC networks. In the case of any AC lines, the two networks must be synchronized
(that is, operated at the same voltage, system frequency, and timing). Since HVDC is
HVDC and Non‐Dispatchable Generation
11
asynchronous, it can adapt to any rated voltage and frequency it receives. Hence, HVDC
technology is used as interties between asynchronous AC networks worldwide.
Suitability for underwater applications: HVDC technology is the predominant choice for
submarine cables. A cable with insulated sheets and metal outer sheath acts like a capacitor. With
longer distance cable, the capacitance (of the cable increases. For long‐distance AC transmission
using cables, the reactive power flow resulting from the large cable capacitance will limit the
maximum possible transmission distance. Hence, HVDC lines are the only viable options for long‐
distance submarine cables. For these reasons, HVDC lines are preferred for interconnecting
offshore wind plants worldwide.
Higher capacity rating: HVDC lines are also operated at rated peak voltage conditions at all times,
unlike AC lines that on average operate at a root‐mean square (RMS) value of the rated peak
voltage. Since the RMS voltage ratings is only 71% of the peak, the power transmission capability
when operating with HVDC is approximately 40% higher than the capability when operating with
AC.
Ability to handle longer periods of overload operations: HVDC lines can operate at overload
capacity for a limited period (usually at 10%–15% higher than the rated capacity for less than 30
minutes). This would give sufficient time for system operators to implement mitigation measures
under contingency conditions. Such extended operation of the line under overload conditions is
not possible with AC lines.
Ability to manage instabilities: Since HVDC lines can operate asynchronously, they are used to
ensure system stability by preventing cascading failures from propagating from one part of the
grid to another. The direction and magnitude of power flow on DC lines can also be controlled by
system operators. These lines could be used for power injections to balance the grid during any
supply‐demand imbalance.
The HVDC transmission scheme also has disadvantages that relate to cost, conversion equipment,
switching, control, and availability. The disadvantages of HVDC transmission schemes are summarized
below:
Higher costs at short distances. As explained earlier, HVDC lines are cost‐effective only beyond a
certain break‐even distance for corresponding voltage and power capacity. The cost of HVDC
projects are also higher due to converter stations and associated equipment. HVDC projects make
economic sense only for projects exceeding a certain critical distance. As a rough rule of thumb,
ABB reports this critical distance as 60 km (or 37 miles) for HVDC submarine lines and 200 km (or
124 miles) for overhead lines (ABB 2014b). For shorter distances, the investment in HVDC
converter stations and related assets may be larger than comparable AC transmission lines. Also,
maintaining an inventory of customized HVDC assets imposes additional costs on the system
operator/transmission line owner.

HVDC and Non‐Dispatchable Generation
12
Figure 4. Cost comparison curves for HVDC and AC lines (generic estimates)
Source: ABB (2014b).
Limited control between terminals: In contrast to AC transmission systems, implementing a
multi‐terminal HVDC system is complicated and cost prohibitive. Controlling power flow between
terminals remains a technical challenge.
Lower availability: HVDC schemes offer lower availability than comparable AC systems, mainly
due to conversion stations and associated equipment. In addition, the converter stations have
limited overload capacity.
Greater complexity in components. HVDC circuit breakers are difficult to build since some kind
of mechanism needs to be developed to force the current to zero without causing arcing and
contact wear. Mechanical circuit breakers are too slow for HVDC lines, although they have been
predominantly used in other applications. Only recently have commercial circuit breakers for
HVDC applications been introduced in the market (ABB 2012), which uses a combination of power
electronics and fast mechanical breakers.
HVDC and Non‐Dispatchable Generation
13
3. Analysis and Results
The U.S. generation portfolio is undergoing a significant transformation with ongoing retirements of
baseload units like coal and nuclear, and growth in natural gas, wind, and solar resources (APS Physics
2010, NERC 2016). This shift is driven by several factors, such as existing and proposed federal, state, and
regional environmental regulations, low natural gas prices, and the integration of both distributed and
utility‐scale renewable resources. Renewable resources can be categorized as either (1) dispatchable
renewables (for example, hydro, geothermal, and biomass), which can be dispatched based on system
requirements, or (2) non‐dispatchable renewables (for example, solar and wind), whose output depends
on weather conditions and time of day, and cannot be operated in response to dispatch signals. The
increasing deployment and penetration of non‐dispatchable renewable resources like solar and wind
across the country could pose special challenges to the system operators since these resources cannot be
controlled to meet grid requirements.
Two features of non‐dispatchable renewable resources may prove problematic for overall grid operation
and reliability. First, the output from renewable resources like solar and wind are variable over time and
are subject to local weather conditions. Unlike other conventional technologies like fossil fuel, hydro
(including pumped storage), and nuclear, the output from renewables cannot be planned and dispatched
in advance to meet the projected demand. As a result, these resources are sometimes termed as variable
energy resources (VERs). At low renewable penetration level, VERs pose no system reliability issues.
However, at higher penetration levels, the system demand minus VER generation (or net load that must
be supplied by other dispatchable resources) varies significantly and becomes difficult to predict. This
poses system reliability and power dispatch/commitment challenges to grid operators. The second factor
is the variability in renewable generation calls for increased ancillary service resources to meet higher
ramping requirements, frequency, and voltage support. Some of the reliability services affected by large
integration of VERs include ramping requirements, system inertia and frequency response, and active and
reactive power controls. As penetration of VERs increases, the need for additional system flexibility and
ancillary service requirements will also increase.
In the United States, the share of VERs in the overall capacity mix has been steadily increasing in recent
years. The total installed capacity of solar and wind resources in the country are currently estimated to
be around 106 GW (out of a total capacity of 1,130 GW as of end of 2016). This share is expected to
increase in the near future as the share of VERs increase to 190 GW by 2020 (out of a total expected
capacity of 1,272 GW by 2020). By 2020, the VERs are expected to constitute nearly 15% of the installed
capacity in the United States. The share of VERs is higher in some of the ISO/RTOs like California
Independent System Operator (CAISO), ERCOT, and SPP. Two important factors are driving the surge in
deployment of VERs. First, federal incentives like investment/production tax credits are driving the
renewable growth in recent years (DSIRE 2017). With the incentives expiring in the near future, there is a
rush to develop wind and solar resources. Second, the renewable portfolio standards (RPSs) or obligations
set by different states are contributing to the renewable build‐up. To date, nearly 29 states and
Washington, DC, have implemented some form of a mandatory RPS policy (DSIRE 2017). Additionally,

HVDC and Non‐Dispatchable Generation
14
eight additional states have RPS obligations that are not binding. States like California and New York have
set ambitious RPS targets of 50% or more by 2030. With these changes, the national generation portfolio
in the near‐ to long‐term future is expected to change significantly.
Figure 5. Generation capacity in the United States by fuel type (existing and planned)
Source: Compiled by ICF using SNL data.
Note: Future capacity estimates are based on actual planned and under‐construction projects.
Figure 6. Wind and solar generation capacity in the United States (existing and planned)
Source: Compiled by ICF using SNL data.
Note: Future capacity estimates are based on actual planned and under‐construction projects.
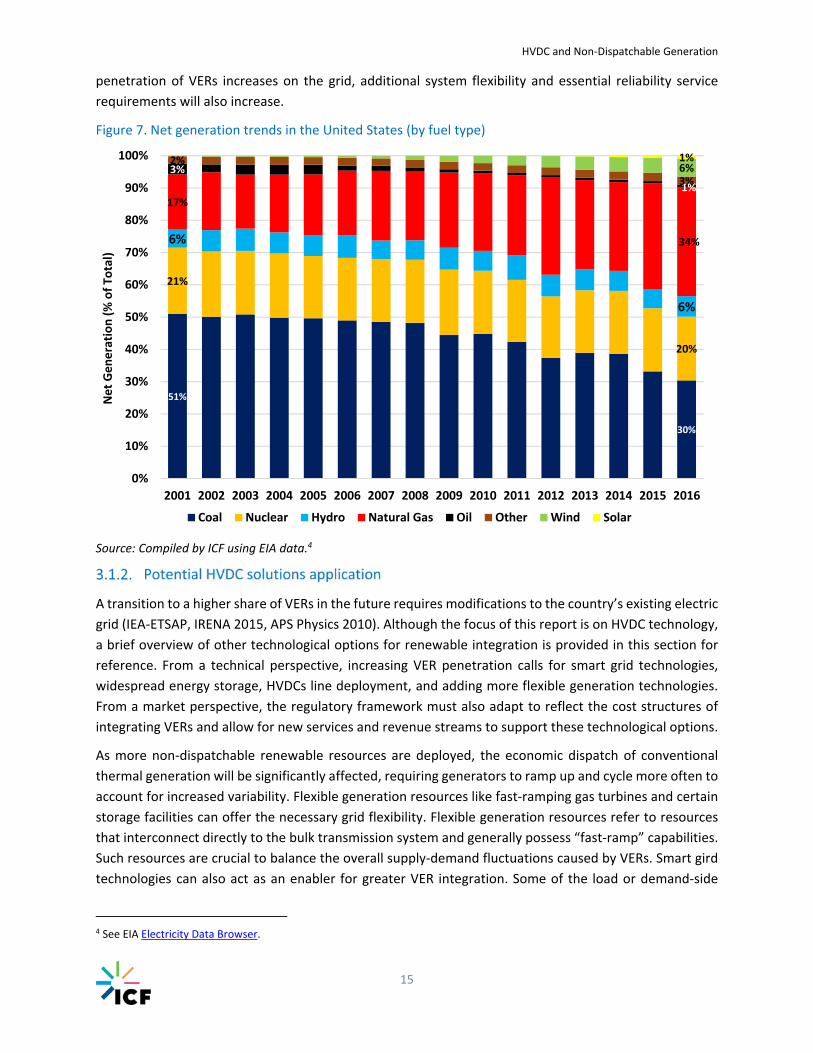
The net generation trends for the United States also show an increasing dispatch from VERs like solar and
wind. In 2016, wind and solar contributed nearly 7% of the total generation. From 2001 to 2016, the net
energy generation from VERs increased from 7,280 GWh to nearly 263,626 GWh, with an average annual
growth rate of 27% for the past 15 years. This trend is only expected to increase in the near future with
the planned capacity of solar and wind projects in the pipeline. In the future, curtailment of output from
VERs is also likely to emerge as an acute issue because of over‐generation concerns during light‐load
conditions or potential overloading of transmission lines because of transmission constraints. As
0
200
400
600
800
1,000
1,200
1,400
200020012002200320042005200620072008200920102011201220132014201520162017201820192020
Installed Cap
acity (GW)
Biomass Coal Gas Geothermal Nuclear Oil Other Nonrenewable Solar Water Wind
0
20
40
60
80
100
120
140
160
180
200
2000 2001 2002 2003 2004 2005 2006 2007 2008 2009 2010 2011 2012 2013 2014 2015 2016 2017 2018 2019 2020
VER
s (Solar & W
ind) (GW)
Wind Solar
HVDC and Non‐Dispatchable Generation
15
penetration of VERs increases on the grid, additional system flexibility and essential reliability service
requirements will also increase.
Figure 7. Net generation trends in the United States (by fuel type)
Source: Compiled by ICF using EIA data.4
A transition to a higher share of VERs in the future requires modifications to the country’s existing electric
grid (IEA‐ETSAP, IRENA 2015, APS Physics 2010). Although the focus of this report is on HVDC technology,
a brief overview of other technological options for renewable integration is provided in this section for
reference. From a technical perspective, increasing VER penetration calls for smart grid technologies,
widespread energy storage, HVDCs line deployment, and adding more flexible generation technologies.
From a market perspective, the regulatory framework must also adapt to reflect the cost structures of
integrating VERs and allow for new services and revenue streams to support these technological options.
As more non‐dispatchable renewable resources are deployed, the economic dispatch of conventional
thermal generation will be significantly affected, requiring generators to ramp up and cycle more often to
account for increased variability. Flexible generation resources like fast‐ramping gas turbines and certain
storage facilities can offer the necessary grid flexibility. Flexible generation resources refer to resources
that interconnect directly to the bulk transmission system and generally possess “fast‐ramp” capabilities.
Such resources are crucial to balance the overall supply‐demand fluctuations caused by VERs. Smart gird
technologies can also act as an enabler for greater VER integration. Some of the load or demand‐side
4 See EIA Electricity Data Browser.
51%
30%
21%
20%
6%
6%
17%
34%
3%
1%
2%
3%6%1%
0%
10%
20%
30%
40%
50%
60%
70%
80%
90%
100%
2001 2002 2003 2004 2005 2006 2007 2008 2009 2010 2011 2012 2013 2014 2015 2016
Net Generation (% of To
tal)
Coal Nuclear Hydro Natural Gas Oil Other Wind Solar
HVDC and Non‐Dispatchable Generation
16
technologies like demand‐side management and advanced metering infrastructure help the system
operator to maintain supply‐demand balance in light of intermittent output from VERs. Smart grid
technologies like phasor measurement units (PMUs) and advanced control systems help system operators
to maintain grid reliability in light of intermittent output from VERs. New advances in wind and solar
technologies allow them to operate over a wide range of conditions and provide ancillary services like
frequency and voltage control. This could also contribute to bulk system reliability. Energy storage
technologies can alleviate short‐term variability caused by the intermittent nature of VER output. Energy
storage can also alleviate long‐term variability through careful scheduling and operation of pumped‐
storage hydropower units. In addition, distribution‐level grid configurations like micro‐grids and island
systems can also facilitate greater integration of VERs in the future.
Increased grid interconnection at regional, national, and trans‐national grid networks would enable more
flexibility in power transmission from regions with excess renewable resources to regions with high
electricity demand. Higher interconnection and transmission capacity also enables the optimal use of
surplus generation, alleviates the problems associated with intermittent generation from VERs, reduces
the requirements for ancillary services, alleviates congestion, and obviates the need for new generator
resources in some cases.
However, the focus of this report is restricted to application of HVDC technology to mitigate the problems
associated with renewable intermittency. Not only do HVDC lines facilitate integration of new VERs, they
can also mitigate the impacts of such resources on grid reliability. Many of the promising wind and solar
resources are located far away from the major load centers in the contiguous United States. Integrating
these resources would require constructing new HVDC lines connecting these regions to major load
centers across the country. Conventional HVDC technology can facilitate the integration of renewable
resources like wind and solar spread out in a given local area. HVDC technology also offers a partial
solution to the problem of intermittency of renewable energy. Aggregating the output of VERs over many
individual units substantially increases bulk system reliability and decreases overall supply fluctuations as
well. HVDC lines can also help to transfer power from generation‐excess regions to generation‐deficient
regions to balance the system. Because of these advantages, system operators and developers favor HVDC
solutions to integrate and deliver power to load centers. As discussed earlier, several HVDC transmission
projects are currently proposed to integrate wind resources in the upper‐central Midwest areas, and solar
resources in southwestern areas of the United States to the demand centers on the East and West coasts.
The suitability of such transmission solutions and challenges in implementing the solutions are explained
using three specific case study examples discussed in Appendix A.1.
HVDC and Non‐Dispatchable Generation
17
This section summarizes key insights and answers to the key questions formulated in the project’s scope,
which are based on the literature review conducted for this report and the detailed case studies discussed
in Appendix A‐1.
How and to what extent may HVDC transmission be used to mitigate non‐dispatchable generation
impacts?
The negative impacts of non‐dispatchable generation include generation curtailment, depressed or
negative energy prices, system stability issues because of mismatch of generation and demand, increased
need for ancillary services, and inefficient unit commitment and dispatch. Increased grid interconnection
through HVDC transmission would enable more flexibility in power transmission from regions with excess
renewable resources to regions with high electricity demand. As discussed, HVDC has characteristics that
allow it to mitigate the non‐dispatchable impacts and improve renewable resource integration. These
characteristics include DC power flows being controllable, low losses over long‐distance transmission, and
the ability for asynchronous interconnection (allowing for efficient ties between different balancing
authorities and even different interconnections).
The studies reviewed in this report demonstrate the capability of HVDC to mitigate some of the impacts
of non‐dispatchable resources. HVDC can deliver excess generation from the host region to a client region
that has a demand for the output of the renewable resource. Because HVDC is decoupled from the AC
system, the transfer from the host to client regions can be achieved with minimal impact on the underlying
AC transmission system of the host region and any neighboring regions. It also allows for the
interconnection of host and client regions that could be in different interconnections, which would not be
practical for AC lines. In cases where the host and client regions are not in the same balancing authority,
HVDC can reduce operational issues that might arise from loop flows. 5 Further, because HVDC has
relatively low losses over long distances, the distance between the host and client regions does not affect
the ability to derive the renewable integration benefits. For example, TWE will interconnect locations that
are 725 miles apart, while the Plains & Eastern Clean Line will transport wind energy over 700 miles.
Evacuating excess energy from the host region helps reduce curtailments and depressed or negative
prices, improve system stability, and reduce the need for ancillary services. Generation that would
otherwise be curtailed can be used in areas with a demand for renewable generation. This is
demonstrated in Brenna et al. (2017), where the introduction of an HVDC interconnection between
northern and southern Italy reduced curtailment of wind generation by approximately 79% and improved
overall benefits to customers. The MacDonald et al. report (2016) also showed that HVDC
interconnections between regions could facilitate the delivery of renewable generation from areas with
a surplus to demand regions, and reduce curtailments in the system as a whole. The ability to deliver
excess generation to the demand regions helps sustain power prices and reduce the number of incidences
of negative prices. A similar conclusion can be drawn from NREL’s Bloom, Townsend et al. (2016) study,
which examines various renewable penetration levels combined with different transmission topologies.
HVDC transmission expansion, which allowed more export to other regions improved renewable
5 Electricity tends to flow along the path of least resistance. Loop flows are electricity flows through the electric grid to avoid congested lines/paths.
HVDC and Non‐Dispatchable Generation
18
integration and reduced curtailment. Simulations in the TradeWinds (2009) study show that HVDC
transmission upgrades can improve renewable integration and reduce overall operating cost.
The APS Physics (2010) study does not provide any simulations that demonstrate the benefits of HVDC,
but it discusses the ability of HVDC to mitigate the intermittency and variability impacts of renewable
generation. High‐capacity, controllable, long‐distance transmission lines can allow excess generation in
one area to be directed to specific targets of deficit far away, instead of being sidetracked in the grid by
local conditions.
The TWE project also demonstrates the extent to which HVDC can mitigate non‐dispatchable generation
impacts. Without the TWE project, it will not be feasible to develop and interconnect 1,500 to 3,000 MW
of wind generation to the weak Wyoming transmission grid. Without significant transmission system
upgrades, only a small fraction of the wind generation will likely be able to operate. In addition, the
reliability of the grid will be compromised. Plains & Eastern Clean Line will also allow for the development
of large amounts of wind in Oklahoma that would otherwise create reliability and other problems in SPP.
Unlike TWE, which would deliver wind connected to the host region, Clean Line will connect wind directly
to the client region, bypassing the host region. Some HVDC lines are also used to resolve intermittency
issues in both the host and the client regions depending on the need. One example is the Skagerrak HVDC
lines between Norway and Denmark. Recently, ABB commissioned the fourth HVDC line of the project
with the objective of balancing loads between Norway’s hydroelectric‐based system and Denmark’s wind‐
and thermal‐based generation (ABB 2015).
The reports and case studies did not explicitly address the extent to which HVDC can mitigate system
stability issues that could occur with the integration of large amounts of non‐dispatchable generation.
TWE indicates that HVDC can provide some mitigation. The 2008 and 2010 TransWest reports show that
with the implementation of TWE, the Wyoming grid can accommodate the interconnection of 1,500 to
3,000 MW of wind, which would otherwise not be feasible on the relatively weak Wyoming grid. The
report highlights the need for protection schemes that would be necessary to avoid widespread outages
under certain contingency conditions involving injection of such a huge amount of power. Additional
studies will be required to develop a better assessment of the ability of HVDC to mitigate stability issues.
Are DC tie lines between balancing authorities sufficient to transfer system impacts from host to client
regions, or must the non‐dispatchable generator(s) be directly connected to the client region, bypassing
any interaction with the host region?
Based on the information reviewed in this study, the benefits of HVDC in mitigating the impacts of non‐
dispatchable generation can be achieved by connecting the host and client regions using an HVDC line,
but the non‐dispatchable generation does not have to be connected directly to the client region to achieve
all the benefits. However, depending on system conditions and the robustness of the underlying AC
network it might be necessary to develop protection schemes to maintain reliability in the host region
under certain emergency conditions, for example, following the loss of the wind generation or the loss of
the HVDC transmission line. In the Brenna et al. (2017) and MacDonald et al. (2016) studies, the benefits
of the HVDC line were achieved even though the wind generation was not connected directly to the client
region. In both cases, the wind generation was modeled as connected to the AC system in the host
region(s), and the HVDC line(s) connected the host and client region(s). Without the HVDC line, the non‐
HVDC and Non‐Dispatchable Generation
19
dispatchable generation would have a negative impact on grid stability in the host region. The TradeWinds
(2009) and the NREL’s Bloom, Townsend et al. (2016) studies also provide similar insights.
The preliminary planning report on the TWE project indicates that TWE would connect the host and client
balancing authorities, and will not involve the direct connection of wind generation to the client region
(TransWest Express LLC 2010). As indicated in the report, the sudden and simultaneous loss of both HVDC
circuits of TWE could result in instability and blackouts because of the relatively weak Wyoming grid. This
indicates that the wind generation will be connected to the AC system in the host region, Wyoming, rather
than directly to the client region via the HVDC line. Therefore, this also shows that the wind generation
does not have to be connected directly to the client region to achieve the expected benefits. TWE also
demonstrates the potential need for protection schemes in the host region to resolve reliability problems
under certain emergency conditions. The preliminary planning report shows that the system can
withstand the loss of only one of the two HVDC circuits without becoming unstable. Protection schemes
would be required to mitigate the impact of the simultaneous loss of the two circuits.
Similarly, the MISO conceptual study and the Square Butte HVDC project both show that HVDC benefits
can be achieved even when the non‐dispatchable generation is connected to the host region and not
directly to the client region.
Are some system configurations and topologies of HVDC lines more effective at mitigating some or all
impacts from non‐dispatchable generation?
Based on the limited review of case studies, bi‐directional/bi‐pole configuration of HVDC lines are always
preferable even if the power is expected to flow predominantly from the renewable resources (host
region) to the load centers (client region). In addition, VSC‐type converter stations would be best suited
for providing ancillary services in the form of fast‐acting frequency response, thereby making it more
effective at mitigating the impacts of non‐dispatchable generation. HVDC lines with VSC‐type converters
can respond to frequency disturbances within a fraction of a second, as compared to a few seconds using
primary/secondary control devices like governors or automatic generation control. Further, VSC‐type
converters can support voltage that helps the AC system to recover faster. HVDC lines can also operate at
overload conditions for a longer period (at 10%–15% higher than the rated capacity for less than 30
minutes). This would give sufficient time for system operators to implement mitigation measures under
contingency conditions involving variations in intermittent VER output.
The Friends of the Supergrid report (2012) describes hybrid AC/DC systems and states that an HVDC
system in parallel to an AC system increases power transmission capacity and at the same time contributes
to system stability. Using a simulated fault on an AC line running in parallel with an HVDC line, it
demonstrates how the HVDC link can dampen the oscillations resulting from the fault and restore system
stability. HVDC improves stability in extended AC systems, which is important for renewable resources
that have to be delivered across long distances. ABB’s HVDC review (ABB 2014a) emphasizes the ability of
HVDC lines to improve stability in hybrid AC/DC systems, and cites the Pacific DC Intertie in the western
United States as an example. The area of the country is characterized by long‐distance transmission lines
that connect generation in the north to load centers in the south. In addition, the report describes other
advantages of HVDC in hybrid AC/DC systems, such as the ability of HVDC to act as a firewall and prevent
disturbances from spreading from one AC system to another, and to provide artificial inertia.

HVDC and Non‐Dispatchable Generation
20
At what penetration levels of non‐dispatchable generation would we expect HVDC solutions to be
deployed?
The penetration levels at which HVDC solutions are likely to be deployed to mitigate non‐dispatchable
generation impacts vary by system. Factors such as the robustness of the underlying transmission
network, the mix of generation resources, availability of flexible resources, and the nature of the ties to
neighboring systems will all affect the level at which HVDC solutions will be deployed. Additionally,
analysis that is more detailed will be required to assess how these factors affect the penetration level,
and to determine more specific penetration levels at which HVDC will be deployed.
ICF examined information from selected ISO/RTO regions to determine the penetration levels at which
the operators started implementing solutions to address renewable integration issues. Because of the
limited information available, this approach is based on anecdotal evidence and it provides indicative
measures of the penetration levels rather than precise values. ICF assumed that unless other solutions
are preferred, HVDC solutions will be deployed when operators start observing problems on their systems.
The annual average penetration levels for CAISO, ERCOT, and MISO are shown in Table 1. The penetration
levels range from a low of 4.8% in MISO to 11.5% in CAISO.
Table 1. Penetration levels corresponding to historic market initiatives
Region Market Initiative Implementation Year Annual Average Penetration Level
CAISO EIM 2014 11.5 %
ERCOT CREZ 2014 5 %
MISO DIR, MVP 2011 4.8 %
Source: SNL.
System operators are continuing to operate the bulk power system under high renewable penetration
levels. ERCOT, CAISO, and SPP have seen hours wherein the highest hourly penetration has exceeded 50%
of the hourly system demand in 2017 (see Table 2). However, all of these regions have implemented large
investments in transmission and other mitigating measures to improve renewable integration and
penetration levels.
Table 2. Maximum renewable penetration in select ISO/RTOs
ISO/RTOs Highest Hourly Penetration
Annual Average Penetration
SPP 54% 14.6%
CAISO ~54% 16.3%
MISO ‐ 9%
ERCOT 50% 11%
Source: Press articles and SNL.
Note: Renewable penetration is the percentage of system demand met by wind and solar generation in a given period.
The ability to deploy alternative solutions will affect the threshold penetration level for HVDC deployment. CAISO expanded the Energy Imbalance Market (EIM), introduced a flexible resource adequacy product, and lowered
minimum threshold for energy bid prices from renewable generators. ERCOT implemented the Competitive

HVDC and Non‐Dispatchable Generation
21
Renewable Energy Zone (CREZ) transmission projects, and MISO implemented a DIR program and developed AC transmission to support renewable integration. The improved penetration levels are shown in Table 3 below.
Table 3. Changes in penetration levels for alternative mitigation solutions
Implementation
Year
Annual Renewables Penetration Level (%)
Region Market Initiative Pre‐Change Post‐Change (2016)
CAISO EIM 2014 11.5 % 16 %
ERCOT CREZ 2014 5 % 11 %
MISO DIR, MVP 2011 4.8 % 9 %
Source: SNL.
How does the penetration levels of non‐dispatchable generation at which we would expect HVDC
solutions to be deployed change based on the type of non‐dispatchable technology deployed, the share
of conventional generation technologies, and/or other regional characteristics?
Intra‐ and interregional HVDC lines make economic sense at high penetration levels of VERs deployed.
Most HVDC projects in the United States are being proposed to deliver the output from a cluster of wind
projects in a local area (for example, TWE and Clean Line HVDC projects). In addition, several existing
HVDC lines are designed to transport hydropower generation (for example, Pacific Intertie and Quebec –
New England lines). In our experience, for the case of big solar projects, AC lines are typically proposed
(for example, Nevada West Connect and SunZia Southwest Transmission projects). Although the type of
non‐dispatchable technology should not affect the technical feasibility of HVDC lines, these lines have
been deployed primarily for wind and hydropower generation to date.
The information examined within the scope of this study is not sufficient to provide a quantitative
measure of the effect of the variations in the factors discussed in the answers above. As described
qualitatively in the previous question, several factors can affect the penetration levels at which solutions
will be required. The type of non‐dispatchable technology can have a material impact. Distributed
resources, such as solar, present challenges that are different from utility‐scale renewable resources.
System operators can manage utility‐scale renewables to some extent, and even direct that the
generation be curtailed to resolve severe reliability problems. Achieving the same level of control with
distributed resources is difficult because it is behind the meter and cannot easily be curtailed. We believe
some of the recent improvements in several regions to enhance the integration of renewable resources
are instructive in understanding how factors such as the nature of the underlying transmission network,
the share of conventional generation technologies, and other regional characteristics can affect the
threshold penetration level.
In ERCOT, the development of the CREZ lines reinforced the underlying transmission network and allowed
the annual penetration level to increase to 11% in 2016 and the maximum hourly penetration reaching a
high of ~50% in 2017. This shows that a region with a robust transmission interconnection between host
and client areas would have a relatively higher threshold penetration level. A region with an underlying
transmission network like the pre‐CREZ ERCOT system will need solutions sooner than one like the post‐
CREZ system. A similar conclusion can be drawn from the impact of the MISO’s Multi Value Project
HVDC and Non‐Dispatchable Generation
22
Portfolio (MVP), which has helped improve penetration levels in the region.6 CAISO’s expansion of the
EIM shows how market mechanisms and access to neighboring regions can affect the threshold
penetration level. CAISO is able to share its surplus generation with neighboring regions, increasing the
penetration level at which CAISO would otherwise need other solutions. Table 3, above, shows how
changes in regional characteristics can affect the threshold penetration level. As indicated in Table 3, the
threshold penetration level was much lower in MISO’s case, as compared to CAISO’s case, when an
alternative mitigation solution was implemented to address renewable intermittency issues.
The feasibility of HVDC solutions is also contingent on technical aspects like the distance between the host
and client region, availability of renewable resources in a concentrated local area, whether delivery is
point‐to‐point or special offtake arrangements are required, whether client and host regions are located
in the same region or interconnection. Typically, transmission lines within a balancing area rely on AC lines
to transfer power (for example, ERCOT’s CREZ transmission projects), while transmission line between
balancing areas/interconnection rely on HVDC lines (for example, Clean Line and TWE). The
characterization of penetration level will also depend on the definition of the area under consideration.
Penetration might be low in a region as a whole, but concentrations of non‐dispatchable generation within
specific sub‐regions could result in levels that require mitigation in the sub‐region. For example, MISO has
a relatively low penetration of non‐dispatchable generation region‐wide, but mitigation measures have
been required in the Minnesota and Iowa areas.
What other parameters influence and/or determine the deployment of HVDC?
HVDC lines are deployed for select applications—delivering large amount of power over a long distance,
as an intertie between asynchronous interconnections, and for power transmission using submarine
cables. As discussed earlier, HVDC lines are suitable for projects beyond a critical distance for
corresponding voltage and power capacity. As a rough rule of thumb, ABB reports this critical distance as
60 km (or 37 miles) for HVDC submarine lines and 200 km (or 124 miles) for overhead lines (ABB 2014b).
For shorter distances, the investment in HVDC converter stations and related assets may be larger than
comparable AC transmission lines. HVDC lines used in renewable integration requires the availability of
large generation potential at or near the HVDC terminals (like wind resources in southern Wyoming for
TWE or wind projects in the Oklahoma‐Texas Panhandle region for Clean Line Project). HVDC technology
is the predominant technology used for submarine cables. For long‐distance AC transmission using cables,
the reactive power flow due to the large cable capacitance will limit the maximum possible transmission
distance. Hence, HVDC lines are the only viable options for long‐distance submarine cables.
Are there limits to how well HVDC can mitigate intermittency impacts?
The reports and case studies reviewed in this study did not specifically identify any limits to the ability of
HVDC to mitigate intermittency impacts. Limitations might be related to the design of the system rather
than the nature of the technology. If the line is appropriately sized to deliver flexible generation to the
host region, or to transfer excess renewable generation from the host to the client, then any negative
impacts of the non‐dispatchable generation will be sufficiently mitigated. Under‐sizing the line will limit
the line’s effectiveness. It will not be able to import sufficient flexible generation to support ramping, load
following, or other required support to a host region with significant amounts of non‐dispatchable
6 See MISO MVP.

HVDC and Non‐Dispatchable Generation
23
generation. Alternatively, it will not be sufficient to export excess non‐dispatchable generation from the
host to client regions and mitigate the impact in the host region.
Oversizing the line can also introduce operational issues and limit its effectiveness. If the capacity of the
HVDC line exceeds the threshold at which a potential outage would result in stability problems, it will
affect system operations. As discussed in Section 3, TWE would have to be designed to minimize the
simultaneous outage of the two 1,500 MW circuits that comprise the project. This precludes the use of a
single 3,000 MW HVDC circuit. System planners can develop operating procedures to manage the impact
of the loss of the line, but these arrangements will be incremental to the actual project. More detailed
studies and analyses would be required to determine specific limitations to the ability of HVDC to mitigate
intermittency impacts.
ICF has reviewed multiple, publicly available sources related to cost trends in HVDC lines. These are
sources focused on individual HVDC projects around North America, providing total project cost estimates
rather than a detailed cost breakdown. A final cost‐per‐mile ($/mile) estimate was derived from the total
project cost and the cable length of each project. The WECC Transmission Expansion Planning Tool
provides a more detailed cost analysis, including substation and converter costs for a 500‐kV HVDC bi‐
pole line.
While specific cost estimates are usually not provided in publicly available sources, NREL’s Jobs and
Economic Development Impact (JEDI) model contains a detailed breakdown of HVDC project costs,
adjustable according to the project location, cable type, voltage, and length. Table 4 contains the cost
estimates provided in the JEDI model assuming a 100‐mile, 500‐kV HVDC bi‐pole line, built on flat terrain
in a rural area.
The project capital cost is determined as the sum of the transmission line, infrastructure, and
services/other costs. NREL also includes costs incurred during the planning and preconstruction phases of
the project, along with labor costs that are adjusting according to the state selected for the project (user
input). The labor costs included in Table 4 are based on the national U. S. average, as determined by NREL.
Using the assumptions mentioned above, NREL suggests that the cost of the new transmission line would
be approximately $1.441 million per mile. Labor and installation would cost $637,000 per mile, which is
similar to the cost of materials and equipment used ($663,000 per mile). Development and
preconstruction costs are projected to be approximately $141,200.
The converter station accounts for the majority of infrastructure costs, at $275 million per station. It is
assumed that at least two stations will be required, one for each endpoint of the transmission line.
Including labor, and other equipment that may be required (transformer, shunt reactor, etc.), the total
infrastructure cost is approximately $367 million per station. An additional $78,000 per mile is added to
account for any management services used during project development (site management, legal, public
relations, engineering, etc.) This leads to a total project capital cost of $9.17 million per mile.
Along with the project capital cost, NREL provides estimates for the annual O&M costs, which include
maintenance labor and materials, any potential ROW royalty payments, insurance, replacement parts,

HVDC and Non‐Dispatchable Generation
24
and a sales tax that is dependent on the state in which this project is located. NREL estimates that the
annual O&M costs (excluding sales tax) for this project would amount to $13,300 per mile. As discussed
in the previous section, distance is an important cost factor, but not a limiting one. NREL7 also takes into
account the terrain class and population density of the site. For example, a 100‐mile line going through a
town on mountainous terrain would cost 13%8 more than a line going through a rural flatland. Cost‐
influencing factors vary between sources. Along with terrain and length, the WECC Transmission
Expansion Planning Tool takes into account additional factors, including the conductor9 and structure10
types, and the age of the transmission line.11
7 NREL JEDI terrain and population density multipliers: Terrain types include desert, farmland, flat, mountainous, and rolling. Population density types include in‐town, near‐town, and rural. 8 This was calculated using the NREL JEDI tool, and comparing layout #1 (mountainous, in‐town) with layout #2 (flat /w access, rural). 9 The three most prevalent conductor types are aluminum conductor steel reinforced cable (ACSR), aluminum conductor steel supported cable (ACSS), and high tensile low sag (HTLS). 10 Structure could be a lattice tower or tubular steel. 11 This could be a brand new line or a current line going through re‐conductoring.
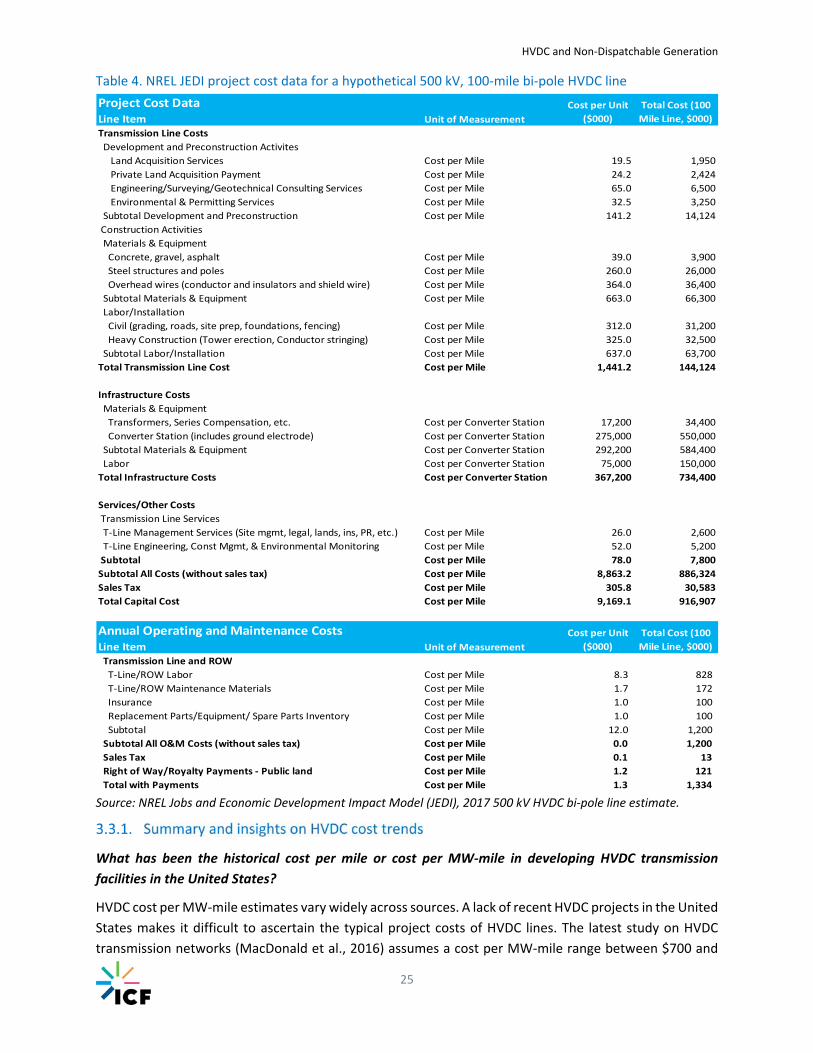
HVDC and Non‐Dispatchable Generation
25
Table 4. NREL JEDI project cost data for a hypothetical 500 kV, 100‐mile bi‐pole HVDC line
Source: NREL Jobs and Economic Development Impact Model (JEDI), 2017 500 kV HVDC bi‐pole line estimate.
What has been the historical cost per mile or cost per MW‐mile in developing HVDC transmission
facilities in the United States?
HVDC cost per MW‐mile estimates vary widely across sources. A lack of recent HVDC projects in the United
States makes it difficult to ascertain the typical project costs of HVDC lines. The latest study on HVDC
transmission networks (MacDonald et al., 2016) assumes a cost per MW‐mile range between $700 and
Project Cost DataLine Item Unit of Measurement
Transmission Line Costs
Development and Preconstruction Activites
Land Acquisition Services Cost per Mile 19.5 1,950
Private Land Acquisition Payment Cost per Mile 24.2 2,424
Engineering/Surveying/Geotechnical Consulting Services Cost per Mile 65.0 6,500
Environmental & Permitting Services Cost per Mile 32.5 3,250
Subtotal Development and Preconstruction Cost per Mile 141.2 14,124
Construction Activities
Materials & Equipment
Concrete, gravel, asphalt Cost per Mile 39.0 3,900
Steel structures and poles Cost per Mile 260.0 26,000
Overhead wires (conductor and insulators and shield wire) Cost per Mile 364.0 36,400
Subtotal Materials & Equipment Cost per Mile 663.0 66,300
Labor/Installation
Civil (grading, roads, site prep, foundations, fencing) Cost per Mile 312.0 31,200
Heavy Construction (Tower erection, Conductor stringing) Cost per Mile 325.0 32,500
Subtotal Labor/Installation Cost per Mile 637.0 63,700
Total Transmission Line Cost Cost per Mile 1,441.2 144,124
Infrastructure Costs
Materials & Equipment
Transformers, Series Compensation, etc. Cost per Converter Station 17,200 34,400
Converter Station (includes ground electrode) Cost per Converter Station 275,000 550,000
Subtotal Materials & Equipment Cost per Converter Station 292,200 584,400
Labor Cost per Converter Station 75,000 150,000
Total Infrastructure Costs Cost per Converter Station 367,200 734,400
Services/Other Costs
Transmission Line Services
T‐Line Management Services (Site mgmt, legal, lands, ins, PR, etc.) Cost per Mile 26.0 2,600
T‐Line Engineering, Const Mgmt, & Environmental Monitoring Cost per Mile 52.0 5,200
Subtotal Cost per Mile 78.0 7,800
Subtotal All Costs (without sales tax) Cost per Mile 8,863.2 886,324
Sales Tax Cost per Mile 305.8 30,583
Total Capital Cost Cost per Mile 9,169.1 916,907
Annual Operating and Maintenance CostsLine Item Unit of Measurement
Transmission Line and ROW
T‐Line/ROW Labor Cost per Mile 8.3 828
T‐Line/ROW Maintenance Materials Cost per Mile 1.7 172
Insurance Cost per Mile 1.0 100
Replacement Parts/Equipment/ Spare Parts Inventory Cost per Mile 1.0 100
Subtotal Cost per Mile 12.0 1,200
Subtotal All O&M Costs (without sales tax) Cost per Mile 0.0 1,200
Sales Tax Cost per Mile 0.1 13
Right of Way/Royalty Payments ‐ Public land Cost per Mile 1.2 121
Total with Payments Cost per Mile 1.3 1,334
Cost per Unit
($000)
Total Cost (100
Mile Line, $000)
Total Cost (100
Mile Line, $000)
Cost per Unit
($000)

HVDC and Non‐Dispatchable Generation
26
$4,400. The lowest cost is achieved through economies of scale at about 1200 miles, and the study
suggests that economies of scale are achieved at about 200 miles (MacDonald, et al. 2016). ETSAP
provides a smaller cost estimate range, between $890 and 3,961 per MW‐mile (IEA ETSAP 2014). In terms
of cost per mile, ICF has seen a range between 1.17 million $/mile to 8.62 million $/mile in the literature
for HVDC projects (see Figure 20 in Appendix A.3. for a cost summary).
How does this break out between fixed and variable cost (that is, costs that are independent of mileage
and costs that are a function of mileage)?
HVDC lines have high fixed costs in the form of converter stations and associated equipment. Using NREL’s
JEDI modeling simulation (in Table 4, above) for a hypothetical 500‐kV, 100‐mile bi‐pole HVDC line, the
fixed infrastructure cost is estimated to be $734.4 million. The transmission line costs for a 100‐mile
hypothetical line in the example is estimated to be $144.1 million. This would translate to a variable cost
of roughly $1.44 million/mile. The fixed costs of the project are roughly five times the variable costs of
transmission line. In addition, the project is expected to have annual operating and maintenance costs of
around $1.3 million/year.
What factors raise or reduce these costs (such as regional labor costs, geography, population density,
and so forth)?
The cost of an HVDC transmission system depends on many factors, such as power capacity to be
transmitted, type of transmission medium (submarine or land‐based), environmental considerations,
access to easements and ROWs and cost of converter stations and associated equipment. The most
important cost‐influencing factor is distance. Short‐distance HVDC lines are typically more expensive on a
unit distance (per mile basis) because of high fixed equipment costs (for example, the Hudson
Transmission Project). Other factors like terrain of the path and the population density around the
transmission line tend to affect the project costs. Generally, acquiring the ROWs and easement is easier
for flat terrain, and areas outside of population centers and environmentally/historically sensitive areas.
Therefore, the cost of such HVDC lines is also cheaper. HVDC lines configured as submarine cables are
expected to be more expensive than land‐based HVDC lines. Taking into account these factors, the
expected cost of HVDC projects in the United States have ranged between $1.17–$8.62 million/mile (see
Figure 20 and Table 6 in Appendix A.3).
What cost‐related factors may constrain HVDC deployment?
The major cost item that could constrain HVDC deployment is the cost of converter stations, which could
range as high as 50%–60% of the total fixed cost for an HVDC project. This makes HVDC uneconomical for
some applications, for example if the line length is below a threshold distance, or if multiple offtake or
delivery locations are required. Bi‐directional transfers require the use of back‐to‐back converter stations
at both the source and delivery locations, which could further increase the cost.
Other cost‐related factors outside of the HVDC component costs could constrain its deployment (DOE
2013):
Cost allocation and regulatory issues: FERC Order No. 1000 (FERC 2011b) requires the allocation
of costs to beneficiaries. However, some projects might have system benefits such as
improvements in system reliability that are difficult to quantify or incorporate into a cost‐benefit
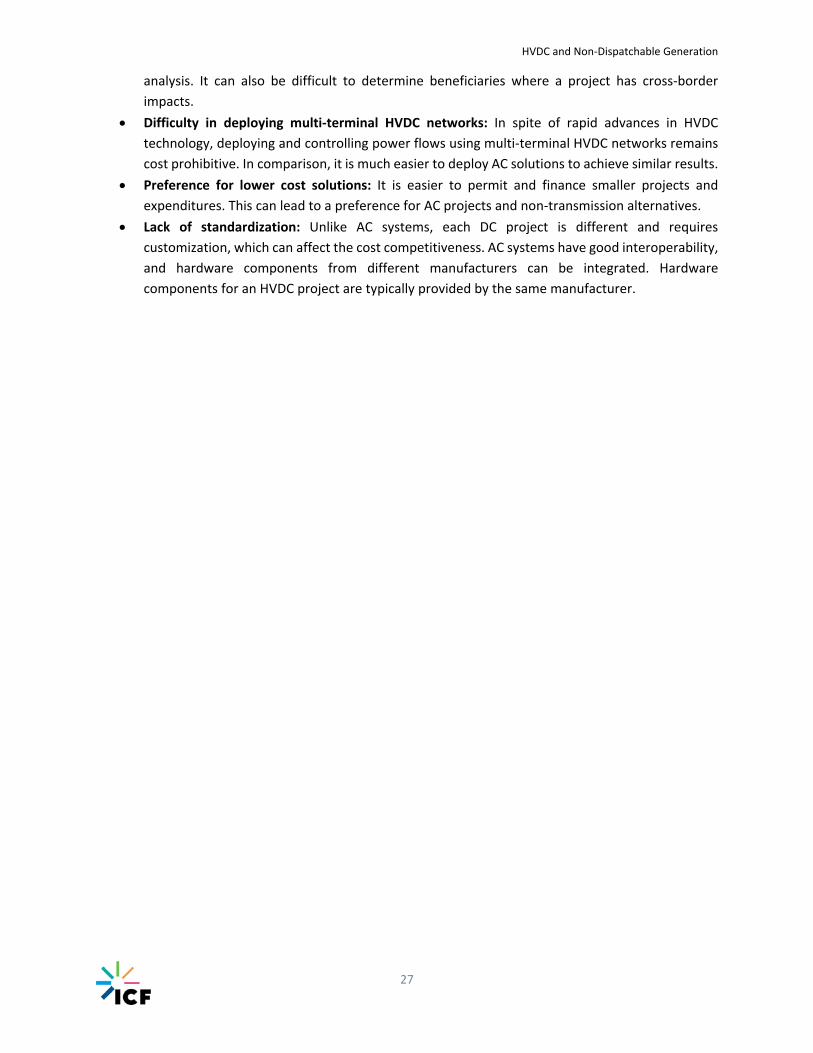
HVDC and Non‐Dispatchable Generation
27
analysis. It can also be difficult to determine beneficiaries where a project has cross‐border
impacts.
Difficulty in deploying multi‐terminal HVDC networks: In spite of rapid advances in HVDC
technology, deploying and controlling power flows using multi‐terminal HVDC networks remains
cost prohibitive. In comparison, it is much easier to deploy AC solutions to achieve similar results.
Preference for lower cost solutions: It is easier to permit and finance smaller projects and
expenditures. This can lead to a preference for AC projects and non‐transmission alternatives.
Lack of standardization: Unlike AC systems, each DC project is different and requires
customization, which can affect the cost competitiveness. AC systems have good interoperability,
and hardware components from different manufacturers can be integrated. Hardware
components for an HVDC project are typically provided by the same manufacturer.

HVDC and Non‐Dispatchable Generation
28
4. Conclusions
ICF reviewed several publicly available reports and prepared case studies for three major market regions
in the United States to support EIA’s effort to assess the potential for HVDC transmission networks to
mitigate the impacts of non‐dispatchable generation technologies. Because non‐dispatchable
technologies such as wind and solar operate only when the indigenous resources are available, they create
dispatchability challenges for system operators. HVDC lines can mitigate the impact of non‐dispatchable
resources because DC power flows are controllable, they have low losses over long‐distance transmission,
and they are they are decoupled from AC systems and are suitable for asynchronous interconnection. ICF
also evaluated recent cost trends associated with HVDC projects.
ICF’s research and case study analysis identified sources that addressed key questions of interest to EIA:
Studies of existing systems and projects under development demonstrate that HVDC can be
effective in mitigating these impacts on non‐dispatchable generation.
HVDC tie lines between balancing authorities are sufficient to transfer system impacts from host
to client regions. The non‐dispatchable generators do not have to be directly connected to the
client region.
Penetration levels of non‐dispatchable generation at which HVDC solutions would be expected to
be deployed vary with factors such as the robustness of the underlying transmission network, the
mix of generation resources, availability of flexible resources, and the nature of the ties to
neighboring systems.
Other parameters such as distance between source and sink, potential alternative solutions, the
nature of the application, and the regional systems within which the host and client areas are
located can influence the deployment of HVDC. HVDC is better suited than AC for submarine
applications and for interconnection of asynchronous regions.
The cost of converter stations and associated equipment can constrain the deployment of HVDC
for some applications.
Some issues are not fully addressed in the reviewed literature and additional research and analysis will be
required to develop further insights:
Whether some system configurations and topologies of AC and DC interfaces are more effective
at mitigating some or all impacts from non‐dispatchable generation
Penetration levels at which HVDC would be required for specific systems, and quantitative
measures of the extent to which regional and other factors can affect penetration level
The extent to which the type of non‐dispatchable technology deployed, the share of conventional
generation technologies, and/or other regional characteristics affect the penetration level
Specific limitations to the ability of HVDC to mitigate intermittency impacts
HVDC and Non‐Dispatchable Generation
29
5. References
ASEA Brown Boveri (ABB). 2012. "ABB Solves 100‐Year‐Old Electrical Puzzle – New Technology to Enable
Future DC Grid." November 7, 2012. Accessed August 29, 2017.
ABB. 2014a. "ABB Awarded $400 Million Order for Maritime Link Power Project in Canada." July 9.
ABB. 2014b. "Special Report: 60 years of HVDC." ABB Review, 1–72.
ABB. 2015. "ABB Sets World Record in HVDC Light Voltage Level." January. Accessed September 2017.
ABB. 2016. "ABB Wins Orders of over $300 Million for World's First 1100 kV UHVDC Power Link in
China." July 19. Accessed August 2017.
ABB. n.d. a. "Rio Madeira – The Longest Transmission Link in the World." Accessed August 2107.
ABB. n.d. b. "Why HVDC? Economic and Environmental Advantages." Accessed August 2017.
ALLETE. 2010. "ALLETE's Bison Wind Energy Project Well Underway in North Dakota." The ALLETE
Investor. September 1.
APS Physics. 2010. "Integrating Renewable Electricity on the Grid–A Report by the APS Panel on Public
Affairs."
Babcock & Brown. 2006. "Completion of Acquisition: New England – New York Cross Sound Cable."
Announcement.
Babcock & Brown. 2007. "Trans Bay Cable Project." Presentation.
Beerten, Jef. 2016. HVDC Technology for Offshore Grids and a Supergrid in Europe – Technological and
Regulatory Challenges and a Way Forward. General Meeting. Boston, MA: IEEE PES.
Black & Veatch. 2014. Capital Costs for Transmission and Substations – Updated REcommendations for
WECC Transmission Expansion Planning.
Bloom, Aaron. 2017. "Interconnections Seam Study." Grid Modernization Initiative, 1–21. Arlington,VA:
U.S. Department of Energy. Accessed September 2017.
Bloom, Aaron, Aaron Townsend, David Palchack, Joshua Novacheck, Jack King, Clayton Barrows, Eduardo
Ibanez, et al. 2016. Eastern Renewable Generation Integration Study. Technical Report prepared
for NREL.
Bonneville Power Administration (BPA). 2010. "Direct Current Line Still Hot After 40 Years." May 26.
Accessed August 20, 2017.
California Independent System Operator (CAISO). 2017. Flexible Ramping Product. September. Accessed
September 2017.
CAISO. 2017b. Renewable Integration Market and Product Review Phase I. September. Accessed
September 2017.
CAISO. 2017c. Pay for Performance Regulation. September. Accessed September 2017.
Clean Line Energy Partners. 2015. Plains & Eastern Clean Line – 1222 Program – Part 2 Application.
Accessed September 2017.
HVDC and Non‐Dispatchable Generation
30
Clean Line Energy Partners. 2016. Plains & Eastern Clean Line. Accessed August 24, 2017.
Clean Line Energy Partners. 2017a. The History of DC Transmission. Accessed August 20, 2017.
Clean Line Energy Partners. 2017b. Plains & Eastern Clean Line Overview.
Corbus, D., D. Hurlbut, P. Schwabe, and E. et al. Ibanez. 2014. California – Wyoming Grid Integration
Study. Technical Report, Denver, CO: National Renewable Energy Laboratory (NREL).
Database of State Incentives for Renewables & Efficiency (DSIRE). 2017. Programs. Accessed September
5, 2017. http://programs.dsireusa.org/system/program?state=US
Department of Energy (DOE). 2013. Applications for High‐Voltage Direct Current Transmission
Technologies. Proceedings Document. Prepared by DOE Grid Tech Team. Arlington, VA: U.S.
Department of Energy.
DOE. 2014. The War of the Currents: AC vs. DC Power. November 18, 2014. Accessed September 2017.
DOE. 2015a. Plains & Eastern Clean Line Transmission Project – Environmental Impact Statement
Summary. EIS Report. Accessed September 2017.
DOE. 2015b. Quadrennial Technology Review – An Assessment of Energy Technologies and Research
Opportunities. Quadrennial Technology Review.
DOE. 2016. "Plains & Eastern Clean Line Transmission Line." U.S. Department of Energy. Accessed
September 2017.
Energy Information Administration (EIA). Electricity Data Browser.
Federal Energy Regulatory Commission (FERC). 2009. "Order Authorizing Acquisition of Transmission
Facilities." FERC.gov. November 24. Accessed September 8, 2017.
FERC. 2011a. “Frequency Regulation Compensation in the Docket Nos. RM11‐7‐000. Organized
Wholesale Power Markets AD10‐11‐000.” Docket Nos. RM11‐7‐000 and AD10‐11‐000. Order
755. Issued October 20, 2011.
FERC. 2011b. “Transmission Planning and Cost Allocation by Transmission Owning and Operating Public
Utilities.” Docket No. RM10‐23‐000; Order No. 1000. Issued July 21, 2011.
FERC. 2017. "Order Issuing Certificate and Granting Abandonment Authority." Docket Nos. CP16‐10‐000
and CP16‐13‐000. Issued October 13, 2017.
Flourentzou, Nikolas, Vassilios Agelidis, and Georgios D. Demetriades. 2009. "VSC‐based HVDC Power
Transmission Systems: An Overview." IEEE Transactions on Power Electronics, 24 (3): 592–602.
Friends of the Supergrid. 2012. Roadmap to the Supergrid Technologies.
GE Energy. 2010. New England Wind Integration Study. ISO‐NE.
Government of Alberta, Canada, Transmission Facilities Cost Monitoring Committee. 2012. Review of the
Cost Status of Major Transmission Projects in Alberta.
Government of Newfoundland and Labrador, Canada. n.d. Backgrounder – Quick Facts – Muskrat Falls
Development Generation and Transmission.
HVDC and Non‐Dispatchable Generation
31
Great River Energy. 2015. "HVDC Transmission System." Great River Energy. October. Accessed
September 8, 2017.
Hirsch, Matthew. 2016. "HVDC on the Rise." EPRI Journal. January 18, 2016.
Hocker, Chris, and Brian Heffron. 2013. Hudson Transmission Project Goes Online Ahead of Schedule,
Provides New York City with 660 MW of Additional Power, Enhanced Reliability. Press Release:
Powerbridge.
International Energy Agency‐Energy Technology Systems Analysis Program (IEA‐ETSAP). 2014. Electricity
Transmission and Distribution. April.
IEA‐ETSAP, IRENA. 2015. Renewable Energy Integration in Power Grids. Technology Brief, IRENA.
Long, Willis, and Stig Nilsson. 2007. "HVDC Transmission: Yesterday and Today." IEEE Power & Energy
Magazine, 22–31.
MacDonald, Alexander E., Christopher T.M. Clack, Anneliese Alexander, Adam Dunbar, James Wilczak,
and Yuanfu Xie. 2016. "Future Cost‐Competitive Electricity Systems and Their Impact on US CO2
Emissions – Supplementary Information." Nature Climate Change. January 25, 2016.
Morris Brenna, Federica Foiadelli, Michela Longo, Dario Zaninelli. 2017. "Improvement of Wind Energy
Production through HVDC Systems." MDPI Journals. Polytechnic University of Milan.
Murata, Yoshinao, Masatoshi Sakamaki, and Kazutoshi Abe et al. 2013. "Development of High Voltage
DC‐XLPE Cable System." SEI Technical Review, April: 55–62.
National Renewable Energy Laboratory (NREL) . 2017. Interconnections Seam Study. Accessed
September 2017.
North American Electric Reliability Corporation (NERC). 2016. 2016 Long‐Term Reliability Assessment.
Osborn, Dale, David Orser, and Maire Waight. 2014. Conceptual Interregional HVDC Network.
Presentation, MISO.
Patel, Sonal. “Readying for New HVDC Line, U.S. Lags Behind Rest of World.” 2017. Power. Accessed
September 2017.
Plains & Eastern. 2017. "Federal Regulatory Processes and Approvals." Plains & Eastern Clean Line.
Accessed September 2017.
Power Company of Wyoming. 2017. Power Company of Wyoming, LLC – About the Project . September.
Accessed September 2017.
Power Engineering. 2016. Great River Energy to Retire Stanton Station. July 18.
Retzmann, Dietmar. 2012. HVDC Station Layout, Equipment LCC & VDC and Integration of Renewables
using HVDC. CIGRE Tutorial, CIGRE.
Rudervall, Roberto, J.P. Charpentier, and Raghuveer Sharma. 2000. "High Voltage Direct Current (HVDC)
Transmission System Technology Review Paper." Energy Week.
Siemens. 2017. HVDC Classic – Low Losses. Accessed August 2017.
HVDC and Non‐Dispatchable Generation
32
S&P Global, Inc. SNL Market Intelligence Platform.
Southwest Power Pool Inc. (SPP). 2009. SPP Balanced Portfolio Report. Southwest Power Pool, Inc.
Accessed September 2017.
SPP. 2014. Regulation Compensation Liason Kickoff Meeting. PowerPoint Presentation. Accessed
September 2017.
SPP. 2016a. SPP 2016 Wind Integration Report. Accessed September 2017.
SPP. 2016b. State of Market Reports.
SPP. 2017. SPP Generator Interconnection Queue (Active List). Spreadsheet Document. Accessed
September 2017.
T&D World Magazine. 2016. Great River Energy to Upgrade HVDC Connection. February 26. Accessed
September 8, 2017.
Torvik, Kristoffer, and Bob Lockhart. 2013. High‐Voltage Direct Current Transmission Systems. Research
Report – Executive Summary, Navigant Research.
TradeWinds. 2009. Integrating Wind – Developing Europe's Power Market for the Large‐Scale
Integration of Wind Power. Research Report.
TransWest Express LLC. 2008. Regional Planning Project Review Report.
TransWest Express LLC. 2010. TransWest Express Transmission Project – Preliminary Plan of
Development. Plan of Development Report.
TransWest Express, LLC. 2016. TransWest Express Transmission Project 2016–17 Interregional
Transmission Project Submittal. Project Report. Accessed September 2017.
TransWest Express LLC. 2017. TransWest Express – News and Update. September. Accessed September
2017.
Walton, Richard. “SPP Bumps into Transmission Constraints as Wind Energy Breaks Records.” Utility
Dive. March 17, 2017.
Western Electricity Coordinating Council (WECC). 2011. 10‐year Regional Transmission Plan. Planning
Report.
Western EIM. 2017. Western Energy Imbalance Market. September. Accessed September 8, 2017.
Xiang, X., M.M.C. Merlin, and T.C. Green. 2016. Cost Analysis and Comparison of HVAC, LFAC and HVDC
for Offshore Wind Power Connection. Conference Paper, Imperial College London.

HVDC and Non‐Dispatchable Generation
A‐1
Appendices
To address the questions raised in the project scope, ICF adopted a case study approach to identify the
issues and challenges of incorporating HVDC solutions in addressing the problem of renewable
intermittency. The three shortlisted case studies focus on regions with a considerable share of renewable
penetration—CAISO (California), ERCOT (Oklahoma‐Texas Panhandle region), and MISO (northeastern
region of Iowa and Minnesota).
Renewable Penetration Trends in CAISO
California has been on the forefront of renewable energy deployment in the United States. California’s
original RPS target called for 33% renewables procurement by 2020. The share of VERs is expected to
increase from 19 GW in 2016 to 25.2 GW in 2020. This is expected to meet the 33% RPS target by 2020.
The share of VERs is expected to be a high of 34% by 2020. Recently, the state increased its RPS target to
50% by 2030.12 This calls for a major ramp up in procurement of electricity from renewable resources in
the near future. Potential HVDC projects capable of delivering renewable power to the state could help
California to meet its 50% RPS target.
Figure 8. Installed capacity trends for CAISO (existing and planned)
Source: Compiled by ICF using SNL data.
Note: Future capacity estimates are based on actual planned and under‐construction projects.
Figure 9 denotes net generation trends in California for recent years. The share of generation output from
VERs in California is gradually increasing from 2.0% in 2001 to 16.3% in 2016. The penetration level is only
12 California passed legislation SB 350 in October 2015, which requires retail sellers and publicly owned utilities to procure 50% of their electricity sales from eligible renewable energy resources by 2030. The interim target for 2020 is still 33% RPS target. For more information, see California Energy Commission Renewable Portfolio Standards.
0
20,000
40,000
60,000
80,000
Installed Capacity (M
W)
Combined Cycle Combustion Turbine Geothermal
Hydro Internal Combustion Nuclear
Other Pumped Storage Solar
Steam Turbine Wind
0
5,000
10,000
15,000
20,000
25,000
30,0002010
2011
2012
2013
2014
2015
2016
2017
2018
2019
2020
Installed Capacity (M
W)
VERs only
Wind Solar
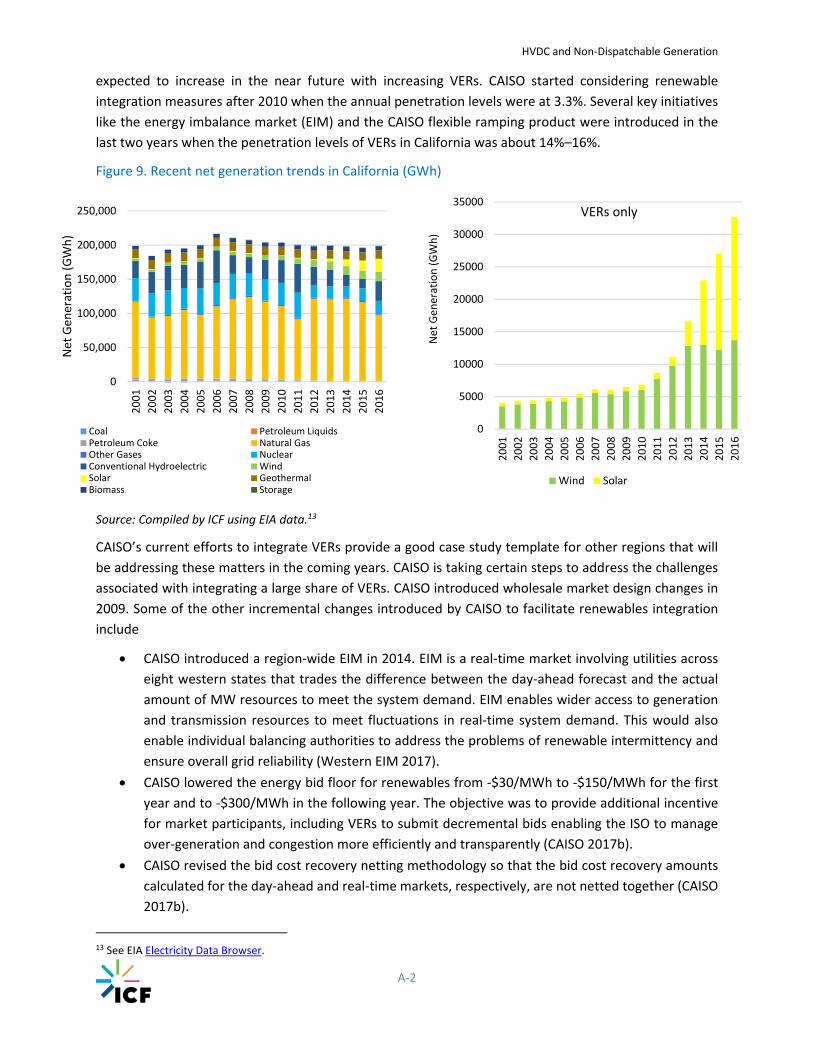
HVDC and Non‐Dispatchable Generation
A‐2
expected to increase in the near future with increasing VERs. CAISO started considering renewable
integration measures after 2010 when the annual penetration levels were at 3.3%. Several key initiatives
like the energy imbalance market (EIM) and the CAISO flexible ramping product were introduced in the
last two years when the penetration levels of VERs in California was about 14%–16%.
Figure 9. Recent net generation trends in California (GWh)
Source: Compiled by ICF using EIA data.13
CAISO’s current efforts to integrate VERs provide a good case study template for other regions that will
be addressing these matters in the coming years. CAISO is taking certain steps to address the challenges
associated with integrating a large share of VERs. CAISO introduced wholesale market design changes in
2009. Some of the other incremental changes introduced by CAISO to facilitate renewables integration
include
CAISO introduced a region‐wide EIM in 2014. EIM is a real‐time market involving utilities across
eight western states that trades the difference between the day‐ahead forecast and the actual
amount of MW resources to meet the system demand. EIM enables wider access to generation
and transmission resources to meet fluctuations in real‐time system demand. This would also
enable individual balancing authorities to address the problems of renewable intermittency and
ensure overall grid reliability (Western EIM 2017).
CAISO lowered the energy bid floor for renewables from ‐$30/MWh to ‐$150/MWh for the first
year and to ‐$300/MWh in the following year. The objective was to provide additional incentive
for market participants, including VERs to submit decremental bids enabling the ISO to manage
over‐generation and congestion more efficiently and transparently (CAISO 2017b).
CAISO revised the bid cost recovery netting methodology so that the bid cost recovery amounts
calculated for the day‐ahead and real‐time markets, respectively, are not netted together (CAISO
2017b).
13 See EIA Electricity Data Browser.
0
50,000
100,000
150,000
200,000
250,000
2001
2002
2003
2004
2005
2006
2007
2008
2009
2010
2011
2012
2013
2014
2015
2016
Net Gen
eration (GWh)
Coal Petroleum LiquidsPetroleum Coke Natural GasOther Gases NuclearConventional Hydroelectric WindSolar GeothermalBiomass Storage
0
5000
10000
15000
20000
25000
30000
35000
2001
2002
2003
2004
2005
2006
2007
2008
2009
2010
2011
2012
2013
2014
2015
2016
Net Gen
eration (GWh)
VERs only
Wind Solar

HVDC and Non‐Dispatchable Generation
A‐3
CAISO modified its payment rules for startup and minimum load costs, unrecovered energy bid
costs, and residual imbalance energy for generators. These changes are aimed at streamlining
uplift payments and eliminating the potential incentives for adverse market behavior by some
generators who previously could expand bid cost recovery or residual imbalance energy payments
(CAISO 2017b).
In 2016, CAISO introduced two flexible ramping products—Flex Up and Flex Down—in its real‐
time markets. These products are designed to enable CAISO to procure sufficient ramping
capability via economic bids. These products provide additional upward and downward flexible
ramping capability to account for uncertainty in net system demand due to renewable
intermittency (CAISO 2017).
In response to FERC Order No. 755 regulation (FERC 2011a), CAISO modified its existing capacity
payment for frequency regulation in its wholesale markets. CAISO has introduced and
implemented a two‐part structure to establish prices for regulation capacity and mileage, which
is a performance‐based payment (CAISO 2017 c).
TransWest HVDC Project in Western Interconnect
As mentioned earlier, HVDC projects can help California in achieving its 50% RPS target. In CAISO, there
are now two operational HVDC lines—Pacific Intertie with BPA and Trans Bay Cable in the San Francisco
area. The Trans Bay Cable (400 MW, 200 kV) is primarily a merchant congestion relief project for delivering
power to the San Francisco area. The Pacific Intertie (3800 MW, 500 kV) is the oldest and largest HVDC
link in the country meant to remote generator interconnection between BPA and CAISO. In addition to
these existing lines, the TransWest Express LLC is proposing to build a 3000 MW, 600 KV TWE line to
deliver wind power from southern Wyoming to California. This project has been proposed since 2005. Its
developers are actively pursuing this project and recently secured approvals from the U.S. Department of
Interior Bureau of Land Management (BLM), Western Area Power Administration, and U.S. Forest Service
following a review of the project’s final Environmental Impact Statement (TransWest Express 2017). ICF
chose to focus on this project since it highlights the factors that come into play when considering HVDC
projects that address renewable integration issues.

HVDC and Non‐Dispatchable Generation
A‐4
Figure 10. Proposed TransWest project in Western Interconnect
Source: TransWest Express, LLC (2016).
The TWE project is a proposed extra‐high‐voltage transmission line connecting the wind resources in
south‐central Wyoming to southern Nevada, which would interconnect to CAISO balancing authority
(TransWest Express 2017). It consists of 725 miles of HVDC lines between Sinclair, Wyoming, and
Marketplace Hub‐Eldorado substation in Boulder City, Nevada. The line is rated to deliver approximately
4,000 MWh of power annually for every 1 MW of installed capacity. In total, the line can deliver up to
12,100 GWh of power annually to southern California and desert southwest region. The project is
expected to interconnect wind power plants in the southwest Wyoming region through the existing AC
network.14 TransWest Express affiliates are currently developing the 3,000‐MW Chokecherry and Sierra
Mandre Wind Energy Project and a potential natural gas generator located near the project’s Northern
Terminal. 15 The wind generator project has received BLM approval for its Environmental Impact
Statement for Phase I of the project. The host region is part of the NTTG transmission planning group
while the client region is part of the WestConnect planning area. The wind site is expected to contain
approximately 1,000 wind turbines of 3 MW‐rated capacity each and spread over 210,000 acres (Power
Company of Wyoming 2017). Power generated from the project will likely be routed to one or more of up
14 Based on publicly available sources, it is not clear if the TWE project has a dedicated collector system for its Northern Terminal end in Wyoming. ICF assumes the wind generators interconnect to the existing AC grid in the region. It should be noted that TWE was part of a Wyoming Wind Collector and Transmission Task Force of WAPA and that there were conceptual plans for a Wyoming collector and transmission system. 15 See Power Company of Wyoming, LLC.
HVDC and Non‐Dispatchable Generation
A‐5
to five potential transmission lines or an existing transmission line. Both these alternatives were assessed
in the Environmental Impact Statement .
Insights from TransWest Case Study
The feasibility of the TWE project has been assessed by various regional planning entities like WECC, NREL,
and Northern Tier Transmission Planning Group. Preliminary assessment by these entities confirms that
the project can cost‐effectively interconnect remote renewable energy to satisfy a portion of California’s
renewable needs. Although the 50% RPS target was not explicitly assessed in these studies, it is expected
that this project would make more economic sense with an increased RPS target. WECC’s 2011 Regional
Transmission Plan highlighted the economic benefits of tapping Wyoming’s high‐capacity wind energy
(Class VI and VII wind resources) to meet California’s RPS goals (WECC 2011). The study estimated that
the TWE project can potentially save California ratepayers $600 million/year (based on 2011 vintage
assumptions). The NREL Wyoming‐California study assessed the economic benefits of a transmission
corridor between the two regions (akin to an HVDC transmission project) (Corbus, et al. 2014). The study
found that the economic benefit of such a transmission line is likely to outweigh the costs, with benefit‐
to‐cost ratios ranging from 1.6 to 3.6. The Corbus et al. study (2014) compared scenarios wherein the 33%
RPS requirement for California is met by in‐state resources versus an option to import up to 12,000
GWh/year from Wyoming in addition to local in‐state resources. The import option would correspond to
a 3,000 MW HVDC line from Wyoming with an average annual capacity factor of wind resources at 46%.
Factoring in line losses, the annualized transmission costs under these assumptions is estimated to be
around $29 per MWh delivered (2014 $). Based on NREL study, the import scenario show economic
benefits exceed costs in the range of $2.3 billion to $9.5 billion over 50 years on a net present value basis
(2014 $ basis). The benefits were primarily due to the difference in generation cost for the various
renewable technologies studied, strongly influenced by the fact that Wyoming has some of the highest
wind capacity factors in the United States. The study also found the LCOE of Wyoming wind delivered by
an HVDC project to be the lowest among all generation options, even lower than in‐state wind and solar
resources. The study also found modest production cost savings of about $31 million/year (or 0.3$) for
the entire WECC region as the result of imports from Wyoming. The savings accrue because of lower
startup costs of wind units. The imports also resulted in lower wholesale prices in southern California
areas that are closer to the Marketplace Hub in Nevada. The study also found that the California–Wyoming
transmission corridor helps to avoid other transmission projects, which would have been required when
relying solely on in‐state renewable resources alone.
It should be noted that none of the publicly available studies has looked at the detailed reliability
implications of the proposed TWE project. In addition, none of the available studies has modeled 50% RPS
target by 2030 as an explicit scenario assumption. Nevertheless, the case for TWE project is expected to
improve under this revised RPS target. None of the studies has indicated any adverse conditions at the
host or client regions because of the proposed HVDC interconnection. The NREL study did perform a
production cost modeling using the Plexos modeling platform and found no major reliability implications
of interconnecting the project to Southern California and Desert Southwest region. Currently, WECC is
implementing the Phase 2 Path Rating Study and Southern Terminal system impact study for the project
(TransWest Express, LLC 2016). Since it is an interregional transmission project, it is being considered in
the current planning cycle by transmission planning entities of CAISO, WestConnect, and NTTG. CAISO’s
Transmission Planning Process for 2016–17 incorporated the TWE project in its assessment. The results
HVDC and Non‐Dispatchable Generation
A‐6
of the assessment are yet to be finalized (at the time of writing). TransWest is also requesting cost
allocation from CAISO and WestConnect transmission planning entities. In the future, TransWest has
indicated that it may apply for cost allocation from NTTG as well. As a configuration alternative, TransWest
is proposing to build a third terminal to connect to the 345 kV bus at the Intermountain Power Project in
Delta, Utah, and to use 500 kV AC technology in lieu of HVDC for the segment from Wyoming to Utah
and/or the segment from Utah to Nevada (TransWest Express, LLC 2016). TransWest is also considering
implementing the project in phases, with building a 3,000 MW line and only 1500 MW of terminal capacity
(at both ends) and add in parallel a 1,500 MW of terminal capacity later. TransWest is also exploring
variants of this phasing plan with initial capacity between 1,500 MW and 2,500 MW and shortening the
period between initial and final build out. Currently, TransWest plans to continue development activities
including state and county permit, private ROW acquisition, transmission planning assessments, project
financing, and securing interconnection/transmission capacity agreements.
The TWE case study highlights the advantage of HVDC when connecting renewable energy sources to
distant load centers. TWE will deliver power generated in Wyoming to load centers more than 700 miles
away. It also facilitates the direct connection of demand and supply sources in different balancing
authorities that are not even contiguous. The impact on the underlying grid in reduced because HVDC is
fully controllable and decoupled from the AC system. TWE also shows that HVDC can transfer system
impacts from host to client regions even if the non‐dispatchable generation is not directly connected to
the client region. As outlined in TransWest Express LLC report (2010), the loss of a single pole of the TWE
project will affect the interconnected system within acceptable parameters until generation tripping can
occur. This implies that the TWE wind resources will be connected to the Wyoming grid, which is the host
region, and not directly to the client. TransWest Express LLC (2010) reiterates this point, and shows that
despite the advantages of HVDC, protection schemes might sometimes be required to resolve dynamic
reliability problems that could occur in the host region under certain emergency conditions. Because of
the size of the project within the relatively weak Wyoming grid, the simultaneous loss of both circuits of
TWE could lead to widespread system outages. TWE would have to be planned to minimize the likelihood
of the simultaneous loss of the two circuits.
Renewable Trends in MISO
In the case of MISO and the upper Midwest region, the growth of VERs has been driven by wind energy
as the region has highly favorable conditions for wind generation (unlike in CAISO’s case with mostly solar
power generation). In particular, Minnesota has set a 25% wind‐based generation target by 2025 and the
largest provider, Xcel Energy has set a 30% wind‐based target by 2020. Iowa has set a specific target for
all IOUs to procure at least 105 MW of renewable generation. VER capacity is expected to increase from
17.1 GW in 2016 to 32.2 GW in 2020. The vast majority of this capacity is coming from wind facilities. Even
solar energy is also expected to show a small upward trend in installation in the coming years. The share
of VERs is expected to increase from 9% in 2016 to 15.4% in 2020. Figure 11 shows the installed capacity
trends within MISO, as well as the VER installed capacity between 2010 and 2020.

HVDC and Non‐Dispatchable Generation
A‐7
Figure 11. Installed capacity trends in MISO
Source: Compiled by ICF using SNL data.
Note: Future capacity is based on actual planned and under‐construction projects.
Figure 12 shows the net generation trends within MISO from 2001 to 2016. VER generation share has
increased from 0.1% in 2001 to 5.11% in 2016. This is attributed solely to wind energy, as solar generation
share is insignificant. The increase in wind capacity over the next few years (Figure 11) combined with the
forecasted reduction in coal capacity is expected to cause an increase in wind generation share, as
mandated by the RPS requirements of most MISO member‐states.
Figure 12. Recent historical net generation trends in MISO (GWh)
Source: Compiled by ICF using SNL.
0.0
50,000.0
100,000.0
150,000.0
200,000.0
250,000.0Installed Capacity (M
W)
Combined Cycle Combustion Turbine
Hydraulic Turbine Internal Combustion
Pumped Storage Steam Turbine
Wind Other
0
5,000
10,000
15,000
20,000
25,000
30,000
35,000
2010
2011
2012
2013
2014
2015
2016
2017
2018
2019
2020
Installed Capacity (M
W)
Solar Wind
0
200,000
400,000
600,000
800,000
1,000,000
1,200,000
2001
2002
2003
2004
2005
2006
2007
2008
2009
2010
2011
2012
2013
2014
2015
2016Net Gen
eration (GWh)
Coal Petroleum Liquids
Petroleum Coke Natural Gas
Other Gases Nuclear
Conventional Hydroelectric Wind
0
10,000
20,000
30,000
40,000
50,000
60,000
70,000
80,000
90,000
100,000
2001
2002
2003
2004
2005
2006
2007
2008
2009
2010
2011
2012
2013
2014
2015
2016
Net Gen
eration (GWh)
Solar Wind Turbine
HVDC and Non‐Dispatchable Generation
A‐8
Case Study of MISO’s Conceptual HVDC Network
In 2014, MISO started an initiative to assess the feasibility of using HVDC lines to interconnect the three
grid networks in the United States and facilitate greater power exports from MISO region to the rest of
the country. MISO published an HVDC network study in 2014 in which the value of creating a national
HVDC network was assessed (Osborn, Orser and Waight 2014). The report identified the following factors
as major drivers behind the project: load diversity, frequency response, wind/solar diversity, and other
benefits like supply of clean renewable power to remote regions. Load diversity is the interregional
transport of generation capacity resulting from differences in load profiles between the host and client
regions. The load profiles among regions vary because of time differences, nature, and composition of
load, climate factors, and local/regional weather conditions. For example, the spare capacity in WECC
during off‐peak hours can help to serve demand in PJM if the two regions are interconnected by a direct
HVDC line. Using MISO’s conceptual HVDC Network (shown in Figure 13), the study identified close to 35
GW of potential load diversity (or spare capacity). Frequency response is seen as another key benefit from
an interregional HVDC network. The MISO study identified potential value in distributing Resource
Contingency Criteria between HVDC network participants. The HVDC network helps to share frequency
response reserves through interregional power transmission. Additionally, VSCs help to facilitate fast
response products like frequency response and regulation. The study identified up to 3 GW of reserves
for frequency response that could be shared between the three grid interconnections. The benefits of
such reserves included deferred cost of procuring additional frequency response products and premiums
in the form of efficient frequency response. The HVDC network would also help to tap into the wind/solar
diversity benefits across the regions. The network could facilitate efficient dispatch of renewable
generation and mitigate renewable curtailments in host regions. Other benefits include a reduced ramp
rate for host/client regions, reduced variability from VERs and, as a consequence, a potentially increased
capacity credit for such resources. Finally, an HVDC network also offers other energy‐based benefits such
as energy arbitrage across networks and cost‐effective compliance with state RPS standards (in some
cases).
According to the study, the monetary value of the potential benefits is estimated to be $45.3 billion, with
benefits accruing due to load diversity ($21 billion), frequency response ($9.8 billion), wind diversity ($2.2
billion), and other energy benefits ($12.2 billion) (all in 2014$) (Osborn, Orser and Waight 2014). The
conceptual network consists of 7654 miles of new lines, 22 LCC type converter stations and 10 VSC‐type
converter stations. The network (Figure 14) would deploy both LCC (5400 MW) and VSC (2200 MW)
converter‐types, with a maximum of three terminal LCC links at each node (VSC taps in parallel). It includes
three lines connecting the eastern and western regions, with a total transmission capacity of 15 GW. The
total cost for a project of this magnitude is estimated to cost $36.2 billion. It would require a total of 7654
miles of HVDC lines, which cost approximately $3 million per mile, for a total line cost of $23 billion. The
22 LCC terminals would cost $10.4 billion ($472 million per terminal) and the 10 VSC terminals would cost
$2.9 billion ($285 million per terminal). The overall cost of the line is expected to be $36.2 billion.
Considering the benefits of such as network at $45.3 billion, the overall benefit‐cost ratio is expected to
be 1.25.
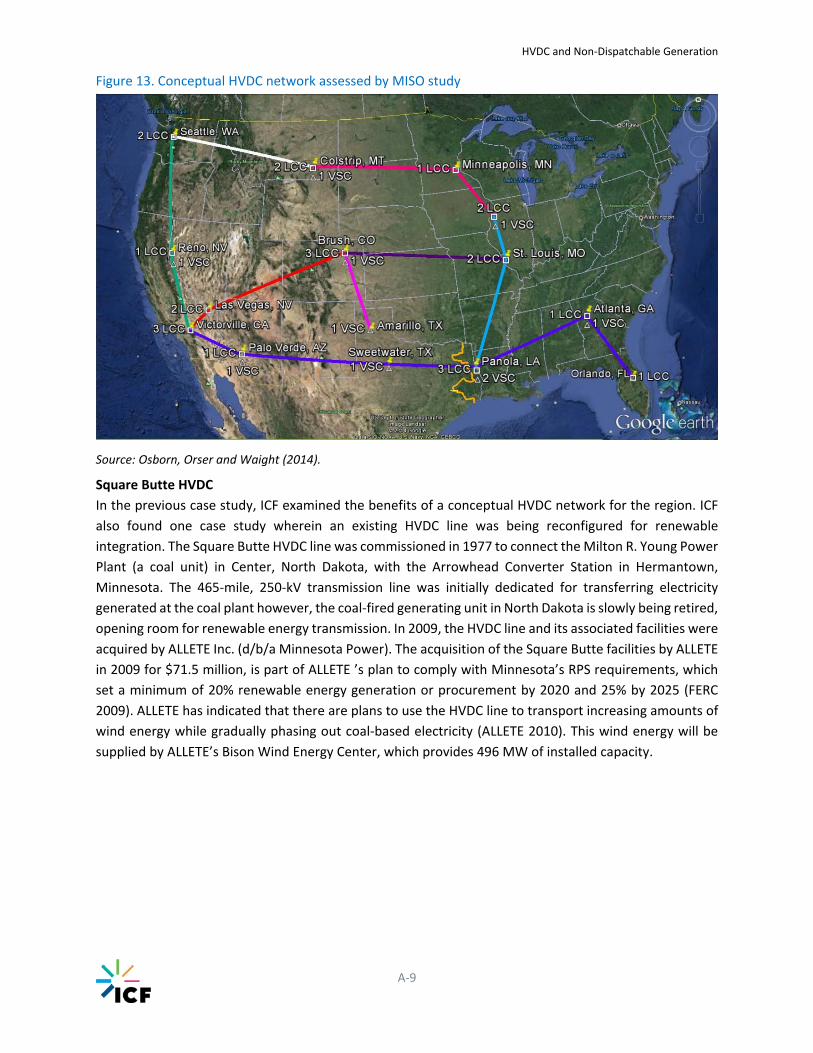
HVDC and Non‐Dispatchable Generation
A‐9
Figure 13. Conceptual HVDC network assessed by MISO study
Source: Osborn, Orser and Waight (2014).
Square Butte HVDC
In the previous case study, ICF examined the benefits of a conceptual HVDC network for the region. ICF
also found one case study wherein an existing HVDC line was being reconfigured for renewable
integration. The Square Butte HVDC line was commissioned in 1977 to connect the Milton R. Young Power
Plant (a coal unit) in Center, North Dakota, with the Arrowhead Converter Station in Hermantown,
Minnesota. The 465‐mile, 250‐kV transmission line was initially dedicated for transferring electricity
generated at the coal plant however, the coal‐fired generating unit in North Dakota is slowly being retired,
opening room for renewable energy transmission. In 2009, the HVDC line and its associated facilities were
acquired by ALLETE Inc. (d/b/a Minnesota Power). The acquisition of the Square Butte facilities by ALLETE
in 2009 for $71.5 million, is part of ALLETE ’s plan to comply with Minnesota’s RPS requirements, which
set a minimum of 20% renewable energy generation or procurement by 2020 and 25% by 2025 (FERC
2009). ALLETE has indicated that there are plans to use the HVDC line to transport increasing amounts of
wind energy while gradually phasing out coal‐based electricity (ALLETE 2010). This wind energy will be
supplied by ALLETE’s Bison Wind Energy Center, which provides 496 MW of installed capacity.
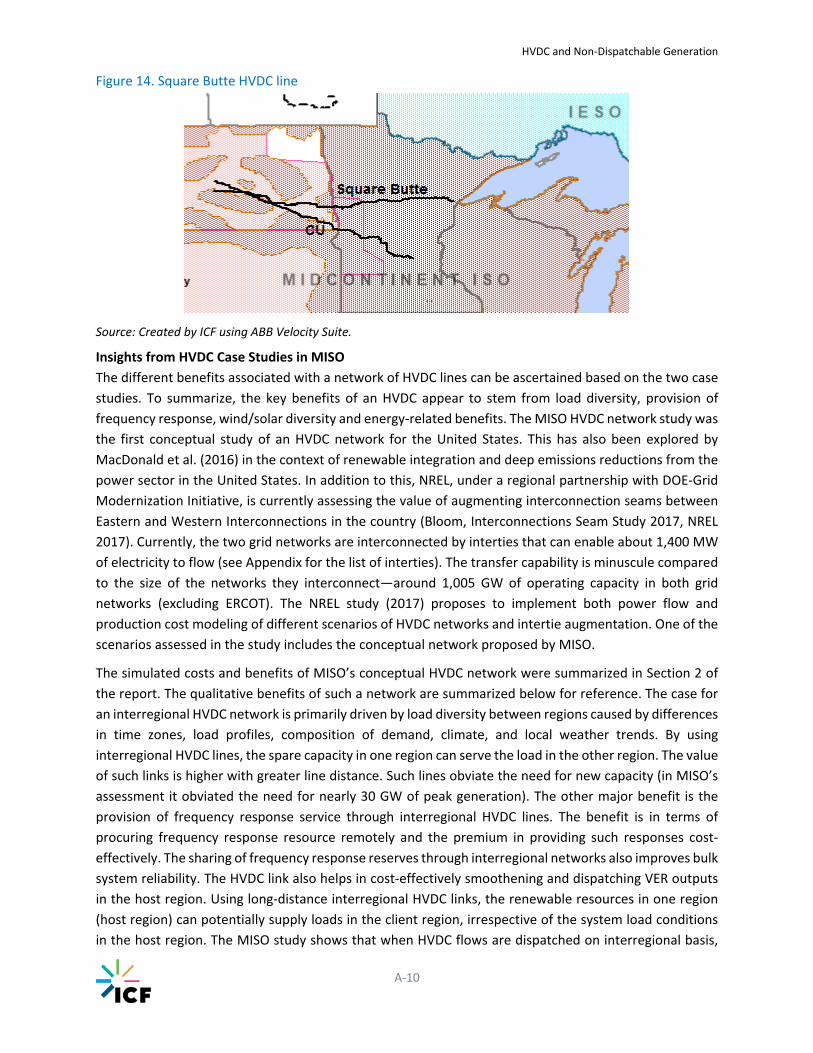
HVDC and Non‐Dispatchable Generation
A‐10
Figure 14. Square Butte HVDC line
Source: Created by ICF using ABB Velocity Suite.
Insights from HVDC Case Studies in MISO
The different benefits associated with a network of HVDC lines can be ascertained based on the two case
studies. To summarize, the key benefits of an HVDC appear to stem from load diversity, provision of
frequency response, wind/solar diversity and energy‐related benefits. The MISO HVDC network study was
the first conceptual study of an HVDC network for the United States. This has also been explored by
MacDonald et al. (2016) in the context of renewable integration and deep emissions reductions from the
power sector in the United States. In addition to this, NREL, under a regional partnership with DOE‐Grid
Modernization Initiative, is currently assessing the value of augmenting interconnection seams between
Eastern and Western Interconnections in the country (Bloom, Interconnections Seam Study 2017, NREL
2017). Currently, the two grid networks are interconnected by interties that can enable about 1,400 MW
of electricity to flow (see Appendix for the list of interties). The transfer capability is minuscule compared
to the size of the networks they interconnect—around 1,005 GW of operating capacity in both grid
networks (excluding ERCOT). The NREL study (2017) proposes to implement both power flow and
production cost modeling of different scenarios of HVDC networks and intertie augmentation. One of the
scenarios assessed in the study includes the conceptual network proposed by MISO.
The simulated costs and benefits of MISO’s conceptual HVDC network were summarized in Section 2 of
the report. The qualitative benefits of such a network are summarized below for reference. The case for
an interregional HVDC network is primarily driven by load diversity between regions caused by differences
in time zones, load profiles, composition of demand, climate, and local weather trends. By using
interregional HVDC lines, the spare capacity in one region can serve the load in the other region. The value
of such links is higher with greater line distance. Such lines obviate the need for new capacity (in MISO’s
assessment it obviated the need for nearly 30 GW of peak generation). The other major benefit is the
provision of frequency response service through interregional HVDC lines. The benefit is in terms of
procuring frequency response resource remotely and the premium in providing such responses cost‐
effectively. The sharing of frequency response reserves through interregional networks also improves bulk
system reliability. The HVDC link also helps in cost‐effectively smoothening and dispatching VER outputs
in the host region. Using long‐distance interregional HVDC links, the renewable resources in one region
(host region) can potentially supply loads in the client region, irrespective of the system load conditions
in the host region. The MISO study shows that when HVDC flows are dispatched on interregional basis,
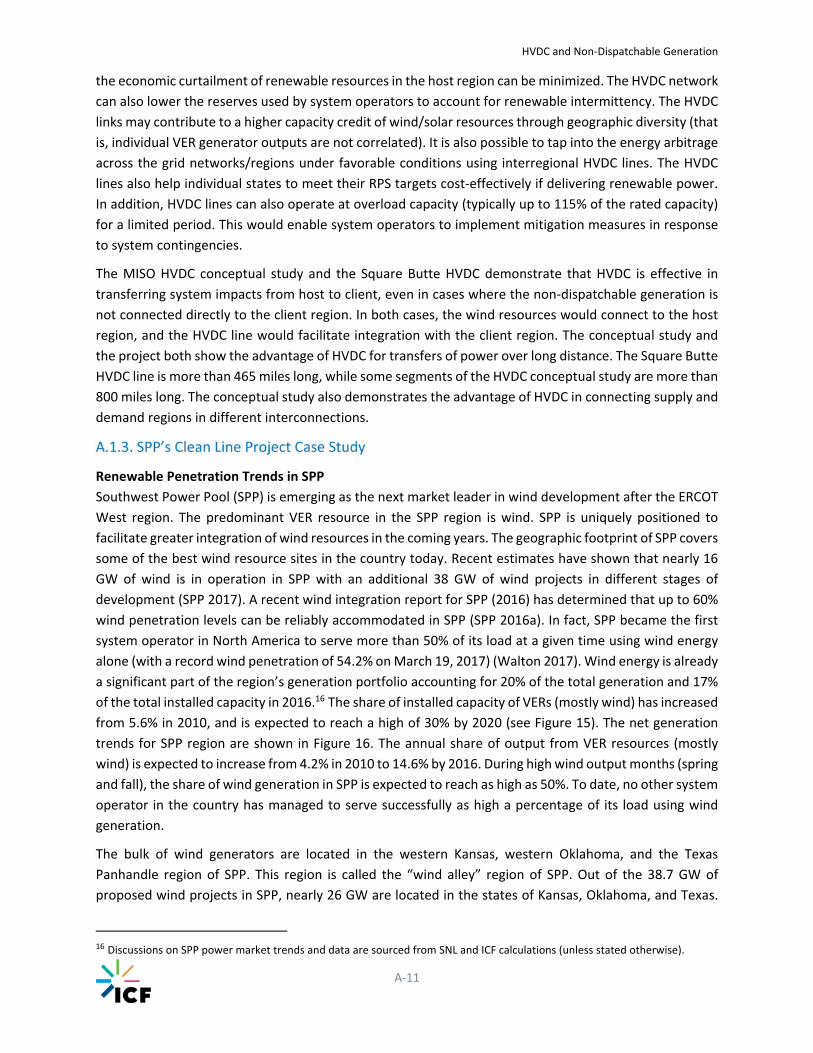
HVDC and Non‐Dispatchable Generation
A‐11
the economic curtailment of renewable resources in the host region can be minimized. The HVDC network
can also lower the reserves used by system operators to account for renewable intermittency. The HVDC
links may contribute to a higher capacity credit of wind/solar resources through geographic diversity (that
is, individual VER generator outputs are not correlated). It is also possible to tap into the energy arbitrage
across the grid networks/regions under favorable conditions using interregional HVDC lines. The HVDC
lines also help individual states to meet their RPS targets cost‐effectively if delivering renewable power.
In addition, HVDC lines can also operate at overload capacity (typically up to 115% of the rated capacity)
for a limited period. This would enable system operators to implement mitigation measures in response
to system contingencies.
The MISO HVDC conceptual study and the Square Butte HVDC demonstrate that HVDC is effective in
transferring system impacts from host to client, even in cases where the non‐dispatchable generation is
not connected directly to the client region. In both cases, the wind resources would connect to the host
region, and the HVDC line would facilitate integration with the client region. The conceptual study and
the project both show the advantage of HVDC for transfers of power over long distance. The Square Butte
HVDC line is more than 465 miles long, while some segments of the HVDC conceptual study are more than
800 miles long. The conceptual study also demonstrates the advantage of HVDC in connecting supply and
demand regions in different interconnections.
Renewable Penetration Trends in SPP
Southwest Power Pool (SPP) is emerging as the next market leader in wind development after the ERCOT
West region. The predominant VER resource in the SPP region is wind. SPP is uniquely positioned to
facilitate greater integration of wind resources in the coming years. The geographic footprint of SPP covers
some of the best wind resource sites in the country today. Recent estimates have shown that nearly 16
GW of wind is in operation in SPP with an additional 38 GW of wind projects in different stages of
development (SPP 2017). A recent wind integration report for SPP (2016) has determined that up to 60%
wind penetration levels can be reliably accommodated in SPP (SPP 2016a). In fact, SPP became the first
system operator in North America to serve more than 50% of its load at a given time using wind energy
alone (with a record wind penetration of 54.2% on March 19, 2017) (Walton 2017). Wind energy is already
a significant part of the region’s generation portfolio accounting for 20% of the total generation and 17%
of the total installed capacity in 2016.16 The share of installed capacity of VERs (mostly wind) has increased
from 5.6% in 2010, and is expected to reach a high of 30% by 2020 (see Figure 15). The net generation
trends for SPP region are shown in Figure 16. The annual share of output from VER resources (mostly
wind) is expected to increase from 4.2% in 2010 to 14.6% by 2016. During high wind output months (spring
and fall), the share of wind generation in SPP is expected to reach as high as 50%. To date, no other system
operator in the country has managed to serve successfully as high a percentage of its load using wind
generation.
The bulk of wind generators are located in the western Kansas, western Oklahoma, and the Texas
Panhandle region of SPP. This region is called the “wind alley” region of SPP. Out of the 38.7 GW of
proposed wind projects in SPP, nearly 26 GW are located in the states of Kansas, Oklahoma, and Texas.
16 Discussions on SPP power market trends and data are sourced from SNL and ICF calculations (unless stated otherwise).
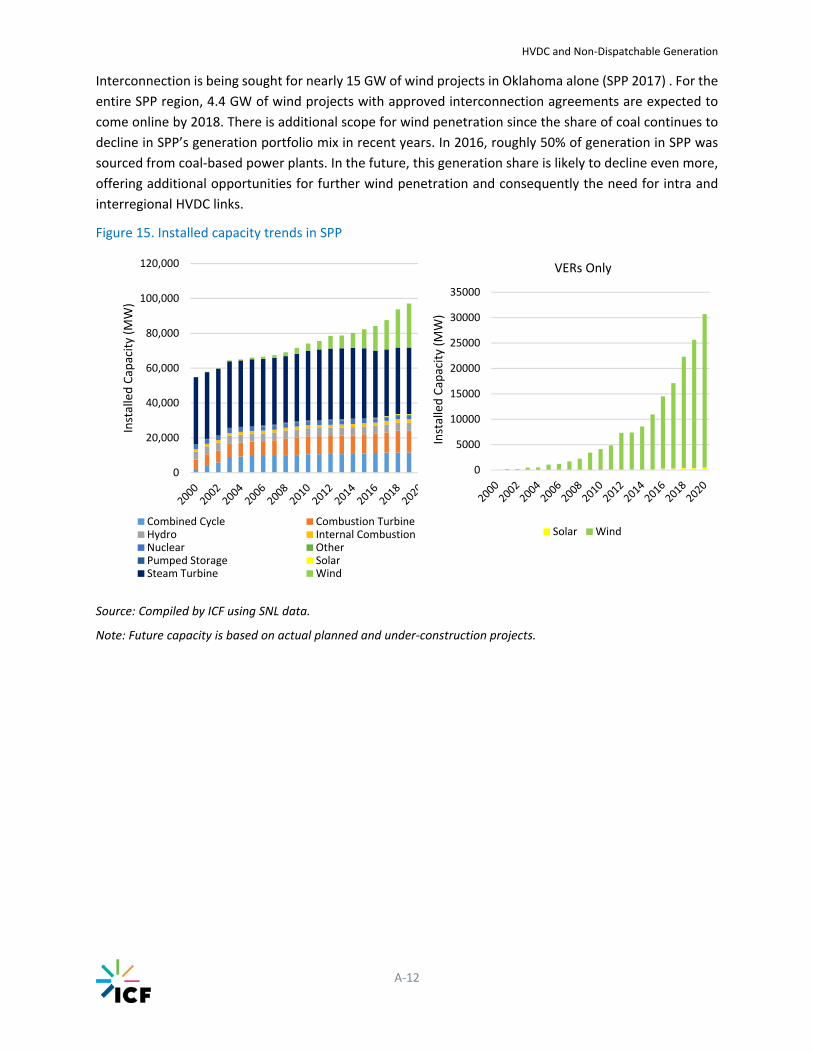
HVDC and Non‐Dispatchable Generation
A‐12
Interconnection is being sought for nearly 15 GW of wind projects in Oklahoma alone (SPP 2017) . For the
entire SPP region, 4.4 GW of wind projects with approved interconnection agreements are expected to
come online by 2018. There is additional scope for wind penetration since the share of coal continues to
decline in SPP’s generation portfolio mix in recent years. In 2016, roughly 50% of generation in SPP was
sourced from coal‐based power plants. In the future, this generation share is likely to decline even more,
offering additional opportunities for further wind penetration and consequently the need for intra and
interregional HVDC links.
Figure 15. Installed capacity trends in SPP
Source: Compiled by ICF using SNL data.
Note: Future capacity is based on actual planned and under‐construction projects.
0
20,000
40,000
60,000
80,000
100,000
120,000
Installed Capacity (M
W)
Combined Cycle Combustion TurbineHydro Internal CombustionNuclear OtherPumped Storage SolarSteam Turbine Wind
0
5000
10000
15000
20000
25000
30000
35000
Installed Capacity (M
W)
VERs Only
Solar Wind
HVDC and Non‐Dispatchable Generation
A‐13
Figure 16. Recent historical net generation trends in SPP
Source: Compiled by ICF using SNL data.
Wind Integration Challenges in SPP
Today, SPP is in a position to reap the benefits of wind integration because of the proactive wind policies
and strategies adopted in the past. As part of its Balanced Portfolio initiative, SPP invested in transmission
upgrades during the period from 2012 to 2014 that set the stage for the increased penetration of wind
seen today (SPP 2009). SPP also implemented the Integrated Marketplace in 2014 that expanded the
market footprint considerably, ushered in improved interregional coordination, and better integration of
renewable generation.17 Specifically, SPP’s Integrated Marketplace included a day‐ahead market with
transmission congestion rights (TCRs); a reliability unit commitment process; a real‐time balancing
market; a market price‐based ancillary and operating reserve market; and a unified balancing authority
setup for the whole of SPP service territory. Specifically, prior to SPP’s Marketplace, Dispatchable Variable
Energy Resources (DVERs) were subject to curtailment in the EIM based on impacts to a constraint and
transmission service priority. Implementation of the SPP Integrated Marketplace introduced rules so that
DVERs could be dispatched down based on offers and locational marginal prices in a manner similar to
other dispatchable resources.
The rapid growth of wind generation projects has brought a unique set of challenges to SPP’s wholesale
markets and operation. Since many of the existing and planned wind projects are located in the “wind
alley” region of SPP, the congestion trends in the region are being exacerbated. Typically, with
transmission constraints the local generation tends to get bottled up, resulting in low or negative nodal
prices. In 2016, the Woodward node (Oklahoma Gas and Electric [OKGE] load zone) experienced 3496
hours of low nodal prices (less than 5 $/MWh).18 Likewise, the Hitchland node (Southwestern Public
17 For more information, see Southwest Power Pool Integrated Marketplace. 18 The node is located near Woodward, Oklahoma, in Oklahoma Gas & Electric (OGE) service territory.
0
50,000
100,000
150,000
200,000
250,000
2010 2011 2012 2013 2014 2015 2016
Net Gen
eration (GWh)
Biomass Coal Natural Gas
Other Fuel Petroleum Products Solar
Nuclear Water Wind
‐
5,000
10,000
15,000
20,000
25,000
30,000
35,000
2010201120122013201420152016
Net Gen
eration (GWh)
VERs only
Solar Wind
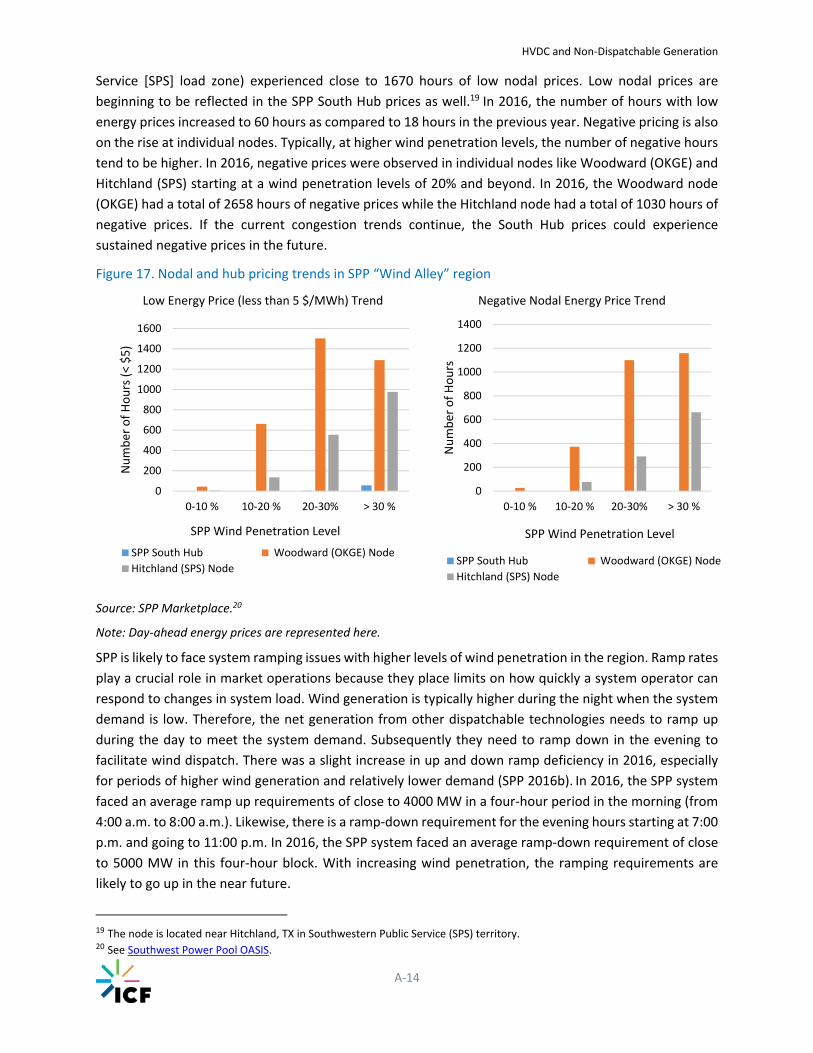
HVDC and Non‐Dispatchable Generation
A‐14
Service [SPS] load zone) experienced close to 1670 hours of low nodal prices. Low nodal prices are
beginning to be reflected in the SPP South Hub prices as well.19 In 2016, the number of hours with low
energy prices increased to 60 hours as compared to 18 hours in the previous year. Negative pricing is also
on the rise at individual nodes. Typically, at higher wind penetration levels, the number of negative hours
tend to be higher. In 2016, negative prices were observed in individual nodes like Woodward (OKGE) and
Hitchland (SPS) starting at a wind penetration levels of 20% and beyond. In 2016, the Woodward node
(OKGE) had a total of 2658 hours of negative prices while the Hitchland node had a total of 1030 hours of
negative prices. If the current congestion trends continue, the South Hub prices could experience
sustained negative prices in the future.
Figure 17. Nodal and hub pricing trends in SPP “Wind Alley” region
Source: SPP Marketplace.20
Note: Day‐ahead energy prices are represented here.
SPP is likely to face system ramping issues with higher levels of wind penetration in the region. Ramp rates
play a crucial role in market operations because they place limits on how quickly a system operator can
respond to changes in system load. Wind generation is typically higher during the night when the system
demand is low. Therefore, the net generation from other dispatchable technologies needs to ramp up
during the day to meet the system demand. Subsequently they need to ramp down in the evening to
facilitate wind dispatch. There was a slight increase in up and down ramp deficiency in 2016, especially
for periods of higher wind generation and relatively lower demand (SPP 2016b). In 2016, the SPP system
faced an average ramp up requirements of close to 4000 MW in a four‐hour period in the morning (from
4:00 a.m. to 8:00 a.m.). Likewise, there is a ramp‐down requirement for the evening hours starting at 7:00
p.m. and going to 11:00 p.m. In 2016, the SPP system faced an average ramp‐down requirement of close
to 5000 MW in this four‐hour block. With increasing wind penetration, the ramping requirements are
likely to go up in the near future.
19 The node is located near Hitchland, TX in Southwestern Public Service (SPS) territory. 20 See Southwest Power Pool OASIS.
0
200
400
600
800
1000
1200
1400
1600
0‐10 % 10‐20 % 20‐30% > 30 %
Number of Hours (< $5)
SPP Wind Penetration Level
Low Energy Price (less than 5 $/MWh) Trend
SPP South Hub Woodward (OKGE) Node
Hitchland (SPS) Node
0
200
400
600
800
1000
1200
1400
0‐10 % 10‐20 % 20‐30% > 30 %
Number of Hours
SPP Wind Penetration Level
Negative Nodal Energy Price Trend
SPP South Hub Woodward (OKGE) Node
Hitchland (SPS) Node

HVDC and Non‐Dispatchable Generation
A‐15
Figure 18. Average net generation profile curve for SPP by the hour of the day (a typical spring week in March)
Source: SPP Marketplace.
Note: Net generation includes generation from dispatchable units (without wind and solar).
To address these challenges, SPP has been implementing a number of incremental mitigation measures
in terms of market reforms and operational practices. In 2015, SPP implemented its Regulation
Compensation market design in compliance with FERC Order No. 755 (FERC 2011a). The revised design
includes additional payment to market participants based on changes in energy output for regulation
deployment in real‐time markets (SPP 2014). The new regulation product is set to offer the highest
mileage offer (that is, price for expected performance) of any resource cleared for regulation service. This
is expected to boost the participation of generator resources in the regulation market, thereby facilitating
greater penetration of wind resources. Cumulatively, these policies helped in reducing wind curtailments
and increasing dispatch from wind units in the region.
To accommodate the expected future wind growth, the SPP and other market participants are exploring
a portfolio of options ranging from sponsored transmission solutions to SPP implementing improved
market operational practices. Absent new demand or consumers, there may not be enough load appetite
for wind projects in the pipeline. Consequently, intra‐ and interregional HVDC lines may offer the suitable
external markets for these wind projects. As an immediate mitigation measure to relieve transmission
bottlenecks in the “wind alley” region, the congestion relief projects identified in recent SPP Integrated
Transmission Planning reports are being planned and implemented. For example for relieving the
Woodward area flow gate, SPP has identified a second 345 kV Matthewson‐Tatonga line and an extra high
voltage phase shifting transformer at Woodward (SPP 2016a). This is expected to relieve the bottlenecks
and facilitate greater dispatch from the planned wind projects in the region.
In terms of market operational practices, ICF identified two measures that could encourage greater wind
penetration. The provision of mileage‐based regulation compensation is expected to incentivize resources
to participate in the ancillary services market. With greater participation of generator resources in these
15000
16000
17000
18000
19000
20000
21000
22000
23000
24000
12:00 AM
1:00 AM
2:00 AM
3:00 AM
4:00 AM
5:00 AM
6:00 AM
7:00 AM
8:00 AM
9:00 AM
10:00 AM
11:00 AM
12:00 PM
1:00 PM
2:00 PM
3:00 PM
4:00 PM
5:00 PM
6:00 PM
7:00 PM
8:00 PM
9:00 PM
10:00 PM
11:00 PM
Avg. N
et SPP Gen
eration (MWh)
Hour of Day
2014 2015 2016 2017
Steep ramp down requirement

HVDC and Non‐Dispatchable Generation
A‐16
markets, the scope for further wind penetration increases. The Wind Integration report calls for changes
in operational dispatch practices and transmission improvements to alleviate these bottlenecks (SPP
2016a). The report recommended installing voltage reactive support capabilities for existing wind farms,
accelerating the Integrated Transmission Planning projects in the SPP queue, and enhancing operations
and utilizing real‐time monitoring tools (using PMU and other software applications) to achieve sustained
higher wind penetration levels (SPP 2016a).
The other key issue affecting wind development in SPP is the need to source new load areas and demand
for the existing units and proposed wind projects in the pipeline. HVDC lines are one of the solutions for
this challenge. Of all the projects in the region, we feel that most promising is the Clean Line HVDC Project.
The Plains & Eastern Clean Line is an approximately 700‐mile DC transmission line that will deliver wind
energy from the Oklahoma‐Texas Panhandle region to utilities and customers in the Mid‐South (MISO)
and southeastern United States (TVA). The project also involves the construction of AC collector systems
to collect and transport the energy generated by wind farms in the “wind alley” region of SPP. The project
received DOE approval in early 2016 and construction commenced in late 2017 (Clean Line Energy
Partners 2017b).
Clean Line HVDC Project – Case Study for SPP
For the SPP region, ICF focused on Plains & Eastern’s Clean Line HVDC Project as a detailed case study
(DOE 2016, Clean Line Energy Partners 2017b). The project is expected to deliver nearly 4,000 MW of
power from the Oklahoma‐Texas Panhandle region to customers in Arkansas (MISO region), Tennessee
(in TVA region), and other southwestern states using a 720‐mile, 600‐kV HCDC overhead line. Although
the HVDC line is expected to be bi‐directional, under normal operating conditions power will flow from
the wind farms to the load centers in Arkansas and Tennessee. The project is also expected to stabilize
regional grids by coordinating with neighboring control areas to change the direction of power flow rapidly
if needed. The wind farms are expected to be directly connected to the Oklahoma converter station
through a dedicated wind collector system. To summarize, the facilities associated with the project include
converter stations located southeast of Guymon in Texas County, Oklahoma; northeast of Memphis in
Shelby County, Tennessee; an intermediate converter station at Pope/Conway County in Arkansas; and
an AC collector system for Oklahoma‐Texas Panhandle region (DOE 2015a, Clean Line Energy Partners
2015). The project is expected to interconnect grids operated by SPP, MISO, and TVA.
In March 2016, DOE issued a Record of Decision approving the transmission project under Section 1222
of the Energy Policy Act, 2005 (DOE 2016, Plains and Eastern 2017). This is the first time a transmission
project has been qualified under this authority that allows for participation of DOE in the implementation
of the project (subject to certain conditions). The project also successfully cleared the applicable National
Environmental Policy Act review in mid‐2015 and has also secured the state regulatory approvals for
operating as a public electric utility from Oklahoma and Tennessee but awaiting approvals from Arkansas
(at the time of writing).

HVDC and Non‐Dispatchable Generation
A‐17
Figure 19. Overview of proposed clean line HVDC line
Source: Clean Line Energy Partners (2017b).
As discussed earlier in the report, the Clean Line Project accommodates the increasing demand for
interregional transmission capacity to evacuate power from the “wind alley” region of Oklahoma‐Texas
Panhandle region to the load centers in the Mid‐South and Southeast. In addition, the Panhandle region
has some of the best wind resources in the country and has the potential to generate cost‐effective wind
power (under three cents per kilowatthour) (Clean Line Energy Partners 2015). There are recognized
limitations to the existing regional transmission system to support the necessary wind energy
development and deliver the low‐cost power to the neighboring regions. Interregional HVDC lines like
Clean Line can help to obviate such limitations and deliver cost‐effective power to MISO and TVA regions.
The project also facilitates the clean energy requirements of the TVA region by receiving nearly 3,500 MW
of the line capacity. Finally, the need for increased west‐east transfer capability was identified in several
interregional studies like the Joint Coordinated System Plan involving MISO, SPP, PJM, and TVA and NREL’s
Eastern Wind Integration and Transmission Study for facilitating wind integration in the region (Clean Line
Energy Partners 2015).
Insights from Clean Line Case Study
Clean Line is expected to utilize a collector system that will in effect connect the wind generation
resources directly to the client region, bypassing the host region. The line, which is expected to be more
than 700 miles long, would show the advantage of HVDC when connecting supply resources to distant
load centers in different balancing authorities.

HVDC and Non‐Dispatchable Generation
A‐18
HVDC transmission is a topic of increasing interest for stakeholders in the power transmission industry.
For this literature survey, ICF reviewed publicly available research studies, reports, industry articles, and
journal articles to summarize the recent trends in HVDC technology and its deployment. These sources
also provide insights about the benefits and challenges of HVDC implementation, and its applicability for
facilitating greater renewable integration.
Applications for High‐Voltage Direct Current Transmission Technologies – DOE (2013)
This report discusses the applications of HVDC transmission technologies. The findings are based on a
workshop organized by DOE in April 2013. This workshop was held to help participants develop a better
understanding of HVDC transmission technologies and their application in the North American electric
grid. The report identifies the benefits of implementing HVDC technologies such as: increased system
stability, frequency regulation, forcing ordered power into an area, limiting fault currents, and providing
black start capabilities. The report highlights the fact that HVDC technology can be applied for water
crossings, asynchronous interconnections (back‐to‐back), bulk power transfers, and accessing offshore
wind. The report suggests that technology hurdles may not be a significant issue for greater deployment,
since losses associated with power electronic devices affect only the business proposition of using HVDC
and controllability has improved (and continues to improve) tremendously. The report states that the
biggest challenge for HVDC applications is the current regulatory landscape, since FERC Order No. 1000
(FERC 2011b) requires the allocation of costs of new transmission projects to beneficiaries, who are hard
to identify.
Improvement of Wind Energy Production through HVDC Systems – Brenna et al. (2017)
Published in January 2017 by Brenna et al. of Polytechnic University of Milan, this research study focuses
on the implementation of HVDC systems on the Italian bulk power system. A model of the power system
was developed to evaluate possible solutions to reduce wind curtailment, and a proposal for the
construction of an HVDC line linking southern and northern Italy was studied.
The study models and simulates the impact of a long‐distance HVDC connection between the country’s
northern and southern regions (about 800 km). The simulation shows that the introduction of the
proposed HVDC line causes a significant drop of wind curtailment. The base case used in the model,
representing the status of the grid, results in 119.8 GWh of overall annual curtailment. Once the proposed
HVDC line (1000 MW capacity) is implemented, the overall annual curtailment drops to 31.9 GWh, a 73%
decrease from the base case. Increasing the line capacity to 1,500 MW causes curtailment to drop to 25
GWh, a 79.1% decrease from the base case. The implementation of the HVDC line also affects the three
main zones of the Italian power grid (SUD – South, NORD – North, SICI – Sicily). The over‐generation
occurring in SUD and SICI is more easily shifted to NORD, where the load is high enough to accommodate
it. The annual hours in which the SICI‐SUD lines are congested are reduced by 241 between the base case
and the 1500 MW HVDC Case.
HVDC is also a better option since the long distance involved makes it more economical and more efficient
compared to an AC connection. Despite long payback times involved with a DC investment, great
substantial reductions in wind curtailments reductions make the implementation of an HVDC connection
HVDC and Non‐Dispatchable Generation
A‐19
compelling. HVDC provide the capability to more easily and efficiently integrate renewable energy
sources, which are bound to increase further in the coming years.
“HVDC on the Rise” – Hirsch, EPRI (2016)
The Electric Power Research Institute (EPRI) published this article in the January/February 2016 edition of
the EPRI Journal. The issue focuses on the new opportunities and benefits of HVDC transmission
implementation. Unlike HVAC transmission technology, HVDC travels through the entire cross‐section of
a conductor and needs fewer wires, enabling it to move energy over greater distances with less power
loss. HVDC also provides controlled power flows, contributing to grid stability. As costs come down for DC
transmission, the business case improves for even shorter distances.
According to the article, HVDC implementation also creates a few challenges, including the management
of an HVDC link loss, the lack of familiarity with HVDC maintenance practices, the shorter lifetimes of
HVDC assets compared to HVAC, and the expensive communication systems required for multi‐terminal
HVDC systems.
The article also notes that globally, the demand for HVDC is growing. This growth can be attributed to
several factors, with the main one being the increasing renewable energy integration, which is well suited
for HVDC. The need for increased system reliability is also a contributing factor, as HVDC can help reduce
the spread of large‐scale disturbances by providing a buffer between regions.
Roadmap to the Supergrid Technologies – Friends of the Supergrid (2012)
Friends of the Supergrid is a group of energy companies with a mutual interest in promoting the policy
and regulatory framework required to enable the creation of an HVDC Supergrid in Europe. The European
Energy Forum defines a Supergrid as “a pan‐European transmission network facilitating the integration of
large‐scale renewable energy and the balancing and transportation of electricity, with the aim of
improving the European market.” 21 In 2012, the group published a report regarding the drivers for
European system expansion and the technologies available to aid this expansion, while presenting a
possible roadmap along with various scenarios for developing the Supergrid.
The report provides a detailed description of HVDC cable types, such as mass‐impregnated (MI) cables
and extruded insulation cables (DC‐XLPE). A breakdown of the factors influencing the decision between
AC and DC transmission is also included. These factors include the transmission distance, the shunt
reactive power compensation required for long cable links, the ROW requirements for each system, and
the system stability provided by each system. According to the report, HVDC can provide damping to
power oscillations because of its precise power flow control capability.
The gradual introduction of HVDC grids over the next 15 years is foreseen to be the key enabling
technology to match renewable targets on the global markets. This is due to the benefits of HVDC
implementation, which include: a DC line can transmit more than double the power at about half the
losses compared to an AC line at a similar voltage level; HVDC lines, even overhead, have a considerably
reduced footprint with consequent reduced consenting risk; and an HVDC in parallel to an AC system
increases power transmission capacity and at the same time contributes to system stability.
21 European Energy Forum. Friends of the Supergrid.
HVDC and Non‐Dispatchable Generation
A‐20
HVDC Technology for Offshore Grids and a Supergrid in Europe – Beerten, IEEE PES (2016)
This presentation is from the IEEE Power & Energy Society (PES) General Meeting in 2016 by the University
of Leuven and Energyville, a Belgian research institute. It focuses on the technological and regulatory
challenges of HVDC technology implementation for offshore grids and the European Supergrid. A detailed
comparison of AC and DC cables is provided, comparing attributes of the two system types, including
controllability, investment costs, long‐distance capabilities, and line losses.
The report discusses the present and future state of markets for HVDC technologies. It is noted that the
worldwide HVDC market is in excess of $4 billion annually and rising, since HVDC grids are nowadays
considered as the backbone for future transmission systems. The presentation highlights the challenges
affecting HVDC grid implementation, such as power flow and DC voltage control, fault clearing capabilities,
grid protection coordination, communication requirements, multi‐vendor interoperability, and voltage
level standardization. The lack of widespread HVDC implementation is attributed to the manufacturers,
who are waiting for a robust demand from the market to speed up developments, and to the Transmission
System Operators (TSOs), who are missing strong incentives to jointly develop interconnected HVDC grids
under the current regulatory framework. The report suggests a continued focus on research and
development (R&D) in the system operation and optimization fields, the development of interoperability
guidelines and standards, and the conception of new control and operation guidelines by TSOs.
Renewable Energy Integration in Power Grids – IEA‐ETSAP IRENA (2015)
This technology brief, prepared by the International Energy Agency (IEA) Energy Technology Systems
Analysis Programme (ETSAP) 22 and the International Renewable Energy Agency (IRENA), 23 provides
insights on renewable energy integration in power grids. It includes a detailed grid interconnection
section, noting that increased interconnection at a regional, national and international level would enable
more flexibility in power transmission from regions with ample availability of renewables to other regions
with high electricity demand. The benefits of higher interconnection capacity are discussed, which can be
achieved through HVDC implementation. According to the brief, higher interconnection capacity allows
for the optimal use of surplus generation, alleviates the problem of daily and seasonal peak demands,
reduces the requirements for regulation reserves, enhances congestion management, and reduces the
need for new generation capacity. It is also noted that HVDC transmission lines are highly efficient,
although their implementation takes time and involves significant upfront investment.
“Future Cost‐competitive Electricity Systems and Their Impact on US CO2 Emissions” – MacDonald et
al. (2016)
Published in the May 2016 edition of Nature Climate Change, this article provides an overview of future
cost‐competitive electricity systems and their impact on U.S. CO2 emissions. It provides several reasons
why HVDC should be implemented over HVAC, such as the long‐distance transmission capability of HVDC,
and the increased efficiency and lower cost compared to HVAC. It suggests that by using existing
technologies, the U.S. electricity sector can substantially reduce its CO2 emissions by 2030 without an
increase in the LCOE, assuming learning curve cost reductions in wind and solar photovoltaics and the
22 ETSAP is the longest running Technology Collaboration Programme of the International Energy Agency (IEA). 23 IRENA is an intergovernmental organization founded in 2009. It promotes the adoption and sustainable use of renewable energy across its 150 member‐states.
HVDC and Non‐Dispatchable Generation
A‐21
facilitation of a national HVDC transmission grid overlay. A national HVDC network is also proposed,
asserting that a shift from a regionally divided system to a national one could save U.S. consumers an
estimated $47.2 billion annually, which amounts to almost three times the cost of the HVDC transmission
per year. This national power system would consist of a web of lines connecting 32 nodes, allowing power
to flow between each region. The HVDC reduces the potential of whole electrical power system blackouts
because the entire system does not need to operate at exactly the same frequency. The supplementary
information document of the article includes costs for HVDC, estimating the transmission line cost at
$701/MW‐mile and the transformer station cost at $182K/MW. The cost is highly dependent on the length
of the transmission lines.
High‐Voltage Direct Current Transmission Systems – Torvik and Lockhart, Navigant Research (2013)
This report includes a global market analysis of HVDC transmission systems. The report provides a market
overview and notes that more recent innovations in power electronics complement and extend AC
systems with reliable, energy efficient, and high power HVDC voltage conversion and power transmission.
It refers to the Hudson Transmission Partners’ (HTP) project in New York and New Jersey as an example
of an HVDC project designed to creatively address regional transmission intertie requirements. Navigant
estimates that the HVDC transmission market constitutes approximately 333 GW of new transmission
capacity between 2013 and 2020.
The HVDC drivers are also discussed, and Navigant suggests that the growth in electricity demand, along
with the asynchronous operability and efficiency of HVDC, will lead to an increase in HVDC
implementation. Navigant forecasts that the global cumulative HVDC converter revenue will amount to
$56.6 billion in 2020, citing a growth in VSC demand. VSC is a technology that can be used for submarine
HVDC transmission and is estimated to amount to 19% of total new HVDC capacity between 2013 and
2020.
Quadrennial Technology Review – An Assessment of Energy Technologies and Research Opportunities
– DOE (2015b)
This report provides an assessment of emerging energy technologies and associated research
opportunities and provides an in‐depth look into transmission and distribution components (HVDC
converters, VSCs, and MMCs) along with suggestions for HVDC circuit protection. The report recommends
that the HVDC protection systems be enhanced to ensure system reliability. The issue is that while
protection technologies (for example, breakers) are mature for HVAC, they are less established for HVDC
systems. Material and design innovations are expected to drive down costs and increase power ratings,
accelerating technology deployment. Multi‐terminal networks require advanced methods for DC fault
identification and mitigation, and since many HVDC system components are in isolated locations,
advances in circuit technology will aid in system protection, maintenance, and restoration.
ABB Review – Special Report: 60 Years of HVDC – ABB (2014)
ABB Inc. published this special market report on the state of HVDC technology evolution over the past 60
years, along with a future market outlook, insights on future HVDC technologies and their potential impact
on the U.S. power grid. According to the report, HVDC transmission systems provide numerous benefits,
including twin‐cable installation, which neutralizes magnetic fields, and an enclosed converter station,
which efficiently suppresses noise and has a smaller station footprint compared to HVAC. New HVDC

HVDC and Non‐Dispatchable Generation
A‐22
technologies (HVDC Light) allow for new system applications, such as remote offshore applications, weak
system interconnections, and long land cables. The report notes that as the demand for energy grows, so
does the demand for reliable energy supply. The report pitches HVDC technology as capable of offering
more intelligent and better‐controlled grid networks. These networks will be a combination of AC and DC
technologies, embedding HVDC transmission inside the AC grid and reinforcing the operation of the whole
grid with the controllability, speed, and low losses provided by HVDC. The report opines that increasing
sub‐sea transmission projects have opened the door to the further expansion of the global power cable
network. HVDC transmission is critical to build such global cable networks. New VSC technology is
expected to simplify the job of connecting weak AC networks as well as making it easier to transfer power
from offshore wind generators and other remote renewables. Since HVDC has the capability of connecting
asynchronous AC networks, it can effectively be used in very long sub‐sea cables that connect AC systems.
As stated in the report, a key enabling product for HVDC is the new, lightweight polymer‐insulated cable,
which allows systems with higher transmission to be built. HVDC transmission capability has grown from
80 kV during the first iteration of HVDC Light, to a remarkable 320 kV in projects that are currently under
construction. The theoretical limits of HVDC’s core technologies have not yet been reached, meaning that
HVDC still has great potential for growth and is set to become an even more dominant technology for bulk
power transmission.
Integrating Renewable Electricity on the Grid – APS Physics (2010)
This report on the integration of renewable electricity on the existing power grid provides ways HVDC
implementation can help with renewable integration. The report notes that HVDC is favored for distances
greater than a few hundred miles, for its lower electrical losses, and for lower cost. The report states that
the mandated growth of nationwide wind and solar generation through RPSs to 20% for 2020 or 30% for
2030 of electricity supply changes the landscape for long‐distance transmission. This is because such large
fractions of renewable power often are not found within 100 miles of urban load centers and rooftop
photovoltaics can alleviate some of the need for long‐distance transmission, but often at a higher cost
than wind or concentrating solar power.
The report also discusses HVDC transmission implementation options, proposing that underground
superconducting DC transmission lines allow for the creation of a national renewable electricity
transmission system. These lines operate at zero resistance, eliminating losses for any transmission
length, and they carry much more current and power than conventional conductors. Without losses, there
is no need to raise voltage and lower current to extreme levels.
Finally, the report provides the following recommendations for DOE, specific to HVDC technology: extend
the DOE/OE High Temperature Superconductivity program for 10 years, with a focus on DC
superconducting cables for long‐distance transmission of renewable energy from source to market; and
accelerate R&D on wide‐band gap power electronics for DC conversion options and development of
semiconductor‐based circuit breakers operating at 200 kV and 50 kiloamps with microsecond response
time.
New England Wind Integration Study – GE Energy, ISO‐NE (2010)
This report, prepared for ISO‐NE by GE Energy, was commissioned to assess the operational effects of
large‐scale wind penetration in New England using statistical and simulation analysis of historical data.
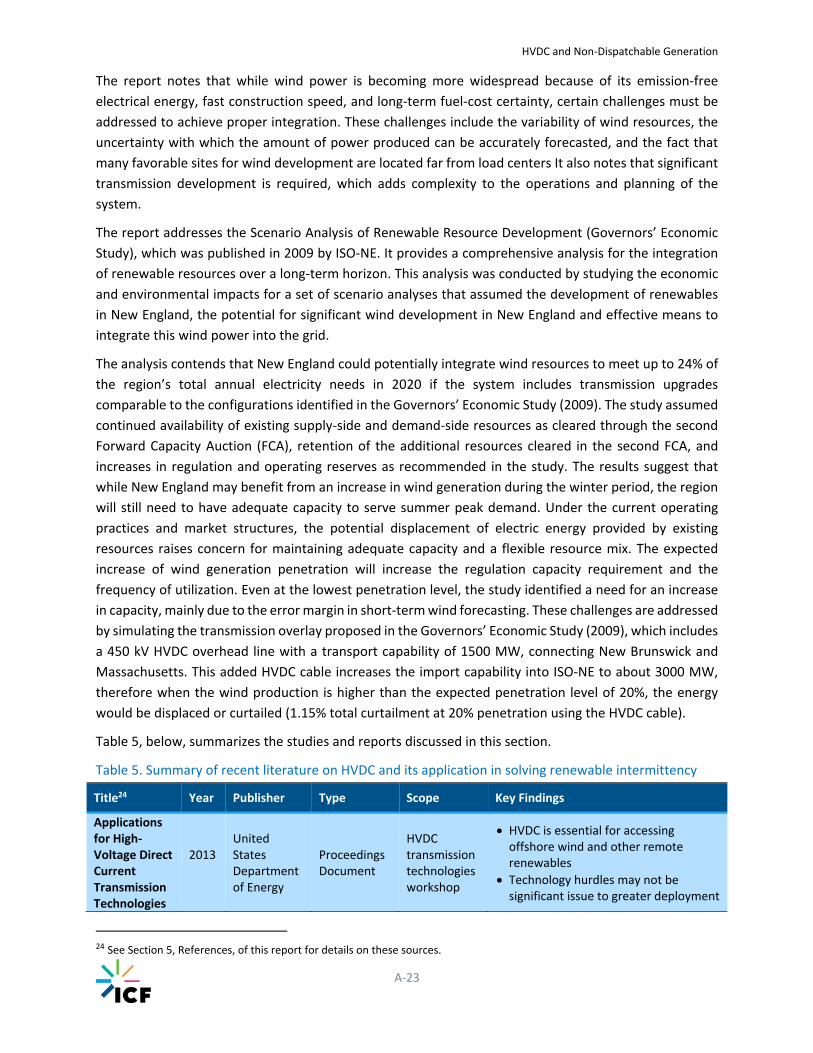
HVDC and Non‐Dispatchable Generation
A‐23
The report notes that while wind power is becoming more widespread because of its emission‐free
electrical energy, fast construction speed, and long‐term fuel‐cost certainty, certain challenges must be
addressed to achieve proper integration. These challenges include the variability of wind resources, the
uncertainty with which the amount of power produced can be accurately forecasted, and the fact that
many favorable sites for wind development are located far from load centers It also notes that significant
transmission development is required, which adds complexity to the operations and planning of the
system.
The report addresses the Scenario Analysis of Renewable Resource Development (Governors’ Economic
Study), which was published in 2009 by ISO‐NE. It provides a comprehensive analysis for the integration
of renewable resources over a long‐term horizon. This analysis was conducted by studying the economic
and environmental impacts for a set of scenario analyses that assumed the development of renewables
in New England, the potential for significant wind development in New England and effective means to
integrate this wind power into the grid.
The analysis contends that New England could potentially integrate wind resources to meet up to 24% of
the region’s total annual electricity needs in 2020 if the system includes transmission upgrades
comparable to the configurations identified in the Governors’ Economic Study (2009). The study assumed
continued availability of existing supply‐side and demand‐side resources as cleared through the second
Forward Capacity Auction (FCA), retention of the additional resources cleared in the second FCA, and
increases in regulation and operating reserves as recommended in the study. The results suggest that
while New England may benefit from an increase in wind generation during the winter period, the region
will still need to have adequate capacity to serve summer peak demand. Under the current operating
practices and market structures, the potential displacement of electric energy provided by existing
resources raises concern for maintaining adequate capacity and a flexible resource mix. The expected
increase of wind generation penetration will increase the regulation capacity requirement and the
frequency of utilization. Even at the lowest penetration level, the study identified a need for an increase
in capacity, mainly due to the error margin in short‐term wind forecasting. These challenges are addressed
by simulating the transmission overlay proposed in the Governors’ Economic Study (2009), which includes
a 450 kV HVDC overhead line with a transport capability of 1500 MW, connecting New Brunswick and
Massachusetts. This added HVDC cable increases the import capability into ISO‐NE to about 3000 MW,
therefore when the wind production is higher than the expected penetration level of 20%, the energy
would be displaced or curtailed (1.15% total curtailment at 20% penetration using the HVDC cable).
Table 5, below, summarizes the studies and reports discussed in this section.
Table 5. Summary of recent literature on HVDC and its application in solving renewable intermittency
Title24 Year Publisher Type Scope Key Findings
Applications for High‐Voltage Direct Current Transmission Technologies
2013
United States Department of Energy
Proceedings Document
HVDC transmission technologies workshop
HVDC is essential for accessing offshore wind and other remote renewables
Technology hurdles may not be significant issue to greater deployment
24 See Section 5, References, of this report for details on these sources.
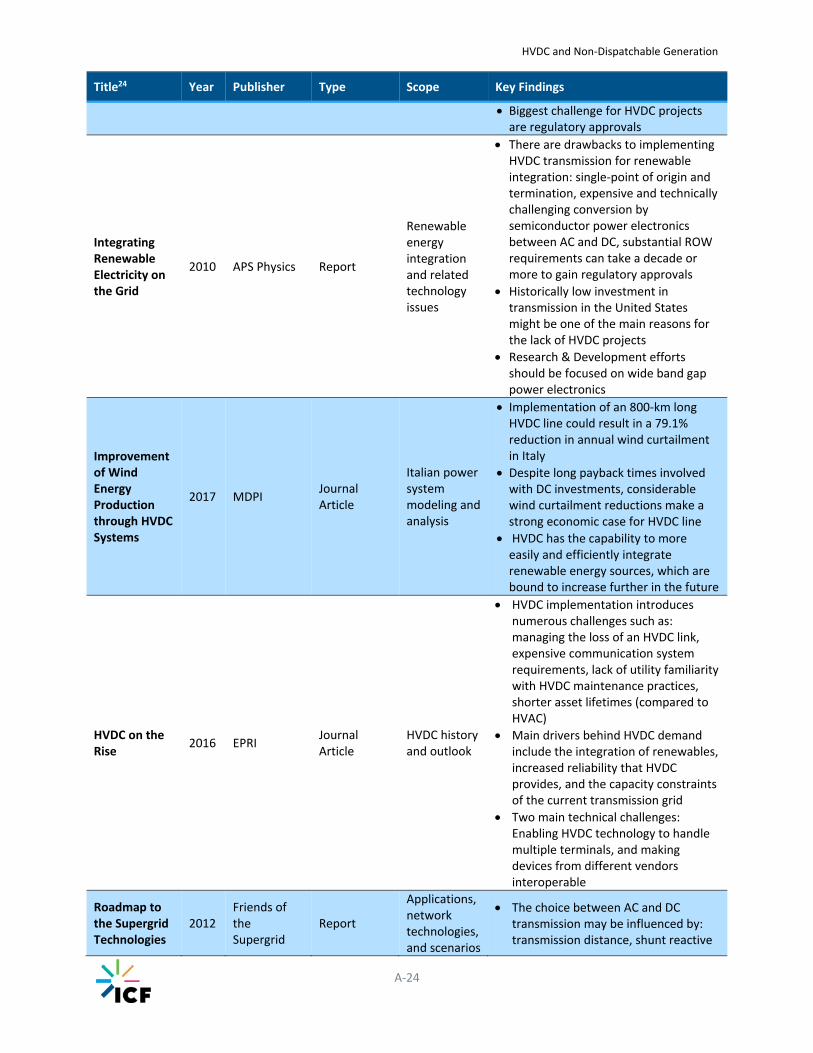
HVDC and Non‐Dispatchable Generation
A‐24
Title24 Year Publisher Type Scope Key Findings
Biggest challenge for HVDC projects are regulatory approvals
Integrating Renewable Electricity on the Grid
2010 APS Physics Report
Renewable energy integration and related technology issues
There are drawbacks to implementing HVDC transmission for renewable integration: single‐point of origin and termination, expensive and technically challenging conversion by semiconductor power electronics between AC and DC, substantial ROW requirements can take a decade or more to gain regulatory approvals
Historically low investment in transmission in the United States might be one of the main reasons for the lack of HVDC projects
Research & Development efforts should be focused on wide band gap power electronics
Improvement of Wind Energy Production through HVDC Systems
2017 MDPI Journal Article
Italian power system modeling and analysis
Implementation of an 800‐km long HVDC line could result in a 79.1% reduction in annual wind curtailment in Italy
Despite long payback times involved with DC investments, considerable wind curtailment reductions make a strong economic case for HVDC line
HVDC has the capability to more easily and efficiently integrate renewable energy sources, which are bound to increase further in the future
HVDC on the Rise
2016 EPRI Journal Article
HVDC history and outlook
HVDC implementation introduces numerous challenges such as: managing the loss of an HVDC link, expensive communication system requirements, lack of utility familiarity with HVDC maintenance practices, shorter asset lifetimes (compared to HVAC)
Main drivers behind HVDC demand include the integration of renewables, increased reliability that HVDC provides, and the capacity constraints of the current transmission grid
Two main technical challenges: Enabling HVDC technology to handle multiple terminals, and making devices from different vendors interoperable
Roadmap to the Supergrid Technologies
2012 Friends of the Supergrid
Report
Applications, network technologies, and scenarios
The choice between AC and DC transmission may be influenced by: transmission distance, shunt reactive
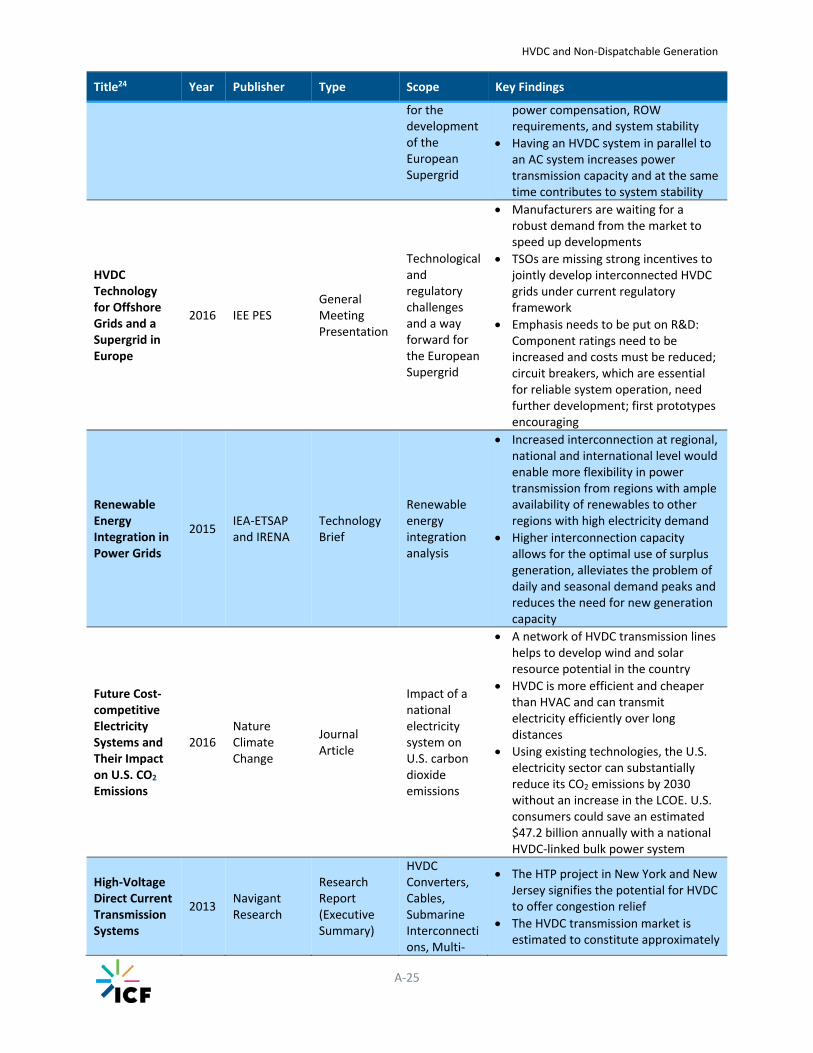
HVDC and Non‐Dispatchable Generation
A‐25
Title24 Year Publisher Type Scope Key Findings
for the development of the European Supergrid
power compensation, ROWrequirements, and system stability
Having an HVDC system in parallel to an AC system increases power transmission capacity and at the same time contributes to system stability
HVDC Technology for Offshore Grids and a Supergrid in Europe
2016 IEE PES General Meeting Presentation
Technological and regulatory challenges and a way forward for the European Supergrid
Manufacturers are waiting for a robust demand from the market to speed up developments
TSOs are missing strong incentives to jointly develop interconnected HVDC grids under current regulatory framework
Emphasis needs to be put on R&D: Component ratings need to be increased and costs must be reduced; circuit breakers, which are essential for reliable system operation, need further development; first prototypes encouraging
Renewable Energy Integration in Power Grids
2015 IEA‐ETSAP and IRENA
Technology Brief
Renewable energy integration analysis
Increased interconnection at regional, national and international level would enable more flexibility in power transmission from regions with ample availability of renewables to other regions with high electricity demand
Higher interconnection capacity allows for the optimal use of surplus generation, alleviates the problem of daily and seasonal demand peaks and reduces the need for new generation capacity
Future Cost‐competitive Electricity Systems and Their Impact on U.S. CO2 Emissions
2016 Nature Climate Change
Journal Article
Impact of a national electricity system on U.S. carbon dioxide emissions
A network of HVDC transmission lines helps to develop wind and solar resource potential in the country
HVDC is more efficient and cheaper than HVAC and can transmit electricity efficiently over long distances
Using existing technologies, the U.S. electricity sector can substantially reduce its CO2 emissions by 2030 without an increase in the LCOE. U.S. consumers could save an estimated $47.2 billion annually with a national HVDC‐linked bulk power system
High‐Voltage Direct Current Transmission Systems
2013 Navigant Research
Research Report (Executive Summary)
HVDC Converters, Cables, Submarine Interconnections, Multi‐
The HTP project in New York and New Jersey signifies the potential for HVDC to offer congestion relief
The HVDC transmission market is estimated to constitute approximately
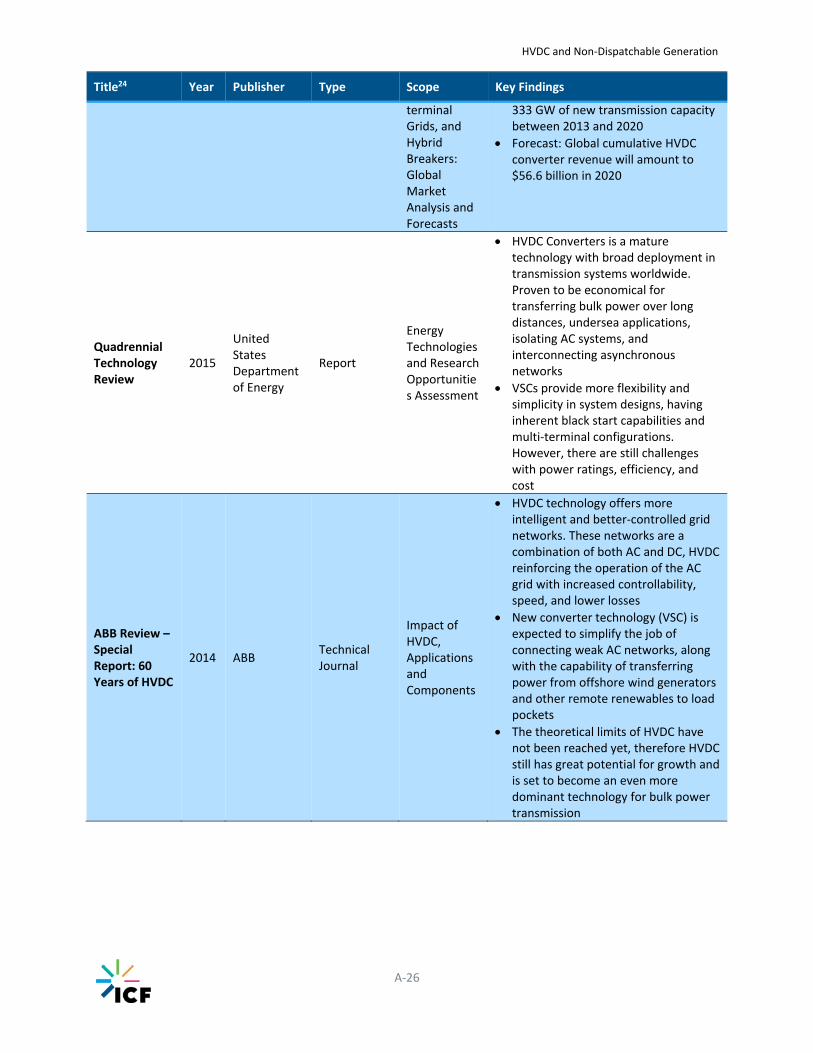
HVDC and Non‐Dispatchable Generation
A‐26
Title24 Year Publisher Type Scope Key Findings
terminal Grids, and Hybrid Breakers: Global Market Analysis and Forecasts
333 GW of new transmission capacity between 2013 and 2020
Forecast: Global cumulative HVDC converter revenue will amount to $56.6 billion in 2020
Quadrennial Technology Review
2015
United States Department of Energy
Report
Energy Technologies and Research Opportunities Assessment
HVDC Converters is a mature technology with broad deployment in transmission systems worldwide. Proven to be economical for transferring bulk power over long distances, undersea applications, isolating AC systems, and interconnecting asynchronous networks
VSCs provide more flexibility and simplicity in system designs, having inherent black start capabilities and multi‐terminal configurations. However, there are still challenges with power ratings, efficiency, and cost
ABB Review – Special Report: 60 Years of HVDC
2014 ABB Technical Journal
Impact of HVDC, Applications and Components
HVDC technology offers more intelligent and better‐controlled grid networks. These networks are a combination of both AC and DC, HVDC reinforcing the operation of the AC grid with increased controllability, speed, and lower losses
New converter technology (VSC) is expected to simplify the job of connecting weak AC networks, along with the capability of transferring power from offshore wind generators and other remote renewables to load pockets
The theoretical limits of HVDC have not been reached yet, therefore HVDC still has great potential for growth and is set to become an even more dominant technology for bulk power transmission
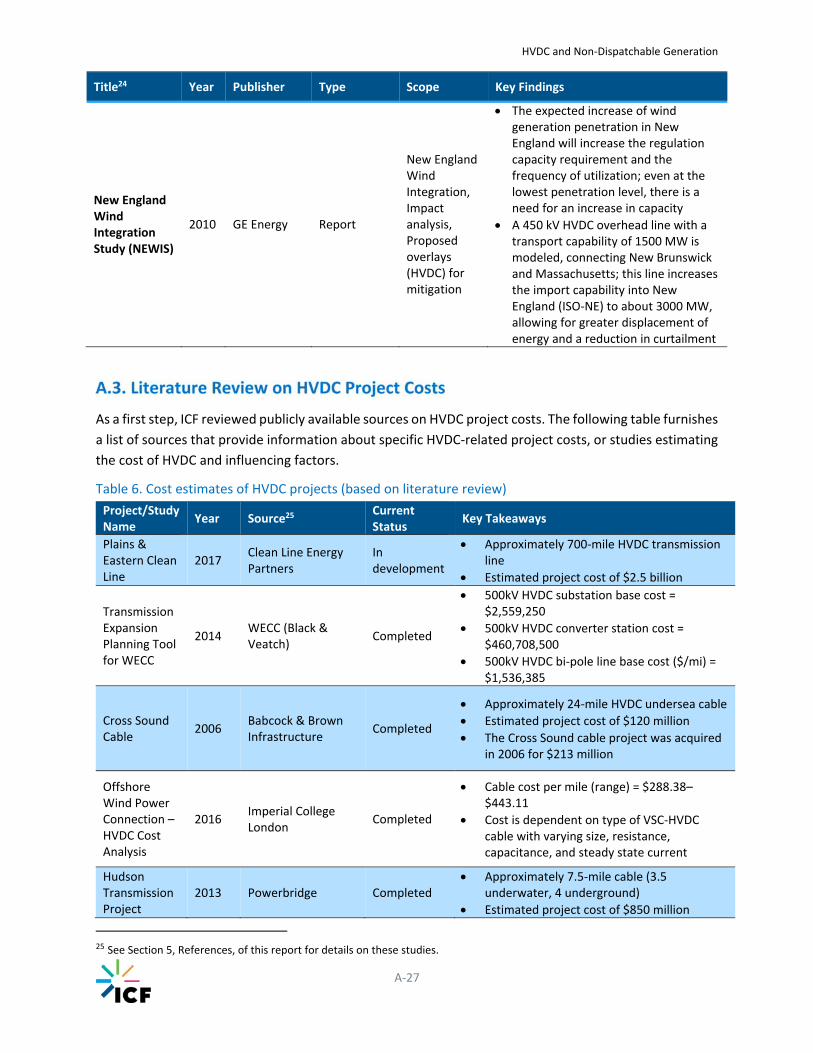
HVDC and Non‐Dispatchable Generation
A‐27
Title24 Year Publisher Type Scope Key Findings
New England Wind Integration Study (NEWIS)
2010 GE Energy Report
New England Wind Integration, Impact analysis, Proposed overlays (HVDC) for mitigation
The expected increase of wind generation penetration in New England will increase the regulation capacity requirement and the frequency of utilization; even at the lowest penetration level, there is a need for an increase in capacity
A 450 kV HVDC overhead line with a transport capability of 1500 MW is modeled, connecting New Brunswick and Massachusetts; this line increases the import capability into New England (ISO‐NE) to about 3000 MW, allowing for greater displacement of energy and a reduction in curtailment
As a first step, ICF reviewed publicly available sources on HVDC project costs. The following table furnishes
a list of sources that provide information about specific HVDC‐related project costs, or studies estimating
the cost of HVDC and influencing factors.
Table 6. Cost estimates of HVDC projects (based on literature review)
Project/Study Name
Year Source25 Current Status
Key Takeaways
Plains & Eastern Clean Line
2017 Clean Line Energy Partners
In development
Approximately 700‐mile HVDC transmission line
Estimated project cost of $2.5 billion
Transmission Expansion Planning Tool for WECC
2014 WECC (Black & Veatch)
Completed
500kV HVDC substation base cost = $2,559,250
500kV HVDC converter station cost = $460,708,500
500kV HVDC bi‐pole line base cost ($/mi) = $1,536,385
Cross Sound Cable
2006 Babcock & Brown Infrastructure
Completed
Approximately 24‐mile HVDC undersea cable
Estimated project cost of $120 million
The Cross Sound cable project was acquired in 2006 for $213 million
Offshore Wind Power Connection – HVDC Cost Analysis
2016 Imperial College London
Completed
Cable cost per mile (range) = $288.38–$443.11
Cost is dependent on type of VSC‐HVDC cable with varying size, resistance, capacitance, and steady state current
Hudson Transmission Project
2013 Powerbridge Completed Approximately 7.5‐mile cable (3.5
underwater, 4 underground)
Estimated project cost of $850 million
25 See Section 5, References, of this report for details on these studies.
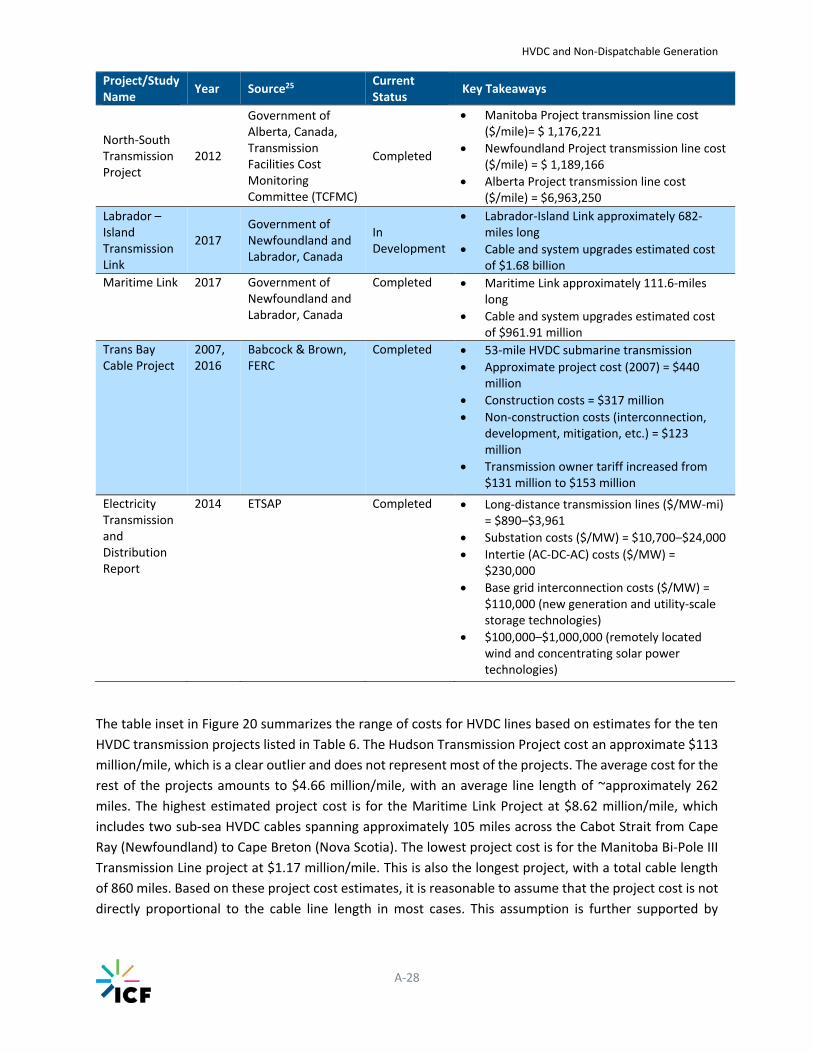
HVDC and Non‐Dispatchable Generation
A‐28
Project/Study Name
Year Source25 Current Status
Key Takeaways
North‐South Transmission Project
2012
Government of Alberta, Canada, Transmission Facilities Cost Monitoring Committee (TCFMC)
Completed
Manitoba Project transmission line cost ($/mile)= $ 1,176,221
Newfoundland Project transmission line cost ($/mile) = $ 1,189,166
Alberta Project transmission line cost ($/mile) = $6,963,250
Labrador – Island Transmission Link
2017 Government of Newfoundland and Labrador, Canada
In Development
Labrador‐Island Link approximately 682‐miles long
Cable and system upgrades estimated cost of $1.68 billion
Maritime Link 2017 Government of Newfoundland and Labrador, Canada
Completed Maritime Link approximately 111.6‐miles long
Cable and system upgrades estimated cost of $961.91 million
Trans Bay Cable Project
2007, 2016
Babcock & Brown,FERC
Completed 53‐mile HVDC submarine transmission
Approximate project cost (2007) = $440 million
Construction costs = $317 million
Non‐construction costs (interconnection, development, mitigation, etc.) = $123 million
Transmission owner tariff increased from $131 million to $153 million
Electricity Transmission and Distribution Report
2014 ETSAP Completed Long‐distance transmission lines ($/MW‐mi) = $890–$3,961
Substation costs ($/MW) = $10,700–$24,000
Intertie (AC‐DC‐AC) costs ($/MW) = $230,000
Base grid interconnection costs ($/MW) = $110,000 (new generation and utility‐scale storage technologies)
$100,000–$1,000,000 (remotely located wind and concentrating solar power technologies)
The table inset in Figure 20 summarizes the range of costs for HVDC lines based on estimates for the ten
HVDC transmission projects listed in Table 6. The Hudson Transmission Project cost an approximate $113
million/mile, which is a clear outlier and does not represent most of the projects. The average cost for the
rest of the projects amounts to $4.66 million/mile, with an average line length of ~approximately 262
miles. The highest estimated project cost is for the Maritime Link Project at $8.62 million/mile, which
includes two sub‐sea HVDC cables spanning approximately 105 miles across the Cabot Strait from Cape
Ray (Newfoundland) to Cape Breton (Nova Scotia). The lowest project cost is for the Manitoba Bi‐Pole III
Transmission Line project at $1.17 million/mile. This is also the longest project, with a total cable length
of 860 miles. Based on these project cost estimates, it is reasonable to assume that the project cost is not
directly proportional to the cable line length in most cases. This assumption is further supported by

HVDC and Non‐Dispatchable Generation
A‐29
MacDonald et al. (2016),26 in which an inverse correlation between transmission distance and cost per
MW‐mile for HVDC line is modeled. In Figure 20, we can see that the unit cost of HVDC projects drops
rapidly with a distance up to 300 miles and then levels beyond that.
Figure 20. Unit cost estimates of HVDC technology
Source: ICF review.
Source: MacDonald et al. (2016).
Table 7 provides the transmission and infrastructure cost estimates from NREL’s JEDI model, WECC’s
Transmission Expansion Planning Tool, and ETSAP’s Electricity Transmission and Distribution technology
brief (2015). These estimates are provided for a 500 kV HVDC bi‐pole line, assuming a flat terrain and a
distance exceeding 100 miles. NREL JEDI and Black & Veatch (2014) provide similar transmission cost
estimates ($1.44 million/mile and $1.53 million/mile), while ETSAP (2015) provides a transmission cost
that is 2 to 2.5 times higher ($3.60 million/mile).
Total Infrastructure cost is assumed to include the cost of constructing two converter stations (one at
each endpoint) and any additional transformers, shunt reactors, and series compensation required for the
reliable operation of the transmission system. NREL estimates that cost to be around $734 million,
including labor costs. Black & Veatch (2014) and ETSAP (2015) provide estimates significantly higher than
NREL (Black & Veatch at $960 million and ETSAP at $1.182 billion). Assuming a 262‐mile line, the calculated
total cost‐per‐mile amounts to $4.24 million/mile for NREL, $5.19 million/mile for Black & Veatch, and
$8.11 million/mile for ETSAP. All three estimates are within the project cost range (Table 6), calculated by
comparing the total project cost and transmission distance of ten recent HVDC projects in North America.
Table 7. Transmission and infrastructure cost estimates (for a hypothetical HVDC line)
NREL JEDI 2017
WECC Transmission Expansion Planning Tool27
ETSAP Electricity Transmission and Distribution
Transmission Line Cost ($ million /mile)
$1.44 $1.53 $3.60
Infrastructure Cost ($ million) $734 $960 $1182
Calculated Total Cost ($ million/mile)
$4.24 $5.19 $8.11
27 Costs extracted from WECC Transmission Expansion Planning Tool, prepared by Black & Veatch. Costs have been adjusted
from 2014$ values to 2017$ using ICF’s assumption of 2.1% inflation per year. These costs assume an HVDC 500‐kV bi‐pole line exceeding 10 miles in length. The listed costs are baseline costs, meaning that additional cost multipliers have not been applied.
HVDC Projects – Cost Range (2017 $)
Total Project Cost ($ million/mile)
1.17 to 8.62
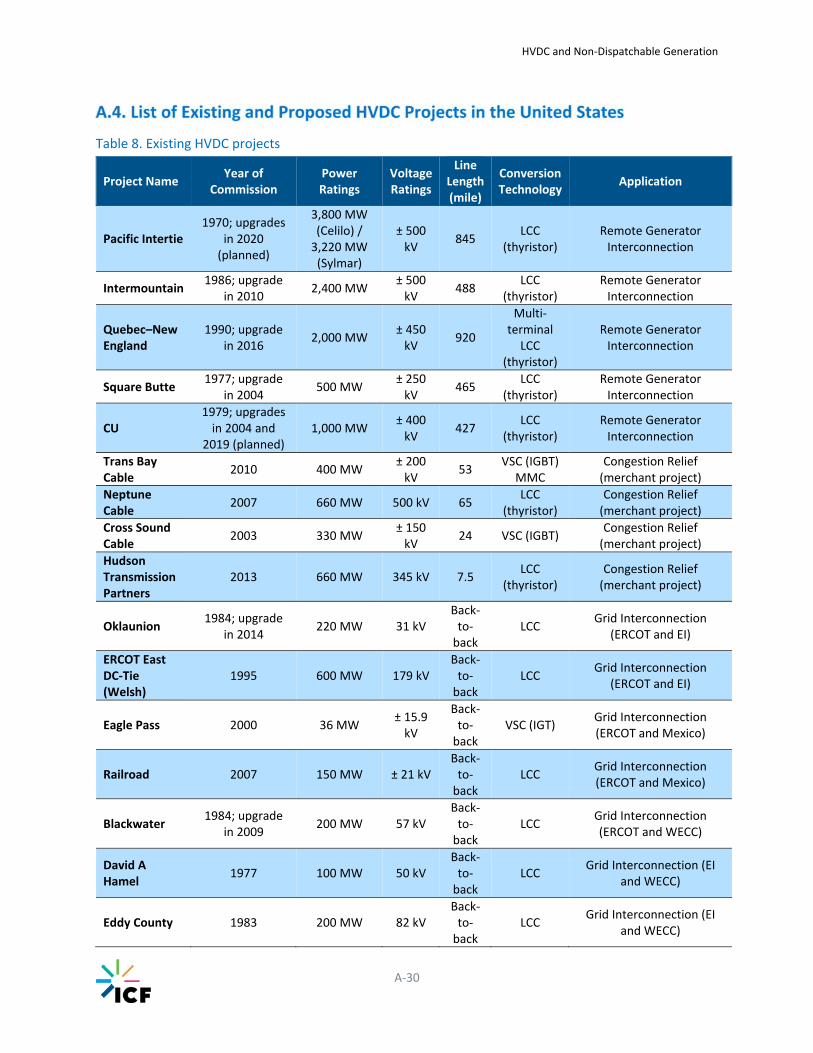
HVDC and Non‐Dispatchable Generation
A‐30
Table 8. Existing HVDC projects
Project Name Year of
Commission Power Ratings
Voltage Ratings
Line Length (mile)
Conversion Technology
Application
Pacific Intertie 1970; upgrades
in 2020 (planned)
3,800 MW (Celilo) / 3,220 MW (Sylmar)
± 500 kV
845 LCC
(thyristor) Remote Generator Interconnection
Intermountain 1986; upgrade
in 2010 2,400 MW
± 500 kV
488 LCC
(thyristor) Remote Generator Interconnection
Quebec–New England
1990; upgrade in 2016
2,000 MW ± 450 kV
920
Multi‐terminal LCC
(thyristor)
Remote Generator Interconnection
Square Butte 1977; upgrade
in 2004 500 MW
± 250 kV
465 LCC
(thyristor) Remote Generator Interconnection
CU 1979; upgrades in 2004 and
2019 (planned) 1,000 MW
± 400 kV
427 LCC
(thyristor) Remote Generator Interconnection
Trans Bay Cable
2010 400 MW ± 200 kV
53 VSC (IGBT)
MMC Congestion Relief (merchant project)
Neptune Cable
2007 660 MW 500 kV 65 LCC
(thyristor) Congestion Relief (merchant project)
Cross Sound Cable
2003 330 MW ± 150 kV
24 VSC (IGBT) Congestion Relief (merchant project)
Hudson Transmission Partners
2013 660 MW 345 kV 7.5 LCC
(thyristor) Congestion Relief (merchant project)
Oklaunion 1984; upgrade
in 2014 220 MW 31 kV
Back‐to‐back
LCC Grid Interconnection
(ERCOT and EI)
ERCOT East DC‐Tie (Welsh)
1995 600 MW 179 kV Back‐to‐back
LCC Grid Interconnection
(ERCOT and EI)
Eagle Pass 2000 36 MW ± 15.9 kV
Back‐to‐back
VSC (IGT) Grid Interconnection (ERCOT and Mexico)
Railroad 2007 150 MW ± 21 kV Back‐to‐back
LCC Grid Interconnection (ERCOT and Mexico)
Blackwater 1984; upgrade
in 2009 200 MW 57 kV
Back‐to‐back
LCC Grid Interconnection (ERCOT and WECC)
David A Hamel
1977 100 MW 50 kV Back‐to‐back
LCC Grid Interconnection (EI
and WECC)
Eddy County 1983 200 MW 82 kV Back‐to‐back
LCC Grid Interconnection (EI
and WECC)
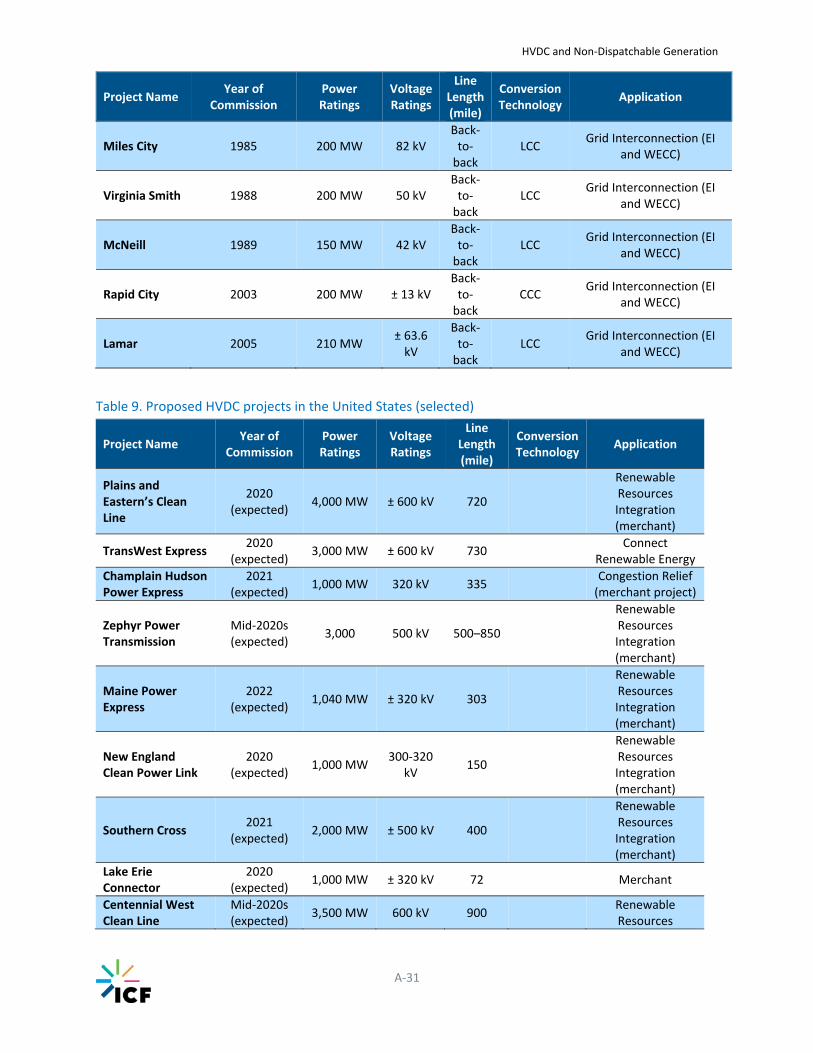
HVDC and Non‐Dispatchable Generation
A‐31
Project Name Year of
Commission Power Ratings
Voltage Ratings
Line Length (mile)
Conversion Technology
Application
Miles City 1985 200 MW 82 kV Back‐to‐back
LCC Grid Interconnection (EI
and WECC)
Virginia Smith 1988 200 MW 50 kV Back‐to‐back
LCC Grid Interconnection (EI
and WECC)
McNeill 1989 150 MW 42 kV Back‐to‐back
LCC Grid Interconnection (EI
and WECC)
Rapid City 2003 200 MW ± 13 kV Back‐to‐back
CCC Grid Interconnection (EI
and WECC)
Lamar 2005 210 MW ± 63.6 kV
Back‐to‐back
LCC Grid Interconnection (EI
and WECC)
Table 9. Proposed HVDC projects in the United States (selected)
Project Name Year of
Commission Power Ratings
Voltage Ratings
Line Length (mile)
Conversion Technology
Application
Plains and Eastern’s Clean Line
2020 (expected)
4,000 MW ± 600 kV 720
Renewable Resources Integration (merchant)
TransWest Express 2020
(expected) 3,000 MW ± 600 kV 730
Connect Renewable Energy
Champlain Hudson Power Express
2021 (expected)
1,000 MW 320 kV 335 Congestion Relief (merchant project)
Zephyr Power Transmission
Mid‐2020s (expected)
3,000 500 kV 500–850
Renewable Resources Integration (merchant)
Maine Power Express
2022 (expected)
1,040 MW ± 320 kV 303
Renewable Resources Integration (merchant)
New England Clean Power Link
2020 (expected)
1,000 MW 300‐320
kV 150
Renewable Resources Integration (merchant)
Southern Cross 2021
(expected) 2,000 MW ± 500 kV 400
Renewable Resources Integration (merchant)
Lake Erie Connector
2020 (expected)
1,000 MW ± 320 kV 72 Merchant
Centennial West Clean Line
Mid‐2020s (expected)
3,500 MW 600 kV 900 Renewable Resources

HVDC and Non‐Dispatchable Generation
A‐32
Project Name Year of
Commission Power Ratings
Voltage Ratings
Line Length (mile)
Conversion Technology
Application
Integration (merchant)
Grain Belt Express Clean Line
2021 (expected)
4,000 MW ± 600 kV 780
Renewable Resources Integration (merchant)
Tres Amigas Interconnection
200 MW Back‐to‐back
VSC
Grid Interconnection (EI – ERCOT –
WECC)
Nogales Interconnection
150 MW planned for
2019; remainder
TBD
300 MW Back‐to‐back
Grid Interconnection (WECC and Mexico)
Capacitor‐commutated converter (CCC): A type of converter used in HVDC systems, which has series
capacitors, inserted into the AC line connections, either on the primary or secondary side of the converter
transformer. The series capacitors partially offset the commutating inductance of the converter and help
to reduce fault currents. This also allows a smaller extinction angle to be used with a converter/inverter,
reducing the need for reactive power support. CCCs have remained only a niche application because of
the advent of voltage‐source converters (VSC), which eliminate the need for an extinction (turn‐off) time.
Converter: An electrical or electro‐mechanical device for converting electrical energy from one form to
another, such as converting between AC and DC, changing the voltage or frequency, or a combination. An
HVDC converter converts electric power from high‐voltage AC to high‐voltage DC current, or vice versa.
Commutation: The process of transferring current from one connection to another within an electric
circuit. Depending on the application, commutation is achieved either by mechanical switching or by
electronic switching. The equivalent of mechanical commutation occurs in solid‐state converter circuits
such as those used for rectifying AC to DC or inverting DC to AC.
Circuit breaker: An automatically operated electrical switch designed to protect an electrical circuit from
damage caused by excess current, typically resulting from an overload or short circuit. Its basic function
is to interrupt current flow after a fault is detected. A circuit breaker can be reset (either manually or
automatically) to resume normal operation. Circuit breakers vary from small devices that protect low‐
current circuits or individual household appliances, to large switchgear designed to protect high‐
voltage circuits.
Harmonics: Deviation of current and voltage in an electrical system from sinusoidal waveforms. Harmonic
currents are caused by non‐linear loads (loads that do not have the same waveform as the supply voltage)
connected to the system. Harmonic frequencies are a common cause of power quality problems.

HVDC and Non‐Dispatchable Generation
A‐33
HVDC: A high‐voltage, direct current system uses direct current for the bulk transmission of electric
power, in contrast with more common AC systems. The advantages of HVDC include lower electrical losses
for long‐distance transmission compared to AC lines, and the ability to transmit power between
asynchronous DC systems.
Interties: An interconnection permitting power flow between two or more grid asynchronous grid
networks.
Line‐commutated converters (LCC): A converter system in which the conversion process relies on the line
voltage of the AC system to which the converter is connected in order to effect the commutation from
one switching device to its neighbor. LCCs use switching devices that are either uncontrolled (such
as diodes) or that can only be turned on (not off) by control action, such as thyristors. In practice, all LCC
HVDC systems use either grid‐controlled mercury‐arc valves (until the 1970s) or thyristors (to the present
day). Most of the HVDC systems in operation today are based on LCCs.
Mercury‐arc valves: A type of electrical rectifier used for converting high‐voltage AC into DC. They were
the primary method of high power rectification before the advent of semiconductor rectifiers, such
as diodes, thyristors, and gate turn‐off thyristors (GTOs) in the 1970s. These solid‐state rectifiers have
since completely replaced mercury‐arc rectifiers thanks to their higher reliability, lower cost and
maintenance, and lower environmental risk.
Skin effect: The tendency of an alternating electric current to become distributed within a conductor such
that the current density is largest near the surface of the conductor, and decreases with greater depths
in the conductor. The electric current flows mainly at the "skin" of the conductor, between the outer
surface and a level called the skin depth. The skin effect causes the effective resistance of the conductor
to increase at higher frequencies where the skin depth is smaller, thus reducing the effective cross‐section
of the conductor.
Real power: The portion of power that, averaged over a complete cycle of the AC waveform, results in
net transfer of energy in one direction, also known as active power. Measured in Watts.
Reactive power: The portion of dissipated power resulting from inductive and capacitive loads, measured
in volt‐amperes reactive. This power cannot do useful work at the load.
RMS Voltage: The root‐mean square (RMS) mathematically represents the square root of the average
squared value of a quantity over an interval. This is commonly applied to AC voltage, which is continually
changing between zero, the positive peak, and the negative peak. RMS voltage represents the effective
value of a varying voltage or current. It is the equivalent steady DC (constant) value, which gives the same
effect.
Transformer: An electrical device that transfers electrical energy between two or
more circuits through electromagnetic induction. Transformers are used to step‐up or step‐down voltage
in AC networks.
Thyristor valves: A thyristor, also known as a semiconductor‐controlled rectifier, is a solid‐state and four‐
layered semiconductor used in electronic devices and equipment to control electrical power or current
output through a phase angle control technique. Thyristor cells (referred to as valves) are a common
technology used in modern HVDC convertor stations, and are typically found in line‐commutated
HVDC and Non‐Dispatchable Generation
A‐34
converters (LCCs). Thyristor valves have a breakdown voltage of a few kilovolts each. For a typical HVDC
converter station, thyristor converters are constructed using large number of thyristors connected in
series.
Thury system: The first commercial system for high‐voltage DC transmission developed by Rene Thury
and first put into service in Italy in 1889 with additional systems installed internationally over the next
several decades. The Thury System used generators in series to attain high voltages. While AC
transmission systems became dominant, Thury systems continued to operate until the 1930s.
Voltage‐source converter (VSC): A technology used in HVDC converter stations. VSCs make use of
semiconductor devices such as insulated‐gate bipolar transistors (IGBTs) and gate turn‐off thyristors
(GTOs), which can both turn off and turn on (whereas thyristor valves used in traditional LCCs can only
turn on). The VSC converter consists of two‐level or multilevel converters, phase‐reactors, and AC filters.
Each single valve element is built up with a number of series‐connected IGBTs together with associated
power electronics devices. VSC technology has been used increasingly in HVDC projects in recent years.