Assessing effects of EU ETS for Portugal – IEW 2007 Assessing the effects of the European...
23
Assessing effects of EU ETS for Portugal – IEW 2007 Assessing the effects of the European Emissions Trading Scheme for Portugal using the TIMES_PT model Environmental Sciences and Engineering Department New University of Lisbon Portugal Sofia Simões, João Cleto, Júlia Seixas
-
Upload
byron-minnie -
Category
Documents
-
view
214 -
download
1
Transcript of Assessing effects of EU ETS for Portugal – IEW 2007 Assessing the effects of the European...

Assessing effects of EU ETS for Portugal – IEW 2007
Assessing the effects of the European Emissions Trading Scheme for Portugal using the TIMES_PT model
Environmental Sciences and Engineering DepartmentNew University of Lisbon
Portugal
Sofia Simões, João Cleto, Júlia Seixas
Assessing effects of EU ETS for Portugal – IEW 2007
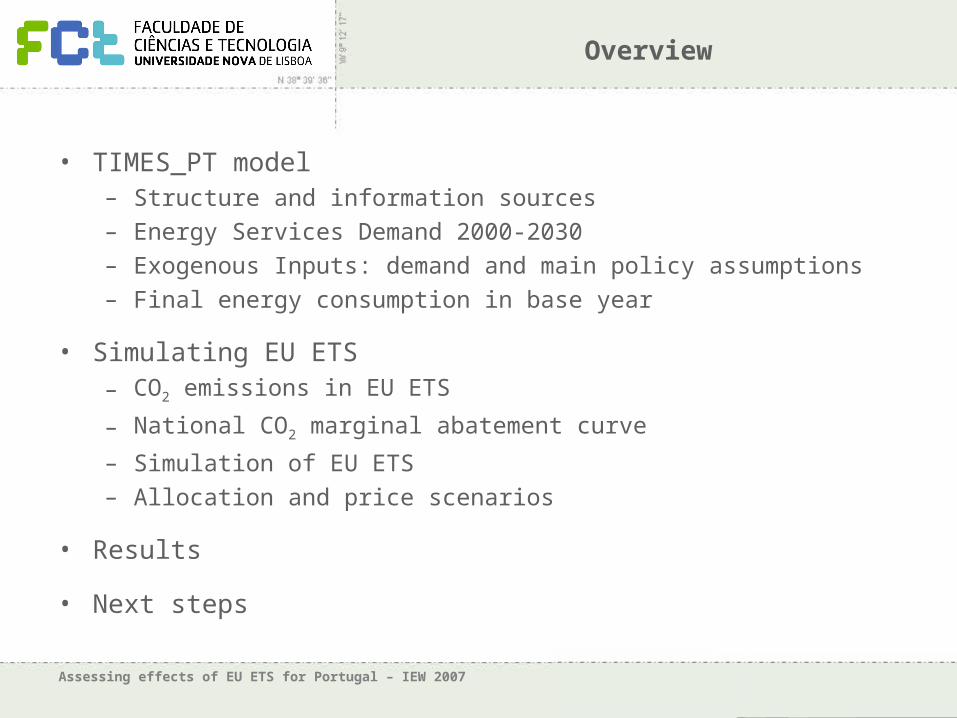
Overview
• TIMES_PT model– Structure and information sources
– Energy Services Demand 2000-2030
– Exogenous Inputs: demand and main policy assumptions
– Final energy consumption in base year
• Simulating EU ETS– CO2 emissions in EU ETS
– National CO2 marginal abatement curve
– Simulation of EU ETS
– Allocation and price scenarios
• Results
• Next steps

Assessing effects of EU ETS for Portugal – IEW 2007
Portuguese energy system
• Energy intensity is one the highest in EU
• Small improvements in energy efficiency for residential and commercial
• Improvements in industry - however mainly low-value energy intensive products
• 85% primary energy imports – rest is hydro, biomass and wind
• Kyoto/burden sharing target of +27% 1990 levels
• Most recent forecasts point to growth of GHG emissions of 47% by 2010 and 41-38% by 2020
Fossil fuels consumption (PJ)
0
5
10
15
20
25
30
35
40
1990 1991 1992 1993 1994 1995 1996 1997 1998 1999 2000 2001 2002
Refineries
Pulp
Paper
Iron &Steel
Tiles and bricks
Other ceramics
Cement
Glass

Assessing effects of EU ETS for Portugal – IEW 2007
TIMES_PT model
Assessing effects of EU ETS for Portugal – IEW 2007
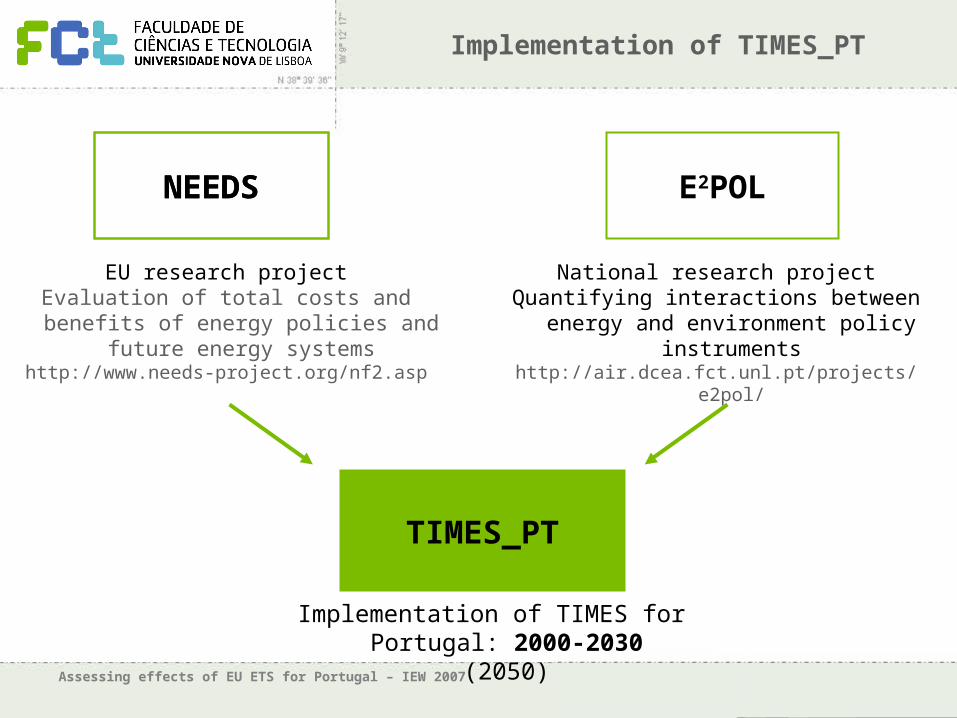
Implementation of TIMES_PT
NEEDS
National research projectQuantifying interactions between energy and
environment policy instrumentshttp://air.dcea.fct.unl.pt/projects/e2pol/
E2POL
EU research projectEvaluation of total costs and benefits of energy policies and future energy systems
http://www.needs-project.org/nf2.asp
TIMES_PT
Implementation of TIMES for Portugal: 2000-2030 (2050)
NEEDS
Assessing effects of EU ETS for Portugal – IEW 2007
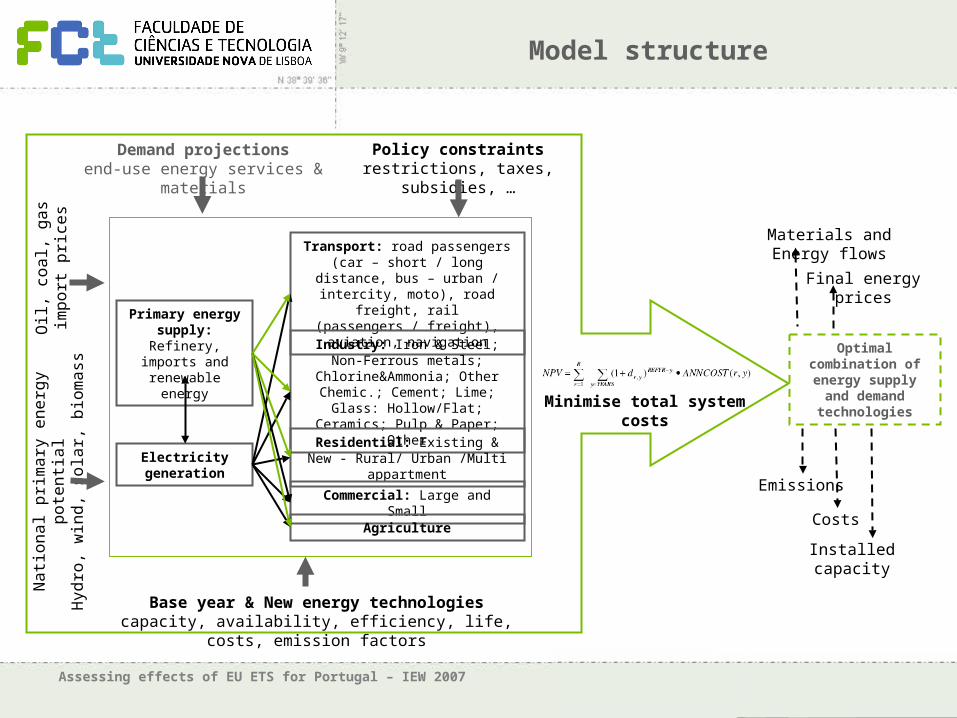
Model structure
Primary energy supply: Refinery,
imports and renewable energy
Electricity generation
Transport: road passengers (car – short / long distance, bus – urban /
intercity, moto), road freight, rail (passengers / freight), aviation,
navigation
Industry: Iron & Steel; Non-Ferrous metals; Chlorine&Ammonia; Other
Chemic.; Cement; Lime; Glass: Hollow/Flat; Ceramics; Pulp &
Paper; Other
Residential: Existing & New - Rural/ Urban /Multi appartment
Commercial: Large and Small
Agriculture
Oil,
co
al,
ga
s im
po
rt
pric
es
Demand projectionsend-use energy services & materials
Base year & New energy technologiescapacity, availability, efficiency, life, costs, emission factors
Na
tion
al p
rima
ry e
ne
rgy
po
ten
tial
Hyd
ro,
win
d,
sola
r, b
iom
ass
Policy constraintsrestrictions, taxes, subsidies, …
Minimise total system costs
Optimal combination of
energy supply and demand
technologies
Emissions
Costs
Installed capacity
Final energy prices
Materials and Energy flows

Assessing effects of EU ETS for Portugal – IEW 2007
– Annual Demand (DEM)• Cement (Mt)• Paper (Mt)• Iron & Steel (Mt)• Glass (Mt)• Pkm (Million Pkm)• Tkm• Other Industries (PJ)• Agriculture (PJ)• Resid. Space Heating (PJ)• Resid. Space Cooling (PJ)• Water Heating (PJ) •Etc.
– Elasticities of final demands to macroeconomic drivers, income (ELASI) and price (ELASP)
– Autonomous efficiency improvement in industry (AEEI)
– Base year data (DEM2000)
– Residential Data
– Population growth
– World energy prices
– Technical progress, energy intensity and labour productivity evolution
– EU-22 GDP growth target (2 to 2.5%)
– Energy prices
– Primary Energy potential and costs
– New and Existing Technologies
– Policy assumption (e.g. CO2 eq emissions restrictions)
Model Structure: Exogenous inputs
GEM-E3Optimization
function
– Energy Scenarios
– Technology profile
– System costs
– Emissions
)1()1(
)1(1
tt
ttt
AEEiELASPPRGR
ELASIDRGRDEMDEM
TIMES_PT
– National Macroeconomic Drivers (DRGR)
• GDP growth
• Private consumption as a proxy for disposable income
• Sectoral production growth: industry, services, transports and agriculture.
– PRGR: Price Evolution (PRGR)
GEM-E3: General Equilibrium Model for Energy-Economy-Environment
Inputs Inputs
Outputs Outputs
Residential Demand
Generation
*
DEMt* = Industry, Commercial, Transports
and Agriculture demand generation

Assessing effects of EU ETS for Portugal – IEW 2007
0.0
2.0
4.0
6.0
8.0
10.0
12.0
14.0
2000 2001 2002 2003 2004 2005 2010 2015 2020 2025 2030
Clin
ker
(Mto
n)
INE TIMES_PT
2,0%
0
0.2
0.4
0.6
0.8
1
1.2
1.4
2000 2001 2002 2005 2010 2015 2020 2025 2030
Cru
de s
teel
(M
ton)
Eurostat TIMES_PT
Clinker, Pulp, Glass, Iron & Steel Demand
0.0
0.5
1.0
1.5
2.0
2.5
3.0
2000 2001 2002 2003 2004 2005 2010 2015 2020 2025 2030
Pul
p (M
ton)
Celpa TIMES_PT
0.0
0.5
1.0
1.5
2.0
2000 2001 2005 2010 2015 2020 2025 2030
Gla
ss (
Mto
n)
Industry Data* TIMES_PT
*Source: Industrials Association of container glass, Saint-Gobain (flat glass) and 2000 data from Statistic National Institute (INE)
Clinker
Glass
Pulp
Iron & Steel
2,5%
1,6%
1,0%
1,5%
1,9%
1,0%
0,3%
* 2000 values from NIR

Assessing effects of EU ETS for Portugal – IEW 2007
Simulating EU ETS

Assessing effects of EU ETS for Portugal – IEW 2007
EU ETS in TIMES
1) Identify emission restriction for each sector • Estimate emissions from EU ETS sectors in a BASE scenario and in a Kyoto
scenario• Assume share of these emissions in EU ETS (glass, ceramics, combustion,
lime, paper)
• Estimate restriction and allowance stock by comparing with Kyoto scenario2) Create possibility to buy allowances
Allocation/restriction scenarios
Maintain 2000 emissions 70% of National target of 0% from 1990
70% of National target of -20% from 1990
Allowances prices scenarios
10 €/t 21 €/t 40 €/t
Trade itself not simulated, only buying allowances
Assumed constant proportion of emissions in EU ETS over time

Assessing effects of EU ETS for Portugal – IEW 2007
TIMES_PT Scenarios - main policy assumption
Base Scenario Kyoto Scenario
Nuclear politically unacceptable
Min. electricity generated from gas combined cycle (existing & new) corresponding to at least 1100 MW in 2010-2030
No new Coal Power Plants before 2015 & no increase in coal in final sectors; new coal has CCS
Min. use of Municipal Waste & Wood Waste for electricity
Min. 1.1 MW wind onshore in 2005 (feed-in-tariffs)
Biofuel targets for 2010 (5.75% of diesel and gasoline)
Min. 39% of the electricity consumed in 2010 is from renewable sources
ISP (energy carriers tax) and VAT over energy carriers
No carbon sinks
CO2 emissions restrictions
(27% above 1990 levels in 2010-2030)
Assessing effects of EU ETS for Portugal – IEW 2007
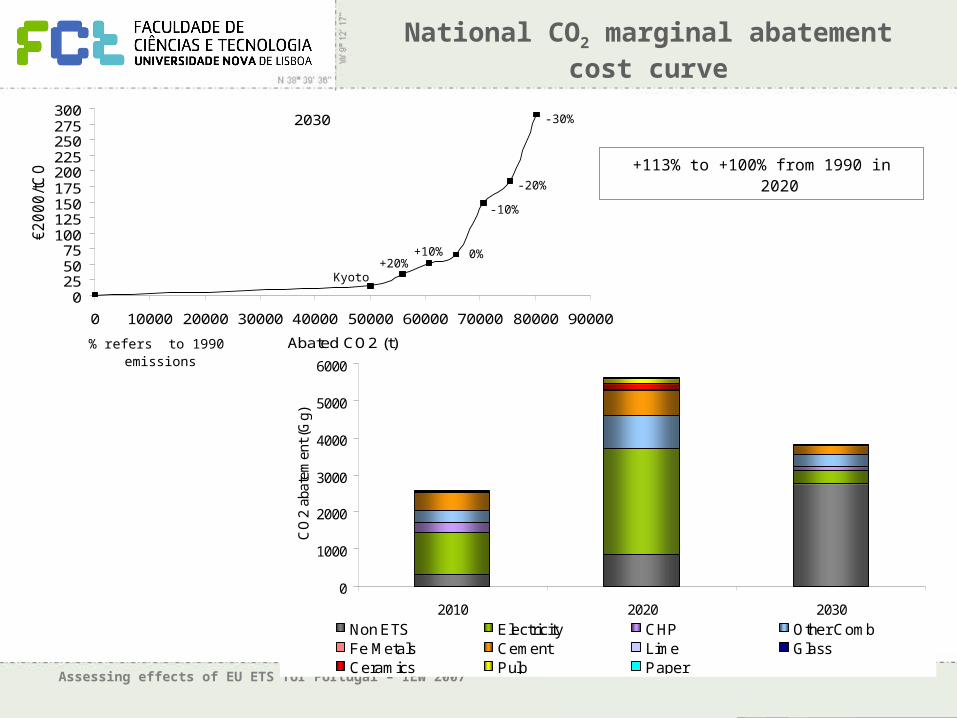
National CO2 marginal abatement cost curve
2030
0255075
100125150175200225250275300
0 10000 20000 30000 40000 50000 60000 70000 80000 90000
Abated CO2 (t)
€2000
/tC
O2
Kyoto+20%
+10% 0%
-10%
-20%
-30%
+113% to +100% from 1990 in 2020
0
1000
2000
3000
4000
5000
6000
2010 2020 2030
CO
2 ab
atem
ent (
Gg)
Non ETS Electricity CHP Other CombFe Metals Cement Lime GlassCeramics Pulp Paper
% refers to 1990 emissions

Assessing effects of EU ETS for Portugal – IEW 2007
CO2 emissions in EU_ETS
Excluded emissions from solvent use, agriculture, waste, fugitive from fuels and f-gases - 20% in 2010
0
10000
20000
30000
40000
50000
60000
70000
CO
2 e
mis
sio
ns
(Gg
)
2000 2010B 2010K 2020B 2020K 2030B 2030K
Non ETS Electricity CHP Other Comb RefineriesCoke oven Fe Metals Cement Lime GlassCeramics Pulp Paper
10%
7%
30%
43%
11%
6%
24%
48%
11%
5%
23%
49%
12%
4%
23%
48%
12%
5%
21%
50%
15%
6%
16%
50%
15%
6%
16%
49%
-2% to -6% +5% to -3% 0% to -5%
(90%) (69%)(80%) (40-54%)
(46%)
Assessing effects of EU ETS for Portugal – IEW 2007
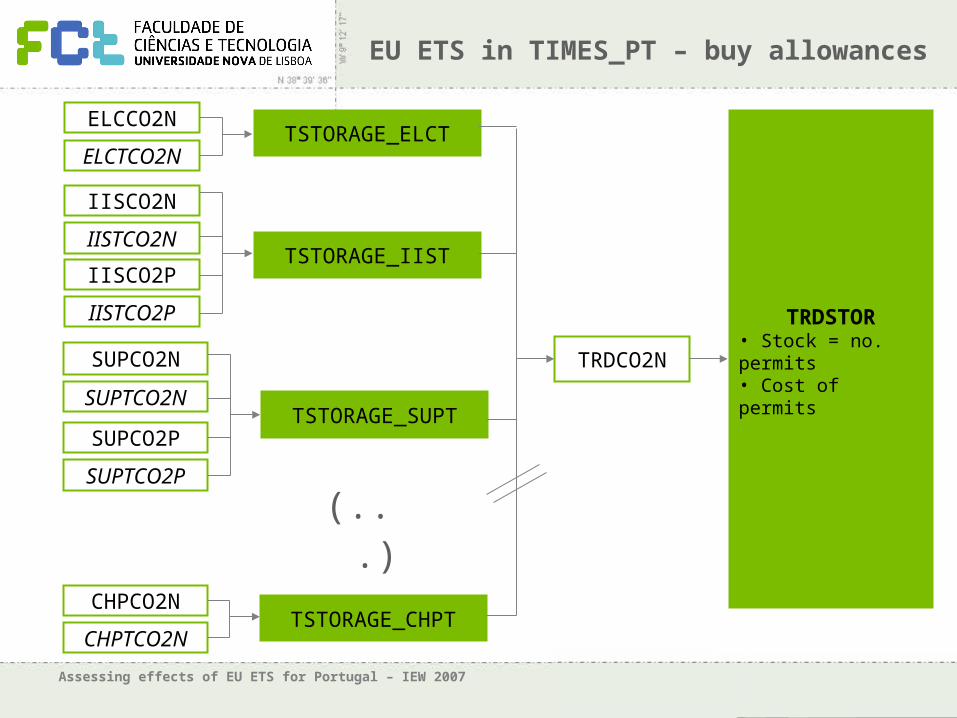
EU ETS in TIMES_PT – buy allowances
TRDSTOR• Stock = no. permits• Cost of permits
TSTORAGE_ELCT
TSTORAGE_IIST
TSTORAGE_SUPT
TSTORAGE_CHPT
TRDCO2N
ELCCO2N
ELCTCO2N
IISCO2N
IISTCO2N
IISCO2P
IISTCO2P
SUPCO2N
SUPTCO2N
SUPCO2P
SUPTCO2P
CHPCO2N
CHPTCO2N
(...)

Assessing effects of EU ETS for Portugal – IEW 2007
Results

Assessing effects of EU ETS for Portugal – IEW 2007
Bought quantities (Gg CO2)
2010 10eur/t 21eur/t 40eur/t
CO2 as 2000 3327 2721 2166
CO2 as Nat 0% / 1990 10149 9057 4986
CO2 as Nat -20% / 1990 14997 13803 8466
2020 10eur/t 21eur/t 40eur/t
CO2 as 2000 5000 4149 4163
CO2 as Nat 0% / 1990 12000 5710 4163
CO2 as Nat -20% / 1990 17054 7673 5879
2030 10eur/t 21eur/t 40eur/t
CO2 as 2000 4589 4536 3807
CO2 as Nat 0% / 1990 6608 6093 4314
CO2 as Nat -20% / 1990 9045 8159 6535
2010
% nat. %ETS
2000 5000 8 15
Nat 0% 12000 18 35
-20% 19000 29 56
increase price
incr
ease
res
tric
tion
Allowances stocks

Assessing effects of EU ETS for Portugal – IEW 2007
0
2000
4000
6000
8000
10000
12000
14000
16000
2000-10eur
2000-21eur
2000-40eur
0%-10eur
0%-21eur
0%-40eur
-20%-10eur
-20%-21eur
-20%-40eur
CO
2 G
g
CHP Electricity Cement Glass Fe metals
Lime Ceramics Other comb. Pulp&paper Refineries
Buyers 2010
Assessing effects of EU ETS for Portugal – IEW 2007
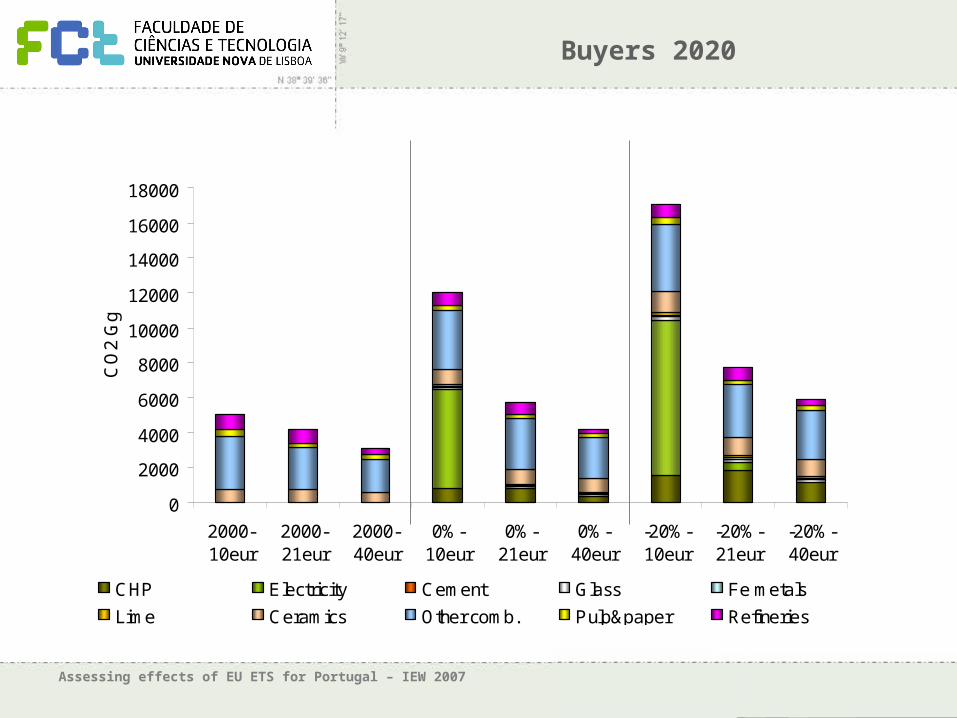
0
2000
4000
6000
8000
10000
12000
14000
16000
18000
2000-10eur
2000-21eur
2000-40eur
0%-10eur
0%-21eur
0%-40eur
-20%-10eur
-20%-21eur
-20%-40eur
CO
2 G
g
CHP Electricity Cement Glass Fe metals
Lime Ceramics Other comb. Pulp&paper Refineries
Buyers 2020

Assessing effects of EU ETS for Portugal – IEW 2007
System cost variations
2010 10eur/t 21eur/t 40eur/t
CO2 as 2000 0.48 0.61 0.68
CO2 as Nat 0% / 1990 0.65 0.81 0.53
CO2 as Nat -20% / 1990 0.84 1.18 1.25
2020 10eur/t 21eur/t 40eur/t
CO2 as 2000 0.40 0.52 0.73
CO2 as Nat 0% / 1990 0.58 0.69 0.87
CO2 as Nat -20% / 1990 0.81 0.70 1.15
2030 10eur/t 21eur/t 40eur/t
CO2 as 2000 1.83 1.97 2.21
CO2 as Nat 0% / 1990 1.83 2.04 2.31
CO2 as Nat -20% / 1990 1.91 2.15 2.56
increase price
incr
ease
res
tric
tion
% change compared to Kyoto scenario

Assessing effects of EU ETS for Portugal – IEW 2007
Next steps
• Test other allocation criteria• Verify results with sector marginal abatement curves• Model with national emission ceiling• Possibility to model selling allowances?
• Feed-in-tariffs for renewables• Acidifying emissions constraints
Assessing effects of EU ETS for Portugal – IEW 2007
http://air.dcea.fct.unl.pt/projects/e2pol/

Assessing effects of EU ETS for Portugal – IEW 2007
Departamento de Ciências e Engenharia do Ambiente
Research work funded by the FCT/MCES and POCI 2010, supported by FEDER

Assessing effects of EU ETS for Portugal – IEW 2007
Primary Energy Potentials in TIMES_PT
2000 2030 ReferenceNon Energy Extr. costs (€/GJ) (VIEWLS project)
Wood Products (PJ) 71.7 100 (+28%)Assumed a maximum growth 30%
of 2000 capacity 4.89
Biogas (PJ) 0.1 29 (+100%)GPPAA & Extrapolation of PNAC
Waste Scenarios 32.85
Crops for Biofuel (PJ) 0.0 15 (+100%)Extrapolation of Renewable
Energy Portugal Forum 1.30
Biofuel production (PJ) 0.0 50 (+100%)Best guess based on 2008 expected installed capacity 28.50
Municipal Waste (PJ) 7.3 10 (+27%)Extrapolation of PNAC Waste
scenarios 5.81
Industrial Waste – Sludge (PJ) 0.0 2 (+100%) Best guess 5.81
Hydro (PJ) 40.2 95 (+58%) Ministery of Economy 0.00
Wind onshore (GW) 0.7 5 (+98%)Conservative assumption based
on REN 0.00
Wind offshore (GW) 0.0 2 (+100%) Best guess 0.00
Solar- heating (PJ) 0.8 38 (+98%)Extrapolation of Renewable Energy in Portugal Forum 0.00
Solar-electricity generation (GW) 0.0 2 (+100%) Best guess 0.00
Geothermal (PJ) 0.6 8 (+93%)Extrapolation of Renewable
Energy Portugal Forum 0.00
Waves (GW) 0.0 5 (+100%)Cruz, J., Sarmento, A. (2004).
Energia das Ondas 0.00