
ASSESSING AND COMPARING QUALITY OF LIFE SCORES IN …
93
ASSESSING AND COMPARING QUALITY OF LIFE SCORES IN PATIENTS WITH IRRITABLE BOWEL SYNDROME-DIARRHEA, IRRITABLE BOWEL SYNDROME-CONSTIPATION, AND IRRITABLE BOWEL SYNDROME-MIXED By Hailey Rentz, RD, LDN A Thesis Presented in Partial Fulfillment of the Requirements for the Degree Master of Science SCHOOL OF HUMAN ECOLOGY COLLEGE OF APPLIED AND NATURAL SCIENCE LOUISIANA TECH UNIVERSITY March 2021
Transcript of ASSESSING AND COMPARING QUALITY OF LIFE SCORES IN …

ASSESSING AND COMPARING QUALITY OF LIFE SCORES IN PATIENTS
WITH IRRITABLE BOWEL SYNDROME-DIARRHEA, IRRITABLE
BOWEL SYNDROME-CONSTIPATION, AND
IRRITABLE BOWEL SYNDROME-MIXED
By
Hailey Rentz, RD, LDN
A Thesis Presented in Partial Fulfillment
of the Requirements for the Degree
Master of Science
SCHOOL OF HUMAN ECOLOGY
COLLEGE OF APPLIED AND NATURAL SCIENCE
LOUISIANA TECH UNIVERSITY
March 2021

LOUISIANA TECH UNIVERSITY
GRADUATE SCHOOL
March 24, 2021
Date of thesis defense
We hereby recommend that the thesis prepared by
Hailey Rentz, RD, LDN
entitled ASSESSING AND COMPARING QUALITY OF LIFE SCORES IN
PATIENTS WITH IRRITABLE BOWEL SYNDROME-DIARRHEA, IRRITABLE
IRRITABLE BOWEL SYNDROME-CONSTIPATION, AND IRRITABLE BOWEL SYNDROME-MIXED
be accepted in partial fulfillment of the requirements for the degree of
Master of Science in Nutrition & Dietetics
Vicky Green, PhD, RDN, LDN
Supervisor of Thesis Research
Ethel Jones, PhD, CFCS
Head of Human Ecology
Thesis Committee Members:
Simone Camel, PhD, RDN, LD
Dawn Erickson, MPH, RDN, LDN
Approved: Approved:
__________________________________ __________________________________
Gary A. Kennedy Ramu Ramachandran
Dean of Applied & Natural Sciences Dean of the Graduate School

iii
ABSTRACT
Irritable bowel syndrome (IBS) is a common gastrointestinal (GI) disorder that
affects an estimated 1 in 10 people globally (Black & Ford, 2020). Since IBS is such a
common GI disorder worldwide it is important to understand that impact it has on quality
of life. This study assessed the differences in the effects of IBS on the quality of life in
patients with each of the three types of IBS: IBS-D, IBS-C, and IBS-M. Potential
respondents were recruited via social media using an online survey, which collected
demographics and assessed the effects of IBS on quality of life. The survey was also
emailed to FODMAP trained dietitians who were asked to share the survey with their
patients. Data collection lasted for approximately 9 weeks. One hundred and ninety-two
responses were analyzed. Descriptive statistics for demographic data were reported as
frequencies and correlated to the quality of life subscale scores. An ANOVA was used to
analyze the differences between the total quality of life scores and subscale scores among
patients with IBS-D, IBS-C, and IBS-M. An ANOVA was also used to analyze the
differences between total quality of life scores among the different races, education
levels, and monthly spending on IBS. A t-test was used to analyze the differences
between quality of life subscale scores among female and male patients. A p-value ≤ 0.05
indicated significance. A significant difference in total quality of life scores was found
between groups based on how much money participants spend monthly on treatments
for/managing their IBS symptoms (F(4, 149)= 10.81, p= <0.01). Significant differences

iv
were found in quality of life subscales scores among IBS-M, IBS-C, and IBS-D
patients in the interference with activities (F(3, 178)= 5.83, p= 0.001), body image (F(3,
185)= 3.61, p= 0.014), and health worry subscales (F(3, 183)= 4.83, p= 0.003).
Significant differences were also found in quality of life subscale scores among white,
non-Hispanic; whites, Hispanic origin; and others (Native Americans, Asian/Pacific
Islanders, multi-racial, and Asian Indians) in the dysphoria (F(2, 181)= 3.86, p= 0.23),
social reaction (F(2, 182)= 3.23, p= 0.42), and relationships subscales (F(2, 184)= 3.58,
p= 0.030). Further research is needed to validate these associations.

APPROVAL FOR SCHOLARLY DISSEMINATION
The author grants to the Prescott Memorial Library of Louisiana Tech University the right to reproduce,
by appropriate methods, upon request, any or all portions of this Thesis. It is understood that “proper request”
consists of the agreement, on the part of the requesting party, that said reproduction is for his personal use
and that subsequent reproduction will not occur without written approval of the author of this Thesis.
Further, any portions of the Thesis used in books, papers, and other works must be appropriately referenced
to this Thesis.
Finally, the author of this Thesis reserves the right to publish freely, in the literature, at any time, any
or all portions of this Thesis.
Author _____________________________
Date _____________________________
GS Form 14
(5/03)

vi
TABLE OF CONTENTS
ABSTRACT……………………………………………………………………………. iii
APPROVAL FOR SCHOLARY DISSEMENATION………………………………….v
LIST OF TABLES……………………………………………………………………..viii
CHAPTER 1 INTRODUCTION…………………………………………………………1
1.1 Statement of the Problem……………………………………………………..1
1.2 Purpose………………………………………………………………………..2
1.3 Hypotheses……………………………………………………………………2
1.4 Justification……………………………………………………………………3
CHAPTER 2 REVIEW OF LITERATURE……………………………………………...4
2.1 Introduction……………………………………………………………….4
2.2 Prevalence of Irritable Bowel Syndrome…………………………………5
2.3 Diagnosis of Irritable Bowel Syndrome…………………………………..7
2.3.1 Irritable Bowel Syndrome- Constipation……………………………...8
2.3.2 Irritable Bowel Syndrome- Diarrhea………………………………….9
2.3.3 Irritable Bowel Syndrome- Mixed……………………………………10
2.4 Quality of Life with Irritable Bowel Syndrome………………………….10
2.5 Economic Impact of Irritable Bowel Syndrome…………………………11
2.6 Triggers for Irritable Bowel Syndrome Symptoms……………………...13
2.6.1 Food Triggers………………………………………………………..13
2.6.2 Lifestyle Triggers…………………………………………………….16

vii
2.6.3 Potential Internal Causes…………………………………………….18
2.7 Potential Treatments for Irritable Bowel Syndrome……………………19
2.7.1 Medications………………………………………………………….19
2.7.2 Peppermint Oil……………………………………………………....20
2.7.3 Diets and Eating Patterns……………………………………………21
2.7.4 Alternative Treatments………………………………………………23
CHAPTER 3 METHODS……………………………………………………………….27
3.1 Sample…………………………………………………………………...28
3.2 Data Collection Instruments……………………………………………..28
3.3 Data Collection Process………………………………………………….29
3.4 Data Analysis…………………………………………………………….30
CHAPTER 4 RESULTS……………………………………………………………...…31
4.1 Respondent Demographics………………………………………………31
4.2 Total Quality of Life Scores……………………………………………..33
4.3 Quality of Life Subscale Scores…………………………………………37
CHAPTER 5 DISCUSSION……………………………………………………………..42
APPENDIX A: Data Collection Licensee Agreement…………………………………..50
APPENDIX B: Data Collection Instrument…………………………………………..…58
APPENDIX C: Human Use Approval Letter……………………………………………76
REFERENCES…………………………………………………………………………..78

viii
LIST OF TABLES
Table 4-1: Demographics of Study Participants………………………………..32
Table 4-2: Demographics of Study Participants, Females Only………………..33
Table 4-3: Comparing Irritable Bowel Syndrome Quality
of Life Scores between Genders, Races, Types of IBS,
Education Levels, and Monthly Spending Groups…………………35
Table 4-4: Comparing Irritable Bowel Syndrome Quality of Life Scores
Between Races, Types of IBS, Education Levels,
And Monthly Spending of Females Only…………………………...36
Table 4-5: Test Examining the Effect of Registered Dietitian
on Quality of Life Scores in Patients with IBS……………………..37
Table 4-6: ANOVA Comparing Irritable Bowel Syndrome
Quality of Life Subscale Scores between IBS-M,
IBS-C, and IBS-D…………………………………………………..38
Table 4-7: ANOVA Comparing Irritable Bowel Syndrome
Quality of Life Scores between IBS-M, IBS-C,
And IBS-D of Females Only………………………………………..39
Table 4-8: ANOVA Comparing Irritable Bowel Syndrome
Quality of Life Subscale Scores between Whites,
Non-Hispanic; Whites, Hispanic; and Others………………………40
Table 4-9: ANOVA Comparing Irritable Bowel Syndrome
Quality of Life Subscale Scores between Whites,
Non-Hispanic; Whites, Hispanics; and Others……………………..41

1
CHAPTER 1
INTRODUCTION
Irritable bowel syndrome (IBS) is one of the most commonly diagnosed
functional bowel disorders, affecting an estimated 1 in 10 people globally (Black & Ford,
2020). IBS is defined as abdominal pain or discomfort associated with at least 2 of the
following symptom groups: symptoms associated with changes in frequency of
defecation, symptom relief associated with defecation, and symptoms associated with
changes in consistency of stool (Bohn et al., 2015; Endo, Shoji, & Fukudo, 2015; Simren,
Palsson, & Whitehead, 2017). Symptoms associated with IBS include chronic bloating,
gas, diarrhea, abdominal distention, constipation, and nausea (National Institute of
Diabetes and Digestive and Kidney Diseases, 2017). IBS seems to have a significant
impact on the health-related quality of life of the patients who suffer from the syndrome
(El-Salhy, 2012; Jamali et al., 2012; Singh et al., 2015).
Statement of the Problem
Irritable bowel syndrome has been found to negatively impact the quality of life
of the patients who suffer from it (Agarwal & Spiegel, 2011; Cho et al., 2011; Jamali et
al., 2012; Jerndal et al., 2010; Kopczyńska, Mokros, Pietras, & Małecka-Panas, 2018;
Østgaard, Hausken, Gundersen, & El-Salhy, 2012; Wang et al., 2012). IBS-diarrhea
(IBS-D) negatively impacts the quality of life of patients (Andrae, Patrick, Drossman, &
Covington, 2013; Buono, Carson, & Flores, 2017). Little research evaluating the effects

2
of IBS-Constipation (IBS-C) and IBS-Mixed (IBS-M) specifically on quality of life has
been conducted. One study comparing the quality of life in IBS-D patients versus IBS-C
patients found that quality of life scores tend to be lower in patients with IBS-D than IBS-
C (Singh et al., 2015). Additional research is necessary to examine the differences among
quality of life in patients with IBS-D, IBS-C, and IBS-M.
Purpose
The purpose of this study was to examine the differences in the effects of IBS on
the quality of life in patients with each of the three types of IBS: IBS-D, IBS-C, and IBS-
M. The IBS-Quality of Life (IBS-QOL) questionnaire assesses quality of life using eight
subscales: body image, dysphoria, interference with activities, healthy worry, food
avoidance, social reactions, sexual health, and effect on relationships (Singh et al., 2015).
This study also examined the quality of life score differences between genders, races,
education levels, and monthly spending on IBS categories of patients with IBS-D, IBS-C,
and IBS-M.
Hypotheses
The following hypotheses were tested:
1. There will be no significant difference in the quality of life scores among patients
with IBS-D, IBS-C, and IBS-M.
2. There will be no significant difference in the quality of life scores between
genders in patients with IBS-D, IBS-C, and IBS-M.
3. There will be no significant difference in the quality of life sub scores among
patients with IBS-D, IBS-C, and IBS-M.

3
Justification
Approximately 10-20% of the global population is diagnosed with IBS with only
12% of those patients seeking healthcare or treatment for their IBS symptoms (Black &
Ford, 2020; Saha, 2014). IBS is a frustrating condition for many patients due to the lack
of effective treatment plans and the lack of visible signs of disease or damage in the
digestive tract (Betram et al., 2001; National Institute of Diabetes and Digestive and
Kidney Diseases, 2017). According to Al Huthail (2013), many IBS patients feel
dissatisfied with their perceived physician-patient relationship due to a feeling of being
insufficiently educated about their condition and a lack of an adequate explanation for
their symptoms. IBS patients also often feel that their concerns are not taken seriously by
their physician and many report perceived uncaring attitudes from medical professionals
(Bertram et al., 2001; Bjorkman, Simren, Ringstrom, & Ung, 2016; Hakanson et al.,
2010). Due to this, many IBS patients fail to seek medical care because they feel a
consultation with a physician will provide little help (Al Huthail, 2013). If more research
is conducted investigating the quality of life of patients with IBS it is possible that
physicians may approach these patients differently. More research about the quality of
life in IBS patients may help physicians understand how much IBS impacts the life of
patients, so they may be more understanding and willing to find ways to improve
symptoms. There is limited research regarding the quality of life in patients with IBS-C
and IBS-M, so this study is needed to provide additional data to the current body of
research related to the quality of life of patients with IBS.

4
CHAPTER 2
REVIEW OF LITERATURE
Irritable bowel syndrome (IBS) is a common gastrointestinal (GI) disorder that
affects an estimated 1 in 10 people globally (Black & Ford, 2020). The exact
pathophysiology of IBS is unclear, but IBS is defined as a group of symptoms that occur
together without any visible signs of disease or damage in the digestive tract (National
Institute of Diabetes and Digestive and Kidney Diseases, 2017). Despite the lack of
physical damage in the digestive tract, IBS can significantly reduce quality of life with
the same degree of impairment as major chronic diseases, like diabetes, congestive heart
failure, kidney disease, and hepatic cirrhosis (El-Salhy, 2012). Quality of life with IBS
has been found to be affected by psychiatric symptoms, GI symptoms, disease severity,
and gender (Singh et al., 2015). The symptoms that commonly occur in IBS may include
chronic abdominal pain, diarrhea, constipation, changes in bowel movements, abdominal
distension, bloating, and gas. Symptoms and the severity of symptoms can vary
drastically between patients (National Institute of Diabetes and Digestive and Kidney
Diseases, 2017). It is estimated that 41% of patients have mild IBS, 35% of patients have
moderate IBS, and 25% of patients are considered to have severe IBS (Corsetti &
Whorwell, 2017). Mild IBS is considered to include 1-3 symptoms, mild/intermittent
abdominal pain, good health-related quality of life, occasional activity restriction (0-15

5
days per year), health care utilization 0-1 time per year, and lack of or mild
psychological distress (Drossman et al., 2011). Moderate IBS is considered to include 4-6
symptoms, including moderate and frequent abdominal pain, fair health-related quality of
life, 15-50 days of activity restriction per year, moderate psychological distress, and
health care utilization 2-4 times per year. Severe IBS is considered to include 7 or more
symptoms, poor health-related quality of life, >50 days of activity restriction per year,
severe psychological distress, severe and constant abdominal pain, and health care
utilization 5 or more times per year (Drossman et al., 2011). Frequency of symptoms can
also vary among patients. Some patients may experience symptoms daily, while other
patients may experience symptoms at intervals of weeks or months at a time (El-Salhy,
2012). IBS can be difficult to diagnose due to the lack of visible damage within the
digestive tract. Typically, IBS is diagnosed by eliminating other GI disorders such as:
ulcerative colitis, crohn’s disease, diverticulitis, small intestinal bacterial overgrowth
(SIBO), celiac disease, non-celiac gluten sensitivity, and lactose intolerance (Borghini,
Donato, Alvaro, & Picarelli, 2017).
Prevalence of Irritable Bowel Syndrome
Approximately 12% of IBS patients seek healthcare related to the treatment of
IBS (Saha, 2014). According to the World Gastroenterology Organization approximately
1/3 of IBS patients have IBS-diarrhea (IBS-D), 1/3 of patients have IBS-constipation
(IBS-C), and 1/3 of patients have IBS-mixed with diarrhea and constipation (IBS-M)
(Corsetti & Whorwell, 2017). In the United States, IBS affects approximately 15% of the
population, but many patients do not seek health care for their condition (Qureshi et al.,
2016). IBS-related care accounts for about 12% of primary care visits and 2.2 million

6
prescriptions. IBS is the most common diagnosis made by gastroenterologists in the
United States (Qureshi et al., 2016). In Western countries IBS tends to be more common
in women, while in Eastern countries IBS is not found to be more common in women
than men. It has been hypothesized that IBS is under diagnosed in Asia and other Eastern
countries (Saha 2014). Approximately 6.5%-10.1% of the Asian population meets the
criteria for IBS (Chang, Lu, & Chen, 2010). Lovell and Ford (2012) collected data from
studies conducted in Northern Europe and Southeast Asia. This meta-analysis found that
IBS occurs more commonly in women than men and age was not a factor in diagnosis
(Lovell & Ford, 2012). These results are different than results found by Pan, Chang, Su,
and Tsai (2016), who found that the incidence of IBS significantly increased with age.
Anbardan et al. (2012) conducted a study examining gender in a sample of 144
patients with IBS in Tehran, Iran. These researchers found that 69.4% of the patients with
IBS were female and 30.6% of the patients were male. These results align with the results
from the meta-analysis conducted by Lovell and Ford (2012) and the study conducted by
Pan, Chang, Su, and Tsai (2016) which found that IBS is more common in women than
men. IBS-D was more common in men (38.6%), while IBS-C was more common in
women (38%). Kosako, Akiho, Miwa, Kanazawa, and Fukudo (2018) conducted an
internet survey of 30,000 Japanese IBS-C patients and abdominal discomfort, abdominal
distention, and abdominal fullness were significantly more common in female subjects
than male subjects. Abdominal distention and abdominal pain were also significantly
more common in IBS-C patients aged 20-49 years than those aged 50-79 years (Kosako,
Akiho, Miwa, Kanazawa, & Fukudo, 2018). Between 1995-2005, IBS was diagnosed in
approximately 141,295 patients worldwide (Ladabaum et al., 2011). Of these 141,295

7
patients 74% were female and the mean age at time of diagnosis was 46 years. Internists
made 68% of diagnoses, gastroenterologists made 13% of diagnoses, and others made
19% of diagnoses (Ladabaum et al., 2011).
Diagnosis of Irritable Bowel Syndrome
A variety of methods can be used to diagnose IBS including reviewing the
patient’s symptoms, reviewing the patient’s medical history, evaluating the patient for
warning signs of more severe conditions, performing a physical examination, and using
the Rome IV Criteria (Lacy & Patel, 2017). The presence of additional functional GI
disorders and extraintestinal disorders such as, fibromyalgia, migraines, gastroesophageal
reflux disease (GERD), dyspepsia, and interstitial cystitis, may increase the likelihood of
a positive IBS diagnosis (Lacy, 2016). Warning signs for more severe conditions include
anemia, hematochezia, unintentional weight loss, and family history of colorectal cancer
or inflammatory bowel diseases. The Rome IV Criteria were developed by an
international panel of experts in the field of functional GI disorders. The Rome IV
Criteria define IBS as a functional bowel disorder with chronic abdominal pain that is
associated with a change in bowel habits. Diarrhea, constipation, or a mix of diarrhea and
constipation are disordered bowel habits. The Rome IV Criteria are chronic abdominal
pain at least 1 day per week over the last 3 months, associated with two or more of the
following criteria: related to defecation, associated with a change in stool frequency, or
associated with a change in appearance or form of stool (Endo, Shoji, & Fukudo, 2015;
Simren, Palsson, & Whitehead, 2017). These criteria must be met over the previous 3
months and symptom onset must have occurred at least 6 months prior to diagnosis
(Simren, Palsson, & Whitehead, 2017). The Rome III were previously used to diagnose

8
IBS and they are characterized by abdominal pain which improves with defecation and
whose onset is associated with a change in frequency or form of stool and is not
attributed to structural or biochemical abnormalities (Sandhu & Paul, 2014).
Irritable Bowel Syndrome-Constipation (IBS-C)
IBS can be divided into three different types based on the predominant change in
bowel habits: IBS-constipation (IBS-C), IBS-diarrhea (IBS-D), and IBS-mixed (IBS-M)
(Mearin et al., 2016). IBS-C can be compared to chronic constipation because both are
functional bowel disorders. In IBS-C constipation, abdominal bloating, and abdominal
distention are the predominant symptoms. IBS-C and chronic constipation are
characterized by visceral hypersensitivity and abnormalities in gut motility (Nellesen,
Yee, Chawla, Lewis, & Carson, 2013). IBS-C is characterized by abdominal discomfort
or pain with disturbed defecation, while chronic constipation is simply characterized by
sporadic and infrequent bowel movements, hard stools, straining, and feeling of
incomplete bowel evacuation. Functional or chronic constipation (with or without IBS)
can be classified according to the pathophysiological mechanism associated with the
constipation including, functional defecatory disorders, slow colonic transit time, and
normal colonic transit time. Approximately 5.2%-66% of IBS patients are considered to
have IBS-C (Nellesen, et al., 2013). DiBonaventura, Sun, Bolge, Wagner, and Mody
(2011) used data from the 2007 National Health and Wellness Survey to assess the effects
of IBS-C on health-related quality of life on patients lives. IBS-C was associated with
reduced health-related quality of life, increased work productivity loss, increased activity
impairment, and greater use of healthcare resources. Patients with IBS-C also reported

9
significantly more doctors’ appointments and emergency room visits when compared to
patients without IBS-C (DiBonaventura, Sun, Bolge, Wagner, & Mody, 2011).
Irritable Bowel Syndrome-Diarrhea (IBS-D)
IBS-D is characterized by abdominal pain, loose or watery stools, abdominal
bloating, and abdominal cramping (Buono, Carson, & Flores, 2017). Patients with IBS-D
may also experience abdominal pain associated with frequent loose stools, a feeling of
urgency not relieved by defecation, and mucus in the stool (Lacy, 2016). IBS-D
symptoms can be infrequent and mild, moderate and occasionally bothersome, or severe
enough to reduce the ability to have normal daily functioning (Lacy, 2016).
Approximately 0.8%-33.98% of IBS patients are considered to have IBS-D (Nellesen,
Yee, Chawla, Lewis, & Carson, 2013). The pathophysiology of IBS-D is not exactly
known, but dietary factors, accelerated transit through the gastrointestinal tract, visceral
hypersensitivity, and abnormalities in the gut microbiota may contribute to the
development of IBS-D (Lacy, 2016). Buono, Carson, and Flores (2017) examined the
impact of IBS-D on health-related quality of life, work productivity, and daily activities,
and found that IBS-D patients reported lower health-related quality of life compared to
patients with asthma, gastroesophageal reflux disease (GERD), or migraines. These
patients also reported more bodily pain, impaired social functioning, and worse mental
health compared to patients with other chronic diseases (Buono, Carson, & Flores 2017).
Singh et al. (2015), conducted a study examining the effect of IBS subtype on IBS-
specific quality of life using the Irritable Bowel Syndrome-Quality of Life (IBS-QOL)
questionnaire. Of the 243 IBS patients included in the study 22.2% had IBS-C, 23.1%
had IBS-D, and 49.8% had IBS-M. Patients with IBS-D and IBS-M scored lower on IBS-

10
QOL and have increased food avoidance, effect on daily activities, and social relationship
problems (Singh et al., 2015).
Irritable Bowel Syndrome-Mixed (IBS-M)
IBS-M is characterized by varying GI symptoms including both diarrhea and
constipation (Su, Shih, Presson, & Chang, 2013). The most common symptoms
associated with IBS-M include irregular bowel habits, bloating, and abdominal pain.
Nausea has also been found to be significantly more common in patients with IBS-M
than patients with IBS-D or IBS-C. Irregular bowel habits can be defined as less than 3
bowel movements per week or greater than 3 bowel movements per day (Su, Shih,
Presson, & Chang, 2013).
Quality of Life with Irritable Bowel Syndrome
Many studies have found that IBS negatively impacts the quality of life of patient
who experience symptoms (Buono, Carson, & Flores, 2017; DiBonaventura, Sun, Bolge,
Wagner, & Mody, 2011; El-Salhy, 2012; and Singh et al., 2015). Symptom severity,
anxiety, and depression have been associated with the overall IBS-QOL life score (Cho et
al., 2011). Fear of GI symptoms has also been found to impact health-related quality of
life in IBS patients (Lackner, Gudleski, Ma, Dewanwala, & Naliboff, 2014). Patients with
worse bowel symptoms that occur more frequently have been found to have a lower
health-related quality of life when compared to patients with mild, less frequent
symptoms (Cho et al., 2011). Singh et al. (2015), found that patients with IBS-D and
IBS-M have significantly lower IBS-QOL scores than patients with IBS-C. IBS-D and
IBS-M patients reported greater interference with daily activities and had increased food

11
avoidance when compared to patients with IBS-C which impacted the overall IBS-QOL
score (Singh et al., 2015). IBS can significantly reduce quality of life with the same
degree of impairment as major chronic diseases, like diabetes, congestive heart failure,
kidney disease, and hepatic cirrhosis (El-Salhy, 2012).
Economic Impact of Irritable Bowel Syndrome
Due to the high prevalence of IBS in the United States and an increased demand
of health care related to the condition, approximately $8 billion are spent on the medical
costs of IBS patients per year (Qureshi et al., 2016). It is also estimated that an additional
$25 billion are wasted by IBS patients who have undergone unnecessary procedures such
as: appendectomies, hysterectomies, cholecystectomies, and other surgical procedures
due to the difficulty associated with diagnosing IBS (Qureshi et al., 2016). According to
Ladabaum et al. (2011), endoscopic and radiologic testing were most commonly used by
gastroenterologists prior to being diagnosed with IBS. Canavan and Card (2014) found
that 15%-43% of patients diagnosed with IBS pay out of pocket for treatments (such as
medications) for their symptoms. Approximately 48% of patients with IBS incur some
costs each year related to their IBS. International annual cost estimates per patient: $742-
$7,547 per year in the U.S.; $116–$409 per year in the UK; $670–$1,020 per year in
France; $259 per year in Canada; $936 per year in Germany; $310 per year in Norway;
and $92 per year in Iran (Canavan & Card, 2014). Doshi et al. (2014), conducted a
retrospective analysis of health care costs associated with IBS in the United States and
found that the mean health care costs for IBS patients was estimated to be $11,182
annually. Over half of these costs were attributed to physician office visits and other
outpatient services. The remainder of the costs were attributed to hospitalizations

12
(21.8%), prescriptions (19.1%), and ER visits (5.4%). Specific GI-related health care
costs averaged $4,456 per year (approximately 39.8% of all-cause health care costs)
(Doshi et al., 2014). Corsetti & Whorwell (2017) facilitated a report with a
pharmaceutical company that states the major cause for the economic burden placed by
IBS on health care services and society is the less than ideal management of the
condition.
A majority (90%) of consultations related to IBS are with a general practitioner
and patients often repeatedly consult their general practitioner for management of IBS
before being referred to a specialist (Corsetti & Whorwell, 2017). These primary care
visits are estimated to account for 30% of total direct healthcare costs for IBS patients,
while 25-30% of costs are attributed to inpatient healthcare. In the UK and US, patients
diagnosed with IBS take an average of 8.5-21.6 days off work each year (Corsetti &
Whorwell, 2017). According to a survey conducted by the American Gastroenterological
Association, patients with IBS reported that their GI symptoms interfered with work
productivity an average of 9 workdays per month and that they had to miss an average of
2 days of work per month due to IBS symptoms (Buono, Carson, & Flores, 2017).
Productivity loss due to IBS amounts to an annual loss of $748 per patient in Canada,
$335 per patient in the U.S., $335 per patient in the UK, and $812 per patient in Iran
(Corsetti & Whorwell, 2017). Despite the significant impact on quality life caused by
IBS, it has been reported that only 60% of employers recognize IBS as a valid reason for
absence from work (Corsetti & Whorwell, 2017). According to the Irritable Bowel
Syndrome with Constipation (IBIS-C) study conducted in the UK, France, Germany,
Italy, Spain, and Sweden, 70% of the 104 IBS patients included in the study consulted a

13
general practitioner, 100% consulted a gastroenterologist, and 24% of patients required
an emergency department visit or inpatient hospital stay (Yiannakou et al., 2015).
Additionally, 52% of patients required some type of diagnostic test, 90% took
prescription drugs for IBS-C, 51% took sick leave due to their IBS symptoms, and 82%
of patients incurred productivity losses (Yiannakou et al., 2015).
Triggers for Irritable Bowel Syndrome Symptoms
Irritable bowel syndrome symptoms can vary among patients and the factors that
trigger symptoms also vary widely (Qin, Cheng, Tang, & Bian, 2014; Saha, 2014; Volta
et al., 2016). Triggers for IBS symptoms may include food triggers, lifestyle triggers, or
internal causes. Some patients may experience symptoms caused by only specific triggers
or combinations of a variety of different triggers (Qin, Cheng, Tang, & Bian, 2014; Saha,
2014; Volta et al., 2016).
Food Triggers
Approximately 60% of IBS patients relate the occurrence of their symptoms with
the consumption of certain foods and many of these patients report worsening of
symptoms within 15 minutes to a few hours after eating a meal (Volta et al., 2016).
Monsbakken, Vandik, and Farup (2006) evaluated perceived food intolerances in IBS
patients and found that 62% of participants limited or excluded certain foods from their
diet and 12% were considered to have a nutritionally inadequate diet. El-Salhy et al.
(2012), reported that the average diet of an IBS patient was low in calcium, magnesium,
phosphorus, riboflavin, and vitamin A. Food related symptoms in IBS patients are
typically referred to as food intolerances rather than food allergies because there is no

14
evidence of an allergic reaction mediated by immunoglobulin E in response to foods in
IBS.
Non-celiac gluten sensitivity (NCGS) is defined as having gastrointestinal and
extra-intestinal symptoms, without celiac disease or a wheat allergy, but symptoms are
improved by following a gluten-free diet (Volta et al., 2016). NCGS is characterized by
symptoms such as: diarrhea, abdominal pain, bloating, gas, headache, fatigue, attention-
deficit/hyperactivity disorder, skin issues, or recurrent oral ulceration (Makharia, Catassi,
& Makharia, 2015). Disorders related to gluten sensitivity or intolerance are recognized
as commonly mimicking the symptoms of IBS (Makharia, Catassi, & Makharia, 2015).
Physicians may perform celiac-specific serological tests in patients with suspected gluten
sensitivity and if these tests are negative patients may be instructed to participate in a trial
of a gluten/wheat free diet. If symptoms improve while the patient is on the gluten/wheat
free diet a diagnosis of NCGS may be supported (Makharia, Catassi, & Makharia, 2015).
In a double-blind randomized placebo-controlled study evaluating the effects of
following a gluten free diet on symptoms in IBS patients, statistically significant
differences, were found in overall symptoms among the gluten-containing group and
placebo group (Shahbazkhani et al., 2015). Based on these results, the researchers
concluded that many IBS patients may be sensitive to gluten (Shahbazkhani et al., 2015).
A controlled-trial of a gluten-free diet in patients with IBS-D which found that
participants consuming the gluten-containing diet had more bowel movements per day
than the group following the gluten free diet (Vazquez-Roque et al., 2013). Despite
having fewer bowel movements per day while following the gluten free diet, the

15
participants in the gluten free diet group did not experience a significant difference in
stool form (Vazquez-Roque et al., 2013).
Fermentable oligosaccharides, disaccharides, monosaccharides, and polyols
(FODMAP) are another category of foods that have been associated with the onset of IBS
symptoms (Barret & Gibson, 2012). FODMAPs are defined as short-chain carbohydrates
that are not completely absorbed in the GI tract (de Roest et al., 2013). These
carbohydrates are also highly fermentable, so this increases the osmotic load in the
intestines. Increased delivery of water to the colon and increased gas production in the
colon causes luminal distention. This luminal distention leads to symptoms such as
altered GI motility, bloating, abdominal pain/discomfort, and gas (de Roest et al., 2013).
Many fruits, vegetables, and grains typically deemed healthy foods that should be
included in the diet are FODMAPs. Examples of FODMAPs are lactose, fructose,
sorbitol, mannitol, fructo-oligosaccharides, and galacto-oligosaccharides (Varney et al.,
2017). Foods are classified as high FODMAP containing, moderate FODMAP
containing, and low FODMAP containing. High FODMAP foods can potentially lead to
the worst IBS symptoms, while low FODMAP foods are often considered to be less
likely to cause symptoms. Despite these generalizations, food triggers vary widely for
IBS patients (Barrett & Gibson, 2012). Oligosaccharides are found in foods such as:
wheat and rye products, nuts, legumes, onion, garlic, and artichokes. There is no an
enzyme in the human body capable of completely breaking down fructans and galacto-
oligosaccharides, so they are malabsorbed. They are highly fermentable, so gas is
produced causing bloating, abdominal pain, and excessive flatulence. Lactose is the
disaccharide FODMAP and it is found in dairy products such as: milk, yogurt, and soft

16
cheeses. Fructose is the monosaccharide FODMAP and it is found in many foods
including apples, pears, watermelon, mango, honey, sugar snap peas, and high fructose
corn syrup. Fructose is highly osmotic and draws water into the lumen. This luminal
distension can cause abdominal pain, bloating, diarrhea, and altered GI motility (Barrett,
2017). Foods that contain polyols that might contribute to IBS symptoms include
mushrooms, apples, pears, stone fruits, cauliflower, snow peas, and sugar-free chewing
gum or mints. Polyols are slowly absorbed in the small intestine and can produce an
osmotic effect similar to fructose (Barrett & Gibson, 2012).
Lifestyle Triggers
Psychological and emotional stress are important factors in the development of
IBS and can exacerbate the severity of symptoms (Qin, Cheng, Tang, & Bian, 2014). IBS
is often described as a functional illness that is influenced by social, psychological, and
physiological factors (Lackner et al., 2010). Psychological stresses have a significant
impact on intestinal sensitivity, secretion, motility, and permeability. Approximately 94%
of patients with IBS also have some type of psychiatric disorder or mental health issue
such as depression or generalized anxiety disorder (Gulewitsch et al., 2013). Panic
disorder is present in 25-44% of IBS patients, generalized anxiety disorder is present in
32%, post-traumatic stress disorder is present in 36% of IBS patient, and major
depressive disorder is present in 47% of IBS patients (Fadgyas-Stanculete, Buga, Popa-
Wagner, & Dumitrascu, 2014). Stress can induce alterations in the neuro-endocrine-
immune system pathway which act on the gut-brain axis and microbiota-gut-brain axis.
These alterations can lead to exacerbation of IBS symptoms or symptom flare-ups (Qin,
Cheng, Tang, & Bian, 2014). Additionally, the secretion of corticotropin-releasing factor

17
(CRF) can be stress-induced which may lead to disruptions in GI function. Immune
system activation and low-grade inflammation also appear to be important in the
development of IBS symptoms (O’Malley, Quigley, Dinan, & Cryan, 2011).
Stress and depression are related to IBS along with functional dyspepsia, and
peptic ulcer disease (Lee et al., 2015). The incidence of IBS increased as stress levels
increased (Lee et al., 2015). Mykletun et al. (2010), examined the prevalence of mood
and anxiety disorders in IBS patients. The researchers found that 27.5% of patients with
IBS also were currently suffering from a mood or anxiety disorder. Additionally, 50.5%
of patients with lifetime IBS also reported having a lifetime psychiatric condition
(Mykletun et al., 2010). Kabra and Nadkarni (2013) found similar results when
evaluating the prevalence of depression and anxiety in IBS patients. Kabra and Nadkarni
(2013) found that 37.1% of participants had an anxiety disorder and 31.4% of participants
suffered from depression. They also found that IBS is significantly associated with low
socio-economic status, lower education levels, and being single, divorced, or widowed
(Kabra & Nadkarni, 2013). Gastrointestinal (GI) specific anxiety, which is anxiety related
to GI symptoms and disorders, has been theorized to influence the quality of life and
severity of symptoms in IBS patients (Gulewitsch et al., 2013; Jerndal et al., 2010).
Jerndal et al. (2010), report that IBS patients have more severe GI specific anxiety when
compared with healthy people. Severe GI specific anxiety is also associated with more
severe GI symptoms, more severe generalized anxiety, lower socioeconomic status, and
more severe depression (Jerndal et al., 2010; Kabra & Nadkarni, 2013).

18
Potential Internal Causes for IBS Symptoms
Potential underlying causes of IBS may include minor inflammatory bowel
disease, serotonin dysregulation, small intestine bacterial overgrowth, and central
dysregulation (Saha, 2014). Approximately 10% of IBS patients believe their IBS
symptoms began after experiencing an infectious illness. Exposure to gastrointestinal
infections can cause low-grade mucosal and systemic inflammation, which causes
mucosal infiltration of immune cells, increased production of several cytokines, and an
altered population of cells circulating through the bloodstream (Belmonte et al., 2012).
Psychological stress has also been reported to be a factor that potentially induces immune
activation (Ishihara et al., 2013). Serotonin dysregulation has been theorized to play a
role in the onset of IBS (Saha, 2014). The 5-HT3 and 5-HT4 serotonin receptors play a
significant role in controlling GI motility, sensation, and secretion (Spiller, 2001).
Houghton et al. (2003), found that plasma 5-HT concentrations are elevated in IBS
patients with diarrhea and reduced in IBS patients with constipation, especially in
patients whose symptoms occur postprandially. Small intestinal bacterial overgrowth
(SIBO) is seems to prevalent in IBS patients, but it remains unclear whether SIBO causes
IBS (Spiegel, 2011). SIBO causes symptoms that mirror IBS symptoms such as: diarrhea,
gas, bloating, constipation, nausea, abdominal pain, and fatigue. Moraru et al. (2014),
found that 31.7% of IBS patients were diagnosed with SIBO. In this study SIBO was
present in 45.7% of patients with IBS-D (Moraru et al., 2014). The central nervous
system modulates gut secretions, motility, and blood flow, so central dysregulation may
influence the onset of IBS symptoms (Mayer, Naliboff, & Craig, 2006).

19
Potential Treatments for Irritable Bowel Syndrome
Due to the variety of triggers and causes for IBS symptoms there are also a wide
variety of potential treatments that may be used to manage IBS (Halmos, Power, Sheperd,
Gibson, & Muir, 2013; Hussain & Quigley, 2006; Kong et al., 2005; Khanna,
MacDonald, & Levesque, 2014; Trinkley & Nahata, 2014). Potential treatments may
include medications, peppermint oil, dietary changes, specific dietary patterns, probiotics,
and other alternative treatments. Many patients go through a trial and error process to
determine the treatment regimen that works the best to control their symptoms and
effective treatment regimens often vary between patients (Halmos, Power, Sheperd,
Gibson, & Muir, 2013; Hussain & Quigley, 2006; Kong et al., 2005; Khanna,
MacDonald, & Levesque, 2014; Trinkley & Nahata, 2014).
Medications
Currently there are no specific medications that are used as a first-line treatment
for all patients with IBS (Trinkley & Nahata, 2014). Typically, when medications are
prescribed for patients with IBS, the medication is chosen based on its efficacy for
treating the patient’s specific symptoms. For example, a patient suffering from chronic
diarrhea or IBS-D will require a different medication than a patient suffering from
chronic constipation or IBS-C (Trinkley & Nahata, 2014). According to Trinkley and
Nahata (2014) there is evidence that supports the improvement of certain IBS symptoms
with many different medications including: loperamide, psyllium husk, lubiprostone,
linaclotide, amitriptyline, trimipramine, desipramine, citalopram, fluoxetine, paroxetine,
dicyclomine, rifaximin, ketotifen, pregabalin, gabapentin, and octreotide. These
medications fall into several categories and have many different mechanisms of action.

20
Citalopram, fluoxetine, and paroxetine are classified as selective serotonin reuptake
inhibitors (SSRIs) and are typically used to treat anxiety and depression (Trinkley &
Nahata, 2014). Amtitriptyline, desipramine, and trimipramine are tricyclic
antidepressants that have been shown to improve IBS symptoms in some patients.
Antispasmodics such as dicyclomine and hyoscyamine have also been used in the
treatment of IBS (Trinkley & Nahata, 2014). Antispasmodics cause decreased GI motility
and ease GI muscle spasms, which can improve abdominal pain and cramping in IBS
patients (Roblin et al., 2009). Loperamide is the only antidiarrheal that has been found to
be effective in patients with IBS-D. Loperamide works by inhibiting peristalsis, reducing
stool frequency, and improving stool consistency (Roblin et al., 2009). LinzessTM is a
medication that has been approved by the FDA for use in patients with IBS-C (Rao et al,
2012). LinzessTM works by increasing the release of intestinal fluid, accelerating
intestinal transit time, and reducing pain in the intestines, but LinzessTM also may cause
diarrhea (Chey et al., 2012).
Peppermint Oil
Peppermint oil naturally causes relaxation of the smooth muscles located
throughout the gastrointestinal system, so it has been researched regarding its potential
role in the treatment of IBS (Khanna, MacDonald, & Levesque, 2014). Peppermint oil
also has several other mechanisms of action including visceral sensitivity modulation,
anti-inflammatory activity, anti-microbial effects, and improvement of psychosocial
stress (Chumpitazi, Kearns, & Shulman, 2018). Based on the meta-analysis performed by
Khanna, MacDonald, and Levesque (2014) peppermint oil was found to cause a
significant improvement in IBS symptoms including abdominal pain. Peppermint oil has

21
also been found to be beneficial in the treatment of functional dyspepsia, functional
abdominal pain, and post-operative nausea (Chumpitazi, Kearns, & Shulman, 2018).
Despite the potential positive effects of peppermint oil on IBS symptoms, heart burn has
been identified as a potential negative side effect (Khanna, MacDonald, & Levesque,
2014).
Diets and Eating Patterns
Many diets that have been theorized and tested in the management of IBS
symptoms, but one of the most popular is the low FODMAP diet (Halmos, Power,
Sheperd, Gibson, & Muir, 2013). The low FODMAP diet is an elimination diet that limits
consumption of fermentable oligosaccharides, disaccharides, monosaccharides, and
polyols (FODMAPs). Many of the foods that fall into these categories can trigger GI
symptoms including gas, diarrhea, abdominal bloating, abdominal discomfort, and
excessive flatulence (Gibson, 2017). The term “FODMAP” was developed by researchers
at Monash University in Melbourne, Australia in 2004 (Gibson, 2017). The low
FODMAP diet focuses on the elimination or limitation of many foods that are considered
to contain high amounts of FODMAPs (Mitchell, Porter, Gibson, Barrett, & Garg, 2018).
When this diet is initiated there is typically an elimination period that lasts approximately
3-8 weeks, then there is a reintroduction phase (Gibson, 2017). The reintroduction phase
involves reintroducing certain foods one at a time for three days each. It is important that
the reintroduction phase is conducted correctly so patients can identify specific foods that
cause GI symptoms for themselves specifically (Gibson, 2017). Examples of foods that
are limited on this diet include onions, garlic, apples, wheat products, milk, yogurt, soft
cheeses, watermelon, cauliflower, green bell pepper, chickpeas, and soybeans. Examples

22
of foods that are suitable for this diet include carrots, celery, red bell pepper, sweet
potato, blueberries, grapes, strawberries, hard cheeses, gluten-free products, lactose-free
milk, and white potatoes (Mitchell, Porter, Gibson, Barrett, & Garg, 2018).
Eswaran, Chey, Han-Markley, Ball, and Jackson (2016) compared the effects of a
low FODMAP diet versus a diet modified from the National Institute for Health and Care
Excellence (mNICE) in patients with IBS-D. The diet modified from the mNICE
guidelines included eating smaller meals more frequently, limiting caffeine and alcohol,
and avoiding foods that are known to cause symptoms (Eswaran, Chey, Han-Markley,
Ball, and Jackson, 2016). Approximately 52% of the participants in the low FODMAP
diet group reported significant relief of their IBS-D symptoms, while 41% of the
participants in the mNICE group reported significant relief of their IBS-D symptoms. The
participants in the low FODMAP group also reported greater reductions in their average
daily scores for abdominal pain, bloating, stool consistency, stool frequency, and urgency
of bowel movements (Eswaran, Chey, Han-Markley, Ball, & Jackson, 2016). Staudacher,
Whelan, Irving, and Lomer (2011) investigated the effects of a low FODMAP diet versus
standard dietary guidelines for patients with IBS. The NICE guidelines were also used in
this study and were the standard dietary guidelines for patients with IBS at this time.
Approximately 76% of the patients in the low FODMAP group reported satisfaction with
their symptom relief, while 54% of the patients in the standard group reported satisfaction
with their symptom relief (Staudacher, Whelan, Irving, & Lomer, 2011). The patients in
the low FODMAP group also reported significant improvements in abdominal pain (low
FODMAP 85% versus standard 61%), bloating (low FODMAP 82% versus standard
49%), and flatulence (low FODMAP 87% versus standard 50%).

23
Despite the favorable results seen in many studies evaluating the efficacy of a low
FODMAP diet there are concerns about the restrictiveness of the diet (Hill, Muir, &
Gibson, 2017). There is concern that the low FODMAP diet may lead to a risk of
inadequate intake of important nutrients and disordered eating patterns. There is also
concern that long-term strict restriction of high FODMAP foods may induce a potentially
unfavorable gut microbiota (a decrease in beneficial bacteria) due to the prebiotic actions
found in fructans and galacto-oligosaccharides. (Hill, Muir, & Gibson, 2017). O’Keefe et
al. (2017), evaluated the long-term effects of the low FODMAP diet on GI symptoms,
food intake, patient acceptability of the diet, and healthcare utilization in IBS patients.
Approximately 12% of participants reported satisfactory relief of symptoms at baseline,
61% at the short-term follow up appointment, and 57% at the long-term follow up
appointment. At the long-term follow up appointment 82% of the participants continued
to follow a low FODMAP diet that was adapted to their individual trigger foods. The low
FODMAP group reported that the diet costed appreciably more than their typical diet and
affected social eating habits (O’Keefe et al., 2017).
Alternative Treatments
Recent studies have found that 50% of IBS patients utilize complementary and
alternative medicine (CAM) as treatment for their IBS symptoms (Hussain & Quigley,
2006; Kong et al., 2005). Herbal therapies, probiotics, turmeric, artichoke leaf extract,
hypnotherapy, cognitive-behavioral therapy, relaxation techniques, acupuncture, and
exercise have all been studied for their potential positive effects on IBS symptoms (Chey,
Maneerattaporn, & Saad, 2011; Yoon, Grundmann, Koepp, & Farnell, 2011). Mind-body
therapies, acupuncture, cognitive-behavioral therapy, probiotics, dietary changes, and

24
exercise are the most common CAM therapies that are sought out by IBS patients (Yoon,
Grundman, Koepp, & Farnell, 2011). Mind-body therapies may potentially have a
positive impact on the quality of life for IBS patients because many IBS patients have
fears and anxiety related to their GI symptoms (Lackner, Gudleski, Ma, Dewanwala, &
Naliboff, 2014). Many types of psychotherapy have been studied in IBS patients
including cognitive-behavioral therapy, gut-directed hypnotherapy, psychodynamic
psychotherapy, and mindfulness (Kinsinger, 2017). Cognitive-behavioral therapy has
been the focus and has been tested in at least 20 published randomized controlled trials
which conclude that cognitive-behavioral therapy is an effective way to improve IBS
symptoms (Laird et al., 2016).
Probiotics are beneficial bacteria that are found naturally in the body, which have
been studied in the treatment of IBS symptoms in patients (Roblin et al., 2009).
Probiotics are defined as live, micro-organisms that can cause a health effect on the host
when consumed in adequate amounts (Butel, 2014). Lactobacillus, Bifidobacterium,
enterococcus, streptococcus, and leuconostoc are the most common strains of probiotics
that are available commercially (Peyton & Greene, 2014). There are five criteria that
must be met in order for a probiotic to be considered effective: 1) it must not be toxic or
pathogenic; 2) it must produce a beneficial effect on the host; 3) it must contain a large
number of viable micro-organisms per pill; 4) it must be able to survive the intestine,
reproduce, maintain itself, and have intraluminal metabolic activity; and 5) it must stay
viable while being stored and used (Dai, Zheng, Jiang, Ma, & Jiang, 2013). Probiotics
have various actions and may improve IBS symptoms by decreasing bacterial overgrowth
in the small intestine and improving the imbalance between the pro-inflammatory

25
cytokines and the anti-inflammatory cytokines (Peyton & Greene, 2014). Probiotics may
also inhibit pathogen binding in the intestinal cells, enhance mucosal barrier function,
effect colonic transit and motility, have an anti-inflammatory effect, reduce intestinal
permeability and bacterial translocation, and function in metabolic reactions (Dai, Zheng,
Jiang, Ma, & Jiang, 2013). The Treatment section of the IBS Clinical Practice Guidelines
concluded that probiotics have the potential to improve multiple IBS symptoms and
generally have been found to be effective in treating IBS patients (Whelan & Quigley,
2013).
A systemic review of randomized controlled trials investigating the use of
exercise therapy in IBS patients which found that quality of life, anxiety, GI symptoms,
and IBS-related comorbidities showed more significant symptom improvements with
exercise therapy when compared to typical lifestyle maintenance (Zhou, Zhao, Li, Jia, &
Li, 2018). Very few studies showed that exercise is as effective as medications or a low
FODMAP diet for the treatment of IBS symptoms (Zhou, Zhao, Li, Jia, & Li, 2018). El-
Sahey, Lillebo, Reinemo, Salmelid, and Hausken (2010), conducted a study evaluating
the effects of a health program including patient education, diet management, probiotics,
and exercise on the symptoms and quality of life of IBS patients and found that
symptoms scores and quality of life scores were significantly improved at the completion
of the program. Zhao, Ni, Zhang, and Tian (2019) conducted a similar study evaluating
the effects of cognitive behavioral therapy combined with exercise on IBS-D patients.
They found that a combination of cognitive behavioral therapy and exercise can have a
positive impact on IBS patients (Zhao, Ni, Zhang, & Tian, 2019). These researchers
concluded that to significantly improve symptoms and quality of life in IBS patients a

26
combination of treatments/therapies may need to be used (El-Sahey, Liilebo, Reinemo,
Salemlid, & Hausken, 2010; Zhao, Ni, Zhang, & Tian, 2019).

27
CHAPTER 3
METHODS
The purpose of this study was to compare the quality of life scores for each
specific type of IBS (IBS-D, IBS-C, and IBS-M). This study used an online survey
design that included the validated Irritable Bowel Syndrome Quality of Life
Questionnaire (IBS-QOL) (Rome Foundation, 2012). The IBS-QOL questionnaire was
developed by the Rome Foundation who also developed the Rome IV IBS diagnostic
criteria. The Rome Foundation works to develop and legitimize the diagnosis and
treatment of disorders of gut brain interactions (DGBIs). The IBS-QOL questionnaire has
been validated in several countries and is used to assess the impact of IBS and its
treatment on quality of life. This survey is available in English as well as many other
languages including French, Spanish, Italian, German, etc. The IBS-QOL questionnaire
assesses quality of life in IBS patients using a total scale score and eight subscales
including: body image, dysphoria, interference with activities, healthy worry, food
avoidance, social reactions, sexual health, and effect on relationships. The author’s
scoring formulas that were used for calculations are included in Appendix B. The
questionnaire was included in an online survey developed on Qualtricsᵀᴹ software and
was distributed through a link provided on various social media outlets including
Facebook, IBS Support Groups on Facebook, and Instagram. The groups chosen included
men and women, a variety of age groups, and a variety of racial groups. FODMAP diet

28
trained dietitians were also contacted and asked to share the survey with their patients.
Demographic data including gender, age, household income, education level, health
insurance status, country of residence, and race was also collected.
Institutional Review Board (IRB) approval was obtained from the Louisiana Tech
University Human Use Committee.
Sample
Eligible participants for this study included persons who have been diagnosed by
a physician to have IBS, are 18 years of age or older, and reside in the United States.
Potential participants were excluded if they could not read and speak English (the survey
was only provided in English), completed less than 50% of the survey, have not been
diagnosed with IBS by a physician or if they have been diagnosed with additional
gastrointestinal diseases (with similar symptoms) such as Crohn’s Disease, Celiac
Disease, or Ulcerative Colitis. The target sample size was 250 participants. Subjects were
recruited via personal accounts on social media and the survey was posted in several
large public IBS Support Groups that are present on Facebook. Approximately 130
FODMAP diet trained dietitians were also contacted and asked to share the survey with
their patients.
Data Collection Instruments
Data collection was conducted via an online questionnaire using the Qualtrics
software. The Irritable Bowel Syndrome Quality of Life Questionnaire (IBS-QOL) was
included. A licensure agreement was provided by the Rome Foundation who developed
the IBS-QOL Questionnaire, which was signed, and permission was given to use the IBS-

29
QOL Questionnaire for this study. The IBS-QOL questionnaire includes a total of 34
items which assess quality of life of IBS patients and includes eight subscales: body
image or dysphoria, interference with activities, health worry, food avoidance, social
reactions, sexual health, and effect on relationships. Eight items assess dysphoria, 7 items
assess interference with activities, 4 items assess body image, 3 items assess food
avoidance, 4 items assess social reactions, 2 items assess sexual health, 3 items assess
effects on relationships, and 3 items assess health worry. The scores for the subscales
could range from 0-100, while the total quality of life scores could be over 100.
Demographic information included gender, age, household income, education level,
health insurance status, country of residence, how much spent monthly on IBS, and race.
The link to the questionnaire was posted on the researcher’s personal Facebook page,
Instagram account, the Phi Mu National Connection Facebook group, and was shared to
public IBS support groups on Facebook. Many of the participants were recruited from the
public IBS support groups on Facebook. FODMAP diet trained dietitians were also
contacted and asked to share the survey with their patients.
Data Collection Process
Institutional Review Board (IRB) approval was obtained from the Louisiana Tech
University Human Use Committee. An introduction social media post describing the
study (Appendix C) and a link that directs participants to the survey on the Qualtrics
website was shared on social media outlets including the researcher’s personal Facebook
page, Instagram account, the Phi Mu National Connection Facebook group, and to the
public IBS Support (Official) group on Facebook which currently has 72,300 members.
FODMAP diet trained dietitians were also contacted and asked to share the survey with

30
their patients. Participants were able to provide consent for participation in the study by
voluntarily completing the survey. The survey was open for approximately 9 weeks. Over
the course of the 9 weeks several follow up posts were made on the researcher’s personal
Facebook page and the IBS Support Groups on Facebook to recruit more participants.
After the survey was closed a technical error was found. It appeared that respondents
were able to select multiple responses to the 34 statements included in the IBS Quality of
Life Survey question matrix, which affected the ability to calculate quality of life scores
and subscale scores for those responses. In the cases where multiple responses were
selected the ones within 1 point of each other were averaged and those more than 1 point
apart were designated as a missing value. As an incentive, all participants were provided
the option to enter a drawing to win a $25.00 Amazon gift card by providing their email
or phone number on a separate survey that was not linked to their responses.
Data Analysis
The Scientific Package for Social Sciences (SPSS) BASE for Students was used
for statistical analysis (SPSS Statistics for Windows, Version 26.0., 2017). Descriptive
statistics for participants included age, race, and gender and were reported as frequencies
and were correlated with the quality of life scale and subscales. Hypotheses one and three
were tested using analysis of variance (ANOVA) test, hypothesis two was tested using a
t-test. A p-value of 0.05 (x ± SD; p < .05) was used to define statistical significance.
Surveys that were less than 50% complete were removed from the study data.

31
CHAPTER 4
RESULTS
Of the 293 responses to the survey, 192 responses were used for analysis. A total
of 39 responses were excluded for not meeting study criteria. An additional 54 responses
were excluded because the respondents have been diagnosed with another gastrointestinal
disorder; and 14 responses were excluded because they had not been diagnosed with IBS
by a physician. A total of 107 responses were excluded. There were 87 participants who
were diagnosed with IBS-D, 36 with IBS-C, 63 with IBS-M, and six were not sure which
type of IBS they have been diagnosed with.
Respondent Demographics
The majority of respondents were white, non-Hispanic (87.5%); female (92.2%);
between the ages of 18-35 (78.1%); and had completed a of college degree (75.6%)
(Table 4-1). Of the total population, approximately 51.1% of respondents were between
the ages of 18-25, 27.9% of respondents were between the ages of 26-35, 8.9% of
respondents were between the ages of 36-45, 4.7% of respondents were between the ages
of 46-55, and 7.4% were 56 or older. Since there were so few males that responded to the
survey the data was also analyzed using females only (Table 4-2)

32
Table 4-1
Demographics of Study Participants (N=192)
Gender
Male 6 (9.5%) 3 (8.3%) 5 (5.7%) 14 (7.3%)
Female 57 (90.5%) 33 (91.7%) 81 (93.1%) 177 (92.2%)
Prefer Not to Answer 0 (0%) 0 (0%) 1 (1.1%) 1 (0.5%)
Race
White, Non-Hispanic 54 (85.7%) 32 (88.9%) 76 (87.4%) 168 (90.3%)
White, Hispanic Origin 32 (3.2%) 4 (11.1%) 11 (12.6%) 17 (9.1%)
Other 7 (11.1%) 0 (0%) 0 (0%) 7 (3.8%)
Age
18-25 27 (43.5%) 23 (63.9%) 43 (50%) 97 (51.1%)
26-35 21 (33.9%) 4 (11.1%) 27 (31.4%) 53 (27.9%)
36-45 7 (11.3%) 4 (11.1%) 5 (5.8%) 17 (8.9%)
46-55 0 (0%) 3 (8.3%) 6 (7%) 9 (4.7%)
56+ 7 (11.3%) 2 (5.6%) 5 (5.8%) 14 (7.4%)
Education
Some High School, no
Diploma
0 (0%) 1 (2.9%) 0 (0%) 1 (0.06%)
High School Graduate or
GED
5 (8.2%) 1 (2.9%) 5 (6.3%) 12 (6.7%)
Trade/Technical/Vocational
Training
2 (3.3%) 0 (0%) 3 (3.8%) 5 (2.8%)
Some College Credit, no
Degree
13 (21.3%) 3 (8.8%) 10 (12.7%) 27 (15.2%)
Associate Degree 4 (6.6%) 4 (11.8%) 5 (6.3%) 13 (7.3%)
Bachelor’s Degrees 23 (37.7%) 14 (41.2%) 36 (45.6%) 76 (42.7%)
Master’s Degree 11 (18.0%) 11 (32.4%) 15 (18.9%) 38 (21.3%)
Professional Degree (MD,
DDS, PharmD, PhD, DCN)
3 (4.9%) 0 (0%) 5 (6.3%) 6 (3.4%)
Note. Some of the total numbers do not add up to 192 due to missing responses to survey questions.
Type of IBS IBS-M IBS-C IBS-D Total
n= 63 (%) n=36 (%) n=87 (%) n=192 (%)

33
Table 4-2
Demographics of Study Participants, Females Only (N=178)
Race
White, Non-Hispanic 70 (86.4%) 30 (90.9%) 48 (84.2%) 155
(87.6%)
White, Hispanic Origin 11 (13.6%) 3 (9.1%) 2 (3.5%) 16 (9.1%)
Other 0 (0%) 0 (0%) 7 (12.3%) 7 (3.3%)
Age
18-25 39 (48.1%) 22 (66.7%) 26 (46.4%) 87 (51.2%)
26-35 26 (32.9%) 3 (9.1%) 19 (33.9%) 48 (28.2%)
36-45 5 (6.2%) 4 (12.1%) 7 (12.5%) 16 (9.4%)
46-55 6 (7.4%) 3 (9.1%) 0 (0%) 9 (5.3%)
56+ 5 (6.2%) 1 (3%) 4 (7.1%) 10 (5.9%)
Education
Some High School, no
Diploma
0 (0%) 1 (3.2%) 0 (0%) 1 (0.06%)
High School Graduate or
GED
5 (6.8%) 0 (0%) 5 (9.1%) 10 (6.3%)
Trade/Technical/Vocational
Training
2 (2.7%) 0 (0%) 2 (3.6%) 4 (2.5%)
Some College Credit, no
Degree
8 (11%) 3 (9.7%) 11 (20%) 22 (13.8%)
Associate Degree 4 (5.5%) 3 (9.7%) 4 (7.3%) 11 (6.9%)
Bachelor’s Degrees 35 (47.9%) 13 (41.9%) 20 (36.4%) 68 (42.5%)
Master’s Degree 15 (20.5%) 11 (35.5%) 11 (20%) 37 (23.1%)
Professional Degree (MD,
DDS, PharmD, PhD, DCN)
5 (6.8%) 0 (0%) 2 (3.6%) 7 (4.4%)
Note. Some of the total numbers do not add up to 178 due to missing responses to survey questions.
Total Quality of Life Scores
Valid t-tests could not be run as too few males responded to the survey. Data
comparing the total quality of life scores among races, types of IBS, education levels, and
monthly spending on IBS were analyzed using an ANOVA (Tables 4-3 & 4-4). There
were no significant differences found between total quality of life scores between patients
Variable IBS-M IBS-C IBS-D Total
n= 81 (%) n=33 (%) n=57 (%) n=178 (%)

34
with genders, races, types of IBS, and education levels (Table 4-3). A significant
difference was found between the different groups based on how much money
participants spend monthly on treatments for/managing their IBS symptoms (F(4, 149)=
10.81, p= 0.000) (Table 4-3). As spending increased, the total IBS-QOL score decreased.
Data examining the effectiveness of Registered Dietitians in IBS patients was analyzed
using a t-test. There were no significant differences found between patients who had seen
a Registered Dietitian compared to patients who had not seen a Registered Dietitian and
those who found a Registered Dietitian to be beneficial versus those who did not (Table
4-5).

35
Table 4-3
ANOVA Comparing Irritable Bowel Syndrome Quality of Life Scores between , Races,
Types of IBS, Education Levels, and Monthly Spending Groups (N=164)
Race 1.28* 0.28
White, Non-Hispanic 146 56.21 ± 21.89
White, Hispanic Origin 14 47.40 ± 21.74
Other 4 47.98 ± 10.85
Type of IBS 0.76* 0.52
IBS-M 68 53.41 ± 23.67
IBS-C 32 58.72 ± 20.12
IBS-D 58 54.63 ± 20.38
Education 1.84* 0.08
Some High School, no
Diploma
1 75.00
High School Graduate or
GED
11 37.37 ± 29.93
Trade/Technical/Vocation
al Training
4 45.49 ± 26.03
Some College Credit, no
Degree
23 55.23 ± 20.42
Associate Degree 12 61.27 ± 23.79
Bachelor’s Degrees 65 56.87 ± 20.32
Master’s Degree 31 60.92 ± 16.64
Professional Degree (MD,
DDS, PharmD, PhD,
DCN)
7 54.83 ± 27.43
Amount Spent
Monthly on IBS
10.81* <0.0
$0-20 77 65.78 ± 18.50*
$21-50 44 50.51 ± 20.91*
$51-75 17 43.29 ± 16.39*
$76-100 9 43.09 ± 20.45*
Over $100 7 34.35 ± 21.94*
Note. Some of the total numbers do not add up to 164 due to missing responses to survey questions. One
Participant selected “Prefer not to answer” for gender. Six participants answered “Not Sure” when asked
what type of IBS. Seventeen participants did not answer the question regarding education level. Thirty-
eight participants did not answer the question regarding amount spent monthly on IBS. *p < 0.05
Variable Number of Total IBS QOL Score F p-value
Participants Mean ± SD

36
Table 4-4
ANOVA Comparing Irritable Bowel Syndrome Quality of Life Scores between Races,
Types of IBS, Education Levels, and Monthly Spending Groups; Females Only (N=153)
Race 1.15* 0.32
White, Non-Hispanic 135 55.92 ± 22.27
White, Hispanic Origin 14 47.40 ± 21.74
Other 4 47.98 ± 21.77
Type of IBS 1.05* 0.37
IBS-M 63 52.29 ± 23.87
IBS-C 31 59.33 ± 20.15
IBS-D 53 54.48 ± 20.86
Education 1.88* 0.077
Some High School, no
Diploma
1 75.00
High School Graduate or
GED
11 37.37 ± 29.93
Trade/Technical/Vocatio
nal Training
3 43.87 ± 31.63
Some College Credit, no
Degree
20 53.69 ± 20.35
Associate Degree 10 61.39 ± 24.38
Bachelor’s Degrees 62 57.14 ± 220.69
Master’s Degree 31 60.92 ± 16.64
Professional Degree
(MD, DDS, PharmD,
PhD, DCN)
6 50.37 ± 27.12
Amount Spent
Monthly on IBS
10.69* <0.01
$0-20 75 65.49 ± 18.65*
$21-50 40 48.70 ± 20.29*
$51-75 15 42.67 ± 17.39*
$76-100 7 42.65 ± 23.41*
Over $100 7 34. 35± 21.94* Note. Some of the total numbers do not add up to 153 due to missing responses to survey questions.
Variable Number of Total IBS QOL Score F p-value
Participants Mean ± SD

37
Table 4-5
T-Test Examining the Effect of Registered Dietitian on Quality of Life Scores in Patients
with IBS (N=156)
Seen a
Registered
Dietitian
0.49* 0.48
Have Seen 31 51.03 ± 20.53
Have Not Seen 125 56.19 ± 22.35
Effectiveness of
Registered
Dietitian
0.21 0.65
Beneficial 18 57.31 ± 19.60
Not Beneficial 10 43.24 ± 20.13 Note. Effectiveness of Registered Dietitian is a small population since only 31 respondents had seen a
Registered Dietitian.
Quality of Life Subscale Scores
There were too few males to run statistics to analyze the differences in quality of
life subscale scores between males and females.
The IBS quality of life subscale scores between patients with IBS-M, IBS-C, and
IBS-D were analyzed using an ANOVA (Tables 4-6 & 4-7). Patients with IBS-M, IBS-C,
and IBS-D were found to have a significant difference between their subscale scores for
the interference with activities subscale (F (3, 178)= 5.83, p= 0.001). Significant
differences between IBS-M, IBS-C, and IBS-D patients were also found in the body
image (F (3,185)= 3.61, p=0.014) and healthy worry (F (3, 183)= 4.83, p= 0.003)
subscales (Table 4-6). The results shown in (Table 4-6 & 4-7) reflect a negative impact of
Variable Number of Total IBS QOL Score F p-value
Participants Mean ± SD

38
IBS on quality of life to varying degrees in each of the subscales for IBS-M, IBS-C, and
IBS-D.
The IBS quality of life subscale scores among races were analyzed using
ANOVA (Tables 4-8 & 4-9). Significant differences between three subscale scores were
found among white, non-Hispanic; whites, Hispanic origin; and others (native
Americans, Asian/Pacific Islanders, Multi-racial, and Asian Indians). The three subscales
were dysphoria (F (2, 181)= 3.86, p=0.02, social reaction (F (2, 182)=3.23, p= 0.04), and
relationships (F(2, 184)= 3.58, p= 0.030) (Table 4-8).
Table 4-6
ANOVA Comparing Irritable Bowel Syndrome Quality of Life Subscale Scores between
IBS-M, IBS-C, and IBS-D of the Total Population (N=181)
Dysphoria 56.71 ± 27.12 55.06 ± 27.75 61.07 ± 24.90 55.01 ± 30.61 1.05* 0.37
Interference
with Activities
52.19 ± 25.65 50.69 ± 52.74 65.77 ± 22.39 45.11 ± 24.12* 5.83* 0.00
Body Image
56.98 ± 24.77
55.63 ± 25.86
47.74 ± 25.54
64.11 ± 21.21*
3.61*
0.01
Health Worry
55.10 ± 23.05
53.01 ± 24.91
45.83 ± 22.07
62.70 ± 18.88*
4.83*
0.03
Food
Avoidance
34.48 ± 28.00
34.51 ± 31.03
40.60 ± 24.93
30.75 ± 25.36
0.95*
0.41
Social
Reaction
54.32 ± 26.05
53.04 ± 27.03
59.82 ± 24.49
52.17 ± 26.05
0.89*
0.44
Sexual
65.26 ± 30.80
64.16 ± 31.89
60.59 ± 33.70
69.15 ± 28.19
0.66*
0.58
Relationships
68.18 ± 25.12
68.60 ± 25.43
69.56 ± 26.76
65.71 ± 24.44
0.62*
0.60
Note. Six participants answered “Not Sure” when asked what type of IBS diagnosis.
*Significant at p <0.05
IBS QOL Total IBS-M IBS-C IBS-D F p-value
Subscale n= 181 n=63 n=31 n=87
Score Mean ± SD Mean ± SD Mean ± SD Mean ± SD

39
Table 4-7
ANOVA Comparing Irritable Bowel Syndrome Quality of Life Subscale Scores between
IBS-M, IBS-C, and IBS-D of Females Only (N=152)
Dysphoria 56.85 ± 27.66 54.52 ± 28.19 62.78 ± 24.46 54.98 ± 28.15 1.30* 0.27
Interference
with Activities
52.31 ± 25.94 49.49 ± 25.71 68.25 ± 21.63 45.57 ± 24.57* 6.67* 0.00
Body Image
56.11 ± 24.84
54.38 ± 25.61
48.48 ± 26.56
62.89 ± 21.60*
2.64*
0.05
Health Worry
54.70 ± 22.79
52.54 ± 24.29
46.21 ± 22.95
61.98 ± 18.72*
4.02*
0.01
Food
Avoidance
34.24 ± 28.29
33.54 ± 31.04
40.28 ± 25.47
31.36 ± 26.14
0.74*
0.53
Social
Reaction
54.00 ± 26.15
52.10 ± 27.18
61.91 ± 24.24
51.17 ± 25.84
1.538
0.21
Sexual
65.43 ± 30.89
63.80 ± 31.52
62.31 ± 34.53
69.19 ± 28.64
0.47
0.70
Relationships
68.75 ± 25.04
69.12 ± 24.84
61.97 ± 26.34
65.15 ± 25.16
0.91*
0.44
Note. Six participants answered “Not Sure” when asked what type of IBS diagnosis.
*Significant at p <0.05
IBS QOL Total IBS-M IBS-C IBS-D F p-value
Subscale n= 152 n=63 n=36 n=53
Score Mean ± SD Mean ± SD Mean ± SD Mean ± SD

40
Table 4-8
ANOVA Comparing Irritable Bowel Syndrome Quality of Life Subscale Scores between
Whites, Non-Hispanic, Whites, Hispanic, and Others of the Total Population (N=192)
Dysphoria 56.71 ± 27.12 58.74 ± 26.32 44.24 ± 30.67 38.39 ± 26.19* 3.86* 0.02
Interference
with
Activities
52.19 ± 25.65 53.45 ± 25.60 43.81 ± 24.83 39.29 ± 25.56 1.77* 0.17
Body Image
56.98 ± 24.77
57.27 ± 24.57
47.79 ± 24.99
56.98 ± 24.77
2.82*
0.06
Health Worry
55.10 ± 23.05
55.38 ± 23.75
50.00 ± 17.48
61.11 ± 14.59
0.61*
0.54
Food
Avoidance
34.48 ± 28.00
35.66 ± 27.73
27.45 ± 31.7
23.81 ± 23.78
1.19*
0.30
Social
Reaction
54.32 ± 26.05
56.13 ± 25.72
41.91 ± 24.88
40.63 ± 28.98*
3.23*
0.04
Sexual
65.26 ± 30.80
65.59 ± 30.96
58.82 ± 31.80
73.21 ± 25.44
0.61*
0.54
Relationships
68.18 ± 25.12
69.94 ± 24.79
57.60 ± 26.20
50.00 ± 19.00*
3.58*
0.03
Note. The other category included Native American, Asian/Pacific Islander, Multi-Racial, Asian Indian,
and other.
*Significant at p < .05
IBS QOL Total White, Non- White, Other F p-value
Score Hispanic Hispanic
n= 192 n=168 n=17 n=7
Mean ± SD Mean ± SD Mean ± SD Mean ± SD

41
Table 4-9
ANOVA Comparing Irritable Bowel Syndrome Quality of Life Subscale Scores between
Whites, Non-Hispanic, Whites, Hispanic, and Others of Females Only (N=153)
Dysphoria 56.85 ± 27.66 59.09 ± 26.87 44.24 ± 30.67 38.39 ±26.19* 3.838 0.02
Interference
with Activities
52.31 ± 25.94 53.68 ± 25.83 43.37 ± 25.71 39.29 ± 25.56 1.81* 0.17
Body Image
56.11 ± 24.84
56.21 ± 24.58
48.05 ± 25.79
75.00 ± 21.65
2.63*
0.08
Health Worry
54.70 ± 22.79
54.80 ± 23.53
51.11 ± 17.50
61.11 ± 14.59
0.42
0.66
Food
Avoidance
34.24 ± 28.29
35.64 ± 28.02
25.52 ± 31.7
23.81 ± 23.78
1.43*
0.24
Social
Reaction
53.99 ± 26.15
55.93 ± 25.73
41.02 ± 25.41
40.63 ±28.98*
3.25*
0.04
Sexual
65.43 ± 30.89
65.71 ± 30.99
59.38 ± 32.76
73.21 ± 25.44
0.53
0.59
Relationships
68.75 ± 25.04
70.72 ± 24.53
57.29 ± 27.02
50.00 ±19.00*
3.95*
0.02
Note. The other category included Native American, Asian/Pacific Islander, Multi-Racial, Asian Indian,
and other.
*Significant at p < .05
IBS QOL Total White, Non- White, Other F p-value
Score Hispanic Hispanic
n= 153 n=135 n=14 n=4
Mean ± SD Mean ± SD Mean ± SD Mean ± SD

42
CHAPTER 5
DISCUSSION
This study examined the potential differences in quality of life scores between
patients with IBS-M, IBS-C, and IBS-D. Approximately half of respondents to this
survey suffer from IBS-D, while the smallest number suffer from IBS-C. Other studies
have found that the percentage of IBS suffers who have each type varies widely, but it is
estimated that approximately 1/3 of IBS participants suffer from IBS-M, 1/3 suffer from
IBS-C, and 1/3 suffer from IBS-D (Corsetti & Whorwell, 2017; Nellesen, et al., 2013;
Singh et al., 2015).
A large majority of the respondents to this survey were female. These findings
align with many other studies which have found that more females suffer from IBS than
males (Anbardan et al.; Kosako, Akiho, Miwa, Kanazawa, & Fukudo, 2018; Ladabaum et
al., 2011; 2012 Lovell & Ford, 2012; Pan, Chang, Su, & Tsai, 2016). The higher
occurrence of IBS diagnosis in females may be associated with stress levels and
emotional distress. According to the American Psychological Association (2012) women
report higher stress levels and are more likely than men to report physical and emotional
symptoms of stress. Psychological and emotional stress are very important factors in the
development of IBS and severity of symptoms (Jerndal et al., 2010; Lackner et al., 2010 ;

43
Lee et al., 2015; Mykletun et al., 2010; Qin, Cheng, Tang, & Bian, 2014). Gulewitsch et
al. (2013), reports that approximately 94% of IBS patients suffer from a psychological
condition such as generalized anxiety disorder or depression. Additional studies have also
found that a significant number of IBS patients suffer from psychological disorders and
emotional stress (Kabra & Nadkarni, 2013; Mykletun et al., 2010). Males had lower
mean scores in the dysphoria, interference with activities, food avoidance, sexual, and
relationships subscale categories. Females had lower mean scores in the body image,
health worry, and social reaction categories.
Slightly over half of the participants in this study were between the ages of 18-25
years, while another quarter were between the ages of 26-35 years. These results differ
from other studies that have found the mean age of IBS diagnosis to be 46 years and that
the incidence of IBS diagnosis increases with age (Ladabaum et al., 2011; Pan, Chang, Su
& Tsai, 2016). The increased number of responses in the 18-25 category may be related
to the way the survey was shared. Because personal social media was used, the education
levels and ages of the respondents may not be reflective of the general IBS population.
The survey was also shared to multiple IBS Support groups on Facebook that include
members of all ages, so these groups likely contributed many of the responses from
participants over the age of 25 years. The education levels of the respondents also may be
related to how the respondents were recruited. A large majority of the participants had
received some type of college degree. Many of the friends on the researcher’s personal
Facebook page have received a college degree, while all of the members of the sorority’s
national connection page were either in college or had graduated from college.

44
This study found that IBS had a negative impact of the quality of life of
respondents. While the quality of life subscale scores varied between groups it was
evident that IBS negatively impacted all patients in each of the eight subscale categories.
The total IBS quality of life scores and subscale scores had a range of 0-100. Overall, the
IBS-C group had the highest total quality of life scores (113.86 ± 27.37), only having
lower subscale scores than the IBS-M or IBS-D groups in three categories (body image,
health worry, and sexual). Lower scores in the body image category from patients with
IBS-C may be related to abdominal distension and bloating which are the predominant
symptoms of IBS-C (Nellesen, Yee, Chawla, Lewis, & Carson, 2013). Abdominal
distension and bloating can significantly impact the outward appearance of the abdomen
which often negatively impacts body image. IBS-C also may cause abdominal pain,
nausea, and severe constipation (Nellesen, Yee, Chawla, Lewis, & Carson, 2013). These
symptoms may contribute to health worry in patients with IBS-C because they may feel
concerned about the reasons their bowels move slower than normal. Constipation, gas,
bloating, pain, feelings that the bowels are unable to empty completely, and rectal
bleeding (which can be attributed to straining due to difficulty during bowel movements)
are also signs of colon cancer, bowel obstructions, and rectal cancer (Mayo Clinic, 2021).
These symptoms can be frightening to patients especially if they are severe and chronic in
nature.
Registered dietitians can potentially have a significant impact on the quality of
life for patients with IBS. Many IBS patients attribute some of their GI symptoms to the
consumption of certain foods. Since registered dietitians are experts in food and nutrition,
they can work with patients to identify foods that may be causing issues, or they can help
45
them follow the low FODMAP diet if their symptoms are severe enough. Dietitians can
become certified in the low FODMAP diet, so these dietitians specifically could be very
beneficial. The quality of life scores for food avoidance were the lowest for each type of
IBS showing that food avoidance has a significant impact on quality of life in IBS
patients.
The IBS-D group had the lowest scores in the interference with activities, food
avoidance, social reaction, and relationships subscales, indicating a higher impact of IBS-
D on these subscales. They had the highest scores in the body image, health worry, and
sexual subscales, indicating a lesser impact of IBS-D on these subscales. Increased bowel
frequency and diarrhea can affect the abilities of patients to participate in normal daily
activities such as, work, travel, and exercise (Lacy, 2016). One can assume that impaired
abilities to participate in daily activities can have negative impacts on relationships and
social interactions. Patients with IBS often contribute their GI symptoms with diet and
certain foods. Patients with IBS-D report a lower quality of life related to the burden of
food avoidance (Singh et al., 2015). The increased food avoidance in patients with IBS-D
may be related to patient or physician driven diet changes aimed at reducing frequency
and severity of symptoms. The IBS-M group quality of life subscale scores fell between
the scores of the IBS-C and IBS-D groups in all categories. This is likely because patients
with IBS-M experience both constipation and diarrhea, so their perceived quality of life
may vary based on the symptoms currently being experienced.
A large majority of the study respondents were white, non-Hispanic (87.5%)
which may be attributed to where participants were recruited from to complete the
survey. Those of Hispanic origin made up 8.9% of the remaining survey respondents

46
while Native Americans, Asian/Pacific Islanders, multi-racial, and Asian Indians were
grouped into the “Other” category which accounted for the last 3.6% of respondents.
Significant differences were found between Hispanics; White, Non-Hispanics; and the
other group for the dysphoria, social reaction, and relationships subscales. White,
Hispanic respondents had higher mean scores than the two other groups in all three of
these subscales. The lower mean subscale scores for respondents of Hispanic origin in the
social reaction and relationship categories are interesting because it has been reported that
people of Hispanic origin often feel obligated to ask for encouragement and advice about
health issues from many family members (Caballero, 2011). These feelings of obligation
and loyalty to their family may cause stress or emotional distress because they may feel
they must consult family members prior to making health-related decisions (Caballero,
2011).
Respondents in the “Other” category had the lowest mean scores in the dysphoria,
interference with activities, food avoidance, social reaction, and relationship subscales.
The white, non-Hispanic group had the highest scores in the dysphoria, interference with
activities, body image, food avoidance, social reaction, and relationships subscales. Many
studies have found significant racial disparities in health care between white, non-
Hispanic people and people of color, so these healthcare disparities may contribute to the
higher quality of life subscale scores in white, non-Hispanic people (Cook, McGuire, &
Zaslavsky, 2012; Lau, Lin, & Flores, 2012; Williams & Wyatt, 2015; Derose, Gresenz, &
Ringel, 2011).
Monthly spending related to IBS treatment and symptom management also seems
to contribute to quality of life in patients. A majority of the participants in this study
47
reported spending $0-50 per month related to their IBS treatments, medications, etc.
According to the American Psychological Association (2015), money is the leading cause
of stress for Americans. Stress is likely the reason why total quality of life scores were
lower in this study for participants who reported spending $51 to over $100 per month on
IBS related costs. The higher spending related to IBS may also be related to severity of
symptoms because they may be spending more on medications or treatments to manage
symptoms, which may also contribute to the lower quality of life scores in this group.
The total quality of life scores were the highest in the group who reported spending $0-20
per month, while they were significantly lower in the group who reported spending over
$100 per month. Emotional and psychological stress are strongly related to the severity
and development of IBS symptoms, so it is understandable that as financial burden
increases, stress levels may also increase, which may increase severity of IBS symptoms
causing reduced quality of life (Jerndal et al., 2010; Lackner et al., 2010 ; Lee et al.,
2015; Mykletun et al., 2010; Qin, Cheng, Tang, & Bian, 2014).
Education levels of patients with IBS may also contribute to reported quality of
life. In this study most of the groups with higher education levels reported higher total
quality of life scores when compared to the groups with lower education levels. One
exception is the “Some High School, no diploma” category which reported the highest
total quality of life score out of all the groups, but there was only one respondent in that
category so overall this may be not be indicative of the quality of life of people in this
group. The higher quality of life scores in the groups with higher education levels may be
related to having more money or access to resources and healthcare to help manage IBS
symptoms. In 2019 the U.S. Bureau of Labor reported that people with a college degree

48
earn an average of 61% more money than people without a college degree. Often
employers that require a college degree offer health insurance to their employees (Abel &
Deitz, 2014). Lack of adequate health insurance can lead to significant levels of
insecurity for people, so this may also affect quality of life in IBS patients with lower
education levels.
There were a few limitations to the current study. All survey responses were self-
reported, so it is possible that some respondents may have contributed inaccurate data. It
is also possible that respondents accidentally skipped certain questions or selected an
incorrect answer choice. The use of an electronic survey also may have been geared
toward the younger or more tech savvy population. Secondly, the survey was initially
shared primarily on the social media platform of Facebook. While the survey was shared
to a large number of IBS patients through IBS Support groups present on Facebook it is
possible that many of the group members have group notifications turned off or do not
check the group often for new posts. Another limitation of the survey recruitment being
on social media is that the older IBS population may not have been reached. Late in the
process of survey sharing many FODMAP diet trained dietitians were contacted and
asked to share the survey link with their clients. Many of these dietitians agreed and
shared the link, so it likely would have been very beneficial to utilize this recruitment
method initially. Additionally, the respondents were primarily white, non-Hispanic and
between the ages of 18-25 which is not reflective of the general population of IBS
patients. There were only 14 male respondents out of the 192 total responses used for
data analysis, so this limited the statistical analysis of the differences in quality of life
scores between males and females.

49
This study also had several strengths. This study included many demographic
questions along with the IBS Quality of Life questionnaire (IBS-QOL) questions that are
not included in many previous studies using the IBS-QOL questionnaire. This study
compared the quality of life total scores and subscores between all three types of IBS,
while many studies focus on IBS-D and IBS-M. This study also compared the quality of
life subscale scores between the different races which to date has not been seen in the
literature using this questionnaire.

50
APPENDIX A
DATA COLLECTION INSTRUMENT LICENSEE AGREEMENT

51
CONTENT LICENSE AGREEMENT
This LICENSE AGREEMENT ("Agreement"), effective as of 21st day of August
2020 (“Effective Date”), by and between the Rome Foundation, Inc. (“ROME” or
“Licensor”), an organization with offices at 14460 Falls of Neuse Rd. Ste. 149-116 Raleigh,
NC 27614, USA and Hailey Hutchison (“Licensee”):
RECITALS
WHEREAS, ROME owns or has the right to license certain images, tables, and related ancillary
materials (“Content”);
WHEREAS, Licensee uses the Rome IV content in Exhibit A.
WHEREAS, Licensee desires to license Content from ROME;
WHEREAS, ROME is willing to provide Licensee with a license, pursuant to the terms and
conditions of this Agreement; and
NOW THEREFORE, the parties agree as follows:
AGREEMENT
1. Grant of License.
1.1. Grant. Subject to the terms and conditions of this Agreement, and during the Term
of this Agreement, ROME grants to Licensee a nonexclusive, non-transferable, nonassignable
(except for as provided herein) license (“Licensee”) to the Content described
in Exhibit A.
ROME acknowledges that the Study may be conducted by Licensee, its affiliates and/or
their contractors and agrees that the rights granted to Licensee under this Agreement will
also benefit to such affiliates and contractors only to the extend necessary for the conduct
of the study.
ROME acknowledges that Licensee may have to communicate the instrument to ethics
committees, Institution Review Boards or any regulatory authorities to conduct the Study
and ROME hereby authorizes such communication.
Usage. The License shall be limited to the purpose of using the IBS-QOL to study the Quality
of Life in each type of IBS (IBS-D, IBS-C, IBS-M). I plan to compare the quality of life scores
(the “Licensee Course”). Usage by Licensee shall further be limited by Licensor’s Right of
Editorial Control. No deletions, alterations, or changes may be made to the Content without the
written consent of ROME.
1.2 . Right of Editorial Control. In the event ROME believes in its sole discretion that
a particular use of, access by, or display by or of Content by Licensee will have an
adverse effect on the image or reputation of ROME, Licensee shall modify such
use, access, or display of the Content to address ROME's concerns.
1.3 . Reservation of Rights. All other rights with respect to the Content (including any
reproductions or derivative works thereof), whether now existing or which may
hereafter come into existence, which are not expressly granted to Licensee herein,
are reserved in ROME.
2. Term and Termination.
Term. The initial term (“Term”) of this Agreement shall cover the duration of
use specified in Section 1.1 from the Effective Date. There is no term end, as long
as the usage is specific to that outlined in Section 1.1 (Usage).
2.1. Renewal. This contract covers the duration of this particular use specified in
Section 1.1 and ends when this intended use is completed.
2.2. Termination. Any party may terminate this Agreement:
2.2.1. if there is a material breach, and such breach is not cured within ten (10)
days of receipt of notice concerning such breach; or
2.2.2. for any reason or no reason, in its discretion, by giving to the other party
sixty (60) days' written notice; or
2.2.3. if a party enters bankruptcy proceedings; or if a party ceases to operate or

52
becomes insolvent.
2.3. Obligations Upon Termination or Expiration. Upon expiration or termination of
this Agreement, Licensee shall (i) immediately cease using, accessing, displaying or
otherwise making available all Content; (ii) within ten (10) days after expiration or
termination, destroy or render inaccessible Content provided by ROME, in any and all
forms, along with a written certification that all such materials have been destroyed or
rendered inaccessible; and (iii) within ten (10) days after termination or expiration, pay to
ROME all sums then owed and outstanding. Upon termination or expiration of this
Agreement, all rights granted herein shall automatically revert to ROME without further
notice.
3. Fees/Royalties.
3.1. Flat Fee. In consideration of the License granted in this Agreement,
Licensee shall pay to ROME a fee of $0.00 USD for this period and upon signature of the
agreement.
3.2. Billing and Payment. For faster processing time, a wire is preferred over mailing
a check. Wire instructions can be found below. If additional invoice needs to be created for the
Licensee, the Rome Foundation will provide this within 10 (ten) days of this agreement being
executed and upon validation of the License. Licensee agrees to pay the invoice within 30 days of
receipt. The payment shall be sent to the Rome Foundation at the wire instructions below, or by
mail to 14460 Falls of Neuse Rd. Ste. 149-116 Raleigh, NC 27614. The Fees shall be exclusive of
any sales, use, value added, withholding or similar tax and the Licensee shall be liable for any
such
taxes.
ROME FOUNDATION WIRING INSTRUCTIONS BANK NAME: WELLS FARGO BANK, N.A.
BANK ADDRESS: For Domestic (US) wires: 420 MONTGOMERY
STREET, SAN FRANCISCO,
CA 94104
For International wires: 525 MARKET STREET, SAN FRANCISCO, CA 94105
BANK PHONE: 919-881-6435 INCOMING WIRE ROUTING/ABA: 121000248 BENEFICIARY: ROME FOUNDATION BENEFICIARY ACCOUNT NUMBER: 2000057776084 BENEFICIARY ADDRESS: 14460 Falls of Neuse Rd. Ste. 149-116 Raleigh, NC 27614. SWIFT CODE: WFBIUS6S (REQUIRED FOR INTERNATIONAL WIRES) 4. Proprietary Rights.
4.1. Ownership. Licensee acknowledges and agrees that the Content is and shall remain
the exclusive property of ROME. Licensee shall not reproduce, copy, sell, sublicense,
lease, display, perform, modify, transfer or distribute the ROME Content and any
derivative works thereof, other than as expressly permitted by this Agreement.
4.2. Copyright Notice. All Content (including any promotional materials in which the
Content or ROME Marks appear) shall bear the following copyright notice (or other
reasonable notices requested by ROME):
4.2.1. Images: “Copyright (or ©) 2000 Rome Foundation, Inc. All Rights Reserved.”
4.2.2. Reprints: “Reprinted with permission from the Rome Foundation; all rights
reserved.”

53
4.3. Trademark Usage. Neither party shall use any of the other’s marks, logos or other
identifiers (“Marks”) in any manner, without the trademark owner’s prior written
approval. The parties reserve the right to review any proposed use of their
respective Marks and to require changes in such further use, and the other agrees to
comply with any such requirements. Each party acknowledges and agrees that: (i)
it shall not use the other’s Marks in a manner likely to diminish the Marks’
commercial value; (ii) it shall not knowingly permit any third party to use the
other’s Marks unless authorized to do so in writing; (iii) it shall not knowingly use
or permit the use of any mark, name, or image likely to cause confusion with the
other’s Marks; (iv) all goodwill associated with use of the Marks shall inure to the
party owning the Marks; (v) the Marks are and shall remain the sole property of
their owner; (vi) nothing in this Agreement shall confer in either party any license
rights or right of ownership in the other’s Marks (and Licensee shall not make any
representation to that effect), or use the other’s Marks in a manner that suggests
that such rights are conferred.
4.4. Breach or Threatened Breach. In the event of a breach or a threatened breach of
any of the provisions of this Section, Licensee acknowledges that a breach or
threatened breach shall result in irreparable harm to ROME, and ROME shall be
entitled to seek a preliminary injunction restraining any such person or entity from
such breach. Nothing contained herein shall be construed as prohibiting ROME
from pursuing such other remedies as may be available to ROME for any such
breach.
5. Confidential Information.
5.1. Definition. Each party acknowledges that it may be exposed to certain information
that is not generally known to the public and that would be considered confidential
and proprietary by the other party (“Confidential Information”). Confidential
Information includes, without limitation, all competitively sensitive or secret
business, marketing and technical information disclosed by one party to another,
such as proposed products and services, affiliate and customer lists, strategic and
tactical business planning materials, sales and technical training materials,
information disclosed in customer conferences, meetings and seminars, materials
obtained from the password protected portion of any party’s web sites or other web
sites utilized in connection with this Agreement, source code, development-level
documentation and similar technical information and the contents of this
Agreement. In addition, the financial terms of this Agreement shall be
considered Confidential Information. Confidential Information does not include
such portions of any disclosed information which: (i) are or become generally
available to the public other than as a result of a disclosure by a party or any of its
agents, representatives, affiliates, employees or consultants in violation of its or
their obligations of confidentiality hereunder; or (ii) become available to a party on
a non-confidential basis from a source which is not prohibited from disclosing such
information to that party by a legal, contractual or fiduciary obligation to the other
party.
5.2. Confidentiality Obligation. Each party agrees that, with respect to received
Confidential Information, it (i) shall protect such Confidential Information from
unauthorized disclosure using the highest commercially reasonable standard of
care, (ii) shall not disclose such Confidential Information to any third party except
the party’s lawyers, accountants, underwriters and other professionals, and (iii)
shall not use such Confidential Information (other than as specifically authorized
by this Agreement) without the prior written consent of the other party. These
mutual obligations with respect to Confidential Information shall continue for the

54
shorter of five (5) years following the date of termination of this Agreement, or
until such information becomes publicly known other than by breach of this
Agreement by any party. Within five (5) calendar days after a party’s request, or
upon termination of this Agreement, all materials or media containing any
Confidential Information shall either be returned to the originating party or
destroyed by the other party, at the originating party’s sole discretion, and each
party agrees to certify its compliance with such obligation upon the request of the
other party.
5.3. Compelled Disclosure. In the event that a party or anyone to whom that party
transmits Confidential Information pursuant to this Agreement becomes legally
compelled to disclose any of the Confidential Information (“Compelled Party”),
the Compelled Party will provide the other party (“Furnishing Party”) with
prompt notice thereof so that the Furnishing Party may seek a protective order or
other appropriate remedy or waive compliance with the provisions of this
Agreement. In the event that such protective order or other remedy is not obtained
by the Furnishing Party or the Furnishing Party waives compliance with the
provisions of this Agreement, the Compelled Party will furnish or cause to be
furnished only that minimum portion of the Confidential Information which the
Compelled Party is legally required to furnish and will exercise commercially
reasonable efforts to obtain reliable assurances that confidential treatment is
accorded the Confidential Information so furnished.
6. Representations and Warranties.
6.1. ROME warrants and represents that it has the right and authority to enter into this
Agreement and to grant the rights in the Content set forth herein, subject to the
limitations and exclusions set forth herein; and that the Content does not and shall
not infringe upon the rights or interests of any third party.
6.2. Licensee represents and warrants that it has the power and authority to enter into
this Agreement and to perform its obligations and, upon execution and delivery
hereof, this Agreement shall constitute the valid and binding obligations of
Licensee enforceable in accordance with its terms.
6.3. CONTENT IS PROVIDED “AS IS” WITHOUT WARRANTY OF ANY KIND.
LICENSEE EXPRESSLY AGREES THAT ITS RECEIPT AND USE OF THE
CONTENT IS AT LICENSEE’S SOLE RISK, AND THAT THE ENTIRE RISK
AS TO SATISFACTORY QUALITY, PERFORMANCE, ACCURACY AND
EFFORT IS WITH LICENSEE. LICENSOR HEREBY DISCLAIMS ALL
WARRANTIES, WHETHER EXPRESS, IMPLIED OR STATUTORY, WITH
RESPECT TO THE CONTENT. LICENSOR SPECIFICALLY DISCLAIMS THE
IMPLIED WARRANTIES OF MERCHANTABILITY, FITNESS FOR A
PARTICULAR PURPOSE, ACCURACY, AND THOSE ARISING FROM A
COURSE OF DEALING OR USAGE OF TRADE.
7. Indemnification.
7.1. By ROME. ROME shall defend, indemnify and hold harmless Licensee from and
against any claims, actions or demands, alleging or resulting from the breach of any
of ROME’s obligations, covenants, representations or warranties under this
Agreement.
7.2. By Licensee. Licensee shall defend, indemnify and hold harmless ROME, its
officers, employees, shareholders, directors, managers, members and suppliers, and
those of its affiliates including parent companies and subsidiaries, from and against
(i) any damages or liability of any kind arising from any use of Content other than
the uses expressly permitted by this Agreement, and (ii) any claims, actions or
demands, alleging or resulting from the breach of any of Licensee’s obligations,

55
covenants, representations, or warranties under this Agreement.
8. Limitation of Liability.
8.1. Limitation of Liability. Other than the indemnification obligation set forth herein,
ROME shall have no liability or responsibility for claims or actions caused by or
arising from use, access, or display of the Content not in accordance with this
Agreement, that arise out of Licensee equipment malfunction or negligence, or that
arise from the use, access or display of the Content in conjunction with products,
platforms, or materials not provided by Licensee in accordance with this
Agreement. NOTWITHSTANDING THE FAILURE OF THE ESSENTIAL
PURPOSE OF ANY REMEDY, IN NO EVENT WILL ROME BE LIABLE FOR
ANY INDIRECT, INCIDENTAL, OR CONSEQUENTIAL DAMAGES
(INCLUDING, WITHOUT LIMITATION, DAMAGES ASSOCIATED WITH
LOSS OF PROFITS, LOSS OF BUSINESS OPPORTUNITIES OR LOSS OF
GOODWILL) EVEN IF ADVISED OF THE POSSIBILITY OF SUCH
DAMAGES, OR FOR ANY MATTER BEYOND ITS REASONABLE
CONTROL, IN EACH CASE REGARDLESS OF THE FORM OF THE CLAIM
OR THE THEORY OF RECOVERY. TOTAL CUMULATIVE LIABILITY FOR
ALL CLAIMS ARISING OUT OF OR RELATED TO ANY SUBJECT MATTER
OF THIS AGREEMENT, REGARDLESS OF THE FORM OF THE CLAIM OR
THE THEORY OF RECOVERY, WILL IN NO EVENT EXCEED US$10,000.
9. PROVISIONS RELATING TO THE FDA REGULATION
Pursuant to the U.S. regulation called the federal food drug and cosmetics act as amended
by the generic drug enforcement act of 1992 (GDEA), ROME represents, warrants and
covenants to Licensee as follows:
(i) to the best of its knowledge at the time of signing the Agreement neither it nor any
individual employed or engaged by ROME have ever been and are not currently
(a) under investigation for debarment or debarred by any relevant health authority
for debarment action (as detailed in the section 306 of the GDEA of 1992),
(b) excluded by any relevant agency for debarment action (as detailed in the
section 306 of the GDEA of 1992),
(c) otherwise disqualified or restricted by the FDA or any other regulatory
authority, nor will ROME knowingly utilize any debarred, excluded or
disqualified personnel to perform services hereunder;
(ii) it will notify Licensee immediately in writing in the event any investigation or
proceeding for debarment, exclusion or disqualification is initiated against ROME
or any employee or personnel during the term of the Agreement or within one (1)
year following its expiration or termination;
(iii) its employees or contractors are, and will continue to be, qualified and have, and
will continue to have, sufficient technical expertise to perform ROME’s obligations
under this Agreement and will require such for other personnel; if ROME, or any
of its employees or contractors involved in the services, or any other person or
organization used by ROME in connection with the services should become
debarred, disqualified or excluded during the term of this Agreement or within one
(1) year following its expiration or termination, provider agrees to notify Licensee
promptly in writing.
10. MISCELLANEOUS
10.1 Survival. Sections of this Agreement relating to Confidential Information,
Indemnification, Limitation of Liability, and Representations and Warranties shall
survive the expiration or termination of this Agreement.
10.2 Waiver. Any waiver by either party of its rights under this Agreement shall not
constitute a waiver of any other rights hereunder.

56
10.3 Assignment. Licensee shall not assign this Agreement or any of its rights hereunder
or delegate any of its obligations hereunder except with the prior written consent of
ROME, except if such assignment is made to the benefice of one of its affiliates.
10.4 Excusable Delay. If, for any reason beyond its control, either party is unable to
comply with its responsibilities under this Agreement, then performance by that
party shall be excused until the reason for such inability ceases to exist. In such
circumstances, each party shall use its best efforts to comply with the essential
portions of this Agreement. In the event that such inability shall exist for a period
of at least thirty (30) days, the parties shall meet to negotiate a resolution of any
such existing performance problems. If the parties fail to negotiate a resolution
within thirty (30) days, the Agreement may be terminated at the option of either
party.
10.5 Jurisdiction. Any legal action or proceeding concerning the validity, interpretation
and enforcement of this Agreement, matters arising out of or related to this
Agreement or its making, performance or breach, or related matters shall be brought
exclusively in the federal or state courts of the State of North Carolina having
jurisdiction, and all parties consent to the exclusive jurisdiction of those courts,
waiving any objection to the propriety or convenience of such venues. The United
Nations Convention on Contracts for the International Sale of Goods does not apply
to or otherwise affect this agreement. The validity, interpretation and enforcement
of this Agreement, matters arising out of or related to its making, performance or
breach, and related matters shall be governed by the internal laws of the State of
North Carolina (without reference to choice of law doctrine). Licensee agrees that
service of process in any actions, controversies, and disputes arising from or
relating to this Agreement may be effected by mailing a copy thereof by registered
or certified mail (or any substantially similar form of mail), postage prepaid, to the
other party however, nothing herein shall affect the right to effect service of process
in any other manner permitted by law. The invalidity or unenforceability of any
part of this Agreement shall not affect the validity or enforceability of the balance
hereof.
10.6 Illegal Provision. If any covenant or other provision of this Agreement is invalid,
illegal, or incapable of being enforced by reason of any rule of law, administrative
order, judicial decision or public policy, all other conditions and provisions of this
Agreement shall, nevertheless, remain in full force and effect. The parties shall
make changes to this Agreement as are necessary to cure the invalidity, consistent
with the original objectives of the parties.
10.7 No Partnership or Joint Venture. Nothing in this Agreement or the relations
between the parties to this Agreement shall be construed to constitute a partnership
or joint venture between or among the parties to this Agreement. Licensee shall
have no right or authority to bind or obligate ROME in any manner whatsoever and
shall not expressly or impliedly incur any liability or obligation on behalf of
ROME.
10.8. Notices. Any notice or demand required or permitted by this Agreement shall be in
writing and shall be deemed given when received by the parties at the address set
forth above.
10.9. Counterpart Execution. This Agreement may be executed by the parties on any
number of separate counterparts, and all such counterparts so executed constitute
one agreement binding on all the parties notwithstanding that all the parties are not
signatories to the same counterpart.
10.10. Entire Agreement. This Agreement contains the entire agreement and
understanding between the parties and may not be modified or amended except by

57
written agreement executed by both of the parties.
IN WITNESS WHEREOF, each of the parties has caused a duly authorized officer or
agent to execute this Agreement as of the dates set forth below.
ROME FOUNDATION, INC. Hailey Hutchison Registered Dietitian 8/21/2020
Johannah Ruddy M. Ed.
Executive Director
August 21, 202

58
APPENDIX B
DATA COLLECTION INSTRUMENT
AND
DATA COLLECTION INSTRUMENT SCORING INSTRUCTIONS

59
Quality of Life in Persons with IBS
Start of Block: Default Question Block
Q1 The following is a brief summary of the project in which you are asked to
participate. Please read this information before continuing on to the survey.
PURPOSE OF STUDY/PROJECT: The purpose of this study is to examine the
differences in the effects of irritable bowel syndrome (IBS) on the quality of life in
patients with each of the three types of IBS: IBS-Diarrhea (IBS-D), IBS-Constipation
(IBS-C), and IBS-Mixed (IBS-M).
PROCEDURE: You have been directed to this survey by clicking on the link provided
via a social media post. The survey will take approximately 10-15 minutes to
complete.
RISKS/ALTERNATIVE TREATMENTS: This is a descriptive study therefore there are
no risks to subjects in the study. As with all online survey tools, the server may collect
information and your IP address indirectly and automatically via “cookies”.
BENEFITS/COMPENSATIONS: There are no direct benefits to participating in this
survey. I attest by clicking “Yes I am over 18 years of age and agree to participate in
the study” below that I have read and understood the following description of the study
“Assessing and Comparing Quality of Life Scores in Patients with Irritable Bowel
Syndrome-Diarrhea, Irritable Bowel Syndrome-Constipation, and Irritable Bowel
Syndrome-Mixed” and its purposes and methods. I understand that my participation
and refusal to participate in this study will not affect my relationship with Louisiana Tech
University. Further, I understand that I may withdraw at any time and refuse to answer
any questions without penalty. Upon completion of the study, I understand that the
aggregated results will be freely available to me upon request. I understand that the
results of the material will be confidential, accessible only to the principal investigators,
myself or a legally appointed representative. I have not been requested to waive nor do I
wave any of my rights related to participating in this study.
If you have any questions or concerns about completing the survey or being in this
study you may contact Hailey Hutchison, Graduate Student, at [email protected]
or Dr. Vicky Green, faculty advisor, at [email protected].
Members of the Human Use Committee of Louisiana Tech University may also be
contacted if a problem cannot be discussed with the experimenters: Dr. Richard Kordal,

60
Director, Office of Intellectual Property & Commercialization Ph: (318) 257-2484, Email:
o Yes I am over the age of 18 and agree to participate in this survey (1)
o I do not agree to participate in the survey (2)
Skip To: End of Survey If The following is a brief summary of the project in which you are asked to participate. Please rea... = I do not agree to participate in the survey
Q2 Have you been diagnosed with Irritable Bowel Syndrome (IBS) by a physician?
o Yes (1)
o No (2)
Skip To: End of Survey If Have you been diagnosed with Irritable Bowel Syndrome (IBS) by a physician? = No
Q3 Have you been diagnosed with any other Gastrointestinal Disorders such as: Celiac
disease, Ulcerative Colitis, Crohn's Disease?
o Yes (1)
o No (2)
Skip To: End of Survey If Have you been diagnosed with any other Gastrointestinal Disorders such as: Celiac disease, Ulcera... = Yes

61
Q4 Do you suffer from IBS-Mixed, IBS-Constipation, or IBS-Diarrhea?
o IBS-Mixed (1)
o IBS-Constipation (2)
o IBS-Diarrhea (3)
o Other (4)
o Not sure (5)
Q5 How long have you been experiencing IBS symptoms?
▼ less than 1 year (1) ... over 25 years (26)
Q6 How long have you been diagnosed with Irritable Bowel Syndrome (IBS)?
▼ less than 1 year (1) ... over 25 years (26)
Q7 Do you have a family history of Irritable Bowel Syndrome (IBS)?
o Yes (1)
o No (2)
o Not sure (3)

62
Q8 What is your sex?
o Male (1)
o Female (2)
o Other (3)
o Prefer not to answer (4)
Q9 What is your race?
o White, Non-Hispanic origin (1)
o White, Hispanic origin (2)
o Black or African American, Non-Hispanic (3)
o Black or African American, Hispanic Origin (4)
o Native American or Alaskan Native (5)
o Asian/Pacific Islander (6)
o Asian Indian (7)
o Middle Eastern (8)
o Multi-racial (9)
o Other (10)
Q10 What is your age?
▼ 18 (1) ... 90 (73)

63
Q11 Do you reside in the United States?
o Yes (1)
o No (2)
Q12 IBS Quality of Life Survey.
Please think about your life over the past month (30 days), and look at the statements
below. Each statement has five possible responses. For each statement, please select
the choice that best describes your feelings.
Not at all
(1) Slightly (2)
Moderately (3)
Quite a bit (4)
A great deal (5)
I feel helpless because of my bowel
problems. (1) ▢ ▢ ▢ ▢ ▢
I am embarrassed of the smell
caused by my bowel
problems. (2)
▢ ▢ ▢ ▢ ▢
I am bothered by how much time I spend on the toilet.
(3)
▢ ▢ ▢ ▢ ▢
I feel vulnerable to
other illnesses
because of my bowel
problems. (4)
▢ ▢ ▢ ▢ ▢
I feel fat because of my bowel
problems. (5) ▢ ▢ ▢ ▢ ▢

64
I feel like I'm losing control
of my life because of my bowel
problems. (6)
▢ ▢ ▢ ▢ ▢
I feel my life is less enjoyable
because of my bowel
problems. (7)
▢ ▢ ▢ ▢ ▢
I feel uncomfortable
when I talk about my
bowel problems. (8)
▢ ▢ ▢ ▢ ▢
I feel depressed about my
bowel problems. (9)
▢ ▢ ▢ ▢ ▢
I feel isolated from others because of my bowel problems.
(10)
▢ ▢ ▢ ▢ ▢
I have to watch the amount of food I eat
because of my bowel problems.
(11)
▢ ▢ ▢ ▢ ▢
Because of my bowel problems,
sexual activity is difficult for
me. (12)
▢ ▢ ▢ ▢ ▢
I feel angry to I have bowel
problems. (13)
▢ ▢ ▢ ▢ ▢

65
I feel like I irritate others because of my bowel problems.
(14)
▢ ▢ ▢ ▢ ▢
I worry that my bowel
problems will get worse.
(15)
▢ ▢ ▢ ▢ ▢
I feel irritable because of my bowel problems.
(16)
▢ ▢ ▢ ▢ ▢
I worry that people think I exaggerate my bowel problems.
(17)
▢ ▢ ▢ ▢ ▢
I feel I get less done
because of my bowel problems.
(18)
▢ ▢ ▢ ▢ ▢
I have to avoid
stressful situations
because of my bowel problems.
(19)
▢ ▢ ▢ ▢ ▢
My bowel problems reduce my
sexual desire. (20)
▢ ▢ ▢ ▢ ▢
My bowel problems limit
what I can wear. (21)
▢ ▢ ▢ ▢ ▢

66
I have to avoid
strenuous activity
because of my bowel problems.
(22)
▢ ▢ ▢ ▢ ▢
I have to watch the
kind of food I eat because of my bowel problems.
(23)
▢ ▢ ▢ ▢ ▢
Because of my bowel problems I
have difficulty being around people I do
not know well. (24)
▢ ▢ ▢ ▢ ▢
I feel sluggish because of my bowel problems.
(25)
▢ ▢ ▢ ▢ ▢
I feel unclean because of my bowel problems.
(26)
▢ ▢ ▢ ▢ ▢
Long trips are difficult for me
because of my bowel problems.
(27)
▢ ▢ ▢ ▢ ▢
I feel frustrated that I cannot eat when I want because of my bowel
▢ ▢ ▢ ▢ ▢

67
problems. (28)
It is important to be near a
toilet because of my bowel problems.
(29)
▢ ▢ ▢ ▢ ▢
My life revolves
around my bowel
problems. (30)
▢ ▢ ▢ ▢ ▢
I worry about losing control of my bowels.
(31) ▢ ▢ ▢ ▢ ▢
I fear I won't be able to
have a bowel movement.
(32)
▢ ▢ ▢ ▢ ▢
My bowel problems are affecting my
closest relationships.
(33)
▢ ▢ ▢ ▢ ▢
I feel that no one
understands my bowel problems.
(34)
▢ ▢ ▢ ▢ ▢

68
Q13 Since being diagnosed with IBS have you sought medical intervention?
o Yes (1)
o No (2)
Skip To: Q15 If Since being diagnosed with IBS have you sought medical intervention? = No
Q14 Have medical interventions been helpful or improved your symptoms?
o Yes (1)
o No (2)
o Unsure (3)
Q15 Have you been able to identify triggers for your IBS symptoms? (ex. Specific foods,
stress, anxiety, etc)
o Yes (1)
o No (2)
o Unsure (3)
Skip To: Q17 If Have you been able to identify triggers for your IBS symptoms? (ex. Specific foods, stress, anxie... = No

69
Q16 What triggers have you identified? Select all that apply.
▢ Foods (1)
▢ Stress (2)
▢ Anxiety (3)
▢ Other (4) ________________________________________________
Q17 Since being diagnosed with IBS have you made any changes to your diet?
o Yes (1)
o No (2)
Skip To: Q19 If Since being diagnosed with IBS have you made any changes to your diet? = No
Q18 Have these diet changes improved your IBS symptoms?
o Yes (1)
o No (2)
o Unsure (3)
Q19 Have you seen a Registered Dietitian or Nutritionist since being diagnosed with
IBS?
o Yes (1)
o No (2)
o Unsure (3)

70
Skip To: Q22 If Have you seen a Registered Dietitian or Nutritionist since being diagnosed with IBS? = No
Skip To: Q22 If Have you seen a Registered Dietitian or Nutritionist since being diagnosed with IBS? = Unsure
Q20 What specific diet or diets did the Registered Dietitian or Nutritionist educate you
about?
▢ Low FODMAP diet (1)
▢ Gluten Free (2)
▢ Other (3) ________________________________________________
Q21 Did you find your discussion with the Registered Dietitian or Nutritionist beneficial?
o Yes (1)
o No (2)
o Unsure (3)
Q22 Do you have health insurance?
o Yes (1)
o No (2)

71
Q23 How much do you spend out-of-pocket monthly on medications or other treatments
for IBS?
o $0-20 (1)
o $21-50 (2)
o $51-75 (3)
o $76-100 (4)
o over $100 (5)
Q24 What is your total annual household income?
o Less than $10,000 (1)
o $10,000 to $19,999 (2)
o $20,000 to $29,999 (3)
o $30,000 to $39,999 (4)
o $40,000 to $49,999 (5)
o $50,000 to $59,999 (6)
o $60,000 to $69,999 (7)
o $70,000 to $79,999 (8)
o $80,000 to $89,999 (9)
o $90,000 to $99,999 (10)
o $100,000 to $149,999 (11)
o $150,000 or more (12)

72
Q25 What is the highest degree or level of education you have completed?
o Less than high school (1)
o Some high school, no diploma (2)
o High school graduate, diploma or the equivalent (for example: GED) (3)
o Trade/technical/vocational training (4)
o Some college credit, no degree (5)
o Associate degree (6)
o Bachelor’s degree (7)
o Master’s degree (8)
o Doctor of Medicine (11)
o Doctor of Dental Science (12)
o Doctor of Pharmacy (13)
o Doctor of Clinical Nutrition (14)
o Other Professional degree (9)
o Doctoral degree (PhD) (10)
Q26 How much do you weigh? Enter in pounds or kilograms.
_______ lbs (12)
_______ kgs (19)

73
Q27 How tall are you? Enter both feet and inches.
_______ Feet (1)
_______ Inches (2)
_______ OR Meters (3)
Q28 Thank you for completing this survey.
Q29 Do you want to enter a drawing to win a $25 Amazon gift card?
o Yes (1)
o No (3)
Skip To: Q30 If Do you want to enter a drawing to win a $25 Amazon gift card? = Yes
Q30 Click the link below to enter the drawing.
https://latechnd.iad1.qualtrics.com/jfe/form/SV_2oC9AdFoYePOcwB
End of Block: Default Question Block

74
Transforming and Computing Overall Score and Subscores of IBS-QOL
Summarized by J.B. Hu
IBS-QOL is a new survey instrument first developed in 1997 to assess health
related quality of life [QOL] of patients afflicted with irritable bowel syndrome [IBS].
The instrument was co-developed by Donald L. Patrick, PhD, Douglas A. Drossman,
MD, and Ihunnaya O. Frederick, in the United States. This summary is based on the
User’s Manual for the U.S. version of IBS-QOL authored and published by the three in
May 1997.
The original U.S. version of the IBS-QOL contains 34 question items relating to
symptoms of IBS. Each item, when answered by the patient, describes the respondent’s
feelings to a particular symptom. The magnitude of the respondent’s feelings to each
item is determined by the patient’s selection of one of the five Likert-style responses
labeled 1 through 5, where 1=Not at all, 2=Slightly, 3=Moderately, 4=Quite a bit, and
5=Extremely.
In data analysis, the five responses are transformed in order to obtain a 100-point
overall score and eight 100-point subscales. The table below lists names [beginning with
TOT_] of the total overall score and 8 subscales, their component items, and acronyms
[beginning with IBS_]of the final 9 computed 100-point scores:
Subscale Names and
Description [total]] Sequential order of component items in
the IBS-QOL 100-point
Names 1 TOT-OV for Overall [34] All 34 items IBS_OV 2 TOT-DY for Dysphoria [8] IBS01 IBS06 IBS07 IBS09 IBS10 IBS13
IBS16 IBS30 IBS_DY
3 TOT-IN for Interference With
Activity [7] IBS03 IBS18 IBS19 IBS22 IBS27 IBS29
IBS31 IBS_IN
4 TOT-BI for Body Image [4] IBS05 IBS21 IBS25 IBS26 IBS_BI 5 TOT-HW for Health Worry [3] IBS04 IBS15 IBS32 IBS_HW 6 TOT-FA for Food Avoidance [3] IBS11 IBS23 IBS28 IBS_FA 7 TOT-SR for Social Reaction [4] IBS02 IBS14 IBS17 IBS34 IBS_SR 8 TOT-SX for Sexual [2] IBS12 IBS20 IBS_SX 9 TOT-RL for Relationship [3] IBS08 IBS24 IBS33 IBS_RL
Step 1 in the transformation is to reverse code the responses, making 5=Not at all,
4=Slightly, 3=Moderately, 2=Quite a bit, and 1=Extremely. Manual reverse coding is
cumbersome, but most statistical analysis packages for personal computers are equipped
with different ways and shortcuts to the reverse coding.
Step 2 of the transformation calculates a summary total of the overall score and
eight subscales by totaling up the reverse coded values of the component items in each of
the 9 groups. For example, TOT-DY is obtained by adding up all the reverse coded
values of IBS01 IBS06 IBS07 IBS09 IBS10 IBS13 IBS16 IBS30.

75
Step 3 computes the final 100-point scores using the following formulas:
Final 100-point
Score Names Computation Formula Explanation
1 IBS_OV = ((TOT_OV -
34)/(136))*100 - denotes subtraction / indicates division * means
multiplication
Note: No final score should
exceed 100. Higher scores
may mean a higher
quality of life and a less
degree of IBS symptoms
and their impact.
2 IBS_DY = ((TOT_DY - 8)/(
32))*100
3 IBS_IN = ((TOT_IN - 7)/(
28))*100
4 IBS_BI = ((TOT_BI - 4)/(
16))*100
5 IBS_HW = ((TOT_HW - 3)/(
12))*100
6 IBS_FA = ((TOT_FA - 3)/(
12))*100
7 IBS_SR = ((TOT_SR - 4)/(
16))*100
8 IBS_SX = ((TOT_SX - 2)/(
8))*100
9 IBS_RL = ((TOT_RL - 3)/(
12))*100
For more details of calculating the scores or to obtain a copy of the original IBS-
QOL questionnaire, the User’s Manual, or other supporting materials, please contact any
person listed below:
Douglas A. Drossman, MD University of North Carolina – Chapel Hill CB 7080 BioInformatics Building Chapel Hill, North Carolina 27599-7080 USA Tel: (919) 966-0141 Fax: (919) 966-8929
or
Donald L. Patrick, PhD Department of Health Services, H689 Box 357660, University of Washington Seattle, Washington 98195-7660 USA Tel: (206) 616-7393 Fax: (206) 616-3135
D:\QOL\QOLSCORE2.DOC Created in Jan98 by JBHu Last printed 12/10/2010 12:21:00 PM

76
APPENDIX C
LOUISIANA TECH HUMAN USE
COMMITTEE APPROVAL FORM
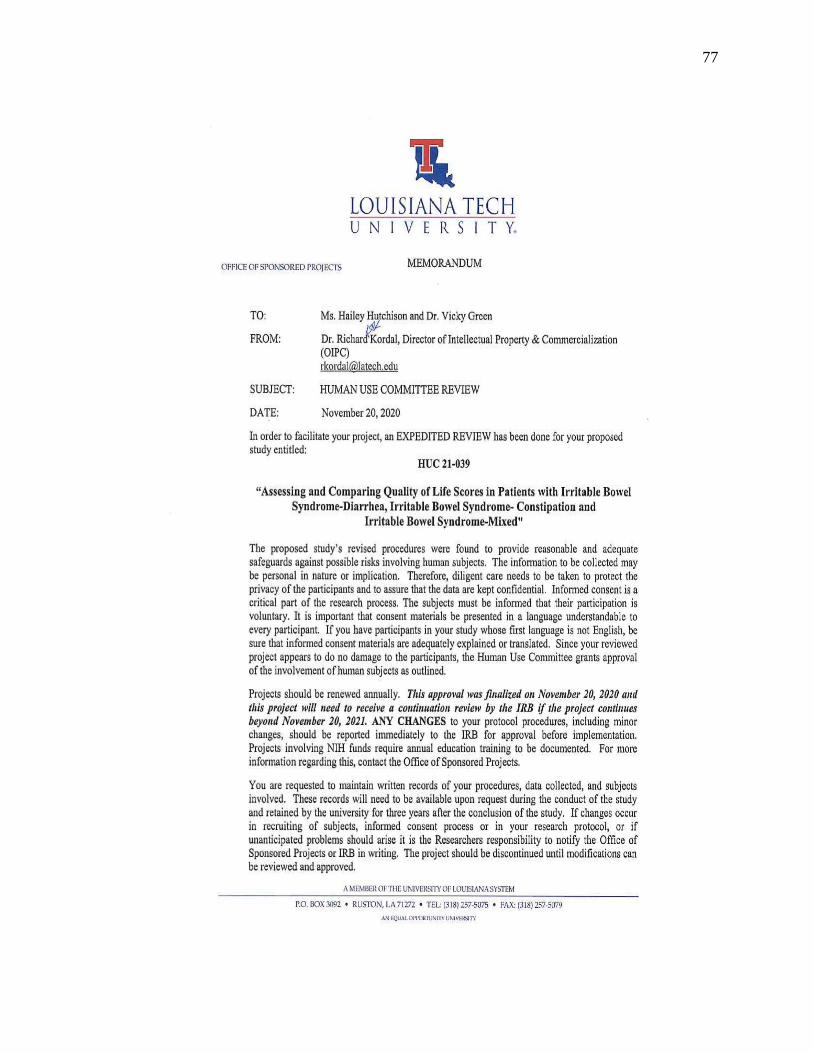
77
78
REFERENCES
Abel, J. R., & Deitz, R. (2014). Do the benefits of college still outweigh the costs?.
Current issues in economics and finance, 20(3).
Al Huthail, Y. R. (2013). Healthcare seeking behavior among subjects with irritable
bowel syndrome. Saudi Med J, 34(3), 225-231.
American Psychological Association. (2012). Gender and stress. www.apa.org.
American Psychological Association. (2015). Speaking of psychology: The stress of
money. www.apa.org
Anbardan, S. J., Daryani, N. E., Fereshtehnejad, S. M., Taba Taba Vakili, S., Keramati,
M. R., & Ajdarkosh, H. (2012). Gender role in irritable bowel syndrome: A
comparison of irritable bowel syndrome module (ROME III) between male and
female patients. Journal of Neurogastroenterology and Motility, 18(1), 70–77.
https://doi.org/10.5056/jnm.2012.18.1.70
Barrett, J. S. (2017). How to institute the low‐FODMAP diet. Journal of
Gastroenterology and Hepatology, 32, 8-10.
Barrett, J. S., & Gibson, P. R. (2012). Fermentable oligosaccharides, disaccharides,
monosaccharides and polyols (FODMAPs) and nonallergic food intolerance:
FODMAPs or food chemicals? Therapeutic Advances in Gastroenterology, 5(4),
261-268.
Belmonte, L., Beutheu Youmba, S., Bertiaux-Vandaële, N., Antonietti, M., Lecleire, S.,
Zalar, A., Gourcerol, G., Leroi, A. M., Déchelotte, P., Coëffier, M., & Ducrotté,
P. (2012). Role of toll like receptors in irritable bowel syndrome: differential
mucosal immune activation according to the disease subtype. PloS One, 7(8),
e42777. https://doi.org/10.1371/journal.pone.0042777
Bertram, S., Kurland, M., Lydick, E., LOCKE, G. R. I., & Yawn, B. P. (2001). The
patient's perspective of irritable bowel syndrome. Journal of Family Practice,
50(6), 521-521.
Björkman, I., Simrén, M., Ringström, G., & Jakobsson Ung, E. (2016). Patients’
experiences of healthcare encounters in severe irritable bowel syndrome: an
analysis based on narrative and feminist theory. Journal of Clinical Nursing,
25(19-20), 2967-2978.
Black, C. J., & Ford, A. C. (2020). Global burden of irritable bowel syndrome: trends,
predictions and risk factors. Nature Reviews Gastroenterology & Hepatology, 1-
14.Borghini, R., Donato, G., Alvaro, D., & Picarelli, A. (2017). New insights in
IBS-like disorders: Pandora's box has been opened; a review. Gastroenterology
and Hepatology from Bed to Bench, 10(2), 79–8

79
Butel, M. J. (2014). Probiotics, gut microbiota and health. Médecine et Maladies
Infectieuses, 44(1), 1-8.
Caballero, A. E. (2011). Understanding the Hispanic/Latino patient. The American
journal of medicine, 124(10), 10-15.
Canavan, C., West, J., & Card, T. (2014). The economic impact of the irritable bowel
syndrome. Alimentary Pharmacology & Therapeutics, 40(9), 1023-1034.
Chang, F. Y., Lu, C. L., & Chen, T. S. (2010). The current prevalence of irritable bowel
syndrome in Asia. Journal of Neurogastroenterology and Motility, 16(4), 389–
400. https://doi.org/10.5056/jnm.2010.16.4.389
Chang, L. (2011). The role of stress on physiologic responses and clinical symptoms in
irritable bowel syndrome. Gastroenterology, 140(3), 761-765.
Chey, W. D., Lembo, A. J., Lavins, B. J., Shiff, S. J., Kurtz, C. B., Currie, M. G., ... &
Baird, M. J. (2012). Linaclotide for irritable bowel syndrome with constipation: a
26-week, randomized, double-blind, placebo-controlled trial to evaluate efficacy
and safety. American Journal of Gastroenterology, 107(11), 1702-1712.
Chey, W. D., Maneerattaporn, M., & Saad, R. (2011). Pharmacologic and complementary
and alternative medicine therapies for irritable bowel syndrome. Gut and Liver,
5(3), 253.
Cho, H. S., Park, J. M., Lim, C. H., Cho, Y. K., Lee, I. S., Kim, S. W., ... & Chung, Y. K.
(2011). Anxiety, depression, and quality of life in patients with irritable bowel
syndrome. Gut and Liver, 5(1), 29.
Chumpitazi, B. P., Kearns, G. L., & Shulman, R. J. (2018). the physiological effects and
safety of peppermint oil and its efficacy in irritable bowel syndrome and other
functional disorders. Alimentary Pharmacology & Therapeutics, 47(6), 738-752.
Cook, B. L., McGuire, T. G., & Zaslavsky, A. M. (2012). Measuring racial/ethnic
disparities in health care: methods and practical issues. Health services
research, 47(3pt2), 1232-1254.
Corsetti, M., & Whorwell, P. (2017). The global impact of IBS: time to think about IBS-
specific models of care? Therapeutic Advances in Gastroenterology, 10(9), 727-
736.
Dai, C., Zheng, C. Q., Jiang, M., Ma, X. Y., & Jiang, L. J. (2013). Probiotics and irritable
bowel syndrome. World Journal of Gastroenterology, 19(36), 5973–5980.
https://doi.org/10.3748/wjg.v19.i36.5973
De Roest, R. H., Dobbs, B. R., Chapman, B. A., Batman, B., O'brien, L. A., Leeper, J. A.,
... & Gearry, R. B. (2013). The low FODMAP diet improves gastrointestinal
symptoms in patients with irritable bowel syndrome: a prospective study.
International Journal of Clinical Practice, 67(9), 895-903.

80
Derose, K. P., Gresenz, C. R., & Ringel, J. S. (2011). Understanding disparities in health
care access—and reducing them—through a focus on public health. Health
Affairs, 30(10), 1844-1851.
DiBonaventura, M., Sun, S. X., Bolge, S. C., Wagner, J. S., & Mody, R. (2011). Health-
related quality of life, work productivity and health care resource use associated
with constipation predominant irritable bowel syndrome. Current Medical
Research and Opinion, 27(11), 2213-2222.
Drossman, D. A., Chang, L., Bellamy, N., Gallo-Torres, H. E., Lembo, A., Mearin, F., ...
& Whorwell, P. (2011). Severity in irritable bowel syndrome: a Rome Foundation
Working Team report. American Journal of Gastroenterology, 106(10), 1749-
1759.
El-Salhy M. (2012). Irritable bowel syndrome: diagnosis and pathogenesis. World
Journal of Gastroenterology, 18(37), 5151–5163.
https://doi.org/10.3748/wjg.v18.i37.5151
El-Salhy, M., & Gundersen, D. (2015). Diet in irritable bowel syndrome. Nutrition
journal,
El-Salhy, M., Lillebø, E., Reinemo, A., Salmelid, L., & Hausken, T. (2010). Effects of a
health program comprising reassurance, diet management, probiotics
administration and regular exercise on symptoms and quality of life in patients
with irritable bowel syndrome. Gastroenterology Insights, 2(1), 21-26.
El-Salhy, M., Østgaard, H., Gundersen, D., Hatlebakk, J. G., & Hausken, T. (2012). The
role of diet in the pathogenesis and management of irritable bowel syndrome.
International Journal of Molecular Medicine, 29(5), 723-731.
Endo, Y., Shoji, T., & Fukudo, S. (2015). Epidemiology of irritable bowel syndrome.
Annals of Gastroenterology, 28(2), 158–159.
Eswaran, S. L., Chey, W. D., Han-Markey, T., Ball, S., & Jackson, K. (2016). A
randomized controlled trial comparing the low FODMAP diet vs. modified NICE
guidelines in US adults with IBS-D. American Journal of Gastroenterology,
111(12), 1824-1832.
Fadgyas-Stanculete, M., Buga, A. M., Popa-Wagner, A., & Dumitrascu, D. L. (2014).
The relationship between irritable bowel syndrome and psychiatric disorders:
from molecular changes to clinical manifestations. Journal of molecular
psychiatry, 2(1), 4. https://doi.org/10.1186/2049-9256-2-4
Gibson, P. R. (2017). History of the low FODMAP diet. Journal of Gastroenterology and
Hepatology, 32, 5-7.
Gulewitsch, M. D., Enck, P., Schwille-Kiuntke, J., Weimer, K., & Schlarb, A. A. (2013).
Mental strain and chronic stress among university students with symptoms of
irritable bowel syndrome. Gastroenterology Research and Practice, 2013.

81
Håkanson, C., Sahlberg-Blom, E., & Ternestedt, B. M. (2010). Being in the patient
position: Experiences of health care among people with irritable bowel syndrome.
Qualitative Health Research, 20(8), 1116-1127.
Halmos, E. P., Power, V. A., Shepherd, S. J., Gibson, P. R., & Muir, J. G. (2014). A diet
low in FODMAPs reduces symptoms of irritable bowel syndrome.
Gastroenterology, 146(1), 67-75.
Hill, P., Muir, J. G., & Gibson, P. R. (2017). Controversies and recent developments of
the low-FODMAP diet. Gastroenterology & Hepatology, 13(1), 36.
Houghton, L. A., Atkinson, W., Whitaker, R. P., Whorwell, P. J., & Rimmer, M. J.
(2003). Increased platelet depleted plasma 5-hydroxytryptamine concentration
following meal ingestion in symptomatic female subjects with diarrhea
predominant irritable bowel syndrome. Gut, 52(5), 663–670.
https://doi.org/10.1136/gut.52.5.663
Hurlstone, D. P., Pocock, C. Y., Walkington, L. A., Farquharson, N. R., Bramble, M. G.,
McAlindon, M. E., & Sanders, D. S. (2005). The incidence of self-prescribed oral
complementary and alternative medicine use by patients with gastrointestinal
diseases. Journal of Clinical Gastroenterology, 39(2), 138-141.
Hussain, Z., & Quigley, E. M. M. (2006). Systematic review: Complementary and
alternative medicine in the irritable bowel syndrome. Alimentary Pharmacology
& Therapeutics, 23(4), 465-471.
Ishihara, S., Tada, Y., Fukuba, N., Oka, A., Kusunoki, R., Mishima, Y., ... & Kinoshita,
Y. (2013). Pathogenesis of irritable bowel syndrome-review regarding associated
infection and immune activation. Digestion, 87(3), 204-211.
Jamali, R., Jamali, A., Poorrahnama, M., Omidi, A., Jamali, B., Moslemi, N., ... &
Daryani, N. E. (2012). Evaluation of health-related quality of life in irritable
bowel syndrome patients. Health and Quality of Life Outcomes, 10(1), 12.
Jerndal, P., Ringström, G., Agerforz, P., Karpefors, M., Akkermans, L. M., Bayati, A., &
Simrén, M. (2010). Gastrointestinal‐specific anxiety: an important factor for
severity of GI symptoms and quality of life in IBS. Neurogastroenterology &
Motility, 22(6), 646-654.
Kabra, N., & Nadkarni, A. (2013). Prevalence of depression and anxiety in irritable
bowel syndrome: A clinic-based study from India. Indian Journal of Psychiatry,
55(1), 77.
Khanna, R., MacDonald, J. K., & Levesque, B. G. (2014). Peppermint oil for the
treatment of irritable bowel syndrome: A systematic review and meta-analysis.
Journal of Clinical Gastroenterology, 48(6), 505-512.
Kinsinger, S. W. (2017). Cognitive-behavioral therapy for patients with irritable bowel
syndrome: Current insights. Psychology Research and Behavior Management, 10,
231-237.

82
Kosako, M., Akiho, H., Miwa, H., Kanazawa, M., & Fukudo, S. (2018). Impact of
symptoms by gender and age in Japanese subjects with irritable bowel syndrome
with constipation (IBS-C): a large population-based internet survey.
BioPsychoSocial Medicine, 12(1), 12.
Lackner, J. M., Brasel, A. M., Quigley, B. M., Keefer, L., Krasner, S. S., Powell, C., ... &
Sitrin, M. D. (2010). The ties that bind: perceived social support, stress, and IBS
in severely affected patients. Neurogastroenterology & Motility, 22(8), 893-900.
Lackner, J. M., Gudleski, G. D., Ma, C. X., Dewanwala, A., Naliboff, B., & Representing
the IBSOS Outcome Study Research Group. (2014). Fear of GI symptoms has an
important impact on quality of life in patients with moderate-to-severe IBS. The
American Journal of Gastroenterology, 109(11), 1815-1823.
Lacy B. E. (2016). Diagnosis and treatment of diarrhea-predominant irritable bowel
syndrome. International Journal of General Medicine, 9, 7–17.
https://doi.org/10.2147/IJGM.S93698
Lacy, B. E., & Patel, N. K. (2017). Rome criteria and a diagnostic approach to irritable
bowel syndrome. Journal of Clinical Medicine, 6(11), 99.
https://doi.org/10.3390/jcm6110099
Ladabaum, U., Boyd, E., Zhao, W. K., Mannalithara, A., Sharabidze, A., Singh, G., ... &
Levin, T. R. (2012). Diagnosis, comorbidities, and management of irritable bowel
syndrome in patients in a large health maintenance organization. Clinical
Gastroenterology and Hepatology, 10(1), 37-45.
Laird, K. T., Tanner-Smith, E. E., Russell, A. C., Hollon, S. D., & Walker, L. S. (2016).
Short-term and long-term efficacy of psychological therapies for irritable bowel
syndrome: A systematic review and meta-analysis. Clinical Gastroenterology and
Hepatology, 14(7), 937-947.
Lau, M., Lin, H., & Flores, G. (2012). Racial/ethnic disparities in health and health care
among US adolescents. Health services research, 47(5), 2031-2059.
Lee, S. P., Sung, I. K., Kim, J. H., Lee, S. Y., Park, H. S., & Shim, C. S. (2015). The
effect of emotional stress and depression on the prevalence of digestive diseases.
Journal of Neurogastroenterology and Motility, 21(2), 273.
Lovell, R. M., & Ford, A. C. (2012). Global prevalence of and risk factors for irritable
bowel syndrome: a meta-analysis. Clinical Gastroenterology and Hepatology,
10(7), 712-721.
Makharia, A., Catassi, C., & Makharia, G. K. (2015). The overlap between irritable
bowel syndrome and non-celiac gluten sensitivity: a clinical dilemma. Nutrients,
7(12), 10417-10426.
Mayer, E. A., Naliboff, B. D., & Craig, A. B. (2006). Neuroimaging of the brain-gut axis:
from basic understanding to treatment of functional GI disorders.
Gastroenterology, 131(6), 1925-1942.
Mayo Clinic. (2021). Colon cancer. www.mayoclinic.org

83
Mearin, F., Ciriza, C., Mínguez, M., Rey, E., Mascort, J. J., Peña, E., ... & Júdez, J.
(2016). Clinical practice guidelines: Irritable bowel syndrome with constipation
and functional constipation in adults: Concept, diagnosis, and healthcare
continuity. Atencion Primaria, 49(1), 42-55.
Mitchell, H., Porter, J., Gibson, P. R., Barrett, J., & Garg, M. (2019). Implementation of a
diet low in FODMAPs for patients with irritable bowel syndrome—Directions for
future research. Alimentary Pharmacology & Therapeutics, 49(2), 124-139.
Monsbakken, K. W., Vandvik, P. O., & Farup, P. G. (2006). Perceived food intolerance
in subjects with irritable bowel syndrome–Etiology, prevalence and
consequences. European Journal of Clinical Nutrition, 60(5), 667-672.
Mykletun, A., Jacka, F., Williams, L., Pasco, J., Henry, M., Nicholson, G. C., ... & Berk,
M. (2010). Prevalence of mood and anxiety disorder in self-reported irritable
bowel syndrome (IBS). An epidemiological population-based study of women.
BMC Gastroenterology, 10(1), 88.
National Institute of Diabetes and Digestive and Kidney Diseases. (November 2017).
Definition and facts for irritable bowel syndrome. www.niddk.nih.gov
Nellesen, D., Yee, K., Chawla, A., Lewis, B. E., & Carson, R. T. (2013). A systematic
review of the economic and humanistic burden of illness in irritable bowel
syndrome and chronic constipation. Journal of Managed Care Pharmacy, 19(9),
755-764.
O’Malley, D., Quigley, E. M., Dinan, T. G., & Cryan, J. F. (2011). Do interactions
between stress and immune responses lead to symptom exacerbations in irritable
bowel syndrome? Brain, Behavior, and Immunity, 25(7), 1333-1341.
O'keeffe, M., Jansen, C., Martin, L., Williams, M., Seamark, L., Staudacher, H. M., ... &
Lomer, M. C. (2018). Long‐term impact of the low‐FODMAP diet on
gastrointestinal symptoms, dietary intake, patient acceptability, and healthcare
utilization in irritable bowel syndrome. Neurogastroenterology & Motility, 30(1),
1-13.
Pan, C. H., Chang, C. C., Su, C. T., & Tsai, P. S. (2016). Trends in irritable bowel
syndrome incidence among Taiwanese adults during 2003–2013: A population-
based study of sex and age differences. PLoS One, 11(11), e0166922.
Peyton, L., & Greene, J. (2014). Irritable bowel syndrome: current and emerging
treatment options. P & T: A Peer-Reviewed Journal for Formulary Management,
39(8), 567–578.
Qin, H. Y., Cheng, C. W., Tang, X. D., & Bian, Z. X. (2014). Impact of psychological
stress on irritable bowel syndrome. World Journal of Gastroenterology: WJG,
20(39), 14126.
Rao, S., Lembo, A. J., Shiff, S. J., Lavins, B. J., Currie, M. G., Jia, X. D., ... Fox, S. M.
(2012). A 12-week, randomized, controlled trial with a 4-week randomized
withdrawal period to evaluate the efficacy and safety of linaclotide in irritable

84
bowel syndrome with constipation. The American Journal of Gastroenterology,
107(11), 1714.
Roblin, X., Biroulet, L. P., Phelip, J. M., Nancey, S., Flourie, B., Heidelbaugh, J. J., ... &
Inadomi, J. M. (2009). Corrigendum: An Evidence-Based Position Statement on
the Management of Irritable Bowel Syndrome. Am J Gastroenterol, 104(1), S1-
S35.
Rome Foundation. (2012). IBS-Quality of Life Questionnaire.
Saha L. (2014). Irritable bowel syndrome: pathogenesis, diagnosis, treatment, and
evidence-based medicine. World Journal of Gastroenterology, 20(22), 6759–
6773. https://doi.org/10.3748/wjg.v20.i22.6759
Saha L. (2014). Irritable bowel syndrome: pathogenesis, diagnosis, treatment, and
evidence-based medicine. World Journal of Gastroenterology, 20(22), 6759–
6773. https://doi.org/10.3748/wjg.v20.i22.6759
Sandhu, B. K., & Paul, S. P. (2014). Irritable bowel syndrome in children: pathogenesis,
diagnosis and evidence-based treatment. World Journal of Gastroenterology,
20(20), 6013–6023. https://doi.org/10.3748/wjg.v20.i20.6013
Shahbazkhani, B., Sadeghi, A., Malekzadeh, R., Khatavi, F., Etemadi, M., Kalantri, E., ...
& Rostami, K. (2015). Non-celiac gluten sensitivity has narrowed the spectrum of
irritable bowel syndrome: A double-blind randomized placebo-controlled trial.
Nutrients, 7(6), 4542-4554.
Simren, M., Palsson, O. S., & Whitehead, W. E. (2017). Update on Rome IV criteria for
colorectal disorders: implications for clinical practice. Current Gastroenterology
Reports, 19(4), 15.
Singh, P., Staller, K., Barshop, K., Dai, E., Newman, J., Yoon, S., Castel, S., & Kuo, B.
(2015). Patients with irritable bowel syndrome-diarrhea have lower disease-
specific quality of life than irritable bowel syndrome-constipation. World Journal
of Gastroenterology, 21(26), 8103–8109.
https://doi.org/10.3748/wjg.v21.i26.8103
Spiegel, B. M. (2011). Questioning the bacterial overgrowth hypothesis of irritable bowel
syndrome: an epidemiologic and evolutionary perspective. Clinical
Gastroenterology and Hepatology, 9(6), 461-469.
Spiller, R. C. (2001). Effects of serotonin on intestinal secretion and motility. Current
Opinion in Gastroenterology, 17(2), 99-103.
Staudacher, H. M., Whelan, K., Irving, P. M., & Lomer, M. C. (2011). Comparison of
symptom response following advice for a diet low in fermentable carbohydrates
(FODMAPs) versus standard dietary advice in patients with irritable bowel
syndrome. Journal of Human Nutrition and Dietetics, 24(5), 487-495.
Su, A. M., Shih, W., Presson, A. P., & Chang, L. (2014). Characterization of symptoms
in irritable bowel syndrome with mixed bowel habit
pattern. Neurogastroenterology & Motility, 26(1), 36-45.

85
Trinkley, K. E., & Nahata, M. C. (2014). Medication management of irritable bowel
syndrome. Digestion, 89(4), 253-267.
Trinkley, K. E., & Nahata, M. C. (2014). Medication management of irritable bowel
syndrome. Digestion, 89(4), 253-267.
Varney, J., Barrett, J., Scarlata, K., Catsos, P., Gibson, P. R., & Muir, J. G. (2017).
FODMAPs: food composition, defining cutoff values and international
application. Journal of Gastroenterology and Hepatology, 32, 53-61.
Vazquez–Roque, M. I., Camilleri, M., Smyrk, T., Murray, J. A., Marietta, E., O'Neill, J.,
... & Burton, D. (2013). A controlled trial of gluten-free diet in patients with
irritable bowel syndrome-diarrhea: effects on bowel frequency and intestinal
function. Gastroenterology, 144(5), 903-911.
Whelan, K., & Quigley, E. M. (2013). Probiotics in the management of irritable bowel
syndrome and inflammatory bowel disease. Current Opinion in Gastroenterology,
29(2), 184-189.
Williams, D. R., & Wyatt, R. (2015). Racial bias in health care and health: challenges and
opportunities. Jama, 314(6), 555-556.
Yoon, S. L., Grundmann, O., Koepp, L., & Farrell, L. (2011). Management of irritable
bowel syndrome (IBS) in adults: conventional and complementary/alternative
approaches. Alternative Medicine Review, 16(2), 134.
Zhao, S. R., Ni, X. M., Zhang, X. A., & Tian, H. (2019). Effect of cognitive behavior
therapy combined with exercise intervention on the cognitive bias and coping
styles of diarrhea-predominant irritable bowel syndrome patients. World Journal
of Clinical Cases, 7(21), 3446-3462.
Zhou, C., Zhao, E., Li, Y., Jia, Y., & Li, F. (2019). Exercise therapy of patients with
irritable bowel syndrome: A systematic review of randomized controlled trials.
Neurogastroenterology & Motility, 31(2), 1-10.


