Assembly of Fe-substituted Dawson-type nanoscale ... · 1 Assembly of Fe-substituted Dawson-type...
23
1 Assembly of Fe-substituted Dawson-type nanoscale selenotungstates clusters with photocatalytic H 2 evolution activity Wei-Chao Chen, Chao Qin, Xin-Long Wang,* Yang-Guang Li, Hong-Ying Zang, Yan-Qing Jiao, Peng Huang, Kui-Zhan Shao, Zhong-Min Su,* and En-Bo Wang a a Institute of Functional Material Chemistry, Key Lab of Polyoxometalate Science of Ministry of Education, Faculty of Chemistry, Northeast Normal University, Changchun, 130024 Jilin, People’s Republic of China. CONTENTS Section 1 Synthesis, Crystal Data, and Structures of 1-2 1.1 Synthesis 1.2 Synthesis Discussion 1.3 Crystal Data 1.4 Structures of 1-2 1.5 The BVS Calculation Result of All the Oxygen Atoms Section 2 Experimental Section 2.1 Materials and Physical Measurements 2.2 UV-Vis spectra 2.3 ESI-MS 2.4 Cyclic Voltammetry 2.5 Magnetism Section 3 Supplementary Physical Characterizations Electronic Supplementary Material (ESI) for ChemComm. This journal is © The Royal Society of Chemistry 2014
Transcript of Assembly of Fe-substituted Dawson-type nanoscale ... · 1 Assembly of Fe-substituted Dawson-type...
1
Assembly of Fe-substituted Dawson-type nanoscale
selenotungstates clusters with photocatalytic H2
evolution activity
Wei-Chao Chen, Chao Qin, Xin-Long Wang,* Yang-Guang Li, Hong-Ying Zang, Yan-Qing
Jiao, Peng Huang, Kui-Zhan Shao, Zhong-Min Su,* and En-Bo Wanga
aInstitute of Functional Material Chemistry, Key Lab of Polyoxometalate Science of Ministry of
Education, Faculty of Chemistry, Northeast Normal University, Changchun, 130024 Jilin,
People’s Republic of China.
CONTENTS
Section 1 Synthesis, Crystal Data, and Structures of 1-2
1.1 Synthesis 1.2 Synthesis Discussion 1.3 Crystal Data 1.4 Structures of 1-2 1.5 The BVS Calculation Result of All the Oxygen Atoms
Section 2 Experimental Section
2.1 Materials and Physical Measurements 2.2 UV-Vis spectra 2.3 ESI-MS 2.4 Cyclic Voltammetry 2.5 Magnetism
Section 3 Supplementary Physical Characterizations
Electronic Supplementary Material (ESI) for ChemComm.This journal is © The Royal Society of Chemistry 2014

2
Section 1 Synthesis, Crystal Data, and Structures of 1-2
1.1 Synthesis
Materials: All chemicals and solvents were commercially purchased and used
without further purification. The polyoxotungstate cluster
(NH4)6Na18[Se6W39O141(H2O)3]·70H2O was prepared according to the literature
method (Chem. Commun., 2014, 50, 2155–2157).
Synthesis of 1: Na2WO4·2H2O (1.70 g, 5.12 mmol) and Na2SeO3 (0.13 g, 0.73 mmol)
were dissolved in 30 mL water. The pH value of the solution was adjusted to 4.5 by
the 50% (1:1) acetic acid solution. After the solution was stirred for around 30 min,
solid Fe(NO3)3·9H2O (0.20 g, 0.50 mmol) and dimethylamine hydrochloride (0.70 g,
6.13 mmol) were successively added. The final pH was kept at 5.5 by 4 M NaOH.
This solution was stirred for another 10 min and then heated to 80 oC stirred for 0.5 h,
cooled down to room temperature, filtered and left to evaporate slowly. Yellow
block-shaped crystals were obtained after two weeks, which were then collected by
filtration and air-dried. Yield: 0.34 g, (21.3 %, based on W). IR (in cm-1): 3443 (w),
3136 (w), 2790 (w), 1605 (s), 1526 (m), 1464 (s), 1406 (m), 1021 (m), 954 (s), 809
(w), 746 (w). Elemental analysis, calc. for C8H136Fe6N4Na14O184Se6W34: C 0.91, N
0.53, Na 3.03, Fe 3.16, Se 4.46, W 58.9 %; Found C 0.79, N 0.44, Na 2.88, Fe 2.83,
Se 4.68, W 59.7 %.
Synthesis of 2: (NH4)6Na18[Se6W39O141(H2O)3]·70H2O (0.50 g, 0.043 mmol) and
NH4Cl (0.27 g, 5.00 mmol) were dissolved with stirring in 40 ml H2O, the reaction
mixture was stirred for 30 min. Solid Fe(NO3)3·9H2O (0.20 g, 0.50mmol) were added,
the white cloudy solution turn to orange cloudy mixture after another five minutes.
This solution was heated to 100 °C stirred for 0.5 h, and then cooled to room
temperature and filtered. The final pH was about 2.50. Slow evaporation of the
solution results in the yellow crystals 2 forming in one month. Yield: 0.12 g, (24.8 %,
based on W). IR (in cm-1): 3437 (s), 1620 (s), 960 (m), 864 (s), 741 (w), 640 (m).

3
Elemental analysis, calc. for H146Fe10N9Na19O286Se8W62: N 0.71, Na 2.44, Fe 3.12, Se
3.53, W 63.8 %; Found N 0.62, Na 2.69, Fe 3.37, Se 3.46, W 62.1 %.
1.2 Synthesis Discussion
Precise control of the one-pot reaction conditions was employed for the assembly
of 1. Many previous reports pointed that the SeO32- anion template has a lone pair of
electrons and only form three bonds through oxygen atoms in trigonal configurations,
they effectively give rise to “open” lacunary units instead of “closed” Keggin-type or
Dawson-type building blocks. Such templates can be viewed as “inorganic ligands”.1
The acidification of WO42- and SeO3
2- by acetic acid was necessary, because acetic
acid has already been proved to be a suitable reagent for acidifying Se-based POTs
clusters1b. Furthermore, molar ratio (W:Se molar ratio 7:1) also plays an important
role that is in accordance with the basic lacunary Dawson-type fragment {α-Se2W14}.
Subsequently, simple metal salt, Fe3+, was introduced to the acid solution. The
possibly formative lacunary Dawson-type fragment {α-Se2W14} filled with the Fe
centers that forms the saturated {M18} configuration which lays the foundation of the
sandwich cluster {Fe6Se6W34}. Besides, the organo-ammonium cations
(dimethylamine hydrochloride)1a, 2 were employed to restrict the aggregation of more
highly symmetrical clusters during the assembly process, resulting in the successful
synthesis of 1.
Compound 2 was synthesized in moderately acidic reactions with {Se6W39}
precursor. The reported trimeric macrocyclic species [Se6W39O141(H2O)3]24- possesses
powerful ability to reassemble in high ionic strength media3. By reassembly and then
refluxing a high counter cations media solution of {Se6W39} precursor in the presence
of Fe centers, we theorize that the formation of the controlled degradation of the
precursor, known to be a slow process and in kinetic equilibrium4, may lead to novel
lacunary Dawson-type intermediate species as inorganic ligands suitable for
substitution on the Fe centers. Here, the reaction was taken in a NH4+-rich media. The
lacunary Dawson-type intermediate species derived from {Se6W39} unit trend to be
induced by Fe centers to access saturated {M18} configurations to get the construction
4
of 2. Moreover, when Fe centers was not introduced during the synthesis, thus we
only found the {Se6W39} precursor precipitated after about two months, which deeply
proved that the role of Fe centers remains indispensable, in other words, the
“metal-inducing” strategy remains powerful.
References:
[1] (a) M. Hutin, D.-L. Long, L. Cronin, Isr. J. Chem. 2011, 51, 205 –214; (b) J. Yan,
D.-L. Long and L. Cronin, Angew. Chem., Int. Ed., 2010, 49, 4117–4120; (c) J. Gao, J.
Yan, S. Beeg, D.-L. Long and L. Cronin, J. Am. Chem. Soc., 2012, 135, 1796–1805;
(d) W.-C. Chen, H.-L. Li, X.-L. Wang, K.-Z. Shao, Z.-M. Su and E.-B. Wang,
Chem.–Eur. J., 2013, 19, 11007–11015. (e) J. M. Cameron, J. Gao, D.-L. Long and L.
Cronin, Inorg. Chem. Front., 2014, 1, 178–185; (f) L.-J. Wang, W.-J. Li, L.-Z. Wu,
X.-B. Dong, H.-M. Hu and G.-L. Xue, Inorg. Chem. Commun., 2013, 35, 122-125. (g)
J. Yan, J. Gao, D.-L. Long, H. N. Mirasand and L.Cronin, J. Am. Chem. Soc., 2010,
132, 11410–11411.
[2] Long, D. L.; Burkholder, E.; Cronin, L. Chem. Soc. Rev. 2007, 36, 105–121.
[3] (a) J. M. Cameron, J. Gao, L. Vilà-Nadal, D.-L. Long and L. Cronin, Chem.
Commun., 2014, 2155–2157; (b) I. V. Kalinina, E. V. Peresypkina, N. V. Izarova, F.
M. Nkala, U. Kortz, N. B. Kompankov, N. K. Moroz, and M. N. Sokolov, Inorg.
Chem., 2014, 53, 2076–2082.
[4] X.-K. Fang and M. Luban, Chem. Commun., 2011, 3066–3068.
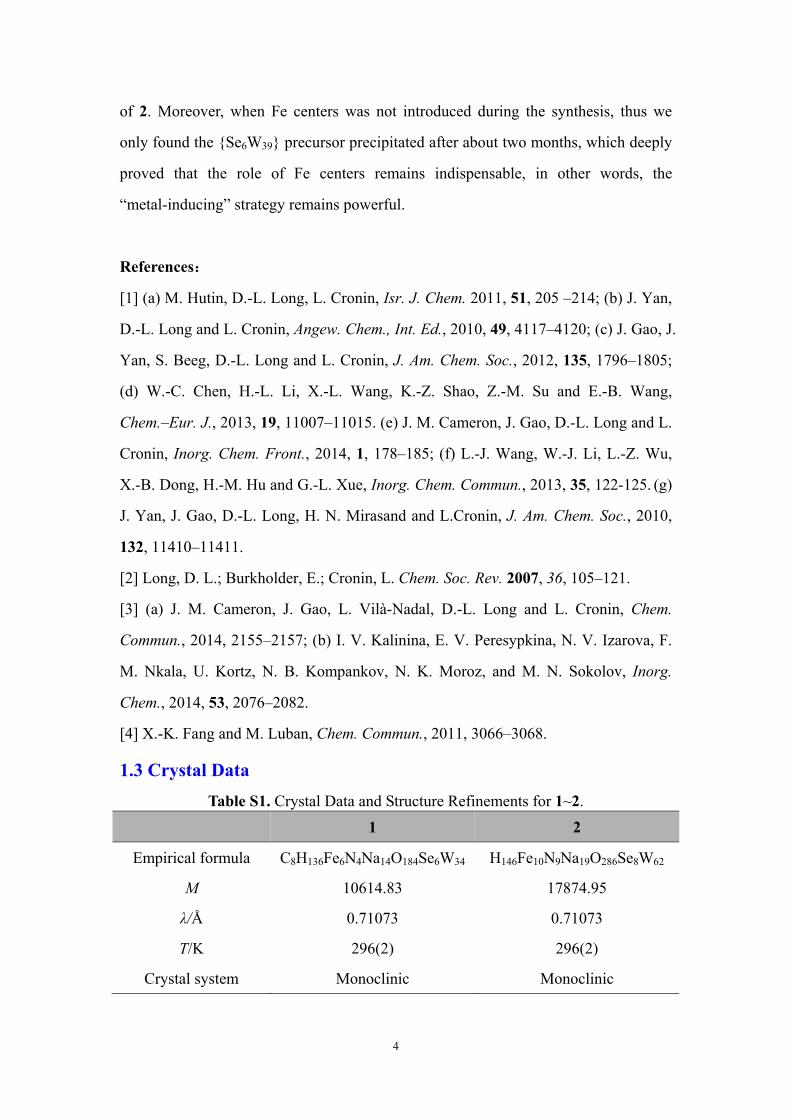
1.3 Crystal Data
Table S1. Crystal Data and Structure Refinements for 1~2.
1 2
Empirical formula C8H136Fe6N4Na14O184Se6W34 H146Fe10N9Na19O286Se8W62
M 10614.83 17874.95
λ/Å 0.71073 0.71073
T/K 296(2) 296(2)
Crystal system Monoclinic Monoclinic
5
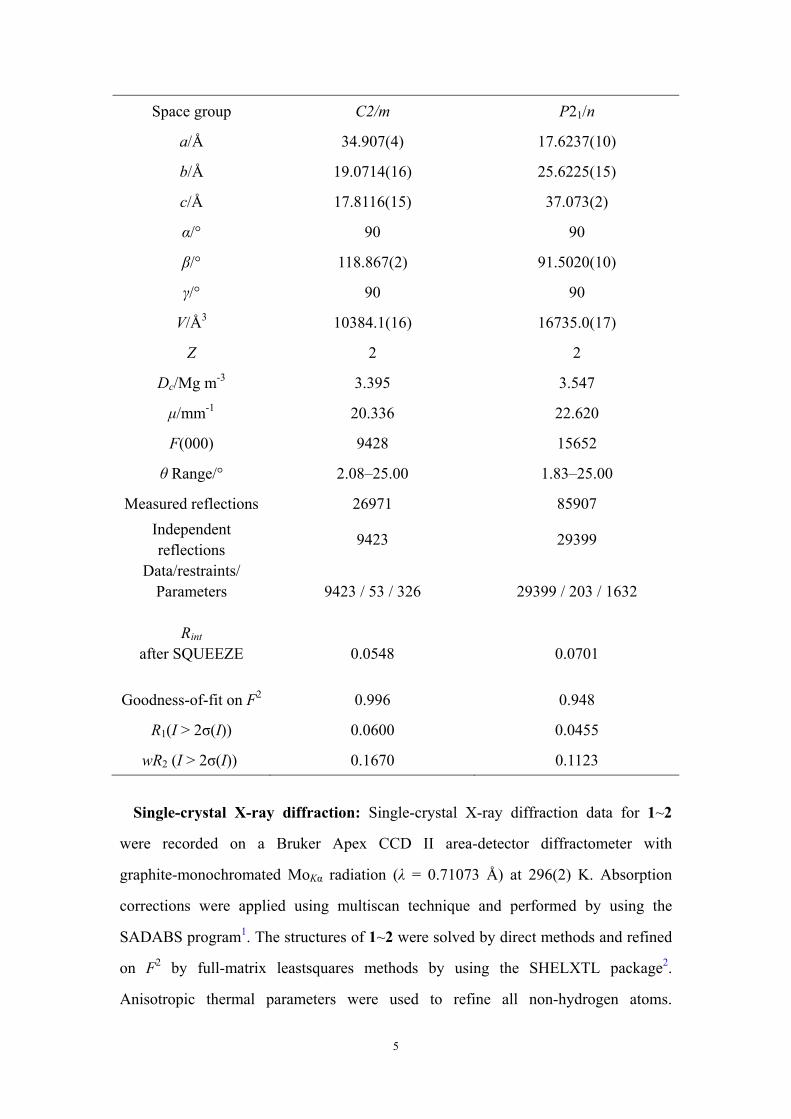
Space group C2/m P21/n
a/Å 34.907(4) 17.6237(10)
b/Å 19.0714(16) 25.6225(15)
c/Å 17.8116(15) 37.073(2)
α/° 90 90
β/° 118.867(2) 91.5020(10)
γ/° 90 90
V/Å3 10384.1(16) 16735.0(17)
Z 2 2
Dc/Mg m-3 3.395 3.547
μ/mm-1 20.336 22.620
F(000) 9428 15652
θ Range/° 2.08–25.00 1.83–25.00
Measured reflections 26971 85907
Independent reflections
9423 29399
Data/restraints/ Parameters
9423 / 53 / 326 29399 / 203 / 1632
Rint
after SQUEEZE
0.0548 0.0701
Goodness-of-fit on F2 0.996 0.948
R1(I > 2σ(I)) 0.0600 0.0455
wR2 (I > 2σ(I)) 0.1670 0.1123
Single-crystal X-ray diffraction: Single-crystal X-ray diffraction data for 1~2
were recorded on a Bruker Apex CCD II area-detector diffractometer with
graphite-monochromated MoKα radiation (λ = 0.71073 Å) at 296(2) K. Absorption
corrections were applied using multiscan technique and performed by using the
SADABS program1. The structures of 1~2 were solved by direct methods and refined
on F2 by full-matrix leastsquares methods by using the SHELXTL package2.
Anisotropic thermal parameters were used to refine all non-hydrogen atoms.
6
Hydrogen atoms attached to lattice water molecules were not located. The numbers of
lattice water molecules and counter cations for 1–2 were estimated by the results of
elemental analyses, TG curves, and calculations of electron count in the voids with
SQUEEZE3. CCDC 1011424 (1) and 1011425 (2) contain the supplementary
crystallographic data for this paper.
References:
[1] Sheldrick, G. SADABS; ver. 2.10; University of Gottingen: Göttingen, Germany,
2003.
[2] Sheldrick, G. M. SHELXL-97, Program for the Refinement of Crystal Structure;
University of Gottingen: Göttingen, Germany, 1993.
[3] Spek, A. L. PLATON, A Multipurpose Crystallographic Tool; Utrecht
University, Utrecht, The Netherlands, 2003.
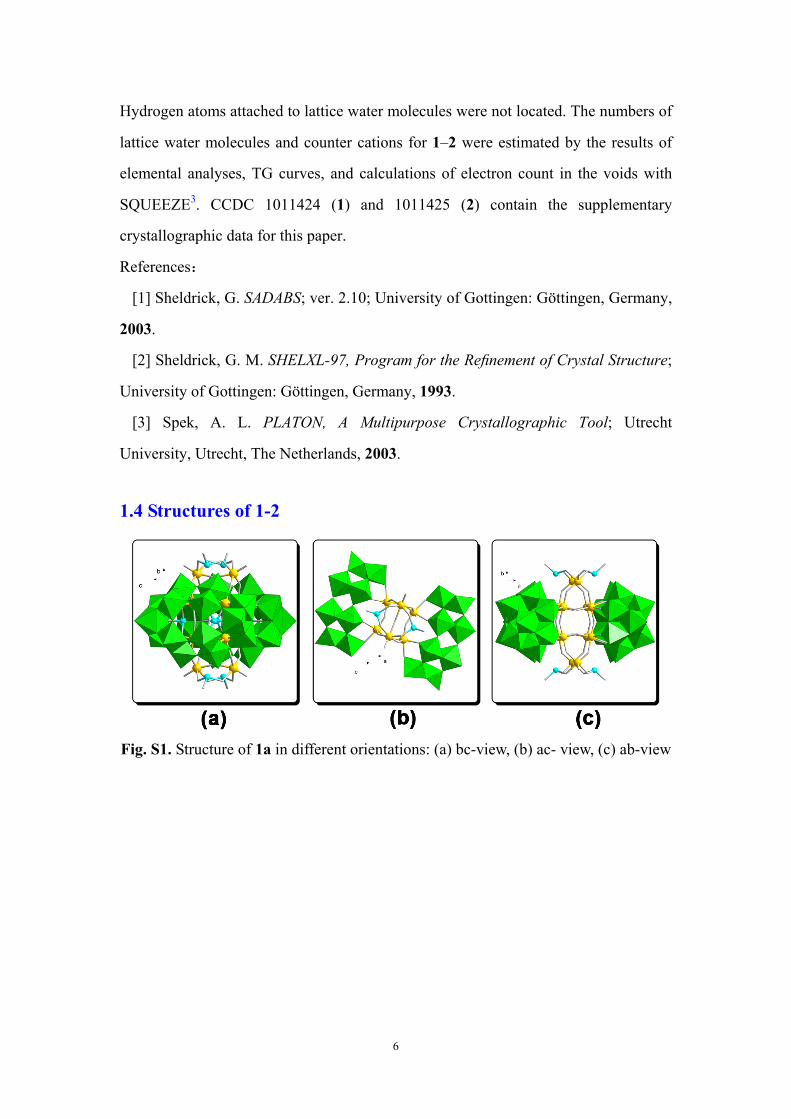
1.4 Structures of 1-2
Fig. S1. Structure of 1a in different orientations: (a) bc-view, (b) ac- view, (c) ab-view

7
Fig. S2. Structure of the {Fe6W6} unit in 1a: (a) side-view, (b) top-view. Connection patterns of one regular cube and two triangular prism topologies (b).
Fig. S3. Structure of 2a in different orientations: (a) bc-view, (b) ac- view, (c) ab-view
8
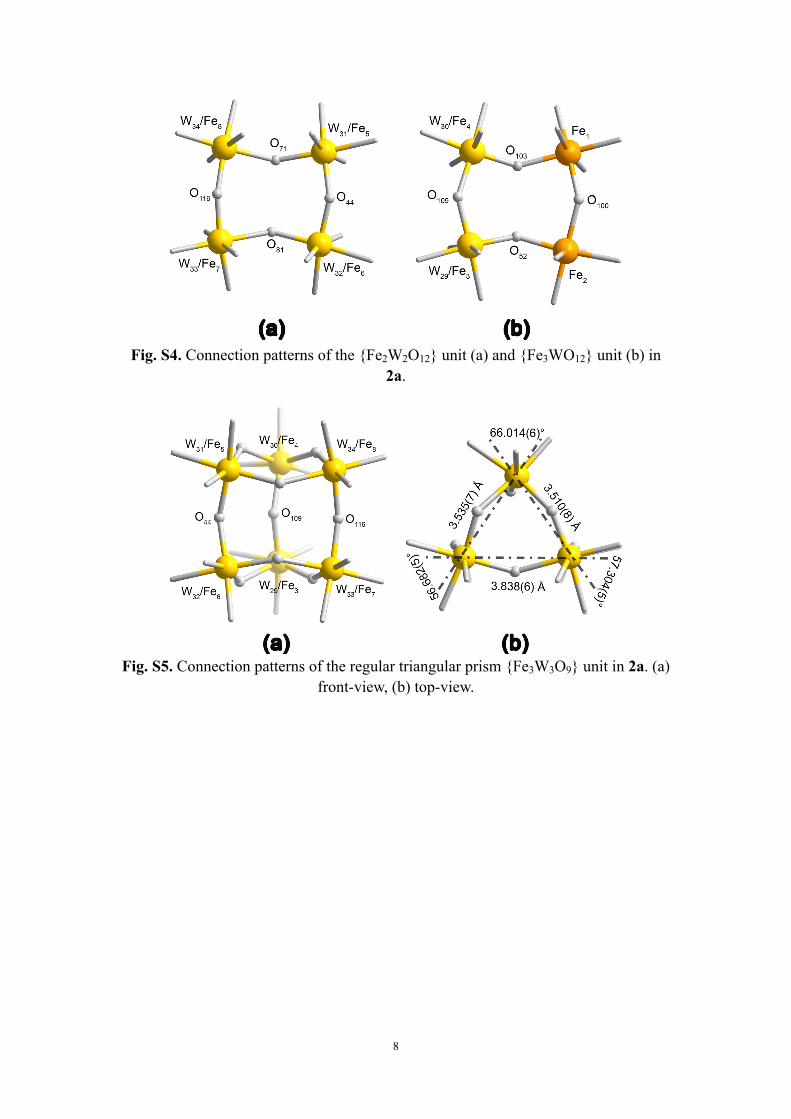
Fig. S4. Connection patterns of the {Fe2W2O12} unit (a) and {Fe3WO12} unit (b) in
2a.
Fig. S5. Connection patterns of the regular triangular prism {Fe3W3O9} unit in 2a. (a)
front-view, (b) top-view.
9
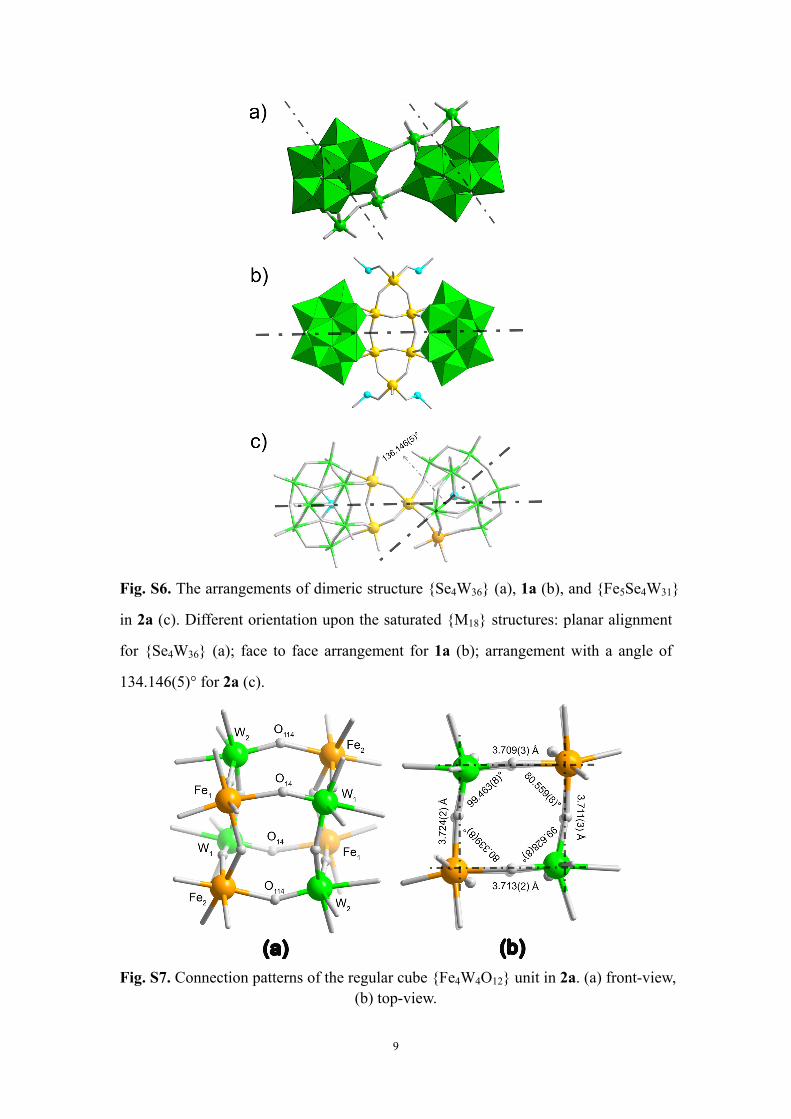
Fig. S6. The arrangements of dimeric structure {Se4W36} (a), 1a (b), and {Fe5Se4W31}
in 2a (c). Different orientation upon the saturated {M18} structures: planar alignment
for {Se4W36} (a); face to face arrangement for 1a (b); arrangement with a angle of
134.146(5)° for 2a (c).
Fig. S7. Connection patterns of the regular cube {Fe4W4O12} unit in 2a. (a) front-view, (b) top-view.

10
1.5 The BVS Calculation Result of All the Oxygen Atoms
Table S2. The BVS calculation results of all the oxygen atoms in 1. Oxygen
Code Bond
Valence Protonation
Degree Oxygen
Code Bond
Valence Protonation
Degree O1 1.255 1 O24 1.041 1 O2 0.992 1 O27 1.000 1 O8 0.960 1 O35 0.555 1 O11 0.987 1 O39 1.365 1
Total 16 protons per cluster
Table S3. The BVS calculation results of all the oxygen atoms in 2. Oxygen
Code Bond
Valence Protonation
Degree Oxygen
Code Bond
Valence Protonation
Degree O7 1.231 1 O82 1.053 1 O31 1.245 1 O92 1.410 1 O48 0.575 1 O94 1.492 1 O60 0.556 1 O100 0.861 1 O62 0.979 1
Total 18 protons per cluster
Table S4. The BVS calculation result of all SeIV atoms in compounds 1 and 2. Compound 1
Code Bond Valence Code Bond Valence Se1 3.814 Se2 3.928 Se3 3.918
Compound 2 Code Bond Valence Code Bond Valence Se1 3.913 Se2 3.956 Se3 4.209 Se4 4.136

11
Section 2 Experimental Section
2.1 Materials and Physical Measurements
Characterization: Elemental analysis of Na, Se, W, and Fe were performed with a
Leaman inductively coupled plasma (ICP) spectrometer; C and N were performed on
a Perkin-Elmer 2400 CHN elemental analyzer. IR spectra were recorded on an Alpha
Centauri FTIR spectrophotometer on pressed KBr pellets in the range 400~4000 cm-1.
Water contents were determined by TG analyses on a PerkinElmer TGA7 instrument
in flowing N2 with a heating rate of 10 °C min-1. Electrospray ionization mass
spectrometry was carried out on a Bruker Micro TOF-QII instrument (1 mg/mL).
Magnetic measurements: Magnetic susceptibility measurements on 1–2 were
performed with a Quantum Design SQUID magnetometer (MPMS-XL). The dc
measurements were conducted from 2.0 to 300 K at 0.1 T on polycrystalline samples.
Experimental data were corrected for the sample holder and for the diamagnetic
contribution of the sample, calculated from Pascal constants.
Electrochemical experiments: Electrochemical measurements were carried out on a
CHI 660 electrochemical workstation at room temperature. Thrice-distilled water was
used throughout the experiments. All solutions were deaerated by bubbling pure argon
prior to the experiments and the electrochemical cell was kept under an argon
atmosphere throughout the experiment. A conventional three-electrode system was
used with a 1.5 mm glassy carbon working electrode, an Ag/AgCl used as electrode,
and a platinum wire counterelectrode. The glassy carbon working electrodes were
polished with alumina on polishing pads, rinsed with distilled water, and sonicated in
H2O before each experiment. The scan rate was 50~450 mV s-1. All potentials were
measured and reported versus Ag/AgCl. Solutions 1 and 2 in 0.5 M H2SO4/Na2SO4
(pH = 2.5) were used. A pHS-25B pH meter was used for pH measurements.
Photocatalytic Measurements: Photocatalytic reactions were carried out in a Pyrex
12
inner-irradiation-type reaction vessel with a magnetic stirrer at room temperature. The
reactant solution was evacuated using N2 several times to ensure complete air removal
and then irradiated by using a 500 W mercury lamp. The produced H2 was analyzed
by a GC9800 instrument with a thermal conductivity detector and a 5 Å molecular
sieve column (2 mm × 2 mm) using N2 as carrier gas.
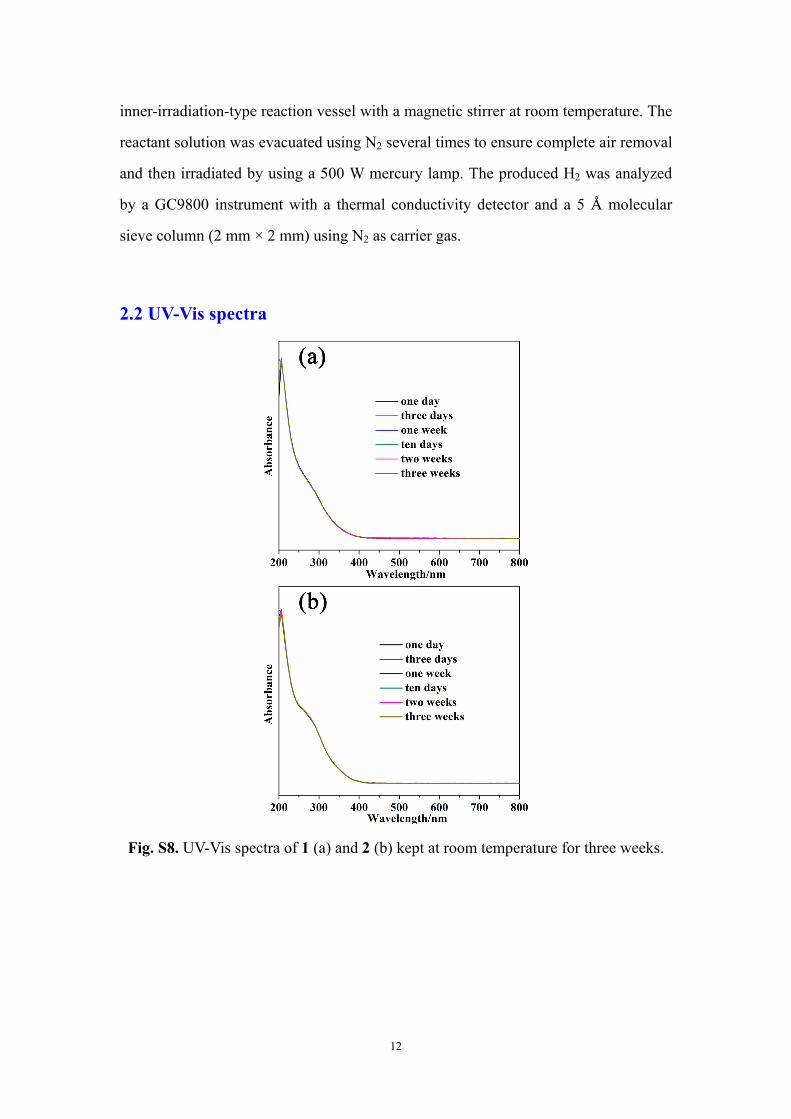
2.2 UV-Vis spectra
Fig. S8. UV-Vis spectra of 1 (a) and 2 (b) kept at room temperature for three weeks.

13
Fig. S9. The diffuse reflectance UV-vis-NIR spectra of K-M function vs. energy (eV)
of 1 (a), 2 (b), and {Se4W36} (c).
2.3 ESI-MS
Fig. S10. ESI-MS of 1 in H2O.
Table S5. Assignment of peaks in negative mode Mass spectrum of 1a.
Observed
m/z
Calculated
m/z Charge Polyanion
2380.0 2380.1 -4 {Na5(C2H8N)H8[Fe6Se6W34O124(OH)16](H2O)2}4-
2417.3 2417.6 -4 {Na11(C2H8N)H2[Fe6Se6W34O124(OH)16](H2O)3}4-
2432.7 2433.4 -4 {Na11(C2H8N)2H[Fe6Se6W34O124(OH)16](H2O)4}4-
2450.6 2450.4 -4 {Na10(C2H8N)4[Fe6Se6W34O124(OH)16](H2O)4}4-
2468.3 2468.4 -4 {Na10(C2H8N)4[Fe6Se6W34O124(OH)16](H2O)8}4-
2486.1 2485.4 -4 {Na9(C2H8N)4H[Fe6Se6W34O124(OH)16](H2O)13}4-

14
Fig. S11. ESI-MS of 2 in H2O.
Table S6. Assignment of peaks in negative mode Mass spectrum of 2a.
Observed
m/z
Calculated
m/z Charge Polyanion
2111.3 2111.2 -8 {(NH4)5Na8H7[Fe10(H2O)4Se8W62O222(OH)18](H2O)5}8-
2766.2 2766.3 -6 {(NH4)NaH20[Fe10(H2O)4Se8W62O222(OH)18](H2O)}6-
2.4 Cyclic Voltammetry
Fig. S12. Cyclic voltammograms of 1 in aqueous 0.5 M H2SO4/Na2SO4 solutions (pH
= 2.50). The scan rate was 50 mV s−1 (a). Cyclic voltammograms of 1 at different scan
15
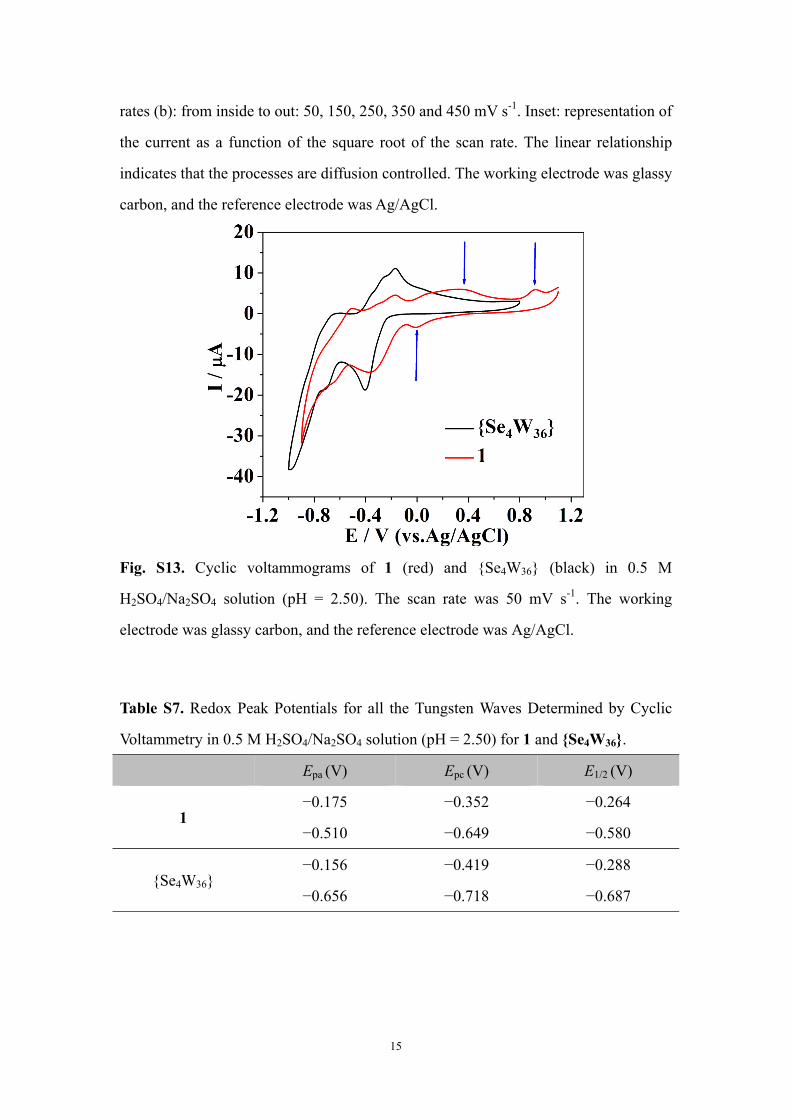
rates (b): from inside to out: 50, 150, 250, 350 and 450 mV s-1. Inset: representation of
the current as a function of the square root of the scan rate. The linear relationship
indicates that the processes are diffusion controlled. The working electrode was glassy
carbon, and the reference electrode was Ag/AgCl.
Fig. S13. Cyclic voltammograms of 1 (red) and {Se4W36} (black) in 0.5 M
H2SO4/Na2SO4 solution (pH = 2.50). The scan rate was 50 mV s-1. The working
electrode was glassy carbon, and the reference electrode was Ag/AgCl.
Table S7. Redox Peak Potentials for all the Tungsten Waves Determined by Cyclic
Voltammetry in 0.5 M H2SO4/Na2SO4 solution (pH = 2.50) for 1 and {Se4W36}.
Epa (V) Epc (V) E1/2 (V)
1 −0.175 −0.352 −0.264
−0.510 −0.649 −0.580
{Se4W36}
−0.156 −0.419 −0.288
−0.656 −0.718 −0.687

16
Fig. S14. Cyclic voltammograms of 2 in aqueous 0.5 M H2SO4/Na2SO4 solutions (pH
= 2.50). The scan rate was 50 mV s−1 (a). Cyclic voltammograms of 2 at different scan
rates (b): from inside to out: 50, 150, 250, 350 and 450 mV s-1. Inset: representation of
the current as a function of the square root of the scan rate. The linear relationship
indicates that the processes are diffusion controlled. The working electrode was glassy
carbon, and the reference electrode was Ag/AgCl.
Table S8. Redox Peak Potentials for all the Tungsten Waves Determined by Cyclic
Voltammetry in 0.5 M H2SO4/Na2SO4 solution (pH = 2.50) for 2.
Epa (V) Epc (V) E1/2 (V)
2
−0.296 −0.362 −0.329
−0.518 −0.733 −0.626
−0.599 −0.943 −0.771
Electrochemistry: Cyclic voltammetry (CV) experiments were performed to examine
the redox properties of 1 and 2 in 0.5 M H2SO4/Na2SO4 solutions pH = 2.50. All of
the two compounds show the waves associated with the reduction of WVI centers
between –0.943 and –0.352 V as well as the redox process of FeIII centers from
–0.116 to +0.919 V (vs Ag/AgCl), which are in good agreement with reported
FeIII-containing POT compounds.1 In a sulfate pH 2.50 medium, the CV of 1 (Fig. S12)
at a scan rate of 50 mV s-1 shows the main characteristic peaks associated with W
17
centered redox couples in the region −0.175 V to −0.649 V of potential values vs
Ag/AgCl. Two separated redox couples of waves at E1/2 = –0.580 V (I/I’) and E1/2 =
–0.264 V (II/II’) [E1/2 = (Epa + Epc)/2], corresponding to the redox processes of WVI
centers, respectively (Tab. S6). Also, Fig. S13 compares the CVs of 1 and the
[(Se2W18O60)2(μ2-O)4]16–2 recorded in 0.5 M H2SO4/Na2SO4 solution (pH 2.5, scan
rate was 50 mV s-1). This study might allow us to extract some distinct features of 1,
which is due to the introduction of FeIII centers and the extra coordinate SeIV centers.
In the cathodic branch of the CV of 1, it can be observed a reduction peak located at
–0.028 V (IV’) vs Ag/AgCl, which does not exist in the pattern of the
[(Se2W18O60)2(μ2-O)4]16– (Fig. S13). This wave is assigned to the reduction of the FeIII
centres. As a matter of fact, the FeIII centres are known to be more easily reduced than
the WVI centers as seen in several FeIII-containing POTs.1e,3 In the positive region of
potentials, there are also two oxidation peaks that does not exist in the pattern of the
[(Se2W18O60)2(μ2-O)4]16–, it should be identified: one wave appears at about +0.919 V
(IV)1d,1e, which is attributed to the oxidation of free FeII; the other peak located at
+0.378 V (III) can be assigned to the oxidation of SeIV.2,4 The extra disorder
coordinated SeIV centers contributes the conspicuous oxidation waves, which can be
recognized in 1 while hardly to be found in [(Se2W18O60)2(μ2-O)4]16–. After increasing
the scan rates from 50 to 450 mV s-1 (Fig. S12b), the SeIV-based oxidation waves
gradually enhance while the FeII-based oxidation waves show a weaken trend, and the
peak positions remain no shifts as described in the literature for other POMs.5 Above
100 mV s−1 the peak currents were proportional to the square root of the scan rate,
demonstrating that the redox process becomes diffusion-controlled, similar behaviors
were observed in the case of 2 (Fig. S12b and S14b). Furthermore, similar FeIII-waves
also occur in the CV of 2: the oxidation wave appeared at about +0.644 V (IV) and
the reduction peak located at –0.116 V (IV’) (vs Ag/AgCl). Fig. S14 shows the main
characteristic peaks associated with W centered redox couples of 2 in the region
–1.200 to +1.200 V of potential values vs Ag/AgCl at a scan rate of 50 mV s-1.
Scanning toward the negative region of potential values, the reduction of W centers
occurs through three redox couples, with the corresponding E1/2 peak potentials

18
located at −0.329 (III/III’), −0.626 (II/II’), and −0.771 V (I/I’) (vs Ag/AgCl) (Tab. S7),
respectively. It is well-known for the electrochemical behavior of the majority of the
POMs that the number and the characteristics of these W waves depend on the pH and
the buffering strength of the electrolyte.5
References:
[1] (a) T. M. Anderson, X. Zhang, K. I. Hardcastle and C. L. Hill, Inorg. Chem., 2002,
41, 2477–2488; (b) I. M. Mbomekalle, B. Keita, L. Nadjo, P. Berthet, K. I. Hardcastle,
C. L. Hill and T. M. Anderson, Inorg. Chem., 2003, 42, 1163–1169; (c) B. Keita, I. M.
Mbomekalle, L. Nadjo, T. M. Anderson and C. L. Hill, Inorg. Chem., 2004, 43,
3257–3263; (d) B. Godin, Y.-G. Chen, J. Vaissermann, L. Ruhlmann, M. Verdaguer
and P. Gouzerh, Angew. Chem., Int. Ed., 2005, 44, 3072–3075; (e) S. S. Mal, M. H.
Dickman, U. Kortz, A. M. Todea, A. Merca, H. Bögge, T. Glaser, A. Müller, S.
Nellutla, N. Kaur, J. van Tol, N. S. Dalal, B. Keita and Louis Nadjo, Chem.–Eur. J.,
2008, 14, 1186–1195; (f) A. H. Ismail, B. S. Bassil, G. H. Yassin, B. Keita and U.
Kortz, Chem.–Eur. J., 2012, 18, 6163–6166.
[2] W.-C. Chen, L.-K. Yan, C.-X. Wu, X.-L. Wang, K.-Z. Shao, Z.-M. Su and E.-B.
Wang, Cryst. Growth Des., 2014, DOI: 10.1021/cg500719q.
[3] (a) J. E. Toth, F. C. Anson, J. Electroanal. Chem. 1989, 256, 361–370; (b) B.
Keita, A. Belhouari, L. Nadjo, R. Contant, J. Electroanal. Chem. 1998, 442, 49–57.
[4] (a) W.-C. Chen, H.-L. Li, X.-L. Wang, K.-Z. Shao, Z.-M. Su and E.-B. Wang,
Chem.–Eur. J., 2013, 19, 11007–11015; (b) J. M. Cameron, J. Gao, L. Vilà-Nadal,
D.-L. Long and L. Cronin, Chem. Commun., 2014, 2155–2157; (c) J. M. Cameron, J.
Gao, D.-L. Long and L. Cronin, Inorg. Chem. Front., 2014, 1, 178–185.
[5] (a) Jabbour, D.; Keita, B.; Mbomekalle, I. M.; Nadjo, L.; Kortz, U. Eur. J. Inorg.
Chem. 2004, 2036. (b) Bi, L.-H.; Wang, E.-B.; Peng, J.; Huang, R.-D.; Xu, L.; Hu,
C.-W. Inorg. Chem. 2000, 39, 671. (c) Bassil, B. S.; Kortz, U.; Tigan, A. S.;
ClementeJuan, J. M.; Keita, B.; Oliveira, P.; Nadjo, L. Inorg. Chem. 2005, 44, 9360.
(d) Mbomekalle, I. M.; Keita, B.; Nierlich, M.; Kortz, U.; Berthet, P.; Nadjo, L. Inorg.
Chem. 2003, 42, 5143. (e) Keita, B.; Lu, Y.-W.; Nadjo, L.; Contant, R. Electrochem.
Commun. 2000, 2, 720.
19
2.5 Magnetism
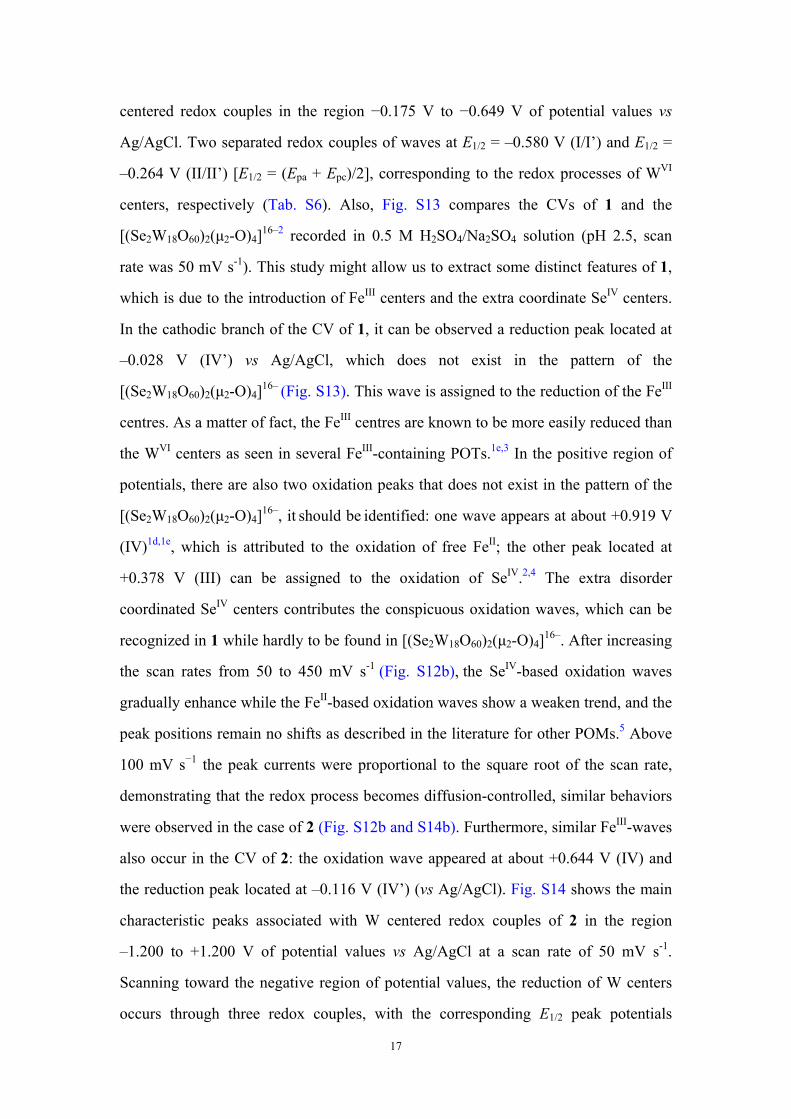
Fig. S15. χ and χT vs T curves of 1 (insert: 1/χ vs T curve).
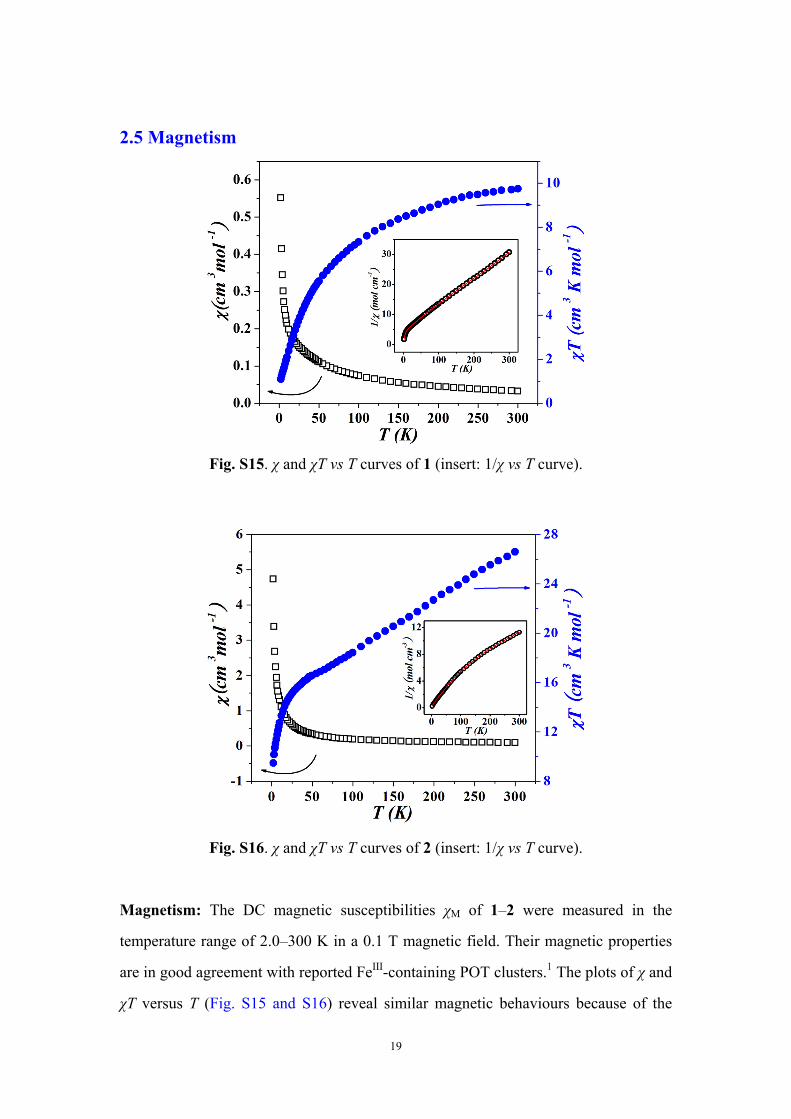
Fig. S16. χ and χT vs T curves of 2 (insert: 1/χ vs T curve).
Magnetism: The DC magnetic susceptibilities χM of 1–2 were measured in the
temperature range of 2.0–300 K in a 0.1 T magnetic field. Their magnetic properties
are in good agreement with reported FeIII-containing POT clusters.1 The plots of χ and
χT versus T (Fig. S15 and S16) reveal similar magnetic behaviours because of the

20
similar triangular prism Fe-topologies. As for 1, the value of χ slowly increases from
3.25 × 10⁻² cm3 mol−1 at 300 K to 0.15 cm3 mol−1 at 25 K and then exponentially to
the maximum of 0.55 cm3 mol−1 at 2 K. At 300 K the value of χT value (9.74 cm3 K
mol−1) is still significantly below the expected high-temperature limit of 26.25 cm3 K
mol−1 for six FeIII centers (S = 5/2, assuming g = 2.0), indicating antiferromagnetic
interactions1b. In addition, the 1/χ versus T curve (insets in Fig. S15) is in accordance
with the Curie–Weiss law in high temperature region, yielded a Curie constant of C =
11.65 cm3 K mol−1 and a Weiss constant θ of −57.24 K, which consolidates the
presence of antiferromagnetic coupling within FeIII centers. Similar situation also
occurs in 2: at room temperature the χT value of 26.59 cm3 K mol−1 is lower than the
calculated χT value of 43.75 cm3 K mol−1 for ten high-spin FeIII (S = 5/2, assuming g
= 2.0) centers, indicating antiferromagnetic interactions. Moreover, the 1/χ versus T
curve (insets in Fig. S16) is in accordance with the Curie–Weiss law in high
temperature region, yielded a Curie constant of C = 39.89 cm3 K mol−1 and a Weiss
constant θ of −151.64 K, the large and negative value of θ indicates a dominant
antiferromagnetic coupling interaction between the FeIII centers.
References:
[1] (a) B. Godin, Y.-G. Chen, J. Vaissermann, L. Ruhlmann, M. Verdaguer and P.
Gouzerh, Angew. Chem., Int. Ed., 2005, 44, 3072–3075; (b) C. P. Pradeep, D.-L.
Long, P. Kögerler and L. Cronin, Chem. Commun., 2007, 4254–4256; (c) S. S. Mal,
M. H. Dickman, U. Kortz, A. M. Todea, A. Merca, H. Bögge, T. Glaser, A. Müller, S.
Nellutla, N. Kaur, J. van Tol, N. S. Dalal, B. Keita and Louis Nadjo, Chem.–Eur. J.,
2008, 14, 1186–1195; (d) A. H. Ismail, B. S. Bassil, G. H. Yassin, B. Keita and U.
Kortz, Chem.–Eur. J., 2012, 18, 6163–6166; (e) P. I. Molina, H. N. Miras, D.-L. Long
and L. Cronin, Dalton Trans., 2014, 43, 5190-5199. (f) J.-W. Zhao, Q.-X. Han, D.-Y.
Shi, L.-J. Chen, P.-T. Ma, J.-P. Wang, J.-Y. Niu. J. Sol. St. Chem., 2011, 184,
2756–2761.

21
Section 3 Supplementary Physical Characterizations
Fig. S17. IR spectrum of 1: The characteristic peaks at 1021, 954, 809, and 746 cm–1
are ascribed to vibrations of ν(Se–O), ν(W=Od), ν(W–Ob), and ν(W–Oc), respectively.
The broad peak at 3443 cm–1 and the strong peak at 1605 cm–1 are attributed to the
lattice water molecules and aqua ligands. The peaks at 3136, 2790, 1526, 1464, and
1406 cm-1 are assigned to {C2H8N} organic molecules.
Fig. S18. IR spectrum of 2: The characteristic peaks at 960, 864, 741, and 640 cm–1
are ascribed to vibrations of ν(Se–O), ν(W=Od), ν(W–Ob), and ν(W–Oc), respectively.
The broad peak at 3437 cm–1 and the strong peak at 1620 cm–1 are attributed to the
lattice water molecules and aqua ligands.

22
Fig. S19. The XRPD patterns for simulated (a) and as-synthesized (b) of 1.
Fig. S20. The XRPD patterns for simulated (a) and as-synthesized (b) of 2.

23
Fig. S21. TG curve of 1. The first weight loss is in the temperature range of 50 ~
200 °C. The value of ca. 7.40 % is in accordance with the calculated value of 7.46 %
(~ 44H2O). The second weight loss in the temperature range of 200 ~ 300 °C is
attributed to the loss of all {C2H8N} organic cations. The value of 1.79 % is close to
the calculated value of 1.73 % (~4{C2H8N}). Then the structure begins to decompose.
Fig. S22. TG curve of 2. The first weight loss is in the temperature range of 50 ~
200 °C. The value of ca. 4.65% is in accordance with the calculated value of 4.63 %
(~46H2O). Then the structure begins to decompose.