1 Tudy of Geothermal Power Plant Electrical and Control System With Emphasis on Reliability Aspects

Aspects of product quality in
plant production
Part:
Quality of oil, protein and fibre crops J. Vollmann, November 2016

Oilseed crop species • oilseed rape (canola)
• sunflower
• oil pumpkin (squash)
• soybean
• olive
• poppy
• oilseed flax (linseed)
• safflower
• new crops (e.g. crambe, camelina, cuphea, lesquerella etc.)
• tropical / subtropical crops: sesame, cotton, peanut, coco nut, palm species ...

Oilseed quality - the example of olive
Olive (Olea europaea L.; Oleaceae) "extra-virgin olive oil": best quality, cold-pressed, first pressing only, no additives, less than 1g free fatty acids per 100 grams "virgin olive oil": less than 2 g free fatty acids ”ordinary virgin olive oil”: less than 3.3 g per 100 grams olive oil (without the term "vergin"): oil has been refined (inferior quality, which has been improved by refining) Protected designations: ”Extra-virgin olive oil” = "Natives Olivenöl extra"(D), "extra vergine" (I), "vierge extra" (F), "virgen extra" (Sp). (Obligatory trade specifications of the European Union since 1991, EU regulation No. 2568/91)
Austrian example - Rapso quality line

Quality of oilseed crops
• Oil quality: fatty acid composition,
largely determined genetically
• Oil content: crop specific trait,
influenced by agronomy and plant
breeding

Vegetable oil systematics
• fatty acid pattern ( iodine value of
vegetable oil sample ...)
• lipids: oils, waxes (long chain fatty acids
esterified to higher alcohols), lipoids
(phospholipids, glucolipids, sulpholipids,
proteolipids ...), emulgators (lecithin),
vitamins (tocopherol)
• essential fatty acids: linoleic, linolenic acid

Vegetable fatty acid properties

Vegetable oil biosynthesis
• fatty acid biosynthesis: FAS fatty acid
synthetase complex on chloroplasts
• fatty acid modifications: desaturation,
addition of functional groups such as
hydroxy or epoxy groups in
endoplasmatic reticulum (ER)
• fat (triglyceride) stored in oleosomes
(oil bodies) in cotyledons

Fatty acid
biosynthesis
(Harwood & Page,
1994)
chloroplast

Fig.: Model of oil body development in oilseeds (from: Wältermann and Steinbüchel 2005)
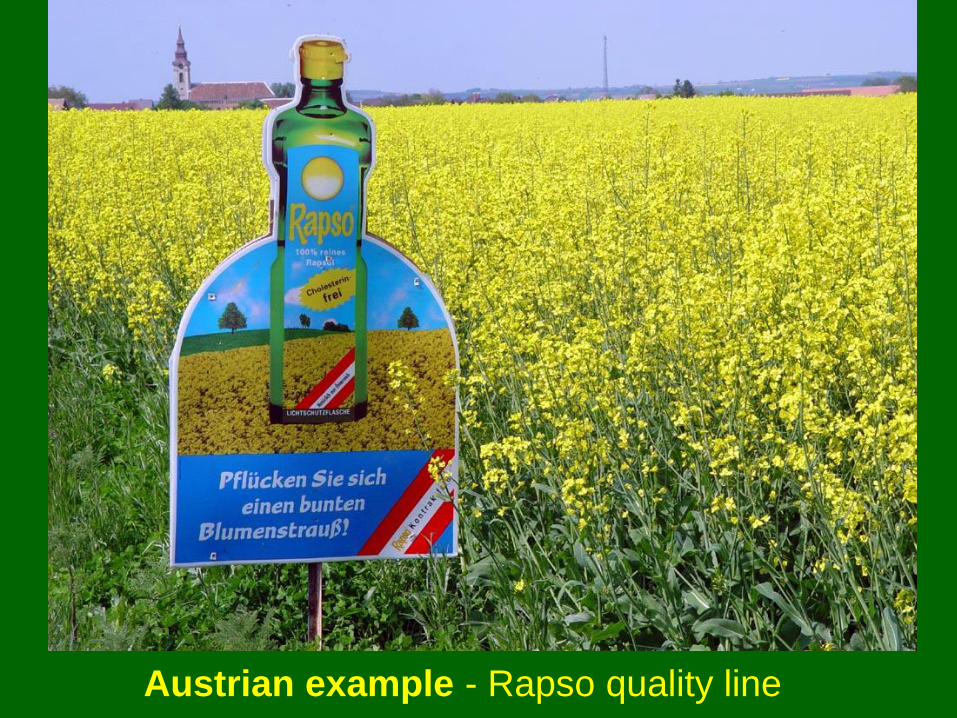
Relative fatty acid content of major
vegetable oils (standard composition)

Relative fatty acid content of special mutants

Oil characteristics of crop
species (summary)
• Brassicaceae: erucic acid (C22:1), eicosenic acid (C20:1)
• Asteraceae: linoleic acid (C18:2)
• Leguminosae: oleic acid (C18:1), linoleic acid (C18:2)
• linseed: linolenic acid (C18:3)
• Cuphea-species: medium chain fatty acids (C10:0 - C14:0)
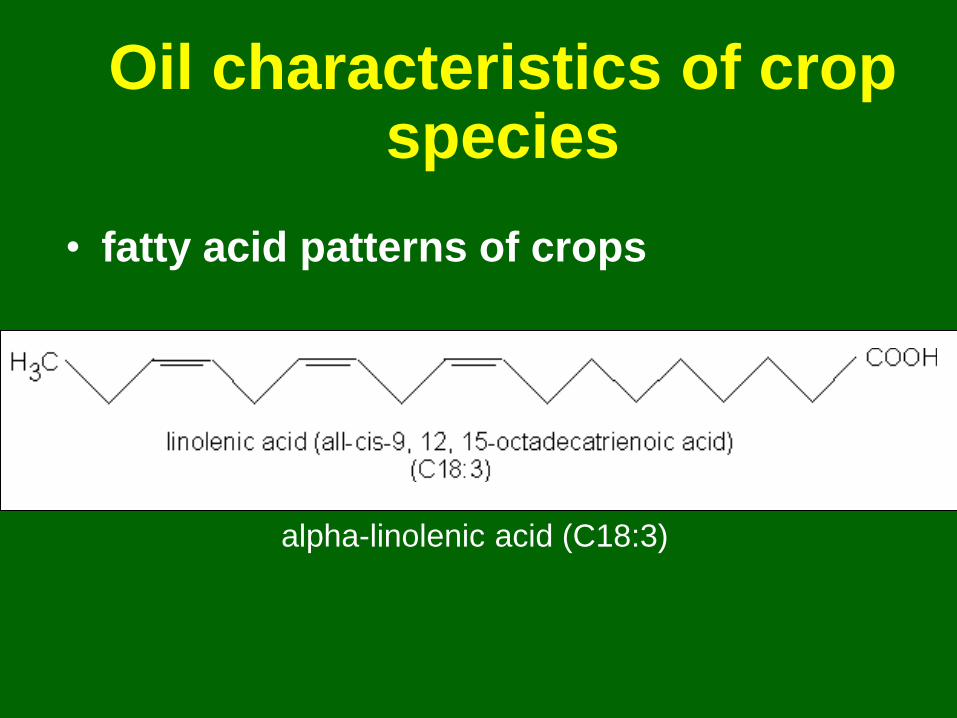
Oil characteristics of crop species
• fatty acid patterns of crops
alpha-linolenic acid (C18:3)

Conflict over linolenic acid Linolenic acid (C18:3) is an essential fatty acid (omega-3 fatty acid). However, low-linolenic acid genotypes are promoted in soybean, rapeseed, linseed ... because of the trans-fatty acid issue.

Selection for high oil content: The famous
Illinois long term selection experiment in maize

Breeding for high oil content
• increased oil content of embryo (more
oleosomes or larger oleosomes in
cotyledon tissue)
• reduction of non-oil seed components
(achene, seed hull etc.)
2 ways to improve oil content:

Breeding for high
oil content:
Seed tissue
Trans-sections of
sunflower cotyledon cells
of a low oil (upper picture)
and a high oil (lower
picture) genotype.
o: oil body, p: protein body
Mantese et al. 2006
low oil
high oil

Breeding for high oil content
• sunflower, safflower: oil content increased from 25-35 % to 40-55 % through selection of genotypes with thinner achenes
• rapeseed: higher oil content in yellow-seeded genotypes (thinner hull)
• linseed: yellow seeded genotypes with reduced seed coat content contain 4-8 % more oil than genotypes with brown seed
• poppy: oil content increased by 3-5 % in genotypes with white seeds
• oil pumpkin: “Schalenloser Steirischer Ölkürbis” with increased oil content due to thin testa
examples

Low- and high-
oil types of
sunflower seed,
rapeseed,
linseed, poppy
and oil pumpkin.
High-oil
genotypes have
thin testa (seed
coat) or thinner
achene walls
(Vollmann & Rajcan 2009)

Linseed / oilseed flax
(Linum usitatissimum)
Yellow seed variety (right): larger seed weight, higher oil
content, less mucilage because of thinner seed coat than
brown seeded variety

Oil content - environmental influences
environment
GE 93 RE 93 GE 94 RE 94
oil
con
ten
t (
g k
g-1
)
375
400
425
450
475Camelina (Leindotter, false flax):
oil content of 10
genotypes considerably
affected by
environmental
conditions. Higher oil
content in environments
with lower temperature
and higher precipitation
during seed filling
period
seed yield ( kg ha-1
)
1600 2000 2400
oil
co
nte
nt (
g k
g-1
)
370
380
390
400
410
420
430
440
r = 0.57**
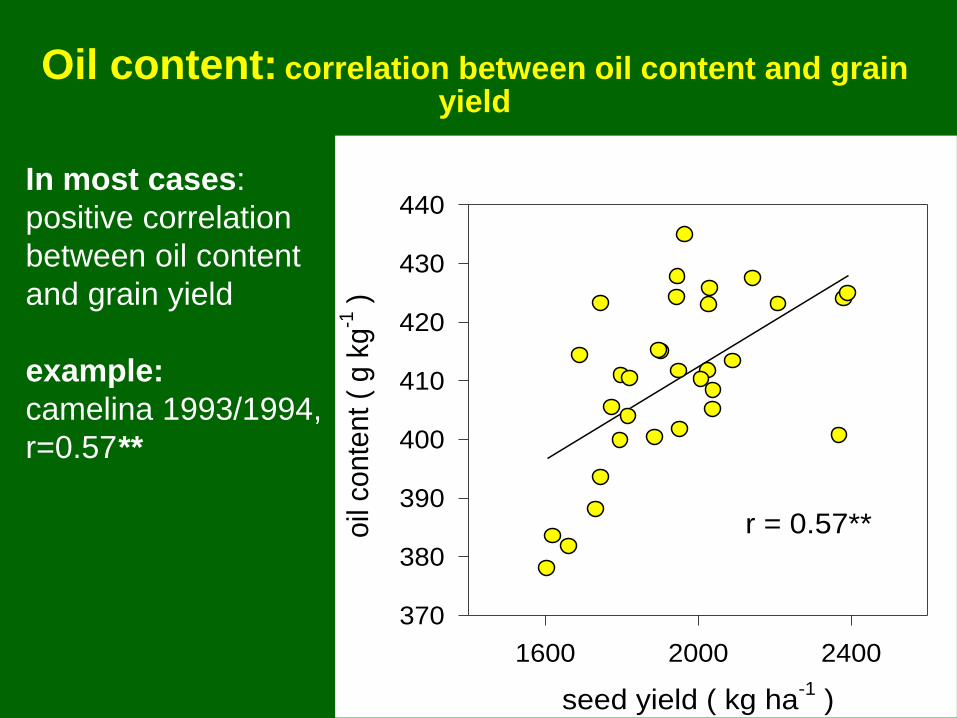
In most cases:
positive correlation
between oil content
and grain yield
example:
camelina 1993/1994,
r=0.57**
Oil content: correlation between oil content and grain yield

Oil content - correlation between oil and protein content
seed protein content (g/kg)
400 410 420 430 440 450
oil
conte
nt (g
/kg)
160
170
180
190
200In nearly all
species: highly
negative
correlation
between oil and
protein content
example: soybean
performance trial;
r = - 0.82
Problem:
Selection for oil
and protein

Oil content - influence of planting density
Response of sunflower to plant population(Robinson et al., 1980)
Plantsper ha
Achenesper head
1000-achene
weight (g)
Oil contentin %
Headdiameter
in cm
Plantheight in
cm17000 1223 106 37.5 28 15225000 1162 95 39.7 24 15737000 997 84 41.4 21 16549000 902 78 42.2 19 17062000 826 72 42.4 18 178
Oil content increased at higher planting density; single plants have larger
heads and a larger number of seeds per head at low density, but cannot fill
so many seeds with oil. Head moisture decreased from 68 to 50% at early
harvest and from 43 to 20% at later harvest, as plant density increased.


Oil content and quality
Oil content is highest at outer circles of a sunflower head due
to a longer seed filling period.
Influence of seed position on sunflowerquality (Diepenbrock, 1987)
Position onthe head
1000-acheneweight in g
Oil contentin %
Oleic acidin %
Linoleicacid in %
outer circle 45.1 47.2 19.0 69.3mid 41.6 45.2 17.3 71.0
inner circle 36.4 38.7 15.0 73.1


Oil content
• selection of a variety with high oil content
• optimized planting density (too low density reduces oil content)
• ensure sufficient water supply during seed filling period
• avoid excessive nitrogen fertilization, which boosts protein content, but reduces oil
• sulfur fertilization of rapeseed may increase oil content
• optimize harvesting date and technique
What can a farmer do ?

Oil quality
• genotypes with low (less than 1%) or high
(>50%) erucic acid (C22:1) content for
human consumption or technical uses,
respectively
• “conventional” genotypes, 0-genotypes (low
erucic), 00-genotypes (=canola quality: low
erucic + low content of glucosinolates)
• genetics: 2 major genes (allotetraploid!)
influencing erucic acid content
Rapeseed / Canola

Oil quality
• conventional genotypes with high linoleic
acid (50-70% C18:2) content
• “high-oleic”-sunflowers with oleic acid
(C18:1) of up to 90 % (technical
applications, high-temperature tolerant
frying oil etc.); one dominant gene for high
oleic acid content
Sunflower

Oil quality of safflower
Genotypes with different levels of stearic (C18:0), oleic
(C18:1) and linoleic (C18:2) acid content due to 3 gene loci
(Knowles, 1989)

Oil quality
Camelina
erucic acid content (%) of M2:3
-families
1 2 3 4 5
eru
cic
acid
co
nte
nt (%
) o
f in
div
idu
al M
3-lin
es
de
rive
d fro
m M
2:3
-fa
mili
es
1
2
3
4
5
6
r = 0.61 **n = 729
a
cb
variation in
erucic acid
content (C22:1)
from below 2 %
up to 6 % in
progeny from a
mutation
breeding
experiment


Oil quality
• green color of oil due to chlorophyll and
phaeophytine (chlorophyll-related
constituent)
• huge differences in vitamin E
(=tocopherols) content between pumpkin
breeding lines from Styria (Murkovic et
al., 1996)
• differences in linoleic acid content due to
location (Schuster et al., 1983)
Oil pumpkin (Cucurbita pepo L.)

Oil pumpkin (Cucurbita pepo L.)
Linoleic acid (C18:2) content (%) of 3
genotypes at different locations (N-S)
LocationGießenerÖlkürbis
Tschermak´s Ölkürbis
Hybrid3/76
Groß-Gerau, Germany 62.0 62.4 61.4Graz, Austria 59.7 60.9 56.0Nyiregyhaza, Hungary 61.0 60.4 60.8Novi Sad, Serbia 59.9 58.9 56.5Fundulea, Romania 54.9 55.4 53.1Eskisehir, Turkey 48.8 49.4 46.4Lakhmés, Tunisia 41.2 41.2 41.0(Schuster et al., 1983)

Oil pumpkin
Content of tocopherols in seeds of different
breeding lines (mg/kg)
Linealpha-
tocopherolgamma-
tocopherol
1 46 559 0 43
11 17 4718 14 41... ... ...45 64 56051 50 61074 91 59077 55 620
(Murkovic et al. 1996)

Tocopherols in general
• Tocopherols (“vitamin E”): alpha-, beta-,
gamma-, delta-isomers in different species
• antioxidant effect for vegetable oil (storability /
shelf life) and in human body
• differences in tocopherol content between
species (soybean: high, pumpkin: rather low)
• temperature effect: high temperature =
increased tocopherol content

Fatty acid pattern
• selection of a specific variety
• no significant influence of agronomy on fatty acid composition
• environment: low temperature during seed filling period reduces saturated fatty acids and increases poly-unsaturated fatty acids (C18:2, C18:3) in many species
• Optimize harvesting date and reduce mechanical damage of seed to avoid free fatty acids (FFA) and rancidity !
• storage at reduced moisture content / temperature
What can a farmer do ???


Protein crop species • soybean
• field pea
• faba bean
• common bean
• lupins
• lentil
• chickpea
• tropical / subtropical legumes: mung bean, cowpea etc.
• other legumes (alfalfa, clovers, vetches ...)
• crops with protein meal used as a by-product (e.g. rapeseed, sunflower and other oilseed meals)

Protein crop species General quality factors of food legumes for human food
and animal feed

Protein crop species

Quality of protein crops
• Protein quality/composition:
largely determined by genetic
background: amino acid
composition, amino acid sequence,
molecule size, 11S/7S etc.
• Protein content: crop specific
character, influenced by agronomy
and plant breeding

Protein quality
• concept of the “IDEAL PROTEIN”: a protein, in which no amino acid is present in a minimum concentration for nutrition (e.g. for pig fattening)
• biological value of a protein is given according to its distance from the “ideal protein”
• protein nutrition: plant proteins are dissolved to amino acids, di-peptides or tri-peptides, which are taken up
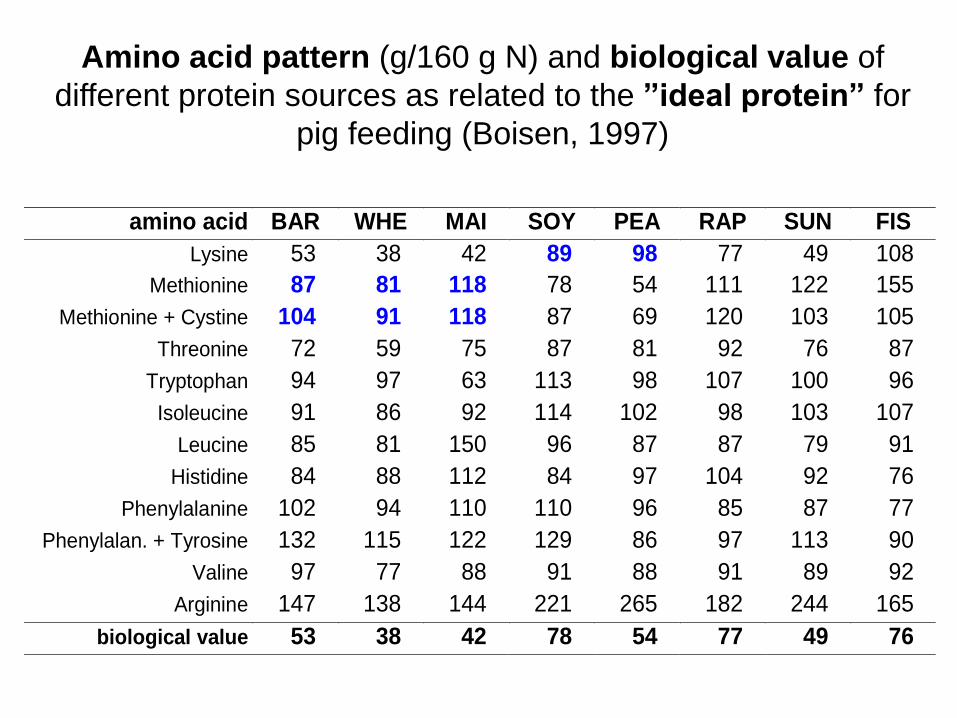
amino acid BAR WHE MAI SOY PEA RAP SUN FIS
Lysine 53 38 42 89 98 77 49 108
Methionine 87 81 118 78 54 111 122 155
Methionine + Cystine 104 91 118 87 69 120 103 105
Threonine 72 59 75 87 81 92 76 87
Tryptophan 94 97 63 113 98 107 100 96
Isoleucine 91 86 92 114 102 98 103 107
Leucine 85 81 150 96 87 87 79 91
Histidine 84 88 112 84 97 104 92 76
Phenylalanine 102 94 110 110 96 85 87 77
Phenylalan. + Tyrosine 132 115 122 129 86 97 113 90
Valine 97 77 88 91 88 91 89 92
Arginine 147 138 144 221 265 182 244 165
biological value 53 38 42 78 54 77 49 76
Amino acid pattern (g/160 g N) and biological value of
different protein sources as related to the ”ideal protein” for
pig feeding (Boisen, 1997)

Protein functions
• enzyme (e.g. lipoxygenase)
• storage protein
• taste
• structural protein
• solubility (food technology parameter)
• gelating properties (e.g. tofu)
• nutritional value
• antinutritional value / allergenic effect ...
Protein functions and characteristics
Protein content
• protein content of a set of soybean
genotypes grown in Gross Enzersdorf
from 1993-1998; considerable influence
of season; higher protein content in
seasons with high temperature and low
precipitation during the seed filling
period; consistent genetic differences
environmental and genetic influences on
soybean protein content

environmental and
genetic influences
on soybean protein
content Year
1993 1994 1995 1996 1997 1998
Se
ed
pro
tein
co
nte
nt
(g k
g-1
)
325
350
375
400
425
450
475 Apache
Ceresia
Proto
Ultra
1993 1994 1995 1996 1997 1998
275
300
325
350
375
400
425
450
475
a
b

Protein content - environmental influences
Location
GE PA GL
325
350
375
400
425
450
475
variation of
protein content
in a set of
soybean
genotypes in 3
environments
due to soil
fertility
differences
Protein content - environmental influences
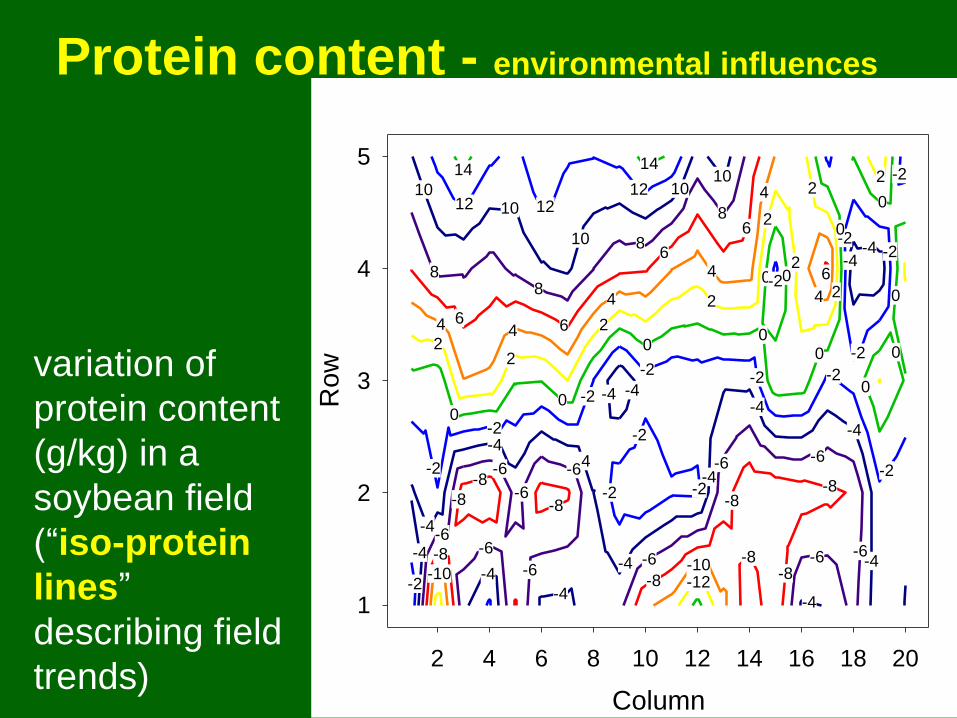
variation of
protein content
(g/kg) in a
soybean field
(“iso-protein
lines”
describing field
trends) Column
2 4 6 8 10 12 14 16 18 20
Row
1
2
3
4
5
0
-2
-2
-2-2-2
2
0
-2-4-4
0
0
-2
-2
-4
-4-4
-4
-4
-4
-4
-4-6
-6 -6
-6
6
4 2
2
00
00
0
0
-8
-8-8
-8-6
2
-4
00-2
22
2
2
2
6 6
6
6
4 4
4
4
4
-8
10
88
8
8
-10
-2
-2-2
-12
1212
10
10
1010
14
-4
-2
-2
-2 -4
-6
-6
-8
-4
-6
-6
12
-8
-8
-4
-6
14
-6
-8
-10-2
-4

340 370 400 430
Ge
no
typ
e
Ultra
Ottawa 127GiesoKalmit
LabradorLeopardPolankaDorenaCeresia
Ma.Arrow
M6X-89Dom
OAC FrontierCarusoLeman
Sundance
BirkaOttawa 68
HM-261
Nebraska
Apache
M6X-111OAC Vision
Proto
Nattosan
Seed protein content (g kg-1)
340 370 400 430 340 370 400 430
control inoculation nitrogen at R1
LSD0.05
me
an
=4
00
.2
me
an
=3
80
.0
me
an
=3
75
.1
LSD0.05
LSD0.05
similar reaction of a set of
soybean genotypes to
inoculation
(Bradyrhizobium
japonicum) or 50 kg/ha
nitrogen fertilizer with
respect to enhancement of
protein content
Protein content
agronomic influences
and genetic differences
in soybean protein
content

Negative
correlation
between protein
content and grain
yield (example
soybean)
hp_ha 97/98
yield estimate
0,5 1,0 1,5 2,0 2,5 3,0
seed p
rote
in
370
380
390
400
410
420
430
440
normal cross
high protein parent
standard
Plot 1 Regr
Protein correlations
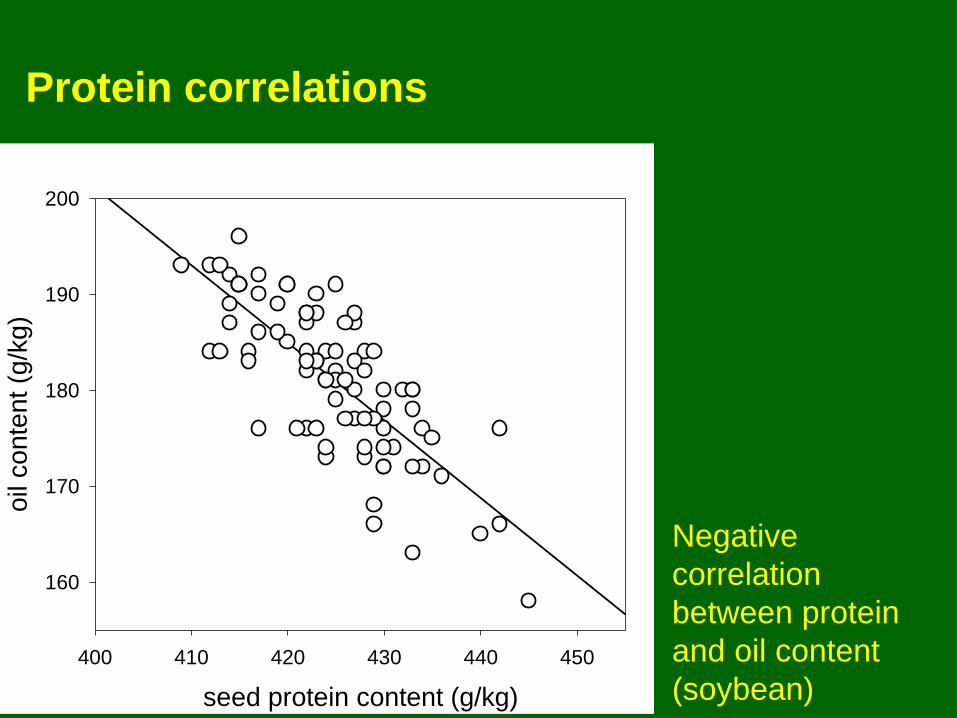
Negative
correlation
between protein
and oil content
(soybean) seed protein content (g/kg)
400 410 420 430 440 450
oil
conte
nt (g
/kg)
160
170
180
190
200
Protein correlations
Rapeseed meal quality
• 00-genotypes: low erucic + low content of
glucosinolates; less than 20 µMol of
glucosinolates in fat-free meal minimizes
negative effects of feeding rapeseed meal
• sulfur fertilization increases glucosinolate
content
Glucosinolate content
Protein content
• selection of a variety with high protein content (reduces grain yield most probably!!!)
• apply late nitrogen fertilization (e.g. fertilization after heading date, urea-fertilization of rapeseed after flowering)
• inoculate soybean/legumes with rhizobial preparations to promote biological nitrogen fixation ( e.g. Bradyrhizobium japonicum strains)
What can a farmer do ?

Pischinger
Watzels-
dorf 2005
BOKU
Raasdorf
2005

Results from:
Protein screening 2 exp., 50 soybean genotypes, locations: BOKU (Raasdorf),
Pischinger (Watzelsdorf), 2005 season.
BOKU Pischinger
Pro
tein
gehalt (
g/k
g)
250
275
300
325
350
375
400
425
450
475

Soybean seed inoculated with Bradyrhizobium japonicum
nodulation bacteria

Comparison: Protein content (%) of crops
• soybean 35-45 trypsin inhibitors
• pea 22-26 high starch content
• faba bean 28-35 tannins, mycotoxins
• lupins 30-50 alkaloids, oil content
• rapeseed 19-26 glucosinolate
• sunflower 15-20
• linseed 18-25 linamarine (glycoside)
• cereals 9-15
Species % prot remark

Amino acid composition
• low genetic variation in most species
(selection is very difficult)
• no significant environmental influence
• cereals: high in S-amino acids
• soybean: best source for lysine
• genetic manipulation of aspartate
pathway to increase lysine content
(Falco et al., 1995)

Aspartate family biosynthetic pathway

Grain legumes and their
ANFs (anti-nutritional factors)
• tannins
• protease inhibitors (e.g. Kunitz- trypsin inhibitor)
• alkaloids
• oligosaccharides
• phytate (phosphorus fixed in phytic acid)
• lipoxygenases
• haemagglutinins (lectins)
• many others

Grain legumes and their ANFs (anti-nutritional factors)

Kunitz trypsin inhibitor of soybean

Soybean Kunitz - trypsin inhibitor in
SDS PAGE type of electrophoresis
(absence of 21.5 kDa-protein in lanes
4, 6 and 8)
Kunitz trypsin inhibitor of soybean

Reduced
trypsin inhibitor
activity in
segregants free
of the Kunitz
protein band
Soybean trypsin inhibitor activity
Kunitz trypsin inhibitor
KTi+ KTi-trypsin
inhib
itor-
activity (
mg/g
)
60
80
100
120
140

Quality parameters of soybean
• oil content
• protein content
• methionine concentration
• trypsin inhibitors (Kunitz TI, Bowman-Birk-TI)
• hilum color
• oligosaccharides (raffinose, stachyose)
• activity of lipoxygenase (fat oxidation/beany flavour)
• linolenic acid content / saturated fatty acids
• tocopherol content
• isoflavone content
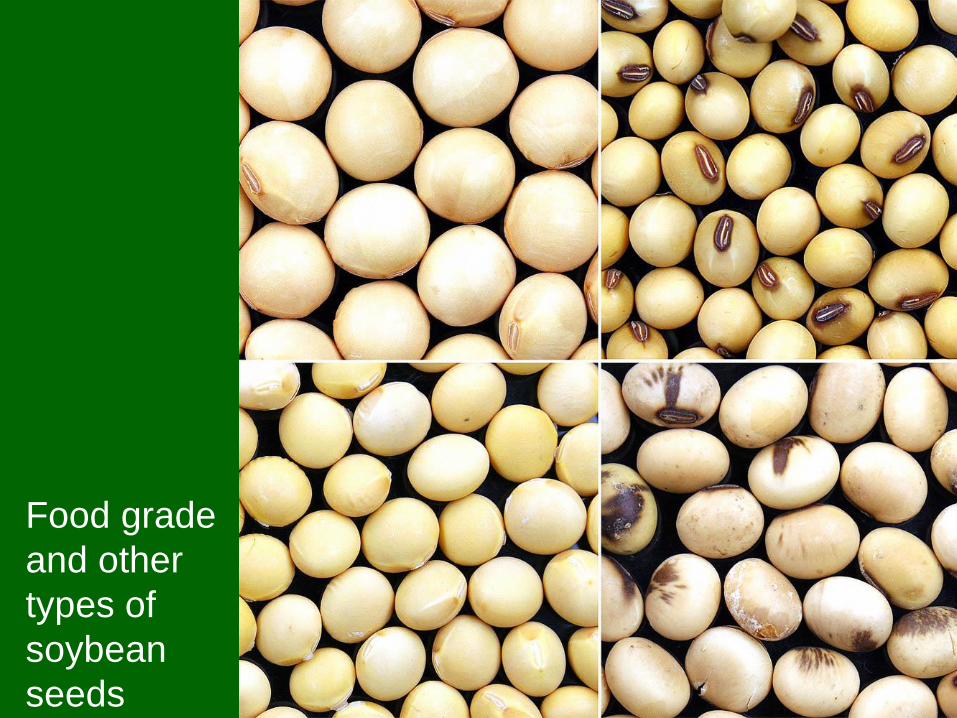
Food grade
and other
types of
soybean
seeds


Fibre crops
Fibres:
cellulose, hemicellulose, pectin, lignin
Hairy fibres: cotton lint
Sclerenchymatic (& xylematic) fibres (“bast
fibres”): flax, hemp, stinging nettle, ramie, jute,
kenaf
Leaf fibres: e.g. sisal agave, fibre banana

Plant fibre quality
• fibre content
• fibre strength
• fibre length
• color
• cotton grades: color (from white to gray),
foreign matter content, smoothness /
roughness from harvest
• technical fibre characteristics

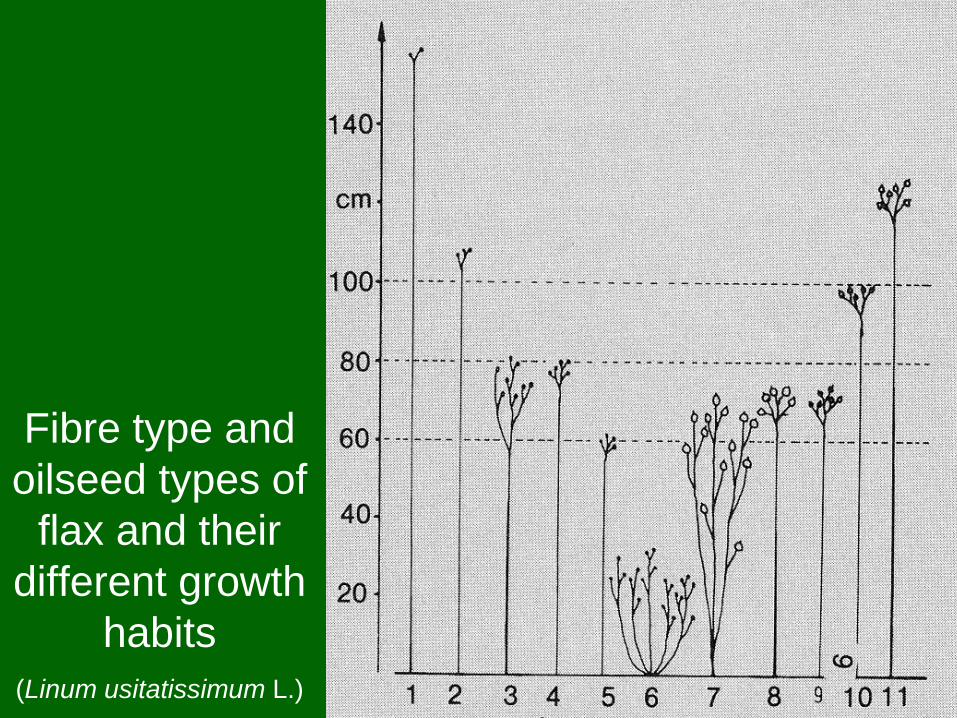
Fibre type and
oilseed types of
flax and their
different growth
habits
(Linum usitatissimum L.)

Flax stem cross-section

Cross-
section of
a flax
stem
Fibre-
bundles in
a flax
stem

Flax fibre yield
Flax (Linum usitatissimum L.)
Effect of flax sowing date on fibre yield
Sowing date Straw yield (kg/ha) Fibre yield (kg/ha)
26 March 6235 15998 April 5148 1321
20 April 5094 129129 April 4616 1202
Flax: Long-day plant (photoperiodism); late sowing causes poor
vegetative development and low fibre yield due to a fixed flowering date

Flax fibre quality
• Water stress: reduction in number of fibre
bundles and plant height
• Nitrogen fertilisation: increase in plant
height, fibre length and stem diameter,
effect on long fibre content not consistent
• Genotypes: differences in straw yield,
plant height, fibre content and fibre
quality
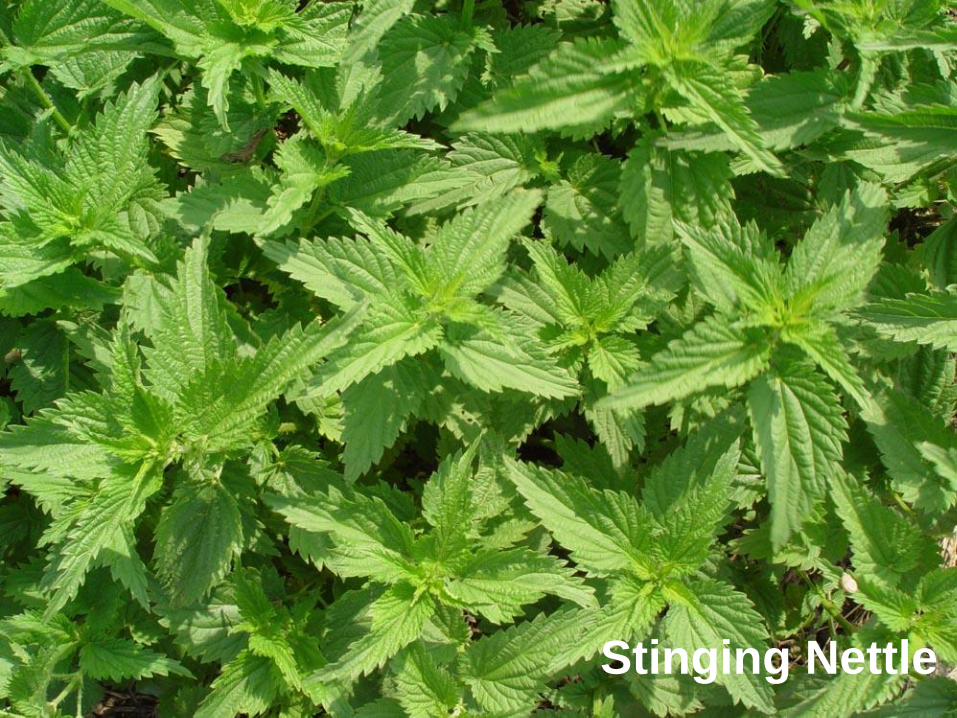
Stinging Nettle


Fibre Hemp


Fibre content
of different
hemp cultivars
(Kriese et al.,
2002)

Fibre hemp (Cannabis sativa L.)
THC regulations in EU
• THC: delta-9 tetrahydrocannabinol is the
psycho-active component in marijuana
• EU regulations (EC 1420/98): maximum
THC content of 0.2 % allowed in fibre
hemp varieties
• significant differences exist in registered
varieties (Mechtler et al., 2004)
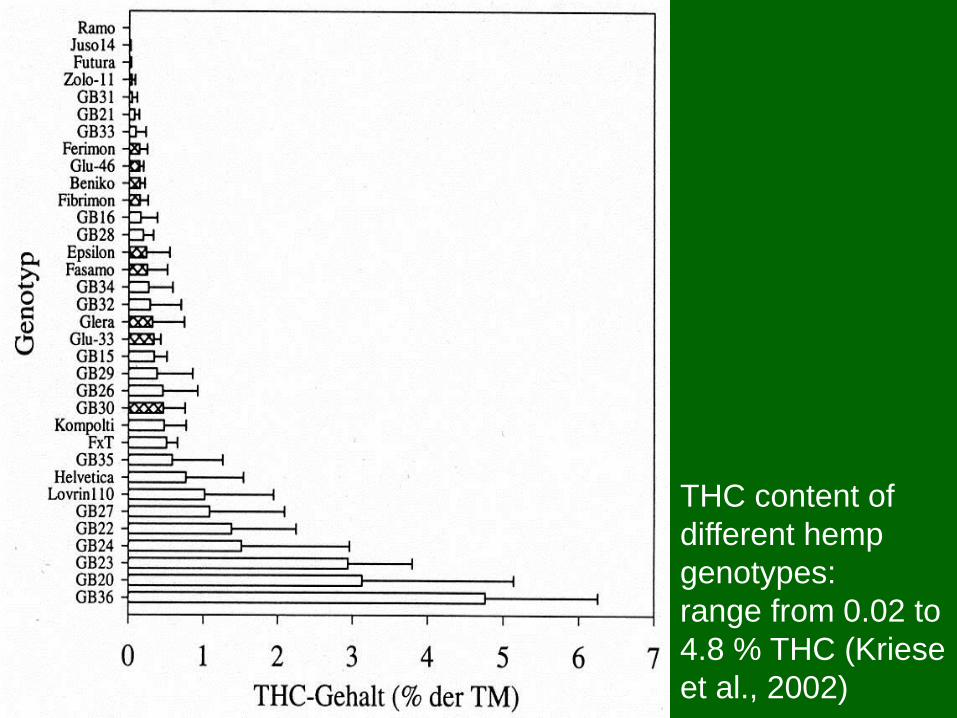
THC content of
different hemp
genotypes:
range from 0.02 to
4.8 % THC (Kriese
et al., 2002)

THC content in single plants from different low-THC
cultivars grown for fibre in Austria (Mechtler et al., 2004)

Aspects of product quality in plant production
Quality of oilseeds, protein
crops and fibre plants
crop species
genetics
agronomy