Aspects of Music Information Retrieval Will Meurer School of Information University of Texas.

ASPECTS OF OVERWEIGHT
VEHICLE OPERATIONS IN TEXAS ------- ---------- -- -----
Prepared For:
State Highway & Public Transportation Commission
by
Texas State Department of Highways and Public Transportation
in Cooperation with
The Center for Transportation Research The University of Texas at Austin
and
Texas Transportation Institute Texas A&M University System
August 23, 1984

August 23, 1984
EXECUTIVE SUMMARY
INTRODUCTION ------------The purpose of this paper is to present aspects of
overweight truck traffic on highways in Texas. The material
presented is drawn from both recently- completed and on-going
research ad technical studies by the State Department of Highways
and Public Transportation, the Center for Transportation Research
of The University of Texas at Austin, and the Texas
Transportation Institute of the Texas A&M University System.
The paper reviews the status of the highway cost allocation
study, overweight truck permit loads, illegal overweight truck
loads, present truck size and weight enforcement activity, and
concludes with recommendations. A Glossary is provided to
facilitate the use of this paper.
The joint CTR/TTI Study is to be completed by September
1 9 8 50 The overall objective is to provide a methodology for
determining an equitable highway cost responsibility to be
allocated among highway users, especially vehicle classes.
When completed, the HCA study will facilitate analysis of
options affecting: (1) truck weight laws and regulations; and
(2)highway user fees and taxes.
Recommendations
Recommendation 1. A structure of fines for overweight
violations should be graduated to reflect degrees of violation
and should be administratively collected by DPS.

August 23, 1984
Recommendation 2. A structure of permits for all overweight
vehicles should be developed under the same procedures that
currently authorize the issuance of oil field servicing permits
(SB 290). The essential features of this procedure are: ( 1 ) it
is established by the Highway Commission; (2) it allows for
effects of highway damages to be recouped in the value of the
permit, and (3) it allows for the trip distance to be included in
calculating the value of the permit.
The license fees for ready-mix concrete
(exempt) vehicles should be established so that the dollar
damages they inflict on the highway system are recovered.
Failing this, the exempt nature of this vehicle should be lifted
and made to conform with all applicable vehicle weight laws.
Further, any study of city streets and county roads mandated by
the Legislature should specifically include an analysis of the
effects of these exempt vehicles upon the street/road network.

August 23, 1984
TABLE OF CONTENTS
PREFACE
SYNOPSIS
CHAPTER 1. INTRODUCTION
CHAPTER 2. COST ALLOCATION IN TEXAS
Revenue Tracking
Allocation of Costs
Study Status
CHAPTER 3. OVERWEIGHT PERMIT LOADS
Permit Operations
Some Economic Effects
Permit Fees
Concrete Trucks - A Special Exempt Class
CHAPTER 4. ILLEGAL OVERWEIGHT LOADS
Background
Benefits of Overweighting
Present Enforcement Activity
Fines and Disincentives
CHAPTER 5. RECOMMENDATIONS
GLOSSARY OF TERMS
APPENDIX A. COMPARISON OF EQUIVALENCIES FOR DIFFERENT TRUCK TYPES

August 23, 1984
TABLE OF CONTENTS, Continued
APPENDIX B. RELATED RESEARCH STUDIES
Effects of Heavy Trucks
Truck Use of Highways
Changes in Truck Dimensions
Truck Size and Weight Studies
Shifting Methodology
The Truck Weighing Program in Texas
Study of Truck Lane Needs
Analysis of Truck Use and Highway Cost Allocation in Texas
Effects of Oil Field Development on Rural Highways

August·23, 1984
PREFACE
Selected aspects of truck traffic on the Texas highway
system are discussed in this paper. An overall policy objective
is to devise a set of mechanisms so that each highway user will
pay its equitable share of the cost of building and maintaining
the highway system.
The paper was prepared using information, analyses, and
reports from related activities (both completed and on-going)
conducted by SDHPT, CTR, and TTL Consequently, the scope of the
material reported here has these two characteristics:
(1) the bulk of the discussions focus upon the 72,000-mile
state highway system and do not address the problems
faced by municipal and county governments in providing
streets and roads for use off the highway system. The
focus, however, does not imply that "off-system"
impacts of overweight vehicles are insignificant. In
fact, the study mandated by the recent Special Session
of the Legislature will likely document significant
impacts occurring on the city streets and county roads.
(2) most of the analyzed data are from the 1979-1980 base
period. More recent data, though, are currently being
developed and analyzed by SDHPT, CTR, and TTI on a
variety of related topics including highway cost
allocation, overweight permit fees, truck lane needs,
oversized vehicle operations, pavement damages and tire
pressures.

August 23, 1984
SYNOPSIS
Chapter 1 describes some of the legal , ins tit u·t ion a 1 , and
operational features of the relationships between truck weights
and the effects on the highway system. Chapter 2 describes the
highway cost allocation study now
focuses upon the issue of legal
underway in Texas. Chapter 3
overweight loadings and the
permit system, and Chapter 4 looks at illegal overweight trucks.
From all the discussions, recommendations are developed in
Chapter 4. A Glossary of Terms follows the last chapter.
Supplemental and more detailed information appears in the
Appendices.

CHAPTER 1. INTRODUCTION
The most recent major change in Texas law regarding truck
weights occurred in 1975, when the maximum gross vehicle weight
was raised to 80,000 pounds,
20,000 pounds, and the maximum
the maximum single axle load to
tandem axle load to 34,000 pounds.
There are also limits to the length and height of a vehicle,
width of wheels, and allowable loads on farm-to-market and ranch
to-market roads. Other pertinent laws relate to:
Statutes governing the issuance of oversize-overweight
permits
Provisions for special truck categories
Statutes governing the enforcement of motor vehicle
sizes and weights
The governmental units in Texas which are involved in
regulating or enforcing the motor vehicle size and weight laws
include the Department of Public Safety (DPS), the State
Department of Highways and Public Transportation (SDHPT), the
Office of the Attorney General (AG), the Texas Railroad
Commission (RRC), and the Justices of the Peace (or the county
court system).
The DPS plays the most direct role in enforcing the size and
weight laws. Vehicles are examined for:
1. Gross weight allowed
2. Axle limitations
3. Tire size limitations
4. Wheel weight limitations

Further, DPS may examine license receipts:
i. To determine if the vehicle is registered for the
proper amount relating to load being transported
2. To determine if the vehicle is displaying license
plates assigned to that vehicle
3. For temporary registrations and permits
4. For exemptions and exceptions to registration laws
5. To determine if nonresident is operating in accordance
with reciprocity agreement from state of residence
6. For general provisions of statutes regulating
registration of all vehicles in Texas
When a truck is found in violation of legal size and weight
limits, the driver of the vehicle is issued a citation with
instructions to appear before a Justice of the Peace. The Justice
of the Peace hears evidence to determine innocence or guilt.
SDHPT issues permits for vehicle loads which cannot be
reasonably dismantled or disassembled and transported as a legal
load. Five types of permits are issued:
1. Permit 598 -- for the movement of concrete beams
2. SB 290 Permit -- for vehicles constructed solely for
oil well servicing, clean-out, and/or drilling purposes
3. Permit 591 -- for the movement of mobile homes
4. Permit 438 -- for general oversize-overweight (OS/OW)
movements, obtained at local district offices
5. Permit 1407 -- for general oversize-overweight (OS/OW)
movements, obtained through telecommunications with
SDHPT's central office in Austin
2

The Texas Railroad Commission, which has regulatory
authority over 30 percent of the truck traffic in Texas, is able
to audit the records of its certificated motor carriers to
determine if the 80,000 pound gross vehicle weight limit is being
exceeded and remove their certification if found in violation.
The Office of the Attorney General has the power to take legal
action against shippers, carriers, and receivers of overloaded
vehicles.
3

CHAPTER 2. COST ALLOCATION IN TEXAS
Currently, CTR and TTI, in cooperation with SDHPT, are
working on a research study entitled "Analysis of Truck Use and
Highway Cost Allocation in Texas," which is to be completed by
September 1985. The objectives are:
To define the nature of truck use of highways in Texas
To provide a basic reference source for information on
truck size and weight issues as well as truck-use
alternatives
To provide a cost allocation methodology for use in
Texas
REVENUE TRACKING
The basic objective of a cost allocation study is to
determine if each vehicle is paying its "fair share" of the
highway costs incurred. Therefore, it is necessary to identify
the total revenues attributable to a particular vehicle class.
For calendar year 1980, the dedicated state revenues (motor fuel
tax, registration fee, and lubricating oil sales tax) have been
allocated by the various vehicle categories, such as by vehicle
group (Figure 2.1), truck type (Figure 2.2), gross vehicle
weight, and fuel type.
ALLOCATION OF COSTS
The highway cost allocation problem is one of determining an
equitable charge for each of the vehicle classes sharing
transportation facilities such as highways and bridges. A
~2~£l~~~li Q2Q=~2Q~r2!~r~!~l ~2l~~!2Q ~~~~2Q2l2~I for the cost
4

VEHICLE CLASSES
~ PASSENGER CARS
h MOTORCYCLES
~II I I I ~~ ~~ VI
BUSES
r:r~ SINGLE UNIT TRUCKS
c9 [~ .--- -~1 COMBINATIONS
Figure 2.1. Basic Vehicle Classes

COMBINATIONS
~I 6 '6""' I
3 AXLES
rdl 0 bO I
4 AXLES (2S-2)
~ 1._ oo 9 I
4 AXLES (35-1)
"'
~b tro I 5 AXLES (35-2) 0
(JI Lb= I 6 'd 'd 5 AXLES (2-S 1-2)
~ ~0 8u; '0'1
6 AXLES
Figure 2.2. Six Types of Combinations

must be
allocated in some rational and systematic way that is deemed
equitable by all users of the system.
Previous attempts at solving the highway cost allocation
problem can essentially be reduced to two major approaches: (a)
proportional (consumption) allocation methods, which determine
cost allocations in proportion to one or more measures of highway
usage; and (b) incremental methods, which allocate costs on the
basis of highway design, e.g., a pavement is designed for
"automobile only" use then re-designed to accommodate trucks.
There are limitations affecting the validity of the
traditional cost allocation methodologies. On one hand,
proportional methods may yield results that conflict with the
perception of fairness by some of the users, e.g., truckers claim
they have to pay too much. On the other hand, incremental
methods may yield inconsistent results due to the fact that if
vehicle classes are introduced in different sequences, different
cost allocations are obtained.
In an attempt to overcome the shortcomings aforementioned,
two new solution approaches to the highway cost allocation
problem have been developed:
and an optimization approach referred to as the Generalized -----------Method. ------ A significant feature of the two new methods is that
they consider all possible combinations of the given vehicle
classes as scenarios for which highway costs are computed for a
specific planning period and traffic data.
7

STUDY STATUS
The work so far accomplished in the cost allocation study
includes:
1. The conceptual models for the Modified Incremental
Approach and the Generalized Method have been developed
2. The models mentioned above have been computerized and
preliminary tests have been run with satisfactory
results
3. The RENU2 program, the basic program for calculating
pavement cost damages, has been reviewed and modified
to make it more suitable to the needs of this problem
and to improve its cost estimating capabilities
4. A few runs of the entire procedure have been made in
order to test the program. More extensive runs with
more realistic data will be conducted.
5. A report describing the work accomplished in Fiscal 83-
84 is being prepared for submission in September 1984.
When completed, the highway cost allocation (HCA) study will
facilitate analyses of policy options affecting: (1) truck weight
laws and regulations; and (2) highway users fees and taxes. More
detailed recommendations for use of the HCA procedures to
illuminate policy alternatives await study completion.
8

CHAPTER 3. OVERWEIGHT PERMIT LOADS
Legally, some trucks can operate on the highway system even
though the legal gross or axle weight limits are exceeded. The
overweight permitting procedures operated by SDHPT are central to
this issue.
PERMIT OPERATIONS
A summary of permits issued is shown in Tables 3.1 and 3.2.
Oil field equipment permits constituted 1.2 percent of the total
permits issued, and generated 7.8 percent of the fees.
ECONOMIC EFFECTS
Some economic effects relating to oversize-overweight
vehicle operations are:
Increased pavement maintenance and rehabilitation cost
due to increased pavement damage
Increased highway structure (bridges, culverts, etc.)
maintenance and rehabilitation cost due to accelerated
damage
State expenditures to enforce vehicle size and weight
laws (these include DPS expenditures for License and
Weight Service and SDHPT expenditures for maintaining
permit issuance operations)
Savings to the owner-operators of oversize-overweight
trucks from reduced vehicle operating cost
Economic benefits accrued through the issuance of
oversize-overweight permits and the fines paid by
overloaded truckers
9

TABLE 3. 1.
FEES COLLECTED FROM EACH TYPE OF PERMIT AND THEIR SHARE OF THE TOTAL (Sept. 1 ' 1982 - Aug. 3 1 ' 1983)
Average Yearly
Permit Permits % of Fees % of Average
Ir.e.~-- Issued Total Collected* Total Fee ------ ----- ---------- ----- ------
Concrete Beams (598) 2,250 . 4 $ 45,000 • 4 $ 20
Oil Field Equip. (SB290) 6,587 1.2 816,325 7.8 124
Mobile Homes (59 1 ) 95,350 17.8 953,500 9. 1 10
OS/OW (Dist.) (438) 420,639 78.8 8,412,780 80.7 20
OS/OW (Austin) (1407) _2.1.211 1.8 __ .l2Q.Ll!±Q 2.0 20
Totals 543,343 100.00 $10,417,945 100.0 1 9
*Fee rates as of September 1, 1983
10

Table 3. 2.
COLLECTION FROM PERMITS ISSUED ACCORDING TO TIME-LENGTH (Sept. 1 ' 1982 - Aug. 3 1 ' 1983)
Permit Permits % of Fees II£~~ Issued Total .Q.Q..!..!.~£!~.5! Total ------ ----- -----
Single Trip 500,467 93.7 8,504,550 82
30-day 27,123 5. 1 1,084,900 10
90-day 5,483 1.0 669,595 6
Annual .!.L~lQ • 2 .!2~.1..2QQ 2
Totals 534,343 100.0 10,417,945 100
11

CTR has estimated the cost of the economic effects of oversize-
overweight vehicle operations using two cases. The first case
represented the existing condition with respect to the 1980
distribution of sizes and weights of vehicles operating on the
highway system. The second case represented an assumed 100
percent compliance condition in which all vehicles were running
at or below maximum size and weight limits. In the second case,
overweight vehicles from the 1980 truck data were removed and
their payloads assigned to a fleet of vehicles that would carry
these payloads at maximum permissible loads.
For both cases, the total equivalent single axle loads
(ESALs) for each highway type were used to estimate total
pavement rehabilitation costs for 1980 and a 20-year analysis
period. The estimated 20-year pavement damage resulting solely
from overweight trucks was approximately $125 million (in 1980
dollars) -- or an average of $6.3 million/year.
Governmental expenditures associated with the enforcement of
size and weight laws were also estimated. The total state costs
for administration, maintenance, and rehabilitation resulting
from oversize-overweight movements were estimated as $261 million
(in 1980 dollars) over 20 years,
million/year.
or an average of $13
The trucking industry, nevertheless, was estimated to derive
financial savings from oversize-overweight operations, primarily
in the form of vehicle operating cost savings per ton of cargo
hauled. The information presented in Table 3.3 (£~~~~ £~ ll~l~~~
Ir~~~ ~~l~~~ ~~r!~1 ~~~~) shows the net savings to the trucking
12

Table 3.3
SUMMARY OF THE ECONOMICS OF OVERSIZE-OVERWEIGHT MOVEMENTS
(MILLIONS OF 1980 DOLLARS)
Average 1980 1980-1999 /Year
Cost to State 1 4. 6 260.6 1 3 . 0
Payments from Trucking Industry 4.2 ~!±.:..1 4.2
Net Cost to State 1 0. 4 176.3 8.8
Net Savings to Trucking Industry !±~.:..1 .1..!.~11.:..!± 61.7
Overall "Benefit" 31.9 1,057.1 52.9
1 3

industry after subtraction of fines and permits. The numbers
indicate that the trucking industry is benefitting from oversize
overweight movements, but that they are not paying fully for the
additional state costs.
PERMIT FEES
Any change in the weight permit fee schedule should consider
the actual costs to the state, in terms of:
1. Administrative collection costs;
2. Actual pavement "damage" or "wear" costs to the highway
system.
Additional costs might be considered in special cases.
It is very difficult to identify the true "damage" cost to
the highway system inflicted by a single overweight permitted
vehicle. However, some of the assumptions incorporated in
SDHPT's pavement design procedures can be used to describe
overweight vehicles in terms of their "relative effect" on
pavements.
Research continues to resolve highly controversial
relationships with this concept. At the moment, and until these
complicating questions are answered, existing damage factors (18-
KESALS) can be used to develop a set of multipliers -- adjusted
for trip distances -- for deriving an overweight permit fee
schedule of GVW in excess of 80,000 lbs. This effort is underway
and will be reported by TTl and CTR on October 1984.
It is recommended that the Highways and Public
Transportation Commission be given the authority to establish
weight permit fee based on sound economic principles.
1 4

££~££~~~ !£~£~~ = A ~£~£l~! §!~~£~ £!~~~
The ready-mix concrete trucks are legally allowed to haul
44,000 pounds on a tandem axle and 20,000 pounds on the steering
axle, provided that a $15,000 surety bond in filed with SDHPT.
The surety bond is to cover possible damage to roadways. This
vehicle is used most heavily on streets and roads that are not a
part of the state system. Consequently, most of the pavement
damage and failure attributable to this exempt vehicle be
repaired by municipal and county agencies.
Some research results have been reported by TTl that show:
1. the single 20,000 pound axle is the critical axle in
causing pavement failure
2. the tandem 44,000 pound axle is the critical axle in
causing pavement fatigue
This study was conducted using a sample of city streets, and the
results are not generalized to include segments of the state
highway system.
Since ready-mix concrete trucks and solid waste transport
vehicles may (by statute) be operating at a weight above the
maximum gross weight allowed on other vehicles, it is recommended
that these vehicles be required to follow normal weight limits or
be required to pay an additional fee that would be set by the
Commission based on the damage caused to the highways and roads
by the operation of these vehicles.
15

CHAPTER 4. ILLEGAL OVERWEIGHT LOADS
BACKGROUND
Any vehicle that operates at a gross vehicle weight in
excess of its gross registered weight and does not have a special
permit or an exemption provision is operating illegally. The
following discussion concentrates on vehicles which exceeded the
single axle weight limit of 20,000 pounds, the tandem axle weight
limit of 34,000 pounds, or the gross vehicle weight limit of
80,000 pounds.
Data obtained from DPS for the first nine months of 1980
indicated the following distribution of violations:
single axle weight, 2 percent
tandem axle weight, 20 percent
gross vehicle weight, 6 percent
legal dimensions, 16 percent
Of the overweight violations, 26.9 percent were on interstate
highways, 61.5 percent were on u.s. and state highways, 10.1
percent were on farm-to-market roads, and 1.5 percent were on
other highways. When the amount of truck travel is taken into
account, the number of violations per 1,000 miles of truck travel
is slightly more than the number for the u.s. and state highways.
Other significant information obtained from the DPS files
can be summarized: (1) Most overweight vehicles exceeded their
registered weight by 4,000 to 8,000 pounds; (2) a few exceeded it
by as much as 50,000 pounds; and (3) violations are most often
incurred by the haulers of grain, gravel, sand, and timber.
16

,--.-a--"''--'''"""'
An analysis was also made on the truck-weight survey data
collected by SDHPT's Transportation Planning Division (D-10).
Based on 1980 truck weight study data, the five-axle 11 18-
wheeler" accounted for 87.3 percent of overweight trucks on
Interstate highways and 89.3 percent of overweight trucks on U.S.
and State highways. Of all "18-wheeler" trucks weighed on
Interstate highways, 27.5 percent were overweight, compared to
39.1 percent of all "18-wheeler" trucks on U.S. and State
highways. The significance of the overweight problem since 1959
is shown in Figure 4.1. The data suggests that there has been an
upsurge in overweight trucks since 1974.
BENEFITS OF OVERWEIGHTING
[NOTE: Much of the material in this section has been excerpted
from a 1981 paper by James P. Glickert and David S. Paxon
entitled "The Value of Overweighing to Intercity Truckers" and
presented to the Transportation Research Board.]
The benefit a trucker receives from overweighting is
increased financial returns. This results from decreasing costs
per ton-mile as cargo weight is increased and is shown in Table
4.1. The example given is the average line-haul cost for a
typical intercity trucker.
The more a truck is overweight, the greater the financial
benefit that results. Table 4.2 illustrates the incremental
advantage that a trucker has as the amount of the overweight
increases.
11

35 I
30 1-
25 c: 0 --c
20 -0
> ~ c: ·-
en 15 ..:.::: (,) ::s ~ .....
10 -0
fl. 5
60
IQMR I
I I
" I ' I
I I \ I
' '!\ I , ' I , '/' : ~'·"' 1
" ....... Total ,1., ''II·
,' .1 ·~ '11/ ' Interstate
, /I . vi R u r a I I . '\: ,,,
- -- -- ---- -- -Urban
65 Years
Figure 4.1. Historical trend of oversize-overweight movements on Texas highways, 1959-1980.

TABLE 4.1. TRUCK COST SENSITIVITY TO CARGO WEIGHT
CARGO WEIGHT LINE-HAUL LINE-HAUL (TONS) COST/MILE COST /ToN-t1 I L..E
10 89.1¢ 8.9¢
15 89.5¢ 6,Q¢
20 90.3¢ 4.5¢
25 90.5¢ 3.6¢
SOURCE: 1980 AAR TRUCK COST MODEL}
1979-1980 NATIONAL MOTOR TRANSPORT DATA
BASE (NMTDB) DATA
19

TABLE 4.2. INCREMENTAL INCENTIVES TO OVERWEIGHT
VEHICLE CARGO RATE/ RESULTING WEIGHT WEIGHT POUND* RATE INCENTIVE
73,0Cl0 451000 5.6¢ $2520 $0
75,000 47JOOO 5.4¢ $2540 $2~
80,000 52,0Cl0 5.2¢ $27~0 $180
90,000 62,000 5.0¢ $3100 $580
100,000 72,000 4.8¢ $3ll60 $940
20

PRESENT ENFORCEMENT ACTIVITY
A central issue regarding permits and fines is the State's
enforcement capability. Since available data suggests that
illegal overloading is a common occurrence, an expanded,
improved, and consistent enforcement program is needed. Portable
scales should be upgraded with state-of-the-art equipment.
On state highways, the primary enforcement responsibility
has been assigned to the Department of Public Safety's License
and Weight Service, a part of the Traffic Law Enforcement
Division. Beginning in 1984, police departments in cities of
over 1.5 million population are also authorized to enforce size
and weight laws on state highways within city limits. County
Sheriffs and their deputies share the authority to enforce these
laws, but do not ordinarily do so on state highways.
Currently, the Department of Public Safety's License and
Weight Service is organized into six geographical regions and
deploys 196 officers-- 12 senior administrators (Captains and
Lieutenants), 18 Sergeants, and 166 troopers. Their primary
objective is to protect the highways from unnecessary damage by
securing compliance with the statutory provisions of law
regulating the weight of commercial vehicles. However, their
duties also include enforcement of motor vehicle registration
laws, the Motor Carrier Act (transportation of persons or
property for hire), Hazardous Materials Regulations, and
enforcing other traffic laws and general law enforcement.
Vehicle weighing operations included the use of 8 permanent
scales, 15 semiportable scales (12 State owned and 3 County
21

.---o--- -.,J,
owned), and portable hand-scales assigned in sets of four to all
troopers. A summary of the 1983 enforcement activity using these
scales is shown below:
1. Enforcement Activity
a • b. c. d.
e •
Vehicles weighed Vehicles checked Vehicles measured Incidence of loads reduced or off-loaded Incidence of loads shifted
2. Citations
a. b.
Oversize Overweight 1) Axle weight violations
over 20,000 single axle
2)
3)
Axle weight violations over 20,000 tandem axle
Over gross weight
TOTAL OVERSIZE AND OVERWEIGHT CITATIONS
213,408 633,409 181,531
25,080 4,527
11,760 46,498
58,258
4 ) Bridge formula included in overgross weight category
5) Fines assessed on completed cases by magistrates
865
12,891
32,742
14,912
a) Oversize violations (Average $28.50) $269' 331.92
b) Overweight violations (Average $42.53) $2,002,320.03
The numbers indicate that 22 percent of the vehicles weighed were found to be overweight.
FINES AND DISINCENTIVES
An examination of the effectiveness of fines must take into
account the probability of being caught. The expected cost of
fines to the trucker is a function of his ability to avoid routes
22
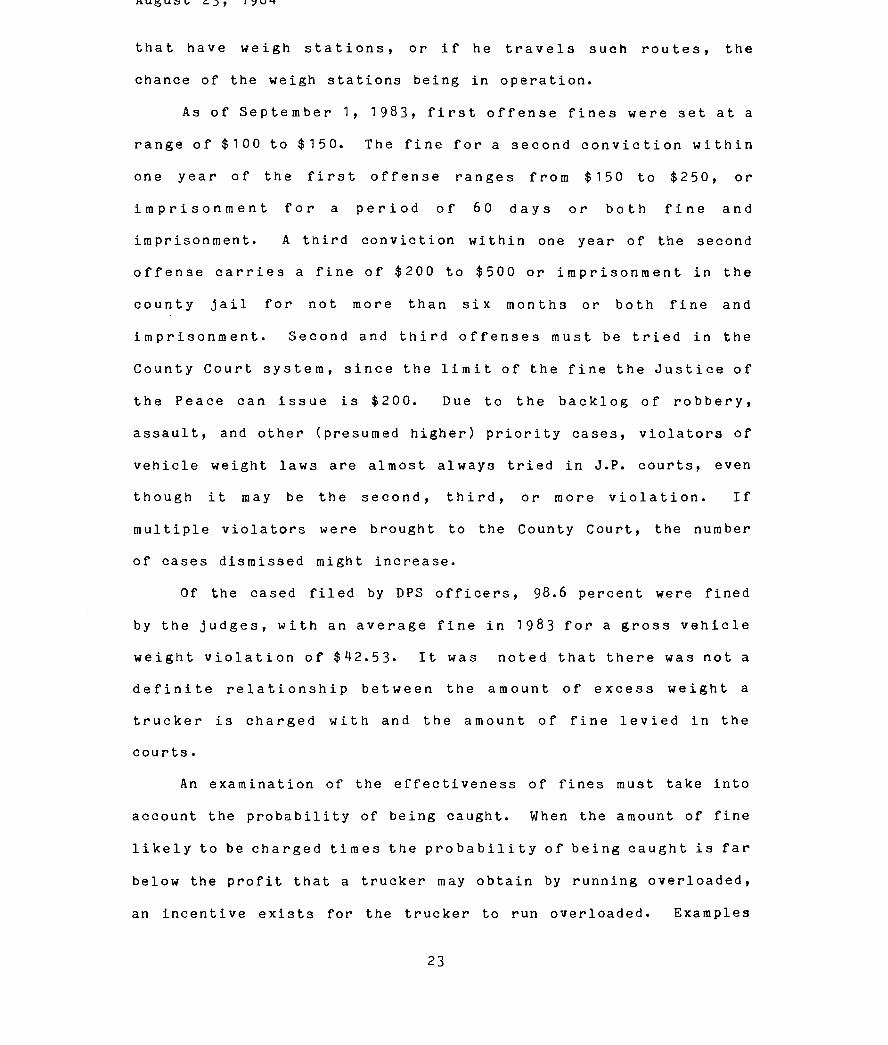
that have weigh stations, or if he travels such routes, the
chance of the weigh stations being in operation.
As of September 1, 1983, first offense fines were set at a
range of $100 to $150. The fine for a second conviction within
one year of the first offense ranges from $150 to $250, or
imprisonment for a period of 60 days or both fine and
imprisonment. A third conviction within one year of the second
offense carries a fine of $200 to $500 or imprisonment in the
county jail for not more than six months or both fine and
imprisonment. Second and third offenses must be tried in the
County Court system, since the limit of the fine the Justice of
the Peace can issue is $200. Due to the backlog of robbery,
assault, and other (presumed higher) priority cases, violators of
vehicle weight laws are almost always tried in J.P. courts, even
though it may be the second, third, or more violation. If
multiple violators were brought to the County Court, the number
of cases dismissed might increase.
Of the cased filed by DPS officers, 98.6 percent were fined
by the judges, with an average fine in 1983 for a gross vehicle
weight violation of $42.53. It was noted that there was not a
definite relationship between the amount of excess weight a
trucker is charged with and the amount of fine levied in the
courts.
An examination of the effectiveness of fines must take into
account the probability of being caught. When the amount of fine
likely to be charged times the probability of being caught is far
below the profit that a trucker may obtain by running overloaded,
an incentive exists for the trucker to run overloaded. Examples
23

of fine structures for overweight trucks from other states are
shown in Tables 4.3 and 4.4.
Penalties other than fines are also an effective deterrent
to overloading. Forced unloading of the overweight freight can
inflict substantial inconvenience and time cost on the driver.
Unloading policies vary, and can be either discretionary (up to
enforcement officer) or mandatory. The laws are often not
enforced due to the lack of available storage space, the nature
of the freight (if perishable), a concern for other motorists'
safety, and the possibility of vandalism.
In those cases where the excess weight is not unloaded, the
financial impact of the fines is not high enough to deter the
trucker from overloading. Unless the current systems are
revised, so that the disincentives to overload are increased, the
truckers may continue to overload when it is in their economic
interests.
The DPS has stated that, since the increased fine structure
and the Aiding and Abetting complaints against the company or
persons loading the vehicles in excess of 15 percent went into
effect, there has been a 12 percent reduction in overweight
vehicles.
In an effective enforcement program there are two basic
components: probability of detection and penalties for
violation. These two components cannot be separated when
evaluating an enforcement program. Combined, these two make up
the expected cost of overweighting to the trucker. At the
24

TABLE 4.3. TYPICAL FINES FOR VARIOUS LEVELS OF THREE-AXLE TRACTORS WITH TWO-AXLE SEMITRAILERS GVW OVERWEIGHT (FIRST OFFENSES)
'----F-'ine for Amount of Overweight ~ STATE r· Comments
t-----------+_!__.OOQ_~tJ_ -~!..S_q_Ql~ 6,_()00 1b 12 ,0001b --------------; Arizona S 30 $ 55 S 255 S 2BH-----------=-------I
I-"A.::r.:.k:::a:::n:.::s=-a-s------lf----:l---=l---=O---t-20i:J 700 Set by Court or by Statute
Califorma :=___JQ 2Q___ 91Q_ !r1r.es Are Mandato ~~~~~~------1
__ £Q__ 3 ! 45 75_--+I~B:::.v...!S~t~a-"te"--------------1 -..CQ..J'l~_t- ----i_lJ)-=._2j) i 25 __:_~Qlt_2_Q_-_l_fi0 600-=ll_0
1Fines Set by Statute
--~~~~::?~;tc;Iu;bi ---~~lfu, F~~:-t- ~&: + H: -iii;.!':;;~,2'''''' of Se.~e.,n.t,Lv ___ _j
flcnda I 85 260- SGQ_--=JfiVi!Pel1alty~lef1or:-vemc1e
_GI:J-el_ionr:_9g __ iisa ___ - _--_ -- _-- --_!_2_,085_ --t--~_Q_,~_L- _l_:lL--t- !!.~ --t ------ -_ Icano _ _ ~6,25 _j_Ei7 ,_2 __ !]_2__,__l0 j __ _________ _ ____ _
)<2____wa --==l __ lQ -~--~--2 ___ ;_-___ 500_-=~J- _1\22_0~_-_~:_- = ~4~000- -~ - -----=_-________ _ Ka~sas 20 l__ _ _ Bend SxsteEJ____:-_LucicJal ::lJscretw~ Ke~t~~-- ---so-- J__ --~5 I 280 500 Fine Assessed above s:~ tolerance I
t-=-~ouf~ian~----1_ z()o=~~o '- 400 700 Mo.ine :J __ Q_ _ _l __ 40- -- BO 2o,._""o,._-_-_-_-:_-_-_-_-:::_-_-_-_-_-:_-_-_-_-_-_-_-::_-:_-_-:_-_-~_
Ma:-.-1and _Q_ ___ ~Q__ 1___Q_Q __ ,~o"-----+-----------------------
--~f~~~~---- :(~ -+-~- - t:~- -:¥a- --To;tDis-c~etion - -
Minneso~_iL___ _ _ _5Q___ I sii_ _____ 4_o_o ____ SQ_Q__j§~--;re:ne Co~rtG~i'J~J;":le~J~~ _ ____ r"-=-=-- _ -,~ _ --::-----------1 17-:-.:=D::.:i:.:s:..:c:.:.re:::..:.:;ti~o-:--n7-:--:-:----:-:-:-:--:---~---l _Mississippi -17 .SO _1 52.50 105 210 Minimum 50 Mile Viola~i~r.'-----l
Missouri 52 -1 202 552 1,152
~Mont~a _:::_3o~40 -+---"--::s"'o-+'----'---:-1-;;2.:_:5--\--;S;-e----:t-M.-;-i'-n7im_u_m __ --;J;-u--,dc:-i-c-:-Ja--;l-----;c;Dccis--c-re----=t--:-io-n-
Nebraska 25 } 25 100 200 Strictly Judicial Discret:.:io::.:n~---Nevada 0 I 20 100 I_ 475 I Set Fine Schedule - Nc Judicial
I ----, I Discreticn
~-:: ~~x~ ---~- 50 j~ -s_o~~ -=~zL--~~- irw~-s~:-:~~:~~~o M1wn~r.- - 1
~:~: g::':;'" -ft--~:-t: .. . -1:6- ;;g :''"""''" 5% "'''"'.: - ---1 I
Ohio 2 S - --- _ _lltj _ 3_A:5~ _ ____;__ _
1 -=-Oklahoma __ Z.L_J -----~~- ___ li 'i __ _ljQ __ __._§all Bond System __ I Orecon 15 T 2 5 4;:J -t-cc--840 ___ ;__l9xl"'~ fine--Jud1c 1a.l ::Jis_cr~, f"PCn~sylvania =:Iso-1" _!_~Q __ ~os_~ ~L82_0 __ ; _ _ ________ I I-R!;'2___je-I~l~~- 10 I 25 60 120 Poss10le Su~ensiuns _______ :
South Carolina --r 100 1 Ma:-:1mum fwe - Judi c1al Di scret1.:.n I s-;'Jth o-~kota o ,-ss J=+o _g;;o_ 1 - --- ----r _Tcnnes~~ _.1_5 ________ -+--- __ill) _ ____Jl;laxJmum F'l_~Q_;_c!al D1scretwn; -~'~---- ___ _25 __ ---i _____ --~_90 ___ j_l'_i_!l_e_r\l~ctwn_~umoer of Off~0-"e~
-------~-----------t----H,..--1-:--:- ]udici_il_LQ_ll_c;:ret;Q.D ______ I Utah __________ 1 2~_9------=tfjaximum fine - Juu!C!<-ll D:screlion
1
Vermgnt __ 5_~' __ l~ _ ___j___ __ 6_Q__ 1jl0_ ;No Judicial Discretion
1 _'{1__rgl~il____ __]D ___ +-~0 --+.-3QQ -·-t-~QO _ ______.Poss!_l:?1e Suspenswn
~2~~~l~~,. _J J!J~~ __ i-f~~iiJ m~ t~'··-~,.._w~.: ;u. ol j , ____ : I _ ' Of!enscs and T1me of Da'
Source: NCHRP Synthesis #68 Motor Vehicle Size and Weight Regulations, Enforcement, and Permit Operations, 1980.
25

TABLE 4.4. FINE STRUCTURES FOR OVERWEIGHT TRUCKS FOR 10 SELECTED STATES
Graduated
Tennessee No
Indiana Yes
Iowa Yes
Arizona Yes
California Yes
Colorado Yes
Connecticut Yes
Xaryland Yes
Minnesota Yes
Texas No
Fine
$25 minimum, $50 maximum
2c/1b for 1000-2000 ow 4c/1b for 2000-3000 ow 6c/lb for 3000-4000 ow 8c/lb for 4000-5000 ow
10c/1b for 5000 + over
$10 + l/2c/lb up to 1000 l~s ow $15 + l/2c/lb 1000-2000 lbs Ow $80 + 3c/lb 2000-3000 lbs ow $150 + Sc/lb 3000-4000 lbs OW $200 + 7c/lb 5000-6000 lbs ow $200 + lOc/lb 6000 lbs and above
Ranges from $30 for 1000 lbs OW to $280 for 6000 lbs and over, maxiwurn fine is $300
Ranges fron $10 for 1000 lbs 0~ to $1000 for over 12500 lbs
$15 + $5/1000 lbs over legal ':Je::!.g!l.::
$2/100 lb for 2-5% 0~ $3/100 lb for 5-10% OW $4/1000 1b for 10-15~ OW $6/1000 lb for 15-20~ OW $8/1000 lb for 20-25% OW $10/1000 lb for over 25% m;
$20 minimum 2c/lb to 5000 lbs OW 6c/lb for over 3000 lbs 0' . . ~ $50 for 1000-2999 lbs OW $100 for 3000-3999 lbs OW $200 for 4000-4999 lbs ow $300 for 5000-5999 lbs Ot~
$400 for 6000-6999 lbs ow $500 for iOOO + :nore
S25 minimum, $200 maximum
Source: Overweight Vehicles - Penalties and Peroits, U.S. Department of Transportation, ~overnber 1979.
26

present time the enforcement level is probably not enough to act
as a deterrent. To increase the enforcement level it would take
approximately $45,500 per year to fund each additional DPS
Officer. This additional Officer would be able to check an
additional 3,800 vehicles and weigh an additional 1,300 vehicles
per year. Another alternative would be to hire civilians as
weight technicians to work with DPS Officers. The estimated cost
per year to hire these civilians would be $25,000 each.
Therefore, with the same increase in funds the impact would be
over double, since they would not have the additional duties of
the DPS Officers.
Penalties are the second component of an effective
enforcement program. If fines are levied for overweights, the
fines must be of a level higher than the economic benefit of
overweighting. Since the present fine structure does not
accomplish this, it should be changed by (1) increasing the fine
level and (2) introducing graduated fines that take into account
the amount of overweight. The level of the fine must be in
excess of the overweight permit fee that is currently being
developed. Also the fine should be changed to a Civil Penalty.
This would keep cases out of the crowded County Courts except
those cases that were contested. The costs derived from
implementing the above program would be matched against the
benefits derived from the decreased damage to the highway system.
In some states (Louisiana, Virginia, etc.) violations of
size and weight laws generate penalty assessments against the
offenders that accrue to the treasuries of the jurisdictions
responsible for roadway maintenance and law enforcement where the
27

offense took place. Civil penalties, or "liquidated damages,"
these fees can be assessed according to a schedule that increases
with the amount of oversize-overload and the distance travelled.
Assessment can be administratively accomplished, with appeal to
the courts provided for the offenders under certain
circumstances, as Texas law now provides for appeals from
Railroad Commission rulings (V.c.s 911b, Sec. 20), for example.
Such an alternative would eliminate the criminal implications of
violations and instead, utilize a schedule of civil penalties for
illegally OS/OW vehicles, to be administratively assessed.
28

CHAPTER 5. RECOMMENDATIONS
Recommendation 1. A structure of fines for overweight
violations should be graduated to reflect degrees of violation
and should be administratively collected by DPS.
!~££~~~~~~!i£~ 2. A structure of permits for all overweight
vehicles should be developed under the same procedures that
currently authorize the issuance of oil field servicing permits
(SB 290). The essential features of this procedure are: ( 1 ) it
is established by the Highway Commission; (2) it allows for
effects of highway damages to be recouped in the value of the
permit, and (3) it allows for the trip distance to be included in
calculating the value of the permit.
The license fees for ready-mix concrete
(exempt) vehicles should be established so that the dollar
damages they inflict on the highway system are recovered.
Failing this, the exempt nature of this vehicle should be lifted
and made to conform with all applicable vehicle weight laws.
Further, any study of city streets and county roads mandated by
the Legislature should specifically include an analysis of the
effects of these exempt vehicles upon the street/road network.
29

GLOSSARY
AASHO ROAD TEST: A study conducted from 1958 to 1961 to study the performance of various pavement designs subjected to loads of known magnitude and frequency.
AXLE WEIGHT: The weight transmitted to the pavement surface by a single axle or a tandem axle.
COMBINATION: A truck-tractor coupled to a semitrailer; also known as a multiple unit truck.
COMMON CARRIER: A company that engages in for-hire transportation of property and offers services to the general public.
CONSUMPTION APPROACH: The "wear-and-tear" method of apportioning cost responsibility in which the extra pavement thickness required to accommodate traffic loading is assigned to each vehicle class according to its share of total ESALs on that segment.
COST ALLOCATION: Determination of the share of a particular cost item to each vehicle class.
COST RES P 0 N SIBIL IT Y : The share of highway costs legitimately assignable to a given vehicle class; also, the general principle that payments by highway users should be in proportion to the highway costs for which they are responsible.
CTR: Center for Transportation Research, The University of Texas at Austin.
ENVIRONMENTAL FACTORS: Weather-related factors such as freeze-thaw cycles and engineering factors such as poor sub-soils that can lead to pavement deterioration.
EQUITY: A situation in which highway users pay their "fair share" of highway costs; the term sometimes refers to taxation according to ability to pay or benefits received.
ESAL: Equivalent Single Axle Load, usually expressed in terms of an 18,000 pound (18 Kip) standard: 18 KESAL. ESAL factors, as developed from the AASHO Road Test, are used to compare the relative wear caused by vehicles of different single and tandem axle weights.
GROSS REGISTERED WEIGHT: The weight at which a motor vehicle is registered and taxed, and therefore the maximum weight at which it can legally operate.
30

GROSS VEHICLE WEIGHT (GVW): The combined weight of a vehicle and its load.
INCREMENTAL ALLOCATION: A method of apportioning costs in which an additional highway increment is shared by all vehicles requiring this increment.
INEQUITY: A situation in which the public or special interest groups see evasion of fuel taxes, violation of weight limits, or legal weight concessions as grossly unfair.
MARGINAL COST PRICING: The setting of user fees that are tied directly to the actual amount of usage by the individual users.
OCCASIONED COSTS: The costs which can be associated with the presence of a particular vehicular class.
PAVEMENT DAMAGE: Pavement damage (or deterioration) resulting from structural fatigue due to repeated applications of various single and tandem axle weights.
REVENUE TRACKING: The process of estimating the proportion of revenues contributed by each vehicle class.
SEMITRAILER: A truck trailer equipped with one or more axles and constructed so that the front end rests upon a truck-tractor.
SINGLE UNIT TRUCK: A truck with the body and engine mounted on the same chassis.
TANDEM AXLE: apart.
Two consecutive axles less than eight feet
TIUS: Truck Inventory and Use Survey, produced every five years by the Bureau of the Census.
TON-MILE TAX: A tax in which the fee schedule varies for each trip according to either the cargo weight or the actual gross operating weight.
TRIP PERMIT: A temporary permit issued by a jurisdiction in lieu of reciprocity or registration.
TTI: Texas Transportation Institute, Texas A&M University.
USER: The owner of a motor vehicle in use on highways, roads, and streets.
USER CHARGE: An amount paid by a highway user that is contingent upon access to the highway system.
31

··-o--- -,J,
VEHICLE CLASS: A subdivision of the total vehicle fleet, consisting of a group of vehicles defined by similar characteristics {weight, vehicle type) for purposes of allocating costs and setting user charges.
VMT: Vehicle miles of travel.
WEIGHT-DISTANCE TAX: A tax in which the fee schedule is tied to a vehicle's weight and distance traveled. Proxies for gross operating weight include gross registered weight and number of axles.
32

APPENDIX A. COMPARISON OF EQUIVALENCIES FOR DIFFERENT TRUCK TYPES
After completion of the AASHO Road Test in 1960, equations
were developed for measuring the relative effects caused by
different axle weights on flexible and rigid pavements. Any
single axle or tandem axle of a known weight can be identified in
terms of an equivalency to a standard 18,000 pound single axle
load (18 KESAL: 18 Kip Equivalent Single Axle Load). By adding
the equivalencies for all axle loads expected to operate over a
specific highway segment during a certain period of time, the
total 18 KESALs can be determined. This concept is presently
used in Texas-- as well as most other states -- for the design of
pavement thicknesses.
Equivalencies can be used to examine the "relative damage"
effects caused by overweight trucks of a specific axle
configuration. As shown on Table A.1, two single unit truck
types and seven multiple unit truck types were examined. Table
A.2 shows 18 KESAL factors on a "per truck" basis, for both legal
and illegal ("overweight") loadings. Texas law limits trucks to
a single axle weight of 20,000 pounds, a tandem axle weight of
34,000 pounds, and a gross vehicle weight of 80,000 pounds. The
weights of front steering axles are limited by safety
considerations as well as the Texas law that the load carried by
each wheel cannot exceed 650 pounds per inch width of tire (a
steering axle with 10 inch-wide tires could thus legally carry
13,000 pounds).
The same information is presented in a more readable form in
T a b_l e s A • 3 a n d A • 4 • These tables clearly point out that
33

TABLE A.1. DESCRIPTION OF TRUCK TYPES
SINGLE UNIT
2D 2 SINGLE AXLES
3A 1 SINGLE, 1 TANDEM
AXLES ON TRUCK AXLES ON AXLES ON TOTAL
MULTIPLE UNIT TRACTOR SEMITRAILER SECOND TRAILER AXLES
2-S1 2 SINGLES SINGLE 3
2-S2 2 SINGLES TANDEM 4
3-S2 SINGLE TANDEM 5 TANDEM
2-S1-2 2 SINGLES SINGLE 2 SINGLES 5
3-S1-2 SINGLE SINGLE 2 SINGLES 6 TANDEM
3-S1-3 SINGLE SINGLE SINGLE 7 TANDEM TANDEM
3•S2-3 SINGLE TANDEM SINGLE 8 TANDEM TANDEM
34

TABLE A.2. DEVELOPMENT Of 18 KESAL fACTORS fOR TRUCKS
WE I GHT, IN THOUSANDS OF POUNDS
TANDEM 18 KESAL/TRUCK SINGLE AXLES AXLES GROSS
TRUCK VEHICLE a b TYPE 2 3 2 WEIGHT fLEX. RIGID
20 2 2 0 0 0 4 0.0006 0.0004 4 6 0 0 0 10 0.024 0.012 8 12 0 0 0 20 0.28 0.21
10 20 0 0 0 30 1. 61 1.63 13 20 0 0 0 33 1. 81 1.82
(OVER.) 14 26 0 0 0 40 4.71 4. 77
3A 8 0 0 12 0 20 0.07 0.06 10 0 0 20 0 30 0.28 0.29 12 0 0 28 0 40 0.78 1.03 13 0 0 34 0 47 1.43 2.14
(OVER.) 12 0 0 38 0 50 1.92 3.09 (OVER.) 14 0 0 46 0 60 3.98 6.49
2-S1 6 6 8 0 0 20 0.09 0.05 8 10 12 0 0 30 0.40 0.29 8 16 16 0 0 40 1.35 1. 25
10 20 20 0 0 50 3. 10 3.18 (OVER.) 12 24 24 0 0 60 6.41 6.64
2-S2 8 10 0 12 0 30 0.19 0.14 8 12 0 20 0 40 0.44 0.42 8 16 0 26 0 50 1 . 12 1.27 8 18 0 34 0 60 2.16 2.90
12 20 0 34 0 66 2.83 3.60 (OVER.) 12 22 0 36 0 70 3.78 4.81 (OVER.) 14 24 0 42 0 80 5.98 7.88
3-S2 8 0 0 16 16 40 0.13 0.19 10 0 0 20 20 50 0.44 0.50 10 0 0 25 25 60 0.85 1. 16 10 0 0 30 30 70 1.52 2.34 12 0 0 34 34 80 2.45 3.92
(OVER.) 12 0 0 39 39 90 3.98 6.64 (OVER.) 14 0 0 43 43 100 5.88 9.81
(CONTINUED)
35

TABLE A.2 DEVELOPMENT Of 18 KESAL fACTORS FOR TRUCKS (CONTINUED)
WE I GHT, IN THOUSANDS Of POUNDS 18 KESAL/TRUCK
SINGLE AXLES TANDEM AXLES GROSS TRUCK VEHICLE a b TYPE 2 3 4 5 2 3 4 WEIGHT FLEX. RIGID
2-S1-2 6 8 10 8 8 0 0 0 0 40 0.29 o. 18 8 10 12 10 10 0 0 0 0 50 0.64 0.45 8 13 13 13 13 0 0 0 0 60 1 • 31 1.09
10 15 15 15 15 0 0 0 0 70 2.22 2.00 10 18 18 17 17 0 0 0 0 80 3. 77 3.69
(OVER.) 10 20 20 20 20 0 0 0 0 90 6.08 6.28 (OVER.) 12 22 22 22 22 0 0 0 0 100 8.91 9.30 (OVER. ) 14 24 24 24 24 0 0 0 0 110 12.76 13.27
3-S1-2 6 8 8 8 0 10 0 0 0 40 0.18 0. 11 6 10 10 10 0 14 0 0 0 50 0.78 0.30 8 12 12 12 0 16 0 0 0 60 0.81 0.65 8 14 14 14 0 20 0 0 0 70 1. 41 1.29 8 16 16 16 0 24 0 0 0 80 2.31 2.31
(OVER.) 10 18 18 18 0 26 0 0 0 90 3.54 3.71 (OVER.) 10 20 20 20 0 30 0 0 0 100 5.29 5.86 (OVER.) 10 21 21 21 0 37 0 0 0 110 5.61 8.46 (OVER.) 11 23 23 23 0 40 0 0 0 120 10. 13 11.95 (OVER.) 12 24 24 24 0 46 0 0 0 130 13.08 16.01
3-S1-3 6 8 8 0 0 14 14 0 0 50 0.20 0.17 6 10 10 0 0 11 17 0 0 60 0.4IJ 0.39 6 12 12 0 0 20 20 0 0 70 0.80 0.79 8 14 14 0 0 22 22 0 0 80 1. 31 1.35
(OVER.) 8 15 15 0 0 26 26 0 0 90 1. 94 2.25 (OVER.) 8 16 16 0 0 30 30 0 0 100 2.75 3.51 (OVER.) 8 18 18 0 0 33 33 0 0 110 4.05 5.37 (OVER.) 8 20 20 0 0 36 36 0 0 120 5.79 7.83 (OVER.) 10 22 22 0 0 38 38 0 0 130 7.84 10.46 (OVER.) 12 24 24 0 0 40 40 0 '0 140 10.53 13.74
3-S2-3 6 10 0 0 0 15 15 14 0 60 0.29 0.27 6 10 0 0 0 18 18 18 0 70 0.47 0.51 8 12 0 0 0 20 20 20 0 80 0.76 0.84
(OVER. ) 8 13 0 0 0 23 23 23 0 90 1. 18 1.44 (OVER.) 8 14 0 0 0 26 26 26 0 100 1. 71 2.27 (OVER.) 8 16 0 0 0 29 29 28 0 110 2.50 3.47 (OVER.) 8 16 0 0 0 32 32 32 0 120 3.37 5.05 (OVER. ) 8 20 0 0 0 34 34 34 0 130 4.87 7.19 (OVER.) 10 22 0 0 0 36 36 36 0 140 6 ,ll3 9.41 (OVER.) 12 24 0 0 0 38 38 38 0 150 8. 39 12.14 (OVER.) 12 24 0 0 0 42 41 41 0 160 10.36 15.56
a ASSUMPTIONS FOR FLEXIBLE PAVEMENT FACTORS:
STRUCTURAL NUMBER = 3.0 TERMINAL SERVICEABILITY INDEX= 2,5
b ASSUMPTIONS FOR RIGID PAVEMENT FACTORS:
SLAB THICKNESS = 8 INCHES TERMINAL SERVICEABILITY INDEX= 2.5
36

* TABLE A.3. 18 KESALs BY TRUCK TYPE, flEXIBLE PAVEMENTS
GROSS VEHICLE WEIGHT,
SINGLE UNIT COMBINATION TRACTOR AND TRALER (S)
POUNDS 2D 3A 2-Sl 2-S2 3-S2 2-Sl-2 3-Sl-2 3•51-3 3-S2-3
20,000 0.28 0.07 0.09
30,000 1.61 0.28 0.40 0.19
40,000 4.71 0.78 1. 35 0.44 0.13 0.29 0. 18
50,000 1.92 3. 10 1.12 0.44 0.64 0.78 0.20
60,000 3.98 6.41 2.16 0.85 1. 31 0.81 0.44 0.29
70,000 3.78 1. 52 2.22 1.41 0.80 0.47
w 80,000 5.98 2.45 3.77 2.31 1. 31 0.76 -....!
90,000 3.98 6.08 3.54 1.94 1. 18
100,000 5.88 8.91 5.29 2.75 1. 71
110,000 12.76 5.61 4.05 2.50
120,000 10.13 5.79 3.37
130,000 13.08 7.84 4.87
140,000 10.53 6.43
150,000 a. 39-
160,000 10.36
* STRUCTURAL NUMBER = 3.0
TERMINAL SERVICEABILITY INDEX = 2.5

* TABLE A.4. 18 KESALs BY TRUCK "i"YPE, RIGID PAVEMENTS
GROSS VEHICLE SINGLE UNIT COMBINATION TRACTOR AND TRAILER (5) WEIGHT, POUNDS 20 3A 2-S1 2-52 3-S2 2-S1-2 3-S1-2 3-51-3 3-52-3
20,000 0.21 0.06 0.05
30,000 1. 63 0.29 0.29 0.14
40,000 4.77 1. 03 1.25 0.42 0. 19 0.18 0. 11
50,000 3.09 3.18 1. 27 0.50 0.45 0. 30 0.17
60,000 6.49 6.64 2.90 1. 16 1. 09 0.65 0. 39 0.27
70,000 4.81 2.34 2.00 1. 29 0.79 0.51
w 00
80,000 7.88 3.92 3.69 2.31 1. 35 0.84
90,000 6.64 6.28 3.71 2.25 1 .44
100,000 9.81 9. 30 5.86 3.51 2.27
110,000 13.27 8.46 5. 37 3.47
120,000 11.95 7.83 5.05
130,000 16.01 10.46 7.19
140,000 13.74 9.41
150,000 12.14
160,000 15.56
* SLAB THICKNESS = 8 INCHES
TERMINAL SERVICEABILITY INDEX= 2.5

"relative damage" is not related solely to gross vehicle weight.
For example, an 80,000 - pound 3-S2, the most common type of
heavy truck operating in Texas, has about the same effect on
pavements (according to AASHO equivalency factors) as an eight
axle truck weighing 110,000 pounds.
39

··--o--- .... -....~,
APPENDIX B. RELATED RESEARCH STUDIES
EFFECTS OF HEAVY TRUCKS
Senate Resolution 589, passed by the Texas Senate on May 10,
1977, during the 65th Legislature, required that a report
describing the planning system being used by SDHPT be submitted.
A supplement to SDHPT's "Report to the 65th Legislature,"
prepared April 1, 1978, was another report prepared September 1,
1978, entitled "Effects of Heavy Trucks on Texas Highways." The
objective of this study was to assess the effects of projected
truck traffic on the highway system of Texas in consideration of
the social and economic vitality of the State over a 20-year
planning horizon.
The study included an evaluation of two scenarios -- one
representing the current statutory gross vehicle and axle weight
limits, and the second representing large increases:
(In Thousands of Pounds)
Scenario A Scenario B
Single Axle Limit 20 26 Tandem Axle Limit 34 44 Gross Vehicle Weight
Limit 80 120
Since Scenario B implies that there will be more trucks operating
above the legal limit of 80,000 pounds, these will be replacing
some trucks that had been operating near and below the old limit.
As a result of the shift, ton mileage remaining constant, there
was an overall reduction in the number of loaded vehicle trips
and, correspondingly, a decrease in the number of empty trips.
Table B.1 shows the comparative 20-year tax dollar costs required
to perpetuate the state highway system in an acceptable condition
40

TABLE B .1. COHPARATIVE T\;1ENTY-YEAR COSTS FOR SCENARIOS A AND B~~
Pavement Maintcn:tr~"e & Seal Coats
Pavement Rchabili-tali on
I nter-.ta!t• Ili~h~ay~.
Fllllll- ~~~
l\t urkt-t H.onds
Othrr Stntt• llig'hwnys
t:-.1i:!loll'> of Constant 1977 Dollar~)
'io I .I 00 s 960
Total State System
s 2.300 i
J
I I 1.1.1-t , 1.:11.~ J.OE·I 5,930 !
: ! i i Bridge Rcplacc:ncnts • : ·t • ' 7 (J" ; 50~ 130 • I
Totals ' S 1.578 I S.:' ,6H8 i $4,094 S 8.360 I
!====-=-=----·--------- --~--------~------- ---r ~.' ----·---..---·------~-!--------: I I
ScL·nario [J I j
Pavement 1\binl~nann· ! i & Seal Coals s 2·1ll S.l,lOtl $ 960 s 2,300
il
I
Pavement Rl'h:tbili-tat ion l.R88 1.953 4.61 g
Bridge R cplac mcnt·; • 17!" 3 7(1" 554*
8,459
I ,l 02 •
···-----~~-l-.8~ ~ ____ j Tot<th s: . .\tHl J S _\ • .J:H) i
$(1.] 32 _!
*Bridge replaccmcnl cost~ include ()illy the estimated lW,t ld'upgr;~ding existing bridges to carry the loads included in the two scenarios. The cost or structure !1Ja!lltenann::. bridge replacement and rehabilitation due to functional deticiencic~ and wear-out ar~ not included because of I he inability to isolate structmc maintenance requirement~ associated with heavy loads and the lack of current technology for analyzing the etTects of repctiti vc heavy loadings on the life t ·I' structures. Thcn•fore the totals do not rcflt•ct the entire cost of maintaining the existing S)'Stl·m.
41

while carrying the estimated traffic for both scenarios. The
cost estimates (in 1977 dollars) do not include city streets and
county roads and bridge maintenance, nor bridge rehabilitation
and replacement resulting from functional deficiencies and
deterioration. These costs were excluded due to the inability to
isolate bridge maintenance requirements associated with heavy
loads and the lack of current technology for analyzing the
effects of repetitive heavy loadings on the life of structures.
Pavement rehabilitation costs were projected with the REHAB
computer program. The methodology for adjusting pavement service
life due to heavier trucks was based on the 18-KIP equivalencies
developed during the AASHO Road Test.
TRUCK USE OF HIGHWAYS
A major research project at CTR that has resulted in the
publication of a number of reports is entitled "Truck Use of
Highways in Texas." Three of these reports will be reviewed in
this section.
Q~~g~~~ ig I~~~~ Qi~~Q~i£Q~
A CTR report entitled "An Assessment of Changes in Truck
Dimensions on Highway Geometric Design Principles and Practices"
was published in 1981. The report emphasizes that any
significant change in the vehicular operating characteristics
would require an assessment of the geometric design practices and
the impact on the existing highway system in terms of operational
aspects and safety. In order to accommodate larger vehicles,
42

additional costs would be required to redesign and modify the
current network or segments of the network.
I~~£~ ~l~~ ~g£ ~~l~~l ~l~£l~~
A CTR report entitled "An Assessment of Recent State Truck
Size and Weight Studies" was published in 1982. The report
documents the status of current legislation in each state with
respect to laws governing truck size and weight, with emphasis
placed on laws pertinent to the operation of larger motor
carriers such as "doubles" and "triples", overall vehicle length,
width, axle weight, and gross vehicle weight. It was emphasized
in many studies that highway engineers concerned with pavement
design, maintenance, and general serviceability are more
interested in the magnitude and frequency of axle weights than in
gross vehicle weights.
An analysis of the results of the Texas Size and Weights
study indicated that the introduction of triple trailer
combinations, as well as the so-called "turnpike doubles", into
Texas may not create serious additional pavement damage or
require extensive geometric redesign cost if these large
combinations are confined to the Interstate system. Allowing
these combinations on U.S. and State highways would result in
considerable trucking benefits, but allowing these vehicles on
farm-to-market roads would be very impractical.
~~lfllg~ ~~l~£££l£~Z
A CTR report entitled "Truck Weight Shifting Methodology for
Predicting Highway Loads" was published in 1983. The report
doc~ments a new procedure for the projection of changes in future
43

truck weight distribution patterns due to changes in legal truck
weight limits. The methodology can be used to predict both gross
vehicle weight and axle weight distributions. Weight
distribution patterns can have a significant effect on cost
effective design and rehabilitation of pavements.
THE TRUCK WEIGHING PROGRAM IN TEXAS
A number of studies have been made of SDHPT's truck weight
survey program over the last 15 years. The general consensus of
these studies is that an adequate sample of the actual axle
weights operating over
highway planning and
Texas highways
design. In
is extremely important to
the early 1960's, SDHPT
collected weight data from 21 manual "loadometer" stations. By
1983, six weigh-in-motion stations were in operation. It is
believed that SDHPT's ability to project the costs required to
perpetuate the highway system in Texas could be significantly
improved if weight data was collected at a larger number of
locations throughout the state.
TRAFFIC LOAD FORECASTING
A CTR research project entitled "Estimation of Truck
Loadings for Design and/or Rehabilitation of Pavements" will be
completed this year. The objective of this study is to examine
SDHPT's existing traffic load forecasting procedure and determine
if any improvements should be made. The typical purpose of the
Texas procedure is to determine the total 18-KIP equivalent
single axle loads (18 KESALs) that are expected to operate over a
particular highway segment during a 20-year period.
44

A fundamental assumption of the Texas procedure, as well as
the procedure used in most other states, is the applicability of
the AASHO equivalency factors for calculation of total 18 KESALs.
If the equivalencies are accurate, it is possible to determine
the amount of damage caused by one vehicle in relation to the
damage caused by a standard vehicle. Since this can be a very
important concept for the assessment of permit fees for
overweight trucks,
Appendix A.
additional detail has been provided in
STUDY OF TRUCK LANE NEEDS
Traffic increase is an inevitable by-product of the
phenomenal growth of the State of Texas. Both general and
commercial traffic are on the rise, in metropolitan and rural
areas alike, impinging upon the ability of the current highway
system to meet the future needs of the State's economy and the
mobility of its residents in a safe and efficient manner.
Furthermore, current trends toward larger and heavier trucks on
one hand, and toward more compact fuel-efficient passenger
vehicles on the other, raise serious safety considerations due to
the sharing of roadways by vehicles with such dissimilar extreme
characteristics.
The development and implementation of economically and
technically viable solutions require concerted planning efforts
supported by careful analysis of anticipated truck traffic on the
highway network. The implications of various proposed solutions
in terms of required expenditures and resulting service levels
45

for both the trucking industry and the general public should be
systematically assessed and evaluated. No quick fixes to a
problem of this magnitude exist, and the decisions and strategies
developed now will have long-ranging effects on future
development. Adequate methodological support for this planning
activity is essential for its proper conduct.
Q£j~£~i!~
The overall objective of this study is to develop
information that will be useful to SDHPT in solving the unique
problems associated with heavy truck usage of highway facilities.
The major tasks are: (1) identifying critical highway sections
from the perspective of excessive truck traffic; (2) establishing
criteria or warranting procedures for measures to cope with truck
traffic; and (3) evaluating the corridor and systemwide impacts
of various relief or prevention measures.
!~El~~~~~~~iQ~ ~~Q ~~~~£.!.~~
The results of this study will provide SDHPT with a
systematic procedure for identifying, analyzing, and evaluating
the truck lane needs on the Texas highway system. As the SDHPT
intensifies its activities in reconstructing and performing heavy
maintenance on the major intercity routes, the presence of
significant truck traffic will affect the expenditures needed.
In its decision making, SDHPT can make better use of the
taxpayers' dollars if it has reliable information about the best
truck lane design counter-measures applicable for use on the
network. The results will provide for the safest, most efficient
facilities available for a given level of expenditures.
46

ANALYSIS OF HIGHWAY COST ALLOCATION IN TEXAS
1!!.!!:2.Q.!!.£!i2.!!.
The highway cost allocation problem is one of determining
equitable charges for each of the vehicle classes sharing
transportation facilities such as highways and bridges. A
completely non-controversial solution methodology for the cost
allocation problem may not exist; however, cost must be allocated
in some rational and systematic way which is deemed equitable by
all users of the system.
Previous attempts at solving the highway cost allocation
problem can essentially be reduced to two major approaches: (a)
proportional (consumption) allocation methods, which determine
cost allocations in proportion to one or more measures of highway
usage; and (b) incremental methods, which allocate costs on the
basis of highway design differences necessary to accommodate
gradually heavier vehicle classes.
There exist, however, some limitations affecting the
validity of the traditional cost allocation methodologies. On
one hand, proportional methods may yield results that conflict
with the perception of fairness by some of the users, hence
hindering the acceptability of such results and questioning the
overall applicability of proportional approaches. On the other
hand, incremental methods may yield inconsistent results, since
they identify cost responsibilities on the basis of cost
dirferences associated with the specific ordering of vehicle
classes. The inconsistency is due to the fact that if vehicle
47

classes are introduced in different sequences, different cost
allocations are obtained. Since a rational basis to support a
particular sequence does not exist, this inconsistency
constitutes a serious flaw in any cost allocation method that
seeks to be equitable.
New Methods
In an attempt to overcome the shortcomings aforementioned,
two new solution approaches to the highway cost allocation
problem have been developed:
and an optimization approach referred to as the Generalized -----------Method. ------ A significant feature of the two new methods; is that
they consider all possible combinations of the given vehicle
classes as scenarios for which highway costs are computed given a
planning horizon and traffic data. In the analysis, the costs
associated with all scenarios are used to compute final vehicle
class allocations that satisfy the following three requirements:
(a) Completeness: the provision of highway facilities must
be entirely financed by the various vehicle classes
that utilize them.
(b) Rationality: The common facility is the most
economically attractive alternative for all vehicle
classes to meet their transportation needs; that is,
any other alternative to satisfy this need, such as
using an exclusive facility, would be more expensive
for any vehicle class.
48

(c) Marginality: the allocated costs associated with any
vehicle class must be sufficient to at least cover its
corresponding marginal costs.
Work !£££~£li~~~i
The work so far accomplished in this project can be
summarized as follows:
1. The conceptual models for the Modified Incremental
Approach and the Generalized Method have been
developed.
2. The models mentioned above have been computerized and
preliminary tests have been run with satisfactory
results.
3. The RENU2 program has been reviewed and modified to
make it more suitable to the needs of this problem and
to improve its cost estimating capabilities. In
particular:
(a) The program was made sensitive to traffic
intensity (for instance, number of vehicles per
year);
(b) Results from other studies were implemented to
upgrade the pavement survival estimation
capability of the program;
(c) The age adjusting procedure was substantially
revise to reflect a more realistic behavior;
(d) The program was simplified to yield only results
related to cost allocation. All computations
49

associated with changes in legal load limits were
eliminated.
(e) Work is being conducted to develop performance and
survivor curves that are responsive to changes in
traffic composition. This work is needed, since
RENU2 contains curves that are representative of
past traffic conditions. Therefore, new curves
must be developed for new scenarios.
4. A few runs of the entire procedure have been made in
order to test the program. More extensive runs with
more realistic data will be conducted.
5. A report describing the work accomplished in FY 83-84
is under preparation.
COMPUTERIZED METHOD OF PROJECTING REHABILITATION AND MAINTENANCE REQUIREMENTS DUE TO VEHICLE LOADINGS
The goal of this research project is to revise and combine
the REHAB and NULOAD computer models into a new approach to
forecast pavement rehabilitation costs. The new model is called
RENU and it incorporates the following three main elements: (a)
revised pavement performance equations, (b) design-oriented
survivor curves, and (c) a procedure to predict the increment in
axle loads when higher pay loads are allowed. The most relevant
contribution of the new model in the area of flexible pavements
is the development of a serviceability/distress approach to
investigate the effect of vehicle loading on the life cycle of
highways. This approach has the capability to predict if a
pavement needs light to medium rehabilitation as a result of
50

distress signs, when the riding conditions (PSI) have not yet
reached a terminal value.
The new approach is considered more reliable, for Texas
flexible pa vern en ts, than the AASHTO methode 1 ogy. In the area of
rigid pavements the two most important improvements are the
formulation of a modified AASHTO equation to include soil support
values, regional factors, design characteristics, and traffic
conditions typical of the Texas highway system, and the
development of a failure prediction model to estimate maintenance
needs.
The RENU approach was built using experimental values of
material properties, climatic conditions, design factors, and
traffic measurements obtained by the Texas Transportation
Institute (TTl) and the Center for Transportation Research (CTR).
Briefly, the avera 11 methodology can be summarized in four
steps: (a) a load distribution procedure is incorporated to
investigate the shift toward higher loads is a new legal axle
load limit is considered, (b) generation of a pavement
performance functions based upon statistical criteria, (c)
generation of a survivor curve to predict the extent of road
rehabilitation requirements in each of the periods of a planning
horizon, and (d) determination of rehabilitation costs
considering life cycles for both the current and new axle load
legal limits.
EFFECTS OF OIL FIELD DEVELOPMENT ON RURAL HIGHWAYS
The principal objectives of this study were to identify the
primary phases of development of an oil well, describe the
51

vehicle-mix during the development, and estimate an annual cost
associated with a reduced pavement life. Five general activities
comprise the sequential development: site preparation, rigging
up, drilling, completion, and production.
Traffic generated by the drilling of an oil well was
recorded using an 18mm movie camera. Peak volumes of up to 350
vehicles per day occurred during the rigging stages.
Approximately 200 vehicles per day were present during the
drilling phase. An average daily traffic of 150 vehicles per day
was observed over the 73 day filming period. The average daily
traffic is estimated at 50 vehicles per day once the production
phase stabilizes.
Truck combinations made up 14 percent of the traffic mix
during the filming period. Seven (7) percent of the total
traffic mix consisted of the 3-S2 (tractor-semitrailer) type.
Since actual axle weight measurements were not possible in this
study, the observed truck counts were distributed across the axle
load ranges compiled by the SDHPT and listed in the axle load
distribution tables ("W-Tables). When converted to 18-KESAL, 945
equivalent load repetitions were estimated in the design lane at
the oil well site for the first year.
When the oil well traffic repetitions (945) are added to the
intended use 18KESAL repetitions (445), 1390-18KESAL repetitions
result after one year of service. The concept of pavement
serviceability developed at the AASHO Road Test was then used to
determine a reduction in pavement service life due to this
increased traffic demand.
52

··-o--- '--..JJ
An increased annual cost of $12,500 per mile was estimated
for a low volume (250 ADT), light duty (1/2 inch bituminous surface
treatment on a 6-inch foundation base course) pavement section.
This cost considered only a capital investment for a surface
treatment pavement and the cost to resurface the pavement for the
intended use condition. The initial pavement placement cost was
estimated at $61,000/mile and $8,600/mile for a future seal coat
surface treatment. It was further assumed that oil production
would last at least 3 years. Final pavement design may actually
necessitate the reconstruction of a higher type pavement to cost
effectively serve the increased traffic demand generated by
ultimate oil field development.
Reduction in service life generally range from 60 to 75
percent. Actual loss of pavement utility varies among the
distress types. Raveling and flushing distress experience a 75
percent reduction in service life for both the 6-inch and 10-inch
pavements. Since these distresses are traffic-associated, the
increase in average daily traffic is primarily responsible for
this loss of service. Load associated distresses result in
approximately 60 percent loss of life. The thinner 6-inch
pavement is, as expected, very sensitive to increased axle
loading.
This technique can be used to evaluate alternative
maintenance strategies or to select pavement thickness
commensurate with a truck traffic demand. Potentially, the
procedure can aid SDHPT in allocating funds to districts that are
in particular need of additional maintenance or reconstruction
monies. The versatility of the computer program provides a
53

framework for examining other "special-use" truck traffic
conditions.
54