Aspects of agro-products export promotion in Azerbaijan
33
Expert Round Table “Best practices in export promotion: Experiences in Latin America, Eastern Europe and Central Asia” 24-25 of May 2016 , IAMO Halle (Saale), Germany Dr. Elchin R. Atababayev Aspects of agro-products export promotion in Azerbaijan
-
Upload
externalevents -
Category
Education
-
view
203 -
download
1
Transcript of Aspects of agro-products export promotion in Azerbaijan
Expert Round Table
“Best practices in export promotion:
Experiences in Latin America, Eastern Europe and Central Asia”
24-25 of May 2016 , IAMO Halle (Saale), Germany
Dr. Elchin R. Atababayev
Aspects of agro-products export promotion in Azerbaijan
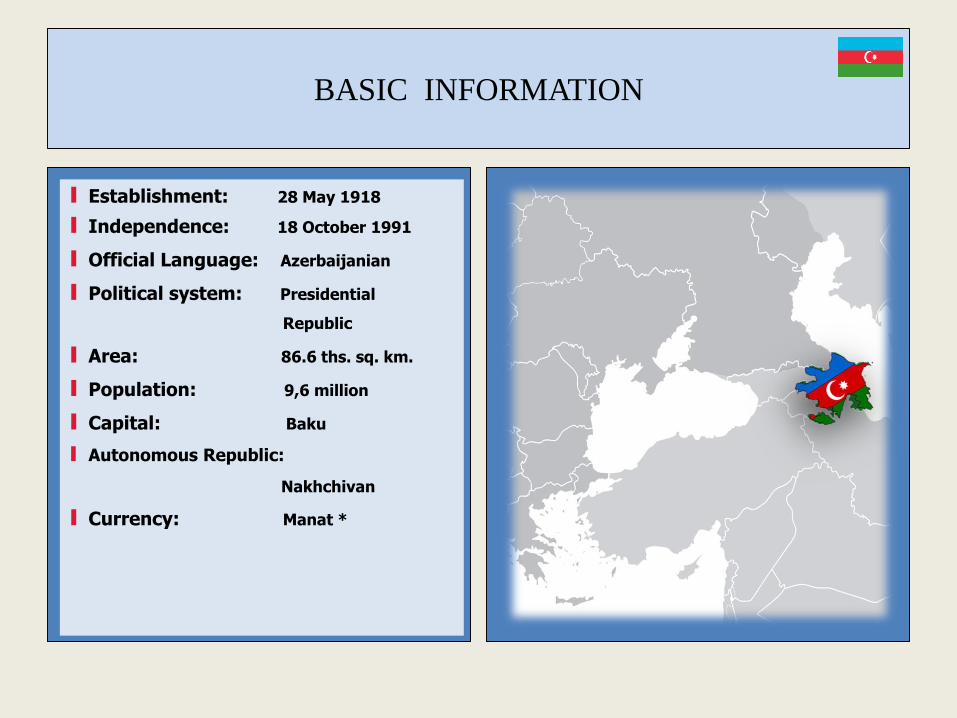
BASIC INFORMATION
I Establishment: 28 May 1918
I Independence: 18 October 1991
I Official Language: Azerbaijanian
I Political system: Presidential
Republic
I Area: 86.6 ths. sq. km.
I Population: 9,6 million
I Capital: Baku
I Autonomous Republic:
Nakhchivan
I Currency: Manat *
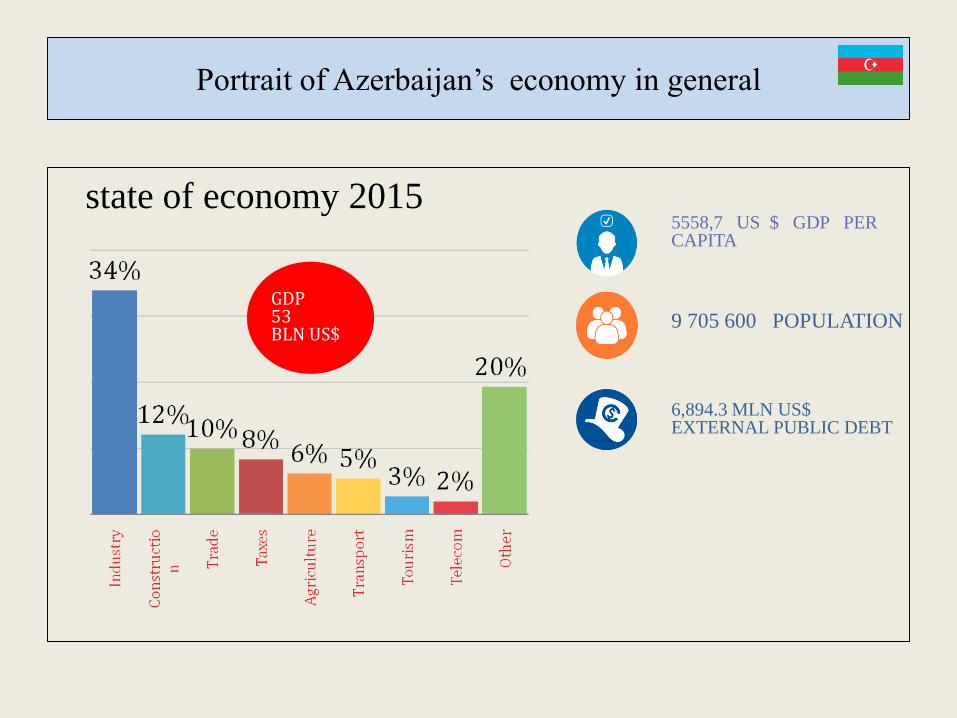
Portrait of Azerbaijan’s economy in general
state of economy 2015 5558,7 US $ GDP PER CAPITA
9 705 600 POPULATIONGDP53 BLN US$
6,894.3 MLN US$EXTERNAL PUBLIC DEBT

Competitiveness of Azerbaijan economy
The Global Competitiveness Report 2015-2016 Commonwealth of Independent States
AZERBAIJAN
Azerbaijan #40
KAZAKHSTAN #42
RUSSIA #45
GEORGIA #66
UKRAINE #79
TAJIKISTAN #80
ARMENIA #82
MOLDOVA #84
KYRGYZSTAN #102
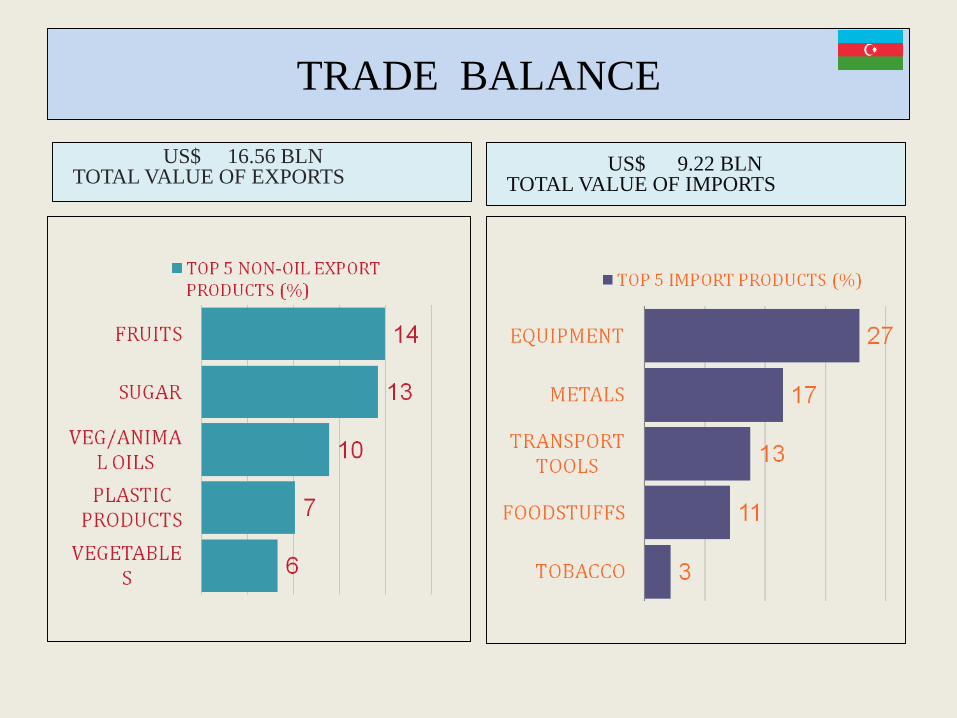
TRADE BALANCE
US$ 16.56 BLNTOTAL VALUE OF EXPORTS
US$ 9.22 BLNTOTAL VALUE OF IMPORTS
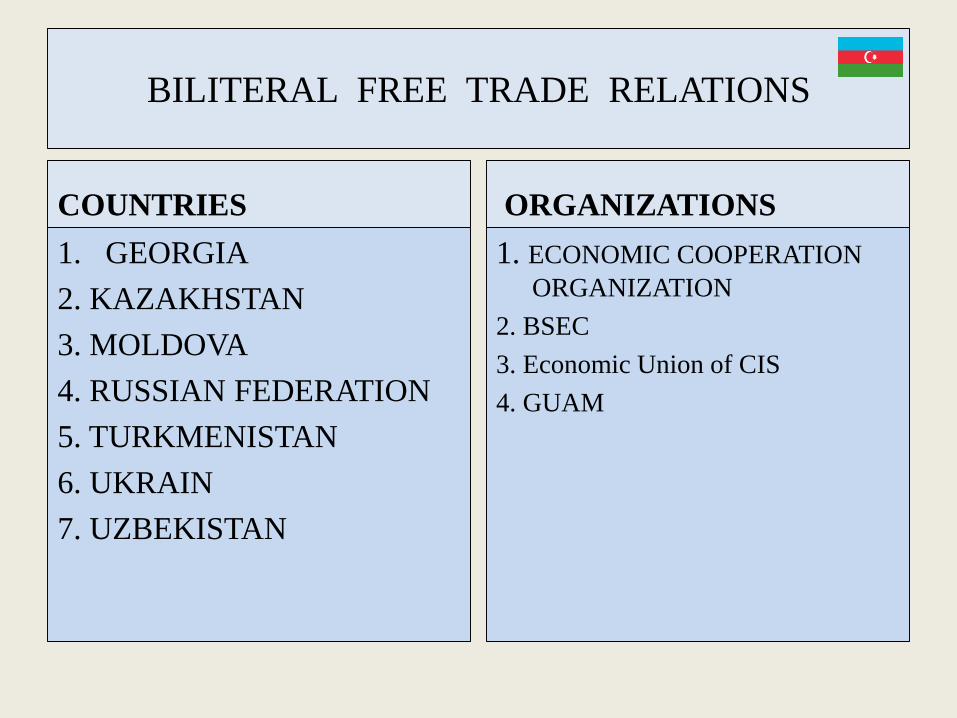
BILITERAL FREE TRADE RELATIONS
COUNTRIES
1. GEORGIA
2. KAZAKHSTAN
3. MOLDOVA
4. RUSSIAN FEDERATION
5. TURKMENISTAN
6. UKRAIN
7. UZBEKISTAN
ORGANIZATIONS
1. ECONOMIC COOPERATION
ORGANIZATION
2. BSEC
3. Economic Union of CIS
4. GUAM

REGIONAL PROSPECT

NON-OIL INVESTMENTS
Non-oil Foreign Investments Non-oil Top Investors
TURKEY 2,8 BLN US $
UK 1,5 BLN US $
USA 1,0 BLN US $
NETHERLANDS 0,9 BLN US $
UAE 0,7 BLN US $
GERMANY 0,4 BLN US $
Economic portrait of agricultural sector of
Azerbaijan
• 1. The volume of contribution of Agriculture
and food processing sector to country GDP is
6 % ( 31 December 2015).
• 2. Sector employs 39 % of labor force .
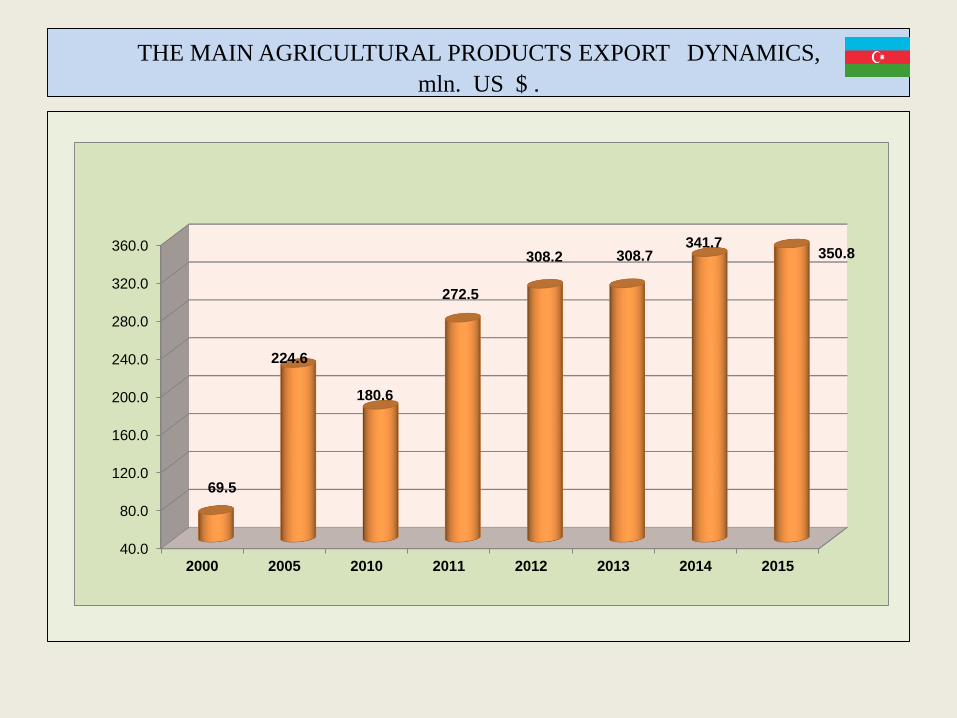
THE MAIN AGRICULTURAL PRODUCTS EXPORT DYNAMICS,
mln. US $ .
40.0
80.0
120.0
160.0
200.0
240.0
280.0
320.0
360.0
2000 2005 2010 2011 2012 2013 2014 2015
69.5
224.6
180.6
272.5
308.2 308.7341.7
350.8
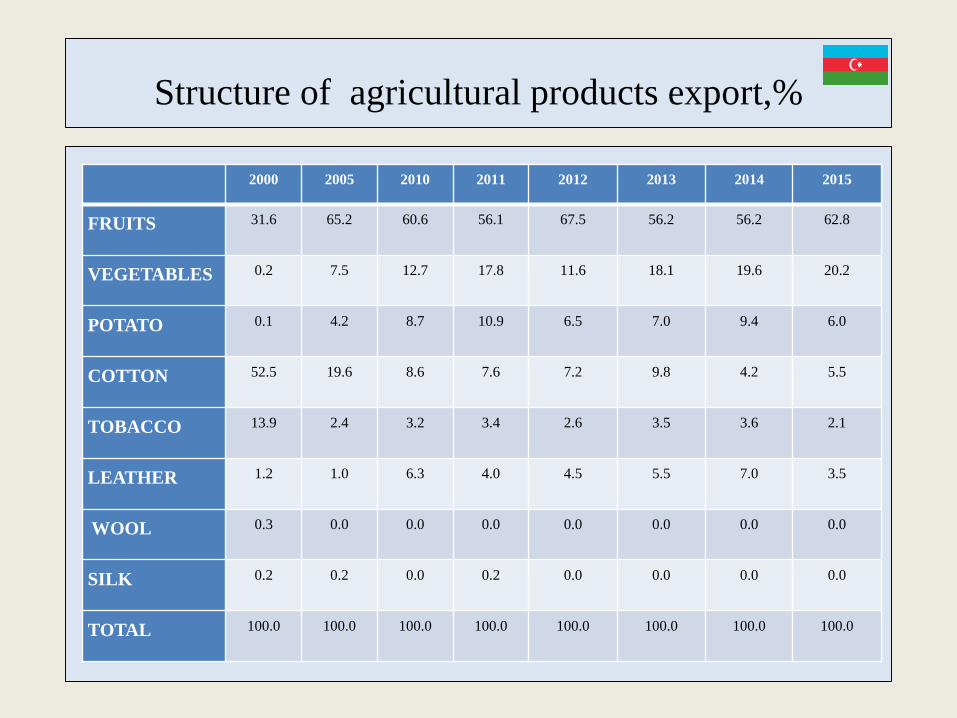
Structure of agricultural products export,%
2000 2005 2010 2011 2012 2013 2014 2015
FRUITS 31.6 65.2 60.6 56.1 67.5 56.2 56.2 62.8
VEGETABLES 0.2 7.5 12.7 17.8 11.6 18.1 19.6 20.2
POTATO 0.1 4.2 8.7 10.9 6.5 7.0 9.4 6.0
COTTON 52.5 19.6 8.6 7.6 7.2 9.8 4.2 5.5
TOBACCO 13.9 2.4 3.2 3.4 2.6 3.5 3.6 2.1
LEATHER 1.2 1.0 6.3 4.0 4.5 5.5 7.0 3.5
WOOL 0.3 0.0 0.0 0.0 0.0 0.0 0.0 0.0
SILK 0.2 0.2 0.0 0.2 0.0 0.0 0.0 0.0
TOTAL 100.0 100.0 100.0 100.0 100.0 100.0 100.0 100.0
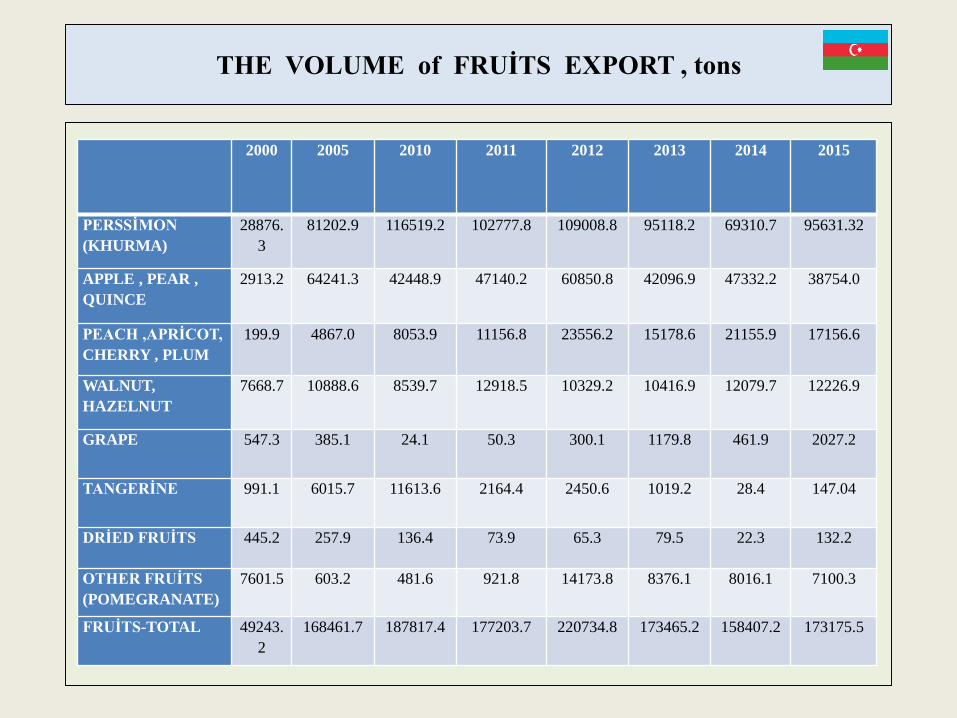
THE VOLUME of FRUİTS EXPORT , tons
2000 2005 2010 2011 2012 2013 2014 2015
PERSSİMON
(KHURMA)
28876.
3
81202.9 116519.2 102777.8 109008.8 95118.2 69310.7 95631.32
APPLE , PEAR ,
QUINCE
2913.2 64241.3 42448.9 47140.2 60850.8 42096.9 47332.2 38754.0
PEACH ,APRİCOT,
CHERRY , PLUM
199.9 4867.0 8053.9 11156.8 23556.2 15178.6 21155.9 17156.6
WALNUT,
HAZELNUT
7668.7 10888.6 8539.7 12918.5 10329.2 10416.9 12079.7 12226.9
GRAPE 547.3 385.1 24.1 50.3 300.1 1179.8 461.9 2027.2
TANGERİNE 991.1 6015.7 11613.6 2164.4 2450.6 1019.2 28.4 147.04
DRİED FRUİTS 445.2 257.9 136.4 73.9 65.3 79.5 22.3 132.2
OTHER FRUİTS
(POMEGRANATE)
7601.5 603.2 481.6 921.8 14173.8 8376.1 8016.1 7100.3
FRUİTS-TOTAL 49243.
2
168461.7 187817.4 177203.7 220734.8 173465.2 158407.2 173175.5
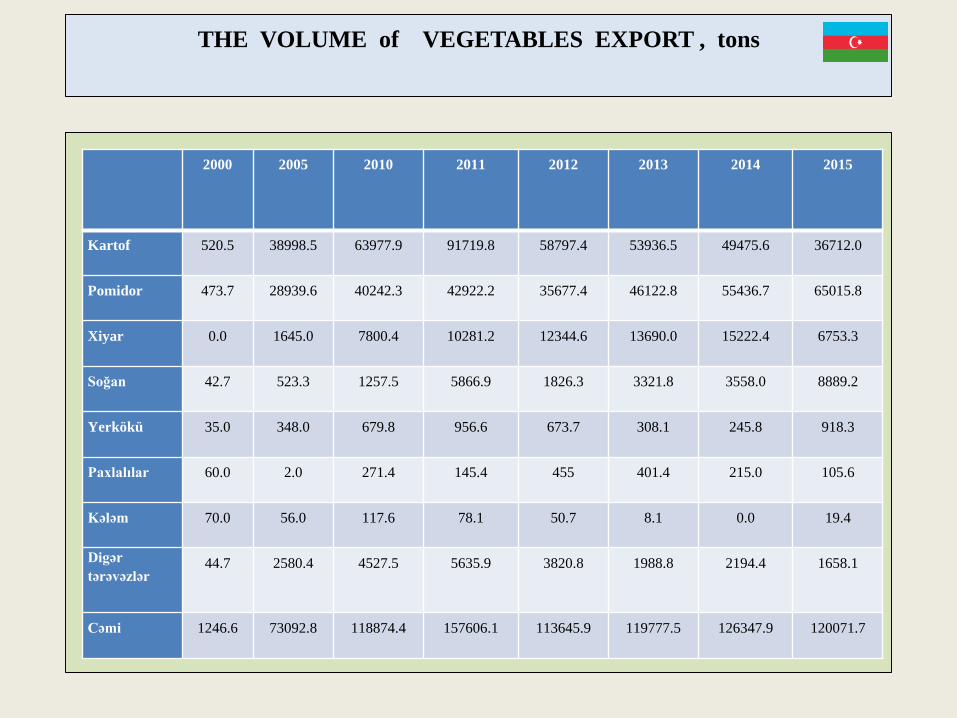
THE VOLUME of VEGETABLES EXPORT , tons
2000 2005 2010 2011 2012 2013 2014 2015
Kartof 520.5 38998.5 63977.9 91719.8 58797.4 53936.5 49475.6 36712.0
Pomidor 473.7 28939.6 40242.3 42922.2 35677.4 46122.8 55436.7 65015.8
Xiyar 0.0 1645.0 7800.4 10281.2 12344.6 13690.0 15222.4 6753.3
Soğan 42.7 523.3 1257.5 5866.9 1826.3 3321.8 3558.0 8889.2
Yerkökü 35.0 348.0 679.8 956.6 673.7 308.1 245.8 918.3
Paxlalılar 60.0 2.0 271.4 145.4 455 401.4 215.0 105.6
Kələm 70.0 56.0 117.6 78.1 50.7 8.1 0.0 19.4
Digər
tərəvəzlər44.7 2580.4 4527.5 5635.9 3820.8 1988.8 2194.4 1658.1
Cəmi 1246.6 73092.8 118874.4 157606.1 113645.9 119777.5 126347.9 120071.7
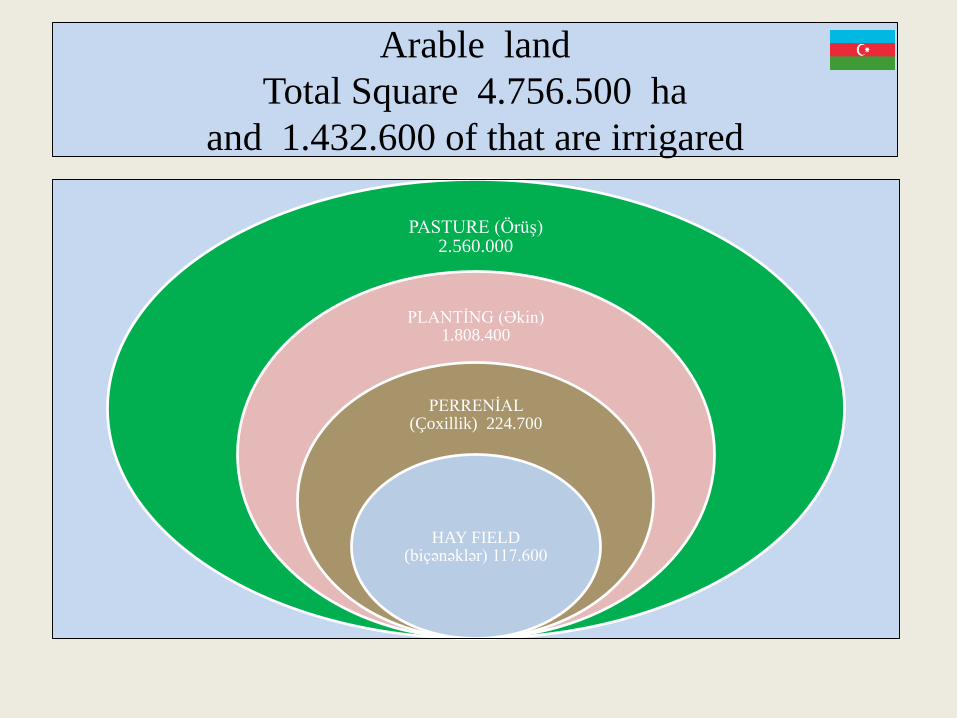
Arable land
Total Square 4.756.500 ha
and 1.432.600 of that are irrigared
PASTURE (Örüş) 2.560.000
PLANTİNG (Əkin) 1.808.400
PERRENİAL (Çoxillik) 224.700
HAY FIELD (biçənəklər) 117.600
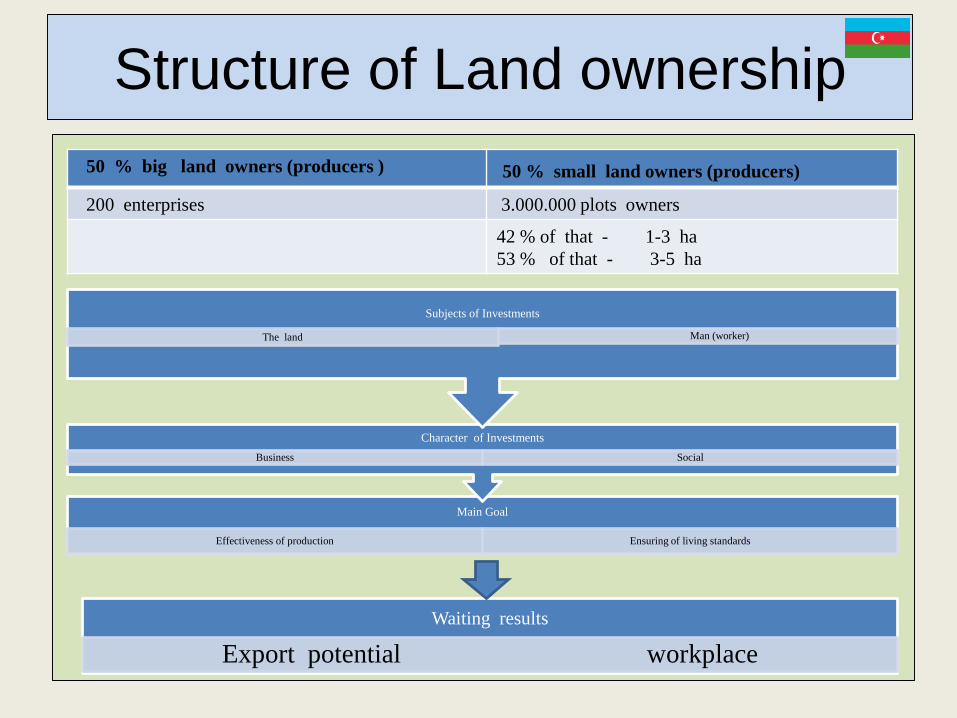
Structure of Land ownership
Main Goal
Effectiveness of production Ensuring of living standards
Character of Investments
Business Social
Subjects of Investments
The land Man (worker)
Waiting results
Export potential workplace
50 % big land owners (producers ) 50 % small land owners (producers)
200 enterprises 3.000.000 plots owners
42 % of that - 1-3 ha
53 % of that - 3-5 ha
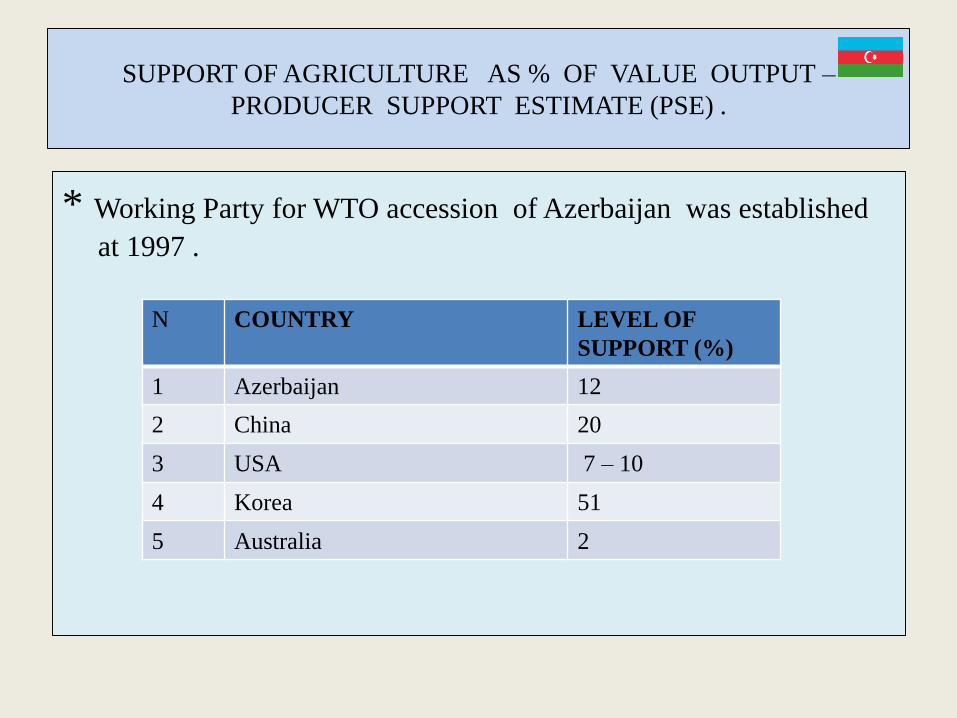
SUPPORT OF AGRICULTURE AS % OF VALUE OUTPUT –
PRODUCER SUPPORT ESTIMATE (PSE) .
* Working Party for WTO accession of Azerbaijan was established
at 1997 .
N COUNTRY LEVEL OF
SUPPORT (%)
1 Azerbaijan 12
2 China 20
3 USA 7 – 10
4 Korea 51
5 Australia 2
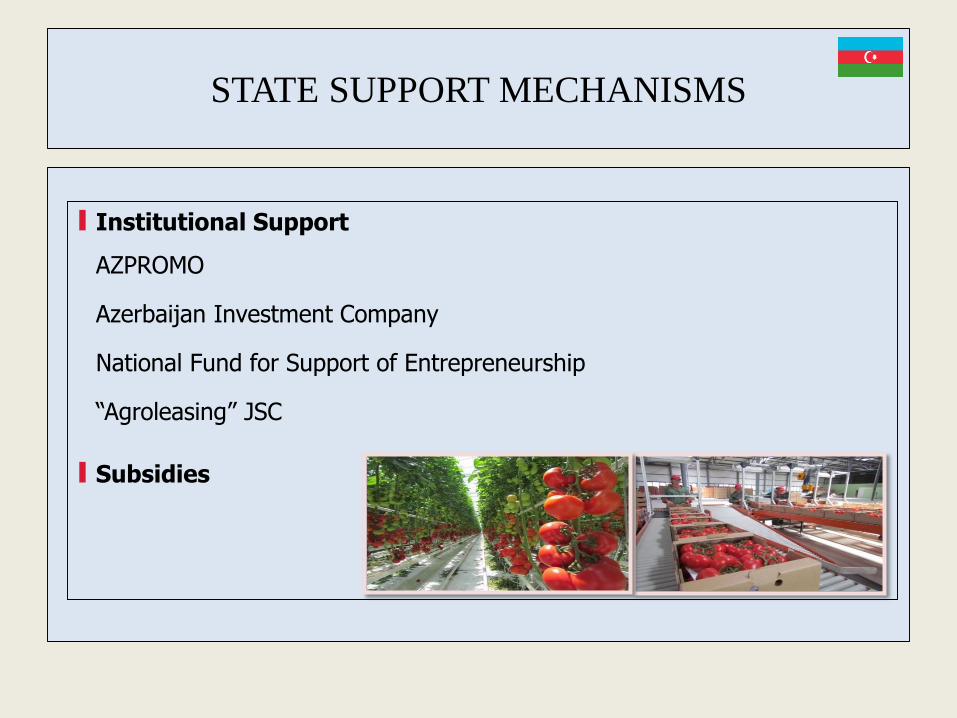
STATE SUPPORT MECHANISMS
I Institutional Support
AZPROMO
Azerbaijan Investment Company
National Fund for Support of Entrepreneurship
“Agroleasing” JSC
I Subsidies
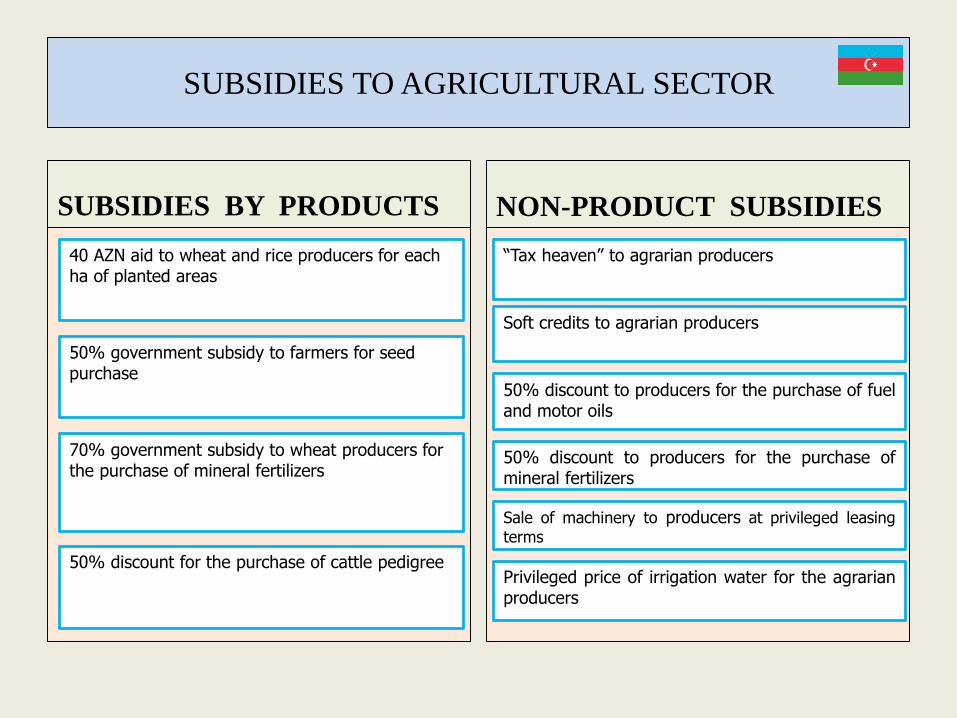
SUBSIDIES TO AGRICULTURAL SECTOR
SUBSIDIES BY PRODUCTS NON-PRODUCT SUBSIDIES
40 AZN aid to wheat and rice producers for each ha of planted areas
50% government subsidy to farmers for seed purchase
70% government subsidy to wheat producers for the purchase of mineral fertilizers
50% discount for the purchase of cattle pedigree
“Tax heaven” to agrarian producers
Soft credits to agrarian producers
50% discount to producers for the purchase of fueland motor oils
50% discount to producers for the purchase ofmineral fertilizers
Sale of machinery to producers at privileged leasingterms
Privileged price of irrigation water for the agrarianproducers
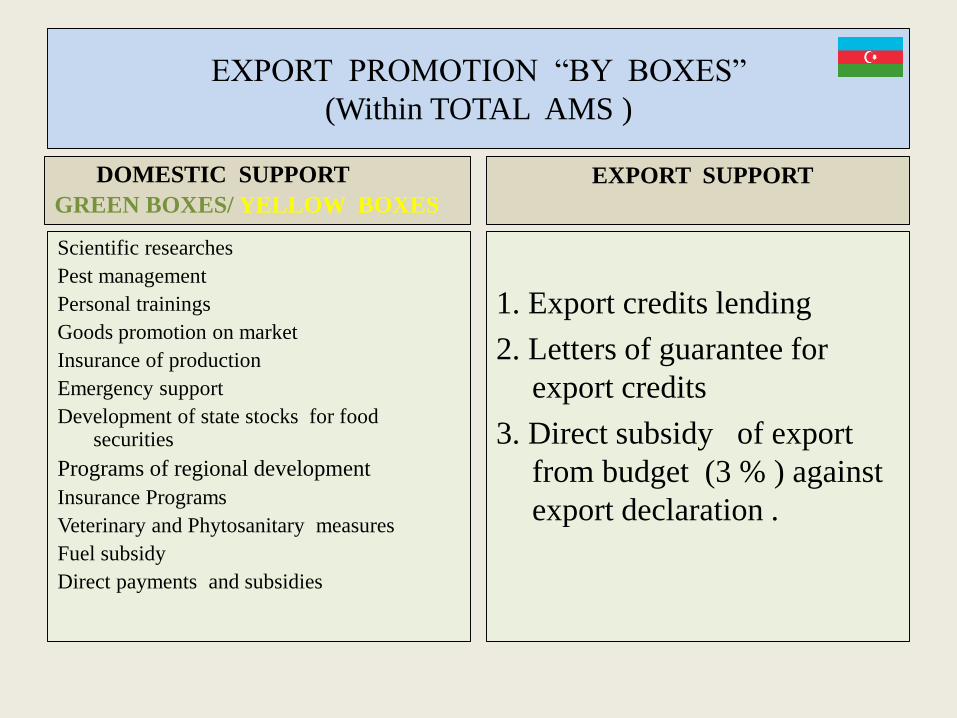
EXPORT PROMOTION “BY BOXES”
(Within TOTAL AMS )
DOMESTIC SUPPORT
GREEN BOXES/ YELLOW BOXES
Scientific researches
Pest management
Personal trainings
Goods promotion on market
Insurance of production
Emergency support
Development of state stocks for food securities
Programs of regional development
Insurance Programs
Veterinary and Phytosanitary measures
Fuel subsidy
Direct payments and subsidies
EXPORT SUPPORT
1. Export credits lending
2. Letters of guarantee for
export credits
3. Direct subsidy of export
from budget (3 % ) against
export declaration .
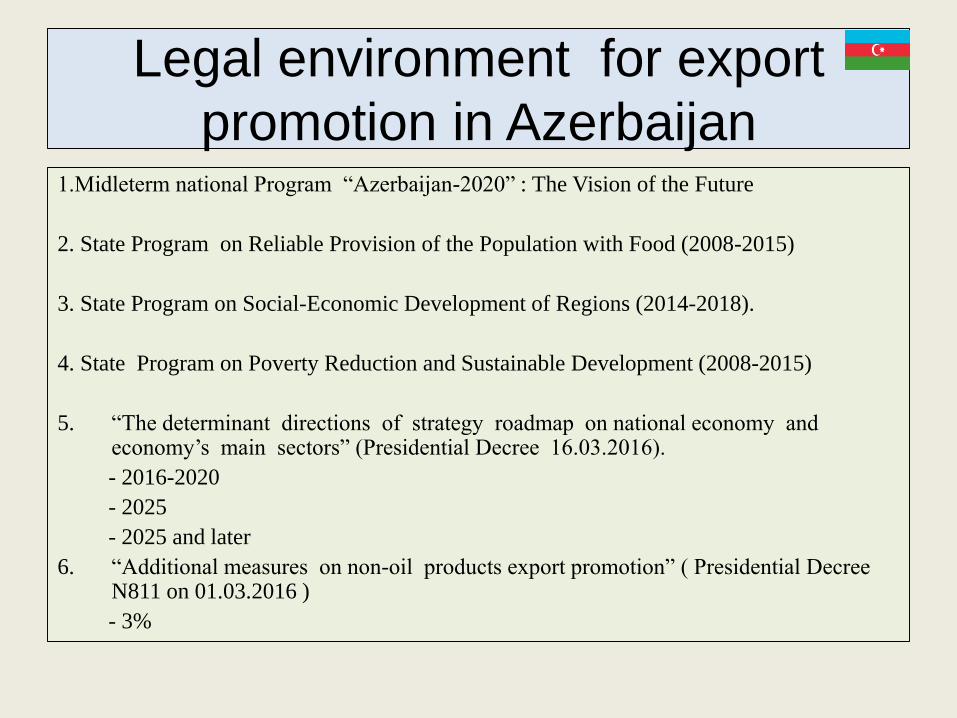
Legal environment for export
promotion in Azerbaijan 1.Midleterm national Program “Azerbaijan-2020” : The Vision of the Future
2. State Program on Reliable Provision of the Population with Food (2008-2015)
3. State Program on Social-Economic Development of Regions (2014-2018).
4. State Program on Poverty Reduction and Sustainable Development (2008-2015)
5. “The determinant directions of strategy roadmap on national economy and economy’s main sectors” (Presidential Decree 16.03.2016).
- 2016-2020
- 2025
- 2025 and later
6. “Additional measures on non-oil products export promotion” ( Presidential Decree N811 on 01.03.2016 )
- 3%
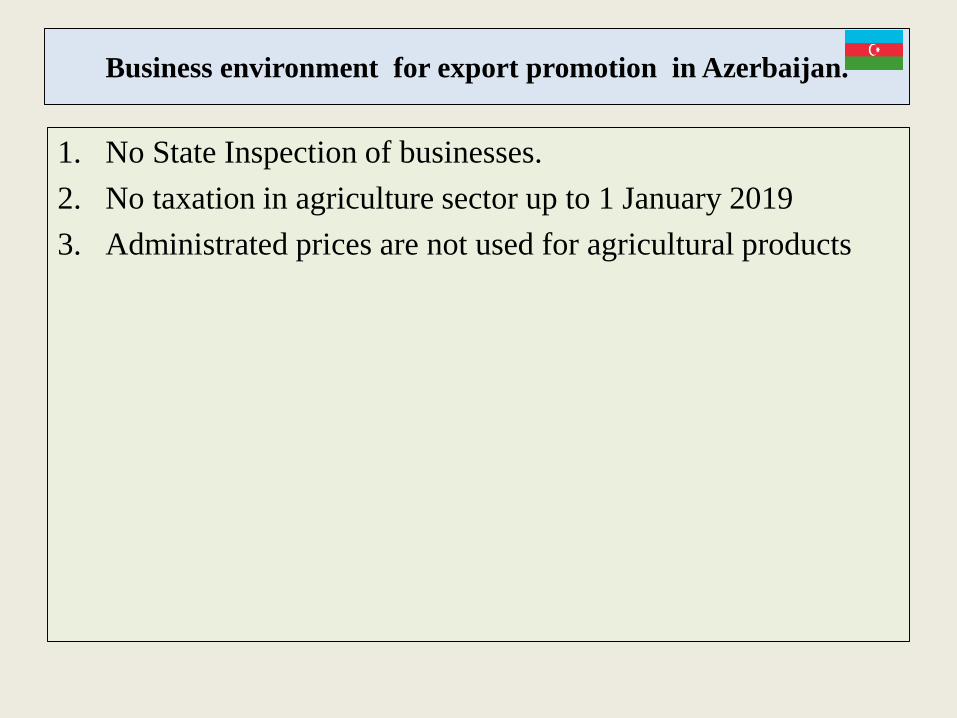
Business environment for export promotion in Azerbaijan.
1. No State Inspection of businesses.
2. No taxation in agriculture sector up to 1 January 2019
3. Administrated prices are not used for agricultural products

International directive documents for agriculture sector
of Azerbaijan
1. “Millenium Development Goals” Declaration
2. United Nations Development Assistance
Framework (UNDAF) for the Republic of
Azerbaijan (2011-2015)
3. World Food Security Summits ; 1996, 2009
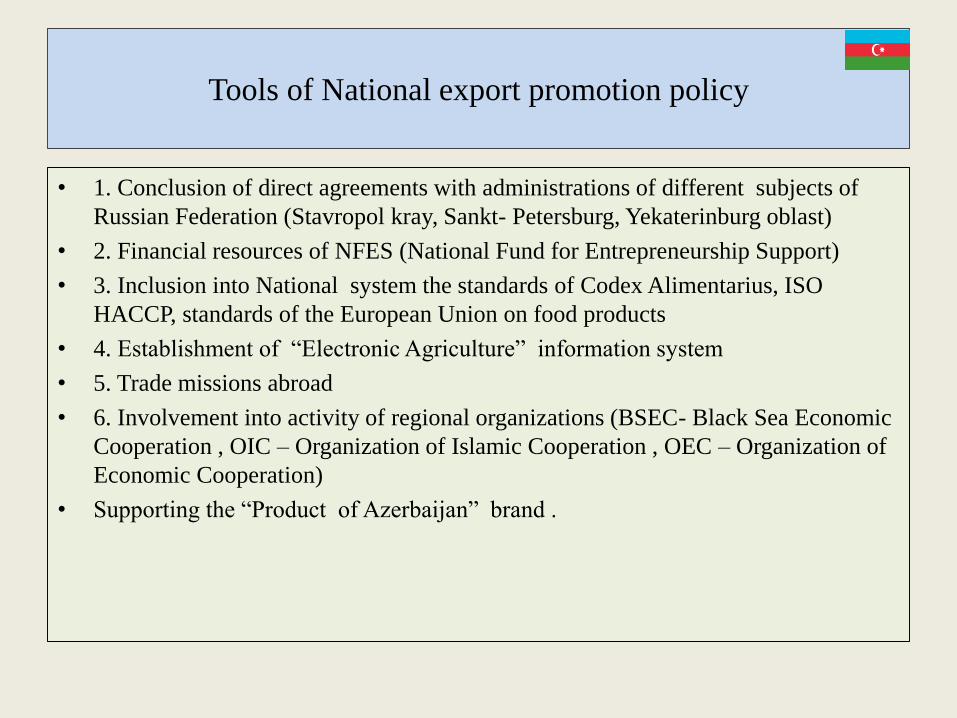
Tools of National export promotion policy
• 1. Conclusion of direct agreements with administrations of different subjects of
Russian Federation (Stavropol kray, Sankt- Petersburg, Yekaterinburg oblast)
• 2. Financial resources of NFES (National Fund for Entrepreneurship Support)
• 3. Inclusion into National system the standards of Codex Alimentarius, ISO
HACCP, standards of the European Union on food products
• 4. Establishment of “Electronic Agriculture” information system
• 5. Trade missions abroad
• 6. Involvement into activity of regional organizations (BSEC- Black Sea Economic
Cooperation , OIC – Organization of Islamic Cooperation , OEC – Organization of
Economic Cooperation)
• Supporting the “Product of Azerbaijan” brand .
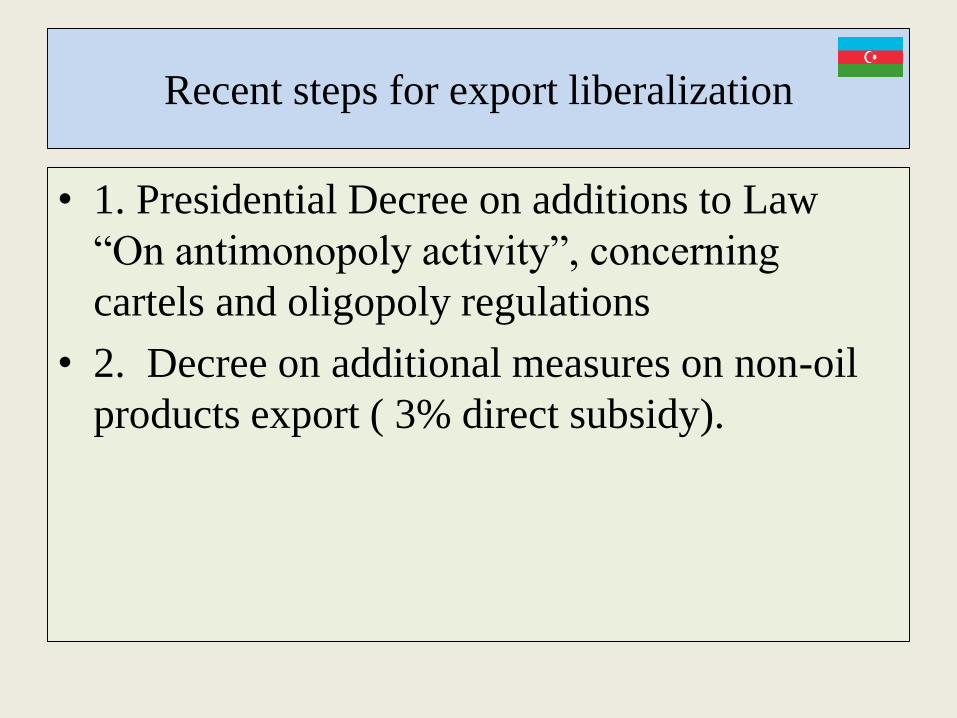
Recent steps for export liberalization
• 1. Presidential Decree on additions to Law
“On antimonopoly activity”, concerning
cartels and oligopoly regulations
• 2. Decree on additional measures on non-oil
products export ( 3% direct subsidy).
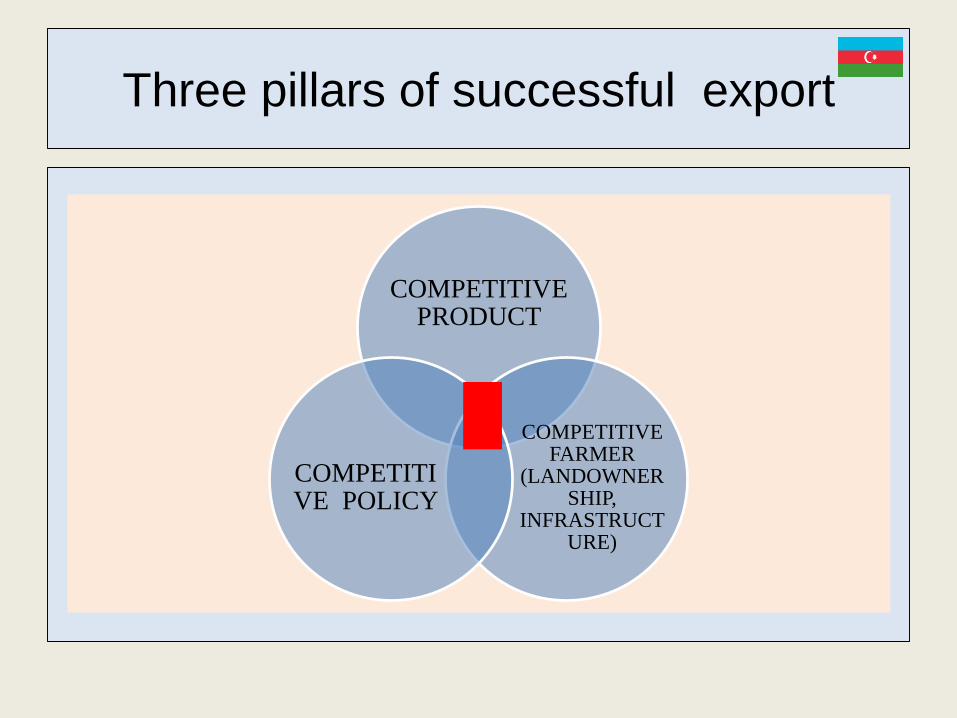
Three pillars of successful export
COMPETITIVE PRODUCT
COMPETITIVE FARMER
(LANDOWNERSHIP,
INFRASTRUCTURE)
COMPETITIVE POLICY
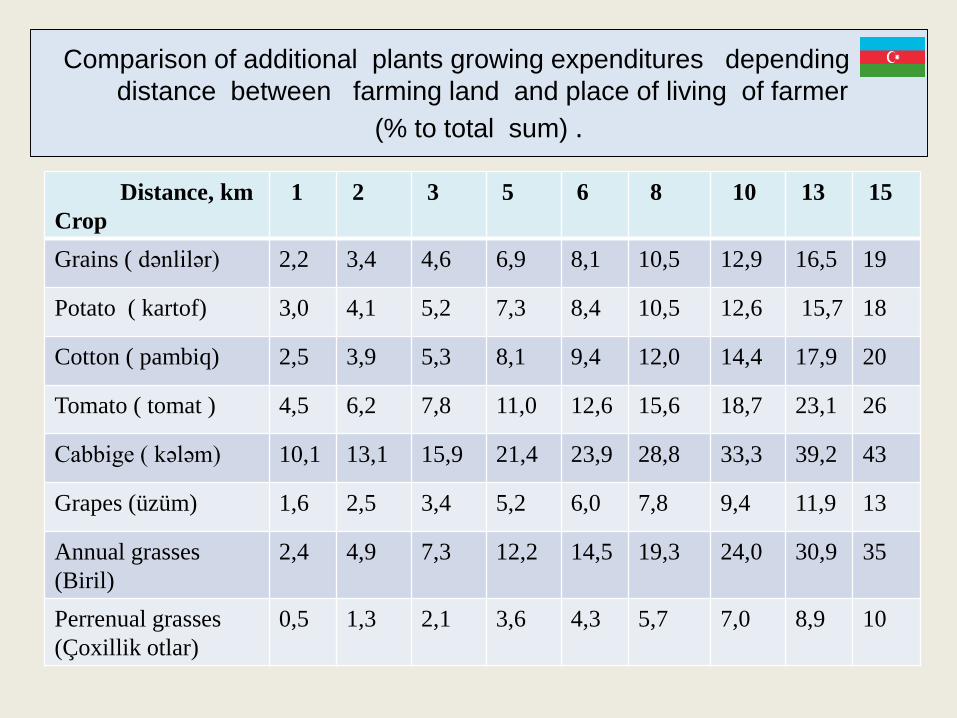
Comparison of additional plants growing expenditures depending on
distance between farming land and place of living of farmer
(% to total sum) .
Distance, km
Crop
1 2 3 5 6 8 10 13 15
Grains ( dənlilər) 2,2 3,4 4,6 6,9 8,1 10,5 12,9 16,5 19
Potato ( kartof) 3,0 4,1 5,2 7,3 8,4 10,5 12,6 15,7 18
Cotton ( pambiq) 2,5 3,9 5,3 8,1 9,4 12,0 14,4 17,9 20
Tomato ( tomat ) 4,5 6,2 7,8 11,0 12,6 15,6 18,7 23,1 26
Cabbige ( kələm) 10,1 13,1 15,9 21,4 23,9 28,8 33,3 39,2 43
Grapes (üzüm) 1,6 2,5 3,4 5,2 6,0 7,8 9,4 11,9 13
Annual grasses
(Biril)
2,4 4,9 7,3 12,2 14,5 19,3 24,0 30,9 35
Perrenual grasses
(Çoxillik otlar)
0,5 1,3 2,1 3,6 4,3 5,7 7,0 8,9 10

Expenditure variation indices for 1 ha crop growing
depending on compartmentalization of land plots
Size of plots
ha
Crops
2 4 5 10 15 20 25 30 35 40
Grains ( dənlilər) 1,17 1,15 1,14 1,10 1,08 1,05 1,04 1,03 1,02 1,01
Potato (kartof) 1,10 1,09 1,08 1,06 1,04 1,03 1,02 1,01 1,01 1,01
Cotton (pambıq) 1,16 1,14 1,13 1,10 1,07 1,05 1,04 1,03 1,02 1,02
Grapes (üzüm) 1,12 1,10 1,09 1,07 1,05 1,04 1,02 1,01 1,01 1,01
Annual grasses
(birillik otlar)
1,11 1,09 1,08 1,06 1,05 1,03 1,02 1,01 1,01 1,01
Perrenual grasses
(Coxillik otlar)
1,24 1,21 1,19 1,14 1,10 1,07 1,05 1,04 1,03 1,02
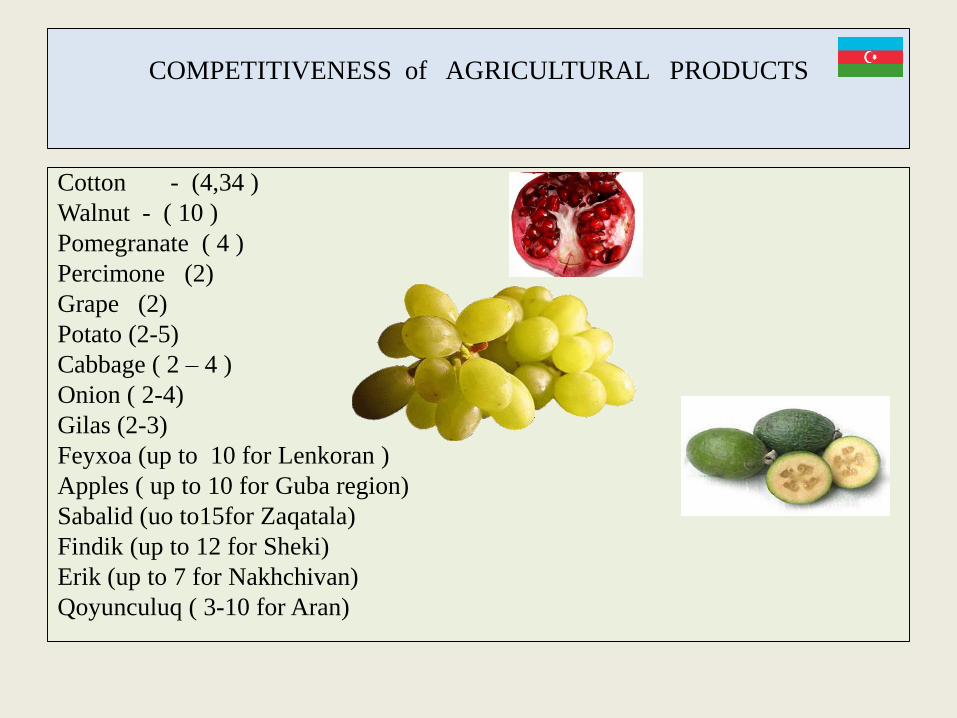
COMPETITIVENESS of AGRICULTURAL PRODUCTS
Cotton - (4,34 )
Walnut - ( 10 )
Pomegranate ( 4 )
Percimone (2)
Grape (2)
Potato (2-5)
Cabbage ( 2 – 4 )
Onion ( 2-4)
Gilas (2-3)
Feyxoa (up to 10 for Lenkoran )
Apples ( up to 10 for Guba region)
Sabalid (uo to15for Zaqatala)
Findik (up to 12 for Sheki)
Erik (up to 7 for Nakhchivan)
Qoyunculuq ( 3-10 for Aran)
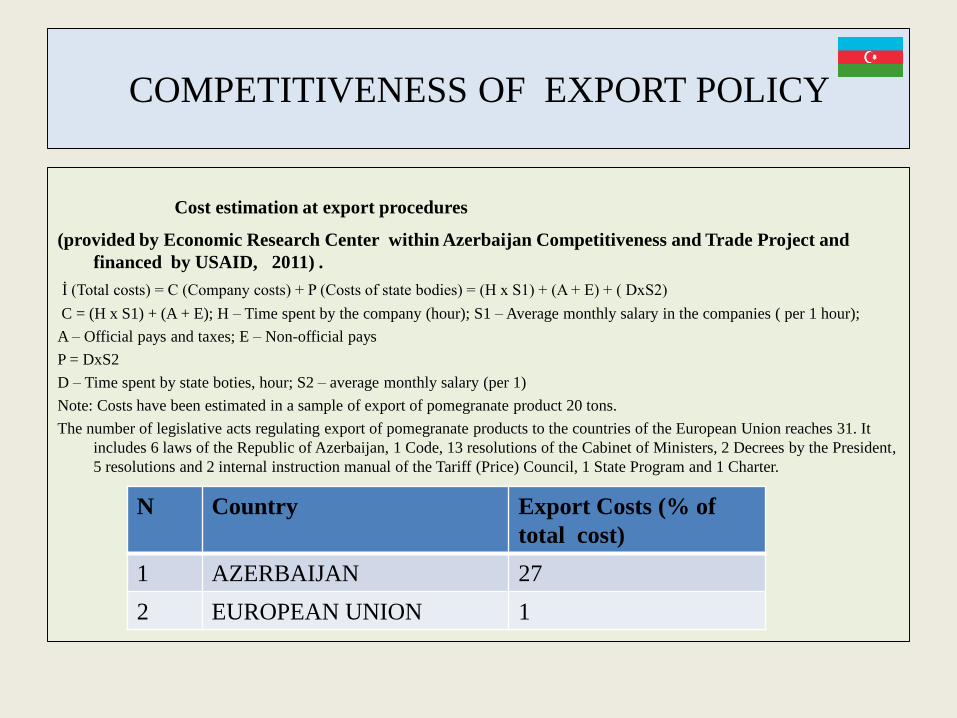
COMPETITIVENESS OF EXPORT POLICY
Cost estimation at export procedures
(provided by Economic Research Center within Azerbaijan Competitiveness and Trade Project and
financed by USAID, 2011) .
İ (Total costs) = C (Company costs) + P (Costs of state bodies) = (H x S1) + (A + E) + ( DxS2)
C = (H x S1) + (A + E); H – Time spent by the company (hour); S1 – Average monthly salary in the companies ( per 1 hour);
A – Official pays and taxes; E – Non-official pays
P = DxS2
D – Time spent by state boties, hour; S2 – average monthly salary (per 1)
Note: Costs have been estimated in a sample of export of pomegranate product 20 tons.
The number of legislative acts regulating export of pomegranate products to the countries of the European Union reaches 31. It
includes 6 laws of the Republic of Azerbaijan, 1 Code, 13 resolutions of the Cabinet of Ministers, 2 Decrees by the President,
5 resolutions and 2 internal instruction manual of the Tariff (Price) Council, 1 State Program and 1 Charter.
N Country Export Costs (% of
total cost)
1 AZERBAIJAN 27
2 EUROPEAN UNION 1
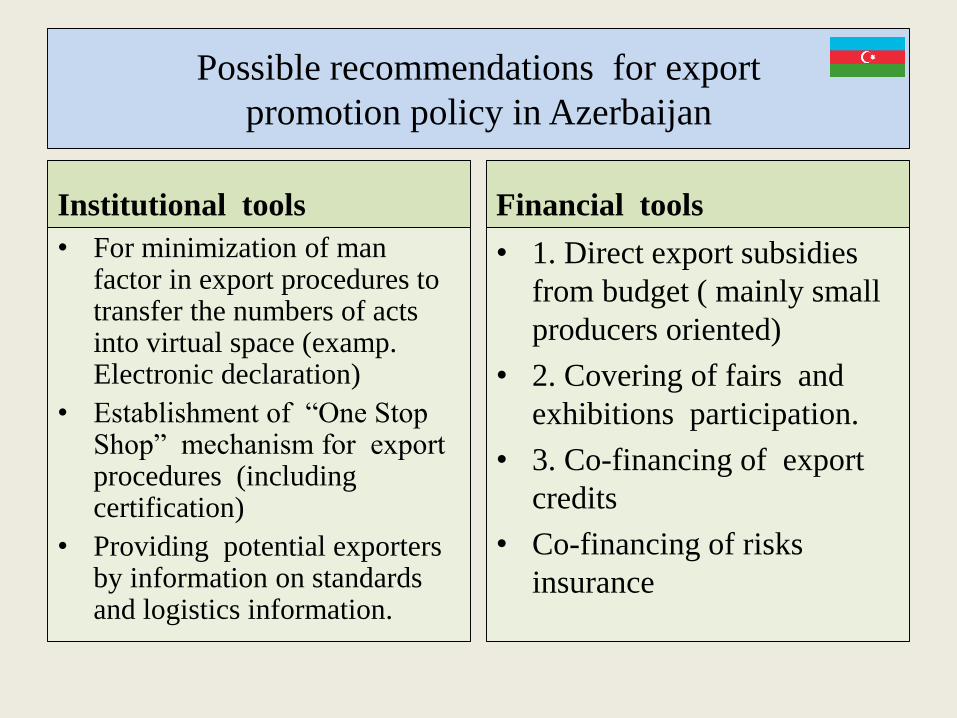
Possible recommendations for export
promotion policy in Azerbaijan
Institutional tools
• For minimization of man factor in export procedures to transfer the numbers of acts into virtual space (examp. Electronic declaration)
• Establishment of “One Stop Shop” mechanism for export procedures (including certification)
• Providing potential exporters by information on standards and logistics information.
Financial tools
• 1. Direct export subsidies
from budget ( mainly small
producers oriented)
• 2. Covering of fairs and
exhibitions participation.
• 3. Co-financing of export
credits
• Co-financing of risks
insurance
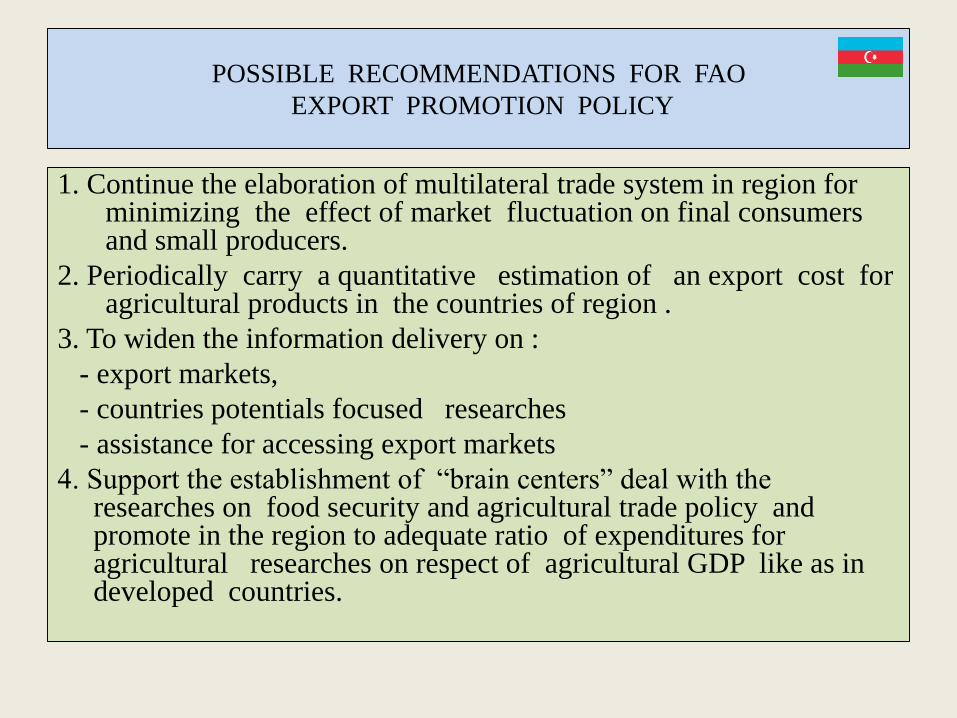
POSSIBLE RECOMMENDATIONS FOR FAO
EXPORT PROMOTION POLICY
1. Continue the elaboration of multilateral trade system in region for minimizing the effect of market fluctuation on final consumers and small producers.
2. Periodically carry a quantitative estimation of an export cost for agricultural products in the countries of region .
3. To widen the information delivery on :
- export markets,
- countries potentials focused researches
- assistance for accessing export markets
4. Support the establishment of “brain centers” deal with the researches on food security and agricultural trade policy and promote in the region to adequate ratio of expenditures for agricultural researches on respect of agricultural GDP like as in developed countries.
Used sources
• 1. State Customs Committee
• 2. State Statistics Committee
• 3. “TradeMap” International trade portal
• 4. The State of agricultural commodity markets
(SOCO) 2015-2016.
• 5. Global Agribusiness Annual 2016
(INFORMA Agribusiness Intelligence).
End of presentation
Thank You very much !!!
Dr. Elchin R. Atababayev
AZ 1016 , U.Hajibeyli, 80 , the Government House , room 801. Baku,
E’mail : [email protected]
Tel. + 994 55 7148410