‘Specialist and non- specialist’ teaching in England ...1.4.3 ‘Non-specialist’ teaching in...
71
‘Specialist and non- specialist’ teaching in England: Extent and impact on pupil outcomes December 2016
Transcript of ‘Specialist and non- specialist’ teaching in England ...1.4.3 ‘Non-specialist’ teaching in...
‘Specialist and non-specialist’ teaching in England: Extent and impact on pupil outcomes
December 2016

2
Contents Table of tables and figures 4
Executive Summary 7
There is a high extent of ‘specialist’ teaching in England 8
The impact of ‘specialist’ teaching shows mixed or limited findings 9
Introduction 11
1. Extent of specialist and non-specialist teaching in England 12
1.1 Background 12
1.2 International perspective 13
1.2.1 The Trends and International Mathematics and Science Study 13
1.2.2 The OECD Teaching and Learning International Survey 15
1.2.3 Eurydice: Readiness to teach 18
1.3 Administrative data available in England 19
1.4 Evidence from England 20
1.4.1 Methodology 20
1.4.2 Comparisons between English administrative data and the data from international studies 21
1.4.3 ‘Non-specialist’ teaching in England over time by subject 22
1.4.4 Differences across key stages 25
1.4.5 Qualification types 28
1.4.6 Subjects of qualifications held by ‘non-specialists’ 30
2. Impact of specialist and non-specialist teaching 32
2.1 Literature Review 32
2.1.1 Impact of teachers’ academic qualifications on pupil outcomes 32
2.1.2 Impact of teacher subject knowledge on pupil outcomes 36
2.2 Data analysis 38
2.2.1 Data analysis methodology 39
2.2.2 Curriculum structure and specialism levels in schools 40
2.2.3 Specialism level and attainment 43
2.2.4 Specialism level and value added: comparisons at a point in time 46
2.2.5 Specialism level and value added: comparisons over time 47
2.2.6 Regression analysis 49

3
References 53
Government sources 53
External references 53
Annex A: Percentage of hours taught by teachers with a relevant post A-level qualification as published in the School Workforce SFR 57
Annex B: Percentage of hours taught by teachers with a relevant post A-level qualification by key stage 58
Annex C: Underlying data for Figure 1 61
Annex D: Subject classifications 63
Annex E: Qualifications of ‘non-specialists’ 65
Annex F: Regression analysis methodology 66
Glossary 70

4
Table of tables and figures Figure 1: Proportion of year 5 and year 9 pupils in England and internationally by qualifications of their Mathematics/Science teacher ........................................................ 14
Table 1: Education and training completed in selected subjects taught ........................... 15
Figure 2: Teacher training mismatch and teacher resource allocation ............................. 17
Figure 3: The feeling of readiness for work among teachers who have completed Initial Teacher Training based on the content of their classes in lower secondary education (key stage 3) ............................................................................................................................ 18
Table 2: Proportion of hours taught in a typical week to pupils in years 7 to 13 by a teacher with a relevant post A-level qualification using a matched database of teacher qualifications and the TSM subject mapping .................................................................... 23
Table 3: Structure of curriculum taught expressed as the proportion of hours taught in a typical week to pupils in years 7 to 13 by TSM subject and key stage ............................. 26
Figure 4: Proportion of hours taught in a typical week in November 2015 to pupils in key stages 3, 4 and 5 by a teacher with a relevant post A-level qualification using a matched database of teacher qualifications and the TSM subject mapping ................................... 27
Table 4: Proportion of hours taught in a typical week in November 2015 to pupils in years 7 to 13 by the highest relevant post A-level qualification of teacher using a matched database of teacher qualifications and the TSM subject mapping ................................... 29
Table 5: Subjects of post A-level qualifications held by ‘non-specialists’ who taught Biology, Chemistry or Physics to pupils in years 7 to 13 in a typical week in November 2015 ................................................................................................................................. 31
Table 6: Subjects of post A-level qualifications held by ‘non-specialists’ who taught French, German or Spanish to pupils in years 7 to 13 in a typical week in November 2015 ......................................................................................................................................... 31
Figure 5: School average point score in pupil’s best science GCSE by proportion of ‘specialist’ Physics teachers ............................................................................................ 34
Figure 6: Proportion of hours in Mathematics, English and Science taught to pupils in years 7-11 by a teacher with a relevant post A-level qualification by the proportion of the school’s curriculum in years 7-11 devoted to teaching the subject, November 2015 ....... 41
Figure 7: Proportion of hours in Humanities and Modern Foreign Languages taught to pupils in years 7-11 by a teacher with a relevant post A-level qualification by the proportion of the school’s curriculum in years 7-11 devoted to teaching the subject, November 2015 ............................................................................................................... 42
Figure 8: Proportion of pupils achieving the EBacc Mathematics subject area in 2010/11-2014/15 by the proportion of hours in Mathematics taught in schools to pupils in years 7-11 by a teacher with a relevant post A-level qualification ................................................ 43
5
Figure 9: Proportion of pupils achieving the EBacc English subject area in 2010/11-2014/15 by the proportion of hours in English taught in schools to pupils in years 7-11 by a teacher with a relevant post A-level qualification .......................................................... 44
Table 7: Average Mathematics and Science achievement of year 5 and year 9 pupils in England and internationally by the qualifications of their teachers ................................... 45
Figure 10: Proportion of hours taught to pupils in years 7-11 by a teacher with a relevant post A-level qualification by subject against value added in the respective EBacc subject area ................................................................................................................................. 46
Figure 11: Year-on-year change (in percentage points) in the proportion of hours taught to pupils in years 7-11 by a teacher with a relevant post A-level qualification by subject and by a year-on-year change in value added in the respective EBacc subject area ...... 48
Table 8: Proportion of hours taught in a typical week to pupils in years 7 to 11 by a teacher with a relevant post A-level qualification for schools with and without post-16 provision .......................................................................................................................... 49
Table 9: Proportion of schools with the respective subject specific value added measure above 1000 for schools with and without post-16 provision ............................................. 50
Figure 12: Coefficients and 95% confidence intervals from the school-level regression analysis explaining the EBacc value added in the five subject areas by the percentage of teaching to pupils in years 7-11 by a teacher with a relevant post A-level qualification and a range of control variables .............................................................................................. 51
Table 10: Proportion of hours taught in a typical week to pupils in years 7 to 13 by a teacher with a relevant post A-level qualification ............................................................. 57
Table 11: Proportion of hours taught in a typical week to pupils in years 7 to 9 by a teacher with a relevant post A-level qualification using a matched database of teacher qualifications and the TSM subject mapping .................................................................... 58
Table 12: Proportion of hours taught in a typical week to pupils in years 10 to 11 by a teacher with a relevant post A-level qualification using a matched database of teacher qualifications and the TSM subject mapping .................................................................... 59
Table 13: Proportion of hours taught in a typical week to pupils in years 12 to 13 by a teacher with a relevant post A-level qualification using a matched database of teacher qualifications and the TSM subject mapping .................................................................... 60
Table 14: Proportion of year 5 and year 9 pupils in England and internationally taught Mathematics by the qualifications of their teachers ......................................................... 61
Table 15: Proportion of year 5 and year 9 pupils in England and internationally taught Science by the qualifications of their teachers ................................................................. 62
Table 16: TSM subject mapping ...................................................................................... 63
Table 17: Proportion of hours taught in a typical week in November 2015 to pupils in years 7 to 13 by teachers without a relevant post A-level qualification by the subject(s) of the post A-level qualifications they hold ........................................................................... 65

6
Table 18: Distribution of schools by the proportion of ‘specialist’ teaching in five subjects ......................................................................................................................................... 69

7
Executive Summary This report summarises existing evidence and provides new analysis on the extent and impact of ‘specialist’ and ‘non-specialist’ teaching in England. It has been produced to inform public debate and to feed into further policy making related to subject specialism.
Most secondary teaching in England is conducted by teachers with a relevant post A-level qualification. Both previous research and new analysis only provide limited evidence of an impact of teachers’ qualifications in the subjects they teach on pupil outcomes.
This, however, does not mean that subject knowledge is not important. Academic qualifications are not the only method of acquiring subject knowledge, which can be obtained through training and continuous professional development (CPD). While the Department for Education holds comprehensive data on teachers’ post-A level qualifications, it holds limited information on teachers’ CPD and no data on teachers’ overall subject knowledge.
Since we cannot directly measure subject knowledge, we use a degree or other post A-level qualifications in a subject as our proxy measure. It is possible that teachers who have been defined as ‘non-specialists’ may have equal or greater subject knowledge acquired through other means than a degree, or through a degree with some overlapping subject content. Therefore, we are not able to strictly compare ‘specialists’ with ‘non-specialists’.
A further limitation is that it is not technically possible to directly link data on teachers to pupil outcomes. This makes an accurate assessment of the relationship between teacher characteristics and pupil outcomes difficult. We can only conduct analysis at school level but since few secondary schools in England experience very high levels of ‘non-specialist’ teaching, we have little information about the typical pupil outcomes in such schools. Data limitation: not possible to link teacher data directly to pupil data
Administrative data held by DfE on the teacher workforce do not include information on which pupils they teach. This makes it impossible to directly assess the effectiveness of individual teachers by the outcomes of the pupils they teach. As a consequence of this data limitation, it is not possible to directly evaluate the impact ‘specialist’ teachers have on pupil outcomes by comparing them to ‘non-specialist’ teachers. This report employs a variety of analytical strategies to estimate the impact indirectly using school level data. New analysis of the impact of ‘non-specialist’ teaching presented in this report is therefore based on the proportion of ‘specialist’ teaching calculated at school level.

8
There is a high extent of ‘specialist’ teaching in England
The available data show that for a suite of subjects the extent of ‘specialist’ teaching in secondary schools in England is comparable or higher than the international averages.
The vast majority of hours taught in England to pupils in years 7-13 in most subjects are taught by teachers with a relevant post A-level qualification. In November 2015, the respective proportions were 88.9% for all subjects, 90.2% for EBacc subjects, 89.2% for Mathematics, 91.5% for English, 91.5% for History, 89.0% for Geography, 79.0% for Modern Foreign Languages, 80.2% for Physics, 88.8% for Chemistry and 95.1% for Biology.
Subject specialism definition
Teachers’ knowledge of subject content taught in schools is very difficult to measure directly which is why most research work, including this report, uses teachers’ academic qualifications as a proxy.
There are however limitations to this approach. First, in the available international studies, there is no clear link between teachers’ knowledge of subject content taught and previous academic study in the subject. As an extreme example, teachers of Modern Foreign Languages teaching their native language can be classified as ‘non-specialists’ if only earned academic qualifications are considered for assessing ‘specialism’.
Furthermore, there is no agreement on which qualifications make a teacher a subject ‘specialist’. Arguably the narrowest definition is that teachers must have a degree in the subject they teach. Wider definitions cover teachers who have undertaken initial teacher training (ITT) or continuous professional development (CPD) in the relevant subject. However, data on CPD is not captured in the main administrative datasets on teachers.
This report uses a proxy measure of ‘specialism’ defined as those having a relevant post A-level qualification. CPD, and qualifications at A-level and below, are not covered. This definition will inevitably fail to identify some teachers correctly as ‘specialists’ and this may happen more often in some subjects than in others. It should be seen as a purely operational definition used for the purposes of this paper given its simplicity and data availability.
The information about teachers’ post A-level qualifications is derived from administrative data using a methodology similar to the one used in the School Workforce SFR. There are two differences to the methodology. First, by the use of data matching, we have improved the consistency and coverage of the teacher qualification data already collected. Second, subject classifications consistent with the Teacher Supply Model have been used to ensure easy transferability of the results between this report and the model. More detail about the methodology can be found in Section 1.4.1 of the report.

9
‘Non-specialist’ teaching is often conducted by ‘specialists’ in a different but a related subject. For example, under the definition used in this report a geology degree would not be classed as ‘relevant’ for teaching Physics. Someone teaching Physics with a degree in geology might, however, cover a large amount of geophysics in their degree.
As pupils progress through their education they generally experience a higher proportion of ‘specialist’ teaching than in previous years. This may be due to schools holding a view that different levels of ‘specialism’ are required at different key stages; specifically that ‘specialists’ are best deployed in GCSE and A level classes.1
When looking at how ‘specialist’ teaching relates to the curriculum structure of schools, the analysis finds that schools with a higher proportion of key stage 3 and key stage 4 teaching hours devoted to English and Mathematics tended to have slightly higher levels of ‘non-specialist’ teaching in these subjects. There is no visible relationship for Science. Schools teaching Humanities and Modern Foreign Languages relatively more tended to exhibit a lower degree of ‘non-specialist’ teaching.
The impact of ‘specialist’ teaching shows mixed or limited findings
The limited existing English evidence to date has suggested that being taught by a teacher with a degree in the subject they teach has a small positive impact, if any, on pupil outcomes at GCSE. The wider international evidence also suggests that being taught by teachers with a degree in the subjects they teach has little, if any, positive effect on pupil outcomes over the ages 11-18.
Some international evidence suggests that teachers’ knowledge of subject content taught in school has an influence on their effectiveness in improving pupil outcomes. However, in the available studies, there is no clear link between teachers’ knowledge of subject content taught in school and previous academic study directly in the subject. There is also a lack of English evidence on this.
The new analysis undertaken in this report seeks to estimate the impact of ‘specialist’ teaching on pupil outcomes indirectly using data at school level. The results show mixed or limited findings and do not imply a causal link between the two factors.
There is a positive association between the level of ‘specialist’ teaching in English and Mathematics and attainment in these subjects at the end of key stage 4. On the other hand, the available international data provide little to no evidence of a positive effect of ‘specialist’ teaching in year 9. Neither of these comparisons, however, control for confounding factors and they do not imply causation.
1 https://www.gov.uk/national-curriculum/overview

10
When looking at how KS2-KS4 value added relates to subject ‘specialist’ teaching the analysis finds that the level of ‘specialist’ teaching in school is positively associated with the school’s value added in English, Mathematics and Humanities. No relationship has been found for Science and Modern Foreign Languages but this may be because identification of ‘specialists’ in the data is more difficult for these two subjects.
Similar findings hold when controlling for other school-level variables. We find no discernible effect of ‘non-specialist’ teaching on pupil outcomes at GCSE for Modern Foreign Languages and Science. For Mathematics, English and Humanities there is some evidence of a positive impact but this is relatively small in size. The findings are not fully robust to the changes in the analytical methodologies employed, i.e. different methodologies lead to different conclusions. For example, an analysis of longitudinal changes in schools’ value added scores and ‘specialist’ teaching only identifies a positive relationship for English.
In line with most previous research, there remains limited evidence of an impact of teachers’ academic qualifications in the subjects they teach on pupil outcomes. As explained above, this does not mean that subject knowledge is not important. Teachers’ academic qualifications are an imperfect proxy measure for their subject ‘specialism’. The few ‘non-specialist’ teachers employed in state-funded secondary schools in England often hold a qualification in a different but a related subject and many have undertaken CPD. Making an accurate assessment of the impact of subject ‘specialism’ is further made difficult by the fact that it is not technically possible to directly link teachers to the pupils they teach.
We would welcome feedback on the methods used and insights generated in this report, to inform future research and development of future publications. Please send your views to: [email protected]

11
Introduction In recommendation 4 of their report from June 2016, the Public Accounts Committee wrote that the Department for Education should report back “on the extent and impact of teachers taking lessons they are not qualified in.” This report addresses this recommendation by focussing directly on the extent and impact of ‘non-specialist’ teaching in state-funded schools in England. To provide insights and inform the public debate, the report uses administrative data available to the Department for Education in combination with wider evidence, including academic research and data from international studies.
The report is split into two chapters, each of which has a separate focus; the first chapter focuses on the extent of ‘specialist’ and ‘non-specialist’ teaching in state-funded secondary schools in England and the second chapter focuses on the impact of ‘non-specialist’ teaching on pupil outcomes. When looking at the extent of ‘specialist’ and ‘non-specialist’ teaching this report draws on data held by the Department for Education and three main international studies. When looking at the impact of ‘specialist’ and ‘non-specialist’ teaching this report draws on a range of international and English evidence and new analysis of data held within the Department for Education. The analysis is new and is covered in a high level of technical detail. In order to be transparent with the findings additional information is supplied in the annexes and the accompanying spreadsheets.
There are important data limitations to the analysis presented in this report. Evaluating the extent of ‘non-specialist’ teaching is hindered by the lack of agreement on the definition of what it takes to be a subject ‘specialist’. Although DfE collects relatively detailed information on teachers’ academic qualifications, it is unknown what continuous professional development teachers have undertaken and there is also a lack of data on other relevant teachers’ skills such as native proficiency in a foreign language. Evaluating the impact of ‘non-specialist’ teaching is further hindered by the challenges of isolating the effects of teacher quality and other factors, the longitudinal character of teaching and learning as well as the challenges of linking teacher data directly to pupil outcomes.

12
1. Extent of specialist and non-specialist teaching in England
This chapter focuses on the challenges in defining and capturing subject specialism and it also estimates the extent to which ‘non-specialist’ teaching occurs in state-funded secondary schools in England.
1.1 Background Summary: There is no generally agreed definition of what makes a teacher a subject ‘specialist’. Possible definitions range from strict views requiring a completion of a university degree with a primary focus on the subject to more open definitions under which completing a CPD retraining course would be included. The focus on capturing subject knowledge constitutes a common denominator across these definitions.
The interest in subject ‘specialism’ stems from the premise that effective teachers need to be experts in the subject they teach, or that one cannot become an effective teacher without a detailed understanding of the subject content. The more complex the subject content, the higher is the level of subject knowledge required from a teacher. As a practical consequence, different levels of ‘specialism’ may be required at different key stages.
Nevertheless, it remains unclear whether the knowledge of the subject content taught at school can be satisfactorily mapped to formal qualifications. Indeed, the Royal Society’s 2007 report recognised that there is no standard definition of subject ‘specialist’ teachers.
Arguably the narrowest definition of the term ‘specialist’ teacher requires a degree in the subject they teach. The Science Community Representing Education (SCORE) produced a report stating that a Science degree and teaching qualification in the subject is required. This definition is very restrictive and would exclude, among others, teachers holding a Postgraduate Certificate in Education (PGCE), but not a first degree, in a given subject. This means that teachers undertaking initial teacher training in a subject would not be seen as ‘specialists’ in it. It would also exclude teachers who gain their subject knowledge via a CPD route.
The 2015 position statement of the Institute of Mathematics and its Applications (IMA) argued for a broader definition in Mathematics, with Physics and Engineering graduates counting as Mathematics ‘specialists’. Since many university courses are multidisciplinary by nature, their graduates can subsequently be considered as ‘specialist’ in more than one subject. It is furthermore recognised that long Subject Knowledge Enhancement (SKE) courses are suitable as preparation to be a subject ‘specialist’ (see SCORE 2011, IMA 2015).

13
1.2 International perspective This section summarises the evidence on the extent of non-specialist teaching available in the major international comparative educational studies that England participates in. It also notes how these studies define subject ‘specialism’.
1.2.1 The Trends and International Mathematics and Science Study
Summary: In terms of subject ‘specialism’, TIMSS focuses on whether teachers hold a major or a specialisation (i.e. a post-secondary qualification) in the subject. Using this definition, the proportion of year 5 pupils in England taught Science and Mathematics by ‘specialists’ is lower than the international averages. In year 9 the proportion of pupils taught Mathematics by ‘specialists’ is on a par with the international average, and the extent of ‘specialist’ teaching of Science exceeds the international average.
In 2015, the Trends and International Mathematics and Science Study (TIMSS; Martin et al., Mullis, Foy & Hooper, 2016; Mullis, Martin, Foy & Hooper, 2016) collected data about Mathematics and Science teachers of pupils in year 5 and year 9. Teachers were asked to indicate:
- whether they held a post-secondary qualification in education2 o Primary education in the case of year 5 teachers and o Mathematics/Science education in the case of year 9 teachers
- whether they held a post-secondary qualification in Mathematics/Science3 - teachers with neither of the above two were further asked whether they held:
o a different post-secondary qualification or o no post-secondary qualification at all.
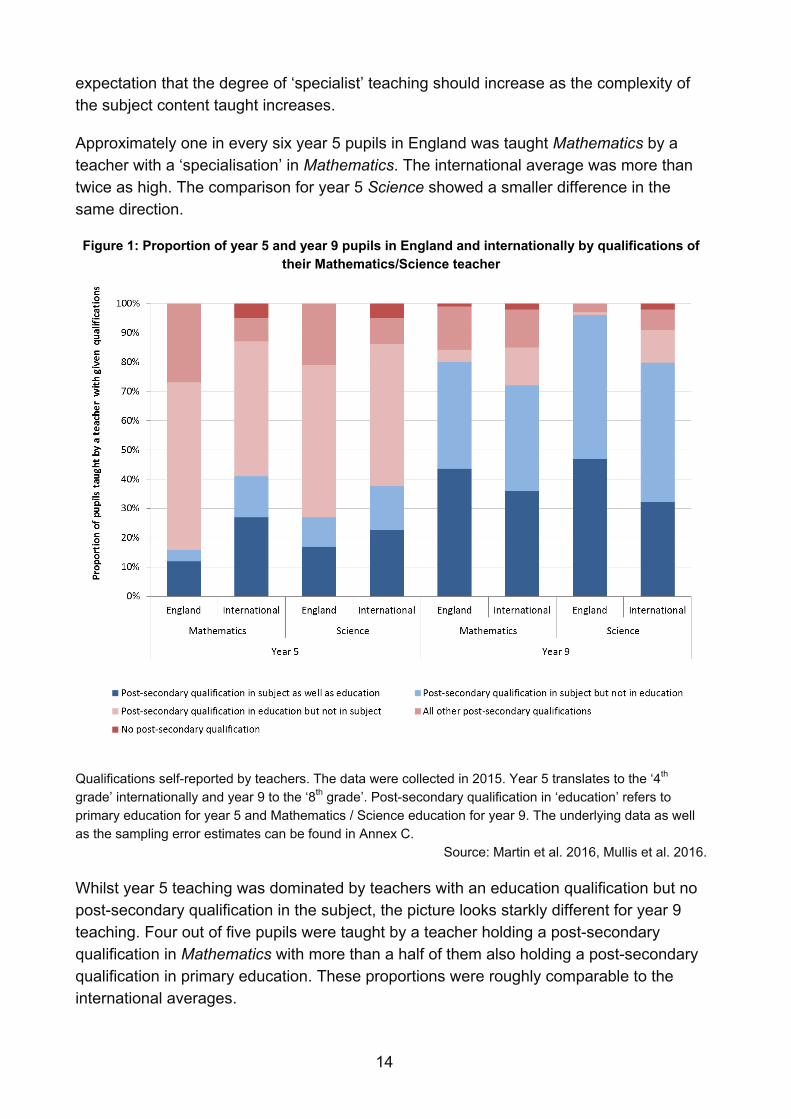
Figure 1 shows the proportion of pupils taught by teachers of each of the above categories, separately for year 5/year 9 and Mathematics/Science. It compares the average international figures4 to the figures for England. The blue parts of each of the bars relate to ‘specialist’ teachers and the red parts relate to ‘non-specialist’ teachers. It is immediately clear that both in England and internationally, the degree of ‘non-specialist’ teaching is much higher in year 5 than in year 9. This is in line with an
2 Term ‘major in education’ used in TIMSS is substituted by term ‘post-secondary qualification in education’ here as this relates better to the English educational system. 3 Term ‘major or specialisation in subject’ used in TIMSS is substituted by term ‘post-secondary qualification in subject’ here as this relates better to the English educational system. 4 The international averages are based on the data from all countries included in the study. Please note that the selection of countries included varies from study to study and the international figures reported in this section may therefore not be directly comparable to the international averages reported in Section 1.2.2.
14
expectation that the degree of ‘specialist’ teaching should increase as the complexity of the subject content taught increases.
Approximately one in every six year 5 pupils in England was taught Mathematics by a teacher with a ‘specialisation’ in Mathematics. The international average was more than twice as high. The comparison for year 5 Science showed a smaller difference in the same direction.
Figure 1: Proportion of year 5 and year 9 pupils in England and internationally by qualifications of their Mathematics/Science teacher
Qualifications self-reported by teachers. The data were collected in 2015. Year 5 translates to the ‘4th grade’ internationally and year 9 to the ‘8th grade’. Post-secondary qualification in ‘education’ refers to primary education for year 5 and Mathematics / Science education for year 9. The underlying data as well as the sampling error estimates can be found in Annex C.
Source: Martin et al. 2016, Mullis et al. 2016.
Whilst year 5 teaching was dominated by teachers with an education qualification but no post-secondary qualification in the subject, the picture looks starkly different for year 9 teaching. Four out of five pupils were taught by a teacher holding a post-secondary qualification in Mathematics with more than a half of them also holding a post-secondary qualification in primary education. These proportions were roughly comparable to the international averages.

15
Year 9 Science teaching in England was dominated by teachers with a Science ‘specialism’. Around a half of teachers held both an education qualification and a Science ‘specialisation’ and the other half held a ‘specialisation’ in Science only. These figures compared favourably to the international averages.
1.2.2 The OECD Teaching and Learning International Survey
Summary: In TALIS, ‘specialism’ is captured by holding a post-secondary qualification in the subject or completing a CPD course in it. Combining the two, the level of ‘specialist’ key stage 3 teaching in England in each of Mathematics, Science and English is comparable or higher than is typically the case in the other countries. ‘Non-specialist’ teaching of Modern Foreign Languages is almost non-existent in England and much lower than the international average. CPD is more common in England than internationally and this holds across all the four subjects.
The OECD’s 2013 TALIS report includes an international comparison of whether teachers are teaching subjects for which they have been well prepared to teach (OECD 2014, 43-45). The definition used covers post-secondary qualifications, formal training at the in-service or professional development stage and subject specialisation as a part of the teacher training.
Table 1: Education and training completed in selected subjects taught
Subject currently taught
Post-secondary qualification
or a part of ITT
In-service or professional
development stage
No formal education or training
Eng Avg Diff Eng Avg Diff Eng Avg Diff Reading, writing and literature 89.2% 90.6% = 39.2% 29.6% Pos 5.8% 5.7% =
Mathematics 90.5% 89.8% = 33.2% 27.4% Pos 5.9% 6.6% =
Science 94.1% 89.0% Pos 36.6% 25.6% Pos 5.6% 7.6% =
Modern Foreign Languages 98.1% 85.5% Pos 37.8% 24.5% Pos 1.9% 10.5% Neg
Self-reported by teachers. Percentage of lower secondary (key stage 3) teachers who received the following types of formal education or training in the subject fields they currently teach. ‘Eng’ stands for England, ‘Avg’ for the average across all included countries and ‘Diff’ for the difference between the two. This has the value of ‘=’ where the 95% confidence interval around the value for England and 95% confidence interval around the value for the average intersect. ‘Pos’ means a positive difference (the value for England is higher than the average) and ‘Neg’ means a negative difference (the value for England is lower than the average) with the 95% confidence intervals not overlapping. The standard errors used for the calculation of the confidence interval are taken from the source data.
Source: OECD 2014, p. 44.
Table 1 shows that the proportions of lower secondary (key stage 3) teachers in England teaching Reading, writing and literature as well as Mathematics who held a post-secondary qualification in the subject or a ‘specialisation’ acquired within teacher training

16
was at around 90%, comparable to the average proportion across all included countries. These proportions were higher in England when compared to the international average for Science and Modern Foreign Languages. According to the data, in England around 94% of lower secondary teachers of Science and around 98% of lower secondary teachers of Modern Foreign Languages held this type of ‘specialisation’.5
Table 1 further shows that regardless of the subject, the proportion of lower secondary teachers who received a ‘specialist’ formal training in-service or in their professional development stage was higher in England than was the average across all the included countries. Overall, the proportion of teachers with no post-secondary or CPD qualifications was comparable in England to the average in all subjects apart from Modern Foreign Languages with the proportion being much lower in England.
Figure 2 combines the data from Table 1 into a single composite measure for every country and each subject with the exception of Modern Foreign Languages which is a subject more country-specific than the other three and hence hardest to use in comparisons. As shown in the left-hand part of Figure 2, the proportion of lower secondary (key stage 3) teachers without formal education or training was less than 5% for each of Science, Mathematics and Reading, writing and literature in the vast majority of countries with the available data. The percentage of ‘non-specialists’ in these subjects in England was comparable or lower than was the average across all the countries included in the sample. This suggests that the overall level of ‘non-specialist’ teaching was not unusually high in England, at least in the subjects analysed.
5 The top countries in these subjects are: Singapore with 97% in Reading, writing and literatures and Science, Portugal with 98% in Mathematics, and England with 98% in Modern Foreign Languages.

17
Figure 2: Teacher training mismatch and teacher resource allocation
Self-reported by teachers. Source: OECD 2014, p. 44.

18
1.2.3 Eurydice: Readiness to teach
Summary: An alternative way of defining ‘specialism’ could measure whether teachers feel prepared to teach the content of their subject. The proportion of key stage 3 teachers in England who feel prepared to teach the content is similar to the EU average.
An alternative approach to measuring teacher ‘specialism’ levels uses subjective judgement. The European Commission’s summary of the Teaching Profession in Europe (EC 2015) further analysed TALIS 2013 data, among other aspects, in terms of teachers’ perception of their readiness to teach. Figure 3 shows the findings for the lower secondary (key stage 3) teachers who have completed initial teacher training, in terms of whether they felt ready for teaching the subject content of their classes. Teachers in England were more likely than the EU average (68% and 62% respectively) to report feeling ‘very well’ prepared (with 93% in England and 96% across EU ‘very well’ prepared or ‘well’ prepared). Although these findings are interesting, they should be seen as complementary to the evidence provided by survey and administrative data. The subjective nature of the data makes it difficult, if not impossible, to make objective comparisons. It is, for example, unclear why teachers in Finland display by far the lowest level of the feeling of readiness to teach. Nevertheless, self-perception levels may vary significantly by country due to a range of underlying factors and the figures should be treated with caution.
Figure 3: The feeling of readiness for work among teachers who have completed Initial Teacher Training based on the content of their classes in lower secondary education (key stage 3)
Self-reported by teachers. Country codes: EU: European Union, BE nl: Belgium – Flemish Community, BG: Bulgaria, CZ: Czech Republic, DK: Denmark, EE: Estonia, , ES: Spain, FR: France, HR: Croatia, IT: Italy, CY: Cyprus, LV: Latvia, NL: The Netherlands, PL: Poland, PT: Portugal, RO: Romania, SK: Slovakia, FI: Finland, SE: Sweden, UK-ENG: England, IS: Iceland, NO: Norway, RS: Serbia.
Source: Eurydice, on the basis of TALIS 2013.

19
1.3 Administrative data available in England Summary: The administrative data available to DfE that could be used to examine teachers’ specialism only include teachers’ post A-level qualifications; CPD is not covered. This is the operational definition that will be used in the rest of the report. Although imperfect, it remains very close to the definitions used by the major international studies.6
In the School Workforce SFR, the Department for Education publishes national level information related to the level of ‘non-specialist’ teaching in publicly funded secondary schools in England. The information collected on teachers’ qualifications is combined with the timetabling information provided by a large sample of secondary schools.7
Specifically, the SFR reports on whether teachers of a selection of subjects have a ‘relevant post A-level qualification’. This definition reflects the information in the School Workforce Census which contains for all teachers their relevant qualifications grouped at level 4 or above (i.e. those higher than A-level).
The School Workforce Census only records teachers’ qualifications, and so does not capture any subject-knowledge-focussed professional development they may have undertaken. It cannot take account of Teacher Subject Specialism Training (TSST), which is specifically designed to give ‘non-specialist’ teachers the knowledge they need to teach a new subject. It also cannot take into account Subject Knowledge Enhancement (SKE) courses that trainees complete before starting their Initial Teacher Training.8 Looking forward, the Department for Education will be exploring whether these evidence gaps can be filled by the use of administrative data matching, combining the information collected in the School Workforce Census with TSST and SKE management information data.
Similarly, for languages, the School Workforce Census does not record if someone is a native speaker yet it can hardly be argued that a native French speaker has anything but excellent subject knowledge in French. However, subject knowledge alone does not cover experience in teaching that subject.
Keeping in mind the limitations of this definition of subject ‘specialist’ teaching, the analysis included in this report focuses on the definition consistent with the School Workforce SFR, i.e. holding a ‘relevant post A-level qualification’. In reference to Section
6 Although, as described above, TALIS also considers CPD. 7 Representing 73.6% of all secondary school teachers in the 2016 School Workforce SFR. 8 Arguably, missing SKE data constitutes a smaller issue because SKE courses are taken specifically to go onto a teacher training course in that subject. Most teachers would then have the teacher training course recorded as a relevant post-A level qualification.
20
1.2.1 and Section 1.2.2, it is worth noting that this definition closely corresponds to the definitions used by the major international studies.9 It should be seen as a purely operational definition used for the purposes of this paper given its simplicity and data availability.
Please refer to Annex D for more details about subject classification and the particulars of defining subject ‘specialism’ for the individual subjects.
1.4 Evidence from England This section describes the methodology used for assessing the extent of ‘non-specialist’ teaching in England by the use of the available administrative data. It also applies this methodology to the collected data to provide the respective estimates.
1.4.1 Methodology
Summary: By the use of administrative data matching, DfE has improved the consistency and coverage of the teacher qualification data already collected. Moreover, subject classification consistent with the Teacher Supply Model10 has been used to ensure easy transferability of the results between this report and the Model.
The School Workforce SFR reports on the number of teachers in a subject with a relevant post A-level qualification as well as the percentage of hours taught in the subject by teachers with a relevant post A-level qualification; it is the latter that is most useful, since the first measure includes any teacher who takes any number of lessons in the subject. Focusing on the proportion of hours taught instead of the number of teachers assures that a teacher teaching a full timetable contributes to the aggregate figures more than a teacher who only spends a very small number of hours teaching. This measure will be the main focus of the analysis throughout this report.
Table 10 in Annex A shows by subject the proportion of hours taught in a typical week to pupils in years 7 to 13 by a teacher with a relevant post A-level qualification. These figures are taken from the six School Workforce SFRs published annually between 2011 and 2016, covering school years 2010/11 to 2015/16. The figures show a varying degree of ‘specialism’ by subject, if defined this way. Between 2010/11 and 2014/15, there were decreases in ‘specialist’ teaching in a range of subjects. This is followed by an increase for all subjects between 2014/15 and 2015/16 although part of this rise may be due to improvements in the number of teachers for whom we have qualifications data. The
9 Although, as described above, TALIS also considers CPD. 10 The Teacher Supply Model is used annually by the DfE to estimate the number of postgraduate ITT trainees needed for future teacher stocks. The model is published online here.

21
changes in non-response resulting from continuing improvements in the quality of the collected data make year-on-year comparisons difficult.
In order to be able to make consistent comparisons over time, we reconstruct the time series for the whole time period between 2010/11 and 2015/16 utilising the data pooled from all years together. Improvements in data matching also mean that we can now match teachers’ records across the years and by using the data provided about them in other School Workforce Census collections fill the gaps in their qualifications data. Also, when a teacher works in several schools and only one of them supplies qualification data, we can use that information to assess whether in the school that did not provide qualification data the teacher teaches the subject in which they hold a qualification.
Moreover, in order to provide a more direct comparison with the estimates of the Teacher Supply Model (TSM), we are using the subject mapping used by the model.11 This methodological change will make it easier to inform the discussion around teacher supply and feed the outputs of this analysis into the future teacher supply considerations.
1.4.2 Comparisons between English administrative data and the data from international studies
Summary: The ‘specialism’ estimates calculated from the School Workforce Census using the improved methodology compare well to the data reported in TALIS and TIMSS. However, in Modern Foreign Languages is there a large difference with the SWC reporting much lower ‘specialism’ levels than TALIS. This could point to a potential under recording of qualifications earned abroad by the SWC.
The improved methodology leads to figures comparable to the figures reported in international surveys (Table 1 and Figure 1). The SWC key stage 3 ‘specialism’ figures used to make these comparisons for each subject can be found in Table 11 in Annex B.
As mentioned in Section 1.2, TALIS reports that in England, 89.2% of key stage 3 teachers of Reading, writing and literature have a post-secondary qualification or a subject specialisation gained within teacher training. Looking at the figures for English, reported in the second row of Table 11, they are very close indeed, falling between 87.9% and 88.8% across the years.
11 The exceptions include Modern Foreign Languages which in the TSM include Other Modern Foreign Languages but that category is omitted here for the purposes of assessing specialism (e.g. having a qualification in Japanese does not make one a specialist to teach Italian). Similarly, Others are omitted as a marginal category. Combined/General Science and Humanities are recorded in the data but not used as separate categories in the TSM where they are redistributed into Physics, Biology and Chemistry and Geography and History respectively. Further detail is available in Annex D.
22
For Mathematics, the comparison is between 90.5% in the TALIS study and figures ranging between 85.5% and 86.9% in the School Workforce Census. The estimate of 81% reported from TIMSS is lower but it needs to be remembered that this figure comes from survey data with limited sample sizes. In fact the TIMSS figure is a combination of two proportions each of them having a 95% confidence interval spreading across approximately 16 percentage points. Taking the sampling variability into account, these figures do not provide evidence that there is a significant difference.
For Science, TALIS reports 94.1%, TIMSS reports the point estimate of 96% and the School Workforce Census reports between 96.2% and 96.6% across the years. This is in line with the expectation that the SWC figure might be an overestimate due to the limitations associated with the data for Science.12
These minor differences can be explained by sampling variation, the different timings of the collections, different data collection frameworks, the differences between the measures13 and the fact that the TALIS measure is purely self-reported but the School Workforce Census measure is not.
Modern Foreign Languages is the only subject with substantial differences (98.1% in TALIS compared to figures between 76.2% and 77.3% in the School Workforce Census). One possible explanation is that the School Workforce Census could be under-recording qualifications earned abroad which is likely to affect teachers of Modern Foreign Languages disproportionately more than other teachers.
1.4.3 ‘Non-specialist’ teaching in England over time by subject
Summary: There has been a high extent of specialist teaching; 8 out of 9 hours taught to pupils in years 7-13 have in recent years been conducted by a teacher with a relevant post A-level qualification. For EBacc subjects this holds for 9 out of 10 hours. Similar rates have been observed for Mathematics, English, Chemistry, History and Geography. ‘Specialism’ levels are lower in Physics (8 out of 10) but higher in Biology (19 out of 20).
Table 2 shows that the newly developed matched database of teacher qualifications has a more complete coverage compared to the annual snapshots of data. As a result, the proportion of hours taught by a teacher with a relevant post A-level qualification is higher for a majority of subjects compared to the previous estimates. For example, the 2015/16 figure for History now reads 91.5% compared to 89.0% in the School Workforce SFR.
12 More detail is provided in the next section and in Annex D. 13 The percentage of specialist teachers reported in TALIS compared to the proportion of pupils taught by specialists reported in TIMSS and the percentage of specialist teaching derived from the School Workforce Census.

23
Table 2: Proportion of hours taught in a typical week to pupils in years 7 to 13 by a teacher with a relevant post A-level qualification using a matched database of teacher qualifications and the TSM
subject mapping
Subject 2010/11 2011/12 2012/13 2013/14 2014/15 2015/16 Mathematics 88.2 88.9 89.6 89.9 89.7 89.2 English 90.9 91.6 91.6 91.7 91.4 91.5 Any Science 95.8 95.9 95.8 95.7 95.6 95.4
Physics 83.3 83.2 82.6 83.0 81.2 80.2 Chemistry 89.9 90.3 89.9 89.7 89.8 88.8 Biology 94.9 94.7 94.9 94.4 94.5 95.1 Comb/General Science 97.6 97.9 98.0 98.0 98.1 98.1
History 91.2 91.1 91.1 91.0 91.3 91.5 Geography 91.1 90.9 90.9 90.6 89.9 89.0 Humanities 69.0 66.0 67.6 67.9 66.3 66.7 Modern Foreign Languages 80.0 79.8 79.7 79.6 79.4 79.0
French 85.0 85.1 85.6 86.1 85.9 85.9 German 80.8 80.8 81.6 80.8 81.7 82.4 Spanish 65.5 65.5 64.4 64.2 65.0 64.3
Design & Technology 88.8 89.8 90.6 91.1 91.4 92.0 Food 39.4 40.1 40.1 38.9 39.2 37.4 Computing 60.6 62.2 64.5 66.7 68.6 70.4 Business Studies 77.2 79.1 81.1 81.1 81.3 82.0 Religious Education 75.4 75.9 76.7 77.1 77.0 76.5 Classics 71.8 71.5 73.9 73.6 72.9 72.5 Music 95.9 96.2 96.5 96.5 96.9 97.1 Drama 73.9 74.3 75.9 76.8 78.1 79.4 Art & Design 94.2 94.5 94.9 95.2 95.5 95.7 Physical Education 92.1 93.1 93.8 94.5 95.1 95.7
EBacc 90.0 90.3 90.5 90.6 90.4 90.2 Total 86.9 87.5 88.1 88.5 88.7 88.9
Any Science aggregates each of Physics, Chemistry, Biology and Combined/General Science. Since the teaching data for Combined/General Science cannot be further split, a teacher of this subject is classified as a ‘specialist’ regardless of which of the four Science subjects they hold a qualification in. The category of Modern Foreign Languages aggregates French, German and Spanish. Other Modern Foreign Languages constitutes a small proportion of the MFL teaching (see Table 3) and is excluded from the above table. More information about the subject classification is provided in Annex D.
Source: School Workforce Census, 2010-2015.

24
Using the ‘relevant post A-level qualification’ definition of teacher specialism, we can see that the proportion of ‘specialist’ teaching in Mathematics has remained fairly stable at just under 90%. There is a similar consistency for English, with approximately 91% of hours in English were being taught by ‘specialists’ each year.
Approximately 19 out of 20 hours of Science (labelled as Any Science in Table 2) have been taught by subject ‘specialists’. However, there is an important caveat to note here: as mentioned above, due to data limitations post A-level qualifications in either of Physics, Biology, Chemistry and Combined / General Science are classified as relevant for the teaching of Combined / General Science. This means that the ‘specialism’ levels reported in Table 2 related both to the Combined / General Science category and the Any Science category are likely to be overestimates.14
The figures for the three separate sciences may give more accurate estimates of the extent of ‘specialist’ teaching. Physics has seen a decrease in the extent of ‘specialist teaching’ with 4 out of 5 hours taught by a ‘specialist’ in November 2015. ‘Specialist’ teaching was more common in Chemistry (8 out of 9 hours taught by a ‘specialist’) and Biology (19 out of 20 hours taught by a ‘specialist’).
The level of ‘specialist’ teaching in History has been slightly rising over the last couple of years and it stood at 91.5% in November 2015. In contrast, there has been a slight decrease over the last six years in Geography with the latest figure being 89%. Humanities have seen a lower percentage of ‘specialist’ teaching, between 66% and 69% across the years but this is affected by data limitations. Humanities is a marginal category in terms of size (see Table 3 below) and can cover a variety of subjects. Since in the TSM subject classification the social sciences fall under the main marginal category ‘Other’, teachers with social-scientific degrees such as ‘Government studies’ or ‘Sociology’ are therefore classified as ‘non-specialist’ when teaching Humanities. Similarly to Any Science, post A-level qualifications in either History or Geography are seen as relevant for the teaching of Humanities.
Assessing specialism in Modern Foreign Languages is difficult given the data limitations outlined above. We do not hold data on the native languages of teachers. Also, we only have limited information on the subject of teachers’ qualifications from abroad, e.g. degrees earned in France could be less likely to appear in our data. Modern Foreign Languages are herein further split into French, German and Spanish, the three main languages taught in state-funded secondary schools in England, covering more than 90% of language teaching overall (see Table 3 below). Teaching in most of the other languages is coded in the School Workforce Census using a marginal category ‘Other
14 The Any Science category is dominated by Combined/General Science in terms of the number of hours taught: the amount of teaching it covers is approximately twice as high as the amount for Physics, Biology and Chemistry combined (see Table 3).

25
Modern Foreign Languages’ and those are excluded from specialism calculations and from the composite Modern Foreign Languages also. With all the above caveats in mind, the data show the highest proportion of teaching by a teacher with a relevant post A-level qualification in French (85.9% in November 2015), followed by German (82.4%) and Spanish (64.3%). It is unclear why the percentage for Spanish is considerably lower than is the case for the other two languages.
There has been an increase in ‘specialist’ teaching in Design and Technology from 88.8% in November 2010 to 92.0% in November 2015. Related to this Food is another subject hard to assess because many qualifications are simply classified as ‘Design and Technology’ or ‘Design Studies’, which is too high level to determine if there is a ‘specialism’ in Food. Table 3 shows that Food is a smaller subject in terms of the number of hours taught which means that problems with assessing the extent of ‘specialist’ teaching in the subject have a relatively low impact on the overall picture.
Computing is the subject with the largest increase in the proportion of hours taught by teachers with a relevant post A-level qualification, from 60.6% in November 2010 then rising consistently by approximately 2 percentage points each year to 70.4% in November 2015. Computing covers both ICT and Computer Science.15
Business Studies, Religious Education and Classics have all seen slight increases since 2010. An increase has been reported in Drama, from 73.9% in November 2010 to 79.4% in November 2015. In each of Music, Art and Design and Physical Education, more than 95% of teaching was done by teachers with a relevant post A-level qualification.
Combining all of the above together, the overall degree of ‘specialist’ teaching has steadily increased from 86.9% in November 2010 to 88.9% in November 2015. Restricting the selection of subjects to the English Baccalaureate (EBacc) only, the proportion has consistently been slightly above 90%.
1.4.4 Differences across key stages
Summary: As pupils progress through their education they generally experience a higher proportion of ‘specialist’ teaching. This is consistent with the notion that different levels of ‘specialism’ may be required at different key stages.
Although Table 2 is informative at the aggregate level, it combines teaching in key stages 3, 4 and 5 and therefore masks differences between them. Breaking down the data further by key stage can provide additional insights because the degree of ‘specialist’
15 This is an important distinction, as ICT is not an EBacc subject, whereas Computer Science is an EBacc subject.

26
teaching may differ across key stages but also because the amount of teaching in each subject varies greatly by key stage.
Table 3: Structure of curriculum taught expressed as the proportion of hours taught in a typical week to pupils in years 7 to 13 by TSM subject and key stage
Subject KS3 KS4 KS5 Total Mathematics 14.6 15.4 10.5 14.2 English 15.0 16.0 8.4 14.2
Any Science 12.6 18.3 15.8 15.3 Physics 0.3 1.4 3.8 1.3 Chemistry 0.3 1.4 4.6 1.4 Biology 0.3 1.5 5.5 1.6 Combined/General Science 11.8 14.2 1.8 10.9 History 5.5 4.5 4.8 5.0 Geography 5.3 4.2 3.7 4.6 Humanities 0.9 0.2 0.1 0.5
Any MFL 8.9 5.8 4.2 6.9 French 4.7 2.8 1.7 3.5 German 1.2 1.0 0.8 1.0 Spanish 2.2 1.8 1.3 1.9 Other MFL 0.8 0.2 0.3 0.5
Design & Technology 6.4 3.8 3.4 5.0 Food 0.8 1.5 0.5 1.0 Computing 3.4 3.5 4.1 3.6
Business Studies 0.3 2.3 6.0 2.0 Religious Education 3.7 3.5 2.7 3.5 Classics 0.1 0.1 0.3 0.2
Music 3.3 1.4 2.0 2.4 Drama 2.9 1.8 2.4 2.4 Art & Design 4.2 3.2 4.7 3.9
Physical Education 8.5 8.5 5.1 7.9
Others 3.5 5.8 21.3 7.4 EBacc 62.9 64.5 47.8 60.8
Total 100.0 100.0 100.0 100.0
Column percentages. Any Science aggregates each of Physics, Chemistry, Biology and Combined/General Science. Similarly, Any MFL aggregates French, German, Spanish and Other Modern Foreign Languages. More information about the subject classification is provided in Annex D.
Source: School Workforce Census, 2015
The latter point is addressed in Table 3 which shows the proportion of hours taught for each subject by key stage based on the latest School Workforce Census data from November 2015. It is clear that some subjects show a reduction in the proportion of hours

27
taught between key stage 3 and key stage 4, notably Modern Foreign Languages, Design & Technology, Music, Drama and Art & Design. On the other hand, the proportion of Science hours taught rises between key stage 3 and key stage 4. The teaching of English Baccalaureate subjects is generally more common at key stage 4 than at key stage 5. This drop is complemented by the large increase in Others, covering subjects such as Economics and Social Studies.
Figure 4: Proportion of hours taught in a typical week in November 2015 to pupils in key stages 3, 4 and 5 by a teacher with a relevant post A-level qualification using a matched database of teacher
qualifications and the TSM subject mapping
The bars with a red outline are grouped categories constructed by combining the relevant subjects. Any Science aggregates each of Physics, Chemistry, Biology and Combined/General Science. Since the teaching data for Combined/General Science cannot be further split, a teacher of this subject is classified as a ‘specialist’ regardless of which of the four Science subjects they hold a qualification in. The category of Modern Foreign Languages aggregates French, German and Spanish. Other Modern Foreign Languages constitutes a small proportion of the MFL teaching (see Table 3) and is excluded from the above table. More information about the subject classification is provided in Annex D.
Source: School Workforce Census, 2015.

28
The proportion of hours taught by teachers with a relevant post A-level qualification also varies by key stage. Figure 4 summarises the data from the latest School Workforce Census (November 2015) with the longitudinal tables being available in Annex B of this paper. A majority of subjects show higher percentages of ‘specialist’ teaching at later key stages, e.g. Mathematics shows a rise from 85.5% at KS3 through 91.2% at KS4 to 96.7% at KS5 and English also shows an increase from 87.9% at KS3 through 94.3% at KS4 to 97.0% at KS5. This data indicates that ‘specialist’ teachers are more likely to be deployed where subject complexity is highest.
There is also a strong relationship between ‘specialist’ teaching in Physics, Biology and Chemistry and key stage, with the later key stages showing higher proportions of ‘specialist’ teaching. The lower percentages in the three separate subjects in KS3 and KS4 carry less weight because, as is apparent from Table 3, Combined/General Science constitutes the vast majority of Science teaching at those key stages.16 This changes in key stage 5 when the curriculum split shifts from Combined/General Science towards separate Physics, Chemistry and Biology. By then the percentages of ‘specialist’ teaching in the three subjects are 87.9%, 93.0% and 97.3% respectively.
The marginal category of Humanities shows a different pattern to the other subjects. As noted above, this is affected by the fact that Humanities teachers with social-scientific degrees such as ‘Government Studies’ or ‘Sociology’ are classified as ‘non-specialist’.
1.4.5 Qualification types
Summary: The vast majority of ‘specialist’ teaching has been by teachers with a degree in the subject. PGCE is the second most common highest qualification and it is particularly prevalent among teachers of ‘hard-to-recruit’ subjects.
Apart from a simple split of having versus not having a post A-level qualification, a further distinction can be made by the type of the relevant qualification that the teacher holds. This is shown in Table 4. Only the highest-level qualification in each subject is used for each teacher, with ‘Degree’ being the highest and ‘None’ the lowest, e.g. data for a History teacher holding both a PGCE and a degree in History would only count towards the ‘Degree’ column, not towards the ‘PGCE’ column. The ‘PGCE’ column therefore does not estimate the proportion of teaching by teachers with a relevant PGCE but instead it estimates the proportion of teaching by teachers with a relevant PGCE who do not hold a relevant degree.
16 This may partly be due to the curriculum data being recorded in the School Workforce Census using the general Science code instead of the specific science subject codes, such as Biology, Chemistry, Physics or Combined Science.

29
Table 4: Proportion of hours taught in a typical week in November 2015 to pupils in years 7 to 13 by the highest relevant post A-level qualification of teacher using a matched database of teacher
qualifications and the TSM subject mapping
Subject Degree BEd PGCE Other None Total Mathematics 60.6 3.9 20.1 4.7 10.8 100.0 English 78.2 2.0 7.7 3.7 8.5 100.0 Any Science 87.3 1.9 5.1 1.1 4.6 100.0
Physics 66.9 1.8 10.4 1.2 19.8 100.0 Chemistry 79.2 1.2 7.8 0.6 11.2 100.0 Biology 86.9 1.3 5.8 1.2 4.9 100.0 Comb/General Science 90.8 2.1 4.0 1.2 1.9 100.0
History 83.0 1.2 6.0 1.3 8.5 100.0 Geography 81.6 1.6 4.9 1.0 11.0 100.0 Humanities 58.4 1.3 5.3 1.6 33.3 100.0 Modern Foreign Languages 56.2 1.7 19.2 1.8 21.0 100.0
French 59.4 2.0 22.3 2.2 14.1 100.0 German 66.0 1.2 14.3 0.9 17.6 100.0 Spanish 45.1 1.5 16.0 1.7 35.7 100.0
Design & Technology 68.1 11.2 9.1 3.5 8.0 100.0 Food 20.9 6.3 6.2 3.9 62.6 100.0 Computing 44.9 3.6 15.8 6.2 29.6 100.0 Business Studies 71.6 4.1 5.0 1.3 18.0 100.0 Religious Education 60.5 2.3 11.6 2.0 23.5 100.0 Classics 67.4 0.2 3.4 1.5 27.5 100.0 Music 88.4 2.5 4.9 1.3 2.9 100.0 Drama 67.1 2.5 6.7 3.1 20.6 100.0 Art & Design 86.5 2.7 5.2 1.4 4.3 100.0 Physical Education 75.7 12.4 6.0 1.5 4.3 100.0 EBacc 74.5 2.3 10.8 2.6 9.8 100.0 Total 72.6 3.8 9.8 2.6 11.1 100.0
Row percentages. ‘Degree’ covers undergraduate level qualifications and higher in the subject. ‘BEd’ stands for Bachelor of Education and ‘PGCE’ for Postgraduate Certificate in Education. ‘Other’ are other post A-level qualifications, including Certificate in Education. ‘None’ covers teaching by teachers with no relevant post A-level qualification. Only the highest level qualification in each subject is used for each teacher, with ‘Degree’ being the highest and ‘None’ the lowest, e.g. teaching by teachers with both a PGCE and a degree in the relevant subject is only used for the figures in the ‘Degree’ column, not in the ‘PGCE’ column as well. More information about the subject classification is provided in Annex D.
Source: School Workforce Census, 2015.

30
Across all subjects, 72.6% of teaching to pupils in years 7 to 13 in November 2015 was by a teacher with a degree in the relevant subject. A further 3.8% of the teaching was delivered by teachers with a relevant Bachelor of Education and 9.8% by teachers with a relevant PGCE. 2.6% of the teaching was conducted by teachers with other relevant post A-level qualifications and 11.1% by teachers with no relevant post A-level qualification.
For English Baccalaureate subjects, 74.5% of teaching was delivered by teachers with a degree and a further 10.8% was delivered by teachers with PGCE being their highest relevant qualification. The proportion was slightly lower for the teachers with a Bachelor of Education but no degree in the subject.
The qualification structure of teaching varied substantially by subject. For example, although the overall level of teaching by teachers with a post A-level qualification was very similar for English and Mathematics, three out of five hours of Mathematics were taught conducted by degree-level ‘specialists’, whereas four out of five hours of English were conducted by degree-level ‘specialists’. On the other hand, the proportion of teaching by teachers with a PGCE being their highest qualification was substantially higher for Mathematics than it was for English (20.1% and 7.7% respectively).
PGCE as the highest qualification is most common in the teaching of Mathematics, Modern Foreign Languages, Computing, Religious Education and Physics. With the exception of Religious Education, all of these subjects are eligible for SKE support which indicates that a SKE course combined with a PGCE constitutes a successful way of training new ‘specialists’ in ‘hard to recruit’ subjects.
Bachelor of Education as the highest qualification was relatively most common in the teaching of Physical Education (12.4%) and Design and Technology (11.2%).
1.4.6 Subjects of qualifications held by ‘non-specialists’
Summary: ’Non-specialist’ teaching is very often conducted by teachers with a post A-level qualification in a somehow related subject, e.g. a different Science subject for Physics teaching or a different Modern Foreign Language in the case of teaching of Spanish.
This section explores the ‘specialisms’ of ‘non-specialists’. For brevity it focuses on a selection of subjects only but the full results for all subjects are available in Annex E.
Table 5 reports, based on the data from November 2015, the main patterns for the ‘non-specialist’ teaching in Biology, Chemistry or Physics. Each figure in the table shows the proportion of ‘non-specialist’ teaching in the respective ‘row subject’ that was conducted by a teacher with a post A-level qualification in the respective ‘column subject’. For example, 58% of the ‘non-specialist‘ teaching in Biology was conducted by teachers with a post A-level qualification in Chemistry and in total 81% was conducted by ‘specialists’ in either Physics, Chemistry or Science. The row percentages do not sum to 100% because a teacher might hold several qualifications and even a single qualification might

31
contain content covering multiple subjects, i.e. a teacher can be a ‘specialist’ in more than one subject.
We can see that virtually all ‘non-specialist’ teaching of Physics and Chemistry was conducted by teachers with a post A-level qualification in one of the Sciences. For both subjects, this was primarily driven by a large proportion of teaching by Biology specialists. The proportion of ‘non-specialist’ teaching in Chemistry conducted by Physics ‘specialists’ is much lower than the proportion of ‘non-specialist’ teaching in Physics conducted by Chemistry ‘specialists’.
Table 5: Subjects of post A-level qualifications held by ‘non-specialists’ who taught Biology, Chemistry or Physics to pupils in years 7 to 13 in a typical week in November 2015
'Specialism' subject
Biology Chemistry Physics Any Science
Subj
ect
taug
ht Biology 58% 39% 81%
Chemistry 87% 9% 95% Physics 73% 45% 94%
Each figure in the table shows the proportion of ‘non-specialist’ teaching in the respective row subject that was conducted by a teacher with a post A-level qualification in the respective column subject. Category Any Science covers post A-level qualifications in any of Physics, Chemistry, Biology and Combined/General Science. More information is provided in Annex D and Annex E.
Source: School Workforce Census, 2015.
Table 6 shows a similar table for Modern Foreign Languages. 6 out of 10 ‘non-specialist’ hours in French were taught by a ‘specialist’ in Other MFL. The majority of ‘non-specialist’ teaching in both German and Spanish was conducted by French ‘specialists’ and around a half by ‘specialists’ in Other MFL. Interestingly, Spanish ‘specialists’ did not tend to conduct much ‘non-specialist’ teaching of German. ‘Non-specialists’ teaching any of the three Modern Foreign Languages also often held a qualification in English.
Table 6: Subjects of post A-level qualifications held by ‘non-specialists’ who taught French, German or Spanish to pupils in years 7 to 13 in a typical week in November 2015
'Specialism' subject
French German Spanish Other MFL English
Subj
ect
taug
ht French 25% 22% 60% 30%
German 61% 9% 51% 26% Spanish 59% 16% 49% 30%
Each figure in the table shows the proportion of ‘non-specialist’ teaching in the respective row subject that was conducted by a teacher with a post A-level qualification in the respective column subject. More information is provided in Annex D and Annex E.
Source: School Workforce Census, 2015.

32
2. Impact of specialist and non-specialist teaching This chapter provides an overview of the domestic and international evidence relating to the impact of subject ‘specialist’ teachers on pupil outcomes. It also contributes to the discussion by providing new analysis of the administrative data held by DfE.
2.1 Literature Review Academic evidence relating to the impact of subject ‘specialist’ teachers on pupil outcomes is summarised in this section. The limited available English evidence suggests that being taught by a teacher with a degree in the subject they teach has a small, if any, impact on pupil outcomes at GCSE. The wider international evidence also suggests teachers with a degree in the subjects they teach have little, if any, effect on pupil outcomes over the ages 11-18.
Some international evidence suggests that teachers’ knowledge of subject content taught in school has an influence on their effectiveness in improving pupil outcomes. However, in the available studies, there is no clear link between teachers’ knowledge of subject content taught in school and previous academic study directly in the subject. There is also a lack of English evidence on this.
2.1.1 Impact of teachers’ academic qualifications on pupil outcomes
Summary: The limited available English evidence suggests that being taught by a teacher with a degree in the subject they teach has a small, if any, impact on pupil outcomes at GCSE. The wider international evidence also suggests teachers with a degree in the subjects they teach have little, if any, effect on pupil outcomes over the ages 11-18.
2.1.1.1 English evidence
The overall evidence on the impact of subject ‘specialism’ is based on only a few studies17, particularly in the English context. Three English studies have looked specifically at the impact of being taught by a teacher with a relevant degree on pupil outcomes.
The first study was by Smithers & Robinson (2005) and looked at the impact of subject ‘specialist’ teachers on Physics GCSE and A Level performance. The study drew on a
17 A forthcoming study for the Royal Society of Chemistry looking at the impact of specialist Chemistry teachers should help to further build the evidence base. Details of the study can be found here.

33
survey of 432, or 10%, of institutions teaching 11-16-year-old students18. They found that the presence of ‘specialist’ teachers was associated with pupils’ GCSE and A Level results: the size of the effect was reduced when they controlled for the type of institution but was still significant. Indeed, their work found that a teacher qualification in Physics was the second most powerful predictor of pupil achievement after pupil ability, achievement being measured by pupils’ GCSE and A Level results. However, this study had particular limitations. First, it was based on a survey rather than available administrative data on pupil qualification outcomes and teacher specialisms. Second, the analysis did not control for a wide range of pupil and school-level characteristics that may correlate both with the presence of ‘specialist’ teachers and pupil attainment outcomes, thus confounding the observed relationship in this study. Two more recent studies (Education Data Lab, 2015; Cawood, 2015) addressed some of these concerns.
Education Data Lab (2015) conducted analysis of the impact of ‘specialist’ Physics teachers on pupils’ Physics GCSE outcomes. They made use of the Schools Workforce Census to identify where teachers with a Physics (or Engineering degree) were teaching and the National Pupil Database to relate this to pupils’ GCSE outcomes. For their sample of 1,128 secondary schools, they found that teachers with a Physics degree were most prevalent in schools with higher prior attainment. The authors looked first at the relationship between the number of teachers at a school with a Physics degree and entrance rates to GCSE Physics. They found a modest positive relationship, but as they point out, the direction of causality is not clear: do ‘specialist’ Physics teachers attract more pupils to take Physics GCSE or are ‘specialist’ Physics teachers attracted to schools with higher GCSE Physics entrance (or a combination of the two explanations)? They then looked at the effect of ‘specialist’ Physics teachers on pupil attainment, by examining whether schools with more ‘specialist’ Physics teachers have a higher average points score in science. Controlling for prior attainment of the in-take, they found no such relationship, as can be seen in Figure 5. The fact that the three lines in the chart lie on top of each other means that the school’s average grade in Science does not depend on the proportion of specialist teaching once prior attainment is controlled for.
However, given that pupils achieve their average science scores through a mixture of subjects this is not an ideal measure. Education Data Lab (2015) then used a more sophisticated measure, a Physics contextual value added (CVA) score, to assess this relationship. The CVA assesses pupils’ Physics GCSE performance, taking into account prior attainment and all observable pupil characteristics. They found no overall relationship between a schools Physics CVA and the number of Physics ‘specialists’ in each school.
18 This included comprehensive schools (both 11-16 and 11-18), secondary moderns, grammar schools, independent schools, sixth form colleges and further education colleges.

34
Figure 5: School average point score in pupil’s best science GCSE by proportion of ‘specialist’ Physics teachers
Source: Education Data Lab, 2015.
As such, Education Data Lab’s work suggests there is no consistent relationship between pupil outcomes in Physics at secondary school and the presence of ‘specialist’ teachers. A limitation of this work is that it only compares schools with no ‘specialist’ teachers, those with up to 20% ‘specialist’ Physics teachers and those with over 20% of ‘specialist’ teachers: it is possible more fine grained analysis may reveal an effect, and in addition the analysis only focussed on Physics and other subjects may differ. Cawood’s (2015) work addresses these limitations.
Cawood’s (2015) work investigates whether subject ‘specialist’ teachers in English, Physics and Mathematics impact on pupil attainment. Again Cawood makes use of the Schools Workforce Census and the National Pupil Database, but he goes beyond the work of Education Data Lab by looking at the impact of each additional 1 percentage point chance of being taught by a ‘specialist’ teacher on pupil GCSE outcomes, while controlling for prior attainment and a wide range of pupil characteristics. Cawood finds that there is an impact of being taught by a ‘specialist’ but it is very small: findings were that a one percentage point increase in the likelihood of being taught by a subject ‘specialist’ yields an improvement of 0.0026 of a GCSE grade in Maths, 0.0021 of a grade in English and 0.0018 of a grade in Physics. However, a limitation of Cawood’s work is that it does not control for school or teacher-level factors which may both affect grades and the probability of a pupil being taught by a ‘specialist’ teacher and these may confound the relationship observed in the study.
In addition, in both Cawood’s study and Education Data Lab’s, it is not possible to match pupils to individual teachers they were actually taught by and therefore the relationship

35
can only be observed in an imperfect manner by looking at probabilities of being taught by a ‘specialist’.
2.1.1.2 International evidence
A number of American econometric studies have looked at the impact on pupil outcomes of being taught by someone with a degree in the subject taught, generally as part of larger studies of teacher effectiveness.
Goldhaber & Brewer (1997) drew on US national longitudinal data from between 1988 and 1990, where individual teachers and pupils could be matched, to look at the impact of teacher effectiveness on Mathematics achievement. They found using regression modelling that teachers with a BA or MA in Mathematics had a significant positive impact on student achievement.
However, a number of more recent studies have not found this relationship. For example, Betts, Zau & Rice (2003) analysed a large scale survey data-set from San Diego to look at the impact of teachers on pupil achievement in Mathematics and Reading at middle and high school. They found no relationship between having a degree in the subject taught and pupil outcomes.
Similarly, Aaronson, Barrow & Sander (2007) used administrative data which matched pupils to individual teachers to look at the impact of teachers on pupils’ Mathematics achievement in Chicago high schools, and they found that there was no significant effect on pupils’ Mathematics achievement from the teacher having a degree in Mathematics. More generally, Aaronson et al. (2007) found that measures of educational background including quality of university attended, degree subject and whether a teacher holds a postgraduate degree had very limited explanatory power when looking at teacher effectiveness within their sample.
Rockoff, Jacob, Kane & Staiger (2011) used a survey of US teachers and found no significant effect of teachers holding a degree in Mathematics on pupil Mathematics achievement, while, Ladd & Sorenson (2015) looked at the impact of Masters degrees on teacher effectiveness in North Carolina middle and high schools, and found no evidence of a consistent positive effect on teacher effectiveness from holding a Masters in the subject taught. For example, they found for a middle school Mathematics teacher holding a Master’s in Mathematics actually has a small negative effect on achievement, while for high school Physics teachers, those holding a Masters in a Science subject are actually less effective than those with other Masters such as School Administration. On the other hand, they do find that holding a Masters in School Administration and Social Studies degrees does increase teacher effectiveness in Civics.
More widely, Blömeke, Olsen & Suhl (2016) and Gustaffson & Nilsen (2016) investigated the relationship between teachers’ degree specialism and pupil achievement cross-nationally making use of the TIMMS (Trends in International Mathematics and Science Study) data. Blömeke et al. (2016) analysed grade 4 student and teacher data from

36
TIMMS 2011, with a sample of 205,515 students from 47 countries in 10,059 classrooms. Using multi-level structural equation modelling, they found that overall, cross-nationally, being taught by teachers who majored in Mathematics (i.e. held a relevant degree) was associated with higher Mathematics achievement. However, when the data was looked at within countries the association was generally insignificant, with modest positive and negative associations within particular countries. Gustaffson & Nilsen (2016) utilised longitudinal data for 38 countries from TIMMS 2007 and TIMMS 2011 to look at the relationship between pupils’ grade 8 Mathematics achievement and teachers’ degree specialism. By utilising a longitudinal approach, the authors argued that the analysis was more likely to unearth causal relationships by controlling for time-invariant confounds. They found that whether a teacher had majored in Mathematics had no effect on students’ Mathematics achievement.
One possible explanation, advanced by Education Data Lab (2015), for the lack of consistent effects of subject ‘specialism’ on teacher effectiveness is that it reflects a more general finding that teacher academic credentials have little relationship with teacher effectiveness.19 Moreover, studies investigating factors affecting teacher effectiveness are reliant on surveys and administrative data and the characteristics generally recorded in these sources. One factor generally not recorded in these is teacher subject knowledge and the next section looks at evidence that this may be a significant factor affecting pupil outcomes.
2.1.2 Impact of teacher subject knowledge on pupil outcomes
Summary: Some international evidence suggests that teachers’ knowledge of subject content taught in school has an influence on their effectiveness in improving pupil outcomes. However, in the available studies, there is no clear link between teachers’ knowledge of subject content taught in school and previous academic study directly in the subject. There is also a lack of English evidence on this.
In the US, context studies have pointed to the potential importance of teacher subject knowledge to pupil outcomes. Two studies by Hill and colleagues (2005, 2015) looked at the impact of US Mathematics teachers’ subject knowledge on pupil outcomes. The first study (Hill, Rowan & Ball, 2005), looked at maths achievement gains for 2,000 1st and 3rd grade pupils who were collectively taught by 700 different teachers. They tested teachers on a measure of their specialised Mathematics knowledge and skills used in teaching maths, as opposed to measuring teachers’ general Mathematics knowledge. They found that teachers’ specialised Mathematics knowledge was significantly related to student achievement in both grades, when controlling for a number of key pupil-level and
19 See Burgess (2015) for a review of the relevant literature; In the English context Slater, Davies & Burgess (2012) found no statistically significant influence of degree class or subject on teacher effectiveness.

37
teacher-level variables. The authors note that they cannot rule out that teachers with superior general knowledge or aptitude for teaching scored higher on the Mathematics knowledge test and this drove the findings, but after conducting further analysis they suggested this was not the case.
A second study (Hill, Charalambous & Chin, 2015) looked at 300 US teachers’ mathematics knowledge and how it affected Mathematics achievement for 2nd and 4th grade pupils. Again, they found that the pupils of teachers whose tested Mathematics knowledge was stronger had better outcomes, though the effect was small and only explained a moderate amount of the variance in student learning. Interestingly, they found that teachers’ Mathematics knowledge was unrelated to the number of Mathematics content/methods courses they had taken, suggesting that this knowledge had been arrived at possibly through other means.
Sadler, Sonnert, Coyle, Cook-Smith & Miller (2013) conducted a further US study investigating the impact of teacher subject knowledge on pupil outcomes. Their study examined the relationship between teacher knowledge of subject content taught and pupil achievement in Physics amongst 9,556 pupils at 181 US middle schools. They administered identical Physics knowledge tests to pupils and teachers across a year. Using regression analysis, they found that better teacher knowledge of subject content taught accounted for higher student gains. As with Hill et al. (2005), they considered the possibility that better teacher knowledge was a proxy for other teacher characteristics which actually explained improved pupil outcomes, but they tested for this using observable teacher characteristics, such as experience, and found knowledge remained a powerful predictor of pupil outcomes. Interestingly, they found that subject knowledge was a superior predictor of pupil outcomes than whether or not they had taken a Science degree. Nonetheless, Sadler et al. (2013) suggest there is a need for experimental studies to build the evidence base on the impact of teacher subject knowledge on pupil outcomes.
A wider cross-national evidence base also exists on the impact of teacher knowledge on pupil outcomes. Metzler & Woessmann (2010) estimated the causal impact of teacher subject knowledge on pupil achievement using a unique Peruvian data set which contained knowledge test scores for teacher and pupils in two subjects. They found teacher subject knowledge had a large causal impact on pupil outcomes, with the same student taught in two different subjects by the same teacher performing relatively better in the subject for which the teacher had superior knowledge. Similarly, Guimarães, Sitaram, Taguchi & Robinson (2012) measured the effect of teacher content knowledge, as measured through a test, on Mathematics achievement of year 5 pupils in Brazil. They also found that teachers with higher content knowledge had a greater impact on pupils’ Mathematics achievement, when controlling for a wide range of pupil, teacher and school characteristics.
However, Shepherd (2010) looked at the impact of teacher subject knowledge on pupil performance in South Africa from a representative year 7 data set. She found that

38
teacher subject knowledge was only estimated to have a significant positive impact on performance for pupils at schools in the wealthiest quintile, and this effect was removed when controlling for a wider range of teacher characteristics. Altinok (2013) explored the effect of teacher knowledge in Mathematics and Reading on student achievement in fourteen sub-Saharan African countries. They found variability in the impact of teacher subject knowledge on pupil performance: in some countries the effect was large, while in others investigated it was very small.
The studies above point to a possible important effect of teacher subject knowledge on pupil outcomes but such an effect was not found in all contexts. Unfortunately, no study could be located that looked directly at the impact of subject knowledge on teacher effectiveness in an English context. One English study which is of relevance, is an evaluation by Walker, Straw, Jeffes, Sainsbury, Clarke & Thom (2013) which looked at the impact of a DfE funded upskilling programme – Mathematics Specialist Teachers (MAST) programme for primary Mathematics teachers. MAST focussed on primary Mathematics teaching and was delivered to four cohorts of teachers and aimed to develop their ‘specialist’ subject knowledge and pedagogical skills, learning which they would then share across their school with the aim to raise the standard of Mathematics teaching and thereby pupil outcomes. In total, the programme amounted to a two-year Masters level course delivered through higher education institutes. The authors found that qualitative teacher feedback was very positive about the programme and its impact on teaching. However, when evaluating pupil outcomes in relation to a control group of schools where teachers had not been part of the MAST programme, they found that MAST had not had an impact on KS1 or KS2 attainment. It should be noted that the time frame for the evaluation was relatively short and an impact may have taken longer to materialise and most teachers were not receiving the upskilling directly; however, it does point to a challenge in improving pupil outcomes through programmes to boost teacher subject knowledge.
2.2 Data analysis This section introduces new analysis of what impact subject ‘specialism’ might have on pupil outcomes. It is based on the administrative data held by DfE which has limitations around the data collected and the technical inability to link individual teachers to pupil outcomes. The analysis supports previous research and international evidence and does not find evidence of a strong link between the subjects of teachers’ post A-level qualifications and pupil outcomes.
When looking at how ‘specialist’ teaching relates to the curriculum structure of schools, the analysis finds that schools with a higher proportion of key stage 3 and key stage 4 teaching hours devoted to English and Mathematics tended to have slightly higher levels of ‘non-specialist teaching’ in these subjects. There is no visible relationship for Science. Schools teaching Humanities and Modern Foreign Languages relatively more tended to exhibit a lower degree of ‘non-specialist’ teaching.

39
There is a positive relationship between the level of ‘specialist’ teaching in English and Mathematics and attainment in these subjects at the end of key stage 4. This, however, does not control for confounding factors. On the other hand, the international data provide little to no evidence of a positive effect of ‘specialist’ teaching in year 9.
When looking at how KS2-KS4 value added relates to subject ‘specialist’ teaching the analysis finds that the level of ‘specialist’ teaching in school is associated with the school’s value added in English, Mathematics and Humanities. No relationship has been found for Science and Modern Foreign Languages. This analysis does not control for other related factors and it does not imply causation.
Finally, when looking at the relationship between KS2-KS4 value added and subject ‘specialist’ teaching when other school-level variables are controlled, the analysis suggests a small positive impact for Mathematics and Humanities; there is also weak evidence of a small positive impact for English. No effect was identified for Science and Modern Foreign Languages.
The sections below set out these findings in more detail and cover the methodologies used as part of the analysis. Further information is also provided in the Annexes to this report and the accompanying spreadsheets.
2.2.1 Data analysis methodology
The fact that it is not technically possible to link DfE’s data on individual teachers to the pupils they teach20 creates constraints in determining the impact of ‘non-specialist’ teaching on pupil outcomes using administrative data. We are only able to run school level analysis which means that in every school all teachers of a given subject will be pooled together, regardless of their specialism level. In this chapter we employ a range of analytical strategies that attempt to isolate the effect of subject specialism but this work should not be seen as providing a definitive methodology. Instead it should be seen as contributing to the existing evidence summarised in the previous section.
The question of the impact of ‘non-specialist’ teaching on pupil outcomes was approached by examining the following relationships:
• How does ‘specialist’ teaching relate to the curriculum structure of schools? • How does ‘specialist’ teaching relate to attainment at GCSE? • How does KS2-KS4 value added21 relate to subject ‘specialist’ teaching?
20 The box in the Introduction contains further information. 21 The ‘KS2 to KS4 value added’ measures the progress that individual pupils at the end of KS4 - i.e. in year 11 - have made since taking their KS2 tests in year 6 (generally aged 11). This measure looks at the progress that pupils have made for the whole secondary phase of education. For the KS2 to KS4 value added measure, each school's pupils are compared individually with other pupils with similar KS2 test

40
• Are changes in ‘specialist’ teaching over time associated with changes in KS2-KS4 value added over time?
• How strong is the relationship between KS2-KS4 value added and subject ‘specialist’ teaching when other school-level variables are controlled?
The subjects covered in the analysis are Mathematics, English, Science22, Humanities23 and Modern Foreign Languages24. Consequently, the five main variables used to evaluate schools’ impact on pupil outcomes in this paper are the KS2-KS4 value added measures for the English Baccalaureate subject areas taken from performance tables.
GCSE attainment is also analysed but only for English and Mathematics, using the proportion of pupils achieving the given EBacc pillar. The other subjects are not covered because the entry rates for these subjects are lower. This introduces additional uncertainty into the analysis and additional assumptions would have to be made about how specialist teaching differs between pupils entering a given area and those not entering it.
In order to maintain consistency with the coverage of the attainment and value added measures used in the analysis, teaching in key stages 3 and 4 only will be analysed throughout the chapter, i.e. teaching in key stage 5 is not covered in this chapter.
Each of the five questions will now be addressed in a separate section below.
2.2.2 Curriculum structure and specialism levels in schools
Summary: Schools with a higher proportion of key stage 3 and key stage 4 teaching hours devoted to English and Mathematics tended to have slightly higher levels of ‘non-specialist teaching’ in these subjects. There is no visible relationship for Science. Schools teaching Humanities and Modern Foreign Languages relatively more tended to exhibit a lower degree of ‘non-specialist’ teaching.
results. If they do better than the median - or middle - performance of other pupils in their GCSE (and equivalent) examinations, the value added will be positive; if they do less well than other pupils, it will be negative. All the individual pupil scores, positive and negative, are added together and averaged to form the school's measure. A value added change of 6 points from 1000 of 1006 would mean that on average each of the school's pupils achieved the equivalent of one GCSE grade higher in a given subject than the median, or middle value, for pupils with similar prior attainment. Please note that some pupils will progress more than others independently of which school they attend and a schools value added score would certainly be different if they had a different cohort of pupils. 22 Defined as a combination of Physics, Biology, Chemistry and Combined/General Science from Chapter 1. Please note that computer science is not covered in order to maintain consistency with the subject mapping used in Chapter 1. 23 Defined as a combination of Geography, History and Humanities from Chapter 1. 24 Defined as a combination of French, German and Spanish from Chapter 1. Please note that other modern foreign languages and classical languages are not included in order to maintain consistency with the subject mapping used in Chapter 1.

41
Figure 6 summarises the relationship for Mathematics, English and Science based on data from November 2015. It shows that in schools where Mathematics constituted 10%-12% of the curriculum, more than 90% of hours in Mathematics were taught by ‘specialist’ teachers. On the contrary, in schools where Mathematics constituted 18%-20% of the curriculum, ‘specialist’ teaching of Mathematics was around 86%. Generally, a two percentage points increase in the share of the curriculum by Mathematics was associated with a one percentage point drop in ‘specialist’ teaching in Mathematics.
Figure 6: Proportion of hours in Mathematics, English and Science taught to pupils in years 7-11 by a teacher with a relevant post A-level qualification by the proportion of the school’s curriculum in
years 7-11 devoted to teaching the subject, November 2015
For each subject all schools are classified into 2-percentage-point bands (10%-12%, 12%-14% etc.) using the proportion of KS3 and KS4 teaching devoted to it. In each band the proportion of hours taught by a teacher with a relevant post A-level qualification is then calculated using all schools falling into the band. For clarity, a small number of schools with the proportion of hours not lying between 10% and 20% have been excluded from the chart. The lines in the chart are illustrative trends estimated using linear regression.
Source: School Workforce Census, 2015.
The same relationship held for English, i.e. a larger share of teaching of English was associated with a decrease in ‘specialist’ teaching in it. The only difference was that the overall level of specialism was higher for English than Mathematics which corresponds to the findings from Chapter 1.

42
Contrary to Mathematics and English, Figure 6 shows no relationship for Science. This could be explained by the already very high general level of ‘specialist’ teaching in Science, making identification of the relationship more complicated even if one existed. It could also be caused by the data limitations surrounding the ‘specialism’ estimates of Science teaching; these are described previously and in Annex D as well.
Figure 7: Proportion of hours in Humanities and Modern Foreign Languages taught to pupils in years 7-11 by a teacher with a relevant post A-level qualification by the proportion of the school’s
curriculum in years 7-11 devoted to teaching the subject, November 2015
For each subject all schools are classified into 2-percentage-point bands (10%-12%, 12%-14% etc.) using the proportion of KS3 and KS4 teaching devoted to it. In each band the proportion of hours taught by a teacher with a relevant post A-level qualification is then calculated using all schools falling into the band. For clarity, a small number of schools with the proportion of hours not lying between 10% and 20% have been excluded from the chart. The lines in the chart are illustrative trends estimated using linear regression.
Source: School Workforce Census, 2015.
Figure 7 shows estimates for Humanities and Modern Foreign Languages. It is clear that the larger curriculum share of these subjects was associated with a higher level of ‘specialist’ teaching. A two percentage points increase in the curriculum share of Modern Foreign Languages was associated with a one percentage point increase in ‘specialist’ teaching. The relationship was slightly weaker for Humanities. It could be hypothesised that schools with ‘specialist’ teachers in these subjects tended to increase their share of the curriculum but it is impossible to determine the causal direction of the relationship.

43
2.2.3 Specialism level and attainment
Summary: A positive relationship was identified between the level of ‘specialist’ teaching in English and Mathematics and attainment in these subjects at the end of key stage 4. The available international data provide little to no evidence of an effect of ‘specialist’ teaching in year 9. These comparisons, however, do not control for confounding factors.
Figure 8 displays the relationship between ‘specialist’ teaching and attainment in Mathematics. It shows that the proportion of pupils achieving the EBacc Mathematics subject area was higher for pupils in the schools with a high level of ‘specialist’ teaching regardless of which of the five latest years of the available data was being examined. The relationship seems to be stable too, with the data showing a fairly linear trend every year. Across the years, the increase of ten percentage points in ‘specialist’ teaching in Mathematics was on average associated with an increase of more than three percentage points in the proportion of pupils achieving the EBacc Mathematics subject area.
Figure 8: Proportion of pupils achieving the EBacc Mathematics subject area in 2010/11-2014/15 by the proportion of hours in Mathematics taught in schools to pupils in years 7-11 by a teacher with a
relevant post A-level qualification
All schools are classified into 5-percentage-point bands (60%-65%, 65%-70% etc.) using the proportion of KS3 and KS4 Mathematics teaching conducted by ‘specialists’. In each band the proportion of pupils achieving the EBacc Mathematics subject area is then calculated using all schools falling into the band. For clarity, a small number of schools with the proportion of hours not lying between 60% and 100% have been excluded from the chart. The lines in the chart are illustrative trends estimated using OLS regression.
Source: School Workforce Census, 2010-2014, Performance Tables 2011-2015.

44
The relationship for English is presented in Figure 9. A similar pattern of a slightly less stable yet overall robust relationship between ‘specialist’ teaching and pupil outcomes emerges. Pupils in schools with a higher proportion of ‘specialist’ teaching were more likely to achieve the EBacc English subject area. Based on the latest data, the strength of the relationship can be estimated to be similar to the one for Mathematics, i.e. an increase of more than three percentage points in the likelihood of achieving the EBacc English subject area was associated with an increase of ten percentage points in ‘specialist’ teaching of English.
The identified correlations, both for Mathematics and English, do not imply causation. Many factors may be related both to pupil achievement and ‘specialist’ teaching. Most importantly, prior attainment is not controlled for in Figure 8 and Figure 9. If schools with high prior attainment attract ‘specialist’ teachers, such a relationship will appear.
Figure 9: Proportion of pupils achieving the EBacc English subject area in 2010/11-2014/15 by the proportion of hours in English taught in schools to pupils in years 7-11 by a teacher with a relevant
post A-level qualification
All schools are classified into 5-percentage-point bands (60%-65%, 65%-70% etc.) using the proportion of KS3 and KS4 English teaching conducted by ‘specialists’. In each band the proportion of pupils achieving the EBacc English subject area is then calculated using all schools falling into the band. For clarity, a small number of schools with the proportion of hours not lying between 60% and 100% have been excluded from the chart. The lines in the chart are illustrative trends estimated using linear regression.
Source: School Workforce Census, 2010-2014, Performance Tables 2011-2015.

45
In order to complement the provided evidence by an alternative data source, results of the 2016 Trends and International Mathematics and Science Study are presented in Table 7. The focus is on the achievement of year 5 and year 9 pupils in Mathematics and Science. Both the figures for England and the international averages are presented. Higher values mean higher average achievement in the tests distributed by the study.
Table 7: Average Mathematics and Science achievement of year 5 and year 9 pupils in England and internationally by the qualifications of their teachers
Mathematics Science
Year 5 Year 9 Year 5 Year 9
Eng Avg Eng Avg Eng Avg Eng Avg
Post-secondary qualification in subject as well as education
548 (11.9)
505 (1.1)
520 (8.1)
483 (1.1)
545 (8.8)
511 (1.3)
536 (5.5)
493 (1.1)
Post-secondary qualification in subject but not in education
582 (23.5)
487 (2.9)
~ ~
480 (2.3)
553 (9.9)
496 (2.7)
541 (6.5)
488 (1.0)
Post-secondary qualification in education but not in subject
543 (4.7)
512 (1.5)
475 (26.2)
481 (2.1)
534 (4.2)
510 (1.6)
526 (8.5)
482 (1.2)
All other post-secondary qualifications
552 (8.7)
495 (2.0)
504 (12.6)
477 (2.4)
533 (5.8)
496 (2.3)
526 (22.8)
485 (2.9)
No post-secondary qualification ~ ~
434 (4.0)
~ ~
396 (4.3)
~ ~
457 (3.7)
~ ~
404 (5.6)
Qualifications self-reported by teachers. Year 5 translates to the ‘4th grade’ internationally and year 9 to the ‘8th grade’. Higher values mean higher average achievement in the tests distributed by the study. Standard errors appear in parentheses. Because of rounding some results may appear inconsistent. A tilde (~) indicates insufficient data to report achievement. The year 9 Science data for England are available for at least 70% but less than 85% of the students. ‘Eng’ stands for England, ‘Avg’ for the average across all included countries.
Source: Martin et al., 2016; Mullis et al., 2016.
Unfortunately, the figures for England for both subjects and grades have large standard errors (standard errors are given in parentheses in the tables) - too large to make comparisons between the categories possible. Larger sample sizes would be needed to make robust comparisons.
In both Science and Mathematics, the international averages show the highest achievement for year 5 pupils taught by teachers with a primary teaching qualification but no subject ‘specialisation’. This stands in stark contrast to the low average performance of the pupils taught by a ‘specialist’ with no primary teaching qualification. Only pupils taught by a teacher with no post-secondary qualification at all had a lower average achievement.
In year 9, the international figures for Mathematics and Science provide little to no evidence of the impact of teachers’ subject ‘specialisation’: the difference is only found between holding any post-secondary qualification (high pupil achievement) and not holding any post-secondary qualification at all (low pupil achievement).

46
2.2.4 Specialism level and value added: comparisons at a point in time
Summary: The level of ‘specialist’ teaching in school is associated with the school’s value added in English, Mathematics and Humanities. No relationship has been found for Science and Modern Foreign Languages. This analysis does not control for confounding factors and it does not imply causation.
Arguably the most straightforward way of evaluating the relationship between subject specialism and value added is by plotting one against the other. Figure 10 plots the percentage of hours taught to pupils in years 7-11 by a teacher with a relevant post A-level qualification against the value added of their school for the given EBacc pillar. A value added change of 6 points from 1000 of 1006 would mean that on average each of the school's pupils achieved the equivalent of one GCSE grade higher in a given subject than the median, or middle value, for pupils with similar prior attainment. All the five analysed subjects are represented in the chart and they are plotted in different colours.
Figure 10: Proportion of hours taught to pupils in years 7-11 by a teacher with a relevant post A-level qualification by subject against value added in the respective EBacc subject area
All schools are classified into 1-point bands using value added in each of the five areas. Within each band the proportion of hours taught by a teacher with a relevant post A-level qualification is then calculated using all schools falling into the band. For clarity, a small number of schools with the value added not lying between 995 and 1005 have been excluded from the chart. The lines in the chart are illustrative trends estimated using linear regression.
Source: School Workforce Census, 2014, Performance Tables 2015.

47
There seems to be little to no relationship between value added and ‘specialist’ teaching for Science and Modern Foreign Languages. Although the chart only covers academic year 2014/15, this finding has also been found to hold for other years (the data are provided in the attached spreadsheet). As mentioned several times above, the available data for both of these subjects have constraints which might explain the lack of a visible direct relationship.
Strong positive linear relationships have been found for Mathematics, English and Humanities. Pupils in schools with low value added in each of these subjects are much less likely to be taught by a ‘specialist’ teacher than pupils in schools with a high value added, e.g. for Mathematics the difference can be as high as 8 percentage points between the low performing schools and the high performing schools. Just as with the other two subjects, even though the figures are not reported in the chart this finding also holds for the previous four years of data (which can be found in the attached spreadsheets).
It needs to be remembered that the analyses presented in this section as well as those in Section 2.2.3 do not isolate the effects of other factors that might be confounding the relationship between subject ‘specialism’ and pupil outcomes. Sections 2.2.5 and particularly 2.2.6 attempt to control for some of these effects. Nevertheless, all analyses presented here are based on statistical data and can never truly validate the existence or absence of a causal effect.
2.2.5 Specialism level and value added: comparisons over time
Summary: An analysis of longitudinal changes in schools’ value added scores and ‘specialist’ teaching only identifies a positive relationship for English.
Another approach of assessing the relationship between value added and subject specialism at school level is by following school data over time and looking at whether changes in one of the measures tend to coincide with changes in the other measure.
Figure 11 makes year-on-year comparisons between the changes in schools’ degree of ‘specialist’ teaching and the change in their value added. This is done for each subject separately, e.g. the top-left plot is for Mathematics, the top-right plot for English etc. There is one line for each of the four year-on-year comparisons that can be made using the five years of available data.
The top-right plot for English shows that in schools with improving value added there was also an increase in the proportion of ‘specialist’ teaching. The charts for all the other subjects reveal a mixed picture depending on which two years are being compared and the estimated trends are very sensitive to the assumptions made, e.g. just excluding the ‘3‘ category from the Humanities chart would turn all the lines in the chart into an increasing relationship. The mixture of trends is not surprising for Science and Modern Foreign Languages given the findings of the previous section.

48
Figure 11: Year-on-year change (in percentage points) in the proportion of hours taught to pupils in years 7-11 by a teacher with a relevant post A-level qualification by subject and by a year-on-year
change in value added in the respective EBacc subject area
All schools are classified into 1-point bands using a year-on-year change in their value added in each of the five subject areas. Within each band the proportion of hours taught by a teacher with a relevant post A-level qualification is then calculated using all schools falling into the band. This is done both for the given year and the following year and the overall percentages for the two years are then subtracted to give the percentage point change in ‘specialist’ teaching plotted on the vertical axis. Only schools with curriculum data and value added data in both the years are included in each chart. For clarity, a small number of schools with the change in value added not lying between -3 and 3 have been excluded from the chart. The lines in the chart are illustrative trends estimated using linear regression.
Source: School Workforce Census, 2010-2014, Performance Tables 2011-2015.
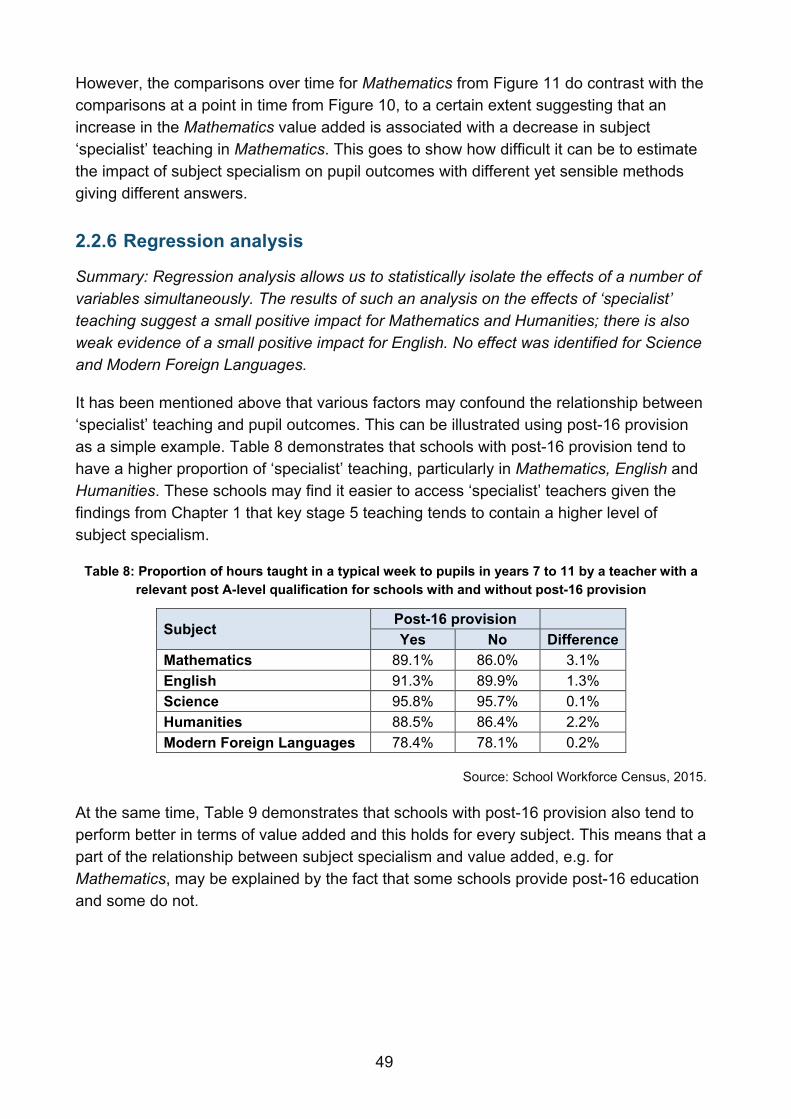
49
However, the comparisons over time for Mathematics from Figure 11 do contrast with the comparisons at a point in time from Figure 10, to a certain extent suggesting that an increase in the Mathematics value added is associated with a decrease in subject ‘specialist’ teaching in Mathematics. This goes to show how difficult it can be to estimate the impact of subject specialism on pupil outcomes with different yet sensible methods giving different answers.
2.2.6 Regression analysis
Summary: Regression analysis allows us to statistically isolate the effects of a number of variables simultaneously. The results of such an analysis on the effects of ‘specialist’ teaching suggest a small positive impact for Mathematics and Humanities; there is also weak evidence of a small positive impact for English. No effect was identified for Science and Modern Foreign Languages.
It has been mentioned above that various factors may confound the relationship between ‘specialist’ teaching and pupil outcomes. This can be illustrated using post-16 provision as a simple example. Table 8 demonstrates that schools with post-16 provision tend to have a higher proportion of ‘specialist’ teaching, particularly in Mathematics, English and Humanities. These schools may find it easier to access ‘specialist’ teachers given the findings from Chapter 1 that key stage 5 teaching tends to contain a higher level of subject specialism.
Table 8: Proportion of hours taught in a typical week to pupils in years 7 to 11 by a teacher with a relevant post A-level qualification for schools with and without post-16 provision
Subject Post-16 provision Yes No Difference
Mathematics 89.1% 86.0% 3.1% English 91.3% 89.9% 1.3% Science 95.8% 95.7% 0.1% Humanities 88.5% 86.4% 2.2% Modern Foreign Languages 78.4% 78.1% 0.2%
Source: School Workforce Census, 2015.
At the same time, Table 9 demonstrates that schools with post-16 provision also tend to perform better in terms of value added and this holds for every subject. This means that a part of the relationship between subject specialism and value added, e.g. for Mathematics, may be explained by the fact that some schools provide post-16 education and some do not.

50
Table 9: Proportion of schools with the respective subject specific value added measure above 1000 for schools with and without post-16 provision
Subject Post-16 provision Yes No Difference
Mathematics 55.8% 46.4% 9.5% English 57.2% 47.8% 9.3% Science 54.1% 42.6% 11.5% Humanities 53.2% 44.5% 8.8% Modern Foreign Languages 52.5% 44.2% 8.4%
For consistency with other analyses presented in this report, only schools included in the respective School Workforce Census (November 2014) are included.
Source: Performance Tables, 2015.
In order to control for the effect of confounding variables we complete the analysis by running a school-level regression analysis for each of the subjects in each of the years for which the data are available, i.e. 2010/11 to 2014/15. These are general linear models with the KS2-KS4 value-added scores used as the dependent variable and the percentage of ‘specialist’ teaching to pupils in years 7-11 used as the main explanatory variable. Other variables were included as control variables, including geographical region; the urban/rural split; deprivation of schools’ area; whether or not the school provides post-16 education; whether or not the school is selective; schools’ overall effectiveness grading by Ofsted; the number of pupils in the KS4 cohort; the proportion of girls in school; the proportion of FSM pupils; the proportion of pupils with English as a second language; the proportion of SEN pupils; the proportion of sessions missed due to absence; the KS2 average point score of the KS4 cohort (to measure pupils’ prior attainment); the average age of classroom teachers in school (as a proxy for overall teacher experience level) and the curriculum share of the given subject in years 7-11. The continuous variables were transformed into quintiles to simplify the interpretation of the results. More information about the methodology is available in Annex F.
The main output of the regression analysis is summarised in Figure 12. It shows the coefficients and the respective 95% confidence intervals for the estimates of ‘specialist’ teaching on pupil outcomes. The majority of the estimates (bars) are positive which suggests that there might be a positive effect of subject specialism. However, many of the confidence intervals include 0 (the whiskers cut the horizontal axis) which means that the uncertainty surrounding the estimate is too high to make a claim that the effect is in fact positive. The evidence is strongest for Mathematics which has a statistically significant coefficient for four out of five analysed years. The evidence is slightly weaker for Humanities with three out of five years yielding a significant positive effect and there is some evidence that teacher specialism has an impact on pupil outcomes in English too. Very little evidence supports the equivalent statements for Modern Foreign Languages and Science.

51
Figure 12: Coefficients and 95% confidence intervals from the school-level regression analysis explaining the EBacc value added in the five subject areas by the percentage of teaching to pupils in years 7-11 by a teacher with a relevant post A-level qualification and a range of control variables
For simplicity the proportion of hours in each subject taught to pupils in years 7-11 by a teacher with a relevant post A-level qualification is banded into quintiles. All the coefficients as well as standard model fit measures are provided in the accompanying spreadsheet. The amount of variance in value added explained by the models varied between 41% and 49% for Mathematics, 29% and 40% for English, 30% and 39% for Science, 33% and 38% for Humanities and 19% and 28% for Modern Foreign Languages.
Source: School Workforce Census, 2010-2014, Performance Tables 2011-2015.
In terms of effect sizes, the significant coefficients typically lay between 0.05 and 0.1. This translates into the predicted value added difference of 0.2-0.4 points between the schools in the highest and the lowest quintile if sorted by the proportion of ‘specialist’ teaching in the given subject. To benchmark this difference, a value added change of 6 points from 1000 of 1006 would mean that on average each of the schools’ pupils achieved the equivalent of one GCSE grade higher in a given subject than the median, or middle value, for pupils with similar prior attainment. Comparing pupils in schools with most ‘specialist’ teaching to pupils in similar schools with least ‘specialist’ teaching, a typical difference in progress made was therefore smaller than 10% of a single grade.
In comparison, other variables seem to have a much larger impact, e.g schools in Inner London typically had the value added in the EBacc language pillar 2.5-3 points higher than comparable schools in East Midlands. There is also a strong relationship with school’s overall effectiveness; the difference between schools graded as ‘Outstanding’ by Ofsted and those graded as ‘Inadequate’ can be higher than 2 value added points. All the coefficients as well as standard model fit measures are provided in the accompanying spreadsheets.
It is important to remember that it is not currently possible to link teacher data directly to pupil outcomes in order to evaluate the impact of ‘non-specialist’ teaching directly. Moreover, any statistical analysis of administrative data only allows for controlling observable characteristics and cannot capture the many unobservable factors which exist
52
in the school environment. Even though the use of multiple methodologies helps increase robustness and validity of the results, the findings should still only be seen as indicative and should be read together with the wider body of evidence on the topic. This is especially important in those areas in which different methodologies produce conflicting results.

53
References
Government sources
Department for Education. (2016). National pupil database. National pupil database - GOV.UK Last updated 16 November 2016.
Department for Education. (2016). National pupil database: Third party requests. National pupil database: third-party requests - Publications - GOV.UK Last updated 14 July 2016.
Department for Education. (2016). Performance tables. Compare school and college performance.
Department for Education. (2016). School workforce in England: November 2015. School workforce in England: November 2015 - Publications - GOV.UK Last updated 30 June 2016.
Department for Education. (2016). Teacher Supply Model 2016/17. https://www.gov.uk/government/publications/teacher-supply-model Last updated 14 October 2015.
Department for Education. (2016). The national curriculum. Available here: https://www.gov.uk/national-curriculum/overview Last updated 25 October 2016.
National Audit Office. (2016). Training new teachers. Available here: https://www.nao.org.uk/report/training-new-teachers/ Last updated 10 February 2016.
Public Accounts Committeee. (2016). Training new teachers. Training New Teachers inquiry - UK Parliament Last updated 7 November 2016.
External references
Aaronson, D., Barrow, L. & Sander, W. (2007). Teachers and student achievement in Chicago public high schools. Journal of Labor Economics, 25(1), 95-135. Available here: http://faculty.smu.edu/millimet/classes/eco7321/papers/aaronson%20et%20al.pdf
Altinok, N (2013). The impact of teacher knowledge on student achievement in 14 sub-Saharan countries. Paper commissioned for the EFA Global Monitoring Report 2013/4, Teaching and learning: Equality for all. UNESCO. Available here: http://unesdoc.unesco.org/images/0022/002258/225832e.pdf
Betts, J.R., Zau, A.C. & Rice, L.A. (2003). Determinants of student achievement: New evidence from San Diego. Public Policy Institute of California. Available here: http://www.ppic.org/content/pubs/report/R_803JBR.pdf Accessed 12 December 2016.
54
Blömeke, S., Olsen, R.V. & Suhl, U. (2016). Relation of student Achievement to the quality of their teachers and instructional quality. In Nilsen, T. & Gustaffson, J.-E. (eds.) Teacher quality, instructional quality and student outcomes: Relationships across countries, cohorts and time. IEA Research for Education 2. Springer: USA. pp. 21-50.
Burgess, S. (2015). Human capital and education: The state of the art in the economics of education. COEURE: Cooperation on Research in Economics. European Commission: FP7. Available here: http://www.coeure.eu/wp-content/uploads/Human-Capital-and-education.pdf
Cawood, K. (2015). The impact of a teacher's degree on their pupils' attainment: an econometric analysis of National Pupil Database and School Workforce Census data in the UK. Unpublished MPhil Thesis, University of Cambridge.
Education Data Lab (2015). Seven things you might not know about our schools. Available here: http://www.educationdatalab.org.uk/getattachment/Blog/March-2015/Seven-things-you-might-not-know-about-our-schools/EduDataLab-7things.pdf.aspx. Accessed 12 December 2016.
European Commission (2016). EURYDICE: The teaching profession in Europe: Practices, perceptions, and policies. Available here: https://webgate.ec.europa.eu/fpfis/mwikis/eurydice/favicon.ico Accessed 12 December 2016.
Gerritsen, S., Plug, E. & Webbink, D. (in press). Teacher quality and student achievement: Evidence from a sample of Dutch twins. Journal of Applied Econometrics. Available here: http://onlinelibrary.wiley.com/doi/10.1002/jae.2539/full
Goldhaber, D.D & Brewer, D.J. (1997) Why don’t schools and teachers seem to matter? Assessing the impact of unobservables on educational productivity. Journal of Human Resources, 32(3), 505-523. Available here: http://www.jstor.org/stable/146181?origin=crossref&seq=1#page_scan_tab_contents
Guimarães, R., Sitaram, A., Taguchi, S. & Robinson, L., (2012). The effect of teacher content knowledge on student achievement: A quantitative case analysis of six Brazilian states. Available here: http://paa2013.princeton.edu/papers/132044 Accessed 12 December 2016.
Gustaffson, J.-E.. & Nilsen, T. (2016). The impact of school climate and teacher quality om mathematics achievement: A difference-in-differences approach. In Nilsen, T. & Gustaffson, J.-E. (eds.) Teacher quality, instructional quality and student outcomes: Relationships across countries, cohorts and time. IEA Research for Education 2. Springer: USA. pp. 81-95.

55
Harris, D.N. & Sass, T.R. (2011). Teacher training, teacher quality and student achievement. Journal of Public Economics, 95 (7-8), 798-812. Available here: Teacher training, teacher quality and student achievement
Hill, H.C., Rowan, B. & Ball, D.L. (2005). Effects of teachers’ mathematical knowledge for teaching on student achievement. American Educational Research Journal, 42(2), 371-406. Available here: http://www.umich.edu/~lmtweb/files/hillrowanball.pdf
Hill, H.C., Charalambous, C.Y. & Chin, M. (2015). Teacher characteristics and student achievement: A comprehensive assessment. Centre for Education Policy Research, Harvard University. http://cepr.harvard.edu/files/cepr/files/hill_charalambous_chin_teacher_characteristics_aera2015.pdf Accessed 12 December 2016.
Institute of Mathematics & its Applications (2015). IMA position statement: Subject specialism teaching in mathematics. Available here: http://www.ima.org.uk/_db/_documents/IMA%20Position%20Statement%20-%20Subject%20Specialism%20Teaching%20in%20Mathematics.pdf Accessed 12 December 2016.
Ladd, H.F. & Sorensen, L.C. (2015). Do Masters degrees matter? Advanced degrees, career paths, and the effectiveness of teachers. CALDER Working Paper 136. Available here: http://www.caldercenter.org/sites/default/files/WP%20136_0.pdf Accessed 12 December 2016.
Martin, M.O., Mullis, I.V.S., Foy, P., & Hooper, M. (2016). TIMSS 2015 International Results in Science. Retrieved from Boston College, TIMSS & PIRLS International Student Center website. Available here: http://timssandpirls.bc.edu/timss2015/international-results/ Accessed 12 December 2016.
Metzler, J. and Woessmann, L. (2010). The impact of teacher subject knowledge on student achievement: Evidence from within-teacher within-student variation. IZA Discussion Paper No. 4999, Institute for the Study of Labor, Bonn. Available here: http://ftp.iza.org/dp4999.pdf
Mullis, I.V.S., Martin, M.O., Foy, P., & Hooper, M. (2016). TIMSS 2015 International Results in Mathematics. Retrieved from Boston College, TIMSS & PIRLS International Student Center website. Available here: http://timssandpirls.bc.edu/timss2015/international-results/ Accessed 12 December 2016.
OECD (2014). TALIS 2013 results: An international perspective on teaching and learning. Available here: http://www.oecd-ilibrary.org/docserver/download/8714021e.pdf?expires=1469435414&id=id&accname=oid033624&checksum=CC1B0197CAED89A76E129C91199CE190 Accessed 12 December 2016.
http://cepr.harvard.edu/files/cepr/files/hill_charalambous_chin_teacher_characteristics_aera2015.pdf

56
Rivkin, S.G., Hanushek, E.A. & Kain, J.F. (2005). Teachers, schools and academic achievement. Econometrica, 73(2), 417-458. Available here: http://econ.ucsb.edu/~jon/Econ230C/HanushekRivkin.pdf
Rockoff, J.E., Jacob, B.A., Kane, T.J. & Staiger, D.O. (2011) Can you recognize an effective teacher when you recruit one? Association for Education Finance and Policy. Available here: https://www.dartmouth.edu/~dstaiger/Papers/2011/Rockoff%20et%20al%20EFandP2011.pdf Accessed 12 December 2016.
Royal Society (2007). A state of the nation report: The UK’s science and mathematics teaching workforce. Available here: https://royalsociety.org/~/media/Royal_Society_Content/Education/policy/state-of-nation/SNR1_full_report.pdf Accessed 12 December 2016.
Sadler, P.M., Sonnert, G., Coyle, H.P., Cook-Smith, N. & Miller, J.L. (2013). The influence of teachers’ knowledge on student learning in middle school physical science classrooms. American Educational Research Journal, 50(5), 1020-1049. Available here: The Influence of Teachers’ Knowledge on Student Learning in Middle School Physical Science Classrooms
SCORE (2011). Subject specialist teaching in the sciences: Definitions, targets and data. Available here: http://www.score-education.org/media/7987/spec-teach.pdf Accessed 12 December 2016.
Shepherd, D.L. (2010). The impact of teacher subject knowledge on learner performance in South Africa: A within-pupil across-subject approach. Available here: http://www.iwaee.org/papers%20sito%202013/Shepherd.pdf Accessed 12 December 2016.
Slater, H., Davies, N.M. & Burgess, S. (2011) Do teachers matter? Measuring the variation in teacher effectiveness in England. Oxford Bulletin of Economics and Statistics, 74(5), 629-645. Available here: http://onlinelibrary.wiley.com/doi/10.1111/j.1468-0084.2011.00666.x/pdf
Smithers, A. & Robinson, P. (2005). Physics in schools and colleges: Teacher deployment and student outcomes. Carmichael Press: Liverpool. Available here: http://www.buckingham.ac.uk/wp-content/uploads/2010/11/physicsprint.pdf
Walker, M., Straw, S., Jeffes, J., Sainsbury, M., Clarke, C. & Thom, G. (2013). Evaluation of the Mathematics Specialist Teacher (MaST) Programme. DfE commissioned research report. Available here: https://www.nfer.ac.uk/publications/PMSZ01/PMSZ01.pdf

57
Annex A: Percentage of hours taught by teachers with a relevant post A-level qualification as published in the School Workforce SFR
Table 10: Proportion of hours taught in a typical week to pupils in years 7 to 13 by a teacher with a relevant post A-level qualification
Subject 2010/11 2011/12 2012/13 2013/14 2014/15 2015/16 Mathematics 83.6 84.0 82.1 82.7 79.8 82.0 English 88.4 87.5 84.7 84.8 83.0 86.6 Physics 78.9 75.9 73.9 74.5 71.8 74.6 Chemistry 79.8 82.1 79.8 80.4 80.2 81.3 Biology 91.2 89.0 86.2 85.6 86.2 92.1 Combined/General Science 90.7 94.2 90.7 90.4 89.0 94.9 Other Sciences 91.0 88.2 81.6 83.8 81.9 89.2 History 89.6 87.4 84.9 85.4 85.3 89.0 Geography 88.8 83.7 82.3 82.4 83.3 85.7 French 82.6 79.8 74.6 75.7 75.3 81.6 German 78.0 75.2 73.6 73.2 75.3 78.4 Spanish 65.7 59.8 57.8 57.5 57.0 60.8 Other Modern Languages 35.7 36.5 39.7 39.7 39.3 44.0 Design and technology 88.6 85.0 82.3 82.6 81.1 83.4
Electr. / Systems and Control 90.9 86.5 83.1 86.6 86.7 87.4 Food Technology 81.6 79.0 73.2 76.2 74.3 76.2 Graphics 92.3 88.6 89.0 86.7 83.4 86.3 Resistant Materials 92.8 89.3 87.3 87.1 86.2 89.5 Textiles 89.5 84.4 84.2 82.5 82.4 83.5
Other/Combined Technology 87.8 83.6 81.5 80.9 79.4 83.6 Engineering 25.2 22.9 22.0 23.2 21.9 23.9 ICT 51.7 56.0 59.2 60.9 56.0 61.6 Business / Economics 78.6 78.3 77.4 77.3 76.7 84.8 Religious Education 72.8 72.9 71.1 71.6 70.4 72.8 Music 95.5 93.8 88.4 89.0 89.2 95.5 Drama 71.2 71.9 72.9 70.9 70.6 75.9 Art and design 93.3 91.8 89.1 89.0 89.0 94.1 Media Studies 27.2 28.4 31.7 32.5 32.1 34.2 Physical education 91.2 89.4 88.0 89.0 89.3 92.8 Citizenship 17.1 18.7 20.8 19.7 17.5 19.5
Source: DfE, School Workforce SFRs 2011-2016.

58
Annex B: Percentage of hours taught by teachers with a relevant post A-level qualification by key stage
Table 11: Proportion of hours taught in a typical week to pupils in years 7 to 9 by a teacher with a relevant post A-level qualification using a matched database of teacher qualifications and the TSM
subject mapping
Subject 2010/11 2011/12 2012/13 2013/14 2014/15 2015/16 Mathematics 85.6 86.3 86.9 86.9 86.6 85.5 English 88.1 88.8 88.7 88.5 88.1 87.9 Any Science 96.3 96.4 96.5 96.6 96.4 96.2
Physics 64.9 66.8 69.6 72.5 68.0 66.2 Chemistry 79.5 80.5 81.9 83.3 81.9 79.6 Biology 89.6 84.3 86.9 85.3 85.9 87.2 Comb/General Science 97.2 97.4 97.4 97.5 97.5 97.5
History 87.1 86.4 86.3 86.2 86.5 86.9 Geography 87.1 86.8 86.3 85.7 84.4 83.3 Humanities 70.7 68.8 69.5 69.7 68.4 69.4 Modern Foreign Languages 77.3 76.9 76.8 76.7 76.4 76.2
French 82.5 82.3 83.0 83.5 83.3 83.4 German 76.4 76.0 76.8 76.4 77.4 78.6 Spanish 60.8 61.0 59.5 59.6 60.2 59.9
Design & Technology 87.5 88.4 88.9 89.4 89.8 90.5
Food 34.9 35.8 36.6 35.1 35.2 32.2 Computing 57.0 58.5 60.3 62.0 63.7 65.7 Business Studies 57.9 59.8 71.0 67.5 67.1 69.0 Religious Education 71.9 72.6 73.1 72.9 72.3 71.5 Classics 69.8 66.8 70.8 72.4 71.3 71.7 Music 95.4 95.8 96.2 96.0 96.4 96.5 Drama 70.7 70.7 71.7 72.8 74.2 75.6 Art & Design 93.1 93.4 93.7 94.2 94.6 94.8 Physical Education 92.0 92.9 93.8 94.4 95.0 95.6 EBacc 87.1 87.3 87.4 87.5 87.1 86.8 Total 85.2 85.6 86.0 86.3 86.4 86.3
Source: School Workforce Census, 2010-2015.

59
Table 12: Proportion of hours taught in a typical week to pupils in years 10 to 11 by a teacher with a relevant post A-level qualification using a matched database of teacher qualifications and the TSM
subject mapping
Subject 2010/11 2011/12 2012/13 2013/14 2014/15 2015/16 Mathematics 89.1 89.9 90.7 91.2 91.1 91.2 English 92.9 93.5 93.8 94.2 93.8 94.3 Any Science 96.0 96.2 95.9 95.6 95.6 95.4
Physics 76.2 77.5 76.9 76.4 74.7 73.3 Chemistry 85.6 86.3 85.0 85.0 85.5 84.1 Biology 92.8 92.8 93.0 91.0 92.4 93.4 Comb/General Science 98.1 98.4 98.5 98.6 98.7 98.8
History 95.4 95.4 95.3 95.3 95.3 95.5 Geography 96.2 95.7 95.7 95.7 95.2 94.5 Humanities 64.6 60.3 62.9 64.6 62.9 58.7 Modern Foreign Languages 83.4 83.3 82.8 82.4 82.5 82.2
French 89.3 89.7 89.3 89.6 89.3 89.6 German 84.3 84.6 85.4 84.1 85.4 86.0 Spanish 69.6 69.3 67.9 67.5 68.6 68.2
Design & Technology 91.1 92.1 93.4 93.8 94.1 94.5 Food 40.7 41.3 40.9 39.7 40.8 39.5 Computing 61.8 63.4 65.7 68.1 70.6 72.4 Business Studies 75.4 77.8 78.8 79.0 79.0 80.2 Religious Education 76.2 76.1 77.4 78.3 78.8 78.1 Classics 72.4 72.0 74.1 73.2 73.3 73.2 Music 97.6 97.5 97.5 97.3 97.9 98.3 Drama 76.8 77.8 80.2 81.1 82.6 84.5 Art & Design 95.5 95.7 96.2 96.3 96.5 96.9 Physical Education 92.4 93.5 94.1 94.9 95.4 96.0 EBacc 92.3 92.6 92.7 92.8 92.8 92.8
Total 88.0 88.8 89.5 90.0 90.4 90.8
Source: School Workforce Census, 2010-2015.

60
Table 13: Proportion of hours taught in a typical week to pupils in years 12 to 13 by a teacher with a relevant post A-level qualification using a matched database of teacher qualifications and the TSM
subject mapping
Subject 2010/11 2011/12 2012/13 2013/14 2014/15 2015/16 Mathematics 95.7 96.0 96.6 96.8 96.5 96.7 English 96.2 96.7 96.8 96.7 96.5 97.0 Any Science 94.0 93.9 93.9 94.0 93.8 93.9
Physics 90.1 89.0 88.3 88.8 87.8 87.9 Chemistry 93.0 93.3 93.3 92.8 93.4 93.0 Biology 96.2 96.5 96.8 97.2 96.8 97.3 Comb/General Science 97.5 98.2 98.5 98.2 98.7 98.4
History 96.9 97.1 97.2 97.1 97.4 97.8 Geography 97.9 97.3 98.0 98.0 98.2 98.0 Humanities 36.5 25.0 36.4 39.5 42.8 40.9 Modern Foreign Languages 86.8 87.1 86.6 86.1 85.9 84.9
French 90.7 92.0 91.7 92.3 92.5 92.1 German 89.7 89.8 89.5 88.2 87.7 87.8 Spanish 76.4 75.5 75.6 74.5 75.3 73.6
Design & Technology 89.9 91.0 92.3 93.1 93.0 93.3 Food 47.3 48.5 48.1 48.3 45.3 46.8 Computing 66.6 68.2 71.6 74.7 75.2 77.2 Business Studies 81.7 83.3 84.5 84.7 85.0 85.0 Religious Education 86.8 88.2 88.7 89.0 89.1 89.6 Classics 72.9 74.8 76.2 74.9 74.0 72.8 Music 96.0 96.4 96.7 97.4 97.8 97.8 Drama 78.1 78.5 81.1 81.3 82.1 83.5 Art & Design 94.9 95.2 95.8 95.9 96.3 96.3 Physical Education 91.8 92.4 93.0 93.6 94.7 94.7 EBacc 94.4 94.5 94.8 94.9 94.8 94.9 Total 90.1 90.7 91.4 91.9 92.0 92.4
Source: School Workforce Census, 2010-2015.

61
Annex C: Underlying data for Figure 1 The Trends and International Mathematics and Science Study (Martin et al. 2016, Mullis et al. 2016) allows for making international comparisons of the extent of specialist teaching. The data was collected in 2015 and the teachers were asked to indicate:
- whether they held a major in Primary education, and separately; - whether they held a major or a specialisation in Mathematics / Science.
Teachers with neither of the two were further asked whether they held a different post-secondary qualification or whether they held no post-secondary qualification at all.
Table 14 reports the average international figures as well as the figures for England for Mathematics. Table 15 reports the equivalent figures for Science.
Table 14: Proportion of year 5 and year 9 pupils in England and internationally taught Mathematics by the qualifications of their teachers
Year 5 Year 9
Eng Avg Diff Eng Avg Diff
Major (or Specialisation) in Mathematics and Major in Education
12 (2.6)
27 (0.4) Neg 44
(4.1) 36
(0.6) =
Major (or Specialisation) in Mathematics but No Major in Education
4 (1.7)
14 (0.3) Neg 37
(4.3) 36
(0.5) =
No Major (or Specialisation) in Mathematics but Major in Education
57 (4.3)
46 (0.5) Pos 4
(1.5) 13
(0.4) Neg
All other majors
27 (3.8)
8 (0.3) Pos 15
(3.0) 13
(0.4) =
No post-secondary qualification
0 (0.0)
5 (0.2) Neg 1
(0.5) 2
(0.2) =
Self-reported by teachers. Column percentages. The data were collected in 2015. Year 5 translates to the ‘4th grade’ internationally and year 9 to the ‘8th grade’. Standard errors appear in parentheses; these are percentages for readability reported without the % sign. Because of rounding some results may appear inconsistent. ‘Eng’ stands for England, ‘Avg’ for the average across all included countries and ‘Diff’ for the difference between the two. This column has the value of ‘=’ where the 95% confidence interval around the value for England and 95% confidence interval around the value for the average intersect. ‘Pos’ means a positive difference (the value for England is higher than the average) and ‘Neg’ means a negative difference (the value for England is lower than the average) with the 95% confidence intervals not overlapping. The standard errors used for the calculation of the confidence interval are taken from the source data.
Source: Mullis et al. 2016.

62
Table 15: Proportion of year 5 and year 9 pupils in England and internationally taught Science by the qualifications of their teachers
Year 5 Year 9
Eng Avg Diff Eng Avg Diff
Major (or Specialisation) in Science and Major in Education
17 (3.0)
23 (0.5) = 47
(3.0) 32
(0.5) Pos
Major (or Specialisation) in Science but No Major in Education
10 (2.6)
15 (0.3) = 49
(3.1) 47
(0.5) =
No Major (or Specialisation) in Science but Major in Education
52 (4.0)
49 (0.5) = 1
(0.4) 11
(0.3) Neg
All other majors
21 (3.1)
9 (0.3) Pos 3
(1.0) 7
(0.3) Neg
No post-secondary qualification
0 (0.0)
5 (0.2) Neg 0
(0.0) 2
(0.2) Neg
Self-reported by teachers. Column percentages. The data were collected in 2015. Year 5 translates to the ‘4th grade’ internationally and year 9 to the ‘8th grade’. Standard errors appear in parentheses; these are percentages for readability reported without the % sign. Because of rounding some results may appear inconsistent. The year 9 data for England are available for at least 70% but less than 85% of the students. ‘Eng’ stands for England, ‘Avg’ for the average across all included countries and ‘Diff’ for the difference between the two. This column has the value of ‘=’ where the 95% confidence interval around the value for England and 95% confidence interval around the value for the average intersect. ‘Pos’ means a positive difference (the value for England is higher than the average) and ‘Neg’ means a negative difference (the value for England is lower than the average) with the 95% confidence intervals not overlapping. The standard errors used for the calculation of the confidence interval are taken from the source data.
Source: Martin et al. 2016.

63
Annex D: Subject classifications The subject classification used in this paper is consistent with the classification used in the 2016/17 Teacher Supply Model (Table 16). A relevant qualification is such that it is tied to a subject from the same subject group, e.g. a ‘Performing Arts’ teacher with a degree in ‘Drama’ is classified as a ‘specialist’.
Table 16: TSM subject mapping
Subject group Coverage Art & Design Includes Applied Art & Design, Art & Design, and Art.
Biology Includes Biology, Botany, Zoology, Ecology, Combined/General Science (Biology), and Environmental Science.
Business Studies
Includes Applied Business Studies, Accountancy, Commercial & Business Studies, Industrial Studies, other Business and Commercial subjects.
Chemistry Includes Chemistry and Combined/General Science (Chemistry).
Classics Includes Classics and Ancient Languages such as Ancient Greek, Ancient Hebrew, and Latin.
Computing Includes applied ICT, Computer Science, and Information & Communication Technology.
Design & Technology
Includes Design & Technology, Construction and Building, Craft and D & T, Electronics, Engineering, Graphics, Resistant Materials, Manufacturing, Systems & Control, and Textiles.
Drama Includes Drama and Performing Arts. English Includes English Language and Literature. Food Includes Food Technology plus Catering & Hospitality. Geography Includes Geography and Geology. History Includes History. Mathematics Includes Mathematics and Statistics. Modern Foreign Languages
Includes French, German, Spanish, Arabic, Bengali, Chinese, Welsh, Modern Greek, Italian, and any other Modern Languages.
Music Includes Music.
Others Includes Child Development, Citizenship, Dance, Economics, Law, Media Studies, Other Social Studies, Other Technology, Politics, Psychology, Sociology, and Social Sciences among others.
Physical Education Includes Physical Education and Sports.
Physics Includes Physics and Combined/General Science (Physics). Religious Education Includes Religious Education and Philosophy.
Source: 2016/17 Teacher Supply Model.
There are several exceptions to this rule. General/Combined Science is used as a separate category to capture hours taught because that is how the data is being collected in the School Workforce Census and it is impossible to further split this into Physics, Biology and Chemistry. Assumptions about the split are made in the TSM and the teaching is redistributed into the three subjects. While this approach is valid in the TSM, due to the addition of the ‘specialism’ element’ it cannot be applied here. It would effectively end up assigning ‘specialism’ of General/Combined Science teachers randomly.

64
Because of this uncertainty, a General/Combined Science teacher is classified as a ‘specialist’ regardless of whether they hold a relevant post A-level qualification in Biology, Chemistry, Physics or General Science. It is understood that this might lead to an overestimate of the degree of ‘specialist’ teaching of Science yet there is no way to overcome the data limitations. Since the data should be interpreted with some caution, caveats are inserted in multiple places throughout the report.
Similarly to General/Combined Science, there is a separate category for Humanities which is redistributed into Geography and History in the Teacher Supply Model. In this report, Humanities teachers with post A-level qualifications in both Geography and History are classified as Humanities ‘specialists’.
Others is a marginal category in the TSM including a variety of subjects. Holding a qualification in one of them does not necessarily make a teacher a specialist in teaching other subjects classed as Others. Others are therefore omitted from all analysis of subject ‘specialism’.
Similarly, Modern Foreign Languages are treated as a separate category in the TSM but when assessing subject ‘specialism’ a qualification in one foreign language does not make a teacher a specialist in any other foreign languages, e.g. holding a degree in German does not make one a ‘specialist’ in Spanish. In this paper, Modern Foreign Languages are therefore further split four categories: French, German and Spanish are homogeneous categories where ‘specialism’ can be more sensibly assessed and Other Modern Foreign Languages is a small marginal category excluded from subject ‘specialism’ analysis.
Secondary subjects that are classed as being EBacc subjects include: Mathematics, English, Biology, Chemistry, Physics, General/Combined Science, Geography, History, Humanities and Modern Foreign Languages.

Annex E: Qualifications of ‘non-specialists’ Table 17: Proportion of hours taught in a typical week in November 2015 to pupils in years 7 to 13 by teachers without a relevant post A-level
qualification by the subject(s) of the post A-level qualifications they hold
Row percentages, e.g. the 47% figure near the top left corner of the table means that 47% of ‘non-specialist‘ teaching of Mathematics was conducted by teachers with a post A-level qualification in a Science subject. A teacher might have more than one qualification so the row percentages do not sum to 100%. More information about the subject classification is provided in Annex D. Higher colour intensity relates to reflects higher numbers.
Source: School Workforce Census, 2015.
'Specialism' subject
Mat
hem
atic
s
Any
Sci
ence
Bio
logy
hem
Cis
tyr
Pyhs
cis
Eng
lish
His
toyr
Gap
hyeo
gr
umH
aniti
es
elR
igio
us E
duca
tion
lC
sas
cis
Dr
maa
Mus
ic
Art
&es
Dig
n
esD
ign
& T
echn
olog
y
omC
putin
g
Bus
ines
s S
tudi
es
Phy
sica
l Edu
catio
n
Food
Fren
ch
Gm
eran
Spa
nish
tO
her M
FL
tO
she
r
Mathematics 0% 47% 30% 14% 15% 5% 6% 9% 14% 4% 0% 2% 3% 6% 12% 7% 8% 25% 1% 3% 1% 1% 2% 57%Comb/Gen Science 14% 0% 0% 0% 0% 6% 5% 5% 10% 4% 0% 2% 3% 11% 11% 6% 10% 19% 1% 2% 1% 1% 1% 66%Biology 6% 81% 0% 58% 39% 2% 2% 20% 21% 4% 0% 0% 0% 2% 8% 2% 2% 4% 1% 0% 1% 0% 1% 46%Chemistry 2% 95% 87% 0% 9%
6% 94% 73% 45% 0%1%1%
1% 8% 9%1% 9% 10%
1%2%
0%0%
0%0%
0% 1% 3%1% 2% 8%
1% 1% 5%1% 2% 4%
3%2%
0%0%
0%0%
0%0%
0%0%
35%33%Physics
English 3% 12% 8% 3% 2% 0% 18% 6% 23% 9% 2% 16% 4% 7% 6% 2% 5% 10% 0% 7% 3% 2% 4% 57%History 5% 22% 9% 4% 2% 11% 0% 22% 22% 20% 2% 4% 2% 5% 4% 1% 7% 11% 1% 3% 2% 1% 3% 71%Geography 4% 20% 17% 4% 3% 8% 33% 0% 33% 15% 1% 2% 2% 4% 4% 2% 10% 21% 1% 2% 1% 1% 2% 59%Humanities 6% 12% 9% 3% 2% 12% 0% 0% 0% 33% 1% 4% 3% 7% 6% 4% 12% 9% 1% 4% 1% 2% 3% 56%
augh
t
Religious Education 4% 17% 8% 3% 3% 12% 31% 15% 44% 0% 1% 3% 3% 5% 5% 2% 6% 9% 1% 4% 2% 1% 3% 64%
t t Classics 3% 4% 1% 1% 1% 31% 39% 6% 42% 14% 0% 2% 0% 3% 3% 1% 3% 1% 0% 21% 8% 6% 19% 42%
Sub
jec Drama 1% 8% 6% 2% 1% 34% 6% 2% 7% 3% 1% 0% 29% 10% 9% 1% 1% 24% 0% 2% 0% 0% 1% 49%
Music 3% 15% 8% 5% 6% 15% 4% 3% 7% 5% 1% 33% 0% 13% 14% 4% 3% 14% 0% 5% 2% 2% 2% 48%Art & Design 4% 17% 8% 8% 3% 32% 10% 4% 13% 3% 1% 13% 9% 0% 12% 3% 8% 12% 3% 2% 1% 0% 1% 49%Design & Technology 7% 20% 13% 6% 6% 13% 3% 5% 8% 2% 1% 3% 2% 17% 0% 8% 21% 10% 2% 2% 0% 0% 1% 60%Computing 19% 25% 11% 8% 11% 5% 4% 8% 11% 3% 0% 2% 3% 14% 19% 0% 39% 9% 1% 3% 1% 1% 1% 54%Business Studies 5% 31% 13% 7% 5% 7% 11% 24% 33% 4% 1% 2% 1% 7% 10% 26% 0% 15% 1% 3% 2% 1% 2% 66%Physical Education 6% 23% 8% 12% 11% 8% 7% 10% 16% 4% 0% 17% 2% 7% 8% 3% 7% 0% 1% 2% 1% 1% 1% 60%Food 3% 15% 4% 8% 3% 4% 2% 2% 3% 1% 0% 2% 0% 65% 71% 1% 26% 4% 0% 0% 0% 0% 0% 40%French 2% 3% 3% 1% 1% 30% 5% 2% 6% 3% 4% 1% 1% 2% 1% 1% 7% 2% 0% 0% 25% 22% 60%
51%49%
29%32%30%
GermanSpanish
3%2%
5%3%
3%2%
1%1%
1%0%
26%30%
4%5%
1%1%
4%5%
2%2%
3%5%
1%1%
1%1%
1%1%
2%1%
0%0%
7%7%
2%2%
0%0%
61% 0% 9%59% 16% 0%
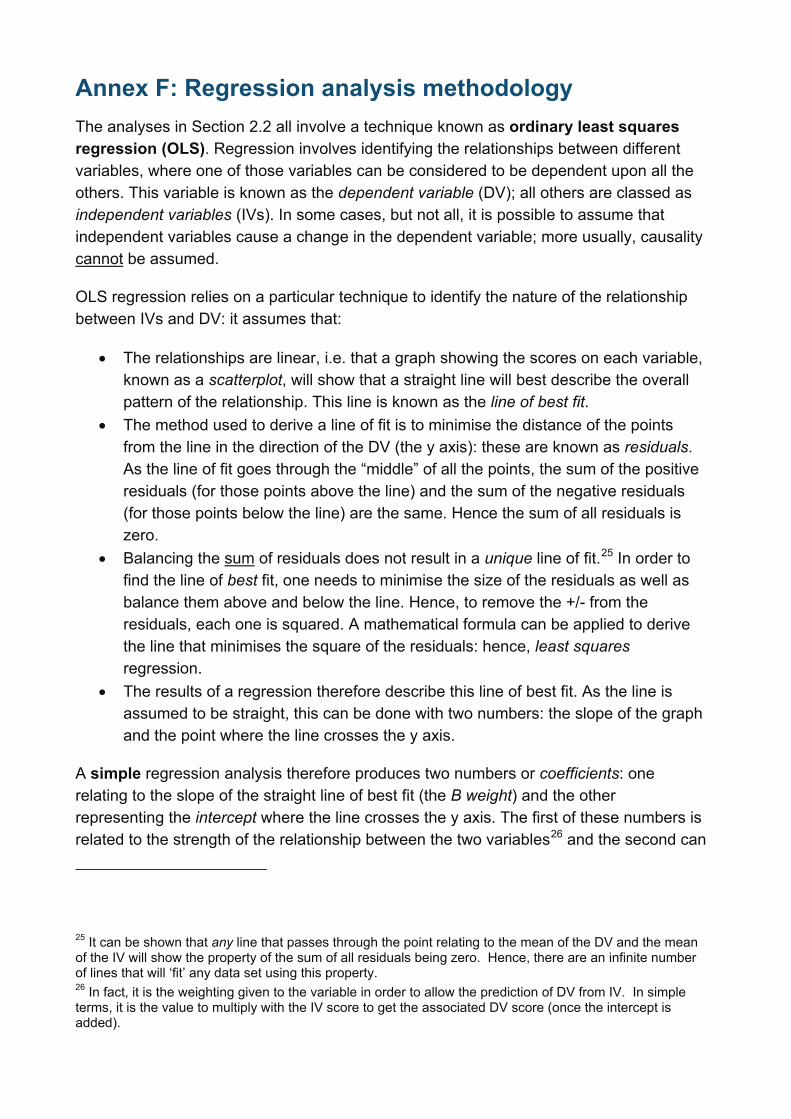
Annex F: Regression analysis methodology The analyses in Section 2.2 all involve a technique known as ordinary least squares regression (OLS). Regression involves identifying the relationships between different variables, where one of those variables can be considered to be dependent upon all the others. This variable is known as the dependent variable (DV); all others are classed as independent variables (IVs). In some cases, but not all, it is possible to assume that independent variables cause a change in the dependent variable; more usually, causality cannot be assumed.
OLS regression relies on a particular technique to identify the nature of the relationship between IVs and DV: it assumes that:
• The relationships are linear, i.e. that a graph showing the scores on each variable, known as a scatterplot, will show that a straight line will best describe the overall pattern of the relationship. This line is known as the line of best fit.
• The method used to derive a line of fit is to minimise the distance of the points from the line in the direction of the DV (the y axis): these are known as residuals. As the line of fit goes through the “middle” of all the points, the sum of the positive residuals (for those points above the line) and the sum of the negative residuals (for those points below the line) are the same. Hence the sum of all residuals is zero.
• Balancing the sum of residuals does not result in a unique line of fit.25 In order to find the line of best fit, one needs to minimise the size of the residuals as well as balance them above and below the line. Hence, to remove the +/- from the residuals, each one is squared. A mathematical formula can be applied to derive the line that minimises the square of the residuals: hence, least squares regression.
• The results of a regression therefore describe this line of best fit. As the line is assumed to be straight, this can be done with two numbers: the slope of the graph and the point where the line crosses the y axis.
A simple regression analysis therefore produces two numbers or coefficients: one relating to the slope of the straight line of best fit (the B weight) and the other representing the intercept where the line crosses the y axis. The first of these numbers is related to the strength of the relationship between the two variables26 and the second can
25 It can be shown that any line that passes through the point relating to the mean of the DV and the mean of the IV will show the property of the sum of all residuals being zero. Hence, there are an infinite number of lines that will ‘fit’ any data set using this property. 26 In fact, it is the weighting given to the variable in order to allow the prediction of DV from IV. In simple terms, it is the value to multiply with the IV score to get the associated DV score (once the intercept is added).

67
be interpreted as the average score of the DV once the effects of the IV have been taken into account. Both these coefficients can be tested to see if they occur due to random variation in scores, or whether they are likely to derive from a real-world relationship between the variables. This is called testing for statistical significance, and is usually performed using a t test.
Simple regression analyses in this paper.
Analyses in Sections 2.2.2-2.2.5 involve simple OLS regression. Figures 6-11 show lines of best fit for the relationships found for each academic subject and year. The text identifies whether the relationships shown are reliable. Please note: some graphs have more than one regression analysis plotted on the same axes (and hence show more than one line of best fit). Also due to problems in the scaling involved, none of these graphs show intercept values: in these analyses, the intercept value is not of great importance and can be difficult to interpret accurately so its absence from the graph is not a matter for concern.
Multiple regression analysis in this paper.
When more than one IV is included in a regression analysis, the technique is known as multiple regression. In such an analysis, it is possible to determine the separate effects of each variable without the relationship being confounded by the effects of other variables. In Section 2.2.6, such a set of regressions is reported.
Multiple regressions include a suite of IVs that all have an effect on the DV of interest. Each IV is assigned a B weight coefficient, but only one intercept is assigned to the whole analysis.27 Each B weight identifies the relationship between a particular IV and the DV, with the effect of all other variables removed. The coefficients in a multiple regression of the sort in Section 2.2.6 therefore show the independent effects of the IVs on the DV. The intercept term can be especially difficult to interpret, but generally relates in some way to the average score of the DV with the effects of all the IVs removed.
Section 2.2.6 reports 25 separate multiple regression analyses, one for every combination of academic year and subject. (There are five academic years – 2010/11 through to 2014/15 – and five academic subjects; hence 5 x 5 = 25 analyses.) It was deemed appropriate to examine the effects of different academic years to ascertain whether or not the relationships shown differed year-on-year; the differing relationships shown by the specific academic subjects was partly the point of the analysis.) In each of these analyses, the dependent variable was the KS2-KS4 ‘value-added’ score for the
27 This naturally results from the least-squares procedure: the straight line of best fit passes through a multidimensional space (k dimensions for k IVs), but will still only intercept the y axis at one point. Hence, the technique results in k slopes (considering each dimension in its bivariate relationship) but just one intercept.

68
pupils in each school. All pupils are included in the English and Mathematics subject area value added measures. However, only the pupils that have taken the required qualifications at the end of key stage 4 are included in the Science, Language and Humanities subject area value added measures. A suite of variables was included as IVs, but only one was of primary interest: the proportion of hours taught in a given subject by a ‘specialist’ teacher in those schools. All other variables were included as control variables: that is the effects of these variables were removed from the relationship between specialist hours and value-added scores.28
All the continuous IVs were transformed using a quintile function prior to their inclusion in the regression model. This means that for each IV all schools were first ordered according to their value in this variable. The bottom 20% of schools were then assigned the value 1, the next 20% of schools were assigned the value 2 and so on until the top 20% of schools were reached and all coded as 5. Where data were missing a value was imputed by the median (third quintile). The primary purpose of this transformation was to provide a common framework for representing numeric IVs in the 25 models. This helped to deal with the fact that these variables often have very different distributions and it also removed the risk of extreme observations skewing the model outputs.
In each model, the coefficients of the transformed variables should be interpreted as the expected difference in the typical value added scores of schools in two neigbouring quintiles. For example, if the coefficient is 0.3 then we expect a school in the lowest quintile to have, on average, the value added score lower by 0.3 than an otherwise equivalent school from the second lowest quintile. The estimate is the same regardless of which two neighbouring quintiles are being compared.
Because of the particular importance of the variable capturing the proportion of ‘specialist’ teaching we considered several options of how it could be included in the model. A big challenge stems from the fact that very few schools experience very low levels of ‘non-specialist’ teaching in the analysed subjects (see Table 18). If we simply included this variable as a percentage in its original form then the data from the few schools with extremely low values could skew the results of the model. An alternative method would exclude these extreme values and build the models on the rest of the data only but in such a case we would end up deleting the small amount of information about schools with little ‘specialist’ teaching that we have.
The use of quintiles was selected as the most appropriate transformation method because it provides a way of utilising the information contained in this data: if a monotone relationship exists between an IV and a DV in the data then a transformation to quintiles retains this relationship in a simplified yet more robust form. Since the simplification could
28 All IVs were included simultaneously into the regression equation: hence this was a case of OLS multiple regression.
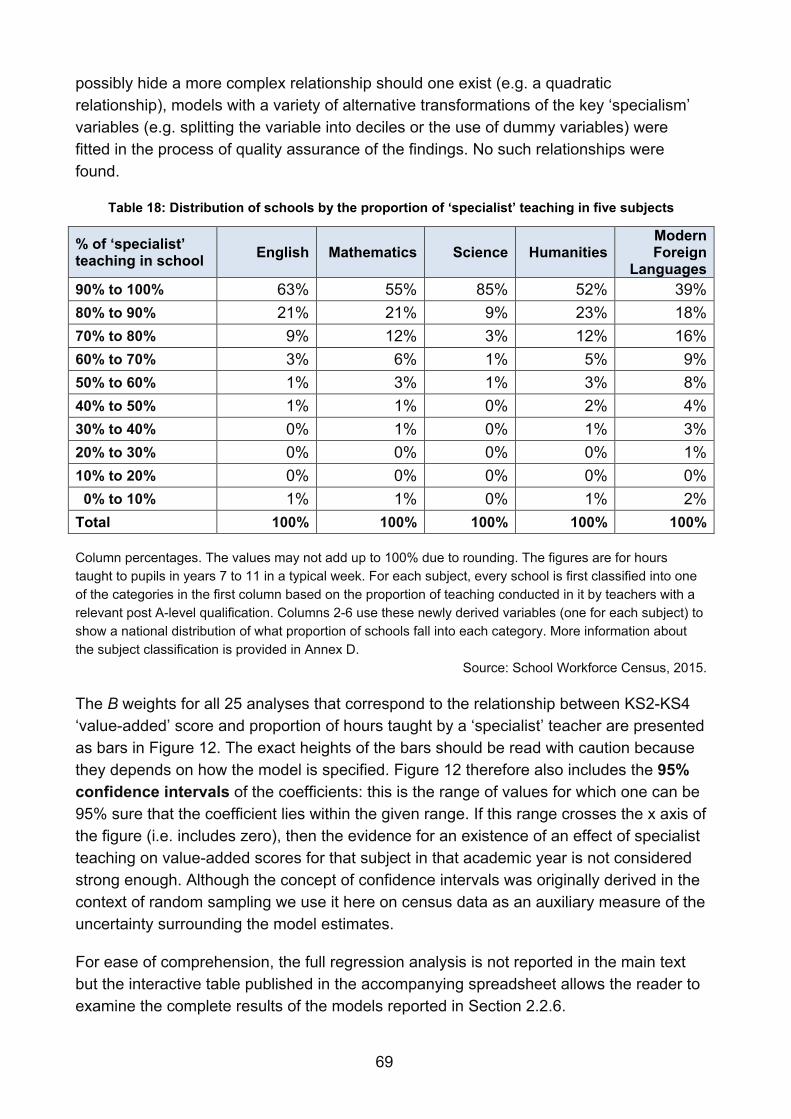
69
possibly hide a more complex relationship should one exist (e.g. a quadratic relationship), models with a variety of alternative transformations of the key ‘specialism’ variables (e.g. splitting the variable into deciles or the use of dummy variables) were fitted in the process of quality assurance of the findings. No such relationships were found.
Table 18: Distribution of schools by the proportion of ‘specialist’ teaching in five subjects
% of ‘specialist’ teaching in school English Mathematics Science Humanities
Modern Foreign
Languages 90% to 100% 63% 55% 85% 52% 39% 80% to 90% 21% 21% 9% 23% 18% 70% to 80% 9% 12% 3% 12% 16% 60% to 70% 3% 6% 1% 5% 9% 50% to 60% 1% 3% 1% 3% 8% 40% to 50% 1% 1% 0% 2% 4% 30% to 40% 0% 1% 0% 1% 3% 20% to 30% 0% 0% 0% 0% 1% 10% to 20% 0% 0% 0% 0% 0% 0% to 10% 1% 1% 0% 1% 2% Total 100% 100% 100% 100% 100%
Column percentages. The values may not add up to 100% due to rounding. The figures are for hours taught to pupils in years 7 to 11 in a typical week. For each subject, every school is first classified into one of the categories in the first column based on the proportion of teaching conducted in it by teachers with a relevant post A-level qualification. Columns 2-6 use these newly derived variables (one for each subject) to show a national distribution of what proportion of schools fall into each category. More information about the subject classification is provided in Annex D.
Source: School Workforce Census, 2015.
The B weights for all 25 analyses that correspond to the relationship between KS2-KS4 ‘value-added’ score and proportion of hours taught by a ‘specialist’ teacher are presented as bars in Figure 12. The exact heights of the bars should be read with caution because they depends on how the model is specified. Figure 12 therefore also includes the 95% confidence intervals of the coefficients: this is the range of values for which one can be 95% sure that the coefficient lies within the given range. If this range crosses the x axis of the figure (i.e. includes zero), then the evidence for an existence of an effect of specialist teaching on value-added scores for that subject in that academic year is not considered strong enough. Although the concept of confidence intervals was originally derived in the context of random sampling we use it here on census data as an auxiliary measure of the uncertainty surrounding the model estimates.
For ease of comprehension, the full regression analysis is not reported in the main text but the interactive table published in the accompanying spreadsheet allows the reader to examine the complete results of the models reported in Section 2.2.6.

70
Glossary Abbreviation Description
CVA Contextual Value Added
DfE Department for Education
EBacc The English Baccalaureate
IMA Institute of Mathematics and its Applications
ITT Initial Teacher Training
KS Key stage
MFL Modern Foreign Languages
SCORE Science Community Representing Education
SWC School Workforce Census
TALIS The OECD Teaching and Learning International Survey
TIMSS The Trends and International Mathematics and Science Study
TSM Teacher Supply Model
VA Value added
71
© Crown copyright 2016
This publication (not including logos) is licensed under the terms of the Open Government Licence v3.0 except where otherwise stated. Where we have identified any third party copyright information you will need to obtain permission from the copyright holders concerned.
To view this licence: visit www.nationalarchives.gov.uk/doc/open-government-licence/version/3 email [email protected] write to Information Policy Team, The National Archives, Kew, London, TW9 4DU
About this publication: enquiries www.education.gov.uk/contactus download www.gov.uk/government/publications
Reference: DFE-00348-2016
Follow us on Twitter: @educationgovuk
Like us on Facebook: facebook.com/educationgovuk