
ASME2011 - Eric v6.pptx
22
A New Approach for Microstructure Characterization of Porous Fuel Cell Materials: “Selection of Representative Volume Elements” 9 th ASME International Conference on Fuel Cell Science, Engineering and Technology – Washington, D.C. Monday, 8 th August 2011 E. A. Wargo , A. C. Hanna, A. Cecen, S. R. Kalidindi and E. C. Kumbur Electrochemical Energy Systems Laboratory Mechanics of Microstructures Group Department of Mechanical Engineering Drexel University, Philadelphia PA www.mem.drexel.edu/energy 2 μm 3
-
Upload
ahmet-cecen -
Category
Documents
-
view
22 -
download
0
Transcript of ASME2011 - Eric v6.pptx

A New Approach for Microstructure
Characterization of Porous Fuel Cell Materials:
“Selection of Representative Volume Elements”
9th ASME International Conference on Fuel Cell Science,
Engineering and Technology – Washington, D.C.
Monday, 8th August 2011
E. A. Wargo, A. C. Hanna, A. Cecen,
S. R. Kalidindi and E. C. Kumbur
Electrochemical Energy Systems Laboratory
Mechanics of Microstructures Group
Department of Mechanical Engineering
Drexel University, Philadelphia PA
www.mem.drexel.edu/energy 2 µm3

Pore Body
Pore Throat
Solid
Solid
Void Space
Gostick et al, J. Power Sources, 2010
• Select the best possible small representative volume
elements (RVEs) that accurately reflect the structural
features and transport properties of the microstructure.
GOAL
A. Pore Network Modeling (PNM)
Limitations:
• Idealized and simplified
geometry
• May misrepresent true
material structure
B. Pore-scale modeling applied
to real microstructures
(e.g., LB or VOF methods)
Limitations:
• Computationally expensive
• Limited to only small volumes
• Accuracy depends on volume
selected
Material Structure
Full Dataset
Volume
Random
Volume
Selection of pore scale modeling domain is very important
Pore-Scale Modeling Efforts

• RVE should ideally capture:
– material structure in a smaller volume
– key structural and transport properties
Method of Approach
Dataset
Acquisition
Image Processing
& Segmentation
Full Material
Dataset
RVE Selection
from Full Dataset
Representative Volume Elements (RVEs)
RVE
WSVE Set
SVE
SVE
SVE
Micro-porous layer (MPL) selected as a test case.
Full Dataset
Volume
Statistical Volume
Element (SVE)
• We optimally select a set of weighted
statistical volume elements
(WSVE Set approach)

Adapted from: Iwai et al., J. of P. Sources, 2010
• 1.5 µm protective Pt layer
• SEM resolution = 9.8nm/pixel
• Slice thickness = 20nm
• 150 slices total
2 µm3
Dataset 1
Dataset 3 Dataset 4
Dataset 2
x
y
z
Adapted from:
Iwai et al., J. of P. Sources, 2010
Platinum
coating
Imaged
surface
Target
volume
Adapted from: Iwai et al., J. of P. Sources, 2010
Platinum coating
Imaged surface
Target volume
Data Acquisition via FIB-SEM (MPL Sample)
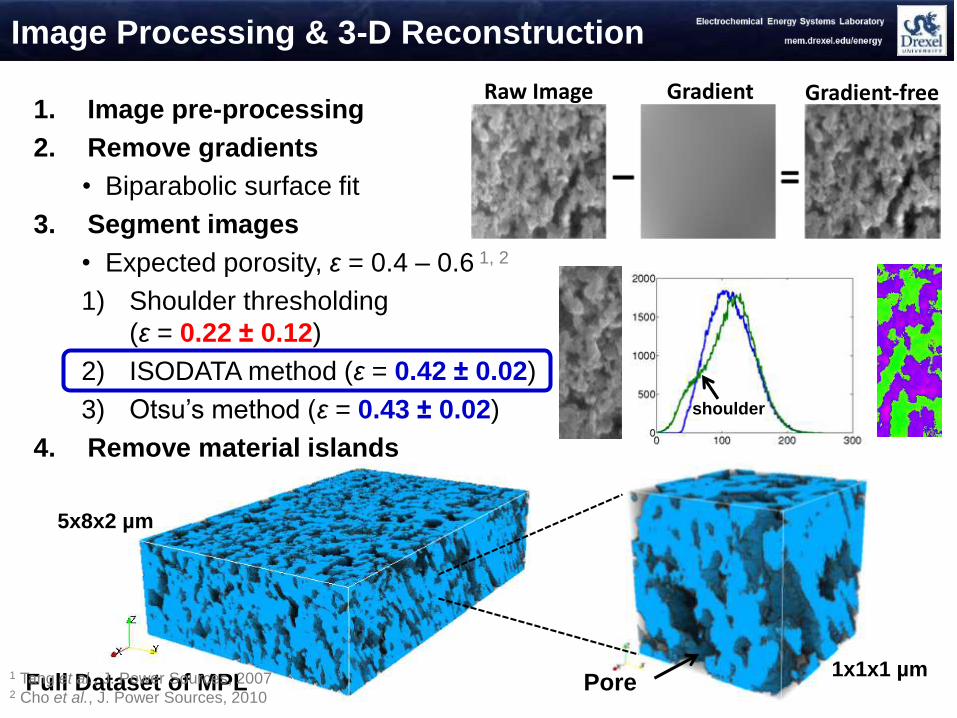
1. Image pre-processing
2. Remove gradients
• Biparabolic surface fit
3. Segment images
• Expected porosity, ε = 0.4 – 0.6 1, 2
1) Shoulder thresholding
(ε = 0.22 ± 0.12)
2) ISODATA method (ε = 0.42 ± 0.02)
3) Otsu’s method (ε = 0.43 ± 0.02)
4. Remove material islands
Raw Image Gradient Gradient-free
PoreFull Dataset of MPL1 Tang et al., J. Power Sources, 20072 Cho et al., J. Power Sources, 2010
shoulder
Image Processing & 3-D Reconstruction
5x8x2 µm
1x1x1 µm

• Diffusivity Coefficient
– Finite volume approximation
– Steady-state Fickian model
• Porosity
Structural Diffusivity Coefficient
Microstructure analysis tools were developed to determine
the key structural properties of the full MPL dataset.
• Internal surface area
– Count voxel faces of internal pore structure
• Connected Internal surface area– Excludes isolated pores
Pore Voxel
Metrics (Property) Analysis Tools

• Tortuosity, τ– Utilized shortest path
search algorithm
– Between start and end surfaces
pathdirect
path computed
Computed Shortest Tortuous Paths
in the Measured Microstructure
1 1.2 1.4 1.6 1.8 2 2.20
0.5
1
1.5
2
2.5
3
3.5
Pro
babili
ty D
ensity
Tortuosity
τeff = τavg = 1.42
St. Dev. = 0.37
Tortuosity,τ
Pro
babili
ty D
ensity
Single Random
Volume
1x1x1 µm
We can determine
spatial distribution of
tortuous paths, not
just one value.
Metrics (Property) Analysis Tools
– Detailed tortuosity
statistics

Metric Average Units
Porosity 0.4115 (fraction)
Internal Surface Area 23.77 (µm2/µm3)
Connected Internal Surface Area 22.30 (µm2/µm3)
Tortuosity 1.34
Structural Diffusivity Coefficient 0.225
Select 300 Random Volumes
Volume 1
Volume 2
Volume 300
Each 100 pixels3
1x1x1 µm
1x1x1 µm
1x1x1 µm
Apply metrics analysis tools to 300 random volumes
Calculated Metrics of Full Dataset
5x8x2 µm

Selection of RVEs
• N-point statistics
– Capture the structure
– Shape/size/spatial distribution
of phases
– Used 2-point statistics for
tested MPL (pore, solid phase)
2-Phase Image 2-pt Statistics Plot
Kalidindi et al. 2009
100x100x100 pixels
1 million 2-point
statistics (dimensions)
To select RVEs, we used the WSVE Set approach which is based
on n-point statistics and principal component analysis.
RVEs selected to
best reflect the 2-
point statistics
• Principal component analysis (PCA)
– Adequately represents in a lower dimensional space
– Identifies the most important statistics
– Speeds up RVE selection
Challenging Task

0
0.1
0.2
0.3
0.4
0.5
0 50 100 150 200Scala
r S
tati
sti
cal
Err
or
Window Size (pixels3)
Selected RVE Configuration:• Window size = 100 pixels3
• 5-member RVE Set0
0.01
0.02
0.03
0.04
0.05
0.06
0.07
0 2 4 6 8 10Scala
r S
tati
sti
cal
Err
or
# Members in RVE Set
Exact
Location
of 5-Member
RVE Set
• Small size, computationally efficient
• 5 members, high accuracy
RVE Window Size & Members Selection
Full Dataset Volume
SVE5
SVE4
SVE3
SVE1
SVE2

• RVE Weights
– Weights allow the RVE Set to better reflect the full dataset
Selected RVE Sets and Weights
1-member
RVE Set3-member
RVE Set
5-member
RVE SetFull Dataset
Exact Location
of RVE member
– Any number of members can form an RVE Set
– Weighted SVE Set approach identifies the best set of volumes
– Optimally assigned to each SVE during the PCA procedure
Set RVESVE1
i
n
i
i w
SVE1
SVE1 SVE2
SVE3
SVE1
SVE2
SVE3
SVE4
SVE5
Weight

Full Dataset 0.4115 23.77 22.30 1.34 0.225
Weighted AveragesPorosity
(fraction)
Surface Area
(µm2/µm3)
Connected SA
(µm2/µm3) Tortuosity
Structural
Diff. Coeff.
5-member
RVE Set 0.4108 24.23 22.75 1.36 0.218
• Compare RVE Set metrics to the Full Dataset
Apply Metric Algorithms to Each Volume
RVE Set Validation & Comparison
Member 1 Member 2
Weight = 0.200 Wt. = 0.316 Wt. = 0.192 Wt. = 0.130 Wt. = 0.161
Member 3 Member 4 Member 55-member
RVE Set
%Error 0.18 1.93 2.04 1.13 3.28

Random selection of volumes will very likely yield a less accurate RVE
RVE Set Validation
0.35 0.4 0.45 0.50
50
100
150
200
250
5000 random sets
Normal fit
5-member WSVE Set
Ensemble average
Porosity
Fre
quency
Full Dataset
Volume 1
Volume 2
Volume 300
. . .
300 Random Volumes
5000 random
sets composed
of 5 members
. . . .n = 1
• Determine property averages for
each of the 5000 random sets
97% of the random sets
are less accurate
. . . .
. . . .
. . . .
n = 2 n = 5000
Vol 1
Vol 2
Vol 5
• Each of the 5 members is equally
weighted

Implementation Strategies for Different Problems
• For effective structural/transport properties
– RVE Set composed of a few small volumes
– Cubic RVEs
• For directionally specific information
– e.g., temperature, reactant or liquid water distribution
– Make the RVE longer in the direction of interest
Size and shape of the RVEs can be tailored to provide an
appropriate model domain
RVEs selected by this approach provide a small
(computationally efficient) and reliable model domain
for pore scale analysis of fuel cell materials.
Th
rou
gh
-pla
ne

• Use of “weighted statistical volume element” (WSVE) approach enables selection of small RVE Sets, which accurately capture the prominent features of a much larger material dataset
• RVE Set metrics match full MPL dataset very well– Less than 5% error
– Small volumes, only 100 pixels3 (~1 µm3)
• Random selection of volumes will very likely yield less accurate RVEs
• Matching 2-pt statistics ensures that key structural and transport properties of the material will be captured by the RVE Set
• RVEs selected by this approach provide a computationally efficient and reliable model domain for pore scale analysis
Conclusions

16
Acknowledgements
Future Work
• Dr. Craig L. Johnson (Centralized Research Facilities, Drexel) and
David M. Turner (Mechanics of Microstructures Group, Drexel)
• NSF Grant #1066623
• NSF Grant #DMR-0722845
• ED Award #P200A100145
• Investigation of a bi-layered GDL sample
• Pore scale modeling of transport in GDL using the selected RVEs
• Characterization of catalyst layer of PEM fuel cells

17
THANK YOU!

18
Spatial Variance of Microstructure in MPL
-1.30E-18
4.00E-04
8.00E-04
1.20E-03
1.60E-03
2.00E-03S
cala
r S
tati
sti
cal
Err
or
Dataset of Particular Window Size (pixels3)
Average Error for Dataset #1 (D1)
Average Error for Dataset #2 (D2)
Average Error for Dataset #3 (D3)
Average Error for Dataset #4 (D4)
100 pixels3
Window Size
= 50 pixels3
75 pixels3
• Four MPL datasets were obtained via FIB-SEM
• A comparison of their 2-point statistics shows that all four datasets
have very similar structures

Comparison of RVE Sets
Weighted AveragesPorosity
(fraction)
Surface Area
(µm2/µm3)
Connected SA
(µm2/µm3) Tortuosity
Structural
Diff. Coeff.
Full Dataset 0.4115 23.77 22.30 1.34 0.225
RVE Set:
1-member
(%Error)
0.4081
(0.84)
27.52
(15.76)
25.91
(16.19)
1.35
(0.74)
0.221
(2.13)
3-member
(%Error)
0.4110
(0.13)
24.91
(4.76)
23.35
(4.70)
1.37
(1.88)
0.222
(1.66)
5-member
(%Error)
0.4108
(0.18)
24.23
(1.93)
22.75
(2.04)
1.36
(1.13)
0.218
(3.28)
0
5
10
15
20
0 1 2 3 4 5 6
% E
rro
r
# Members in WSVE Set
Internal Surface Area (ISA)
Connected Internal Surface Area (CISA)
Porosity (ε)

Comparison of RVE Sets
0
1
2
3
4
5
0 1 2 3 4 5 6
% E
rro
r
# Members in WSVE Set
Structural Diffusivity Coefficient (K)
Tortuosity (τ)
Case #1 (low τ, high K ): Case #2 (high τ, low K ):
Pore
region
Material
A
B
A
B

Compare WSVE Sets and Random Sets
0.35 0.4 0.45 0.50
50
100
150
200
250
5000 random sets
Normal fit
5-member WSVE Set
Ensemble average
18 19 20 21 22 23 24 25 26 270
50
100
150
200
250
5000 random sets
Normal fit
5-member WSVE Set
Ensemble average
Connected Surface Area (µm2/µm3)
b)a)
Porosity
Fre
quency
1.25 1.3 1.35 1.4 1.45 1.5 1.55 1.60
50
100
150
200
250
5000 random sets
Normal fit
5-member WSVE Set
Ensemble average
Tortuosity
c)
Fre
quency
0.16 0.18 0.2 0.22 0.24 0.26 0.28 0.3 0.320
50
100
150
200
250
5000 random sets
Normal fit
5-member WSVE Set
Ensemble average
Structural Dif fusivity Coef ficient
d)

Down-shift
Stretch
Down-shift
)sin(/1 factor
dy
Inkson et al, Scripta Materialia 2001
dz
Ion
beam
Imaging
directionθ
θdy
Raw ImageAlignment )cos( dzdy
Cropped ImageStretch
Crop
Image
Image Processing


![ThanksPowerPoint v6[1].pptx (Read-Only)...2008$Lewisville$ISD$Bond$Program$ Proposed$Projects$1$of$2$ • Three$elementary$schools $ $$$$86.7million • Five$elementary$school$addiDons](https://static.fdocuments.us/doc/165x107/5f0e1b117e708231d43da3b6/thankspowerpoint-v61pptx-read-only-2008lewisvilleisdbondprogram-proposedprojects1of2.jpg)


![[MS-PPTX]: PowerPoint (.pptx) Extensions to the Office ...MS-PPTX... · [MS-PPTX] - v20181211 PowerPoint (.pptx) Extensions to the Office Open XML File Format Copyright © 2018 Microsoft](https://static.fdocuments.us/doc/165x107/5edb5856ad6a402d666584d0/ms-pptx-powerpoint-pptx-extensions-to-the-office-ms-pptx-ms-pptx.jpg)