Ask your child t - Catholic Schools in the Archdiocese of ... Web viewArchdiocese of New York Grade...
34
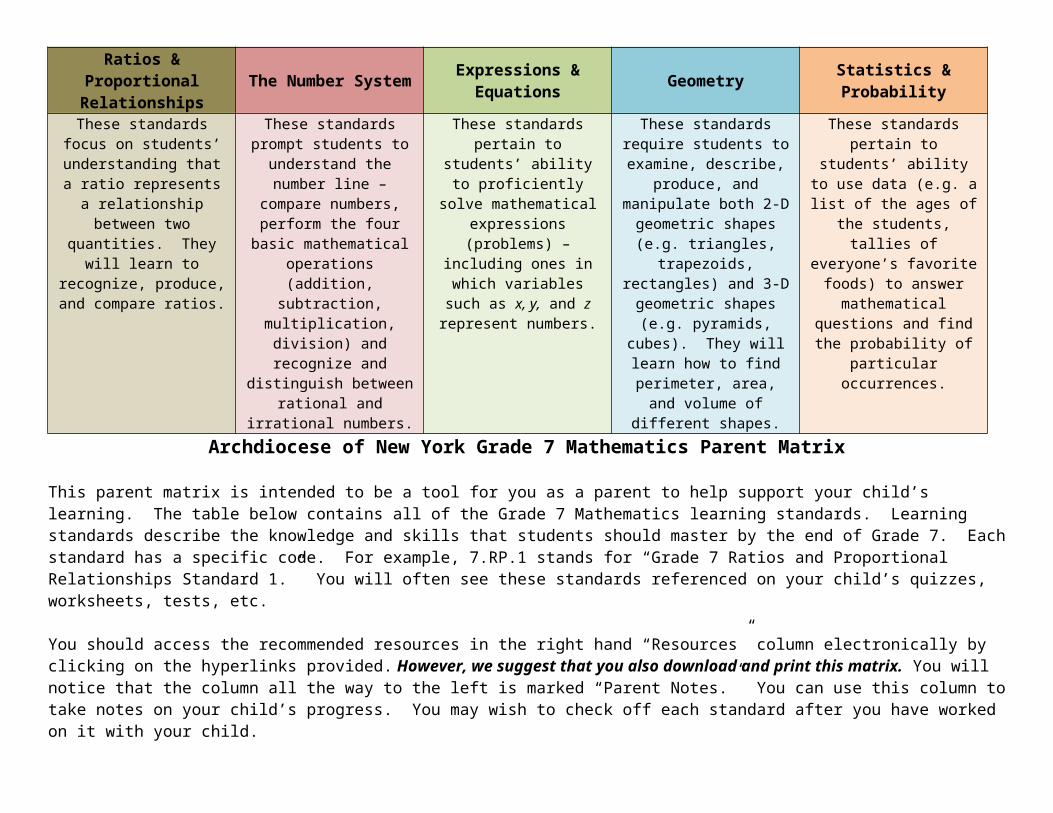
Ratios & Proportional Relationships The Number System Expressions & Equations Geometry Statistics & Probability These standards focus on students’ understanding that a ratio represents a relationship between two quantities. They will learn to recognize, produce, and compare ratios. These standards prompt students to understand the number line – compare numbers, perform the four basic mathematical operations (addition, subtraction, multiplication, division) and recognize and distinguish between rational and irrational numbers. These standards pertain to students’ ability to proficiently solve mathematical expressions (problems) – including ones in which variables such as x, y, and z represent numbers. These standards require students to examine, describe, produce, and manipulate both 2-D geometric shapes (e.g. triangles, trapezoids, rectangles) and 3-D geometric shapes (e.g. pyramids, cubes). They will learn how to find perimeter, area, and volume of different shapes. These standards pertain to students’ ability to use data (e.g. a list of the ages of the students, tallies of everyone’s favorite foods) to answer mathematical questions and find the probability of particular occurrences. Archdiocese of New York Grade 7 Mathematics Parent Matrix This parent matrix is intended to be a tool for you as a parent to help support your child’s learning. The table below contains all of the Grade 7 Mathematics learning standards. Learning standards describe the knowledge and skills that students should master by the end of Grade 7. Each standard has a specific code. For example, 7.RP.1 stands for “Grade 7 Ratios and Proportional Relationships Standard 1.” You will often see these standards referenced on your child’s quizzes, worksheets, tests, etc. You should access the recommended resources in the right hand “Resources” column electronically by clicking on the hyperlinks provided. However, we suggest that you also download and print this matrix. You will notice that the column all the way to the left is marked “Parent Notes.” You can use this column to take notes on your child’s progress. You may wish to check off each standard after you have worked on it with your child.
Transcript of Ask your child t - Catholic Schools in the Archdiocese of ... Web viewArchdiocese of New York Grade...
Ratios & Proportional Relationships The Number System Expressions & Equations Geometry Statistics & Probability
These standards focus on students’ understanding that
a ratio represents a relationship between two
quantities. They will learn to recognize, produce, and
compare ratios.
These standards prompt students to understand the
number line – compare numbers, perform the four
basic mathematical operations (addition,
subtraction, multiplication, division) and recognize and
distinguish between rational and irrational numbers.
These standards pertain to students’ ability to proficiently solve
mathematical expressions (problems) – including ones in which variables such as x, y, and z represent numbers.
These standards require students to examine,
describe, produce, and manipulate both 2-D
geometric shapes (e.g. triangles, trapezoids, rectangles) and 3-D
geometric shapes (e.g. pyramids, cubes). They will learn how to find perimeter,
area, and volume of different shapes.
These standards pertain to students’ ability to use data (e.g. a list of the ages of the
students, tallies of everyone’s favorite foods) to
answer mathematical questions and find the
probability of particular occurrences.
Archdiocese of New York Grade 7 Mathematics Parent Matrix
This parent matrix is intended to be a tool for you as a parent to help support your child’s learning. The table below contains all of the Grade 7 Mathematics learning standards. Learning standards describe the knowledge and skills that students should master by the end of Grade 7. Each standard has a specific code. For example, 7.RP.1 stands for “Grade 7 Ratios and Proportional Relationships Standard 1.” You will often see these standards referenced on your child’s quizzes, worksheets, tests, etc.
You should access the recommended resources in the right hand “Resources” column electronically by clicking on the hyperlinks provided. However, we suggest that you also download and print this matrix. You will notice that the column all the way to the left is marked “Parent Notes.” You can use this column to take notes on your child’s progress. You may wish to check off each standard after you have worked on it with your child.
In Grade 7 Mathematics, there are five main domains of standards. These include Ratios & Proportional Relationships, The Number System, Expressions & Equations, Geometry, and Statistics & Probability. Each category is highlighted in a different color. Your child’s teacher will be able to tell you which standards you should focus on with your child throughout the year.
We hope that this parent matrix is a valuable resource for you. If you find that you would like additional practice materials to work on you can use the standard codes provided below to search for additional resources.
RATIOS & PROPORTIONAL RELATIONSHIPSParent Notes Standard
CodeStandard What does this
standard mean?What can I do at
home?Resources
Ratios and Proportional Relationships Grade 7 Standard 1 (7.RP.1)
Compute unit rates associated with ratios of fractions, including ratios of lengths, areas and other quantities measured in like or different units. For example, if a person walks 1/2 mile in each 1/4 hour, compute the unit rate as the complex fraction 1/2/1/4 miles per hour, equivalently 2 miles per hour
Students continue to work with unit rates from 6th grade; however, the comparison now involves fractions compared to fractions. The comparison can be with like or unlike units. Fractions may be proper or improper. For example, if ½ gallon of paint covers 1/6 of the wall, how much is needed for the entire wall? (3 gallons per wall)
Ask your child to tell you how much milk is needed in a recipe to make 24 muffins if 1/3 cup is needed to make 6 muffins (1 1/3 cup)
Ask your child to follow a recipe and make it for twice as many people as is called for in the recipe. This would require them to recalculate the measure of the ingredients.
https://www.youtube.com/watch?v=Is9ioUILsrU
https://learnzillion.com/lessons/868-find-the-best-deal-by-comparing-unit-rates
Ratios and Proportional Relationships Grade 7 Standard 2(7.RP.2)
Recognize and represent proportional relationships between quantities. a. Decide whether two quantities are in a proportional relationship, e.g., by testing for equivalent ratios in a table or graphing on a coordinate plane and observing whether the graph is a straight line through the origin. b. Identify the
Students determine if two quantities are in a proportional relationship from a table. Fractions and decimals could be used in this standard. This standard focuses on representations, whereas 7.SP.3 will address solving them.
Ask your child if the numbers in the table below represent a proportion:
Number of Books
Price
1 3 3 9 4 12 7 18
The price of the number of books is multiplied by 3 except for 7 books. That means this table does not represent a proportional relationship.
https://www.youtube.com/watch?v=3Nls1WGusCg
https://www.youtube.com/watch?v=PTW_yFBljTY

constant of proportionality (unit rate) in tables, graphs, equations, diagrams, and verbal descriptions of proportional relationships. Represent proportional relationships by equations. For example, if total cost t is proportional to the number n of items purchased at a constant price p, the relationship between the total cost and the number of items can be expressed as t = pn. c. Explain what a point (x, y) on the graph of a proportional relationship means in terms of the situation, with special attention to the points (0, 0) and (1, r) where r is the unit rate.
Ratios and Proportional Relationships Grade 7 Standard 3(7.RP.3)
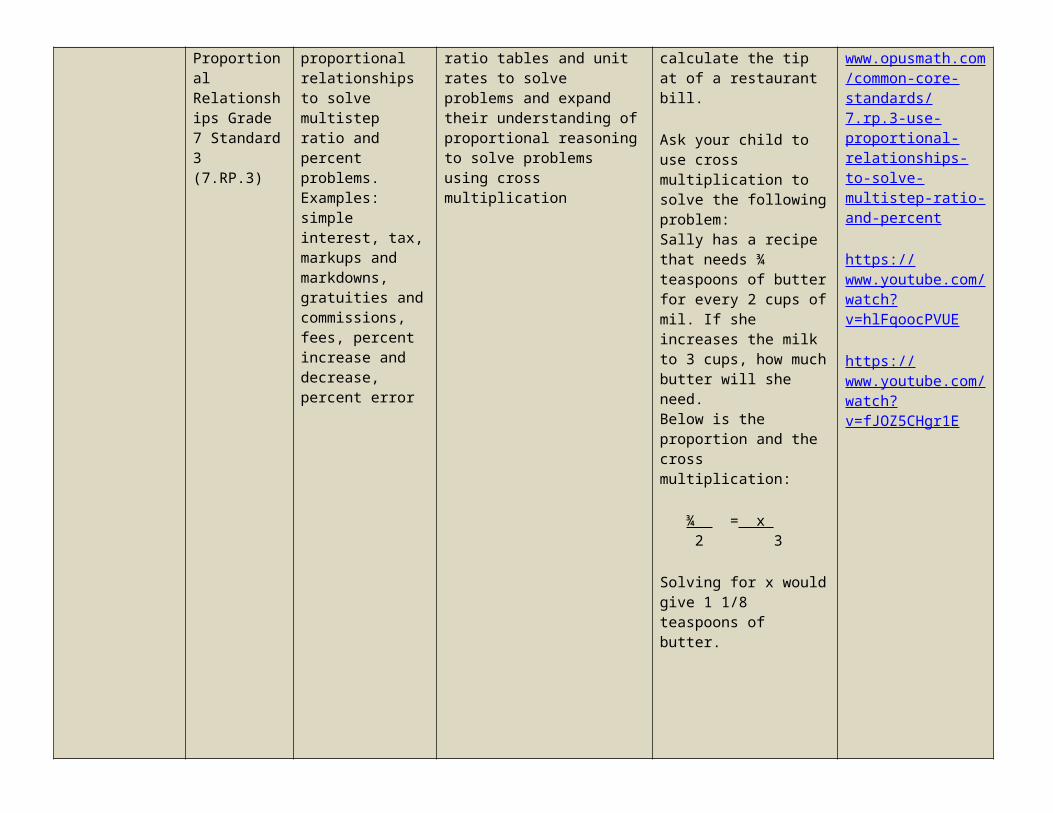
Use proportional relationships to solve multistep ratio and percent problems. Examples: simple interest, tax, markups and markdowns,
Students begin to use ratio tables and unit rates to solve problems and expand their understanding of proportional reasoning to solve problems using cross multiplication
Ask your child to calculate the tip at of a restaurant bill.
Ask your child to use cross multiplication to solve the following problem:Sally has a recipe that needs ¾ teaspoons of butter for
http://www.opusmath.com/common-core-standards/7.rp.3-use-proportional-relationships-to-solve-multistep-ratio-and-percent

gratuities and commissions, fees, percent increase and decrease, percent error
every 2 cups of mil. If she increases the milk to 3 cups, how much butter will she need.Below is the proportion and the cross multiplication:
¾ = x 2 3
Solving for x would give 1 1/8 teaspoons of butter.
https://www.youtube.com/watch?v=hlFqoocPVUE
https://www.youtube.com/watch?v=fJOZ5CHgr1E
THE NUMBER SYSTEMParent Notes Standard
CodeStandard What does this
standard mean?What can I do at
home?Resources
The Number System Grade 7 Standard 1
Apply and extend previous understandings of
Students add and subtract rational numbers and build on their understanding of the
Ask your child to use a number line to add -5 and 7. Students find the -5 on the
https://www.youtube.com/watch?
(7.NS.1) addition and subtraction to add and subtract rational numbers; represent addition and subtraction on a horizontal or vertical number line diagram. a. Describe situations in which opposite quantities combine to make 0. For example, a hydrogen atom has 0 charge because its two constituents are oppositely charged. b. Understand p + q as the number located a distance |q| from p, in the positive or negative direction depending on whether q is positive or negative. Show that a number and its opposite have a sum of 0 (are additive inverses). Interpret sums of rational numbers by describing real-world contexts. c. Understand subtraction of rational numbers as adding the additive inverse, p – q = p + (–q). Show that the distance between
number line developed in Grade 7.
number line and move 7 in a positive direction (to the right). The stopping point of 2 is the answer (the sum) of this expression.
Ask your child to use a number line to subtract – 6 – (-4). This problem is asking for the distance between -6 and -4. The distance between -6 and -4 is 2 and the direction from -4 to -6 is left or negative. The answer would be -2. This answer is the same as adding the opposite of -4 (which would be 4) to -6, which is also -2.
v=bChoL5qB6cM
https://www.youtube.com/watch?v=p8OsA062OPY
https://www.youtube.com/watch?v=rYsGwl4NyfY
two rational numbers on the number line is the absolute value of their difference, and apply this principle in real world contexts. d. Apply properties of operations as strategies to add and subtract rational number
The Number System Grade 7 Standard 2(7.NS.2)
Apply and extend previous understandings of multiplication and division and of fractions to multiply and divide rational numbers. a. Understand that multiplication is extended from fractions to rational numbers by requiring that operations continue to satisfy the properties of operations, particularly the distributive property, leading to products such as (– 1)(–1) = 1 and the rules for multiplying signed numbers. Interpret products of rational numbers by describing real-world contexts. b. Understand that
Students should understand that multiplication and division of integers is an extension of multiplication and division of whole numbers. Integers are whole numbers that can be positive or negative.
Ask your child each number can have a negative sign when division is represented by a fraction bar? (Yes)
Ask your child which of the following fractions is equivalent to -4/5?
4 -16 -4-5 20 -5
The answer is -16/20
https://www.youtube.com/watch?v=pCOcpQ4ppK0
https://www.youtube.com/watch?v=o4dnLi_s0RY
https://www.youtube.com/watch?v=-cs0T8Ui7FY

integers can be divided, provided that the divisor is not zero, and every quotient of integers (with non-zero divisor) is a rational number. If p and q are integers, then –(p/q) = (–p)/q = p/(– q). Interpret quotients of rational numbers by describing real-world contexts. c. Apply properties of operations as strategies to multiply and divide rational numbers. d. Convert a rational number to a decimal using long division; know that the decimal form of a rational number terminates in 0s or eventually repeats.
The Number System Grade 7 Standard 3(7.NS.3)
Solve real-world and mathematical problems involving the four operations with rational numbers. Computations with rational numbers extend the rules for manipulating fractions to complex fractions.
Students use order of operations from 6th grade to write and solve problems with all rational numbers.For example, Jim’s cell phone bill is $32 every month. How much will the deductions total for the year? The answer is found by multiplying -32 by 12 and the answer is $384.
Ask your child to answer the following problem:If it took a submarine 20 seconds to drop 100 feet below sea level what was the rate of descent?-100/20 = -5 ft/second
https://www.youtube.com/watch?v=-GBYmW-heKA
https://www.youtube.com/watch?v=QxXR0fxvTgM

EXPRESSIONS & EQUATIONSParent Notes Standard
CodeStandard What does this
standard mean?What can I do at
home?Resources
Expressions and Equations Grade 7 Standard 1(7.EE.1)
Apply properties of operations as strategies to add, subtract, factor, and expand linear expressions with rational coefficients.
This is a continuation of work from the 6th grade where students combine like terms and write equivalent expressions.
Ask your child to write an equivalent expression for 3(x +5)-2First, distribute the 3 to the x and 5 which gives you 3x + 15 -2 or 3x+13
https://www.youtube.com/watch?v=P3iNM93zIak&list=PLnIkFmW0ticM-74GapsCHr4t9ejXhOCFA

https://www.youtube.com/watch?v=EUh9_BEp1Xc
Expressions and Equations Grade 7 Standard 2(7.EE.2)
Understand that rewriting an expression in different forms in a problem context can shed light on the problem and how the quantities in it are related. For example, a + 0.05a = 1.05a means that “increase by 5%” is the same as “multiply by 1.05.”
Students understand the reason for rewriting an expression in terms of a contextual situation. For example, students understand that a 20% discount is the same as finding 80% of the cost. For example, all varieties of a certain brand of cookies are $3.50. a person buys peanut butter cookies and chocolate chip cookies. Write an expression that represents the total cost, T, of the cookies if p represents the number of peanut butter cookies and c represents the number of chocolate chip cookies. The answer is T= 3.50( p + c)
Ask your child to solve the following problem:
Jamie and Ted get paid the same hourly wage of $9 per hour. This week, Ted made an additional $27 in overtime. Write an expression that represents the weekly wages of both boys if J=the number of hours Jamie works this week and T equals the number of hours Ted works this week?
There are several ways this can be answered and all are correct:
9J +9T+27
9( J +T) +27
9J + (9T +27)
https://www.youtube.com/watch?v=GvCv2Pz0o3I
https://www.youtube.com/watch?v=Z4oewNxD8eE
Expressions and Equations Grade 7 Standard 3(7.EE.3)
Solve multi-step real-life and mathematical problems posed with positive and negative rational numbers in any form (whole numbers, fractions, and decimals), using tools strategically. Apply properties of
Students convert between decimals, fractions, and percent. They estimate to justify the reasonableness of their answers. For example: If a woman making $25 an hour gets a 10% raise, she will make an additional 1/10 of her salary an hour, or $2.50, for a new salary of $27.50. If you want to place a towel bar 9 3/4 inches long in the center of a door that
Ask your child to solve the following problem:
Three students conducted the same survey about the number of hours people sleep at night. The results are shown below for the number of people who sleep 8 hours a night.
https://www.youtube.com/watch?v=ohEKROY1POI
https://www.youtube.com/watch?v=limIo8w0AwY

operations to calculate with numbers in any form; convert between forms as appropriate; and assess the reasonableness of answers using mental computation and estimation strategies
is 27 1/2 inches wide, you will need to place the bar about 9 inches from each edge; this estimate can be used as a check on the exact computation.
Susan reported that 18 of the 48 people she surveyed get 8 hours.
Kenneth reported that 36% of the people he surveyed got 8 hours.
Jamal reported that .365 of the people he surveyed got 8 hours of sleep.
The answer is Susan’s survey because 18/48 is equal to 37.5%
Expressions and Equations Grade 7 Standard 4(7.EE.4)
Use variables to represent quantities in a real-world or mathematical problem, and construct simple equations and inequalities to solve problems by reasoning about the quantities. a. Solve word problems leading to equations of the form px + q = r and p(x + q) = r, where p, q, and r are specific rational numbers. Solve equations of these forms fluently. Compare an algebraic solution to an arithmetic solution, identifying
Students write an equation or inequality to model a situation. Students explain how they determined whether to write an equation or inequality and the properties of the real number system used to find a solution. Students define the variable and use appropriate units.
Students also solve multi-step equations derived from word problems
Ask your child to solve the following word problem:
The youth group is going on a trip to the fair. The trip costs $52. Included in the price is $11 for a concert ticket and the cost of 2 passes, one for the rides and one for the game booths. Each of the passes cost the same price. Write an equation representing the cost of the trip and determine the price of one pass.
2x +11=52 2x= 41X=$20.50
Ask your child to solve the following word problem. Amy had $26 dollars to
https://www.youtube.com/watch?v=LaSgcIsnXlU
https://www.youtube.com/watch?v=3sYVel8u4qI
http://www.opusmath.com/common-core-standards/7.ee.4a-solve-word-problems-leading-to-equations-of-the-form-px--q--r-and-px-

the sequence of the operations used in each approach. For example, the perimeter of a rectangle is 54 cm. Its length is 6 cm. What is its width?b. Solve word problems leading to inequalities of the form px + q > r or px + q < r, where p, q, and r are specific rational numbers. Graph the solution set of the inequality and interpret it in the context of the problem. For example: As a salesperson, you are paid $50 per week plus $3 per sale. This week you want your pay to be at least $100. Write an inequality for the number of sales you need to make, and describe the solutions.
spend on school supplies. After buying 10 pens, she had $14.30 left. How much did each pen cost?
X=number of pens26=14.30 + 10xSolving for x gives $1.17 for each pen

GEOMETRYParent Notes Standard
CodeStandard What does this
standard mean?What can I do at
home?Resources
Geometry Grade 7 Standard 1(7.G.1)
Solve problems involving scale drawings of geometric figures, including computing actual lengths and areas from a scale drawing and reproducing a scale drawing at a different scale
Students determine the dimensions of figures when given a scale and identify the impact of the scale on actual length (one dimension) and area (two dimension). Students identify the scale factor given two figures. They understand that the lengths will change by a factor equal to the product of the magnitude of the two size transformations.
Ask your child to draw a scale model of their room if 2 cm is equal to every 5 feet.
Ask your child if the rectangle below is enlarged using a scale factor of 1.5 what will be the perimeter (the distance around) and the area of the new rectangle 2in
7 in
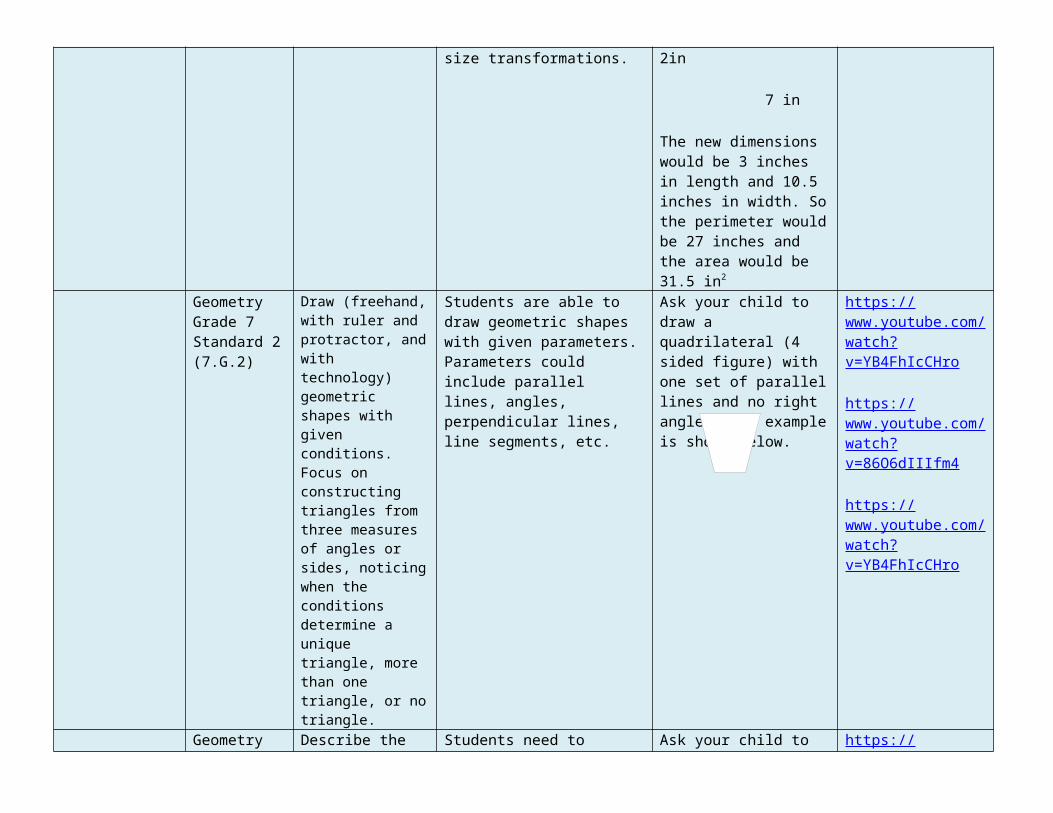
The new dimensions would be 3 inches in length and 10.5 inches in width. So the
https://www.youtube.com/watch?v=7BsI1Htvr-Q

perimeter would be 27 inches and the area would be 31.5 in2
Geometry Grade 7 Standard 2(7.G.2)
Draw (freehand, with ruler and protractor, and with technology) geometric shapes with given conditions. Focus on constructing triangles from three measures of angles or sides, noticing when the conditions determine a unique triangle, more than one triangle, or no triangle.
Students are able to draw geometric shapes with given parameters. Parameters could include parallel lines, angles, perpendicular lines, line segments, etc.
Ask your child to draw a quadrilateral (4 sided figure) with one set of parallel lines and no right angles. One example is shown below.
https://www.youtube.com/watch?v=YB4FhIcCHro
https://www.youtube.com/watch?v=86O6dIIIfm4
https://www.youtube.com/watch?v=YB4FhIcCHro
Geometry Grade 7 Standard 3(7.G.3)
Describe the two-dimensional figures that result from slicing three-dimensional figures, as in plane sections of right rectangular prisms and right rectangular pyramids.
Students need to describe the resulting face shape from cuts made parallel and perpendicular to the bases of the right rectangular prisms and pyramids. Cuts made parallel will take the shape of the base; cuts made perpendicular will take the shape of the lateral (side) face. Cuts made at an angle through a right rectangular prism will produce a parallelogram.
Ask your child to draw a pyramid and cut it with a plane that is parallel to its base. The intersection of the pyramid and the plane is a square cross section.
https://www.youtube.com/watch?v=y8ct1mPYHUk
Geometry Grade 7 Standard 4(7.G.4)
Know the formulas for the area and circumference of a circle and use them to solve problems; give an informal derivation of the relationship between the circumference and area of a circle.
Students understand the relationship between radius and diameter. They also know that the ratio between the circumference of a circle and its diameter can be expressed as pi. Using this knowledge, they generate the formulas for circumference and area.Pi ( π) is an irrational number (its decimal places never repeat or
Ask your child to solve the following problem for the area of a circle with a radius of 5 inches. Let them use 3.14 for the value of π (pi)
Area = π r2 Area = 3.14 (5)2
= 78.5ft2
https://learnzillion.com/lessons/817-determine-the-measures-of-a-circle
https://www.youtube.com/watch?v=EImRMbj9vaw

terminates). The measure of pi is approximately 3.14 or 22/7 when expressed as a fraction
Geometry Grade 7 Standard 5(7.G.5)
Use facts about supplementary, complementary, vertical, and adjacent angles in a multi-step problem to write and solve simple equations for an unknown angle in a figure.
Students use understandings of angles and deductive reasoning to write and solve equations. A right angle is equal to 90 degrees. The sum of all the angles in a triangle is 180 degrees. The measure of the angle formed by a straight line is 180 degrees.
Ask your child to find the measure of x in the drawing below.
400
X
X =130 degrees
https://www.youtube.com/watch?v=Qgiot9_-S1c
https://www.youtube.com/watch?v=W5GNLG_yyDc
https://www.youtube.com/watch?v=L9_lRP7N7bY
Geometry Grade 7 Standard 6(7.G.6)
Solve real-world and mathematical problems involving area, volume and surface area of two and three-dimensional objects composed of triangles, quadrilaterals, polygons, cubes, and right prisms.
Students continue their work on area, volume and surface area of two-dimensional and three-dimensional objects (composite shapes….shapes made of simple figures). At this level, students also determine the dimensions of the figure given the area or the volume because they are supposed to be comfortable working with equations.
Ask your child to find the length of a triangle’s base when its area is 6 square feet and the height is four feet.. One possible solution is to use the formula for the area of a triangle (A= bh) and substitute the known values, then solve for the missing dimension. The length of the base would be 3 feet.
Ask your child to find the volume of a cube with a surface area of 96 in2.
To find the solution a child needs to know that the area of each face of a cube is the same or equal. Since it has six sides, divide 96 by 6, which is an area of 16in2 for each face. Because each
https://www.youtube.com/watch?v=f4udLzWWjS4
https://www.youtube.com/watch?v=Ni2Eo7BIC40

face is a square, the length of the edge is 4 inches. The volume is then found by taking the cube of 4 inches, which are 64 in3.
STATISTICS & PROBABILITYParent Notes Standard
CodeStandard What does this
standard mean?What can I do at
home?Resources
Statistics and Probability Grade 7 Standard 1(7.SP.1)
Understand that statistics can be used to gain information about a population by examining a sample of the population; generalizations about a population from a sample are valid only if the sample is representative of that population. Understand that random sampling tends to produce representative samples and support valid inferences.
Students recognize that it is difficult to gather statistics on an entire population. Instead a random sample can be representative of the total population and will generate valid predictions. This data is then used to draw inferences. A random sample must be used in conjunction with the population to get accuracy. For example, a random sample of elementary school students cannot be used to give a survey about a high school prom.
Ask your child to explain what statistics are in his/her own words.
Ask your child to tell you when using statistics might be helpful.
https://www.youtube.com/watch?v=wCV8EJvtshU
https://www.youtube.com/watch?v=jx0oAThT1PQ
https://www.youtube.com/watch?v=qaz7PXPNdKQ

Statistics and Probability Grade 7 Standard 2(7.SP.2)
Use data from a random sample to draw inferences about a population with an unknown characteristic of interest. Generate multiple samples (or simulated samples) of the same size to gauge the variation in estimates or predictions. For example, estimate the mean word length in a book by randomly sampling words from the book; predict the winner of a school election based on randomly sampled survey data. Gauge how far off the estimate or prediction might be
Students collect and use multiple samples of data to make generalizations about a population. There may be variation in the sample.
Ask your child to make one inference from the data collected below about 100 students who were sampled about their lunch preferences
Hamburger 12Tacos 14Pizza 74Total 100
Inference: Most students preferred pizza
https://www.youtube.com/watch?v=M8St8moqFq4
https://www.youtube.com/watch?v=ezyBOYUSgNs
Statistics and Probability Grade 7 Standard 3(7.SP.3)
Informally assess the degree of visual overlap of two numerical data distributions with similar variabilities, measuring the difference between the centers by expressing it as a multiple of a measure of variability. For example, the mean height of players on
This would be students’ first experience with comparing two data sets. Students are building on their understanding of graphs, mean, median, Mean Absolute Deviation(MAD) and interquartile range from 6th grade. Students understand that a full understanding of data requires consideration of the measures of variability as well as mean and median. Variability is responsible for the overlap of two data sets and that an increase in variability can increase the overlap, and
Ask your child to find the mean height of basketball players (or cheerleaders) on a team of their choice.
https://www.youtube.com/watch?v=7KnncF6Eomg
https://www.youtube.com/watch?v=1tz2bTKTWPg
the basketball team is 10 cm greater than the mean height of players on the soccer team, about twice the variability (mean absolute deviation) on either team; on a dot plot, the separation between the two distributions of heights is noticeable.
median is paired with the inter quartile range, and mean is paired with the mean absolute deviation.
Statistics and Probability Grade 7 Standard 4(7.SP.4)
Use measures of center and measures of variability for numerical data from random samples to draw informal comparative inferences about two populations. For example, decide whether the words in a chapter of a seventh-grade science book are generally longer than the words in a chapter of a fourth-grade science book.
Students compare two sets of data using measures of center (mean and median) and variability (MAD and interquartile range.
Ask your child to tell you which measure of central tendency would be best when comparing multiple people’s salaries in two different companies.
https://www.youtube.com/watch?v=dU-s0GWz2OQ
Statistics and Probability Grade 7 Standard 5(7.SP.5)
Understand that the probability of a chance event is a number between 0 and 1 that expresses the likelihood of the event occurring. Larger numbers indicate greater
This is the students’ first introduction to probability. They should recognize that the probability of a single event can be expressed in terms such as impossible, unlikely, likely, or certain – or as a number between 0 and 1. The closer the fraction is to 1, the greater the probability
Ask your child to solve the following, (keeping in mind that the sum of all possible outcomes is 1). There are three choices of jelly beans – grape, cherry, and orange. If the probability of getting a grape is 3/10 and the
https://www.youtube.com/watch?v=t1KXDricV54
https://www.youtube.com/watch?v=wq6wQBSpioU&list=PLG_KjgfzPSOZDmj0K7

likelihood. A probability near 0 indicates an unlikely event, a probability around ½ indicates an event that is neither unlikely nor likely, and a probability near 1 indicates a likely event.
the event will occur. Larger numbers indicate greater likelihood. For example, if someone has 10 oranges and 3 apples, you have a greater likelihood of selecting an orange at random. Students should also recognize that the sum of all possible outcomes is 1.
probability of getting a cherry is 1/5, what is the probability of getting orange? The answer is 5/10.
Notice how important an understanding of fractions is to probability.
4yx3CpSB1yuix9B
https://learnzillion.com/lessonsets/88
Statistics and Probability Grade 7 Standard 6(7.SP.6)
Approximate the probability of a chance event by collecting data on the chance process that produces it and observing its long-run relative frequency, and predict the approximate relative frequency given the probability. For example, when rolling a number cube 600 times, predict that a 3 or 6 would be rolled roughly 200 times, but probably not exactly 200 times.
Students collect data from a probability experiment, recognizing that as the number of trials increase, the experimental probability approaches the theoretical probability. The focus of this standard is relative frequency. The relative frequency is the observed number of successful events for a finite sample of trials. Relative frequency is the observed proportion of successful event, expressed as the value calculated by dividing the number of times an event occurs by the total number of times an experiment is carried out.
Ask your child to tell you what the relative frequency of heads is when you toss a coin 50 times and have 27 heads and 23 tails ( 27/50 or 54%)
Ask your child to collect data using physical objects or web based simulations they can perform experiments multiple times, pool data with other groups, or increase the number of trials in a simulation
https://learnzillion.com/lessonsets/262
http://www.watchknowlearn.org/Video.aspx?VideoID=17900&CategoryID=4794
Statistics and Probability Grade 7 Standard 7(7.SP.7)
Develop a probability model and use it to find probabilities of events. Compare probabilities from a model to observed frequencies; if the agreement is not
Probabilities are useful for predicting what will happen over the long run. Using theoretical probability, students predict frequencies of outcomes. Students recognize an appropriate design to conduct an experiment with simple
Ask your child to answer the following question:
Jason is tossing a fair coin. He tosses the coin 10 times and it lands on heads eight times. If Jason tosses the coin an eleventh time, what
https://www.youtube.com/watch?v=O2-nNgQ4fS8
https://www.youtube.com/watch?v=Y2JKfGX7R38

good, explain possible sources of the discrepancy. a. Develop a uniform probability model by assigning equal probability to all outcomes, and use the model to determine probabilities of events. For example, if a student is selected at random from a class, find the probability that Jane will be selected and the probability that a girl will be selected. b. Develop a probability model (which may not be uniform) by observing frequencies in data generated from a chance process. For example, find the approximate probability that a spinning penny will land heads up or that a tossed paper cup will land open-end down. Do the outcomes for the spinning penny appear to be equally likely based on the observed
probability events, understanding that the experimental data give realistic estimates of the probability of an event but are affected by the size of the sample. Students can develop models for geometric probability (i.e. a target)
is the probability that it will land on heads? The answer is ½ since the result of the eleventh toss does not depend on previous results.
Ask your child to conduct an experiment by tossing a paper cup and seeing how it lands (right side up or down). How many trials were conducted? How many times did it land right side up? Upside down? On its side? Determine the probability for each of these three different results.
frequencies?Statistics and Probability Grade 7 Standard 8(7.SP.8)
Find probabilities of compound events using organized lists, tables, tree diagrams, and simulation. a. Understand that, just as with simple events, the probability of a compound event is the fraction of outcomes in the sample space for which the compound event occurs. b. Represent for compound events using methods such as organized lists, tables and tree diagrams. For an event described in everyday language (e.g., “rolling double sixes”), identify the outcomes in the sample space that compose the event. c. Design and use a simulation to generate frequencies for compound events. For example, use random digits as a simulation tool to approximate the answer to the question: If 40% of donors have type A
Students use tree diagrams, frequency tables, and organized lists, and simulations to determine the probability of compound events.
Ask your child to solve the following problem:A fair coin will be tossed three times. What is the probability that two heads ad one tail in any order will result?
Answer: 3 out of 8 or 3/8 because the tosses could be head, head, tails (HHT), head, tails, head (HTH) and tails, head, head (THH)
Ask your child to use a tree diagram to show all the possible arrangements of the letters in the word FRED. There are 24 possible arrangements
https://www.youtube.com/watch?v=jtfbQ02Qryw

blood, what is the probability that it will take at least 4 donors to find one with type A blood?