Asia’s power sector and - oxfordenergy.org · December 2016 OIES PAPER: CL 4 The role of coal in...
60
December 2016 OIES PAPER: CL 4 The role of coal in Southeast Asia’s power sector and implications for global and regional coal trade Sylvie Cornot-Gandolphe, OIES Research Associate
Transcript of Asia’s power sector and - oxfordenergy.org · December 2016 OIES PAPER: CL 4 The role of coal in...

December 2016
OIES PAPER: CL 4
The role of coal in Southeast
Asia’s power sector and
implications for global and
regional coal trade
Sylvie Cornot-Gandolphe,
OIES Research Associate

December 2016: The role of coal in Southeast Asia’s power sector
i
The contents of this paper are the authors’ sole responsibility. They do not
necessarily represent the views of the Oxford Institute for Energy Studies or any of
its members.
Copyright © 2016
Oxford Institute for Energy Studies
(Registered Charity, No. 286084)
This publication may be reproduced in part for educational or non-profit purposes without special
permission from the copyright holder, provided acknowledgment of the source is made. No use of this
publication may be made for resale or for any other commercial purpose whatsoever without prior
permission in writing from the Oxford Institute for Energy Studies.
ISBN 978-1-78467-074-0
About the author
Sylvie Cornot-Gandolphe is an independent consultant on energy and raw materials, focusing on
international issues. Since 2014, she has collaborated with the Oxford Institute for Energy Studies
(OIES) as a Research Fellow. She also works with the Energy Centre of the French Institute of
International Relations (IFRI) as a Research Associate, with CyclOpe, the reference publication on
commodities, and with CEDIGAZ, the international centre of information on natural gas of the Institut
Français du Pétrole (IFPEN). Sylvie Cornot-Gandolphe has long and proven experience in global gas
and energy markets, gained during her past positions at IFPEN/CEDIGAZ, the UN/ECE, the IEA, and
ATIC Services. She is the author of several reference publications on energy markets.
Her latest publications include reports on gas, coal, and shale oil and gas: ‘Les exportations
américaines de GNL: De nouvelles règles du jeu sur l’échiquier européen’ (IFRI, June 2016),
‘Underground Gas Storage and LNG Storage Market in the World 2015–2035’ (CEDIGAZ, May 2016),
‘COP21, Haro sur le charbon’ (IFRI, January 2016), ‘Indian Steam Coal Imports: The Great Equation’
(OIES, February 2016), ‘The European Gas Market Looking for its Golden Age?’ (IFRI, October 2015,
co-author), ‘US coal exports: the long road to Asian markets’ (OIES, March 2015), ‘The US shale oil
revolution: the test of the business model is underway’ (IFRI, January 2015), ‘China’s Coal Market:
Can Beijing Tame “King Coal”?’ (OIES, December 2014), ‘Gas Strategy of China’ (IFRI, November
2014), ‘Gas and Coal Competition in the EU Power Sector’ (CEDIGAZ, June 2014), and ‘The Impact
of the Development of Shale Gas in the United States on Europe’s Petrochemical Industries’ (IFRI,
November 2013).

December 2016: The role of coal in Southeast Asia’s power sector
ii
Acknowledgements
I would like to thank the Oxford Institute for Energy Studies (OIES) for giving me the opportunity to
write this report on Southeast Asian coal markets and their implications for global coal trade. I am
very grateful to Bassam Fattouh for his comments on the first draft of this report. My special thanks to
Catherine Gaunt, who edited the final draft of the report, and to Kate Teasdale for her help and
kindness.
December 2016: The role of coal in Southeast Asia’s power sector
iii
Glossary
ACE ASEAN Centre for Energy
ADB Asian Development Bank
AEC ASEAN Economic Community
AIIB Asian Infrastructure Investment Bank
AMEM ASEAN Ministers on Energy Meeting
APAEC ASEAN Plan of Action for Energy Cooperation
APG ASEAN Power Grid
ASEAN Association of Southeast Asian Nations
A-USC Advanced USC
BAU Business-as-Usual
BGR German Federal Institute for Geosciences and Natural Resources
BOT Build-Own-Transfer
CAGR Compound average growth rate
CCGT Combined cycle gas turbine
CCS Carbon capture and storage
CCT Clean Coal Technology
CFB Circulating fluidized bed
CMM coalmine mouth
COP21 21st Conference of the Parties
CO2 Carbon dioxide
DMO Domestic Market Obligation
EBRD European Bank for Reconstruction and Development
EIB European Investment Bank
EMP Energy Master Plan (Myanmar)
ERIA Economic Research Institute for ASEAN and East Asia
EX-IM Export–Import Bank of the United States
FDI Foreign direct investment
FIT Feed-in tariffs
FOB Free on Board
FSRU Floating Storage Regasification Unit
GDP Gross domestic product
GHG Greenhouse gas
Gt Gigatons
GW Gigawatts
HAPUA Heads of ASEAN Power Utilities and Authorities
HELE High-efficiency low-emission
IEA International Energy Agency
IEA CCC IEA Clean Coal Centre
IFIs International financial institutions
IGCC Integrated gasification combined cycle
INDCs Intended Nationally Determined Contributions
IPPs Independent Power Producers
JBIC Japan Bank for International Cooperation
JV Joint-venture
LCOE Levelized cost of electricity generation

December 2016: The role of coal in Southeast Asia’s power sector
iv
LNG Liquefied natural gas
MMBtu Million British thermal units
MEMR Ministry of Energy and Mineral Resources (Indonesia)
MRC Mekong River Commission
Mt Million tons
Mtce Million ton of coal equivalent
Mtoe Million tons of oil equivalent
MYR Malaysian Ringgit
NDB New Development Bank
NEMC National Energy Management Committee (Myanmar)
NOX Nitrogen oxides
NPS New Policy Scenario
OECD Organization for Economic Cooperation and Development
PC Pulverized coal
PDPs Power Development Plans
PDP7-A Adjusted 7th Power Development Plan (Vietnam)
PLN Perusahaan Listrik Negara (Indonesia)
PV Photovoltaic
RE Renewable energies
RPJMN 2015–19 Indonesia’s National Medium-Term Development Plan for the period 2015–19 – see
BPKP (2015)
RUKN General Plan for National Electricity Development (Indonesia)
RUTPL Electricity Supply Business Plan (PLN, Indonesia)
SC Supercritical
SO2 Sulphur dioxide
TAPG Trans-ASEAN Gas Pipeline
TNB Tenaga Nasional Berhad (Malaysia)
TPES Total primary energy supply
UNFCCC United Nations Framework Convention on Climate Change
USC Ultra-supercritical
WBG World Bank Group
WEO 2015 World Energy Outlook 2015 – see IEA (2015c)
December 2016: The role of coal in Southeast Asia’s power sector
v
Contents
Acknowledgements .............................................................................................................................. ii
Glossary ................................................................................................................................................ iii
Executive Summary .............................................................................................................................. 1
1. Introduction ....................................................................................................................................... 3
2. The crucial development of the power sector in Southeast Asia and the coal–gas
competition ............................................................................................................................................ 3
A sharp increase in energy and electricity demand ............................................................................ 4
The increasing role of coal in the power sector .................................................................................. 6
Coal and gas competition in Southeast Asia ...................................................................................... 8
3. The challenge of meeting the rise in electricity demand ............................................................ 12
Significant and common challenges in Southeast Asia .................................................................... 12
Game changers in the power sector ................................................................................................. 15
An aggressive development of renewable energy ......................................................................... 15
Improving energy efficiency ........................................................................................................... 17
ASEAN power market integration .................................................................................................. 18
Clean coal technologies ................................................................................................................. 19
4. Major reassessments of national power development plans and the future role of coal in the
power sector ........................................................................................................................................ 22
Alignment of power development plans with INDCs results in lower coal capacity .......................... 22
But coal still dominates additional power capacity ............................................................................ 23
Additional coal capacity is concentrated in two countries and remains uncertain ............................ 24
A steep increase in coal demand in the short term, but uncertainties on the horizon ...................... 26
5. Implications for regional and global coal trade ........................................................................... 29
Southeast Asian supplies .................................................................................................................. 29
Abundant coal resources ............................................................................................................... 29
Southeast Asian coal imports are surging ..................................................................................... 30
But Indonesian exports fell sharply in 2015 ................................................................................... 31
The key role of Southeast Asia in the global steam coal trade ......................................................... 35
6. Conclusion ....................................................................................................................................... 38
Annex 1: Outlook for coal supply and demand by Southeast Asian country .............................. 40
Indonesia ........................................................................................................................................... 40
Vietnam ............................................................................................................................................. 41
Thailand............................................................................................................................................. 42
Malaysia ............................................................................................................................................ 43
Philippines ......................................................................................................................................... 43
Myanmar ........................................................................................................................................... 44
Cambodia .......................................................................................................................................... 44
Lao PDR ............................................................................................................................................ 44
Annex 2: Global steam coal trade declined in 2015 for the first time ever ................................... 46
International steam coal prices: ‘boom and bust’ is the rule ............................................................. 48
List of tables, figures, boxes and maps ............................................................................................. vi
References ........................................................................................................................................... 49

December 2016: The role of coal in Southeast Asia’s power sector
vi
List of tables, figures, boxes and maps
Tables
Table 1: Southeast Asia’s coal power capacity under construction and proposed (beginning of 2016) 8
Table 2: Key economic and energy indicators in Southeast Asia ......................................................... 13
Table 3: RE targets and RE installed capacity in ASEAN .................................................................... 16
Table 4: Hard coal and lignite resources in Southeast Asia (end of 2014) ........................................... 29
Table 5: Outlook for coal production, demand and imports in Vietnam ................................................ 42
Table 6: Outlook for coal production, demand and imports in Thailand ............................................... 42
Table 7: Outlook for coal demand and imports in Malaysia .................................................................. 43
Table 8: Outlook for coal production, demand and imports in the Philippines ...................................... 44
Figures
Figure 1: Southeast Asia’s total primary energy supply in 2014 – by country ........................................ 5
Figure 2: Historical and projected energy mix in Southeast Asia in the IEA’s WEO 2015 NPS ............. 5
Figure 3: Electricity generation in Southeast Asia in 2014 by country and fuel/technology ................... 6
Figure 4: Installed generation capacity by ASEAN country and fuel/technology in 2015 ....................... 7
Figure 5: Coal and gas prices in Asia ..................................................................................................... 9
Figure 6: LCOE for coal and gas under different price and environmental assumptions ..................... 10
Figure 7: Capacity additions by country and technology (2016–25) ..................................................... 23
Figure 8: Existing coal capacity and capacity additions in Southeast Asia by 2025 ............................. 24
Figure 9: Southeast Asian power generation capacity mix in the IEA Scenarios ................................. 26
Figure 10: Evolution of coal consumption in Southeast Asia (2000–15) .............................................. 27
Figure 11: Outlook for coal demand in ASEAN countries by 2030 ....................................................... 28
Figure 12: ASEAN coal production by country (2000–15) .................................................................... 30
Figure 13: Southeast Asian coal imports (2000–15) ............................................................................. 31
Figure 14: Indonesian coal exports by destination ............................................................................... 32
Figure 15: Recent steam coal export prices ......................................................................................... 35
Figure 16: Outlook for coal imports in Southeast Asia by 2030 ............................................................ 36
Figure 17: Outlook for coal demand in Indonesia ................................................................................. 41
Figure 18: Global steam coal imports by basin ..................................................................................... 46
Figure 19: Asian steam coal imports by main country .......................................................................... 47
Figure 20: Coal exports to the Pacific Basin ......................................................................................... 47
Figure 21: Australian FOB steam coal prices ....................................................................................... 48

December 2016: The role of coal in Southeast Asia’s power sector
vii
Boxes
Box 1: Financing of coal-power plants in Southeast Asia ..................................................................... 12
Box 2: The adoption of HELE technologies in Southeast Asia ............................................................. 20
Box 3: Outlook for Southeast Asian coal-based power in IEA ‘New Policy’ and ‘Bridge’ scenarios ..... 25
Box 4: China’s new regulation on coal mining has led to rising imports and prices since June 2016 .. 34
Map
Map 1: ASEAN Power Grid (APG) ........................................................................................................ 18

December 2016: The role of coal in Southeast Asia’s power sector
1
Executive Summary
Southeast Asia currently plays a key role in rebalancing the global steam coal market – and it could
well play this role in any future rebalancing. Southeast Asia is home to the largest steam coal
exporter, Indonesia, but these exports are decreasing. The region also houses booming coal
importing countries, such as Malaysia, Thailand, the Philippines, and Vietnam (which turned into a net
importer in 2015).
Driven by rapidly increasing electricity demand, regional coal demand has surged since 2010. The
availability of coal in the region, and its lower cost than competing fuels, has made coal the preferred
option to fuel rising power demand. The region added 25 GW of coal-based capacity in the past five
years, accounting for 42 per cent of total additional generation capacity. Even the gas-producing
countries in the region have introduced more coal in their electricity mix as gas shortages pushed
them to diversify their mix. In the short to medium term, this trend is going to continue: there are 29
GW of coal-based capacity under construction in the region, most of them to be completed by 2020.
In addition, there is a huge number of permitted and announced coal-fired power plants in the
pipeline, which means that the shift towards coal may continue well after 2020. However, this shift
compromises the national commitments taken by Southeast Asian governments to reduce their
greenhouse gas emissions.
In the wake of the Paris Agreement, national governments across the region have started to reassess
their power development plans, introducing more renewable energy sources, promoting energy
efficiency measures, and reducing the contribution of coal in the electricity mix. This reassessment,
however, does not constitute a shift away from coal. Despite the scale back, coal still dominates the
targeted additional capacity, followed by natural gas, hydropower, and other renewables. The planned
large increase in renewables (including hydro), together with the adoption of clean coal technologies,
allow Southeast Asian nations to reconcile a growing coal consumption with national commitments to
reduce their carbon intensity compared with a business-as-usual scenario.
Most of the additional coal capacity planned for completion by 2025 is concentrated in two countries,
Indonesia and Vietnam. But in both countries, the targets are challenging. In Indonesia, given the
delays and revisions that have affected previous and ongoing power capacity building programmes, it
is unlikely that the ambitious target will be met. After COP21, the Vietnamese government announced
its intention to review the development plans of all coal plants, making the planned coal boom
uncertain. The growth in Southeast Asian coal demand is therefore mixed: until 2020, it is expected to
be steep as more coal-fired power plants are commissioned, but after that date, the rate of growth is
expected to slow down significantly. The wide range of outlooks for future coal demand has a
significant impact on coal trade in the region.
Regional coal imports have surged since 2010 – growing by 21 per cent in 2015 to 75 Mt – and are
expected to reach 140 Mt by 2020. This growth is led by expansion of the coal fleet in Vietnam,
Malaysia, the Philippines, and Thailand (and, to a much smaller extent, Cambodia) and it is secured
by anticipated demand from power plants currently under construction or committed, although delays
may limit coal imports to 115 Mt by 2020. However, in the 2020s, the rate of growth in coal imports
could slow down dramatically and in some countries, it could even be negative. Much of the
uncertainty comes from Vietnam and, to a lesser extent, Thailand. Southeast Asian coal imports could
peak after 2025 at 150–160 Mt per year in a low scenario, or increase to 230 Mt by 2030 if the
targeted coal capacity included in the national power development plans is built. Putting this into
perspective, however, even in a high scenario the additional regional import demand is far less than
the amount that has been added by either China or India to the international steam coal market over
the past few years. Therefore, on the demand side, the balance of the global coal market will continue
to be determined by China and India, at least in the short to medium term.

December 2016: The role of coal in Southeast Asia’s power sector
2
On the supply side, due to its importance in the Pacific Basin steam coal market, the role of Indonesia
is important to the rebalancing of the market. After an impressive growth between 2008 and 2013,
Indonesian steam coal exports declined in 2014 and plunged in 2015 due to reduced coal import
demand by its major customers. Although Indonesia is one of the lowest-cost producers in the world,
there is a wide range of production costs in the country. Low international coal prices have forced
higher-cost small miners to stop production as they were unable to recover their operational costs.
But other factors are at play to explain the fall in Indonesian coal exports. Growing coal demand in
Indonesia has led the government to prioritize sales of coal production to the domestic market and to
control coal production. New regulation to restrict illegal coal production and exports, the ongoing
consolidation of the mining permit process, and the recent moratorium on new coal mining activities,
are all likely to reduce Indonesian coal production and exports even further. In the short term, by
reducing available coal supply to the export market, Indonesia’s coal policy facilitates the rebalancing
of the global market and the increase in coal prices. Combined with the unexpected increase in
Chinese coal imports since June 2016, the global coal market has tightened and coal prices have
almost doubled since January 2016 to above $100/t at the beginning of November 2016 (Australian
steam coal marker), whereas global coal demand continues to shrink.
In the longer term, Indonesia’s coal mining policy, combined with rapidly growing domestic coal
demand, questions the availability of Indonesian coal for the export market. On one hand, the size of
Indonesian coal resources might allow large Indonesian mining companies to expand their production
to serve both the export and domestic markets, provided that coal prices are high enough to
incentivize investment in coal mining and transportation. On the other hand, should the government
maintain a cap on coal production on a long-term basis (currently production is capped at around 400
Mt per year), Indonesian exports will fall significantly, but gradually.
Reduced Indonesian coal exports could also result from choices made by coal buyers. A significant
portion of Indonesian steam coal exports consists of low-grade coal (in other words, coal with a low
calorific value) which is sold at a discount on the international market once adjusted for energy
content, but it emits more CO2 per kWh than high-calorific value coal. As seen in 2015, coal buyers
are becoming more selective. The reduction of coal imports by China in 2015 was partly explained by
new regulation on coal quality, which reduced the attractiveness of Indonesian low-calorific value
coal. The decline of Indian imports was also more pronounced for Indonesian suppliers than for other
suppliers to the Indian market. On a long-term basis, if Indonesian low-grade coal is no longer
exported – either because it is consumed locally or because buyers don’t want this quality anymore –
the balance of the global market will depend on a very small number of producers, mainly Australian
ones, and their ability to ramp up their production.

December 2016: The role of coal in Southeast Asia’s power sector
3
1. Introduction
Southeast Asia is a cornerstone of the global steam coal market, a position the region is set to
maintain in the coming decades. As international steam coal trade has declined over the past two
years – mainly due to declining import demand by China, and to a lesser extent by India –
developments in supply and demand in Southeast Asia may play a key role in the rebalancing of the
global steam coal market. This is due to two factors:
1. Southeast Asia is home to the world’s leading steam coal exporter, Indonesia, which accounts for more than a third of global steam coal trade and half of the Pacific Basin’s steam coal imports. Any change in Indonesian energy policy is likely to affect global steam coal trade, and particularly trade in the Pacific Basin.
2. The region houses growing coal importing countries, such as Malaysia, Thailand, the Philippines and, more recently, Vietnam which turned into a net importer in 2015. In 2015, these countries collectively increased their imports by 21 per cent to 75 million tons (Mt) as coal demand continued to increase.
Coal demand in Southeast Asia – as in the rest of the world – is dominated by the power sector,
which accounts for 80 per cent of regional coal demand. This paper therefore mainly focuses on the
power sector as the main driver of future growth in regional coal demand (and consequently in coal
imports by the coal-importing countries of the region). The assessment of coal demand is based on
an analysis of recent national power development plans, combined with an assessment of coal-fired
power plants currently under construction and planned in the region. It also considers challenges and
uncertainties faced by the coal sector, in view of growing environmental concerns and national
commitments to reduce greenhouse gas (GHG) emissions. On the supply side, the paper analyses
the key role of Indonesia, the world’s largest steam coal exporter, in the rebalancing of the global coal
market, and how recent national policy decisions on coal supply and demand, as well as current
global market conditions, may affect the country’s coal exports.1
2. The crucial development of the power sector in Southeast Asia and the coal–gas competition
Southeast Asia is one of the most dynamic regions in the world. It was home to 633 million people in
2015 and is continuing to experience high economic growth, robust population increase, and rapid
urbanization. Since the Association of Southeast Asian Nations (ASEAN) was established on 8
August 1967, the ten member states – Brunei Darussalam (Brunei), Cambodia, Indonesia, Lao
People’s Democratic Republic (Lao PDR), Malaysia, Myanmar, the Philippines, Singapore, Thailand,
and Vietnam – have pursued political and security cooperation, economic integration, and socio-
cultural cooperation. ASEAN has contributed significantly to meeting the objectives of: reducing the
poverty rate, improving the overall well-being of the peoples of ASEAN, narrowing the development
gap, strengthening economic development, and expanding both extra- and intra-ASEAN trade and
investment. Southeast Asia has exceeded the global growth average for the last ten years. In 2014,
the combined gross domestic product (GDP) of the region rose to $2.57 trillion, average GDP per
capita reached $4,136, and trade hit a record level of $2.53 trillion. Foreign direct investment (FDI)
inflows to the region have also grown steadily over the years to reach $136.2 billion.2 Economic
growth in Southeast Asia averaged 5.1 per cent during the period 1990–2013, but has slowed
recently as a result of the economic slowdown in China (a major trading partner for the region), and
the persistence of low international energy prices which affected the government revenues of energy
exporters (Indonesia, Malaysia, Brunei) negatively. Despite the recent slowdown, prospects for further
1 The main findings at regional level are presented in the appendix of this paper, which will be complemented by forthcoming
detailed reports on Indonesia and major importing countries in the region (Vietnam, Thailand, Malaysia, and the Philippines).
This paper follows two previous ones dedicated to China and India (OIES, 2016 and OIES, 2014). 2 ASEAN Secretariat (2015a).

December 2016: The role of coal in Southeast Asia’s power sector
4
sustained growth remain favourable. Aggregate growth in the ASEAN economies is forecast to
accelerate steadily from 4.4 per cent in 2015 to 4.5 per cent in 2016 and 4.8 per cent in 2017,
according to the Asian Development Bank.3 Growth will be led by Indonesia, which accounts for 35
per cent of regional GDP, as it ramps up investment in infrastructure and implements policy reform to
spur private investment.
Following the establishment of the ASEAN Economic Community (AEC) in December 2015, 2016
marks an important milestone for regional integration in Southeast Asia. The AEC represents one of
the largest single market economies in the world – the third largest economy in Asia – and facilitates
the free movement of goods, services, and professionals. The AEC Blueprint 2025, which was
launched in November 2015, highlights strategic measures for the community from 2016 to 20254 and
it encourages further trade through reduced or eliminated regulatory barriers and deeper connectivity.
As a result of these policies, the region is projected to grow by at least 4 per cent per year on average
over the next five years, but growth could be as high as 6.1 per cent – provided that ASEAN moves
toward greater integration and member states continue to implement domestic structural reforms to
raise their productivity and competitiveness.5
A sharp increase in energy and electricity demand
Reflecting the steady economic growth and robust demographic development of the region, energy
demand in Southeast Asia has increased by over 150 per cent since 1990, from 233 million tons of oil
equivalent (Mtoe) in 1990 to 624 Mtoe in 2014, according to the International Energy Agency (IEA).6
The five biggest energy consumers are Indonesia, Thailand, Malaysia, Vietnam, and the Philippines.
Together, they account for 90 per cent of the region’s energy demand, while the five remaining
ASEAN countries contribute only 10 per cent.
The total primary energy supply (TPES) of each ASEAN country in 2014, is shown in Figure 1 and it
can be seen that each country’s TPES relies heavily on fossil fuels. Fossil fuels accounted for almost
three-quarters of the energy mix in 2014, compared with 56 per cent in 1990. While oil contributed the
majority of the growth over the period 1990–2014, natural gas demand also expanded rapidly in the
1990s, mainly fuelled by domestic gas production. Most Southeast Asian countries installed natural
gas-fired power plants, which boosted the share of gas to 19 per cent of TPES in 2000 from 13 per
cent in 1990. Since 2000, the rate of growth in gas demand has slowed down, as gas production in
the producing countries of the region levelled off. The share of gas only gained 3 percentage points,
to 22 per cent of TPES, by 2014. In contrast, coal demand has soared from just 32 Mtoe in 2000
(about 8 per cent of TPES) to 99 Mtoe in 2014 (16 per cent). This equates to an annual compound
average growth rate (CAGR) of 8.4 per cent from 2000 to 2014. A large number of coal-fired power
plants were put into operation during the period to diversify the electricity mix and fuel the growing
economy. Bioenergy, mostly traditional biomass, is still largely used in Southeast Asia, with a share of
20 per cent of TPES in 2014. Other renewable energies (RE) accounted for only 4 per cent.
3 ADB (2016a). 4 ASEAN Secretariat (2015b). 5 ASEAN Secretariat (2015b). 6 IEA (2016a).
December 2016: The role of coal in Southeast Asia’s power sector
5
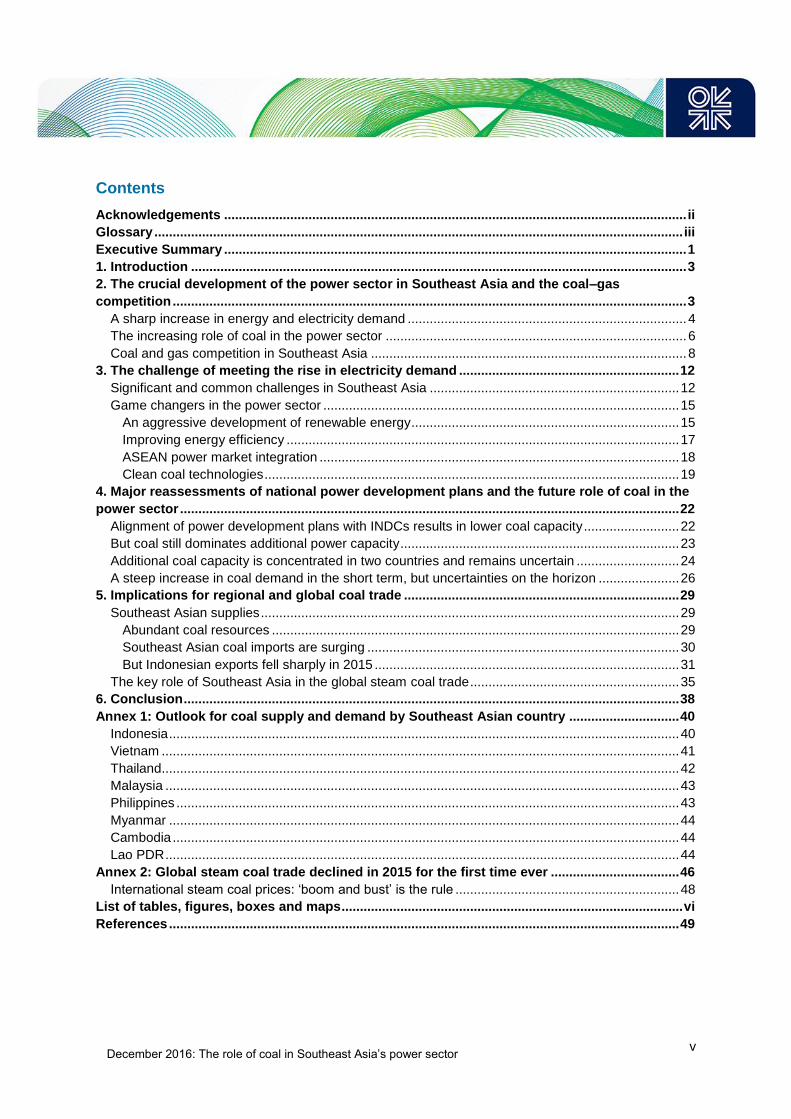
Figure 1: Southeast Asia’s total primary energy supply in 2014 – by country
Source: IEA
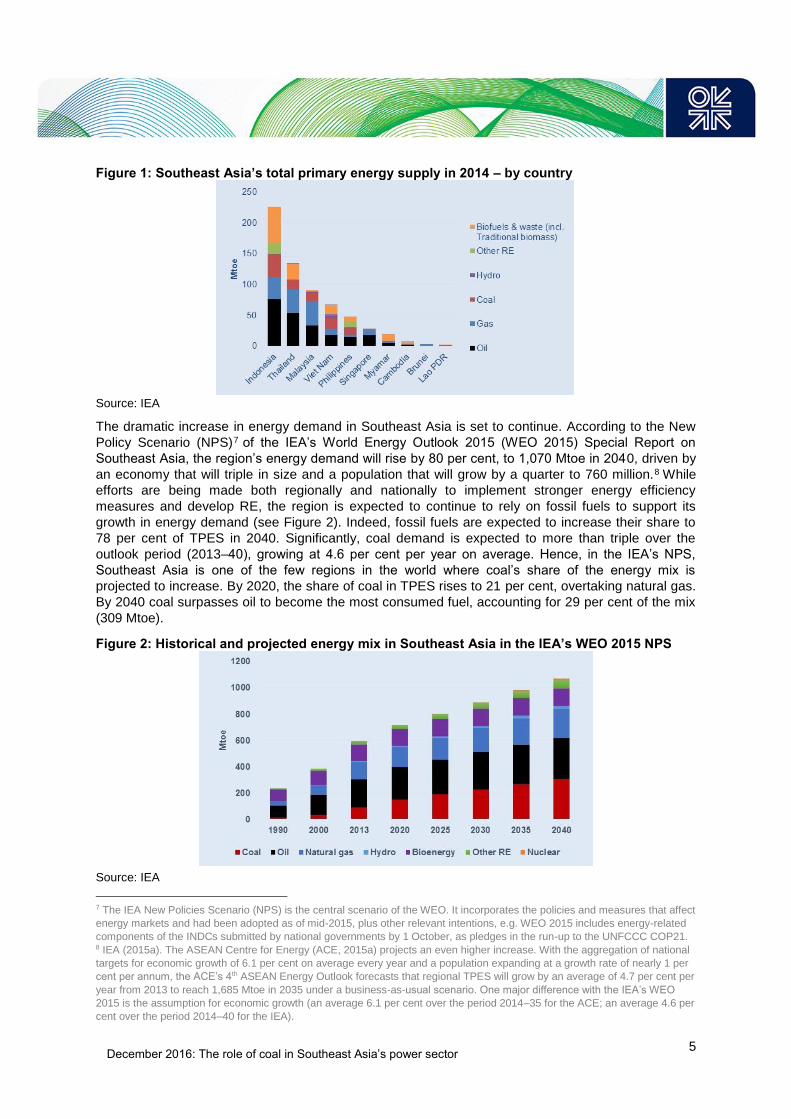
The dramatic increase in energy demand in Southeast Asia is set to continue. According to the New
Policy Scenario (NPS)7 of the IEA’s World Energy Outlook 2015 (WEO 2015) Special Report on
Southeast Asia, the region’s energy demand will rise by 80 per cent, to 1,070 Mtoe in 2040, driven by
an economy that will triple in size and a population that will grow by a quarter to 760 million.8 While
efforts are being made both regionally and nationally to implement stronger energy efficiency
measures and develop RE, the region is expected to continue to rely on fossil fuels to support its
growth in energy demand (see Figure 2). Indeed, fossil fuels are expected to increase their share to
78 per cent of TPES in 2040. Significantly, coal demand is expected to more than triple over the
outlook period (2013–40), growing at 4.6 per cent per year on average. Hence, in the IEA’s NPS,
Southeast Asia is one of the few regions in the world where coal’s share of the energy mix is
projected to increase. By 2020, the share of coal in TPES rises to 21 per cent, overtaking natural gas.
By 2040 coal surpasses oil to become the most consumed fuel, accounting for 29 per cent of the mix
(309 Mtoe).
Figure 2: Historical and projected energy mix in Southeast Asia in the IEA’s WEO 2015 NPS
Source: IEA
7 The IEA New Policies Scenario (NPS) is the central scenario of the WEO. It incorporates the policies and measures that affect
energy markets and had been adopted as of mid-2015, plus other relevant intentions, e.g. WEO 2015 includes energy-related
components of the INDCs submitted by national governments by 1 October, as pledges in the run-up to the UNFCCC COP21. 8 IEA (2015a). The ASEAN Centre for Energy (ACE, 2015a) projects an even higher increase. With the aggregation of national
targets for economic growth of 6.1 per cent on average every year and a population expanding at a growth rate of nearly 1 per
cent per annum, the ACE’s 4th ASEAN Energy Outlook forecasts that regional TPES will grow by an average of 4.7 per cent per
year from 2013 to reach 1,685 Mtoe in 2035 under a business-as-usual scenario. One major difference with the IEA’s WEO
2015 is the assumption for economic growth (an average 6.1 per cent over the period 2014–35 for the ACE; an average 4.6 per
cent over the period 2014–40 for the IEA).
December 2016: The role of coal in Southeast Asia’s power sector
6
The increasing role of coal in the power sector
Since 1990, electricity generation in Southeast Asia has increased faster than economic growth rates.
Between 1990 and 2014, the economy grew by 5 per cent per year on average, while electricity
generation grew at 7.4 per cent and reached about 843 terawatt hours (TWh) in 2014. Demand
growth has been driven by rising population, the rapid pace of urbanization, enormous increases in
industrial production, and the progressive extension of access to modern electricity to larger
segments of rural populations. Five countries (Indonesia, Thailand, Malaysia, Vietnam, and the
Philippines) account for more than 90 per cent of the region’s generated electricity (see Figure 3).
Natural gas and coal are the two main fuel sources of electricity generation, accounting for 44 per
cent and 34 per cent respectively of electricity generation in 2014. Oil still represents 5 per cent of the
electricity mix and while it is being displaced by other power generation sources, this shift is not yet
complete at the regional level as the difficult geography of some countries makes the displacement of
small diesel generators difficult in isolated areas. Renewable energy represented 17 per cent of total
electricity generation. Hydropower is the main source of RE power generation, followed by
geothermal. Some countries – such as Cambodia, Myanmar, and Vietnam – have more than 50 per
cent of their electricity supplied by hydro. Lao PDR is almost 100 per cent dependent on hydropower.
While natural gas still dominates the electricity mix (see Figure 3) the shift to coal has accelerated
since 2010. Hence, the share of gas in electricity generation has decreased by 5 percentage points
(from 49 per cent in 2010 to 44 per cent in 2014) while that of coal has surged from 27 per cent to 34
per cent. The continued ramp-up of coal-fired generation is underpinned by coal’s price advantage
and availability relative to natural gas and other fuel sources, and the demand for widespread and
rapid electrification. Coal is a significant fuel in the power mix of Indonesia, Malaysia, and the
Philippines with a share of 40 per cent to 50 per cent of the electricity produced in these countries
(see Figure 3). The power sector in Vietnam and Thailand is less dependent on coal (20–25 per cent
of electricity generation).
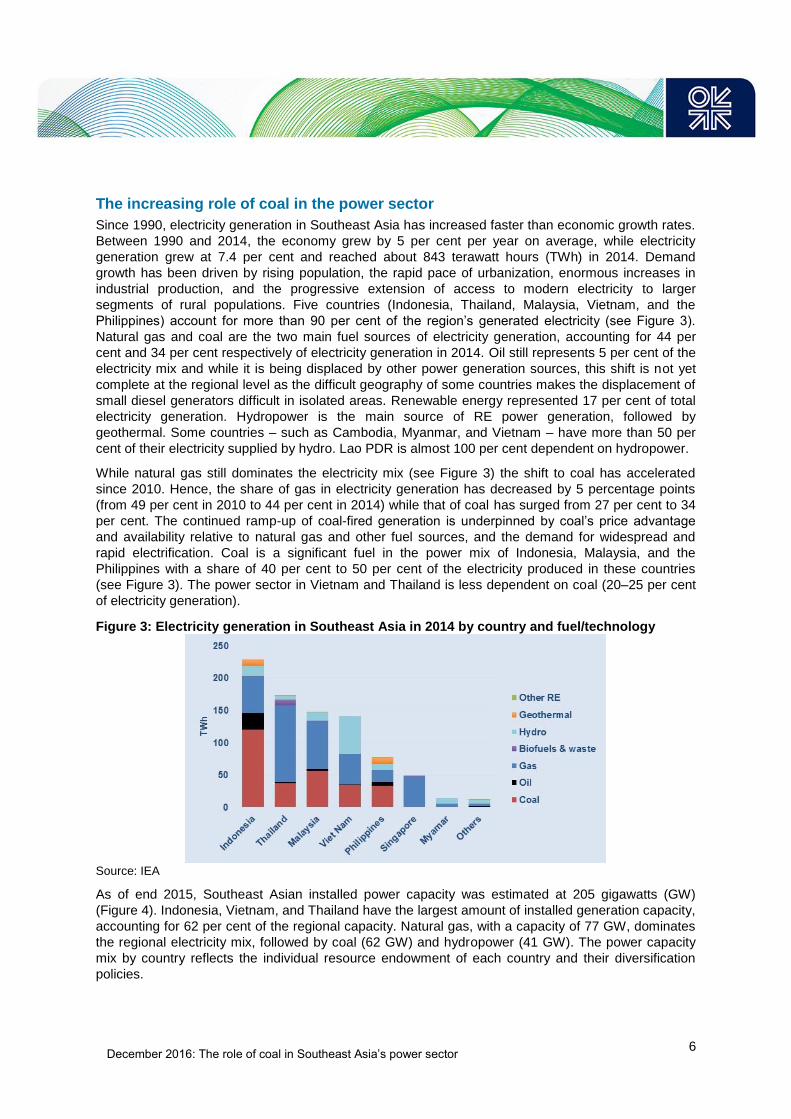
Figure 3: Electricity generation in Southeast Asia in 2014 by country and fuel/technology
Source: IEA
As of end 2015, Southeast Asian installed power capacity was estimated at 205 gigawatts (GW)
(Figure 4). Indonesia, Vietnam, and Thailand have the largest amount of installed generation capacity,
accounting for 62 per cent of the regional capacity. Natural gas, with a capacity of 77 GW, dominates
the regional electricity mix, followed by coal (62 GW) and hydropower (41 GW). The power capacity
mix by country reflects the individual resource endowment of each country and their diversification
policies.

December 2016: The role of coal in Southeast Asia’s power sector
7
Figure 4: Installed generation capacity by ASEAN country and fuel/technology in 2015
Notes: only domestic capacity (excludes import capacity). Brunei (1 GW of total capacity, almost 100 per cent gas-based) is not shown on the graph. Indonesia: only PLN system. Thailand: only EGAT system.
Source: National annual reports9
Gas-based capacity is well developed in gas-producing countries (Malaysia, Indonesia, Thailand).
The role of gas in their power sector was predicated on a history of cheap domestic gas. However, in
the three countries, rapid growth in power demand has led to gas shortages, pushing the countries to
diversify their power mix away from gas and introduce coal to diversify and secure the power mix.
Coal has also been introduced in hydro-dependent countries, such as Vietnam, to secure electricity
supplies all around the year. Over the past five years, coal has been the fuel of choice for power
generation: almost 25 GW of additional coal capacity was built during the period 2010–15, accounting
for 42 per cent of total capacity additions over the period. In 2015 alone, an additional 7.7 GW of coal-
fired capacity came online, of which half was in Vietnam; this brought ASEAN coal capacity to slightly
above 62 GW at the end of 2015.
The shift to coal observed since 2010 will continue in the short and medium term. At the beginning of
2016, there were about 29 GW of coal-fired capacity under construction, to be completed by around
2020, most of them in Vietnam (12.8 GW), Indonesia (6 GW), the Philippines (4.7 GW), and Malaysia
(4.6 GW). In addition, in 2015, the Indonesian government announced a fast-track programme to
rapidly expand Indonesian power capacity by adding 35 GW of capacity by 2019, of which 20 GW are
to be coal fired (‘the 35,000 MW programme’).10 Beyond plants under construction, the capacity of
permitted, pre-permitted, and announced coal-fired power plants amounted to 113 GW at the
beginning of 2016 (Table 1), making Southeast Asia the third-highest region for coal proposals after
East and South Asia.
9 PLN (2016b); General Statistics Office (Vietnam); Department of Energy (DOE) (Philippines) (2016): Ministry of Energy
(Thailand) (2015); Energy Commission (Malaysia) (2015); Energy Market Authority (EMA) (Singapore); Electricite du Laos
(EDL); ADB (2016b); Ministry of Mines and Energy of Cambodia (2016). 10 As of June 2016, of the total additional capacity, 8.2 GW (22 per cent of the total capacity) were under construction, 9.8 GW
(27 per cent) were approaching financial closure, 10.4 GW (28 per cent) were in the procurement stage, and 8.1 GW (22 per
cent) were in the planning phase. PLN (2016c).
Coal30%
Oil7%
Gas37%
Hydro20%
Other RE6%
ASEAN power capacity in 2015: 205 GW
0
10
20
30
40
50
60
GW
Other RE
Hydro
Gas
Oil
Coal
52.9
38.4
18.7
36.9
31.9
13.4
5.5 5.2
1.7
December 2016: The role of coal in Southeast Asia’s power sector
8
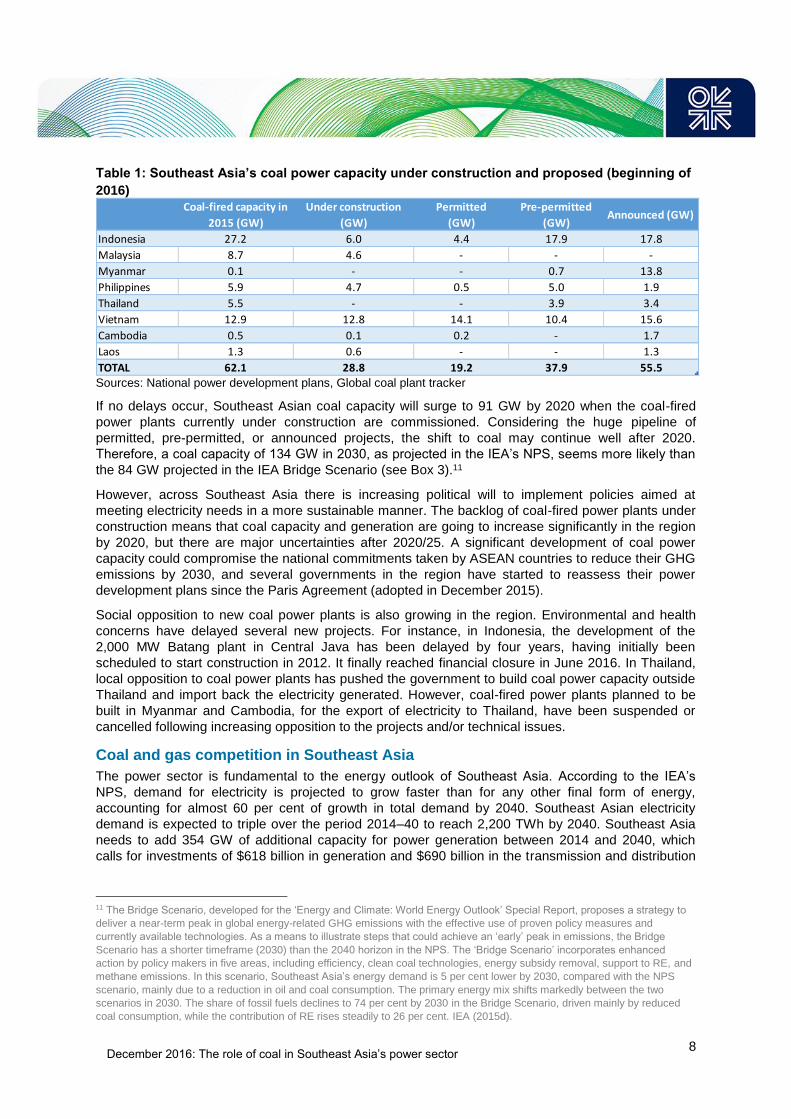
Table 1: Southeast Asia’s coal power capacity under construction and proposed (beginning of
2016)
Sources: National power development plans, Global coal plant tracker
If no delays occur, Southeast Asian coal capacity will surge to 91 GW by 2020 when the coal-fired
power plants currently under construction are commissioned. Considering the huge pipeline of
permitted, pre-permitted, or announced projects, the shift to coal may continue well after 2020.
Therefore, a coal capacity of 134 GW in 2030, as projected in the IEA’s NPS, seems more likely than
the 84 GW projected in the IEA Bridge Scenario (see Box 3).11
However, across Southeast Asia there is increasing political will to implement policies aimed at
meeting electricity needs in a more sustainable manner. The backlog of coal-fired power plants under
construction means that coal capacity and generation are going to increase significantly in the region
by 2020, but there are major uncertainties after 2020/25. A significant development of coal power
capacity could compromise the national commitments taken by ASEAN countries to reduce their GHG
emissions by 2030, and several governments in the region have started to reassess their power
development plans since the Paris Agreement (adopted in December 2015).
Social opposition to new coal power plants is also growing in the region. Environmental and health
concerns have delayed several new projects. For instance, in Indonesia, the development of the
2,000 MW Batang plant in Central Java has been delayed by four years, having initially been
scheduled to start construction in 2012. It finally reached financial closure in June 2016. In Thailand,
local opposition to coal power plants has pushed the government to build coal power capacity outside
Thailand and import back the electricity generated. However, coal-fired power plants planned to be
built in Myanmar and Cambodia, for the export of electricity to Thailand, have been suspended or
cancelled following increasing opposition to the projects and/or technical issues.
Coal and gas competition in Southeast Asia
The power sector is fundamental to the energy outlook of Southeast Asia. According to the IEA’s
NPS, demand for electricity is projected to grow faster than for any other final form of energy,
accounting for almost 60 per cent of growth in total demand by 2040. Southeast Asian electricity
demand is expected to triple over the period 2014–40 to reach 2,200 TWh by 2040. Southeast Asia
needs to add 354 GW of additional capacity for power generation between 2014 and 2040, which
calls for investments of $618 billion in generation and $690 billion in the transmission and distribution
11 The Bridge Scenario, developed for the ‘Energy and Climate: World Energy Outlook’ Special Report, proposes a strategy to
deliver a near-term peak in global energy-related GHG emissions with the effective use of proven policy measures and
currently available technologies. As a means to illustrate steps that could achieve an ‘early’ peak in emissions, the Bridge
Scenario has a shorter timeframe (2030) than the 2040 horizon in the NPS. The ‘Bridge Scenario’ incorporates enhanced
action by policy makers in five areas, including efficiency, clean coal technologies, energy subsidy removal, support to RE, and
methane emissions. In this scenario, Southeast Asia’s energy demand is 5 per cent lower by 2030, compared with the NPS
scenario, mainly due to a reduction in oil and coal consumption. The primary energy mix shifts markedly between the two
scenarios in 2030. The share of fossil fuels declines to 74 per cent by 2030 in the Bridge Scenario, driven mainly by reduced
coal consumption, while the contribution of RE rises steadily to 26 per cent. IEA (2015d).
Coal-fired capacity in
2015 (GW)
Under construction
(GW)
Permitted
(GW)
Pre-permitted
(GW)Announced (GW)
Indonesia 27.2 6.0 4.4 17.9 17.8
Malaysia 8.7 4.6 - - -
Myanmar 0.1 - - 0.7 13.8
Philippines 5.9 4.7 0.5 5.0 1.9
Thailand 5.5 - - 3.9 3.4
Vietnam 12.9 12.8 14.1 10.4 15.6
Cambodia 0.5 0.1 0.2 - 1.7
Laos 1.3 0.6 - - 1.3
TOTAL 62.1 28.8 19.2 37.9 55.5

December 2016: The role of coal in Southeast Asia’s power sector
9
of this power. 12 The overwhelming share of the power sector in future demand highlights the
importance of fuel and technology choices in the sector in shaping Southeast Asia’s energy and GHG
emissions outlook.
The generation cost is a key determinant of the mix of fuels and technologies used in Southeast Asia
to generate electricity. As a significant portion of the ASEAN population is within the lower-income
consumer category, the lowest electricity supply costs are often favoured by decision makers to
reduce the financial burden on consumers. Despite efforts to increase the role of RE, natural gas and
coal will dominate the future electricity mix of the region, and the relative generation cost will remain a
fundamental factor in deciding between gas and coal. Competition between gas and coal has
favoured coal in Southeast Asia, but the coal advantage has been reduced significantly by the recent
reduction in gas prices (see Figure 5). The price of imported liquefied natural gas (LNG) prices in Asia
has been very volatile. It peaked at around $16 per million British thermal units (MMBtu) from 2011 to
2014, collapsed to $10.3/MMBtu in 2015, and then fell to historic low levels, close to $6/MMBtu, in
August 2016. International coal prices have declined sharply during the past five years, from $126/t in
2011 to $63.5/t in 2015 (Asian steam coal marker – in other words, the delivered price of steam coal
in Asia).13 Despite their recent recovery (see Box 4), delivered steam coal prices settled at $75/t in
August 2016, or the equivalent of $2.7/MMBtu. Despite their sharp decline, gas prices are still more
than twice the level of coal prices on an energy equivalence basis.
Figure 5: Coal and gas prices in Asia
Source: BP
Natural gas-fired power plants are, however, cheaper and quicker to build than coal-fired power
plants, have higher efficiencies and greater flexibility in plant operation, and above all emit less CO2
than coal power plants. (The cost of capital expenditure for combined cycle gas turbine (CCGT) plants
is around half that of coal on a per kWe capacity basis and their CO2 emissions are also half that of
coal.)
The levelized cost of electricity generation (LCOE)14 is commonly used in national power development
plans to compare the costs of different technologies. Based on IEA assumptions for the costs of
capital, operation and maintenance, and finance, and using 2015 prices for coal and gas ($63.5/t for
coal and $10.3/MMBtu for gas), the generating cost of a new supercritical (SC) coal plant is 35 per
cent cheaper than the generating cost for a new CCGT plant (Figure 6). However, at August 2016
coal and gas prices, the generating costs for coal and gas are similar – even slightly cheaper for gas.
12 IEA (2015b). 13 BP (2016). 14 The LCOE includes fixed costs, variable costs (operation and maintenance and fuel) and financing costs for new power
plants. In order to make meaningful comparisons, it is necessary to make a range of assumptions about various costs and
operating parameters of competing technologies, as well as assumptions on future coal and gas prices.

December 2016: The role of coal in Southeast Asia’s power sector
10
But if coal prices rise to $100/t and gas to $10/MMBtu, coal becomes about 20 per cent cheaper than
the generating cost for a new CCGT plant. The calculation does not take into account the
environmental impact of fuel combustion as Southeast Asian countries do not yet have carbon
markets or a carbon tax. If a carbon price of 15$/tCO2 is added on top of other costs, the advantage of
coal is reduced significantly.
Figure 6: LCOE for coal and gas under different price and environmental assumptions
Source: Author, based on IEA’s assumptions15
The utility of LCOE is limited somewhat by the fact that it requires making a set of simplifying
assumptions. 16 For example, to calculate the amount of electricity produced, it is necessary to
assume some average load factor – the number of hours per year the plant is expected to run. The
LCOE calculation is usually performed assuming ideal conditions, and so load factor assumptions
tend to be at the high end of what is realistic. The integration of more RE sources in the power mix of
ASEAN countries will have an impact on the load factors of the gas and coal fleet, reducing their
profitability.
Additionally, the LCOE calculation is highly dependent on fuel costs, which are different in each
Southeast Asian country. While coal is generally available at international market prices in all
countries, and is cheaper in Indonesia, the price of gas differs widely from one country to another
depending on each country’s gas resource endowment. Very often, in the gas-producing countries of
the region, the price of gas to the power sector has been subsidized. For instance in Malaysia, the
government regulates the price of gas provided to the domestic power sector. Higher gas prices and
costly imports of LNG in 2013 and 2014 made subsidies for power generation untenable and the
government has started to remove subsidies. The price of gas supplied to the country’s domestic
power sector was MYR18.20/MMBtu ($4.64/MMBtu) at the beginning of 2016, but is expected to rise
by MYR1.50/MMBtu ($0.38/MMBtu) every six months to eventually converge with the market price, a
convergence that will be facilitated by the current decline in Asian imported gas prices. The price of
coal for the power sector was MYR10.57/MMBtu in 2015 (about $2.7/MMBtu or $75/t).17
The IEA Clean Coal Centre (IEA CCC) has estimated historical LCOEs for individual Asian countries;
these indicate wide differences among the countries, depending on their individual fuel costs and the
historic load factors of gas and coal power plants.18 Based on past fuel prices in the region, along with
project costs and plant performance, the outcome of the IEA CCC’s LCOE comparison between
natural gas and coal is mixed. The average LCOE in Indonesia, Malaysia, Vietnam, and the
Philippines suggests that low (subsidized) natural gas prices made CCGT more competitive.
However, shortage of gas supply has made coal the fuel of choice for power generation. In addition,
15 Based on IEA (2015a). 16 IEA (2015b). 17 Energy Commission (Malaysia) (2016) and IEA (2016d). 18 IEA CCC (2015).

December 2016: The role of coal in Southeast Asia’s power sector
11
in the gas exporting countries of the region, the economic impact of using gas to generate power is a
function of the opportunity cost of gas, whereby switching to coal as a cheaper source of fuel for
power generation and exporting gas abroad (at a much higher price than the domestic price of gas
sold to the power sector) generates profit to support the country’s economic growth.
The calculation of future generation costs requires making assumptions on future coal and gas prices,
which in current market conditions is extremely difficult. On one hand, the ongoing removal of gas
subsidies in some Southeast Asian countries and the reduced availability of indigenous gas
production both point towards a likely increase of domestic gas prices in the producing countries of
the region. On the other hand, as more gas is made available on the market, particularly LNG from
Australia and the USA, the low level of imported LNG prices may persist, making generating costs
from gas relatively cheaper than from coal. A turning point in the global LNG market appears to have
been reached in 2015: prices dropped after three years of tightness, shaped primarily by the glut of
new supplies coming from Australia and increasingly from the USA, concurrent with a weaker demand
from major Asian countries, such as China and India. Sustained drops in the gas price may alter the
fuel dynamics in Southeast Asia.
The evolution of coal prices is also uncertain. Coal prices in the region are set to remain relatively low
given the abundance of coal in the region, the global market oversupply, and the projected slower
growth in international coal trade. However, Indonesia, the world's largest exporter of steam coal and
the main supplier of coal to importing countries of the region, may reduce its coal exports significantly
as the Indonesian government prioritizes sales to the domestic market. A drastic reduction of
Indonesian exports would greatly reduce the availability of coal on the export market and,
consequently, may increase coal prices. The behaviour of China is also unpredictable and its imports,
driven by price arbitrage, could surge again (as seen since June 2016), or collapse (if Chinese
domestic coal prices are lower than international ones, as seen in 2014/15).
The relative generation cost, despite being a fundamental factor in determining fuel and technology
choices, is not the only factor in the decision between coal and gas. Other factors, such as the
availability of resources, diversification of supply objectives, public acceptance of various options, and
increased commitments to reduce GHG emissions and local pollution, also play a major role. The
combination of ample supply and low cost of coal relative to gas and RE has, so far, shaped regional
power development plans with a bias towards coal-fired power generation. However, the competition
between coal, gas, and other technologies is becoming increasingly affected by government policies
on the environment. The environmental cost of fuel combustion makes coal less attractive, as coal-
fired power plants emit twice as much CO2 than gas-fired power plants (for illustration, see Figure 6
which compares the LCOE of coal and gas when a CO2 price of $15/t is applied). Currently, no
Southeast Asian country has set a price on carbon, but national power development plans across
Southeast Asian countries have started to include analyses on the impact of CO2 pricing on the
electricity mix. For instance, the Energy Master Plan (EMP) of Myanmar, prepared by the National
Energy Management Committee (NEMC) with Asian Development Bank (ADB) assistance and
launched in January 2016, considers both environmental protection and policy considerations for the
development of an optimum power strategy for the country. 19 Sensitivity analyses, based on the
inclusion of a carbon price, show that a carbon price of $10/tCO2 has little effect on the least cost
expansion strategy. In contrast, with a carbon price of $15/tCO2, the schedule of new coal-fired units
is delayed and the number of units is reduced, replaced by gas, wind, and solar.
Financial issues are also important considerations. In the past, several coal-fired power plants in the
region were built with funding from international financial institutions (IFIs), which offered loans at very
low interest rates. With the withdrawals of IFIs from coal project funding, such favourable conditions
may no longer be available. However, it should be mentioned that financing for coal power plants in
Southeast Asia is still available through Japanese and Chinese lending and other channels (see Box
1).
19 National Energy Management Committee (NEMC) (China) (2016).

December 2016: The role of coal in Southeast Asia’s power sector
12
Box 1: Financing of coal-power plants in Southeast Asia
Many IFIs have dramatically decreased or halted financial support for new coal-fired power plants
since 2013 in efforts to cut global GHG emissions and move global power generation towards a more
sustainable trajectory. Among the institutions that have halted or limited coal-fired project funding are
the World Bank Group (WBG), the European Investment Bank (EIB), the Export–Import Bank of the
United States (EX-IM), and the European Bank for Reconstruction and Development (EBRD). The
ADB originally stated that it would selectively fund coal projects if cleaner technologies were used, but
in practice the funding possibilities have become very narrow. The latest organization to announce
such measures was the Organization for Economic Cooperation and Development (OECD); its
member countries agreed in November 2015 to restrict subsidies employed in the export of
technology used in the construction of inefficient coal facilities, a decision that will take effect in
January 2017. The OECD will limit lending to just the more efficient coal plants (ultra-supercritical)
and to medium-size supercritical plants in countries facing energy poverty. In addition, many
governments (such as the USA, France, the UK, Germany, the Netherlands, and the Nordic
countries) have also stopped providing support to coal projects.
As IFIs and governments have provided over $73 billion worth of direct and indirect financial support
to coal projects around the world between 2007 and 2014, this shift in the coal financing landscape
could have a severe impact on Southeast Asian countries dependent on foreign funding to build
power plants (Indonesia, the Philippines, and Vietnam notably). However, the bulk of financing for
coal-fired power plants in Southeast Asia comes from China and Japan, each of which provided $20
billion of support between 2007 and 2014. Both countries continue their support for developing coal-
fired power plants in the region. Japan is a key provider of finance for high-efficiency low-emission
(HELE) coal plants in Southeast Asia. The largest coal-fired power projects backed by the state-
owned Japan Bank for International Cooperation (JBIC) are the 2,000 MW Batang plant and the 2,000
MW Tanjung Jati B plant expansion (both in Indonesia). China is also very active in the financing of
new coal-fired power plants in the region.
Other funding channels may include the China-led Asian Infrastructure Investment Bank (AIIB) and
the New Development Bank (NDB), although the procurement criteria for the AIIB and the NEB are as
yet unspecified.
In addition, the bulk of coal-fired power plant financing comes from lending by commercial and public
banks ($75 billion in 2014), dominated by Chinese commercial banks.20 Lending by Chinese banks is
rising in Asia, and notably in Indonesia and Vietnam, the two key countries for coal capacity additions
in the future. Also, in some Southeast Asian countries, such as Malaysia, power sector investment is
already primarily funded by local interests and multinational companies, while investment by Thai
companies is growing in the region (Hongsa power plant in Lao PDR for instance). Hence, the
financing of coal-fired power plants in Southeast Asia will not be stopped by the ongoing divestment
campaigns, as Chinese and Japanese companies are increasingly targeting international
infrastructure markets for investment to offset the slowdown they face in their domestic markets. Such
arrangements will, nevertheless, become more difficult as pressure against coal rises, especially in
light of the Paris Agreement.
3. The challenge of meeting the rise in electricity demand
Significant and common challenges in Southeast Asia
There is significant variation in the economic and energy landscape across the ten countries in
Southeast Asia (Table 2). Several are endowed with ample energy resources: Indonesia, Malaysia,
and Brunei, for example, have large fossil fuel resources. Significantly Indonesia holds large coal
20 IEA (2016c)

December 2016: The role of coal in Southeast Asia’s power sector
13
resources and is the largest exporter of steam coal in the world. Most of the other countries, however,
are relatively poor in indigenous fossil fuel resources and are much more reliant on energy imports.
Despite being a mix of countries with disparate energy and economic backgrounds, ASEAN countries
share a set of common challenges, among these are: energy access, security and affordability of
energy supplies, and climate change.
Table 2: Key economic and energy indicators in Southeast Asia
Sources: UN, World Bank, OECD, IEA
Although the region’s economy is steadily expanding, its main energy indicators remain substantially
below global averages. Throughout the ASEAN region, about 103 million people still live without
access to electricity, although electrification rates differ widely in the region and major improvements
have been achieved in recent years. For instance, in 2015, about 88 per cent of Indonesia’s
population had access to electricity compared to less than 68 per cent in 2010. However, Indonesian
Population
(million,
2015)
Real GDP
2015
(billion $)
Real GDP
growth,
2016-2020
(%)
TPES
(2014,
Mtoe)
Import
dependency
(%)
CO2
emissions
(2014,
MtCO2)
Southeast Asia 632.3 2,442.5 5.2 624.1 1,220.6
Brunei 0.4 15.5 1.8 3.6 - 6.7
Cambodia 15.6 18.0 7.3 6.4 34% 6.1
Indonesia 257.6 861.9 5.5 225.5 - 436.5
Lao PDR 6.8 12.3 7.3 2.5 1% 3.4
Malaysia 30.3 296.2 5.0 89.7 - 220.5
Myanmar 53.9 64.9 8.3 19.3 - 19.6
Philippines 100.7 292.0 5.7 47.7 47% 95.7
Singapore 5.6 292.7 2.6 28.0 98% 45.3
Thailand 68.0 395.3 3.6 134.8 44% 243.5
Vietnam 93.4 193.6 6.0 66.6 - 143.3
Electricity
consumption
(2014, TWh)
Electricity
consumption
per capita
(2014,kWh)
Population
without
electricity
(2014, million)
National
electrification
rate (2014, %)
Southeast Asia 788.9 1,262 102.7 84%
Brunei 4.2 10,110 0 100%
Cambodia 4.2 270 10.3 34%
Indonesia 207.1 810 41.2 84%
Lao PDR 3.4 500 0.9 87%
Malaysia 138.9 4,650 0 100%
Myanmar 11.3 210 36.7 32%
Philippines 67.0 710 11.1 89%
Singapore 48.4 8,840 0 100%
Thailand 173.8 2,570 0.7 99%
Vietnam 130.6 1,440 1.9 98%
December 2016: The role of coal in Southeast Asia’s power sector
14
power consumption per capita is one of the lowest in the region at only 910 kWh/capita in 2015.21 In
some ASEAN countries – such as Cambodia, Lao PDR, Myanmar, Indonesia, and the Philippines –
the low rate of access to electricity is a major development challenge. Even among populations with
access to electricity, consumption per capita is significantly lower than the global average in most
countries in the region. As of 2014, ASEAN average electricity consumption was 1,262 kWh/capita
compared to a global average of 3,030 kWh/capita, and primary energy consumption was 1 ton of oil
equivalent (toe)/capita compared to the world average of 1.89 toe/capita. Despite the region’s rapid
increase in generation capacity, electricity supply has not kept pace with electricity demand growth,
leading to power shortages and scheduled blackouts even in grid-connected areas. A key priority,
therefore, for Southeast Asian countries is to increase power capacity to complete the electrification of
the region and to meet rising electricity demand.
A growing need for energy imports (oil and gas in particular) in most countries in the region has made
energy security a pressing concern. Increased exposure to volatile international fossil fuel prices has
given rise to economic concerns linked to rising dependence on imported oil and, in some cases,
natural gas. Many Southeast Asian countries have therefore been seeking to diversify their energy
supply. As part of such diversification efforts, several countries have increased the role of coal in the
electricity mix. Considerable attention is also being placed on the deployment of RE; this includes the
improvement of conditions for attracting private investment.
Very often, a country’s domestic electricity supply has been highly dependent on a single source
(hydro in Vietnam, natural gas in Thailand). Such dependence has created power issues in dry
seasons in the case of hydropower, and shortages of gas in the case of Thailand. This has led
countries to diversify their electricity mix and, in most cases, to introduce more coal as a stable, low-
cost baseload power source.
Security and affordability of electricity supply is not only a social objective in the region but also an
economic one, as inefficient electricity supply may jeopardize industrialization development in some
countries. Southeast Asian countries are seeing a surge in FDI that then translates into industrial
capacity growth. Because of this growth in various industries – from goods to services – electricity
supply becomes crucial at the industrial level. Inadequate power supply in some countries may lead to
FDI investment insecurity and put industrialization at risk. As ASEAN countries compete with each
other for FDI investment, electricity tariffs must also remain competitive, an imperative that has
favoured coal over natural gas in several countries. Additionally, with the gradual removal of subsidies
for natural gas in the gas producing countries of the region, coal’s competitive advantage versus gas
increases.
Southeast Asia is also highly vulnerable to climate change, as most of its people and much of its
economic activity are located along the coastlines. Countries in the region have set national targets to
reduce GHG emissions; these appear in their Intended Nationally Determined Contributions (INDCs)
which have been submitted to the United Nations Framework Convention on Climate Change
(UNFCCC). Energy production and use are increasing the levels of air pollution in many of the
region’s cities, as well as those of GHG emissions. Southeast Asian energy-related CO2 emissions
rose from 355 Mt in 1990 to 1,221 Mt in 2014. The region emits less than 4 per cent of global CO2
emissions, but its share is rising. The burning of fossil fuels to produce electricity and heat is the
second-largest source of regional CO2 emissions, accounting for 39 per cent of emissions from fuel
combustion (2013 data). Gas currently represents 35 per cent of total emissions in the power
generation sector, while coal and oil products represent 58 per cent and 7 per cent, respectively. In
the IEA’s NPS, energy-related CO2 emissions in Southeast Asia increase by 60 per cent from today’s
level to reach 2 Gt in 2030, with Indonesia (the largest regional economy) accounting for around 35
per cent of the total. The emissions increase outpaces the growth for primary energy demand,
reflecting the greater share of fossil fuels in the energy mix. The largest increase in emissions comes
from the power sector – because of both the rapid growth in demand for electricity and the fact that
coal becomes the dominant fuel in the region’s electricity mix.
21 MEMR (2016a).
December 2016: The role of coal in Southeast Asia’s power sector
15
The rapid increase in energy requirements creates several challenges: meeting rising energy demand
while also working to rein in GHG emissions and other potential environmental impacts, and ensuring
secure and affordable energy for the whole region.
Southeast Asian countries are working collectively to improve the security, accessibility, affordability,
and sustainability of their energy supply. Through the fourth ASEAN Plan of Action for Energy
Cooperation (APAEC) 2016–25, which was endorsed at the thirty-third ASEAN Ministers on Energy
Meeting (AMEM) in October 2015 in Kuala Lumpur, the ASEAN community targets a 20 per cent
reduction of energy intensity22 by 2020 and a 30 per cent reduction by 2025 (based on the 2005
level). It also aspires to achieve 23 per cent RE23 in the energy mix by 2025.24
Under the theme ‘Enhancing Energy Connectivity and Market Integration in ASEAN to Achieve
Energy Security, Accessibility, Affordability and Sustainability for All’, APAEC 2016–25 serves as the
blueprint of how ASEAN plans to drive its energy landscape in the cause of advancing regional
integration in seven strategic areas, namely:
1. the ASEAN Power Grid (APG);
2. the Trans-ASEAN Gas Pipeline (TAPG);
3. Clean Coal Technology (CCT) and coal;
4. Energy Efficiency and Conservation;
5. Renewable Energy;
6. Regional Energy Policy and Planning; and
7. Civilian Nuclear Energy.25
The key initiatives include: embarking on multilateral electricity trading to accelerate the realization of
the APG; enhancing gas connectivity by expanding the focus of the TAGP to include LNG
regasification terminals; as well as promoting CCT. APAEC 2016–25 also includes strategies to
achieve higher aspirational targets to improve energy efficiency and increase the uptake of RE
sources, in addition to building capabilities on nuclear energy. Plans to broaden and deepen
collaboration with ASEAN’s Dialogue Partners, International Organizations, academic institutions, and
the business sector will be stepped up to benefit from their expertise and enhance capacity building in
the region.
Game changers in the power sector
The policy directions adopted by ASEAN Ministers have the potential to drastically change the future
electricity mix in the region. The development of RE, energy efficiency, integration of the power grid
(APG), and the adoption of CCT constitute game changers for the future electricity mix of Southeast
Asia. While fossil fuels are expected to remain the dominant source of energy in the ASEAN power
sector over the next 20 years, RE has reached a tipping point where it is set to play a major role in
supplying demand for electricity, facilitated by the integration of the regional power market. In
combination with improvements in energy efficiency on the demand side and the adoption of CCT on
the supply side, the growth in coal demand is likely to be lower than in a Business-as-Usual (BAU)
scenario.
An aggressive development of renewable energy
The ASEAN community has set an aspirational target to increase the share of RE in TPES to 23 per
cent by 2025. To meet this target, the role of the power sector is key.
22 Energy Intensity is calculated as TPES per GDP PPP at constant 2005 USD. 23 All sources of RE, including hydropower of all sizes, but excluding traditional biomass. 24 Under the 3rd APAEC (2010–15), ASEAN Member States had a target to reduce regional energy intensity by at least 8 per
cent by 2015 (from 2005 levels) and to increase the share of RE-based power capacity to 15 per cent. Both targets were easily
achieved. 25 ASEAN Secretariat (2015b); ACE (2015b).
December 2016: The role of coal in Southeast Asia’s power sector
16
ASEAN RE potential is significant, both in quantity and diversity, and largely untapped, except for
hydro, and to some extent, geothermal in the Philippines and Indonesia. Hydropower is by far the
largest source, with a technical potential estimated at 170 GW compared with an installed capacity of
41 GW in 2015. Southeast Asia is also endowed with significant geothermal potential; this is largely
concentrated in the Philippines and Indonesia (respectively the world’s second- and third-largest
producers of geothermal power generation behind the USA) and, to a lesser extent, in Malaysia. The
technical potential of solar and wind in Southeast Asia is also significant. ASEAN countries also have
diverse biomass feedstocks ranging from agriculture and forestry residues to forestry products. 26
Making greater use of these resources diversifies the generation mix and at the same time enhances
energy security and reduces CO2 emissions. In addition, RE technologies can play an important role
in bringing electricity to remote areas such as mountainous areas and small islands.
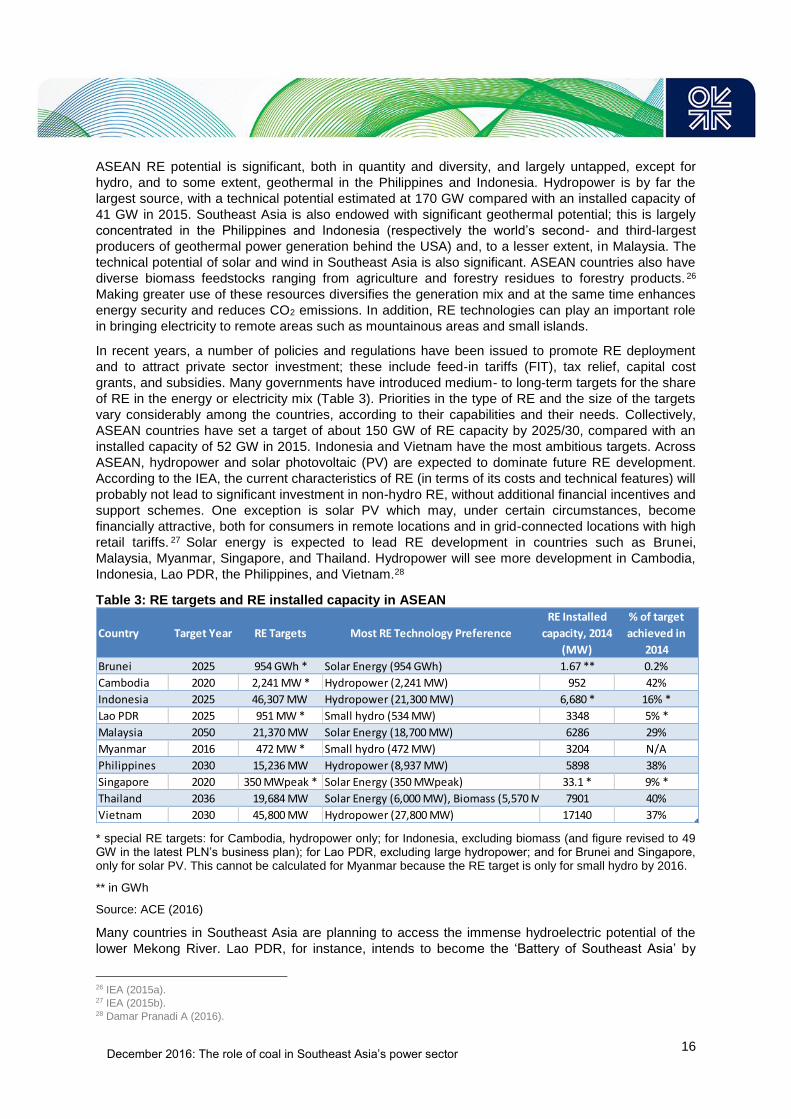
In recent years, a number of policies and regulations have been issued to promote RE deployment
and to attract private sector investment; these include feed-in tariffs (FIT), tax relief, capital cost
grants, and subsidies. Many governments have introduced medium- to long-term targets for the share
of RE in the energy or electricity mix (Table 3). Priorities in the type of RE and the size of the targets
vary considerably among the countries, according to their capabilities and their needs. Collectively,
ASEAN countries have set a target of about 150 GW of RE capacity by 2025/30, compared with an
installed capacity of 52 GW in 2015. Indonesia and Vietnam have the most ambitious targets. Across
ASEAN, hydropower and solar photovoltaic (PV) are expected to dominate future RE development.
According to the IEA, the current characteristics of RE (in terms of its costs and technical features) will
probably not lead to significant investment in non-hydro RE, without additional financial incentives and
support schemes. One exception is solar PV which may, under certain circumstances, become
financially attractive, both for consumers in remote locations and in grid-connected locations with high
retail tariffs. 27 Solar energy is expected to lead RE development in countries such as Brunei,
Malaysia, Myanmar, Singapore, and Thailand. Hydropower will see more development in Cambodia,
Indonesia, Lao PDR, the Philippines, and Vietnam.28
Table 3: RE targets and RE installed capacity in ASEAN
* special RE targets: for Cambodia, hydropower only; for Indonesia, excluding biomass (and figure revised to 49 GW in the latest PLN’s business plan); for Lao PDR, excluding large hydropower; and for Brunei and Singapore, only for solar PV. This cannot be calculated for Myanmar because the RE target is only for small hydro by 2016.
** in GWh
Source: ACE (2016)
Many countries in Southeast Asia are planning to access the immense hydroelectric potential of the
lower Mekong River. Lao PDR, for instance, intends to become the ‘Battery of Southeast Asia’ by
26 IEA (2015a). 27 IEA (2015b). 28 Damar Pranadi A (2016).
Country Target Year RE Targets Most RE Technology Preference
RE Installed
capacity, 2014
(MW)
% of target
achieved in
2014
Brunei 2025 954 GWh * Solar Energy (954 GWh) 1.67 ** 0.2%
Cambodia 2020 2,241 MW * Hydropower (2,241 MW) 952 42%
Indonesia 2025 46,307 MW Hydropower (21,300 MW) 6,680 * 16% *
Lao PDR 2025 951 MW * Small hydro (534 MW) 3348 5% *
Malaysia 2050 21,370 MW Solar Energy (18,700 MW) 6286 29%
Myanmar 2016 472 MW * Small hydro (472 MW) 3204 N/A
Philippines 2030 15,236 MW Hydropower (8,937 MW) 5898 38%
Singapore 2020 350 MWpeak * Solar Energy (350 MWpeak) 33.1 * 9% *
Thailand 2036 19,684 MW Solar Energy (6,000 MW), Biomass (5,570 MW) 7901 40%
Vietnam 2030 45,800 MW Hydropower (27,800 MW) 17140 37%
December 2016: The role of coal in Southeast Asia’s power sector
17
increasing hydroelectricity exports to neighbouring countries. Its hydro potential is estimated at 23
GW, with only 4 GW installed so far. Hydropower is important in the region as it allows the regulation
of rivers and improvements in flood prevention. However, hydroelectric dam construction can cause
serious social and environmental disruptions in Southeast Asia. The Mekong River – which passes
through Myanmar, Laos, Thailand, Cambodia, and Vietnam – is a major water resource for agriculture
and farming as well as hydropower for all the countries, and in 1995 Cambodia, Lao PDR, Thailand,
and Vietnam set up the Mekong River Commission (MRC) to help manage and co-ordinate use of the
river’s resources. However, there have been growing tensions between the countries due to water
rights and this could lead to delays in the implementation of hydropower plants in these countries. For
instance, the construction of the Xayaburi project in Lao PDR was delayed due to concerns about its
impact on regional food security.29
The short-term threat to coal from non-hydro RE development is minimal. However, non-hydro RE
sources are expected to pose a substantial threat in the medium to long term. Increased
environmental awareness is an important factor supporting the development of RE technologies.
Additionally, the cost of power generation from non-hydro RE sources is decreasing, which will make
them increasingly competitive with coal. As fossil fuel imports increase, energy security will remain a
major concern for the region. The potential and need for RE sources is even more pertinent in the
context of depletion of fossil fuel reserves, and as domestic production in the region’s exporting
countries is redirected from exports to meet rising domestic demand.30 The development of RE is also
strategic, to compensate for higher CO2 emissions from rising coal-based generation. It is facilitated
by financial funding both from major development banks in the region and from the expected funding
from developed country Parties of the Paris Agreement.
Improving energy efficiency
ASEAN has set itself a target to reduce energy intensity by 20 per cent as a medium-term target in
2020, and by 30 per cent as a long-term target in 2025, based on the 2005 level. Across the region, a
broad range of approaches have been adopted to improve energy efficiency and conservation. There
has generally been greater reliance on voluntary approaches, such as information and awareness
campaigns, than on mandatory measures and incentives. Thailand provides a good example of a
country that has implemented a comprehensive approach to improving energy efficiency; its new
Integrated Energy Blueprint includes a target to reduce end-use energy intensity by 30 per cent in
2036 (compared with 2010) through fossil fuel subsidy removal and accelerated energy efficiency
actions across a broad range of sectors.31 Energy efficiency measures will allow the reduction of
Thailand’s additional power capacity requirements by almost 10 GW by 2036 (12 per cent of the
projected capacity).32
In most countries, the removal of fossil fuel subsidies is one of the major means of eliminating both
excessive use of energy and inefficient equipment. Very often, the price of oil and natural gas to the
power sector in the region’s producing countries, and electricity tariffs in most countries, have been
subsidized, leading to inefficient use of resources. Since the oil price collapse, governments have
started to reduce or eliminate fossil fuel subsidies. Subsidies to the power sector are being phased
out gradually to target only those most in need. The phase-out of fossil fuel subsidies (and the
resulting reduction of fossil fuels that are combusted) and the implementation of energy efficiency
measures (including those in the industrial sector and buildings), are important drivers of the reduction
in demand for primary energy and electricity. For instance, in Indonesia, the national energy policy
targets a reduction of 50 Mtoe (or 17 per cent) in energy consumption by 2025, through energy
conservation on the demand side.
29 IEA (2015b). 30 ACE (2015a). 31 IEA (2015a). 32 Ministry of Energy (Thailand) (2015).

December 2016: The role of coal in Southeast Asia’s power sector
18
ASEAN power market integration
Development of the ASEAN Power Grid (APG) involves the construction of cross-border transmission
lines for electricity trade/exchange. It was launched in 1997 by the ASEAN Heads of
States/Governments under ASEAN Vision 2020. Through investment in interconnections, the APG
aims at ensuring mutually beneficial regional electricity security and sustainability, connecting those
countries with surplus power generation capacity to those who face a deficit. The aim is to move from
bilateral interconnections, to sub regional ones, and then towards a fully integrated ASEAN power grid
system. At present, the APG is a collection of interconnected national grids offering bilateral
exchanges of electricity, and not a unified regional grid. As of mid-2016, the APG consists of eleven
cross-border interconnections and 5,200 MW of transmission capacity.
The Heads of ASEAN Power Utilities and Authorities (HAPUA), whose objective is to co-ordinate
development of the APG network, set out a master plan in 2003 and selected 11 key grid
interconnection projects to be developed by 2020. Planned projects were expanded to 16 in 2011.
Three sub-regions were identified by HAPUA; the northern, eastern, and southern sub-regions (Map
1). The HAPUA is working towards the realization of various interconnection projects, first on a sub-
regional basis (particularly by tapping the hydropower potential in Cambodia, Lao PDR, and Myanmar
to supply growing demand in Thailand, Malaysia, Singapore, and Vietnam), with the eventual goal of
an integrated ASEAN power grid system.
At the thirty-second AMEM, ASEAN countries agreed to establish a pilot power integration project to
send 100 MW from Lao PDR, through Thailand and Malaysia, to Singapore. The pilot project is the
first concrete initiative towards further multilateral electricity trade beyond neighbouring borders.
Map 1: ASEAN Power Grid (APG)
Source: HAPUA (2016)

December 2016: The role of coal in Southeast Asia’s power sector
19
By 2025, it is envisioned that there will be up to 23,200 MW of cross-border power exchanges through
cross-border interconnections. It is also estimated that integration of the ASEAN network will result in
a net saving of $1.8 billion.33
The construction of cross-border transmission lines has facilitated increased electricity trade in
Southeast Asia. For example, Lao PDR more than quadrupled electricity exports, from 2.8 TWh in
2000 to 12.5 TWh in 2013. While it exports to most of its neighbours, almost 80 per cent of Laotian
exports currently go to Thailand. Net electricity imports in Thailand more than quadrupled from 2000
to 2014. Electricity trade between Lao PDR and Thailand has expanded since 2010, with the start of
commercial operation of large-scale hydropower plants (Nam Theun 2 and Nam Ngum 2) and the
commissioning in 2015 of the Hongsa lignite-fired power plant. The two countries recently agreed to
raise power exports to 9,000 MW. In its Power Development Plan 2015–36, which lays out Thailand’s
electricity and investment plans over the period, Thailand projects that total imports will increase to
more than 11,000 MW by 2036, most of it imported from Lao PDR, with imported power accounting
for 20 per cent of its electricity supply.34
The realization of the APG will mainly benefit hydro and RE, although coal-fired power plants have
also been developed for exports (Lao PDR’s Hongsa Project). However, some coal-fired power plant
projects proposed by Thailand in neighbouring countries have been met by strong local opposition
and/or financial/technical difficulties. The integration of the power grid may therefore limit the use of
coal in the region rather than expand its use. On the assumption that the power interconnection
projects currently under construction and planned are realized, a 2014 Economic Research Institute
for ASEAN and East Asia (ERIA) study forecasts that the share of hydropower generation in the
region’s power mix could increase to 24 per cent by 2035.35 This would come mainly at the expense
of natural gas and coal. Looking at the major impacts of expanded power grid interconnections on a
country-by-country basis, the ERIA study indicates significant shifts in the power mix of individual
countries. For example in Thailand, electricity imports could curb consumption of natural gas for
power generation, while Malaysia could reduce the amount of new coal-fired generation capacity,
which is planned in order to meet growing electricity demand.
Clean coal technologies
Alongside the development of RE and energy efficiency efforts on the demand side, the introduction
of CCT is key to reconciling the increase in coal-based generation with national commitments to
reduce GHG emissions.
High-efficiency low-emission (HELE) coal-fired power technologies, such as supercritical (SC) and
ultra-supercritical (USC) boilers, help to reduce the amount of CO2 emitted from coal-fired power
plants by raising the efficiency – and thus lowering the total amount of coal consumed – of plants.
HELE units emit 20–25 per cent less CO2/kWh (about 800 g CO2/kWh) than the average global
existing power fleet and up to 40 per cent less than the oldest technologies (some of which are still in
place in some countries). Modern coal technology is also key to addressing concerns over air
pollution and reducing other emissions from coal. HELE technologies typically incorporate modern
SO2, NOX and particulate control systems. These devices will become even more important in the
reduction of air pollution, which is becoming a major concern in the region.36
Across Southeast Asia, there is an urgent need to deploy more efficient coal-fired power plant
technology, rather than that employed in the subcritical units that are currently the norm. In 2014,
subcritical technologies represented more than 90 per cent of installed coal-fired capacity and over 70
per cent of the coal capacity added during the year. So far, the widespread adoption of more efficient
plants has been limited by financing, the ready availability of cheap coal (which has discouraged
investment in more efficient plants), a lack of technical expertise and, in some parts of the region, the
33 IEA (2015b); HAPUA (2016). 34 Ministry of Energy (Thailand) (2015). 35 ERIA (2014). 36 See IEA (2016e).
December 2016: The role of coal in Southeast Asia’s power sector
20
structure of the grid – high-efficiency coal plants are typically large (600 MW to 1,000 MW) and the
smaller grids are not capable of handing the increased load. By contrast, subcritical plants have been
favoured because of their lower upfront costs and shorter lead times. Subcritical coal-fired power
plants in Southeast Asia operate at low average efficiency (33 per cent in 2014) and have higher
operating costs, since their lower efficiency levels imply larger volumes of fuel input. This compares
poorly with SC and USC units that are projected to reach efficiency levels as high as 40 per cent and
45 per cent respectively.37
However, national commitments to reduce GHG emissions and the push towards more efficient plants
are changing the situation rapidly. Across Southeast Asia, a shift towards more efficient coal-fired
generation is occurring, as a growing share of new capacity additions are SC or USC (see Box 2).
Notably, Malaysia was the first country in the region to commission a USC coal-fired power plant, in
2015.
The ASEAN community recognizes that CCT is important in ensuring that coal is used in a
sustainable manner that will contribute to significant improvements in coal utilization efficiency and
environmental performance, in comparison with existing coal plants. APAEC 2016–25 promotes CCT
and states that ASEAN will continue its efforts to adopt the most appropriate, efficient, and clean coal
technologies in the region.38
Box 2: The adoption of HELE technologies in Southeast Asia
New coal-fired power plants under construction and planned in the region are increasingly USC power
plants, even in Indonesia, where the existing coal fleet is dominantly subcritical. According to
Indonesia’s 2015 power development policy, while coal-fired power plants can still be developed, the
use of environmentally sound technology should be prioritized, and in mature power systems (such as
Java–Bali and Sumatra), CCT/HELE should be used.39 In its 10-year business plan (2016–25), the
state-owned utility PT Perusahaan Listrik Negara (PLN) plans to add 21.5 GW of USC plants in the
Java–Bali and Sumatra systems over the planning period.40 Indonesia commissioned its first SC
power plants in 2011/12 and intends to commission its first USC power plants in 2019.
In Vietnam, the current coal fleet has a low efficiency: about 32–35 per cent for conventional
pulverized coal (PC) combustion and about 35–38 per cent for circulating fluidized bed (CFB)
combustion. But the new plants (13 GW under construction) will use SC and USC technologies. While
the old plants consume 560–600 g coal/kWh, the coal consumption of the new plants is expected to
decrease to 400 g coal/kWh, reducing CO2 emissions by about 30 per cent per generated unit. To
reduce the carbon footprint of the existing fleet, Vietnam intends to upgrade their performance,
making use of both domestic and imported coal (which has a higher quality than domestic coal), and
co-fire with biomass.41
In ASEAN countries relying on coal imports, such as Malaysia and Thailand, the use of HELE has
already become the norm. As mentioned above, Malaysia commissioned its first USC power plant
(Manjung 4 operated by TNB) in April 2015 and its second (Tanjung Bin operated by Malakoff Corp.)
in March 2016. Other coal plants planned in the country (3.6 GW in June 2016) also use USC
technology.
37 IEA (2015a). 38 ACE (2015b). The ASEAN Forum on Coal (AFOC) is responsible for promoting the development and utilization of clean coal
technologies and facilitating intra-ASEAN coal trade towards enhancing regional energy security and sustainable development.
Under the APAEC 2016–25, the AFOC will continue to work with Dialogue Partners, including Japan, Australia, and the USA, to
implement capacity-building activities on advanced CCT and knowledge transfer. A strategic capacity-building framework and
financing mechanisms are also being planned to enhance knowledge in the region on the technical information and technology
of clean coal power plant systems, as well as to strengthen the network and cooperative partnerships in the promotion and
utilization of coal and CCTs. 39 MEMR (2016a). 40 PLN (2016a). 41 MOIT (Vietnam) (2016b).

December 2016: The role of coal in Southeast Asia’s power sector
21
Thailand commissioned its first SC coal-fired power plant (built by Glow Energy) in 2012. Thailand’s
power development plan to 2036 projects the construction of a coal-based capacity of 7,390 MW by
2036, part of this being to replace aging plants. All of them use USC technology. Thailand is also
retrofitting its Mae Moh lignite-fired power plant and replacing old inefficient boilers with USC boilers.
While most of the existing fleet uses subcritical technology, the Philippines is increasing the use of
CFB and USC technologies, with its first USC plant expected to be commissioned in 2019 in San
Buenaventura. Compared to traditional PC technology, CFB technology is less sensitive to coal
quality variation, allows mixing various kinds of coals, and provides the opportunity for low-cost
reduction of SO2 and NOx emissions. It also allows the building of power plants with smaller unit size
(below 300 MW), better adapted to the Philippine market. Most of the new coal-fired plants built
recently and under construction are based on this technology and can use domestic low-grade coal –
the Philippines produces lignite – and imported coal, while achieving lower emissions of pollutants.
As a result of the implementation of CCT in the region, the share of subcritical plants in installed coal
capacity is expected to decline, while the efficiency of the coal fleet is expected to increase. According
to WEO 2015 (NPS), the share of subcritical plants will decline to 76 per cent by 2020 and to 53 per
cent in 2040. This shift drives an increase of more than five percentage points in the average
efficiency of Southeast Asia’s coal-fired power plants over the period 2014–40; without this, coal
consumption (and CO2 emissions) in the power sector would be almost 16 per cent higher.42
Integrated gasification combined cycle (IGCC) technology further reduces CO2 emissions (to about
650 g CO2/kWh). There are no current plans for IGCC in the region as the technology is not yet
mature commercially. However, IGCC is expected to be introduced by 2025 (in Indonesia for
example) depending on global developments.
Maximizing efficiency is important, but deep cuts in CO2 emissions will require more potent and
costlier steps, such as the adoption of carbon capture and storage (CCS). Deployment of CCS will
take time and will require strong policy support, not least for the development of the geological CO2
storage resource in Southeast Asia, which is not yet well understood.43 Deployment of CCS in the
region will also be closely linked to the accumulation of experience with CCS technologies globally
and transfer of technology. The first large commercially operating coal-fired power plant equipped with
CCS started operations in 2014 at Boundary Dam in Saskatchewan, Canada. Experience gained from
that plant can be applied elsewhere in the world to drive down the costs of CCS and help further
deployment.
The role of Japan and China, the major providers of coal-power equipment and financing in the
region, will be key to the adoption of CCT. Both countries are leaders in the advancement of CCT.
Emissions from Japanese USC plants are 806 g CO2/kWh, while the average figure for global CO2
emissions from coal-fired plants is about 958 g CO2/kWh. Japan is also developing advanced USC
(A-USC) technology, which may be established in 2016 (A-USC plant will have emissions of about
710 g CO2/kWh). By 2020, Japan hopes to have developed IGCC technology emitting CO2 at 650 g
CO2/kWh and in 2025, an integrated coal gasification fuel cell combined cycle operating at 55 per cent
efficiency and emitting only 590 g CO2/kWh. 44 China is the leading country for both ultra-low
emissions and CFB power plants. So far, the country has 86 USC plants with unit size of 1,000 MW,
and 10 SC CFB plants with unit size of 350 MW and 600 MW. An IGCC demonstration plant has been
in operation in China since 2014 and China is starting R&D on fuel cell power generation with the aim
of increasing efficiency further.45
42 Increasing the thermal efficiency of a typical plant in Southeast Asia by just one percentage point can lead to a drop in CO₂ emissions of around 3 per cent. 43 IEA (2016d). 44 Power Engineering International (February 2016). 45 National Energy Administration (NEA) (China) (2016).
December 2016: The role of coal in Southeast Asia’s power sector
22
4. Major reassessments of national power development plans and the future role of coal in the power sector
Environmental concerns over local pollutants, together with the commitments to reduce GHG
emissions agreed by Southeast Asian countries at COP21, have started to erode coal’s dominance,
although the current wave of new power capacity to be completed by 2020 is still dominated by coal.
However, power development plans are actively being reassessed in the region, making the future of
coal more uncertain.
Alignment of power development plans with INDCs results in lower coal capacity
Southeast Asian countries have commenced aligning their national Power Development Plans (PDPs)
with their Intended Nationally Determined Contribution (INDC) targets, which increase the role of RE
in the energy mix and reduce fossil fuel use in electricity generation and energy supply. The revised
PDPs adopted recently (in 2015 or 2016 in most cases) introduced major changes in comparison with
previous ones. These changes include:
A slower pace of growth in electricity demand, driven by energy efficiency efforts. Electricity demand is expected to remain strong over the next 10/15 years. However, the growth is lower than expected in previous plans due to increased energy efficiency efforts.
A diversification of the electricity mix (away from gas in Thailand, away from hydro in Vietnam) and a shift away from reliance on fossil fuels in most countries.
A strong development of RE. All plans put a strong emphasis on RE-power development (see Table 3). Indonesia’s draft General Plan for National Electricity Development (RUKN), adopted in 2015, raises RE-power to 49 GW by 2025, an increase of 29 GW compared with the previous plan.46 In Vietnam, the plan adopted in March 2016 raises capacity from solar power to 12 GW and wind power to 6 GW by 2030. In Thailand, the government has set out a target of 20 GW of RE, or a tripling, by 2036.
Some total capacity additions that could be higher than previously expected (despite the slower pace of growth in electricity demand), as more RE is added (characterized by low capacity factor and a need for backup capacity in the case of intermittent RE). For instance, in Indonesia, the figure for annual capacity additions over the next ten years is raised from 7 GW in the previous plan to 8 GW in the plan adopted by PLN in June 2016.
Lower growth in coal additions. In all new plans, the additional coal capacity has been revised downward. Lower electricity demand and stronger RE power displace some coal power plants. In Vietnam, the national plan adopted in 2010 envisaged a large-scale transition to coal for baseload power generation. However, the plan adopted in March 2016 reduces coal capacity by 30 per cent in 2030 compared with previous plans. In Indonesia, the additional coal capacity over the next 10 years is reduced by 17 per cent (–7.3 GW) compared with the previous plan.
Additional opportunities offered by integration of the region. More countries are targeting power imports, mostly based on hydropower developed in Lao PDR.
A reconsideration of the gas option in view of: lower gas prices, current ample availability of LNG, and the development and flexibility of Floating Storage Regasification Unit (FSRU) technology, which facilitates quick access to LNG.
46 MEMR (2015).

December 2016: The role of coal in Southeast Asia’s power sector
23
But coal still dominates additional power capacity
According to the most recent PDPs, total capacity additions are set to total 211 GW by 2025,47
meaning that power capacity in the region would double by 2025.48 Indonesia, Vietnam, and Thailand
lead the increase in total capacity, accounting for three-quarters of the additional capacity (Figure 7).
Figure 7: Capacity additions by country and technology (2016–25)
Notes: Malaysia: only Peninsular Malaysia (includes 2 GW of hydropower imported from Sarawak in 2025). Philippines: Philippine Energy Plan 2012–30 does not give the breakdown of fuels for thermal generation. Only RE targets to 2030 are specified. The capacity indicated here for coal and natural gas corresponds to committed power plant projects. The new government is formulating a revised plan which is expected to be published at the end of 2016. Thailand: excludes power imports (2.3 GW in 2025). Vietnam: excludes power imports (1.4 GW in 2025). Lao PDR: only to 2020. Brunei and Singapore are not shown in the figure as little capacity is added.
Source: National power development plans49
Despite the overall downward revision, coal still dominates additions to thermal capacity in most
plans. Coal additions are set at 86 GW by 2025, compared with 48 GW for natural gas. National
PDPs emphasize the role of coal as a stable and secure source for power generation at an affordable
cost.
47 This corresponds to the aggregation of targeted capacity additions in each national plan by 2025 (the final year of most
PDPs). 48 The net increase would be lower, as most diesel generators are retired and replaced by other electricity sources (gas and
RE) and some (little) aging gas and coal capacity is retired by 2025 (mainly in Thailand). 49 PLN (2016a); MOIT (Vietnam) (2016a); Ministry of Energy (Thailand) (2015); Energy Commission (Malaysia) (2016); SREP
(2016); Ministry of Electricity and Energy (Myanmar) (2016); National Energy Management Committee (NEMC) (Myanmar)
(2016).
Coal85.8 GW
41%
Gas47.9 GW
23%
Hydro42.5 GW
20%
Other RE32 GW
15%
Cogeneration(multi-fuel)
3.1 GW1%
Capacity additions by technology
Indonesia38%
Vietnam27%
Thailand13%
Malaysia7%
Philippines7%
Lao PDR4%
Myanmar3%
Cambodia1%
Capacity additions by country

December 2016: The role of coal in Southeast Asia’s power sector
24
Only RE power is expected to increase more steeply, driven by a dramatic increase in hydropower
and other RE sources. Collectively, Southeast Asian countries plan to construct 42.5 GW of new
hydropower capacity through 2025. If the targets are met, hydropower capacity will double by 2025.
The relative increase in non-hydro RE is even more pronounced. Non-hydro RE capacity additions
total 32 GW by 2025, almost three times higher than the current capacity (11.6 GW). Indonesia,
Vietnam, Thailand, and Malaysia dominate RE capacity additions. These countries have established
medium- and long-term RE targets and FITs to facilitate the development of RE sources. The
aggressive development of RE is key to reconciling increased coal-based generation with national
commitments to reduce GHG emissions. For instance, Thailand’s PDP projects an increase in the
contribution of coal to 20–25 per cent of the electricity mix by 2036, from 20 per cent in 2014.
However, the relatively larger increase in RE (including hydro) means that the overall carbon intensity
of the power system declines over the timeline of the plan, from 500 g CO2/kWh in 2015 to 300 g
CO2/kWh in 2036.50
Despite the dominance of coal in thermal power capacity, one major change is the increasing role that
natural gas is expected to play in displacing coal or in complementing variable RE power. For
instance, in Indonesia, to meet the government’s new objective to reduce the share of coal to 50 per
cent of electricity generation by 2025, the plan elaborated by PLN foresees the building of eight 800
MW gas units, in replacement of additional coal capacity. In Vietnam, while coal capacity is increased
to meet baseload power demand, gas-fired power plants are added to the mix to meet variable power
demand.
Nuclear is projected to be added as a long-term option in some ASEAN countries. Vietnam expects to
have its first nuclear power plant in operation in 2028. In Indonesia, Thailand, and the Philippines,
nuclear power is a long-term option. However, due to the long lead times of nuclear power, it does not
contribute to the regional electricity mix by 2025, and only marginally in 2030 (6 per cent of the
electricity mix in Vietnam, for instance).
Additional coal capacity is concentrated in two countries and remains uncertain
Altogether, 86 GW of coal-based power capacity is expected to be added between 2016 and 2025.
Considering the huge pipeline of proposed coal-fired power plants in the region, achieving this
capacity is feasible. If the PDPs targets are met, Southeast Asian coal capacity could reach 148 GW
in 2025,51 up 139 per cent from 2015. Coal capacity would represent 37 per cent of total Southeast
Asian capacity, gaining 7 percentage points over 2015, and would surpass gas as the number one
fuel for electricity generation. The IEA’s NPS projects a coal fleet of 108 GW in 2025, which would be
significantly exceeded under current plans (see Box 3).
Figure 8: Existing coal capacity and capacity additions in Southeast Asia by 2025
Source: National power development plans
50 Ministry of Energy (Thailand) (2015) 51 According to the national PDPs, very little aging coal capacity is retired by 2025 in the region (except in Thailand), reflecting
the fact that the coal fleet is relatively young in most countries.

December 2016: The role of coal in Southeast Asia’s power sector
25
But the additional coal capacity is concentrated in two countries: Indonesia and Vietnam account for
81 per cent of the regional total. Notably, Indonesia and Vietnam together plan to add some 70 GW of
coal capacity between 2016 and 2025. The emission impacts of these coal power development
trajectories are large – not only for these two countries but for Southeast Asia as a whole, given the
overwhelming dominance of their planned capacity additions in the regional power mix.
In Indonesia, PLN intends to increase its coal capacity by almost 35 GW by 2025, representing a 130
per cent increase from the current 27 GW. But given the delays and revisions that have affected
previous and ongoing power capacity building programmes in Indonesia, it is unlikely that the target
will be met by 2025. The Ministry of Industry and Trade in Vietnam aims to increase coal capacity by
nearly 35 GW by 2025, nearly three times the current coal capacity (13 GW in 2015). However, in the
wake of the Paris Agreement, Vietnam’s prime minister announced his intention to review the
development plans of all coal plants, and halt any new coal power development, which makes the
current plan uncertain. Compared to Indonesia and Vietnam, targeted additional coal capacity in
Malaysia, Thailand, and the Philippines is moderate at around 5 GW each between 2016 and 2025.
However, in the three countries, this development trajectory means that coal is steadily catching up
with gas as a baseload power source, and is slated to surpass gas as the number one fuel for
electricity generation in Malaysia and the Philippines. Coal additions in the other ASEAN countries are
limited and are concentrated in Lao PDR.
Despite the evident shift to coal generation in the short term and up to at least 2020 (and longer in
Indonesia) there are further emerging policy indications that this coal boom will not be sustained in the
medium to long term; further downward revisions to coal capacity additions can thus be expected in
forthcoming PDPs (for example, in Vietnam). This has significant implications for future coal demand
in the region and consequently for its import demand.
Box 3: Outlook for Southeast Asian coal-based power in IEA ‘New Policy’ and ‘Bridge’
scenarios
In the IEA’s New Policies scenario, Southeast Asia’s total electricity generation almost doubles to
about 1,610 TWh in 2030. To meet electricity demand growth, all sources of generation increase, with
the exception of oil which sees its share dropping from 6 per cent in 2013 (the reference year of WEO
2015) to less than 2 per cent by 2030. The share of fossil fuels in Southeast Asia’s electricity
generation mix declines marginally from 82 per cent in 2013 to 79 per cent in 2030. RE generation
increases by 124 per cent over the period, but its share of generation mix increases only marginally
from 18 per cent in 2013 to 19 per cent in 2030. Nuclear power enters the mix by 2030 as Vietnam
completes construction of some of its planned reactors. The power sector continues its shift towards
coal. Coal is projected to increase its share in power generation from 32 per cent to 48 per cent, while
the share of natural gas declines from 44 per cent to 29 per cent. This trend is underpinned by the
price advantage and relative availability of coal versus gas in the region, as well as the need to meet
rising electricity demand in the context of growing imports of natural gas in several countries. Coal-
fired generation grows faster than every other source (except bioenergy, wind, and solar PV) to reach
775 TWh by 2030.
In terms of capacity, Southeast Asia’s total generation capacity increases from 196 GW in 2013 to
400 GW in 2030. Over the projection period, coal accounts for 42 per cent of gross capacity additions,
followed by renewables at 32 per cent (of which 16 per cent is hydro) and gas at 25 per cent. Coal-
fired capacity expands by 87 GW from 2014 to 2030 (80 GW from 2015 to 2030). Coal’s share of
generation capacity grows from 24 per cent in 2013 to 34 per cent in 2030. It overtakes natural gas by
2030 to become the largest source of power capacity in Southeast Asia.
In the IEA’s ‘Bridge scenario’, Southeast Asian countries have a lower dependence on coal than in
the NPS. They achieve a more environmentally sustainable power generation mix with a large-scale
introduction of RE, supplemented by flexibility from gas-fired electricity generation. Coal’s contribution

December 2016: The role of coal in Southeast Asia’s power sector
26
to electricity generation is 35 per cent lower and its share in the power mix declines to just above one-
third by 2030. This results from measures that discourage the utilization of less-efficient coal-fired
power plants, and from reduced electricity demand. Additional investment supports a rapid expansion
of RE, which account for 26 per cent of electricity generation in 2030. To achieve this, Southeast Asia
would need to increase investment in RE capacity by more than 50 per cent by 2030 compared with
the NPS. Over half of this incremental investment goes to non-hydro RE, particularly wind and solar
PV, while about 30 per cent is for hydropower development.
Compared with the NPS, the net additional capacity by 2030 amounts to 187 GW, which is not
significantly different from the NPS (193 GW from 2015 to 2030). However, the structure of the
capacity mix differs largely from the NPS. Southeast Asia has cumulative coal-fired capacity additions
of around 50 GW from 2015 to 2030 in the Bridge scenario, 30 GW lower than in the NPS; this
reduces investment in coal-fired power plants by a third. The implication of the Bridge scenario for
regional coal demand and CO2 emissions is significant: Southeast Asia saves 230 Mt CO2 emissions
by 2030, relative to the NPS. Compared with the NPS, the average amount of subcritical coal-fired
power capacity installed per year falls by 1.5 GW. The gradual reduction in use of the least-efficient
coal-fired power plants results from three key steps.
1. A ban on the construction of inefficient coal-fired plants (typically conventional subcritical
units), with some exceptions for small power systems that cannot accommodate large
supercritical or ultra-supercritical coal-fired power plants.
2. A gradual reduction in the level of operation of the least-efficient plants that are currently
under construction (ensuring that they can still recover their investment costs).
3. The retirement or idling – to the fullest extent possible without affecting power system
reliability – of all aging inefficient coal-fired power plants that have already repaid their
investment costs.
Figure 9: Southeast Asian power generation capacity mix in the IEA Scenarios
Source: IEA (2015a, d)
A steep increase in coal demand in the short term, but uncertainties on the horizon
Southeast Asian coal demand has more than doubled between 2000 and 2007, to 131 Mt, under the
pressure of Indonesian domestic demand. After a pause in 2008, it has surged since 2009. Regional
coal demand increased from 143 Mt in 2009 to 232 Mt in 2015, growing at a CAGR of 8.4 per cent,
boosted by the commissioning of numerous coal-fired power plants in the region. Coal demand is
dominated by the power sector, which consumes 80 per cent of regional demand. Other users, mainly

December 2016: The role of coal in Southeast Asia’s power sector
27
the cement industry, absorb the remaining 20 per cent. Use of coal by the residential/commercial
sector has almost disappeared. Coal demand is met through a combination of local production and, to
an increasing extent, by imported coal, the only exception being Indonesia which is self-sufficient.
Figure 10: Evolution of coal consumption in Southeast Asia (2000–15)
Source: IEA and national sources
To some degree, coal is consumed in all Southeast Asian countries, except Brunei,52 while Indonesia
and Vietnam dominate regional coal demand. Coal consumption in Indonesia has grown almost four
fold since 2000, to 91 Mt in 2015. The electricity sector is the largest coal consumer, and is expanding
as a result of the addition of coal-fired generation capacity. The Indonesian government encourages
increased use of coal in the power sector, because of abundant domestic supply and the need to
reduce the use of expensive diesel and fuel oil for power generation. In order to guarantee sufficient
domestic supply, the Indonesian government introduced a Domestic Market Obligation (DMO) in
2010; this required nominated coal producers to sell a minimum percentage of their coal output to the
domestic market. Despite significant growth, the level of coal consumption has been much lower than
had been foreseen in government plans.
Vietnam’s coal consumption has surged, growing at a CAGR of 9 per cent over the period 2009–15
and reaching an estimated 45 Mt in 2015, boosted by surging demand by the power sector which
accounted for more than half of coal demand in 2015. Coal consumption in Thailand has been
relatively flat since 2009 and totalled 37 Mt in 2015. The largest user was the Thai power sector (64
per cent) and the country’s industrial sector consumed the remaining 36 per cent. Malaysian coal
demand has doubled since 2005, in line with the commissioning of new coal-fired power plants; its
coal demand totalled an estimated 29 Mt in 2015, most of it used to fuel power plants in Peninsular
Malaysia. Philippine coal demand has surged since 2009, rising from 12 Mt in 2009 to 22 Mt in 2015,
driven by the needs of the power sector. Some 80 per cent of coal supply is used by the Philippine
power sector, 15 per cent by its cement industry, and 5 per cent by industrial and direct processing
industries. Coal consumption in other countries is limited, except in Lao PDR where it surged in 2015
(to an estimated 5 Mt), boosted by the opening of the Hongsa lignite-fired power plant in June 2015.
Future coal demand is expected to increase strongly, at least in the next ten years. With 29 GW of
coal capacity under construction, the pace of growth will be steep in the near term. In addition,
Indonesian targets are much more ambitious, as the government has fast tracked the construction of
an additional 20 GW of coal capacity by 2019, above the capacity currently under construction at the
beginning of 2016. Yet, as mentioned before, the targets set in the Indonesian PDP are ambitious
and, despite government efforts aimed at accelerating the construction of the much-needed capacity,
delays cannot be excluded. In Indonesia, but also more widely in the region, the building of new coal-
52 Singapore uses only small amounts of coal in a multi-fuel power station opened in 2013, which burns low-sulphur coal (0.8 Mt
in 2015), palm kernel shells and wood chips, and natural gas or diesel to supply steam and electricity to industries on Jurong
Island. Cambodia and Myanmar collectively consumed only 2 Mt of coal in 2015.
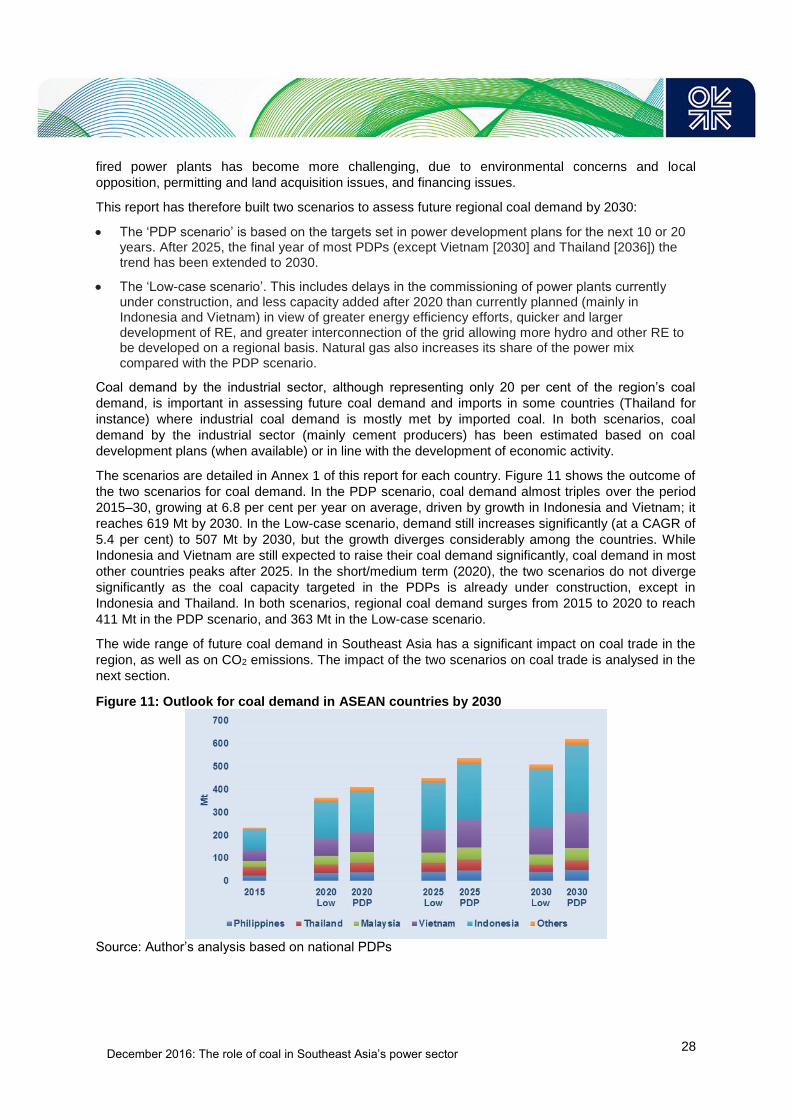
December 2016: The role of coal in Southeast Asia’s power sector
28
fired power plants has become more challenging, due to environmental concerns and local
opposition, permitting and land acquisition issues, and financing issues.
This report has therefore built two scenarios to assess future regional coal demand by 2030:
The ‘PDP scenario’ is based on the targets set in power development plans for the next 10 or 20 years. After 2025, the final year of most PDPs (except Vietnam [2030] and Thailand [2036]) the trend has been extended to 2030.
The ‘Low-case scenario’. This includes delays in the commissioning of power plants currently under construction, and less capacity added after 2020 than currently planned (mainly in Indonesia and Vietnam) in view of greater energy efficiency efforts, quicker and larger development of RE, and greater interconnection of the grid allowing more hydro and other RE to be developed on a regional basis. Natural gas also increases its share of the power mix compared with the PDP scenario.
Coal demand by the industrial sector, although representing only 20 per cent of the region’s coal
demand, is important in assessing future coal demand and imports in some countries (Thailand for
instance) where industrial coal demand is mostly met by imported coal. In both scenarios, coal
demand by the industrial sector (mainly cement producers) has been estimated based on coal
development plans (when available) or in line with the development of economic activity.
The scenarios are detailed in Annex 1 of this report for each country. Figure 11 shows the outcome of
the two scenarios for coal demand. In the PDP scenario, coal demand almost triples over the period
2015–30, growing at 6.8 per cent per year on average, driven by growth in Indonesia and Vietnam; it
reaches 619 Mt by 2030. In the Low-case scenario, demand still increases significantly (at a CAGR of
5.4 per cent) to 507 Mt by 2030, but the growth diverges considerably among the countries. While
Indonesia and Vietnam are still expected to raise their coal demand significantly, coal demand in most
other countries peaks after 2025. In the short/medium term (2020), the two scenarios do not diverge
significantly as the coal capacity targeted in the PDPs is already under construction, except in
Indonesia and Thailand. In both scenarios, regional coal demand surges from 2015 to 2020 to reach
411 Mt in the PDP scenario, and 363 Mt in the Low-case scenario.
The wide range of future coal demand in Southeast Asia has a significant impact on coal trade in the
region, as well as on CO2 emissions. The impact of the two scenarios on coal trade is analysed in the
next section.
Figure 11: Outlook for coal demand in ASEAN countries by 2030
Source: Author’s analysis based on national PDPs

December 2016: The role of coal in Southeast Asia’s power sector
29
5. Implications for regional and global coal trade
Southeast Asian supplies
Abundant coal resources
Southeast Asia is rich in coal resources. Hard coal reserves are estimated by the German Federal
Institute for Geosciences and Natural Resources (BGR) at 21 gigatons (Gt) as of end 2014, with the
majority (80 per cent) located in Indonesia and most of the remainder in Vietnam.53 Lignite reserves
are estimated at 10 Gt, with 81 per cent found in Indonesia and 10 per cent in Thailand. At current
production levels (459 Mt in 2015), the ratio of reserves to production amounts to 68 years. In addition
to these reserves, the region has a considerably larger resource base (estimated at 98 Gt for hard
coal and 234 Gt for lignite) which could be converted to reserves. However, the current low price of
coal is not conducive to investments in greenfield mines. In Indonesia, investment in the coal sector
has fallen from $1.9 billion in 2012 to an estimated $0.4 billion by end-2015.54 While coal resources
are abundant, the lack of investment in new mining projects may limit future growth in production and
question the adequacy of coal reserves to support both a growing domestic market and large exports.
Table 4: Hard coal and lignite resources in Southeast Asia (end of 2014)
Source: BGR
Coal is currently produced in all Southeast Asian countries except Brunei, Cambodia, and Singapore.
Indonesia dominates coal production in the region and accounts for 80–85 per cent of regional
production, while Vietnam produces most of the remainder. Lao PDR, Malaysia, Myanmar, and the
Philippines have a very small production (16 Mt combined in 2015) and Thailand only produces lignite
(15 Mt in 2015). Indonesia and Vietnam produce coal for the export market as well as for their own
53 BGR (2015). 54 Indonesian Coal Mining Association (APBI)/PwC) (2016).
Reserves ResourcesRemaining
Potential
Hard coal (Mt)
Indonesia 17,394 92,431 109,825
Lao PDR 4 58 62
Malaysia 141 1,068 1,209
Myanmar 3 248 252
Philippines 211 1,012 1,223
Viet Nam 3,116 3,519 6,635
TOTAL 20,869 98,336 119,206
Lignite (Mt)
Indonesia 8,274 32,365 40,639
Lao PDR 499 22 521
Malaysia 39 412 451
Myanmar 3 2 5
Philippines 105 912 1,017
Thailand 1,063 826 1,889
Viet Nam 244 199,876 200,120
TOTAL 10,227 234,415 244,642

December 2016: The role of coal in Southeast Asia’s power sector
30
domestic markets, while the other producing countries only produce coal for domestic consumption.
From 2008 to 2013, coal production in the region has almost doubled, reaching 561 Mt in 2013
(Figure 12). This growth was driven by the rapid expansion of the coal industry in Indonesia.
However, lower import demand by major Asian countries has led to significant reductions in South
Asian coal production. In 2014, regional production fell slightly to 557 Mt. In 2015 it fell again, by 3 per
cent, to 541 Mt, led by Indonesian reductions.55
Figure 12: ASEAN coal production by country (2000–15)
Sources: IEA, National statistics
In the Southeast Asian coal market, Indonesia occupies a unique position. It is a growing coal market,
a large producer (the world’s fifth largest), and is still the world’s largest steam coal exporter.
Indonesian coal production almost doubled between 2008 and 2013, growing from 249 Mt in 2008 to
490 Mt in 2013.56 This boom was driven by rising import demand (Indonesian coal exports constitute
about 80 per cent of its sales) while domestic demand accounted for only 7 per cent of the growth.
China and India absorbed over 80 per cent of additional coal supplies from Indonesia over the period,
but changes in Chinese and Indian coal markets and regulation have greatly affected Indonesian
supply and in 2014, Indonesian coal production declined slightly (–1 per cent). Chinese import
demand fell, but this reduction was partly compensated by growing exports to India. In 2015,
however, Indonesian coal production fell by 3 per cent to 469 Mt, and its exports collapsed (–10 per
cent) due to sliding Chinese and Indian steam coal import demand.
The second regionally significant producer, Vietnam, has seen a similar trend in its coal output, which
mainly consists of anthracite. After 2002, its production surged, driven by coal exports to China. Over
recent years, lower import demand by China has reduced its production, which has also been affected
by low international coal prices and high production costs. As a result of declining production and
rising domestic demand, Vietnam turned into a net coal importer in 2015.
Southeast Asian coal imports are surging
Coal importing countries in the region – Malaysia, Thailand, the Philippines and, more recently,
Vietnam, Cambodia, and Singapore – collectively imported 75 Mt in 2015, a healthy 21 per cent
55 Data for Indonesia are based on IEA data (IEA, 2016b). 56 Indonesia is the leading steam coal exporter. It is therefore of utmost importance to appraise coal production and exports by
the country. However, this task is made difficult by the large variation of coal statistics among sources, including Indonesian
ones. Production, exports, and consumption data differ greatly from one source to another. One reason may be that Indonesian
production and exports include large volumes of ‘off spec’ low-calorific value coal, which is closer to lignite than hard coal, and
not accounted for in the hard coal statistical data published by the Indonesian Ministry of Energy and Mineral Resources
(MEMR). Another reason is that there is a significant amount of coal (about 50 to 60 Mt per year) produced and exported
illegally and not accounted in official data. For instance, according to IEA data, in 2015, Indonesian production totalled 469 Mt,
a fall of 3 per cent from 2014.The fall is very pronounced in official data. The MEMR reported production of only 393 Mt, a
decrease of 14.2 per cent compared with 2014 (MEMR (2016b).

December 2016: The role of coal in Southeast Asia’s power sector
31
increase over 2014. While this increase is significant, it represents a rise of ‘only’ 13 Mt and could not
compensate for the fall in Chinese and Indian steam coal imports observed in 2015.
Figure 13: Southeast Asian coal imports (2000–15)
Source: National statistics
Coal imports by Thailand have increased significantly since 2006 with the start of coal imports by
Independent Power Producers (IPPs). Due to the country’s limited coal resources, the new power
plants added after 2006 rely entirely on imported coal. As coal production is not able to cope with
Vietnam’s rising coal demand, the country is undergoing a transition from being a net exporter to a net
importer, a status it arrived at for the first time in 2015 as coal imports more than doubled to 7 Mt in
that year. The growth in its coal imports continued in 2016: in the first eight months of the year,
Vietnam imported 10 Mt. This growing reliance on the international market is partly due to the high
cost of its domestic coal production and the cheaper cost of international supplies. Despite rising coal
production in the Philippines, the country is heavily dependent on coal imports, which have increased
significantly since 2010 and reached 17.4 Mt in 2015 (95 per cent is imported from Indonesia). This
high dependence on one supplier creates security of supply issues, notably due to rising maritime
attacks in the Sulu Sea. All coal consumed in Peninsular Malaysia is imported. Imports totalled 26.3
Mt in 2015, up 21 per cent from 2014.
But Indonesian exports fell sharply in 2015
Southeast Asian coal-importing countries source coal mainly from Indonesia, but have started to
diversify their supplies with growing imports from Australia, South Africa, and Russia. Indonesian coal
exports have been growing impressively since the beginning of the twenty-first century, making
Indonesia the largest steam coal exporter in the world, accounting for over 40 per cent of global
steam coal exports over the period 2010–14. Indonesia has gained this rank thanks to its abundant
low-cost coal resources and its strategic position close to major Asian coal importing countries.
Indonesia exports about 80 per cent of its coal production to other Asian countries, mainly China and
India (see Figure 14).
Thanks to low production costs and proximity to major customers, Indonesia’s steam coal exports
increased from 198 Mt in 2008 to 422 Mt in 2013.57 Consequently, Indonesia was one of the driving
forces behind the spectacular growth in global steam coal trade, accounting for 58 per cent of the
incremental growth during the period (see Annex 2). Indonesian exports consist almost entirely of
steam coal (less than 3 Mt of coking coal is exported annually). A significant portion of this exported
coal consists of a medium-quality type (between 5,100 and 6,100 kcal/kg) and a low-grade type
(below 5,100 kcal/kg) which is sold at a discount on the international market once adjusted for energy
content. Indonesian coal has a low-sulphur content, typically less than 0.7 per cent. Large demand for
low-grade coal came mainly from China and India.
57 Based on IEA data.
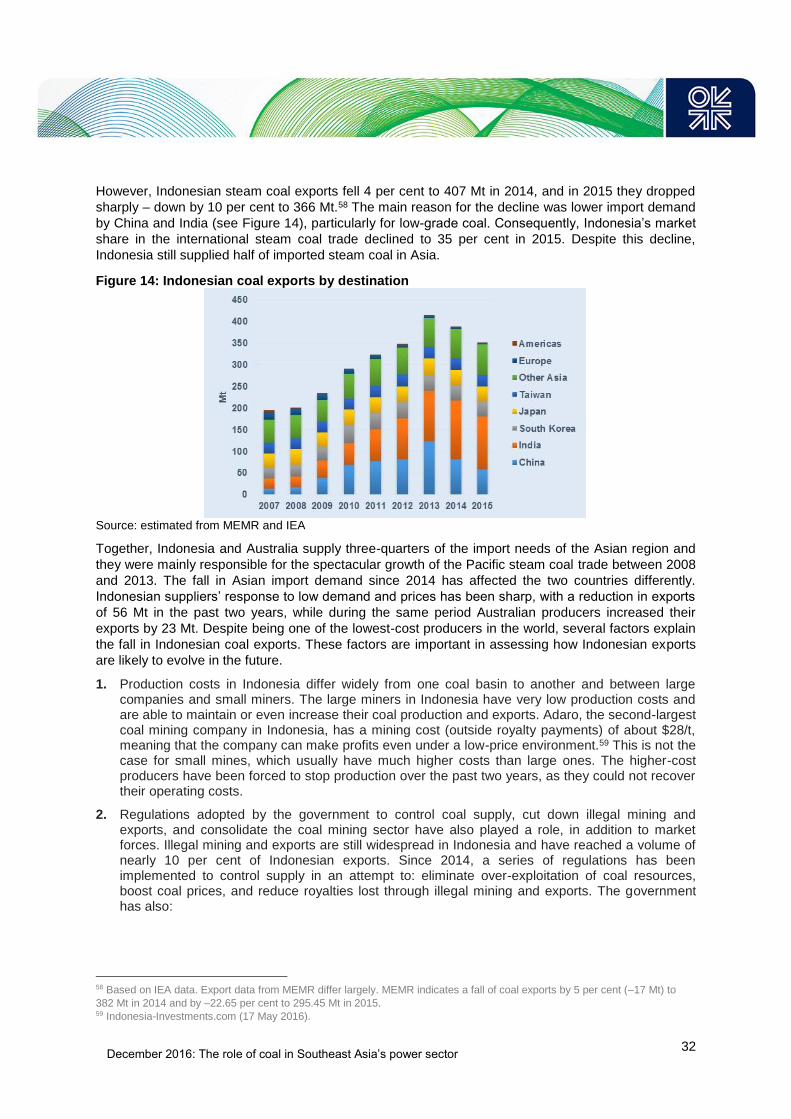
December 2016: The role of coal in Southeast Asia’s power sector
32
However, Indonesian steam coal exports fell 4 per cent to 407 Mt in 2014, and in 2015 they dropped
sharply – down by 10 per cent to 366 Mt.58 The main reason for the decline was lower import demand
by China and India (see Figure 14), particularly for low-grade coal. Consequently, Indonesia’s market
share in the international steam coal trade declined to 35 per cent in 2015. Despite this decline,
Indonesia still supplied half of imported steam coal in Asia.
Figure 14: Indonesian coal exports by destination
Source: estimated from MEMR and IEA
Together, Indonesia and Australia supply three-quarters of the import needs of the Asian region and
they were mainly responsible for the spectacular growth of the Pacific steam coal trade between 2008
and 2013. The fall in Asian import demand since 2014 has affected the two countries differently.
Indonesian suppliers’ response to low demand and prices has been sharp, with a reduction in exports
of 56 Mt in the past two years, while during the same period Australian producers increased their
exports by 23 Mt. Despite being one of the lowest-cost producers in the world, several factors explain
the fall in Indonesian coal exports. These factors are important in assessing how Indonesian exports
are likely to evolve in the future.
1. Production costs in Indonesia differ widely from one coal basin to another and between large companies and small miners. The large miners in Indonesia have very low production costs and are able to maintain or even increase their coal production and exports. Adaro, the second-largest coal mining company in Indonesia, has a mining cost (outside royalty payments) of about $28/t, meaning that the company can make profits even under a low-price environment.59 This is not the case for small mines, which usually have much higher costs than large ones. The higher-cost producers have been forced to stop production over the past two years, as they could not recover their operating costs.
2. Regulations adopted by the government to control coal supply, cut down illegal mining and exports, and consolidate the coal mining sector have also played a role, in addition to market forces. Illegal mining and exports are still widespread in Indonesia and have reached a volume of nearly 10 per cent of Indonesian exports. Since 2014, a series of regulations has been implemented to control supply in an attempt to: eliminate over-exploitation of coal resources, boost coal prices, and reduce royalties lost through illegal mining and exports. The government has also:
58 Based on IEA data. Export data from MEMR differ largely. MEMR indicates a fall of coal exports by 5 per cent (–17 Mt) to
382 Mt in 2014 and by –22.65 per cent to 295.45 Mt in 2015. 59 Indonesia-Investments.com (17 May 2016).

December 2016: The role of coal in Southeast Asia’s power sector
33
set a short-term cap on coal production of about 400 Mt per year;60
been consolidating the mining permit process with the introduction, in October 2014, of the ‘clean and clear’ certification system to ensure that all locally licensed mines were in compliance with basic laws, including conducting environmental impact assessments and paying taxes;
required coal exporters to be registered;
announced a rise in royalties from 1 January 2017 for companies working under the Mining Business Permit (IUP) framework (this will mainly affect smaller and medium-sized firms);
announced (in April 2016) a ban on new coal mining permits which will limit over-exploitation of coal resources.
All these regulations mostly affect small mining firms and have restrained their coal production.
3. There is less demand for Indonesian coal in the market. Both China and India have significantly reduced their imports of low-grade coal in favour of higher-quality coal. New regulation in China restricts the use of low-grade coal. Indonesian exports to China dropped by 22 per cent in 2014 and by 30 per cent in 2015 as Chinese coal demand slowed down. The decline was expected to continue in the short term. However, the behaviour of China is unpredictable. Despite a continued decrease in its coal demand, Chinese imports have increased since June 2016 (see Box 4).
In 2014, the decrease in Chinese imports was partly offset by higher Indonesian exports to India,
which grew by 15 per cent, making India the most important buyer of Indonesian coal. However, in
2015, India’s rising domestic steam coal output contributed to an 8 per cent drop in Indonesia’s steam
coal exports to the country (to 123 Mt). This decline is expected to continue as India’s energy minister
plans to cut steam coal imports altogether by 2017, with the exception of meeting the requirements of
power plants located near coastal areas. In addition, Indonesian coal is disadvantaged by the clean
environment tax levied by India on coal (the cess tax). The tax is levied on coal tonnage, and not on
energy content, which makes coal with a lower calorific value relatively more expensive than higher-
grade coal from Australia and South Africa. The tax was doubled in early 2016, and this will continue
to negatively affect Indonesian coal exports to India.
Indonesian steam coal exports to other countries fell by 8 per cent in 2015 to 206 Mt, with growing
shipments to developing Asian countries offset by a drop in exports to many developed Asian nations,
such as South Korea and Taiwan.
As more and more buyers are indicating a preference for coal of a higher quality than Indonesia’s low-
grade coal, the future market for Indonesian coal could be significantly restrained. The quality of
Indonesian coal can be upgraded (to some extent) by processing operations such as coal crushing,
coal washing, coal blending, and upgrading; this is required by a government regulation adopted in
2010 which aims to increase the value added of coal (and other mineral products).61 However, this will
not transform low-calorific value coal into a high-calorific product.
In the future, the obligation on producers to sell a growing share of their coal production on the
domestic market (DMO) will be a serious threat to rising exports. As electricity demand rises strongly,
Indonesia plans to have a greater reliance on coal, given the relatively higher price of imported oil and
the difficulty of accessing domestic natural gas. PLN’s business plan for 2016–25 projects that the
share of coal in electricity generation will reach 60 per cent in 2020, driven by the government fast-
track programme launched in 2015 (‘the 35,000 MW programme’).62 The programme aims to add 35
GW of capacity by 2019, of which 20 GW are coal based. Indonesia thus seeks to retain more of its
60 The cap is to be compared with official production figures. For instance, the cap on coal production was 425 Mt in 2015, while
official production that year was only 393 Mt. 61 To increase the value added of mineral products, including coal, in 2010, the government issued a regulation requiring IUP
holders to carry out in-country processing. The regulation, amended in 2014, clarifies that in respect of coal, ‘processing’ covers
activities such as coal crushing, coal washing, coal blending, and upgrading. In January 2014, the government banned the
export of unprocessed metal mineral exports (not coal). 62 PLN (2016a).

December 2016: The role of coal in Southeast Asia’s power sector
34
coal production for fuelling rising domestic demand. Indonesia’s National Medium-Term Development
Plan for the period 2015–19 (RPJMN 2015–19)63 projects that 60 per cent of Indonesian production in
2019 will be allocated to the domestic market (260 Mt), reducing coal exports to only 140 Mt. Although
coal demand is not expected to rise at such a steep rate – Indonesia consumed 91 Mt in 2015 – the
prioritization of sales to the domestic market will make less coal available for exports.
Intentionally or otherwise, the 35,000 MW programme and the prioritization of domestic coal as fuel
for electricity generation constitute a lifeline for the coal mining sector, by creating new demand for
domestic coal. Many large-scale coal companies have already taken advantage of this opportunity by
constructing coalmine mouth (CMM) power plants and becoming IPPs. As well as gaining profits from
the sale of electricity, the move will sustain the demand for their coal production for the next 30 years.
Due to the sheer size of Indonesia on the Pacific Basin, the reduction of its exports is facilitating the
rebalancing of the coal market. Combined with the unexpected rise of Chinese imports since June
2016, this has led to a tightening of the Pacific steam coal market and the rise in steam coal prices
observed since that date.
Box 4: China’s new regulation on coal mining has led to rising imports and prices since June
2016
Until mid-2014, Chinese imports had functioned as the main method of clearing supply growth in the
steam coal market, as favourable price arbitrage drove the replacement of higher-cost Chinese
domestic supply with cheaper overseas imports.64 In 2014, however, this started to change and in
2014 and 2015, China’s coal imports slumped, exacerbating the oversupply on the international coal
market and the fall in coal prices. Coal imports by China were expected to continue their contraction,
as demand for coal in China slowed down.
However, against all expectations, Chinese coal imports increased in the first ten months of 2016, as
domestic supply dropped sharply. In early 2016, the Chinese government implemented a supply side
reform to remove excessive and outdated capacities in their domestic coal industry. Over the period
2016–20, the government expects to shut down 550 Mt of overcapacity, of which 280 Mt is expected
to go in 2016. It has required coal mining companies to cut operating days to 276 days per year, from
330. The new regulation, combined with coal supply disruption due to heavy rain in Shanxi, the main
producing region, led to a fall in coal production. In the first ten months of 2016, Chinese coal
production was down 10.7 per cent to 2.74 Gt. This has resulted in tight supply and low stocks at
mines, transfer ports, and power plants. Tighter supplies and increased consumption during summer
2016 have helped to lift domestic coal prices. The Chinese steam coal benchmark price has doubled
since the beginning of 2016 to 634 yuan/t FOB, inclusive of 17 per cent VAT (5,000 kcal/kg net-as-
received) from 306 yuan/t at the beginning of the year. This has re-opened the price arbitrage in
favour of overseas coal and boosted demand for imported coal. In the first ten months of 2016,
Chinese total coal imports jumped 18.5 per cent year-on-year to 202 Mt.
This unexpected surge in Chinese imports has had a large impact on international coal prices, and
China has regained its price setting role on the coal market. Since May 2016, steam coal prices
(Australian FOB price) have increased by 81 per cent to $93/t in October. The price rally could,
however, be short lived. The Chinese government intends to maintain domestic coal prices within a
reasonable range to avoid increasing power generation costs and consequently rising power tariffs. In
response to the rising prices, it has relaxed its regulation on coal mining, allowing temporary rises in
production until the end of 2016, which may temper the rise in international steam coal prices.
63 BPKP (2015). 64 See OIES (2014) for a detailed analysis of the Chinese coal market.

December 2016: The role of coal in Southeast Asia’s power sector
35
Figure 15: Recent steam coal export prices
Source: World Bank; MEMR
The key role of Southeast Asia in the global steam coal trade
The key consideration for the future of the global coal trade rests on balancing supply with global
demand. Southeast Asia is called to play a key role in bringing the market more into balance.
Reductions in import demand from China and India in 2015 have resulted in coal exporters
scrambling to find customers. In this new context, the growing importing countries of Southeast Asia
appear as the latest high-growth market for coal exporters. As most of these countries, apart from
Indonesia, are dependent on coal imports, regional coal imports are expected to surge in the near
term with 23 GW of coal capacity under construction in the region (outside Indonesia).
Based on the assessment of coal demand and supply in each country (see Figure 11 and Annex 1),
Southeast Asian steam coal imports are expected to almost double between 2015 and 2020. They
could increase by 65 Mt and reach 140 Mt in 2020 in the PDP scenario. This growth is led by
expansion of the coal fleet in Vietnam, Malaysia, the Philippines, and Thailand and, to a much lesser
extent, Cambodia. The growth is secured by demand related to power plants currently under
construction or committed, although delays may occur.
Vietnam, traditionally a net exporter, became a net importer in 2015 and its imports are set to rise to
37 Mt per year by 2020. In Malaysia, there are plans to commission 4 GW of coal-fired capacity by
2020, requiring 16 Mt per year of additional import demand (including imports by industrial users). If
all Philippine committed coal-fired power plants are realized and on time, an additional 9 Mt per year
would be required by 2020. Thailand also has plans for new coal power plants to be built by 2020,
and should import an additional 7 Mt of coal by 2020. The robustness of the Vietnamese plan is
perhaps the most difficult to confirm, and therefore holds the greatest downside risk. Some capacity
(2 GW) in Malaysia is also likely to be completed only after 2020. In the Low-case scenario, imports
increase by 40 Mt (25 Mt lower than the PDP scenario) to 115 Mt in 2020, as some coal-fired power
plants are not completed on time. (See Figure 16.)
In the 2020s, however, the rate of growth in coal imports could slow down dramatically and in some
countries, could even be negative. This is due to the expected slowdown in coal demand after 2025 in
most countries. Much of the uncertainty comes from Vietnam and, to a lesser extent, Thailand.
In Vietnam, the Coal Development Plan and the Power Development Plan, adopted in March 2016,
project an increase in coal imports to 100 Mt by 2030. But with the government’s intention to review
future coal power plants, it is likely that some coal capacity will not be built, and will be replaced by
RE and natural gas after 2020. The level of coal demand in the long term could be much lower than
that projected in current plans, reducing import needs (67 Mt by 2030 in the Low-case scenario
discussed in this report). In Thailand, strong opposition to new coal projects may block the

December 2016: The role of coal in Southeast Asia’s power sector
36
construction of new coal-fired power plants in the country; these would be replaced by natural gas,
electricity imports, and RE.
Overall, Southeast Asian coal imports could increase by only 48 Mt between 2020 and 2030 in a low
scenario (after a peak by around 2025), and by 90 Mt in the PDP scenario (Figure 16). In the PDP
scenario, regional coal imports reach 230 Mt in 2030. Their CAGR over the period 2020–30 falls to
5.1 per cent, compared with 13.3 per cent over the period 2015–20. In the low scenario, coal imports
total 163 Mt in 2030. Their CAGR over the period 2020–30 falls to 3.3 per cent. The large
uncertainties on future Southeast Asian coal imports constitute an additional challenge for global
exporters, notably Australia, which could see its export demand rising significantly, but only for a
limited period.
Figure 16: Outlook for coal imports in Southeast Asia by 2030
Source: Author’s analysis
Global steam coal trade is expected to continue shrinking as import demand remains weak. Chinese
imports are expected to decline further (after their temporary rise) due to overcapacity and demand
slowdown, and Indian steam coal imports are expected to be gradually replaced by domestic
production. The rebalancing of the global market is therefore expected to come from the supply side,
with high-cost producers closing their mines and reducing global steam coal supply. However,
although coal prices fell for five consecutive years from 2011 to mid-2016, coal mining companies
have been slow to cut their production. On the contrary, their first strategy was to increase coal output
to maintain revenues, exacerbating the oversupply. Long-term ship-or-pay contracts with railways (in
Australia for instance) also prevented miners from cutting supplies, as their financial losses would
have been even higher. Instead, they have reduced their costs significantly to expand their
production. A strong dollar, combined with relatively weak currencies in producing countries, has
helped global producers to reduce their costs (except those in the USA which were the first to cut their
production and reduce their steam coal exports). After 2014, the fall in oil prices has helped all
producers to reduce their costs.
The changes in Chinese and Indian importing behaviour have resulted in Indonesian supply cuts
becoming the main market adjustment mechanism in the Pacific Basin.65 As China plays a leading
role in rebalancing the market on the demand side, Indonesia plays this key role on the supply side.
65 To some extent, the US market has played this adjustment role on the Atlantic Basin. At their peak in 2012, US steam coal
exports totalled 50.7 Mt (of which 41.3 Mt were exported to the Atlantic Basin). In 2015, US steam coal exports were only 25.4
Mt, of which 19.1 Mt were exported to the Atlantic Basin. Lower demand in the Atlantic Basin (mainly Europe) and fierce
competition from lower-cost producers (Colombia and Russia) forced US high-cost coal mining companies to stop production.
Many companies, including the largest ones (Peabody Energy, Arch Coal, Patriot Coal, Walter Energy, and Alpha Natural
Resources), have filed for Chapter 11 bankruptcy. But the US role in the Pacific Basin has always been limited and it was
unable to rebalance this basin. At their peak in 2012, US steam coal exports to the Pacific Basin reached 9.4 Mt, representing
only 1.3 per cent of steam coal imports by the Pacific Basin.

December 2016: The role of coal in Southeast Asia’s power sector
37
Due to the sheer size of its Pacific Basin exports, the reduction of Indonesian coal exports has
facilitated the rebalancing of the coal market and the increase in coal prices in the short term.
In the medium to long term, Indonesia’s future export levels are rather unpredictable and constitute a
major source of uncertainty for the supply of neighbouring ASEAN countries and other major Asian
coal importing countries, as well as for competing global suppliers, especially Australia. The intention
of the Indonesian government to control coal production to cut down illegal mining and reduce over-
exploitation is expected to constrain production and exports by small producers. But large companies
have the ability to raise their production, should prices recover sustainably.
Two contrasting scenarios for future Indonesian production are possible. The country could cap its
coal production at about 400 Mt per year on a long-term basis, to limit over-exploitation and preserve
coal resources for future generations. Otherwise, the size of their coal resources allows large
Indonesian companies to increase their production again if prices recover sustainably.
In a scenario where coal production increases in the long term (for instance in the IEA’s WEO 2015),
exports will still increase in the long term, although their increase is limited by rising domestic
demand. In the IEA’s NPS, Indonesia sees its market share in total coal trade (including coking coal)
dip to 30 per cent in 2040, despite an increase in exports of nearly 40 Mtce (about 50 Mt) over the
period 2013–40. The slowdown in the growth of Indonesia’s exports stems, on one hand, from
robustly growing domestic demand and, on the other hand, from the fact that Indonesia’s coal quality
is declining, while costs are rising. Smaller high-cost operations in Indonesia are becoming the swing
supplier in the Asia–Pacific market.66
Should Indonesia cap its production at 400 Mt per year in the long term, its coal exports would be
drastically reduced as the government prioritizes sales to the growing domestic market, potentially
leading to a tightening of the global market and rising coal prices. This report, however, does not
conclude that exports will fall as steeply as foreseen in Indonesia’s National Medium-Term
Development Plan for the period 2015–19 (a fall of 163 Mt in five years to 160 Mt in 2019), but that
they will decline gradually. The main reason is that the building of new coal power plants in Indonesia
has to overcome many challenges, despite several government initiatives to accelerate construction
of the needed capacity. It is expected that coal demand by the power sector will increase more
gradually, and that the 35,000 MW programme will be extended after 2019. Nevertheless, if
production is capped effectively at roughly 400 Mt per year in the short and long term, it will make less
coal available for the export market. In this report, based on an effective cap on coal production at
400 Mt per year on a long-term basis, Indonesian coal exports have been projected to decline from
366 Mt in 2015 to 225–240 Mt by 2020, and to 105–150 Mt in 2030.67
In both scenarios, due to the sheer size of Indonesian coal exports the impact of a gradual reduction
or a relative stagnation of its coal exports would be significant, as other global coal suppliers have
also reduced their mining investment and postponed or cancelled new greenfield mines (for instance
in Australia). The reduction of Indonesian coal exports would lead to a tighter market and enhanced
competition for coal supply between traditional importers (Japan, Korea, Taiwan) and rising emerging
importing countries in Southeast Asia, with the potential for a rise in coal prices. While much of the
uncertainty on the global coal market has come from the demand side (China’s importing behaviour
and Indian importing needs), an additional factor of uncertainty has been added to the market on the
supply side. Both the level of Indonesian production and the rate of increase in its coal demand are
uncertain, creating difficulties in forecasting its future coal exports.
66 IEA (2015c). 67 Based on an estimated domestic demand of 160–176 Mt in 2020 and 250–295 Mt by 2030 (see Annex 1).

December 2016: The role of coal in Southeast Asia’s power sector
38
6. Conclusion Developments in the Southeast Asian coal market – the leading role of Indonesia in the Pacific Basin
steam coal trade and growing imports by Southeast Asian countries, such as Vietnam, the
Philippines, Malaysia, and Thailand – are affecting the global coal market.
While the rise in coal imports by the coal-importing countries in the region is not sufficient to
rebalance the global coal market, even in a high scenario, their possible slowdown after 2025 would
have a much more significant impact. As Southeast Asia is the latest region expected to strongly
increase its coal imports, if this growth does not materialize, one can expect a prolonged era of low
coal prices. On the other hand, if there is high growth of coal demand and imports, some pressure
could be put on the international coal market, as little investment has been made in the past few years
in the global mining sector. This underinvestment threatens the availability of growing coal supplies.
However, it is worth noting that even in a high scenario, the additional import demand from the region
is far less than the amount added by China or India to the international steam coal market in the past
few years: in a high scenario, Southeast Asian imports are expected to increase by 155 Mt over the
next 15 years, while Chinese and Indian imports increased by 323 Mt in just five years, from 2008 to
2013. Therefore, at least in the short to medium term, on the demand side, the balance of the global
coal market will continue to be determined by China and India. In 2015, despite their declining
imports, the two countries still accounted for more than 30 per cent of global steam coal imports.
The impact on regional and global coal markets of the future trajectory of Indonesian coal production
is much more significant. The size of Indonesian coal resources should allow the country to increase
its production to serve both its domestic consumption and export demand. However, current market
conditions are not conducive to investment in coal mining, which could restrain future coal production
due to the long lead time of coal mining projects. In addition, new regulation to crack down on illegal
mining activities, the ongoing consolidation of the mining permit process, and the recent moratorium
on new coal mining activities, are likely to reduce Indonesian coal production even further. In the short
term, by reducing available coal supply to the export market, Indonesia’s coal policy facilitates the
rebalancing of the market and the increase in coal prices.
In the medium to long term, however, there are huge uncertainties about the role of Indonesia on the
global coal market, as Indonesian exports are not solely determined by market forces, but also by
government policies. On one hand, if the Indonesian government maintains a cap on coal production
of about 400 Mt per year on a long-term basis, the country’s exports will fall significantly, but
gradually. On the other hand, when the coal mining sector is consolidated, the size of Indonesian coal
resources might allow large Indonesian mining companies to expand their production for the benefit of
the export and domestic markets, provided that coal prices rise sufficiently to incentivize investment in
coal mining and transportation.
It is still the case, however, that more and more buyers are indicating a preference for higher-calorific
value coal. This could significantly restrain the future market for Indonesian low-grade coal. In
addition, there are further long-term risks for the Indonesian coal mining sector. Indonesian coal
exports may decrease further due to new environmental regulations in importing countries. This may
come in various forms: a ban on low-grade coal imports (such as the threshold on coal quality
imposed in eastern China), a tax on coal (such as the cess in India) or, more generally, new
regulation on power plant emissions – which presents a specific risk to Indonesian coal due to its low
calorific value. Despite its higher price, high-grade coal has a key advantage over lower-grade coal:
its higher energy content and therefore lower CO2 emissions per kWh. The risk in the long term is that
Indonesian low-grade coal has a more limited export market.
These trends would have a significant impact on global coal trade. However, there are large
uncertainties both on the demand side (actual coal imports by China and India, new regulation on
emissions in Asian countries) and on the supply side (actual reduction in Indonesian coal production).
December 2016: The role of coal in Southeast Asia’s power sector
39
Indonesian coal exports continued their decline in the first half of 2016 and the recovery in coal prices
observed for other coals was less pronounced in the case of Indonesian low-grade coal. High-quality
coal is sold at a higher premium, reflecting buyers’ choice, while low-grade coal is further discounted.
On a long-term basis, if Indonesian low-grade coal is no longer exported (either because it is
consumed locally or because buyers don’t want this quality anymore), the balance of the global
market will depend on a very small number of producers, mainly Australian ones, and their ability to
ramp up their production. It might be that 2016 provides an interesting test for the coal market – to
see how coal producers worldwide react to the current recovery in coal prices, provided the recovery
is sustained.

December 2016: The role of coal in Southeast Asia’s power sector
40
Annex 1: Outlook for coal supply and demand by Southeast Asian country
This annex details the outcome of the analysis of coal supply and demand trends to 2030 for each
Southeast Asian country.68
Indonesia
The Directorate General of Electricity in Indonesia’s Ministry of Energy and Mineral Resources
(MEMR) is responsible for developing the General Plan for National Electricity Development (RUKN);
this sets out targets and actions specific to the power sector. The draft RUKN 2015–34, published in
July 2015, sets a total generation capacity of 146 GW by 2025 (134 GW for PLN’s system and 12 GW
outside PLN’s system), and proposes a total power capacity mix consisting of 34 per cent of RE, 37
per cent of coal (54 GW), 26 per cent of gas, and about 3 per cent of fuel oil.69 The share of RE in
electricity generation is projected to increase to 25 per cent by 2025, while the share of coal is
reduced to 50 per cent and oil is almost completely phased out.
In addition, in 2015, the government launched a third fast track programme (‘the 35,000 MW
programme’) to add 35 GW of power capacity by 2019, of which 20 GW would be coal-based
capacity. Altogether, the three fast track programmes, launched respectively in 2006 (almost
complete), 2009 (5 per cent complete at end 2015), and 2015 aim to bring 42.9 GW of generation
online from 2015 up to 2019. Coal projects dominate, with 25.8 GW of capacity to be added by 2019.
PLN adopted its ten-year Electricity Supply Business Plan in June 2016 (RUTPL 2016–25) to support
the draft RUKN targets, although not without difficulty – particularly in achieving the RE target and the
limit on coal-fired generation.70 Additional generation capacity totals 80.5 GW over the period 2016–
25, or an average increase of 8.1 GW per year, compared with 7 GW per year in the previous plan.
Despite the growing capacity additions, the projected additional coal capacity has been revised
downwards (–7.3 GW over the period). Despite that, coal still dominates future capacity additions.
RUTPL 2016–25 projects 34.8 GW of additional coal capacity over the period 2016–25 (43.2 per cent
of the total additional capacity), most of them to be commissioned in 2019 (17 GW), in accordance
with the completion of the 35,000 MW programme by 2019. Most of the new capacity is added in the
Java–Bali system and in South Sumatra.
The share of coal in electricity generation rises to 60 per cent by 2019 and even reaches 64 per cent
in 2023, before falling to 50 per cent in 2025. It is worth noting that this decline – based on the
fulfilment of the 50 per cent limit set in the draft RUKN – is not consistent with the additional coal
capacity projected after 2020 (6 GW are added between 2021 and 2025). Otherwise, it requires that a
large amount of old inefficient coal plants is retired by 2025.
If all projects were built, and on time, the coal capacity would increase from an estimated 27 GW at
end 2015 to 62 GW in 2025. In the past five years, Indonesia added 3 GW per year of coal capacity,
on average. This rate is expected to increase – thanks to government incentives to speed up the
implementation of the 35,000 MW programme – which means that a total addition of 34.8 GW over a
ten-year period is feasible. However, the completion of the 35,000 MW programme by 2019 requires
that 25.8 GW are built by 2019. This is unlikely to happen as it takes four to five years to build a coal
plant. As of the beginning of 2016, about 6 GW of coal capacity is under construction and will be
commissioned by 2019. In addition, at end December 2015, PLN had signed power purchase
agreements with IPPs for 13 GW of coal-based capacity. Most of this capacity involves large USC
plants built by IPPs in Java, and coalmine mouth power (CMM) plants in South Sumatra. The new
coal plants will boost domestic coal demand significantly. According to PLN, the 20 GW of coal
capacity included in the 35,000 MW programme requires about 70 Mt of coal per year when fully
68 Brunei has no coal market and Singapore coal market is limited to coal imports by one multi-fuel power plant which
consumed 0.8 Mt of coal in 2015. 69 MEMR (2015). 70 PLN (2016a).

December 2016: The role of coal in Southeast Asia’s power sector
41
operational. PLN expects coal consumption by the power sector to more than double from 77 Mt in
2016 to 163 Mt in 2023.71
However, given the delays that the fast track programmes experienced in the past, it is expected that
the rise in coal demand will be more gradual. Assuming some delays in the implementation of the
35,000 MW programme, this report has estimated an increase in coal capacity from 27 GW at end
2015 to 40–43 GW in 2020 (rather than the 51 GW by end 2019 expected in RUPTL 2016–25), and to
60–70 GW by 2030. Based on these assumptions, coal demand by the power sector would increase
to 140–150 Mt in 2020 and 210–245 Mt in 2030.72
As the government pushes infrastructure and industrial development, cement producers and other
industrial companies are upgrading their capacity and this will also create a surge in demand for coal.
Coal consumption in cement, metallurgy, and other industries is expected to increase from 15 Mt in
2015 to 20–25 Mt by 2020, and to 40–50 Mt in 2030.73
Altogether, coal demand could increase from 91 Mt in 2015 to 160–176 Mt in 2020 and to between
250 Mt and 295 Mt by 2030 (see Figure 17). As seen previously, should the government cap coal
production at around 400 Mt per year, coal exports would be reduced drastically (only 105 to 150 Mt
by 2030).
Figure 17: Outlook for coal demand in Indonesia
Source: Author’s analysis
Vietnam
Vietnam revised its power development plan (Adjusted 7th Power Development Plan or PDP7-A) in
March 2016; this increased the role of RE in the power mix while reducing the role of coal compared
with previous plans.74 Despite the scale back, coal is still the dominant fuel in the power mix by 2030,
with a projected capacity of 55.3 GW by 2030, compared with an installed capacity of 12.9 GW in
2015. Coal demand by the power sector is therefore projected to surge to 129 Mt in 2030 (see Table
5). In addition, increased demand by the industrial sector boosts total coal demand to about 155 Mt in
2030. Due to the high cost of production of domestic coal, Vietnam is expected to become a key
importer in the region. Its imports are going to increase steeply in the next five/ten years as new
plants currently under construction (12.8 GW) are commissioned. However, import demand has been
71 According to RUPTL 2016–25, after 2023, coal consumption by the power sector is expected to decline to 148 Mt in 2025.
The decline at the end of the forecast period is somewhat artificial. It is explained by a decline in power generation from coal in
2025 to fulfil the limit for coal generation set in the draft RUKN. It is not consistent with the continued increase of coal capacity
by 2025. Similarly, despite the expected surge in coal capacity (17 GW) in 2019, power generation from coal and coal demand
do not surge in RUPTL. Coal demand by the power sector increases by only 10 Mt in 2019 and 11 Mt in 2020 in RUPTL 2016–
25. See PLN (2016a). 72 This is based on the assumption that 1 GW requires 3.5 Mt of coal per year. 73 Data for coal demand by the non-power sector differs greatly from one source to another. 74 MOIT (Vietnam) (2016a).
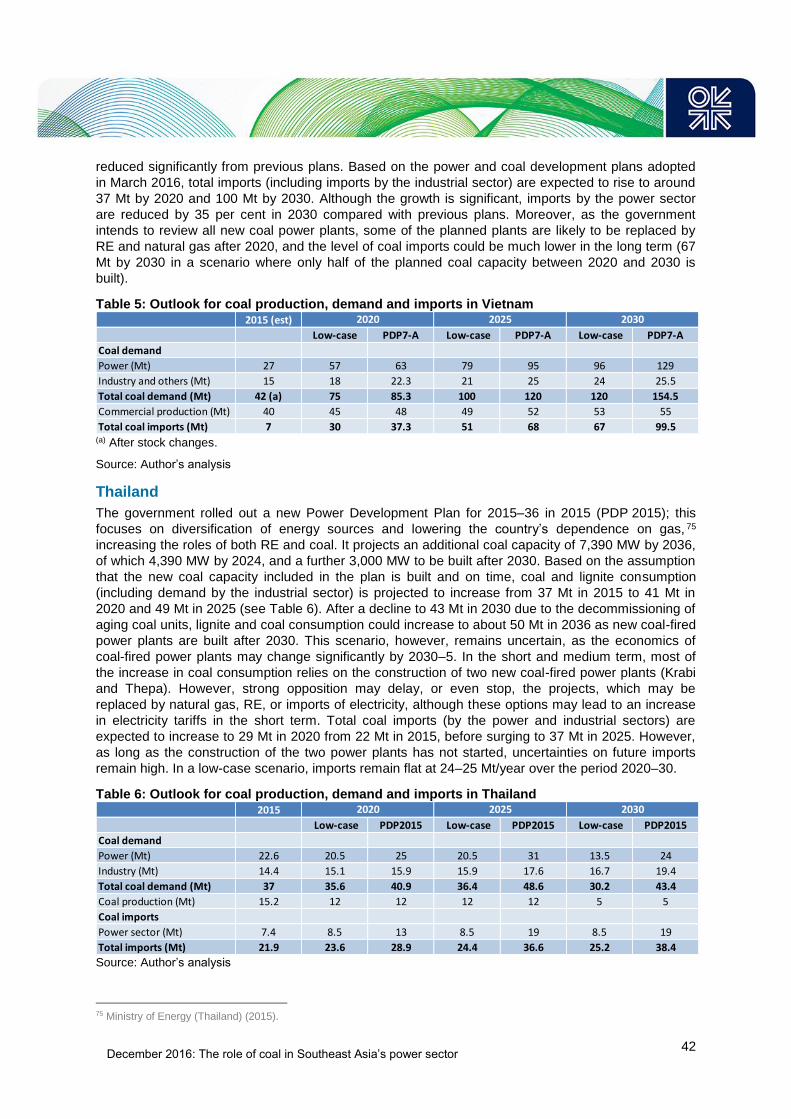
December 2016: The role of coal in Southeast Asia’s power sector
42
reduced significantly from previous plans. Based on the power and coal development plans adopted
in March 2016, total imports (including imports by the industrial sector) are expected to rise to around
37 Mt by 2020 and 100 Mt by 2030. Although the growth is significant, imports by the power sector
are reduced by 35 per cent in 2030 compared with previous plans. Moreover, as the government
intends to review all new coal power plants, some of the planned plants are likely to be replaced by
RE and natural gas after 2020, and the level of coal imports could be much lower in the long term (67
Mt by 2030 in a scenario where only half of the planned coal capacity between 2020 and 2030 is
built).
Table 5: Outlook for coal production, demand and imports in Vietnam
(a) After stock changes.
Source: Author’s analysis
Thailand
The government rolled out a new Power Development Plan for 2015–36 in 2015 (PDP 2015); this
focuses on diversification of energy sources and lowering the country’s dependence on gas, 75
increasing the roles of both RE and coal. It projects an additional coal capacity of 7,390 MW by 2036,
of which 4,390 MW by 2024, and a further 3,000 MW to be built after 2030. Based on the assumption
that the new coal capacity included in the plan is built and on time, coal and lignite consumption
(including demand by the industrial sector) is projected to increase from 37 Mt in 2015 to 41 Mt in
2020 and 49 Mt in 2025 (see Table 6). After a decline to 43 Mt in 2030 due to the decommissioning of
aging coal units, lignite and coal consumption could increase to about 50 Mt in 2036 as new coal-fired
power plants are built after 2030. This scenario, however, remains uncertain, as the economics of
coal-fired power plants may change significantly by 2030–5. In the short and medium term, most of
the increase in coal consumption relies on the construction of two new coal-fired power plants (Krabi
and Thepa). However, strong opposition may delay, or even stop, the projects, which may be
replaced by natural gas, RE, or imports of electricity, although these options may lead to an increase
in electricity tariffs in the short term. Total coal imports (by the power and industrial sectors) are
expected to increase to 29 Mt in 2020 from 22 Mt in 2015, before surging to 37 Mt in 2025. However,
as long as the construction of the two power plants has not started, uncertainties on future imports
remain high. In a low-case scenario, imports remain flat at 24–25 Mt/year over the period 2020–30.
Table 6: Outlook for coal production, demand and imports in Thailand
Source: Author’s analysis
75 Ministry of Energy (Thailand) (2015).
2015 (est)
Low-case PDP7-A Low-case PDP7-A Low-case PDP7-A
Coal demand
Power (Mt) 27 57 63 79 95 96 129
Industry and others (Mt) 15 18 22.3 21 25 24 25.5
Total coal demand (Mt) 42 (a) 75 85.3 100 120 120 154.5
Commercial production (Mt) 40 45 48 49 52 53 55
Total coal imports (Mt) 7 30 37.3 51 68 67 99.5
2020 2025 2030
2015
Low-case PDP2015 Low-case PDP2015 Low-case PDP2015
Coal demand
Power (Mt) 22.6 20.5 25 20.5 31 13.5 24
Industry (Mt) 14.4 15.1 15.9 15.9 17.6 16.7 19.4
Total coal demand (Mt) 37 35.6 40.9 36.4 48.6 30.2 43.4
Coal production (Mt) 15.2 12 12 12 12 5 5
Coal imports
Power sector (Mt) 7.4 8.5 13 8.5 19 8.5 19
Total imports (Mt) 21.9 23.6 28.9 24.4 36.6 25.2 38.4
2020 2025 2030

December 2016: The role of coal in Southeast Asia’s power sector
43
Malaysia
The Electricity Supply Outlook for Peninsular Malaysia, prepared by the Energy Commission and
adopted in 2016, foresees the commissioning of 5,010 MW in Peninsular Malaysia over the period
2015–20 (of which 2,010 MW were commissioned in 2015 and 2016).76 Coal demand by the power
sector in Peninsular Malaysia is therefore going to increase dramatically to around 38 Mt by 2020
(see Table 7). Between 2020 and 2025, the Energy Commission projects one additional 1,000 MW
coal plant, which would raise coal demand by the power sector to 41.5 Mt in 2025. In addition, the
industrial sector is expected to use 3–5 Mt per year, bringing Peninsular Malaysia’s total consumption
to 42 Mt in 2020 and 46.5 Mt in 2025. After 2025, this report has assumed that no additional coal
power plant is built in Peninsular Malaysia. In Sarawak, coal demand, fuelled by local production, is
expected to reach about 6 Mt when the Balingian coal-fired power plant is commissioned.
Malaysian coal imports are expected to increase strongly during the period 2015–20, driven by the
needs of the power sector in Peninsular Malaysia and, to a lesser extent, by growth in the industrial
sector. Based on the needs of the power plants currently under construction, total coal imports
(including imports by the industrial sector) are expected to jump from 26 Mt in 2015 to 42 Mt in 2020
and 46.5 Mt in 2030. After 2020, however, the slower rate of growth in electricity demand coupled with
increasing electricity imports from Sarawak, the development of RE, and greater energy efficiency
efforts, could lead to a slowdown in the growth in coal imports to 41 Mt by 2030.
Table 7: Outlook for coal demand and imports in Malaysia
Source: Author’s analysis
Philippines
The Philippines had 5.9 GW of coal capacity at the end of 2015.77 In addition, 4.7 GW of committed
coal capacity are planned to be completed by 2020. In the PDP scenario, coal demand by the power
sector could increase to 32 Mt by 2020 from 18 Mt in 2015 (see Table 8) if no delays in the
commissioning of the committed plants occur. The industrial sector (mainly the cement industry) is
also expected to increase its coal demand and could push total demand up to 37 Mt by 2020. In a
Low scenario, this report considers delays in the commissioning of new power plants (only 3.4 GW
commissioned by 2020), and assumes that the committed 4.7 GW are completed by 2025 only. Under
these assumptions, total coal demand (including industrial demand) totals 33 Mt in 2020. As the
growth in domestic production is limited, imports are expected to surge from 17 Mt in 2015 to 22–27
Mt by 2020.
In the longer term, the rise in coal demand by the power sector is likely to slow down. The dramatic
increase in coal-fired capacity expected between 2016 and 2020 is mainly explained by the
requirement to rapidly add capacity to avoid power crises. After the current buildout, there are still
some 8 GW of planned coal capacity. However, this indicated capacity exceeds the additional
requirement for new capacity by 2030. In addition, other fuels and technologies are expected to be
developed as baseload sources of electricity (geothermal, biomass, nuclear in the long term). These
sources will displace the need for some additional coal capacity. The Low scenario assumes that only
1 GW of coal capacity is added by 2025 and none after that date. In the High scenario, 3 GW of new
76 Energy Commission (Malaysia) (2016). 77 Department of Energy (DOE) (Philippines) (2016).
2015
Low-case Plan Low-case Plan Low-case High-case
Coal demand
Peninsular Malaysia 26 34 42 41 46.5 41 46.5
Power sector 23 31 38 38 41.5 38 41.5
Industrial sector 3 3 4 3 5 3 5
Sarawak (total demand) 3 5.6 5.6 6 6 6 6
Total Malaysia (Mt) 29 39.6 47.6 47 52.5 47 52.5
Coal Imports 26 34 42 41 46.5 41 46.5
2020 2025 2030
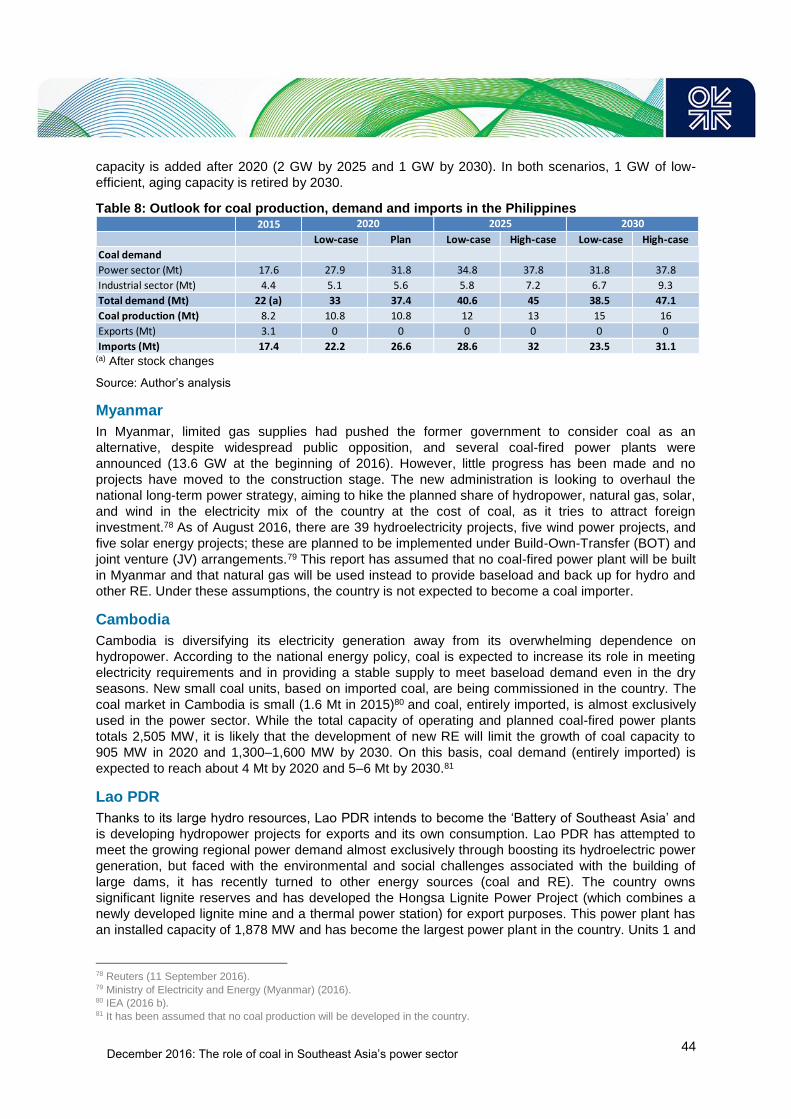
December 2016: The role of coal in Southeast Asia’s power sector
44
capacity is added after 2020 (2 GW by 2025 and 1 GW by 2030). In both scenarios, 1 GW of low-
efficient, aging capacity is retired by 2030.
Table 8: Outlook for coal production, demand and imports in the Philippines
(a) After stock changes
Source: Author’s analysis
Myanmar
In Myanmar, limited gas supplies had pushed the former government to consider coal as an
alternative, despite widespread public opposition, and several coal-fired power plants were
announced (13.6 GW at the beginning of 2016). However, little progress has been made and no
projects have moved to the construction stage. The new administration is looking to overhaul the
national long-term power strategy, aiming to hike the planned share of hydropower, natural gas, solar,
and wind in the electricity mix of the country at the cost of coal, as it tries to attract foreign
investment.78 As of August 2016, there are 39 hydroelectricity projects, five wind power projects, and
five solar energy projects; these are planned to be implemented under Build-Own-Transfer (BOT) and
joint venture (JV) arrangements.79 This report has assumed that no coal-fired power plant will be built
in Myanmar and that natural gas will be used instead to provide baseload and back up for hydro and
other RE. Under these assumptions, the country is not expected to become a coal importer.
Cambodia
Cambodia is diversifying its electricity generation away from its overwhelming dependence on
hydropower. According to the national energy policy, coal is expected to increase its role in meeting
electricity requirements and in providing a stable supply to meet baseload demand even in the dry
seasons. New small coal units, based on imported coal, are being commissioned in the country. The
coal market in Cambodia is small (1.6 Mt in 2015)80 and coal, entirely imported, is almost exclusively
used in the power sector. While the total capacity of operating and planned coal-fired power plants
totals 2,505 MW, it is likely that the development of new RE will limit the growth of coal capacity to
905 MW in 2020 and 1,300–1,600 MW by 2030. On this basis, coal demand (entirely imported) is
expected to reach about 4 Mt by 2020 and 5–6 Mt by 2030.81
Lao PDR
Thanks to its large hydro resources, Lao PDR intends to become the ‘Battery of Southeast Asia’ and
is developing hydropower projects for exports and its own consumption. Lao PDR has attempted to
meet the growing regional power demand almost exclusively through boosting its hydroelectric power
generation, but faced with the environmental and social challenges associated with the building of
large dams, it has recently turned to other energy sources (coal and RE). The country owns
significant lignite reserves and has developed the Hongsa Lignite Power Project (which combines a
newly developed lignite mine and a thermal power station) for export purposes. This power plant has
an installed capacity of 1,878 MW and has become the largest power plant in the country. Units 1 and
78 Reuters (11 September 2016). 79 Ministry of Electricity and Energy (Myanmar) (2016). 80 IEA (2016 b). 81 It has been assumed that no coal production will be developed in the country.
2015
Low-case Plan Low-case High-case Low-case High-case
Coal demand
Power sector (Mt) 17.6 27.9 31.8 34.8 37.8 31.8 37.8
Industrial sector (Mt) 4.4 5.1 5.6 5.8 7.2 6.7 9.3
Total demand (Mt) 22 (a) 33 37.4 40.6 45 38.5 47.1
Coal production (Mt) 8.2 10.8 10.8 12 13 15 16
Exports (Mt) 3.1 0 0 0 0 0 0
Imports (Mt) 17.4 22.2 26.6 28.6 32 23.5 31.1
2020 2025 2030

December 2016: The role of coal in Southeast Asia’s power sector
45
2 were completed in June 2015 and November 2015 respectively. Unit 3 started production in March
2016. A fourth unit could be built on the site. The project is being developed by Hongsa Power
Company, a consortium comprising the Thai companies Banpu and RATCH, together with Lao
Holding State Enterprise (LHSE). Nearly all the plant’s output is sold to Thailand. The Hongsa mine
will produce 14 Mt per year to supply the power plant. A second, smaller, integrated project is planned
to be built in the southern Sekong province. Based on current coal projects, coal production and
demand in Lao PDR could reach 15–18 Mt by 2020, most of it being lignite with low calorific value
(2,000 kcal/kg), representing about 6 Mtce. Most of the production is destined to fuel power plants
built to both export electricity and satisfy rising domestic power demand. In addition, the cement
industry could consume some 1 Mt a year, with some minor coal imports due to quality issues.

December 2016: The role of coal in Southeast Asia’s power sector
46
Annex 2: Global steam coal trade declined in 2015 for the first time ever
International steam coal trade (seaborne and overland trade) grew almost continuously until 2014,
driven by a sustained growth in coal demand by the power sector. Between 2008 and 2014 the trade
nearly doubled, driven by rising coal import demand by countries in Asia – specifically China and India
– reaching 1,117 Mt in 2014, the majority (72 per cent) being traded in the Pacific Basin (Figure 18).82
China and India accounted for 85 per cent of the increase in total world steam coal trade from 2008 to
2014. Coal trade in the rest of the world declined over the same period. However, the growth rate
stagnated in 2014, falling to 1.4 per cent due to lower Chinese demand and imports. This was partly
compensated by increases in Indian imports but 2015 marked a profound shift in global steam coal
trade, with the first ever year of reduction in traded flows. Global steam coal imports actually fell by 6
per cent to 1,047 Mt in 2015, when both China and India reduced their imports.83
Figure 18: Global steam coal imports by basin
Source: IEA
China, which was the driving force of coal demand and export demand in the past decade, has
dramatically reduced its coal imports since 2014 (see Figure 19). At their peak in 2013, Chinese
steam coal imports totalled 252 Mt, up from 36 Mt in 2008. However, they fell by 9 per cent in 2014
and 34 per cent in 2015 to 150 Mt in 2015. In just two years, Chinese steam coal imports had fallen
by more than 100 Mt. Domestic supply overcapacities, improvements in coal transportation
infrastructure, measures to reduce air pollution, and slower growth in domestic coal demand had
resulted in lower domestic coal prices; this reduced the price advantage of overseas coal,
consequently reducing demand for coal imports. Additionally, the Chinese government introduced
several measures in late 2014 and early 2015 aimed at supporting China’s coal industry. These
measures include: re-establishing taxes on coal imports; placing limits on allowable sulphur, ash, and
trace elements for imported coal; and issuing a directive to major utilities to reduce their annual coal
imports by approximately 50 Mt.
India, the second-largest steam coal importing country, imported 186 Mt of steam coal in 2014, up
from 40 Mt in 2008. But its steam coal imports fell by 8 per cent in 2015 to 171 Mt. The government
intends to stop Indian reliance on steam coal imports by the end of 2017. Efforts are underway to
substantially increase domestic coal production and to complete three major rail transportation
82 Based on IEA data (IEA, 2016b). The steam coal market is split into two major markets, the Atlantic and the Pacific Basins.
The Atlantic Basin is made up of utilities and traders from Europe (including the countries bordering the Mediterranean), the
eastern seaboards of North, Central, and South America, and the northern and western coasts of Africa. The Pacific Basin is
made up of utilities from China, India, Japan, South Korea, and Taiwan. Other emerging buyers include Malaysia, Philippines,
Thailand, Vietnam, and the west coast of North America and South America. 83 The fall in global trade even started in 2014 for the seaborne steam coal trade (this excludes overland coal trade between
neighbouring countries), which fell by 1.8 per cent in 2014 and 5.8 per cent in 2015 and totalled 883 Mt in 2015.
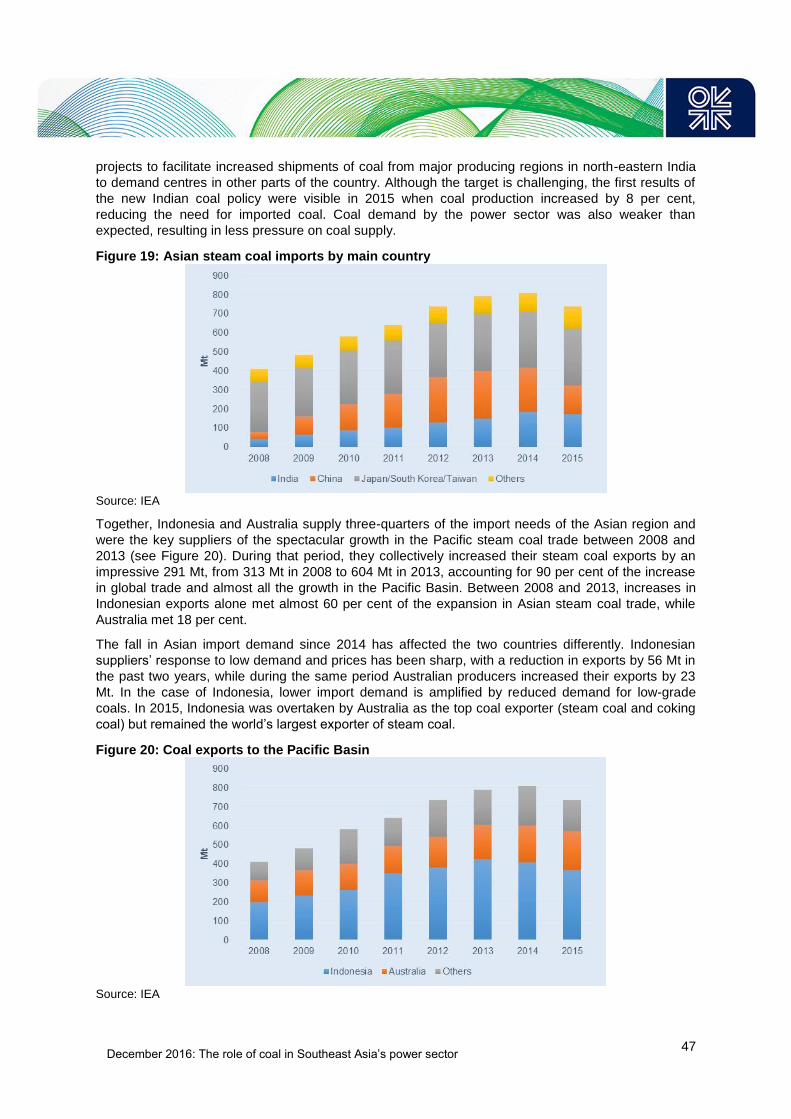
December 2016: The role of coal in Southeast Asia’s power sector
47
projects to facilitate increased shipments of coal from major producing regions in north-eastern India
to demand centres in other parts of the country. Although the target is challenging, the first results of
the new Indian coal policy were visible in 2015 when coal production increased by 8 per cent,
reducing the need for imported coal. Coal demand by the power sector was also weaker than
expected, resulting in less pressure on coal supply.
Figure 19: Asian steam coal imports by main country
Source: IEA
Together, Indonesia and Australia supply three-quarters of the import needs of the Asian region and
were the key suppliers of the spectacular growth in the Pacific steam coal trade between 2008 and
2013 (see Figure 20). During that period, they collectively increased their steam coal exports by an
impressive 291 Mt, from 313 Mt in 2008 to 604 Mt in 2013, accounting for 90 per cent of the increase
in global trade and almost all the growth in the Pacific Basin. Between 2008 and 2013, increases in
Indonesian exports alone met almost 60 per cent of the expansion in Asian steam coal trade, while
Australia met 18 per cent.
The fall in Asian import demand since 2014 has affected the two countries differently. Indonesian
suppliers’ response to low demand and prices has been sharp, with a reduction in exports by 56 Mt in
the past two years, while during the same period Australian producers increased their exports by 23
Mt. In the case of Indonesia, lower import demand is amplified by reduced demand for low-grade
coals. In 2015, Indonesia was overtaken by Australia as the top coal exporter (steam coal and coking
coal) but remained the world’s largest exporter of steam coal.
Figure 20: Coal exports to the Pacific Basin
Source: IEA

December 2016: The role of coal in Southeast Asia’s power sector
48
International steam coal prices: ‘boom and bust’ is the rule
International prices for steam coal are mainly determined by market forces (domestic prices may
include subsidies). Due to long lead times for the development of new coalmines, railways, and export
capacity, coal prices are cyclical. When supply is tight prices can rise steeply, incentivizing investment
in new infrastructure, while excess supply leads to falls in prices until the market rebalances. In the
short term, prices are volatile. Supply constraints (flooding of mines for instance) make coal
vulnerable to sudden shocks. On the demand side, lower electricity demand and high coal stocks may
lead to a fall in international coal prices. Figure 21 illustrates the evolution of Australian FOB prices
since the beginning of 2009 and shows the fall of coal prices from a peak of $132/t in January 2011 to
just $50/t in January 2016; this is mainly explained by global oversupply and a shrinking coal trade.
However, as explained in Box 4, the unexpected surge in Chinese imports since June 2016 has had a
huge impact on international coal prices. Since January 2016, steam coal prices have increased by
87 per cent, to $93/t in October 2016. At the beginning of November 2016, they exceeded $100/t.
Figure 21: Australian FOB steam coal prices
Source: World Bank

December 2016: The role of coal in Southeast Asia’s power sector
49
References
ACE (2015a), ‘The 4th ASEAN Energy Outlook’, (AEO4) 2013–2035, ASEAN Centre for Energy,
Jakarta, www.aseanenergy.org/resources/publications/the-4th-asean-energy-outlook/.
ACE (2015b), ‘ASEAN Plan of Action for Energy Cooperation (APAEC) 2016–2025, Phase I: 2016-
2020’, ASEAN Centre for Energy, Jakarta, www.aseanenergy.org/wp-
content/uploads/2015/12/HighRes-APAEC-online-version-final.pdf.
ACE (2016), ‘ASEAN-RESP: ASEAN Renewable Energy Policies’, Renewable Energy Support
Programme for ASEAN (ASEAN-RESP), ASEAN Centre for Energy Jakarta,
www.aseanenergy.org/resources/publications/asean-renewable-energy-policies/.
ADB (2013), ‘Energy Outlook for Asia and the Pacific’, Asian Development Bank, Manila,
www.adb.org/sites/default/files/publication/30429/energy-outlook.pdf.
ADB (2016a), ‘Asian development OUTLOOK 2016, Asia’s potential growth’, Asian Development
Bank, Manila, https://www.adb.org/sites/default/files/publication/182221/ado2016.pdf
ADB (2016b), ‘Myanmar Energy Master Plan’, presentation at the Energy Forum, 9 March 2016, Nay
Pyi Taw.
Agency for Natural Resources and Energy (Japan) (2016), Japanʼs contribution through Clean Coal
Technology, presentation at the 25th Clean Coal Day in Japan 2016 International Symposium, 7–8
September, 2016, Tokyo, www.jcoal.or.jp/eng/news/2016/08/clean-coal-day-in-japan-2016-
international-symposium.html.
ASEAN Secretariat (2015a), ‘A Blueprint for Growth, ASEAN Economic Community 2015: Progress
and Key Achievements’, Jakarta, www.asean.org/storage/images/2015/November/aec-page/AEC-
2015-Progress-and-Key-Achievements.pdf.
ASEAN Secretariat (2015b), ‘ASEAN Economic Community Blueprint 2025’, Jakarta,
www.asean.org/storage/images/2015/November/aec-page/AEC-Blueprint-2025-FINAL.pdf.
BP (2016), ‘Statistical Review of World Energy 2015’, BP, London,
www.bp.com/en/global/corporate/energy-economics/statistical-review-of-world-energy.html.
BPKP (2015), ‘National Medium-Term Development Plan for the period 2015–2019’, (RPJMN 2015-
19), BPKP (Financial Supervisory Agency), Jakarta, Indonesia
www.bpkp.go.id/sesma/konten/2254/Buku-I-II-dan-III-RPJMN-2015-2019.bpkp.
BGR (2015), ‘Energy Study 2015, Reserves, Resources and Availability of Energy Resources’,
Bundesanstalt für Geowissenschaften und Rohstoffe BGR, Hannover,
www.bgr.bund.de/EN/Themen/Energie/Downloads/energiestudie_2015_en.pdf?__blob=publicationFil
e&v=2.
Damar Pranadi A. (2016), ‘The Current Status of RE and its Target in ASEAN Member States’, ACE
blog, 15 September 2016, Jakarta, www.aseanenergy.org/blog/the-current-status-of-re-and-its-target-
in-asean-member-states/.
Department of Energy (DOE) (Philippines) (2016), ‘2015 Philippine Power Statistics’, Summary,
Department of Energy, Manila, Philippines
https://www.doe.gov.ph/sites/default/files/pdf/energy_statistics/power_statistics_2015_summary.pdf.
ERIA (2014), ‘Investing in Power Grid Interconnection in East Asia’, Economic Research Institute for
ASEAN and East Asia (ERIA), Jakarta.

December 2016: The role of coal in Southeast Asia’s power sector
50
Electricite du Laos (EDL), www.edl.com.la
Energy Commission (Malaysia) (2015), ‘2014 – Performance and Statistical Information on Electricity
Supply Industry in Malaysia’, Kuala Lumpur, http://meih.st.gov.my/documents/10620/f34c62ce-b169-
4729-b4e8-854bb5016922;
Energy Commission (Malaysia) (2016), ‘Peninsular Malaysia – Electricity Supply Industry Outlook
2016’, Kuala Lumpur, www.st.gov.my/index.php/download-page/category/106-
outlook.html?download=591:peninsular-malaysia-electricity-supply-industry-outlook-2016.
Energy Market Authority (EMA) (Singapore), ‘Statistics’, https://www.ema.gov.sg/Statistics.aspx.
General Statistics Office (Vietnam), https://www.gso.gov.vn/.
Global coal plant tracker, http://endcoal.org/global-coal-plant-tracker/.
HAPUA (2016), ‘ASEAN power grid: route to multilateral electricity trade’, presentation by
Hermawanto B., Chairman, ASEAN Power Grid Consultative Committee (APGCC), at the Asia Clean
Energy Forum (ACEF), HAPUA/APGCC, Manila, 6 June 2016, www.asean-aemi.org/wp-
content/uploads/2016/06/AEMI-ACEF2016-Bambang-Hermawanto.pdf.
IEA (2015a), ‘Southeast Asia Energy Outlook 2015’, World Energy Outlook Special Report,
OECD/IEA, Paris,
https://www.iea.org/publications/freepublications/publication/weo2015_southeastasia.pdf.
IEA (2015b), ‘Development Prospects of the ASEAN Power Sector, Towards an Integrated Electricity
Market’, Partner Country Series, OECD/IEA, Paris,
https://www.iea.org/publications/freepublications/publication/Partnercountry_DevelopmentProspectsof
theASEANPowerSector.pdf.
IEA (2015c), ‘World Energy Outlook 2015’, OECD/IEA, Paris, www.worldenergyoutlook.org/weo2015/.
Referred to in this document as ‘WEO 2015’.
IEA (2015d), ‘Energy and Climate Change’, World Energy Outlook Special Report 2015, OECD/IEA,
Paris,
https://www.iea.org/publications/freepublications/publication/WEO2015SpecialReportonEnergyandCli
mateChange.pdf.
IEA (2016a), ‘World Energy Balances 2016’, International Energy Agency, OCED/IEA, Paris,
https://www.iea.org/statistics/.
IEA (2016b), ‘Coal Information 2016’, OECD/IEA, Paris, www.iea.org/statistics/.
IEA (2016c), ‘World Energy Investment 2016’, IEA/OECD, Paris, https://www.iea.org/investment/.
IEA (2016d), ‘Reducing emissions from fossil-fired generation – Indonesia, Malaysia and Viet Nam’,
Insight Series 2016, IEA/OECD, Paris,
https://www.iea.org/publications/insights/insightpublications/reducing-emissions-in-fossil-fired-
generation---indonesia-malaysia-and-viet-nam.html.
IEA (2016e), ‘Energy and Air Pollution’, World Energy Outlook Special Report, 2016, IEA/OECD,
Paris, https://www.iea.org/publications/freepublications/publication/weo-2016-special-report-energy-
and-air-pollution.html.
IEA CCC (2015), Coal and gas competition in power generation in Asia, CCC/246, IEA Clean Coal
Centre, London, www.iea-coal.org.uk/.
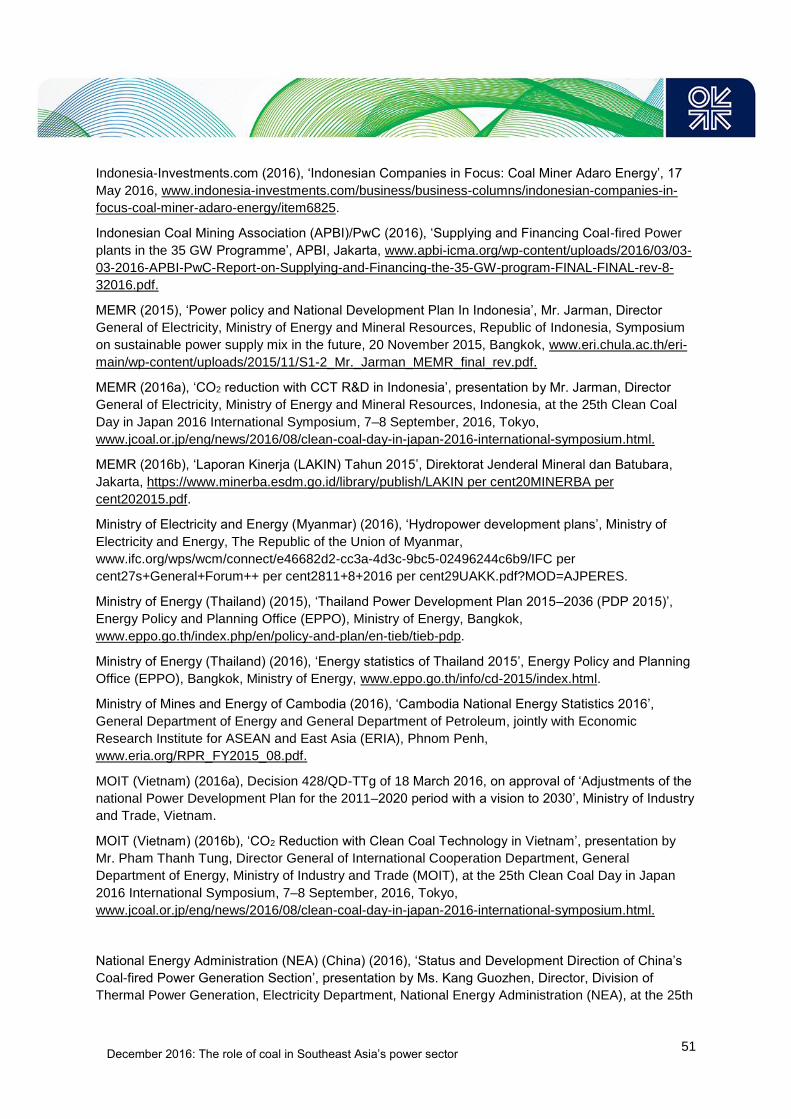
December 2016: The role of coal in Southeast Asia’s power sector
51
Indonesia-Investments.com (2016), ‘Indonesian Companies in Focus: Coal Miner Adaro Energy’, 17
May 2016, www.indonesia-investments.com/business/business-columns/indonesian-companies-in-
focus-coal-miner-adaro-energy/item6825.
Indonesian Coal Mining Association (APBI)/PwC (2016), ‘Supplying and Financing Coal-fired Power
plants in the 35 GW Programme’, APBI, Jakarta, www.apbi-icma.org/wp-content/uploads/2016/03/03-
03-2016-APBI-PwC-Report-on-Supplying-and-Financing-the-35-GW-program-FINAL-FINAL-rev-8-
32016.pdf.
MEMR (2015), ‘Power policy and National Development Plan In Indonesia’, Mr. Jarman, Director
General of Electricity, Ministry of Energy and Mineral Resources, Republic of Indonesia, Symposium
on sustainable power supply mix in the future, 20 November 2015, Bangkok, www.eri.chula.ac.th/eri-
main/wp-content/uploads/2015/11/S1-2_Mr._Jarman_MEMR_final_rev.pdf.
MEMR (2016a), ‘CO2 reduction with CCT R&D in Indonesia’, presentation by Mr. Jarman, Director
General of Electricity, Ministry of Energy and Mineral Resources, Indonesia, at the 25th Clean Coal
Day in Japan 2016 International Symposium, 7–8 September, 2016, Tokyo,
www.jcoal.or.jp/eng/news/2016/08/clean-coal-day-in-japan-2016-international-symposium.html.
MEMR (2016b), ‘Laporan Kinerja (LAKIN) Tahun 2015’, Direktorat Jenderal Mineral dan Batubara,
Jakarta, https://www.minerba.esdm.go.id/library/publish/LAKIN per cent20MINERBA per
cent202015.pdf.
Ministry of Electricity and Energy (Myanmar) (2016), ‘Hydropower development plans’, Ministry of
Electricity and Energy, The Republic of the Union of Myanmar,
www.ifc.org/wps/wcm/connect/e46682d2-cc3a-4d3c-9bc5-02496244c6b9/IFC per
cent27s+General+Forum++ per cent2811+8+2016 per cent29UAKK.pdf?MOD=AJPERES.
Ministry of Energy (Thailand) (2015), ‘Thailand Power Development Plan 2015–2036 (PDP 2015)’,
Energy Policy and Planning Office (EPPO), Ministry of Energy, Bangkok,
www.eppo.go.th/index.php/en/policy-and-plan/en-tieb/tieb-pdp.
Ministry of Energy (Thailand) (2016), ‘Energy statistics of Thailand 2015’, Energy Policy and Planning
Office (EPPO), Bangkok, Ministry of Energy, www.eppo.go.th/info/cd-2015/index.html.
Ministry of Mines and Energy of Cambodia (2016), ‘Cambodia National Energy Statistics 2016’,
General Department of Energy and General Department of Petroleum, jointly with Economic
Research Institute for ASEAN and East Asia (ERIA), Phnom Penh,
www.eria.org/RPR_FY2015_08.pdf.
MOIT (Vietnam) (2016a), Decision 428/QD-TTg of 18 March 2016, on approval of ‘Adjustments of the
national Power Development Plan for the 2011–2020 period with a vision to 2030’, Ministry of Industry
and Trade, Vietnam.
MOIT (Vietnam) (2016b), ‘CO2 Reduction with Clean Coal Technology in Vietnam’, presentation by
Mr. Pham Thanh Tung, Director General of International Cooperation Department, General
Department of Energy, Ministry of Industry and Trade (MOIT), at the 25th Clean Coal Day in Japan
2016 International Symposium, 7–8 September, 2016, Tokyo,
www.jcoal.or.jp/eng/news/2016/08/clean-coal-day-in-japan-2016-international-symposium.html.
National Energy Administration (NEA) (China) (2016), ‘Status and Development Direction of China’s
Coal-fired Power Generation Section’, presentation by Ms. Kang Guozhen, Director, Division of
Thermal Power Generation, Electricity Department, National Energy Administration (NEA), at the 25th

December 2016: The role of coal in Southeast Asia’s power sector
52
Clean Coal Day in Japan 2016 International Symposium, 7–8 September, 2016, Tokyo,
www.jcoal.or.jp/eng/news/2016/08/clean-coal-day-in-japan-2016-international-symposium.html.
National Energy Management Committee (NEMC) (Myanmar) (2016), ‘Myanmar Energy Master Plan’,
ADB/Myanmar Ministry of Energy, Naypyidaw,
https://www.dropbox.com/s/6mr5u0mkncythoi/20151221_IES-
MMIC_Myanmar_EMP_Final_V2%20%281%29.pdf?dl=0.
OIES (2014), ‘China’s Coal Market: Can Beijing Tame “King Coal”?’, Sylvie Cornot-Gandolphe,
Oxford Institute for Energy Studies Paper, CL 1, December, https://www.oxfordenergy.org/wpcms/wp-
content/uploads/2014/12/CL-1.pdf.
OIES (2016), ‘Indian Steam Coal Imports: The Great Equation’, Sylvie Cornot-Gandolphe, Oxford
Institute for Energy Studies Paper, CL 3, March, https://www.oxfordenergy.org/wpcms/wp-
content/uploads/2016/03/Indian-Steam-Coal-Imports-The-Great-Equation-CL-3.pdf.
PLN (2016a), ‘RUPTL 2016–2025’, (Electricity Supply Business Plan for 2016–2025), Perusahaan
Listrik Negara (PLN), Jakarta, www.djk.esdm.go.id/pdf/RUPTL/RUPTL%20PLN%202016-2025.pdf.
PLN (2016b), Annual Report 2015, PLN, Jakarta, www.pln.co.id/.
PLN (2016c), ‘35,000 MW for Indonesia’, PLN, Jakarta, www.pln.co.id/35000mw/en/#s1.
Power Engineering International, ‘IEA Clean Coal Centre points to Japan’s clean coal leadership’,
February 2016, www.powerengineeringint.com/articles/2016/02/iea-clean-coal-centre-points-to-japan-
s-clean-coal-leadership.html.
Reuters, ‘Hungry for power, Myanmar bets on hydro in new energy plan’, 11 September 2016,
www.reuters.com/article/us-myanmar-energy-hydropower-idUSKCN11H0SD.
SREP (2016), ‘Scaling-up Renewable Energy for Low Income Countries Program, Investment Plan for
the Kingdom of Cambodia’, draft document, SREP/SC.15/5, World Bank/Climate Investment Fund
(CIF), https://www-cif.climateinvestmentfunds.org/sites/default/files/meeting-
documents/srep_15_5_srep_investment_plan_for_cambodia_final.pdf.
UN (2016), World population prospects, the 2015 revision, Department of Economic and Social Affairs
(ESA), United Nations, New York, https://esa.un.org/unpd/wpp/Download/Standard/Population/.
WEO 2015, see IEA (2015c).
World Bank (2016), World Development Indicators, New York, http://data.worldbank.org/data-
catalog/GDP-ranking-table