Asia’s largest Pharma Complex - Green Business Centre
42
1 Asia’s largest Pharma Complex , Visakhapatnam, India Reactor Volume (in Lakhs Lts ) Installed Capacity (in MT) (per Annum) 73.2 36,878 DD.Prasad Rao R.Appa Rao
Transcript of Asia’s largest Pharma Complex - Green Business Centre

1
Asia’s largest Pharma Complex , Visakhapatnam, India
Reactor Volume
(in Lakhs Lts )Installed Capacity
(in MT) (per Annum)73.2 36,878
DD.Prasad RaoR.Appa Rao

NUMBERS SAY IT ALL
25+
years of expertise
in pharmaceuticals
Amongst the world’s
largest manufacturers of
APIs
& ARVs
30+
state-of-the-art
manufacturing facilities
Global presence
120+
countries
15,000+
employees worldwide
300+
products in portfolio
India’s
largestclosely held
pharmaceutical company
2
3
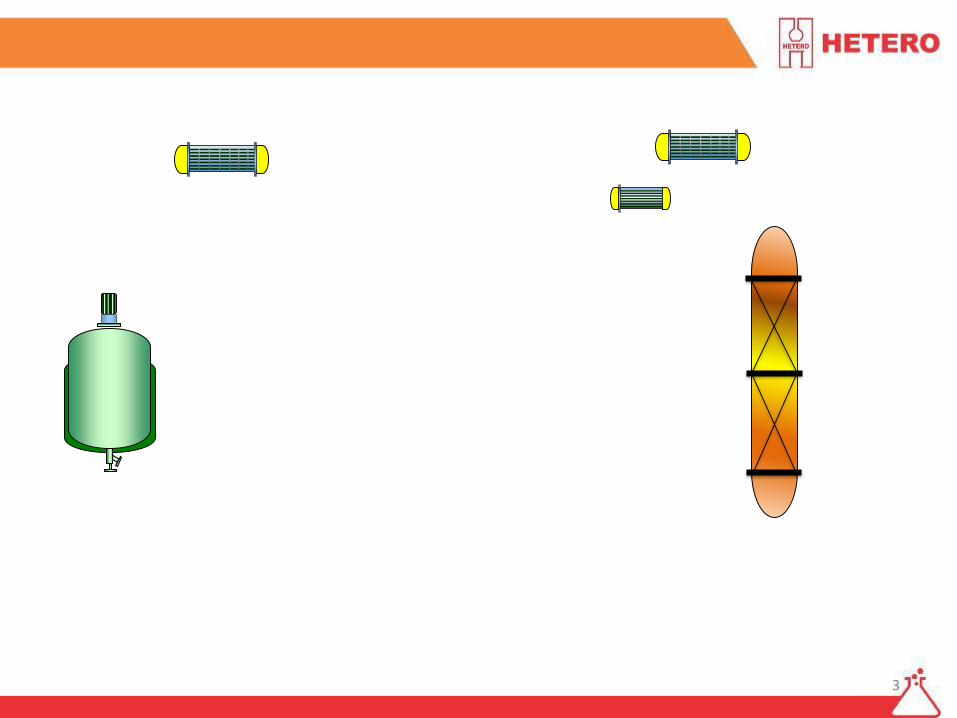
Column
ANFD
REACTOR
DISTILLED RECEIVER
ANFDML’S
RECEIVER
STORAGETANK
PHARMASTORES
Recovered Solvent
REFLUX
REBOILER
STORAGE TANK
Process ,Recovery & Reuse Integration

Source 2015-16 2016-17 2017-18
Wind Power 77190845 70173261 75324321
Co Generation 40887798 32218049 34529062
APEPDCL/OA 28567029 18758508 27115694
DG Power 1423009 812390 765031
Total 148068681 121962208 137734108
Power Consumption Scenario – In kWh
52.13%
57.54%54.69%
27.61% 26.42% 25.07%
19.29%15.38%
19.69%
0.96% 0.67% 0.56%
2015-16 2016-17 2017-18
Wind power Co-Generation APEPDCL/OA DG Power

Installed in three Locations
Wind Power Generation (Captive Power)
a) Tirumalayapalli, Kadapa, AP, 54 MW (36Nosx1.5MW)July’2013.
a) Isapur, Maharashtra31.5MW (10.5Commissioned)
5MW Solar Power Plant inMothkur , Nalgonda Dist

6
54.69%25.07%
19.69%0.56%
Power Supply (Source wise)
Wind Power Co Generation APEPDCL/OA DG Power
63.00%,
37.00%,
Power Demand
Utilities Production
Energy Mapping

7
Specific Energy Trend Over Last Three Years
44525
35054 34913
FY 2015-16 FY 2016-17 FY 2017-18
Electrical Energy/Kg of Drug
353485
322993
226995
FY 2015-16 FY 2016-17 FY 2017-18
Thermal Energy/Kg of Drug
36%22%

Refrigeration System
Description Design
Tem Mfg STD (KW/TR)
Present Operation (KW/TR)
Target (KW/TR)
Screw Compressor
+ 5°C 0.70 0.85 0.80
-5°C 1.00 1.15 1.10
-15°C 1.40 1.60 1.50
-20°C 1.55 1.80 1.75
-40°C 2.60 3.00 2.80
-70°C 5.40 6.50 6.10
Boiler Description Mfg. STD Present Operation Target
Fuel to Steam Ratio with Imported Coal (kg/kg)
4.00 4.00 4.10
Steam Condensate Recovery % 80 -90 51.00 70.00
Industrial Bench Marking of Utilities
9
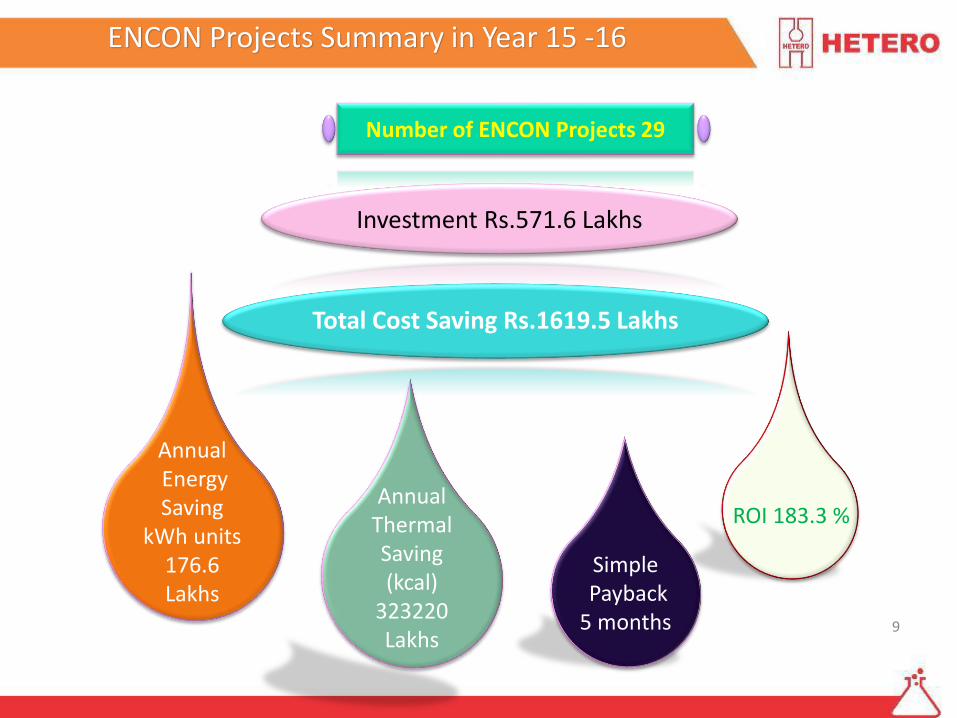
AnnualEnergy Saving
kWh units 176.6Lakhs
AnnualThermalSaving (kcal)
323220Lakhs
SimplePayback
5 months
ROI 183.3 %
ENCON Projects Summary in Year 15 -16
Total Cost Saving Rs.1619.5 Lakhs
Number of ENCON Projects 29
Investment Rs.571.6 Lakhs

10
AnnualEnergy Saving
kWh units 238.86Lakhs
AnnualThermalSaving (kcal)52000Lakhs
SimplePayback
5 months
ROI 189%
ENCON Projects Summary in Year 16 -17
Total Cost Saving Rs.316.06 Lakhs
Number of ENCON Projects 12
Investment Rs.109 Lakhs

11
AnnualEnergy Saving
kWh units 273.58Lakhs
SimplePayback
2 monthsROI 521%
ENCON Projects Summary in Year 17 -18
Total Cost Saving Rs.273.58 Lakhs
Number of ENCON Projects 10
Investment Rs.44 Lakhs

12
ENCON Projects Summary in Year 15 -18
Number of ENCON Projects 51
Investment Rs.724.60 Lakhs
Total Cost Saving Rs.2209.14 Laks
AnnualEnergy Saving
kWh units 689.04Lakhs
AnnualThermalSaving (kcal)
375220Lakhs
SimplePayback
12 months
ROI 205%

S
No.Title of Project
Annual
Savings
in Lakhs
Invest Year
1Optimization Chilling Plants Operation - Stopping of low load running minus 5°C refrigeration systems(<60 TR)
1.7 0 2015-16
2Modification of Reactor Utility Line for increasing cooling efficiency and reducing of time cycle
0.2 0 2015-16
3Enhanced daylight usage by replacing Translucent, Strip/Roof sheets by high performance prismatic transparent sheets for roofing.
0.1 0 2015-16
4 Reduction of Drying Time by using Steam in place of Hot Water 0.3 0 2015-16
5Replacement of -40 deg C brine in place of -15 deg C brine to reduce batch time
29.4 0 2016-17
6Rectification drive on Faulty Installation of evaporative condensers
59.5 0 2016-17
7 Introducing Evaporative condenser for refrigeration systems 12.1 0 2016-17
8 Optimization of Coal handling plant operating hours. 16.0 0 2017-18
9 AHUs operation control as per demand. 50.0 0 2017-18
10Control of Air Requirement in crystallizer room by optimizing AHUs
47.0 0 2017-18
Total 10 No’s Projects 216.3
ENCON Projects Summary – Zero/Low Investment

14
S.No. Title of Project
Annual Electrical Saving,
Million Rs
Annual Thermal Saving, Million
Kcal
Total Annual Savings,
Million Rs
Investment Made
Payback
1Reduction in Power Plant Boiler DE aerator steam consumption
11037 16.8 3 2
2Reduction in steam distribution losses with steam lines temperature mapping and insulation strengthening.
13797 21 4 2
3Power Saving and Turbine loading improvement by installation of VAMs in place of +5 compressors
26.8 26.8 15.6 7
4 Optimization of Coal handling plant operating hours. 0.16 0.16 0 0
5 Installation of De super heaters for SRS - I&II 1776 2.67 1.5 7
6Increasing the utility pressure & stopped secondery pumps by optimizing the process.
9.14 9.14 0 0
7 AHUs operation control as per demand 5.04 5.05 0 0
8Control of Air requirement in crystalliser room by oprtimazing AHUs
4.69 4.69 0 0
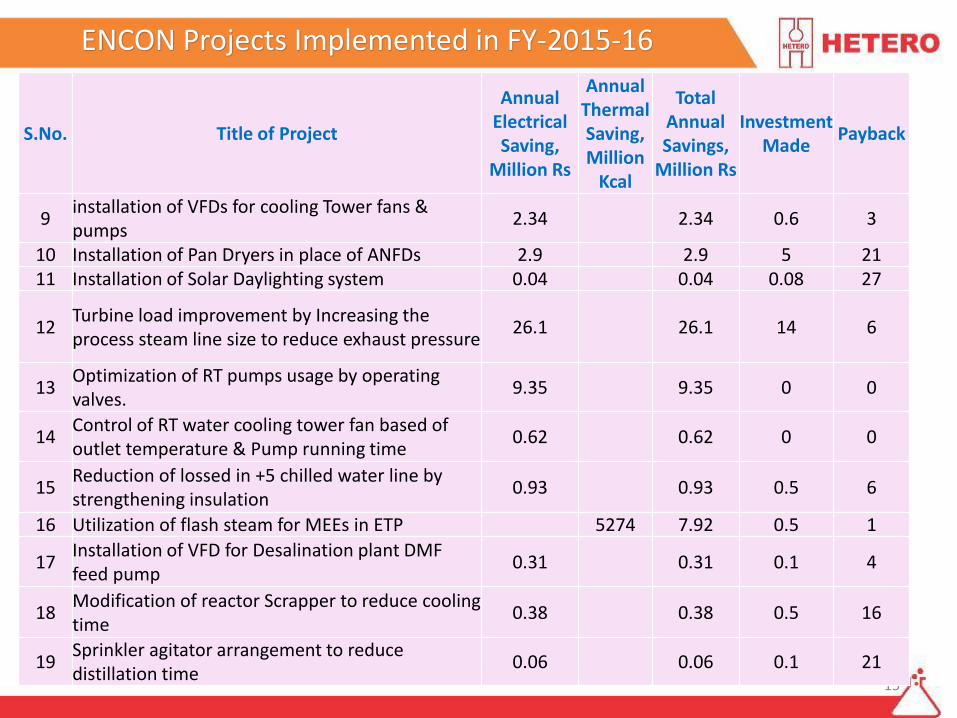
ENCON Projects Implemented in FY-2015-16
15
S.No. Title of Project
Annual Electrical Saving,
Million Rs
Annual Thermal Saving, Million
Kcal
Total Annual Savings,
Million Rs
Investment Made
Payback
9installation of VFDs for cooling Tower fans & pumps
2.34 2.34 0.6 3
10 Installation of Pan Dryers in place of ANFDs 2.9 2.9 5 2111 Installation of Solar Daylighting system 0.04 0.04 0.08 27
12Turbine load improvement by Increasing the process steam line size to reduce exhaust pressure
26.1 26.1 14 6
13Optimization of RT pumps usage by operating valves.
9.35 9.35 0 0
14Control of RT water cooling tower fan based of outlet temperature & Pump running time
0.62 0.62 0 0
15Reduction of lossed in +5 chilled water line by strengthening insulation
0.93 0.93 0.5 6
16 Utilization of flash steam for MEEs in ETP 5274 7.92 0.5 1
17Installation of VFD for Desalination plant DMF feed pump
0.31 0.31 0.1 4
18Modification of reactor Scrapper to reduce cooling time
0.38 0.38 0.5 16
19Sprinkler agitator arrangement to reduce distillation time
0.06 0.06 0.1 21
ENCON Projects Implemented in FY-2015-16

16
S.No. Title of Project
Annual Electrical Saving,
Million Rs
Annual Thermal Saving, Million
Kcal
Total Annual Savings,
Million Rs
Investment Made
Payback
20Installation of Liquid Liquid extractor system to improve THF recovery
2.34 2.34 2 10
21Filtration of N - hexane & Acetone with Pressure in place of Vacuum
0.21 0.21 0 0
22 Batch size increase in MacDowell in I Block 0.5 0.5 0 0
23 PNG filtration with ANFD in place of Centrifuge 0.11 0.11 0 0
24Installation of VFDs for AHUs to control RPM as per requirement
2.21 2.21 2 11
25Chiller primary pump interlocking with compressor
5 5 0.2 0
26Block wise and Product Specific power consumption monitoring (Power quota fixing)
9.9 9.9 0 0
27 Installation of VFDs for Reactors 3.7 3.7 6.68 22
28Installation of Preheating condenser for Methanol distillation
438 0.66 0.5 9
29Connecting capacitors at Motor end for BFW pump and ETP agitators
0.52 0.52 0.3 7
Total 112.91 32322 161.96 57.16
ENCON Projects Implemented in FY-2015-16
17
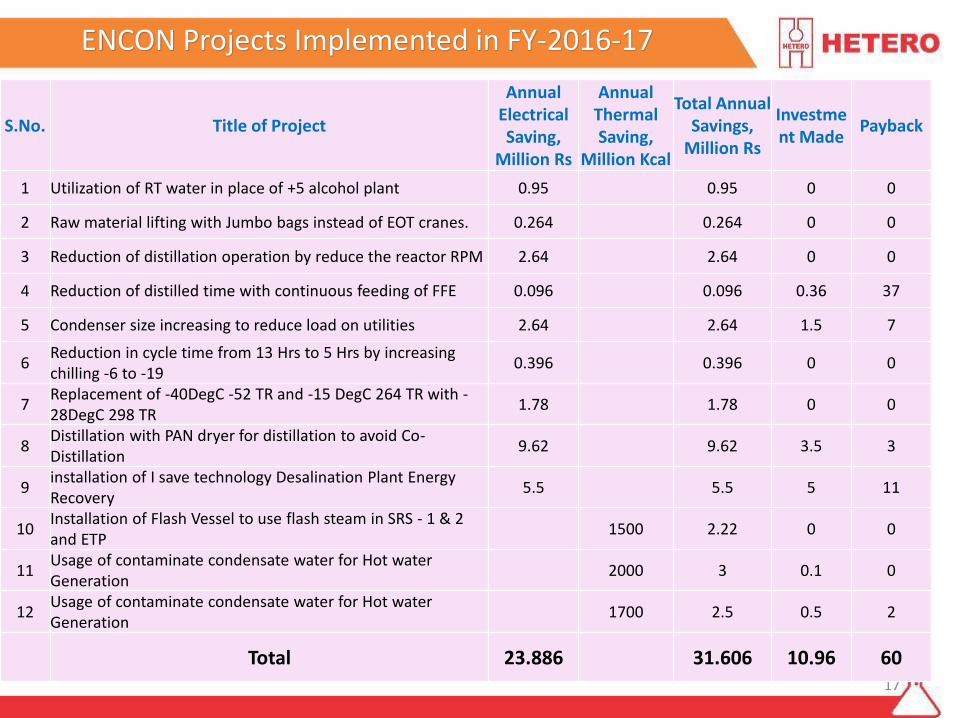
ENCON Projects Implemented in FY-2016-17
S.No. Title of Project
Annual Electrical Saving,
Million Rs
Annual Thermal Saving,
Million Kcal
Total Annual Savings,
Million Rs
Investment Made
Payback
1 Utilization of RT water in place of +5 alcohol plant 0.95 0.95 0 0
2 Raw material lifting with Jumbo bags instead of EOT cranes. 0.264 0.264 0 0
3 Reduction of distillation operation by reduce the reactor RPM 2.64 2.64 0 0
4 Reduction of distilled time with continuous feeding of FFE 0.096 0.096 0.36 37
5 Condenser size increasing to reduce load on utilities 2.64 2.64 1.5 7
6Reduction in cycle time from 13 Hrs to 5 Hrs by increasing chilling -6 to -19
0.396 0.396 0 0
7Replacement of -40DegC -52 TR and -15 DegC 264 TR with -28DegC 298 TR
1.78 1.78 0 0
8Distillation with PAN dryer for distillation to avoid Co-Distillation
9.62 9.62 3.5 3
9installation of I save technology Desalination Plant Energy Recovery
5.5 5.5 5 11
10Installation of Flash Vessel to use flash steam in SRS - 1 & 2 and ETP
1500 2.22 0 0
11Usage of contaminate condensate water for Hot water Generation
2000 3 0.1 0
12Usage of contaminate condensate water for Hot water Generation
1700 2.5 0.5 2
Total 23.886 31.606 10.96 60
18
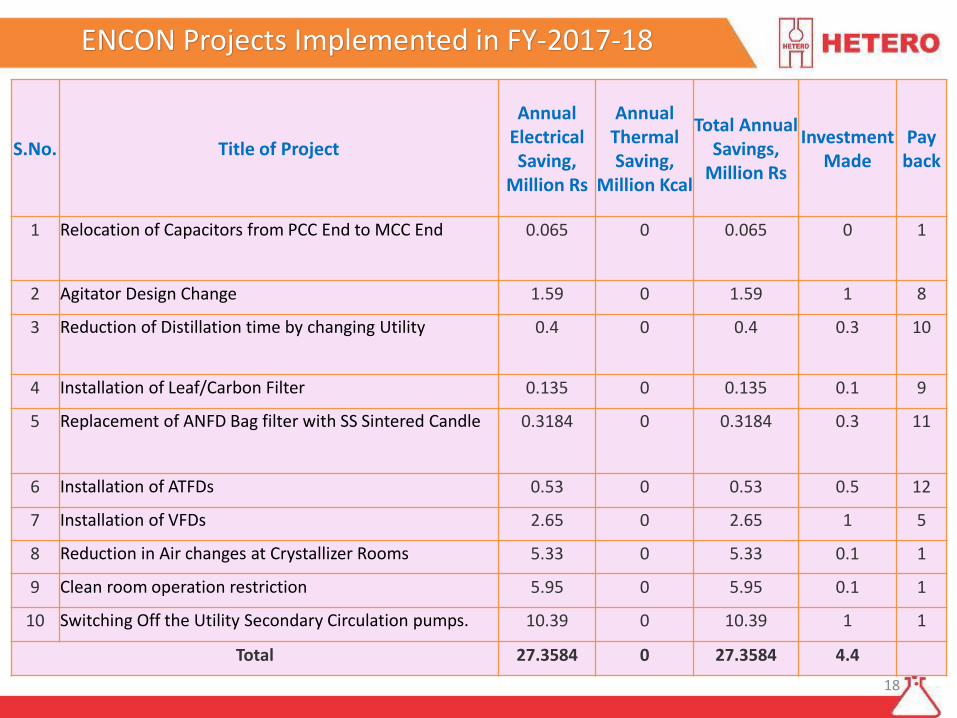
ENCON Projects Implemented in FY-2017-18
S.No. Title of Project
Annual Electrical Saving,
Million Rs
Annual Thermal Saving,
Million Kcal
Total Annual Savings,
Million Rs
Investment Made
Pay back
1 Relocation of Capacitors from PCC End to MCC End 0.065 0 0.065 0 1
2 Agitator Design Change 1.59 0 1.59 1 8
3 Reduction of Distillation time by changing Utility 0.4 0 0.4 0.3 10
4 Installation of Leaf/Carbon Filter 0.135 0 0.135 0.1 9
5 Replacement of ANFD Bag filter with SS Sintered Candle 0.3184 0 0.3184 0.3 11
6 Installation of ATFDs 0.53 0 0.53 0.5 12
7 Installation of VFDs 2.65 0 2.65 1 5
8 Reduction in Air changes at Crystallizer Rooms 5.33 0 5.33 0.1 1
9 Clean room operation restriction 5.95 0 5.95 0.1 1
10 Switching Off the Utility Secondary Circulation pumps. 10.39 0 10.39 1 1
Total 27.3584 0 27.3584 4.4

19
Present time cycle13Hrs (35°c U/V)
1.Earlier Reactor Agitator is not removing the Solvent traces from wet material2.Anchor Agitator modified by arranging Bullets.3.Distillation Time cycle is reduced from 19Hrs to 13Hrs
Monetary Saving/annum :10.60 LakhsInvestment : 0.8 Lakhs
Annual Energy Saving:1.51Lakh KWh Pay back period: 0.3 Month
Previous time cycle19Hrs(35°c U/V)
Innovative 1. Modification of Reactor Agitator
Bullets

20
RTD
chilled inlet RTD
chilled outlet
6"
34m2
RTD
e) RTD - Chilled Brine
f) RTD - Chilled water
RTD
b) On-off vavle - 15 NB-N2
c) On-off vavle - 15 NB-N2 break I/L
d) APT-Vac. & Pres.
e) RTD - Steam vapor O/L
f) RTD - ATFD vapor
Rota meter g) RTD - Rotor cooling
h) Rotary Air Lock valve - 10" & 8"
XV (15NB)
TT
O/L
APT I/L
VFD
½"
PT Powder Receiver
1½"
N2
CV(50NB)
APT
a) On-off vavle - 50 NB-Vac.
b) Control vavle - 25 NB-Vac. Control
Steam PRV
CV(80NB)
ATFD PROCESS DIAGRAM
ATFD
a) On-off vavle - 80 NB-Vac.
Feed Tank
ROTARY VALVE
Vacuum pump
SUV
c) Level Transmeter
a) Level Transmeter
b) Mass flow meter
c) Control Valve
d) VFD for Pump
Condensers
a) PT - Chilled Brine.
b) PT - Chilled water.
c) PT - Nitrogen
d) PT - Inst. Air
Steam control Valve
Vacuum pump
Distilled Receiver
a) Level Transmeter
Vacuum Pump
a) APT
Feedtank 10 kl
ATFD
HE2
(-15) (14.7m²)
HE1 (+5) (34m²
)
DistilledReceiver (2.0 KL)
suv
Innovative 2.Installed ATFD instead of Reators
21
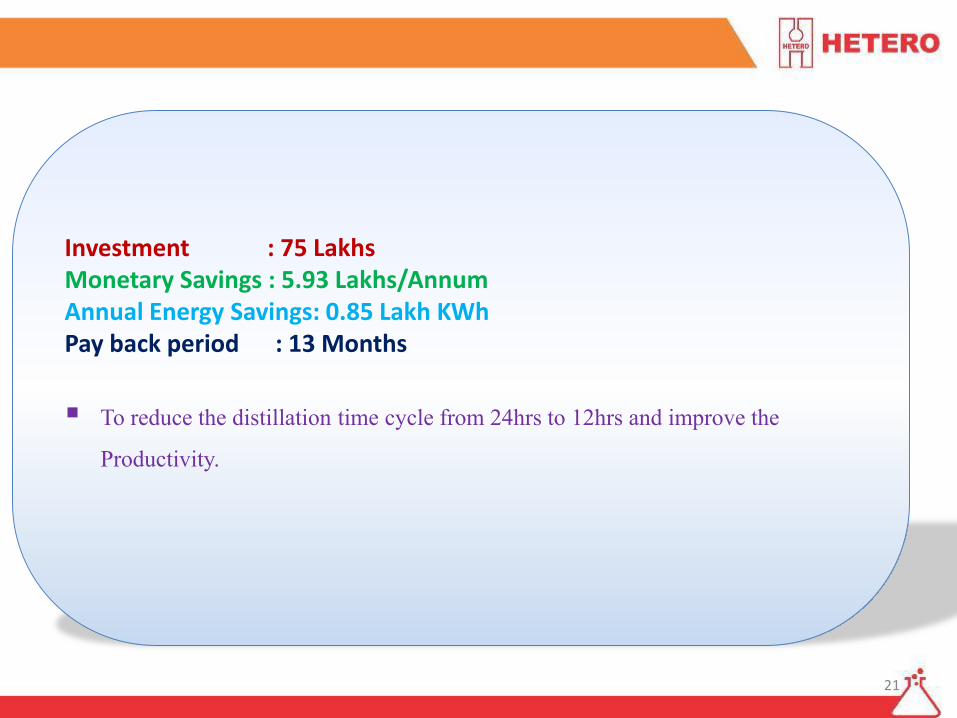
Investment : 75 LakhsMonetary Savings : 5.93 Lakhs/AnnumAnnual Energy Savings: 0.85 Lakh KWhPay back period : 13 Months
▪ To reduce the distillation time cycle from 24hrs to 12hrs and improve the Productivity.

22
Innovative3.Replaced ANFD Bag filter with SS Sintered Filter
Investment : 5 LakhsMonetary Savings : 33.55 Lakhs/AnnumAnnual Energy Savings: 4.80 Lakh KWhPay back period: 0. 2 Months
▪ SS Sintered Filter Provided in place of Bag filter in ANFD for better Drying▪ Nitrogen purging is given at regular intervals to dechoke the Sintered candles to
get efficient vacuum throughout the Drying process.▪ Reduced Drying time from 48hrs to 30hrs

Project Details :
▪ Avoided shutdown and manual cleaning of condenser
▪ Avoided Scale Formation & Depositions in Condenser tubes
▪ Noted Low Compressor Discharge Temperatures and low energy consumption
▪ Achieved high Cooling Tower Approach
Using Parking Sheds &
▪ Savings = Rs. 14 Lakhs▪ Investment = Rs. 11.5 Lakhs▪ Payback = 10 Months
Note: Savings related to Water Quality
Automatic Tube Cleaning System for Condensers

24
Sr.No. YearOrganic Residues
In TonsSpent Carbon
1 FY' 15-16 1823.92 473
2 FY' 16-17 10938 1892
3 FY' 17-18 10074 2088
Utilization of Waste as fuel
1823.92
1093810074
473
1892 2088
0
2000
4000
6000
8000
10000
12000
FY' 15-16 FY' 16-17 FY' 17-18Organic Residues Spent Carbon

2,9
0,7
40
3,1
5,0
13
3,0
6,2
95
3,2
7,7
10
24
,36
,74
0
23
,80
,69
5
25
,38
,92
4
35
,99
,63
9
0
5,00,000
10,00,000
15,00,000
20,00,000
25,00,000
30,00,000
35,00,000
40,00,000
2014-15 2015-16 2016-17 2017-18
IN M
T
Carbon Emission Level & Production
CO2 Emission
Production
Carbon Foot Prints
26
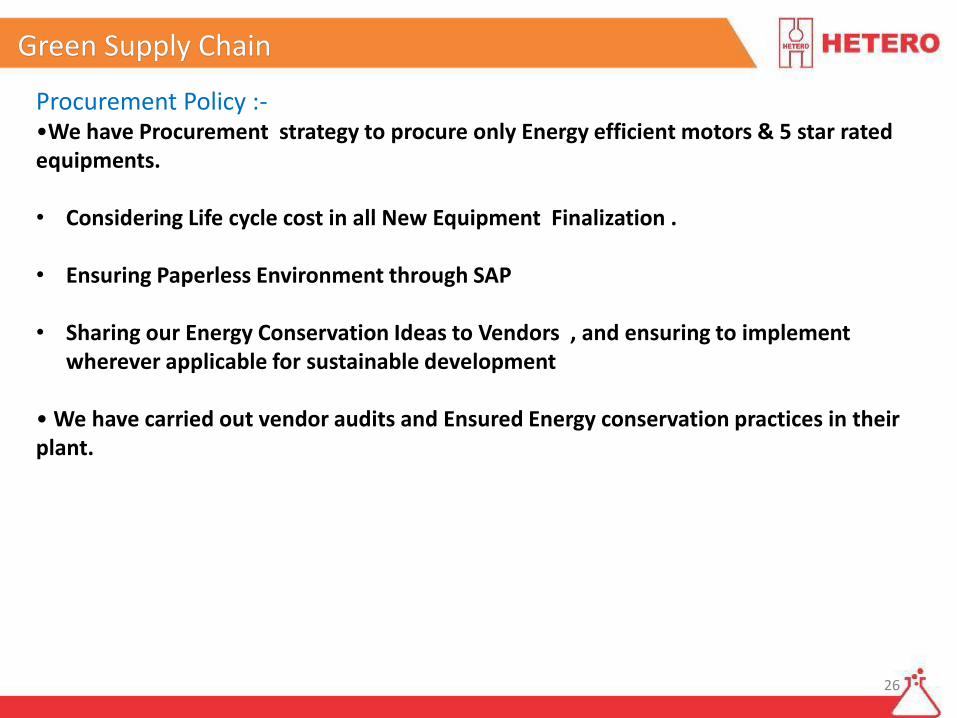
Procurement Policy :-•We have Procurement strategy to procure only Energy efficient motors & 5 star rated equipments.
• Considering Life cycle cost in all New Equipment Finalization .
• Ensuring Paperless Environment through SAP
• Sharing our Energy Conservation Ideas to Vendors , and ensuring to implement wherever applicable for sustainable development
• We have carried out vendor audits and Ensured Energy conservation practices in their plant.
Green Supply Chain

27
Bottom Up Approach
EnMS Core Team
TopManagement
Support
Steering Committee
Director(Operations)
V P(Operations)
AVP(Engg & Proj)
Sr. V P(TSD)
MR-EnMS
HOD-Utilities HOD-Power plantHOD-Electrical HOD-Corp Engg HOD-Purchase
ManagerUtilities
ManagerPower Plant
ManagerInstrumentation
Executive Mechanical
Executive Power Plant
Executive Instrumentation
ManagerElectrical
ManagerProjects & Engg
Executive Utilities
ExecutiveProjects & Engg
Level of Co-ordination & Implementation
Energy Performance of the Plant is reviewed by Top Management on the Monthly basis.Ideas generation through : Suggestion Scheme, Plant Visits, Technology Scanning, Seminars, Technical Journals, Knowledge Management, Brainstorming Sessions, etc.,Encouragement and recognitions : Cash awards, Part of Appraisals, etc.,
Energy Management Team - Employee Involvement

28
✓ Implementation of ISO 50001 Energy Management systems.
✓ Energy Management Structure.
✓ Employees involvement at all levels
✓ Daily Energy Report
✓ Energy Critical Parameters Operating Limits
✓ Tool Box – Energy Talks
✓ Regular Energy Awareness Training
✓ Modifications are routed through Change Management Committee
✓ Built in controls to prevent negative impact on energy conservation.
✓ Pre-Design Check Lists special emphasis on energy conservation.
✓ Ensuring procurement of Energy Efficient Products & Services
✓ Motor Procurement – only high efficiency (IE3 Class)
✓ Procurement policy of Star Rated Electrical Appliances
Operational
Control
Design
Procurement
Energy
Conscious
Culture
Energy Management System

Highest Installation of ANFD’s (300 Nos)
Renewable Energy – Wind Power Generation
High Efficient Agitator in Process Vessels
Highest Population of Dry screw Vacuum Pumps
Invertor type and Five Star Rated Air Conditioners
Advanced Process & Laboratory Equipment
World Class Screw or Centrifugal Chillers with Evaporative Condensers
Sea Water Desalination Plant with Turbo/ERI/I Save
Most Energy Efficient Lighting System – LED’s
The Best Energy Efficient Equipment in Hetero Group

30
Gap Analysis for Process equipment
S.NoDescription of area/Equipment
Reason for failure Remedy Action plan Savings
01-15 Deg C 450TR, 400kw motor DE bearing
Structure supports
Strengthened the structure
Rs. 6 Lakhs /Annum
Failure Vibration Vibration analysis
02Failure of secondary condenser partition plate
due to Ageing & Erosion
Replaced all condensers with SS plate 60KWh/ day
03Failure of Mechanical seals in process pumps
Dry run, lack of compatibility
1. Electrical interlock to avoid dry run
Rs. 8Lakhs /Annum
2. Compatibility of "O" rings

31
2015
20172016
20182019
2020
20132014
Sustainability
1.Installation
of Energy
Efficient
Desalination
Plant(2MLD)
2.Energy
Audit
Conducted by
NPC
3.Installation
of Energy
Savers, EE
Motors,EE
Transformers,
LEDs.
4.Implementat
ion of ISO
50001:2011
Energy
management
System.
1.Installation
of Energy
Efficient
Evaporative
condensers.
2. Commissio
-ning
of 6.1MW
Co-
Generation
plant
3.Installation
of Energy
efficient
chilling
plants
1.Steam
Distribution
System
TEAP Audit
by
Uniklinger
India.
2.Pumping
Study by
Grundfos.
3.Solar
Power plant
5.0MW
installed.
4.Installation
of VAMs to
increase
Power
Generation
1.Global
Sustainabilit
y Leadership
Award for
Sustainable
Resource
impact.
2. Steam
distribution
system
Thermograp
hy conducted
and Desuper
heater
installed.
3.Installation
of Pan
dryers
1.Energy
Audit
conducted
by TERI
on 45TPH
AFBC Boiler
2.Installatio
n of High
Efficiency
Distillation
Columns.
3.Dedicated
Energy
Team is
formed.
4..Installatio
n of
pressure
powered
pump units
1.Energy
Audit
2.Zero
Investment
Projects.
3.Wind
power
plant
54MW
installed.
4. 6.1MW
Power
Plant
Budget
Approval
1.Installati
on of
132KV
switch yard
I n place of
3x33KV
and
2x11KV
switch
yards.
2.Installati
on of Solar
Power
Plant at site
1.Replaceme
nt of Utility
pumps with
EE pumps
2.Installation
of
Desuperheate
r in ETP
3.Condensate
& flash steam
recovery.
4.Installation
of PPPU
pumps for
condensate
recovery

32
Energy policy
Energy planning
Implementation & operation
Checking
Monitoring measurement and
analysis
Management Review
Internal audit of the EnMS
Nonconfirmativecorrection, corrective and preventive action
EnMS Implementation Methodology

❑ Energy Audit was Conducted by M/s Zenith Energy Servicesand M/s Armstrong International
❑ Boiler performance, steam distribution, trap survey and condensate recovery audit was conducted by M/s Uni klinger Ltd.
❑ Involving and motivating all level of employees by Spot Recognition Award Schemes for effective implementation of energy conservation initiatives.
❑ Nominating all level of employees to various training programs on Energysaving. CII, COPES, Suppliers Locations both in India and Foreign Countries
❑ Installed online Power Energy Monitoring system (EMS) to monitor all areas ofPower consumption round the clock
❑ Installation of i-save desalination plant.
Efforts to Improve Energy Saving

To recognize efforts of our employee and their family members in energy conservation initiatives
Implement innovative Ideas, Modifications, Improvements and up gradation of the equipment
Benchmarking all products/services for energy consumption by comparison at regional as well as national level
Periodic energy Audit, continuous monitoring, review of targets & benchmarks for energy
Identifying potential areas and equipment for energy conservation
To replace old energy inefficient technology/equipment with the latest energy efficient technology / equipment continually
Make energy conservation a mass movement with the involvement of all Employees
Energy conservation awareness and training to all employees.
Methodology for Project Implementation
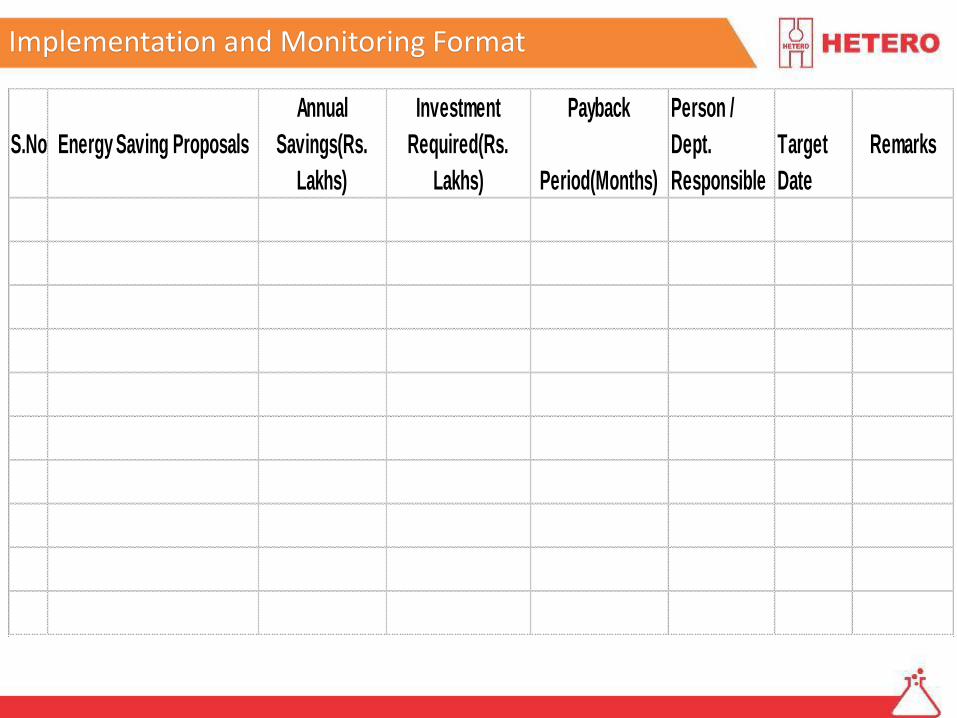
S.No Energy Saving Proposals
Annual
Savings(Rs.
Lakhs)
Investment
Required(Rs.
Lakhs)
Payback
Period(Months)
Person /
Dept.
Responsible
Target
Date
Remarks
Implementation and Monitoring Format
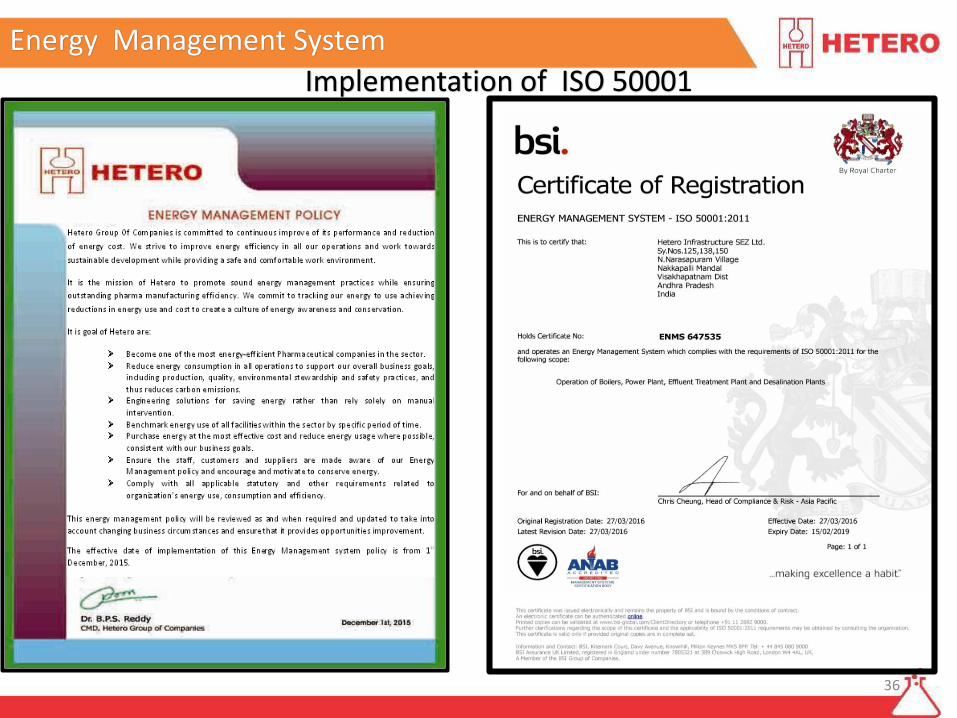
36
Energy Management System
Implementation of ISO 50001

❖ Vent condensers in series to Reactors, Distillation columns, Driers, centrifuge etc
❖ Vents of process Equipment's are connected to common headers and Scrubbers
❖ All the operations filtration, centrifugation, drying are conducted in closed
conditions
❖ Agitated Neustche filter and drier (ANFD) in place of conventional centrifuges.
❖ Closed Transfer of raw materials/solvents
❖ Mechanical seals to transfer pumps
❖ Material transfer from drums using air operated diaphragm pumps in closed hoods.
❖ Nitrogen Blanketing, Breather valves and reflux condensers to storage tanks.
❖ Low boiling solvents tanks, insulated and connected with reflux condensers with
chilled water supply to minimise the loss.
❖ All Effluent collection tanks are covered with FRP hoods with Scrubbers
Engineering Controls to Mitigate Diffused/Fugitive Emissions
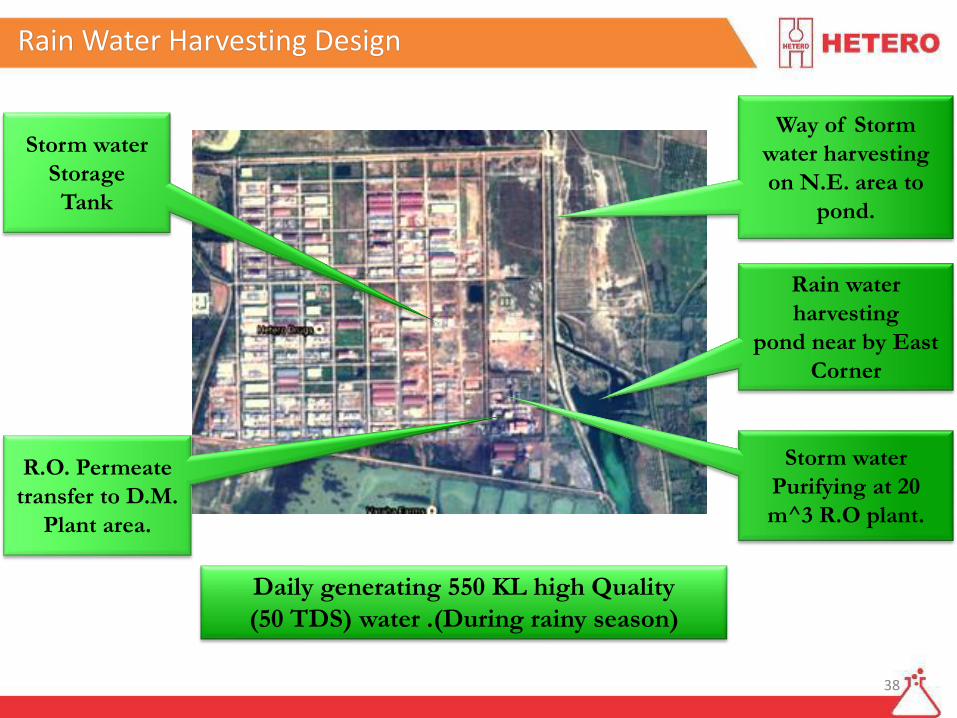
38
Way of Storm
water harvesting
on N.E. area to
pond.
Rain water
harvesting
pond near by East
Corner
Storm water
Purifying at 20
m^3 R.O plant.
Storm water
Storage
Tank
R.O. Permeate
transfer to D.M.
Plant area.
Daily generating 550 KL high Quality
(50 TDS) water .(During rainy season)
Rain Water Harvesting Design

39
Corporate Social Responsibility Initiatives in 9areas

40
Awards & Certifications
Selected asEnergy Efficient Unit in
CII National Award for Excellence in Energy Management–2015,2016& 2017
Secured ‘3 Star Rating’ in the CII Southern region Environment Health & Safety Award.
Certifications from
M/s BSI
ISO9001:2015, ISO14001:2015,
OHSAS18001:2007 & ISO50001:2011

41
ENMS-50001:2011 EMS-14001:2015 OHSAS-18001:2007 QMS-9001:2015
Certifications

4295
Our Energy Excellence Journey Continues
HETERO Energy Mgmt. Planning
Energy Mgmt.
Methodology
Energy Mgmt.
Initiatives
Journey
Excellence is not a destination , It’s a Continuous journey that never ends …