Asian Paints Limited - images.moneycontrol.com
26
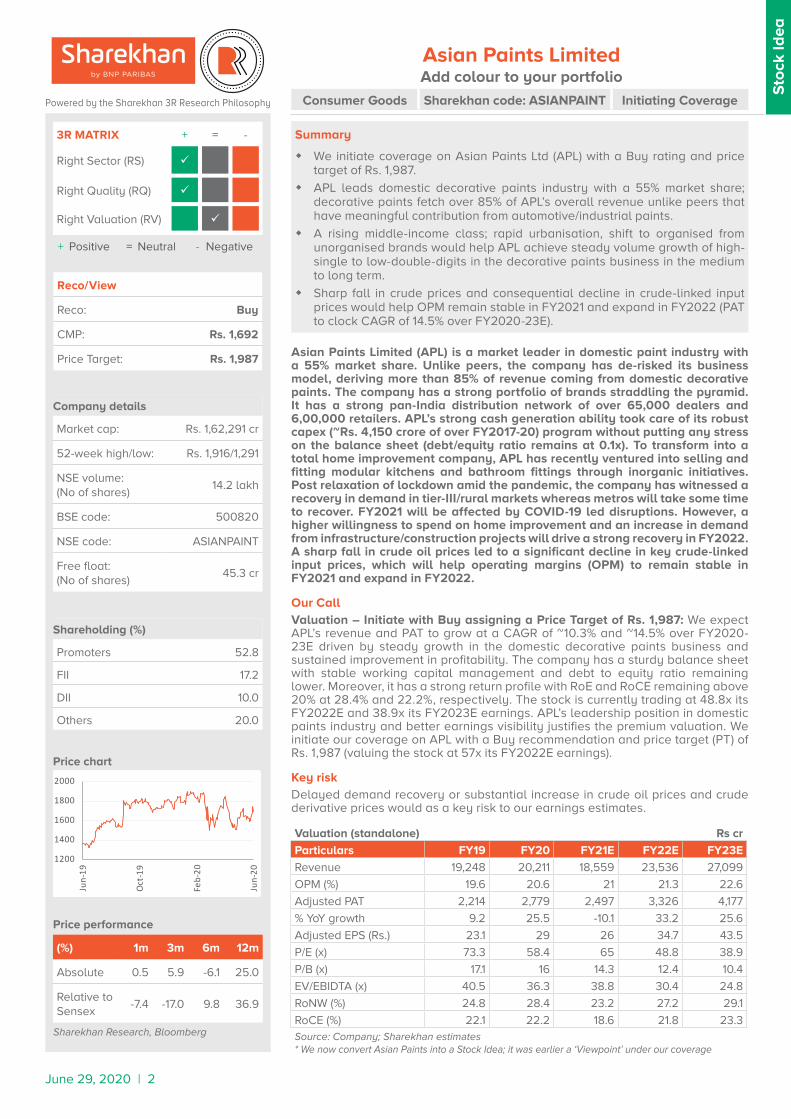
June 29, 2020 | 2 Company details Market cap: Rs. 1,62,291 cr 52-week high/low: Rs. 1,916/1,291 NSE volume: (No of shares) 14.2 lakh BSE code: 500820 NSE code: ASIANPAINT Free float: (No of shares) 45.3 cr Shareholding (%) Promoters 52.8 FII 17.2 DII 10.0 Others 20.0 Stock Idea Price performance (%) 1m 3m 6m 12m Absolute 0.5 5.9 -6.1 25.0 Relative to Sensex -7.4 -17.0 9.8 36.9 Sharekhan Research, Bloomberg Reco/View Reco: Buy CMP: Rs. 1,692 Price Target: Rs. 1,987 Valuation (standalone) Rs cr Particulars FY19 FY20 FY21E FY22E FY23E Revenue 19,248 20,211 18,559 23,536 27,099 OPM (%) 19.6 20.6 21 21.3 22.6 Adjusted PAT 2,214 2,779 2,497 3,326 4,177 % YoY growth 9.2 25.5 -10.1 33.2 25.6 Adjusted EPS (Rs.) 23.1 29 26 34.7 43.5 P/E (x) 73.3 58.4 65 48.8 38.9 P/B (x) 17.1 16 14.3 12.4 10.4 EV/EBIDTA (x) 40.5 36.3 38.8 30.4 24.8 RoNW (%) 24.8 28.4 23.2 27.2 29.1 RoCE (%) 22.1 22.2 18.6 21.8 23.3 Source: Company; Sharekhan estimates * We now convert Asian Paints into a Stock Idea; it was earlier a ‘Viewpoint’ under our coverage Price chart Consumer Goods Sharekhan code: ASIANPAINT Initiating Coverage + Positive = Neutral - Negative Asian Paints Limited (APL) is a market leader in domestic paint industry with a 55% market share. Unlike peers, the company has de-risked its business model, deriving more than 85% of revenue coming from domestic decorative paints. The company has a strong portfolio of brands straddling the pyramid. It has a strong pan-India distribution network of over 65,000 dealers and 6,00,000 retailers. APL’s strong cash generation ability took care of its robust capex (~Rs. 4,150 crore of over FY2017-20) program without putting any stress on the balance sheet (debt/equity ratio remains at 0.1x). To transform into a total home improvement company, APL has recently ventured into selling and fitting modular kitchens and bathroom fittings through inorganic initiatives. Post relaxation of lockdown amid the pandemic, the company has witnessed a recovery in demand in tier-III/rural markets whereas metros will take some time to recover. FY2021 will be affected by COVID-19 led disruptions. However, a higher willingness to spend on home improvement and an increase in demand from infrastructure/construction projects will drive a strong recovery in FY2022. A sharp fall in crude oil prices led to a significant decline in key crude-linked input prices, which will help operating margins (OPM) to remain stable in FY2021 and expand in FY2022. Our Call Valuation – Initiate with Buy assigning a Price Target of Rs. 1,987: We expect APL’s revenue and PAT to grow at a CAGR of ~10.3% and ~14.5% over FY2020- 23E driven by steady growth in the domestic decorative paints business and sustained improvement in profitability. The company has a sturdy balance sheet with stable working capital management and debt to equity ratio remaining lower. Moreover, it has a strong return profile with RoE and RoCE remaining above 20% at 28.4% and 22.2%, respectively. The stock is currently trading at 48.8x its FY2022E and 38.9x its FY2023E earnings. APL’s leadership position in domestic paints industry and better earnings visibility justifies the premium valuation. We initiate our coverage on APL with a Buy recommendation and price target (PT) of Rs. 1,987 (valuing the stock at 57x its FY2022E earnings). Key risk Delayed demand recovery or substantial increase in crude oil prices and crude derivative prices would as a key risk to our earnings estimates. 3R MATRIX + = - Right Sector (RS) ü Right Quality (RQ) ü Right Valuation (RV) ü Summary We initiate coverage on Asian Paints Ltd (APL) with a Buy rating and price target of Rs. 1,987. APL leads domestic decorative paints industry with a 55% market share; decorative paints fetch over 85% of APL’s overall revenue unlike peers that have meaningful contribution from automotive/industrial paints. A rising middle-income class; rapid urbanisation, shift to organised from unorganised brands would help APL achieve steady volume growth of high- single to low-double-digits in the decorative paints business in the medium to long term. Sharp fall in crude prices and consequential decline in crude-linked input prices would help OPM remain stable in FY2021 and expand in FY2022 (PAT to clock CAGR of 14.5% over FY2020-23E). Powered by the Sharekhan 3R Research Philosophy Asian Paints Limited Add colour to your portfolio 1200 1400 1600 1800 2000 Jun-19 Oct-19 Feb-20 Jun-20
Transcript of Asian Paints Limited - images.moneycontrol.com
June 29, 2020 | 2
Company details
Market cap: Rs. 1,62,291 cr
52-week high/low: Rs. 1,916/1,291
NSE volume: (No of shares)
14.2 lakh
BSE code: 500820
NSE code: ASIANPAINT
Free float: (No of shares)
45.3 cr
Shareholding (%)
Promoters 52.8
FII 17.2
DII 10.0
Others 20.0
Sto
ck Id
ea
Price performance
(%) 1m 3m 6m 12m
Absolute 0.5 5.9 -6.1 25.0
Relative to Sensex
-7.4 -17.0 9.8 36.9
Sharekhan Research, Bloomberg
Reco/View
Reco: Buy
CMP: Rs. 1,692
Price Target: Rs. 1,987
Valuation (standalone) Rs cr
Particulars FY19 FY20 FY21E FY22E FY23E
Revenue 19,248 20,211 18,559 23,536 27,099
OPM (%) 19.6 20.6 21 21.3 22.6
Adjusted PAT 2,214 2,779 2,497 3,326 4,177
% YoY growth 9.2 25.5 -10.1 33.2 25.6
Adjusted EPS (Rs.) 23.1 29 26 34.7 43.5
P/E (x) 73.3 58.4 65 48.8 38.9
P/B (x) 17.1 16 14.3 12.4 10.4
EV/EBIDTA (x) 40.5 36.3 38.8 30.4 24.8
RoNW (%) 24.8 28.4 23.2 27.2 29.1
RoCE (%) 22.1 22.2 18.6 21.8 23.3Source: Company; Sharekhan estimates* We now convert Asian Paints into a Stock Idea; it was earlier a ‘Viewpoint’ under our coverage
Price chart
Consumer Goods Sharekhan code: ASIANPAINT Initiating Coverage
+ Positive = Neutral - Negative
Asian Paints Limited (APL) is a market leader in domestic paint industry with a 55% market share. Unlike peers, the company has de-risked its business model, deriving more than 85% of revenue coming from domestic decorative paints. The company has a strong portfolio of brands straddling the pyramid. It has a strong pan-India distribution network of over 65,000 dealers and 6,00,000 retailers. APL’s strong cash generation ability took care of its robust capex (~Rs. 4,150 crore of over FY2017-20) program without putting any stress on the balance sheet (debt/equity ratio remains at 0.1x). To transform into a total home improvement company, APL has recently ventured into selling and fitting modular kitchens and bathroom fittings through inorganic initiatives. Post relaxation of lockdown amid the pandemic, the company has witnessed a recovery in demand in tier-III/rural markets whereas metros will take some time to recover. FY2021 will be affected by COVID-19 led disruptions. However, a higher willingness to spend on home improvement and an increase in demand from infrastructure/construction projects will drive a strong recovery in FY2022. A sharp fall in crude oil prices led to a significant decline in key crude-linked input prices, which will help operating margins (OPM) to remain stable in FY2021 and expand in FY2022.
Our CallValuation – Initiate with Buy assigning a Price Target of Rs. 1,987: We expect APL’s revenue and PAT to grow at a CAGR of ~10.3% and ~14.5% over FY2020-23E driven by steady growth in the domestic decorative paints business and sustained improvement in profitability. The company has a sturdy balance sheet with stable working capital management and debt to equity ratio remaining lower. Moreover, it has a strong return profile with RoE and RoCE remaining above 20% at 28.4% and 22.2%, respectively. The stock is currently trading at 48.8x its FY2022E and 38.9x its FY2023E earnings. APL’s leadership position in domestic paints industry and better earnings visibility justifies the premium valuation. We initiate our coverage on APL with a Buy recommendation and price target (PT) of Rs. 1,987 (valuing the stock at 57x its FY2022E earnings).
Key riskDelayed demand recovery or substantial increase in crude oil prices and crude derivative prices would as a key risk to our earnings estimates.
3R MATRIX + = -
Right Sector (RS) ü
Right Quality (RQ) ü
Right Valuation (RV) ü
Summary
� We initiate coverage on Asian Paints Ltd (APL) with a Buy rating and price target of Rs. 1,987.
� APL leads domestic decorative paints industry with a 55% market share; decorative paints fetch over 85% of APL’s overall revenue unlike peers that have meaningful contribution from automotive/industrial paints.
� A rising middle-income class; rapid urbanisation, shift to organised from unorganised brands would help APL achieve steady volume growth of high-single to low-double-digits in the decorative paints business in the medium to long term.
� Sharp fall in crude prices and consequential decline in crude-linked input prices would help OPM remain stable in FY2021 and expand in FY2022 (PAT to clock CAGR of 14.5% over FY2020-23E).
Powered by the Sharekhan 3R Research Philosophy
Asian Paints LimitedAdd colour to your portfolio
1200
1400
1600
1800
2000
Jun-
19
Oct
-19
Feb-
20
Jun-
20
June 29, 2020 | 3
Sto
ck Id
ea
Powered by the Sharekhan3R Research Philosophy
Executive Summary
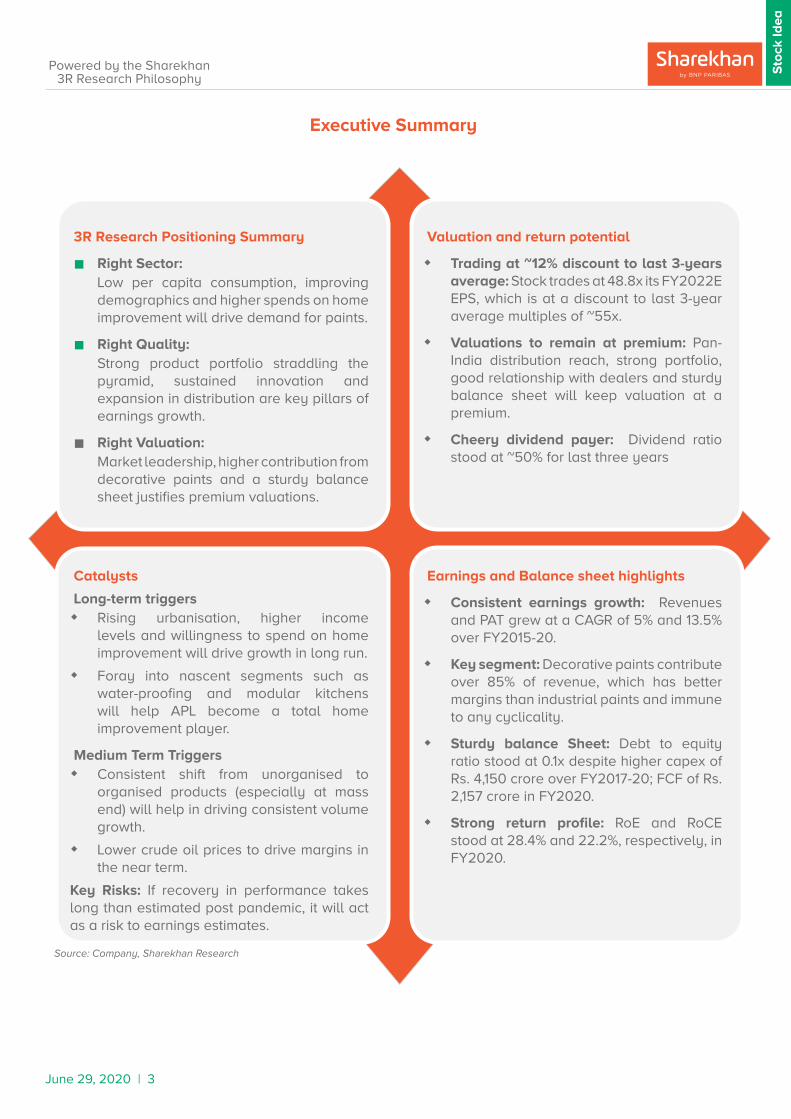
3R Research Positioning Summary
n Right Sector: Low per capita consumption, improving demographics and higher spends on home improvement will drive demand for paints.
n Right Quality: Strong product portfolio straddling the pyramid, sustained innovation and expansion in distribution are key pillars of earnings growth.
n Right Valuation: Market leadership, higher contribution from decorative paints and a sturdy balance sheet justifies premium valuations.
Valuation and return potential
� Trading at ~12% discount to last 3-years average: Stock trades at 48.8x its FY2022E EPS, which is at a discount to last 3-year average multiples of ~55x.
� Valuations to remain at premium: Pan-India distribution reach, strong portfolio, good relationship with dealers and sturdy balance sheet will keep valuation at a premium.
� Cheery dividend payer: Dividend ratio stood at ~50% for last three years
Earnings and Balance sheet highlights
� Consistent earnings growth: Revenues and PAT grew at a CAGR of 5% and 13.5% over FY2015-20.
� Key segment: Decorative paints contribute over 85% of revenue, which has better margins than industrial paints and immune to any cyclicality.
� Sturdy balance Sheet: Debt to equity ratio stood at 0.1x despite higher capex of Rs. 4,150 crore over FY2017-20; FCF of Rs. 2,157 crore in FY2020.
� Strong return profile: RoE and RoCE stood at 28.4% and 22.2%, respectively, in FY2020.
Catalysts
Long-term triggers� Rising urbanisation, higher income
levels and willingness to spend on home improvement will drive growth in long run.
� Foray into nascent segments such as water-proofing and modular kitchens will help APL become a total home improvement player.
Medium Term Triggers� Consistent shift from unorganised to
organised products (especially at mass end) will help in driving consistent volume growth.
� Lower crude oil prices to drive margins in the near term.
Key Risks: If recovery in performance takes long than estimated post pandemic, it will act as a risk to earnings estimates.
Source: Company, Sharekhan Research

June 29, 2020 | 4
Sto
ck Id
ea
Powered by the Sharekhan3R Research Philosophy
Table of Contents PagesRight Sector - why we like paint industry
� Domestic paint industry is growing at 1.5-2x GDP; likely to reach Rs. 70,000 crore by FY2023E 5
� Key growth drivers for decorative paint industry in the near term 6
Right Quality - why we like APL
� Leading player in the domestic decorative paints industry 12
� Expansion of distribution reach remains key pillar for growth 12
� Strong product portfolio - Straddling the pyramid 13
� Capacity expanded by 13Lakh KL over FY2010-19 14
� Innovation remains one of the key growth strategies 15
� Wide international presence; leadership position in most markets 17
� Home improvement business to improve with scale 17
� APL's revenue to report a 10% CAGR over FY2020-23E 18
� Lower input prices to drive margins in the near term 19
� Higher capex didn’t impact balance sheet; dividend payout remained strong 19
� Impact of COVID-19 20
Financials in charts 21
Right Valuation
� Outlook - FY2021 will be affected by COVID-19; Strong recovery likely in FY2022 22
� Valuation 22
� One-year forward P/E band 22
� One-year forward EV/EBIDTA band 23
� One-year forward P/BV band 23
� Peer comparison 23
Key financials
� P/L account 24
� Balance Sheet 24
� Cash Flow Statement 25
� Key Ratios 25
APL snapshot
� Company background 26
� Investment theme 26
� Key risks 26
� Key management personnel 26
� Top 10 shareholders 26
3R Philosophy definitions 27

June 29, 2020 | 5
Sto
ck Id
ea
Powered by the Sharekhan3R Research Philosophy
Sto
ck Id
ea
Powered by the Sharekhan3R Research Philosophy
Why we like the paints industry – Strong demand for decorative paints to be key growth lever
The Indian paints industry is correlated to GDP and is growing at 1.5-2x the GDP, led by strong demand for decorative paints. Rising income levels, rapid urbanisation, shift from unorganised to organised products (especially at bottom of pyramid) and improving penetration for decorative paints (especially in rural India) are some key growth drivers that will help the paint industry reach a size of Rs. 70,000 crore by FY2023 from Rs. 50,000 crore currently.
Domestic paints industry growing at 1.5-2x of GDP; likely to reach Rs. 70,000 crore by FY2023: India’s paints industry grew at an average of 13.8% as against average GDP growth of 7.4% over FY2013 to FY2017. Growth in FY2018 and FY2019 was affected by events such as demonetisation and implementation of GST. With a slowdown in rural consumption and automotive industry facing tough times, paints industry is expected to grow modestly in FY2020. Affected by pandemic situation, India’s GDP is expected to decline by 4-5% in FY2021. H1FY2021 will be affected by lockdown, supply disruption and non-availability of painters. However, things are gradually expected to improve in H2FY2021. Demand for industrial coatings and automotive paints is expected to return in FY2022, when industrial and auto demand cycles turn around. A substantial recovery is anticipated in FY2022 and paints industry is likely to reach Rs. 70,000 crore by FY2023. Rising incomes, rapid urbanisation and consumers upgrading to a better lifestyle and improving infrastructure are some key long-term growth drivers for the paints industry in India.
Indian paints industry growing at 1.5-2x GDP
Source: Industry
6.47.4 8.0 8.2
7.2
12.1
14.8 14.515.5
12.2
0
3
6
9
12
15
18
FY13
FY14
FY15
FY16
FY17
(%)
India GDP growth Indian Paint Industry
Indian Paint Industry
Decorative (75%) Industrials (25%)
Premium Range (High end Acrylic
Emulsions)
Medium Range (Enamel Paints)
Distemper Range (low end Paints)
Metros & large cities
Small cities
Rural areas
Automotive (about 2/3rd )
Marine paints & other OEM’s (1/3rd)
Source: Company, Sharekhan Research

June 29, 2020 | 6
Sto
ck Id
ea
Powered by the Sharekhan3R Research Philosophy
Key growth drivers for decorative paint industry
� Home repainting cycle has reduced in last decade: Repainting segment forms ~70% of the overall decorative paints industry and is among the key contributors to growth to decorative paint industry in India. Changing consumer demographics, with increased annual income, higher willingness to spend on home improvement and innovations (glossy paints, anti-bacterial paints) reduced the repainting cycle to 3-5 years from 6-8 years earlier for interior paints, while for exterior paints, it has shrunk to 7-8 years from 12-16 years. Re-painting demand is higher in the months preceding major festivals such as Ganesh Chaturthi, Durga Puja, Diwali, Pongal and Christmas in India.
Key growth drivers
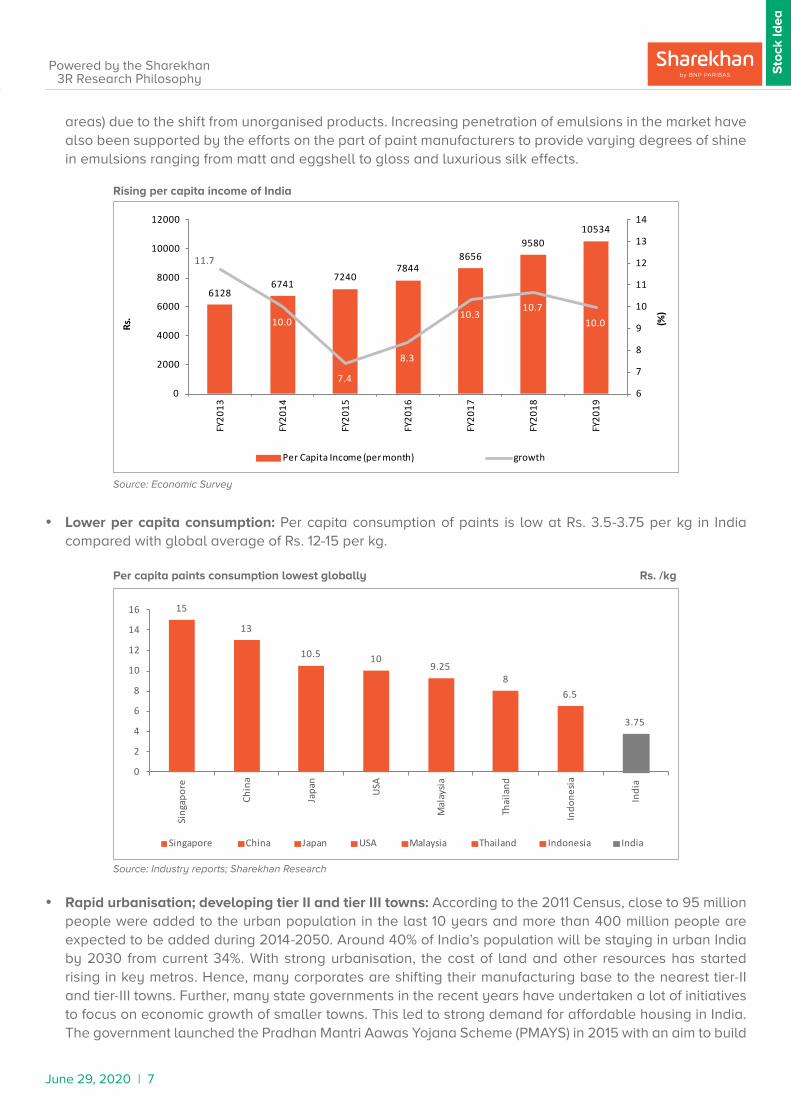
� Paint basket upgrades driven by rising incomes: India’s monthly per capita income clocked a CAGR of 9.4% over FY2013 to FY2019 to Rs. 10,534 (growth was much faster at a CAGR of 10.3% over FY2016-19). Moreover, middle-income group population has grown rapidly in the recent past. This resulted in improving consumer confidence both in domestic and rural markets in the last few years. Rising incomes led people to upgrade to higher-value products, from distempers to emulsions and regular to premium emulsions, etc. in the domestic market resulting in strong demand for decorative paints. Under decorative paints, emulsions are the fastest-growing category because of rising traction among masses (especially in rural
Repainting forms 70% of total demand Reduction in repainting cycle (Years)
Source: Company; Sharekhan Research Source: Industry reports; Sharekhan Research
Repainting, 70%
New Painting, 30%
0
1
2
3
4
5
6
7
8
Earlier (6-8 yrs) Current (3-5 yrs)
Re-painting cycle
1.5-2.0x of GDP Growth
Growth closely linked to GDP growth
Rs50,000crDomestic Industry
Global average @12-15kgs
Lower per Capita Paint Consumption
@ ~3.75kg
Shift to organised players under GST regime
70:30 Organisedsector to
Unorganised
Servicing directly by company
Paints sold through mom &
pop shops
50:50 Global Ratio75:25 Decorative
paints to Industrials
Source: Company, Sharekhan Research
June 29, 2020 | 7
Sto
ck Id
ea
Powered by the Sharekhan3R Research Philosophy
Sto
ck Id
ea
Powered by the Sharekhan3R Research Philosophy
areas) due to the shift from unorganised products. Increasing penetration of emulsions in the market have also been supported by the efforts on the part of paint manufacturers to provide varying degrees of shine in emulsions ranging from matt and eggshell to gloss and luxurious silk effects.
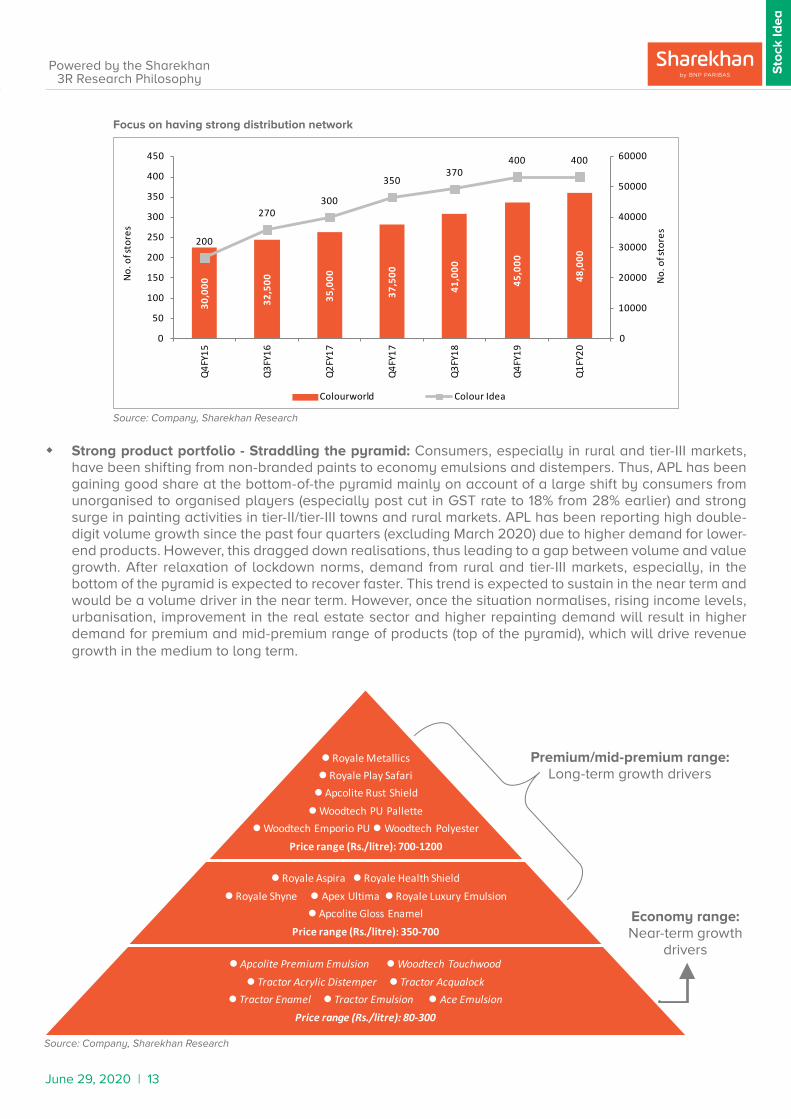
� Lower per capita consumption: Per capita consumption of paints is low at Rs. 3.5-3.75 per kg in India compared with global average of Rs. 12-15 per kg.
Rising per capita income of India
Per capita paints consumption lowest globally Rs. /kg
61286741
72407844
86569580
10534
11.7
10.0
7.4
8.3
10.310.7
10.0
6
7
8
9
10
11
12
13
14
0
2000
4000
6000
8000
10000
12000FY
2013
FY20
14
FY20
15
FY20
16
FY20
17
FY20
18
FY20
19
(%)
Rs.
Per Capita Income (per month) growth
Source: Economic Survey
Source: Industry reports; Sharekhan Research
� Rapid urbanisation; developing tier II and tier III towns: According to the 2011 Census, close to 95 million people were added to the urban population in the last 10 years and more than 400 million people are expected to be added during 2014-2050. Around 40% of India’s population will be staying in urban India by 2030 from current 34%. With strong urbanisation, the cost of land and other resources has started rising in key metros. Hence, many corporates are shifting their manufacturing base to the nearest tier-II and tier-III towns. Further, many state governments in the recent years have undertaken a lot of initiatives to focus on economic growth of smaller towns. This led to strong demand for affordable housing in India. The government launched the Pradhan Mantri Aawas Yojana Scheme (PMAYS) in 2015 with an aim to build
15
13
10.5 109.25
86.5
3.75
0
2
4
6
8
10
12
14
16
Sing
apor
e
Chin
a
Japa
n
USA
Mal
aysi
a
Thai
land
Indo
nesi
a
Indi
a
Singapore China Japan USA Malaysia Thailand Indonesia India

June 29, 2020 | 8
Sto
ck Id
ea
Powered by the Sharekhan3R Research Philosophy
houses for all by 2022. Affordable and mid-segments accounts for 62% of new launches in India. Execution in the first phase was successful and in the phase-II, the government is planning to build 1.95 crore houses for the eligible beneficiaries. The three-year target appears realistic and achievable, considering that more than 1.5 crore rural homes have been completed in the last five years. This will be one of the key revenue drivers for building material companies (including paint manufacturers). Thus, rising demand for housing and rising regulatory pressures on real estate sector (especially on small players) to provide quality construction to the consumer will drive the demand for new painting (30% of overall decorative paints industry).
� GST implementation a boon for organised players: The organised sector constitutes 70% of the total paints industry, with the balance 30% being the unorganised sector, which implies that there is potential for growth. Implementation of GST has led to a shift from unorganised to organised products, which benefitted the organised sector by creating a level-playing field across market segments. Clear beneficiaries will be large players (such as APL) that constitute close to a 55% market share in the decorative paint segment. In June 2018, the government slashed the GST rate on paints to 18% from 28%. Large companies such as APL passed on the benefits to consumers by cutting product prices by 7-8%. The price cut led to de-stocking initially in trade channels affecting the performance in H1FY2019. However, the industry returned to normalcy in H2FY2019 with strong demand for paints both in rural and urban India during the festive season.
Urbanisation rising More towns to turn into metros by 2030E
Source: Industry; Sharekhan Research Source: Industry; Sharekhan Research
Cumulative demand-supply over 2016-2020 in top 8 cities (‘000s) units
Affordable and mid-segment housing gaining steam in India (%)
Source: Industry reports; Sharekhan Research Source: Industry reports; Sharekhan Research
717
1457
1982
351
647
25
0 500 1000 1500 2000 2500
HIG
MIG
LIG
Supply Demand
61
3426
18
6246
90
51
83
29 28 29
99
49
7962
0
20
40
60
80
100
120
Bang
alor
e
Chen
nai
Del
hi N
CR
Hyd
erab
ad
Kolk
ata
Mum
bai
Pune
Indi
a
Q1CY19 Q1CY20
11
29 3034
0
5
10
15
20
25
30
35
40
CY1901 CY2001 CY2011 CY2017
(%)
Urbanisation (as per Census)
46
68
0
10
20
30
40
50
60
70
80
2011 2030E
No of metro cities

June 29, 2020 | 9
Sto
ck Id
ea
Powered by the Sharekhan3R Research Philosophy
Sto
ck Id
ea
Powered by the Sharekhan3R Research Philosophy
Industrial paints constitute 25% of overall paint industry: Industrial paints and auto coating constitute about 25% of the overall Indian paints industry. This is lesser as compared to developed economies where industrial paints constitute 50-75% of overall paint industry. Industrial paint demand is heavily dependent on auto coating/replenish segment (constitutes two-thirds of segment). Auto industry is cyclical in nature and currently reeling under pressure of slowdown and pandemic situation. On the other hand, rapid urbanisation and infrastructure development of roads, ports, refineries, etc. augured well for the industrial paint and protective coatings segment.
� Auto replenishment demand is expected to remain sluggish in the near term: India is the world’s largest two-wheeler market. Rise in middle-class income, young population and increasing exports led to a strong demand in the auto sector, which grew at an average of ~6% in volumes over FY2015-19. However, the sector is going through tough times as of now due to a slowdown in the macroeconomic environment and bleak liquidity and COVID-19 adding the wounds of theindustry. We believe FY2021 will be another bad year for automobiles sector in India after muted FY2020 (decreased by ~14% in FY2020). However, faster recovery is anticipated in FY2022 after two years of lull which will also help in recovering auto replenishment/auto coating industry. The segment contributes just 7% to overall domestic revenue (3% of consolidated revenue) of APL and hence, should not have any significant impact on revenue growth unlike its close peers.
Industrial paint segment is yet to set a grip in India
Source: Industry reports; Sharekhan Research
40
75
28 33 3548
65
60
25
72 67 6552
35
0
20
40
60
80
100
120
World India South Korea China Japan USA Britain
Decorative paints Industrial paints
Auto industry declined by ~14% in FY2020 (% growth/decline)
Source: Industry reports; Sharekhan Research
9.1
2.75.2
19.1
3.0
-14.4
-20.0
-15.0
-10.0
-5.0
0.0
5.0
10.0
15.0
20.0
25.0
FY15 FY16 FY17 FY18 FY19 FY20
Auto sector Passenget vehicle Two wheelers

June 29, 2020 | 10
Sto
ck Id
ea
Powered by the Sharekhan3R Research Philosophy
� Pick-up in investments of infrastructure projects will augur well for industrial coatings: Industrial coatings (excluding auto coatings) have a less than 10% share in India as compared to developed economies where the proportion is 25-35%. Economic growth in India will be followed by a shift in underlying demographics (increase in urbanisation levels, growing workable population and increase in the share of employed individuals in the service sector in urban areas. These transformed demographics will require the development of a host of infrastructure facilities, thus increasing the demand for increase in coverage and quality of service delivery across the entire infrastructure spectrum. This would result in development of better roads, metro railways, economic zones, industrial corridors, airports and ports. An increase in infrastructure development would lead to higher demand for protective paints segment in the India.
Trend in Infrastructure investment in India (in lakh crore) Break-up of investment of Rs. 111 lakh crore over FY2020-25
Source: Industry reports; Sharekhan Research Source: Industry reports; Sharekhan Research* Others includes Airport, ports, Digital infra, Agriculture & food proc.; Industrial Infra.
1.7 2.0 2.33.9 3.8
3.0 3.54.3
3.8 3.72.33.0
2.62.5 2.5
7.0
8.59.2
10.2 10.0
0.0
2.0
4.0
6.0
8.0
10.0
12.0
0.0
2.0
4.0
6.0
8.0
10.0
12.0
FY15 FY16 FY17 FY18E FY19E
Centre State Private Total
Energy, 24
Roads, 18
Railways, 12
Urban, 17
Irrigation, 8
Rural infra, 7
Social infra, 4
Others, 10

June 29, 2020 | 11
Sto
ck Id
ea
Powered by the Sharekhan3R Research Philosophy
Sto
ck Id
ea
Powered by the Sharekhan3R Research Philosophy
Pre-COVID 19 period January- February 2020
Decorative paints Growth was better than 9M growth
Industrial paints Auto coatings/replenish demand was muted
Dealers/Stores 100% operating
Capacity utilisation Units are operating at 100% capacity utilisation
Availability of painters Easy
Lockdown period March-April 2020
Decorative paints
March Pipeline filling didn't happen due to lockdown at fag-end of the month
April No sales; key month for painting before monsoon
Industrial paints Sales were substantially down due to shut down of manufacturing/industrial activities
Capacity utilisation No Production
Stores Non-essential category; all hardware/paint shops were closed
Availability of painters Labourers started migrating to native places due to unavailability of jobs
Unlock 1 Mid of May-June 2020
May Gradual easing of lockdown led to opening of stores; dealers started filling the inventory
June Sales recovered to 70-80% of June 2019 levels driven by recovery in demand in tier-III and rural markets
Dealers/Stores All stores (except for those in containment zones) are operational
Capacity utilisation Returned back to 75-80% levels in June for most large players
Availability of painters Less in tier-I and tier-II cities/towns due to migration of labourers
Current trends Some green shoots visible
Metros (50-55% of decorative paints)
Mumbai, Ahmedabad, Chennai and New Delhi were badly affected due to rising COVID-19 cases; Hyderabad and Bangalore getting back to normalcy.
Tier-III/rural markets (45-50% of decorative paints)
Demand is picking up as tier-III towns and rural markets are less affected by virus spread and availability of labour was better.
Supporting dealer networks Large companies are supporting dealer networks by sanitising shops/warehouses, providing insurance support to dealers and enhancing credit support to some key dealers.
Supporting the painters Providing safety kits, insurance support, educating them about the hygiene levels and giv-ing leads to re-start operations.
Consumer Psyche Reluctant to allow outsiders to enter homes due to social distancing norms.
Reviving consumer confidence Large players running safety campaigns, offering own painting services and sanitising hous-es post completion of painting activity.
Potential future trends Possibility of shift to large brands
Recovery in demand Initial trends suggest that demand for repainting will be back post monsoon season (espe-cially metros) once the scare of the virus reduces.
Shift to branded products Consumer will shift to large brands for availing paint services due to trust on safety and hygiene measures.
Innovation Demand for anti-bacterial/anti-fungal paints will increase and hence more innovations might happen in this space.
Sanitisation services Along with painting, large companies in the space might also offer sanitisation services to customers.
Availability of painters Migrant labourers are likely to return back prior to Diwali.Source: Company; Sharekhan Research
Indian Paints Industry - Past, present and potential future
Management commentaries of top paint companies (including Asian Paints, Berger Paints and Kansai Nerolac) suggest a recovery in demand (especially in tier-III cities and rural markets) post easing of lockdown norms. Metros such as Mumbai, Chennai and Delhi will take time to recover as the impact of COVID-19 is much higher than other cities. The companies are operating at 75-80% capacity utilisation in most their manufacturing units. Painters who have migrated to their home towns due to lack of jobs are expected to return prior to Diwali. A large shift is anticipated to top brands due to trust for safe and hygienic paint services. A full recovery in sales is anticipated in FY2022.

June 29, 2020 | 12
Sto
ck Id
ea
Powered by the Sharekhan3R Research Philosophy
Why we like APL – Market leader in paint industry with strong business fundamentals
APL leads the domestic paint industry with a 55% market share. Unlike other paint majors, the company has de-risked its business model, deriving more than 85% of revenue coming from domestic decorative paints. It has a strong distribution network of 65,000+ dealers and 6,00,000+ retailers across India including 48,000+ Colourworld stores and 400+ Colour Idea stores. The company has a strong cash flow generation ability, sturdy balance sheet and return ratios of over 20%.
� Leading player in domestic decorative paints industry: APL is a huge player in the domestic paint industry with a strong footing in the decorative paints business. It is commanding ~55% of the decorative paints market in India. To remain the industry leader and stay competitive in the domestic market, the company is focusing on four strategies: 1) having a strong distribution set-up; 2) occupying space in consumer minds through marketing initiatives/providing unique services; 3) having an innovative product portfolio (straddling the pyramid); and 4) sustained capacity addition with automated technologies to fulfill needs of consumers. In urban markets, the company is more focused on providing better services through sustained product innovation and providing better home décor ideas. In FY2019 the company provided over 8 lakh in-store colour consultancies (through its Colour Idea stores), painted over 40,000 homes through Paint Total, Paint Rite and Home Solution services to customers. The rural segment is not mature enough to appreciate service related offerings and therefore, the rural strategy is more product-related. APL’s Tractor brand has good traction in the rural market. APL is well-poised to take maximum advantage of the concessions given to the housing sector and of the growing disposable incomes in rural India. Thus, varied strategies for two different markets have aided APL to remain a leading player in the domestic paints industry.
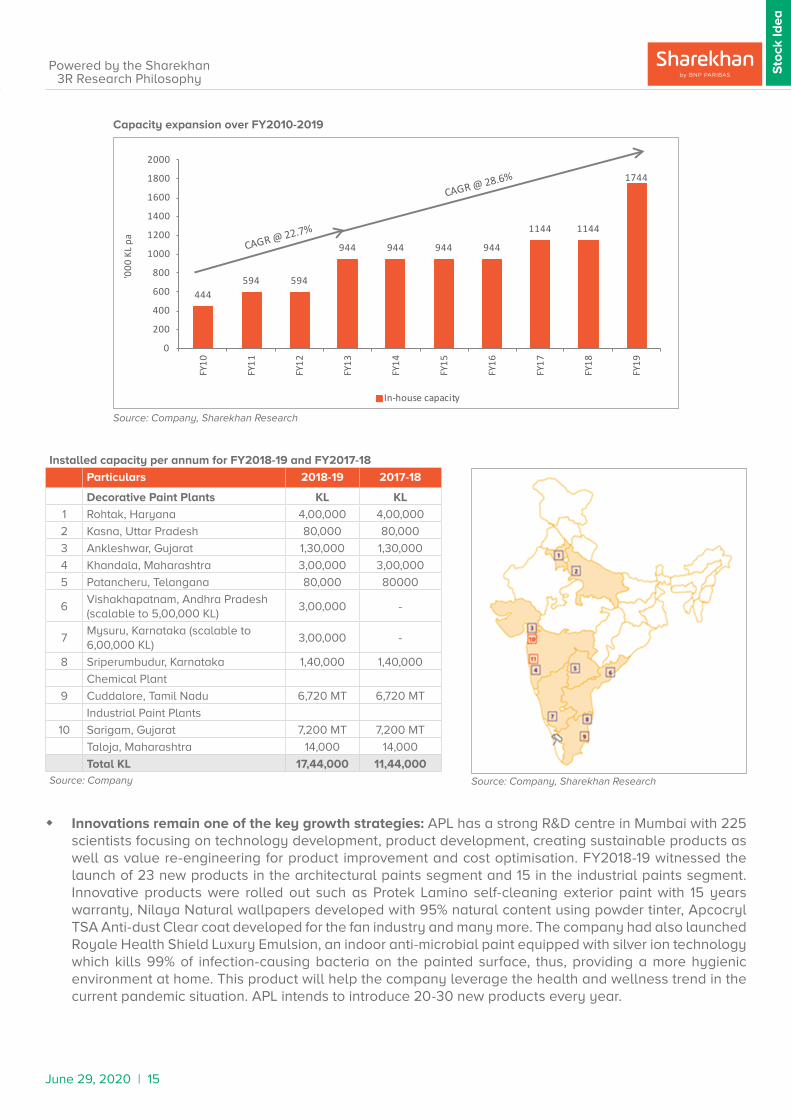
� Expansion of distribution reach remains a key pillar of growth: APL has a strong distribution network of 65,000+ dealers and 6,00,000+ retailers across the country including 48,000+ Colourworld stores and 400+ Colour Idea stores. The company has 135 depots, which service 65,000 customers (yet the inventory days are low at about 60 days; maintained for over five years). This indicates strong back-end integration with the supply team, resulting in a stable working capital cycle. The company is looking to add 3,000 dealers, 4,000 Colourworld stores and 25 Colour Idea stores per annum to expand its distribution reach in the domestic market. A strong distribution network and better relationship with the dealers will help the company to maintain steady volume growth momentum in a stable macro environment.
APL revenue growth versus GDP growth
Source: Industry, Company
5.6 6.3 7.0 7.7 8.07.0 6.6 5.8
5.0 4.5 4.73.1
7.3
16.1
10.713.7
15.7
8.7
26.4
12.218.2
9.3
2.7
-8.4
-13
-8
-3
2
7
12
17
22
27
0
5
10
15
20
25
Q1F
Y18
Q2F
Y18
Q3F
Y18
Q4F
Y18
Q1F
Y19
Q2F
Y19
Q3F
Y19
Q4F
Y19
Q1F
Y20
Q2F
Y20
Q3F
Y20
Q4F
Y20
(%)
GDP growth Asian Paints growth
Higher growth in Q3FY19 due to festive season
June 29, 2020 | 13
Sto
ck Id
ea
Powered by the Sharekhan3R Research Philosophy
Sto
ck Id
ea
Powered by the Sharekhan3R Research Philosophy
� Strong product portfolio - Straddling the pyramid: Consumers, especially in rural and tier-III markets, have been shifting from non-branded paints to economy emulsions and distempers. Thus, APL has been gaining good share at the bottom-of-the pyramid mainly on account of a large shift by consumers from unorganised to organised players (especially post cut in GST rate to 18% from 28% earlier) and strong surge in painting activities in tier-II/tier-III towns and rural markets. APL has been reporting high double-digit volume growth since the past four quarters (excluding March 2020) due to higher demand for lower-end products. However, this dragged down realisations, thus leading to a gap between volume and value growth. After relaxation of lockdown norms, demand from rural and tier-III markets, especially, in the bottom of the pyramid is expected to recover faster. This trend is expected to sustain in the near term and would be a volume driver in the near term. However, once the situation normalises, rising income levels, urbanisation, improvement in the real estate sector and higher repainting demand will result in higher demand for premium and mid-premium range of products (top of the pyramid), which will drive revenue growth in the medium to long term.
Focus on having strong distribution network
Source: Company, Sharekhan Research
Source: Company, Sharekhan Research
30,0
00
32,5
00
35,0
00
37,5
00
41,0
00
45,0
00
48,0
00
200
270300
350370
400 400
0
50
100
150
200
250
300
350
400
450
Q4F
Y15
Q3F
Y16
Q2F
Y17
Q4F
Y17
Q3F
Y18
Q4F
Y19
Q1F
Y20
0
10000
20000
30000
40000
50000
60000
No.
of s
tore
s
No.
of s
tore
s
Colourworld Colour Idea
Royale Metallics Royale Play Safari Apcolite Rust Shield Woodtech PU Pallette
Woodtech Emporio PU Woodtech PolyesterPrice range (Rs./litre): 700-1200
Royale Aspira Royale Health Shield Royale Shyne Apex Ultima Royale Luxury Emulsion
Apcolite Gloss EnamelPrice range (Rs./litre): 350-700
Apcolite Premium Emulsion Woodtech Touchwood Tractor Acrylic Distemper Tractor Acqualock
Tractor Enamel Tractor Emulsion Ace EmulsionPrice range (Rs./litre): 80-300
Premium/mid-premium range: Long-term growth drivers
Economy range: Near-term growth
drivers

June 29, 2020 | 14
Sto
ck Id
ea
Powered by the Sharekhan3R Research Philosophy
The company has launched many new products at the bottom-of-the-pyramid, which are gaining good traction. In FY2020, the company launched Tractor emulsion Sparc and Ace Sparc, which gained a good response within the economy range of products. In the past 3-4 years, the company launched products such as Tractor Uno and Tractor Aqualock - low-priced distemper brands, which will attract lower strata of consumers especially in tier-III towns and rural markets to shift from unorganised products to organised products. These brands led to a revival in domestic distemper category, which has a size of Rs. 12,000-15,000 crore in India. Another segment which APL is focusing on is putty, which is worth around Rs. 5,000-6,000 crore. The strong focus in the value and economy segment aided APL to achieve strong double-digit volume growth in FY2020 (excluding March, 2020 which was affected by COVID-19) despite muted consumer sentiments in metros and tier-I towns.
APL’s economy portfolio
Brands Rs./Litre Category
Tractor Uno 64
DistemperTractor Aqualock 82
Tractor Acrylic 86
Utsav Acrylic 90
Tractor Sparc 100
EmulsionRoyale Shyne 120
Tractor Emulsion 134
Tractor Emulsion Shyne 134Source: Company; Sharekhan Research
APL has a wide range of offerings in the premium, mid-premium as well as economy categories in the decorative segment as compared to its peers Berger Paints and Kansai Nerolac that have limited number of offerings in the decorative segment. Unlike its peers, 85% of the product portfolio of APL is in the decorative segment which will help APL gain market share post the pandemic situation.
Product portfolio of key peers
Berger Paints Kansai Nerolac
Products Category Price range (Rs./litre)
Products Category Price range (Rs./litre)
Silk Illusions Design MetallicaPremium 900-1,100
Impressions 24 Carat
Mid-premium 400-600
Imperia Water Based Luxury PU Impressions Eco Clean
Easy Clean
Mid-premium 300-700
Impressions Glitter Gold
Silk Illusions Marble Finish Italian Pigmented PU White Glossy
Silk Illusions Metallica Pearls Lustre Finish
Silk Illusions Non Metallic Excel Total
Silk Luxury Emulsion Beauty Acrylic Distemper
Economy 40-300
Silk Breathe Easy Beauty Smooth Finish
Bison Distemper
Economy 30-200
Pearls Emulsion
Bison Acrylic Emulsion ReadyMix Primer Putty
Bison Wall putty Wall Putty Acrylic
Bison Glow Acrylic Interior Emulsion Excel Alkali Prime
Bison Exterior putty Excel Rain Guard Horizontal WallsSource: Company, Sharekhan Research
� Capacity expanded by 13 lakh KL over FY2010-19: APL currently operates 27 paint manufacturing plants globally including eight decorative paint manufacturing plants across India with a total manufacturing capacity of 17.3 kilolitres (KL) p.a. The company expanded its total capacity including industrial paint plants from 9.44 lakh KL p.a. in FY2012-13 to 11.44 lakh KL p.a. in FY2016-17 and 17.44 lakh KL p.a. in FY2018-19 (6 lakh KL added in FY2018-19 itself). The Mysuru and the Vizag plants were commissioned in September 2018 and January 2019 respectively, with an initial capacity of 3 lakh KL p.a. each (Mysuru plant is scalable up to 6 lakh KL p.a. and the Vizag plant is scalable up to 5 lakh KL p.a. in a phased manner).
June 29, 2020 | 15
Sto
ck Id
ea
Powered by the Sharekhan3R Research Philosophy
Sto
ck Id
ea
Powered by the Sharekhan3R Research Philosophy
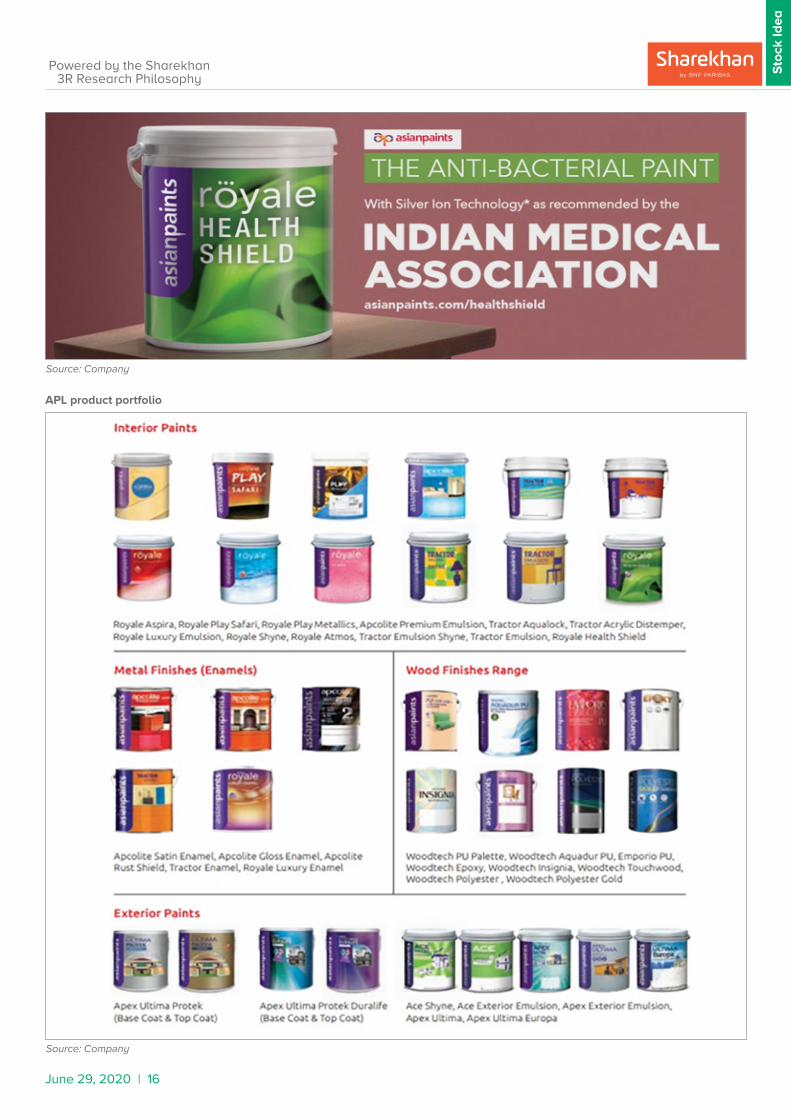
� Innovations remain one of the key growth strategies: APL has a strong R&D centre in Mumbai with 225 scientists focusing on technology development, product development, creating sustainable products as well as value re-engineering for product improvement and cost optimisation. FY2018-19 witnessed the launch of 23 new products in the architectural paints segment and 15 in the industrial paints segment. Innovative products were rolled out such as Protek Lamino self-cleaning exterior paint with 15 years warranty, Nilaya Natural wallpapers developed with 95% natural content using powder tinter, Apcocryl TSA Anti-dust Clear coat developed for the fan industry and many more. The company had also launched Royale Health Shield Luxury Emulsion, an indoor anti-microbial paint equipped with silver ion technology which kills 99% of infection-causing bacteria on the painted surface, thus, providing a more hygienic environment at home. This product will help the company leverage the health and wellness trend in the current pandemic situation. APL intends to introduce 20-30 new products every year.
Capacity expansion over FY2010-2019
Source: Company, Sharekhan Research
Source: Company, Sharekhan Research
444594 594
944 944 944 944
1144 1144
1744
0
200
400
600
800
1000
1200
1400
1600
1800
2000
FY10
FY11
FY12
FY13
FY14
FY15
FY16
FY17
FY18
FY19
'000
KL
pa
In-house capacity
Installed capacity per annum for FY2018-19 and FY2017-18
Particulars 2018-19 2017-18
Decorative Paint Plants KL KL
1 Rohtak, Haryana 4,00,000 4,00,000
2 Kasna, Uttar Pradesh 80,000 80,000
3 Ankleshwar, Gujarat 1,30,000 1,30,000
4 Khandala, Maharashtra 3,00,000 3,00,000
5 Patancheru, Telangana 80,000 80000
6Vishakhapatnam, Andhra Pradesh (scalable to 5,00,000 KL)
3,00,000 -
7Mysuru, Karnataka (scalable to 6,00,000 KL)
3,00,000 -
8 Sriperumbudur, Karnataka 1,40,000 1,40,000
Chemical Plant
9 Cuddalore, Tamil Nadu 6,720 MT 6,720 MT
Industrial Paint Plants
10 Sarigam, Gujarat 7,200 MT 7,200 MT
Taloja, Maharashtra 14,000 14,000
Total KL 17,44,000 11,44,000Source: Company
June 29, 2020 | 16
Sto
ck Id
ea
Powered by the Sharekhan3R Research Philosophy
Source: Company
Source: Company
APL product portfolio
June 29, 2020 | 17
Sto
ck Id
ea
Powered by the Sharekhan3R Research Philosophy
Sto
ck Id
ea
Powered by the Sharekhan3R Research Philosophy
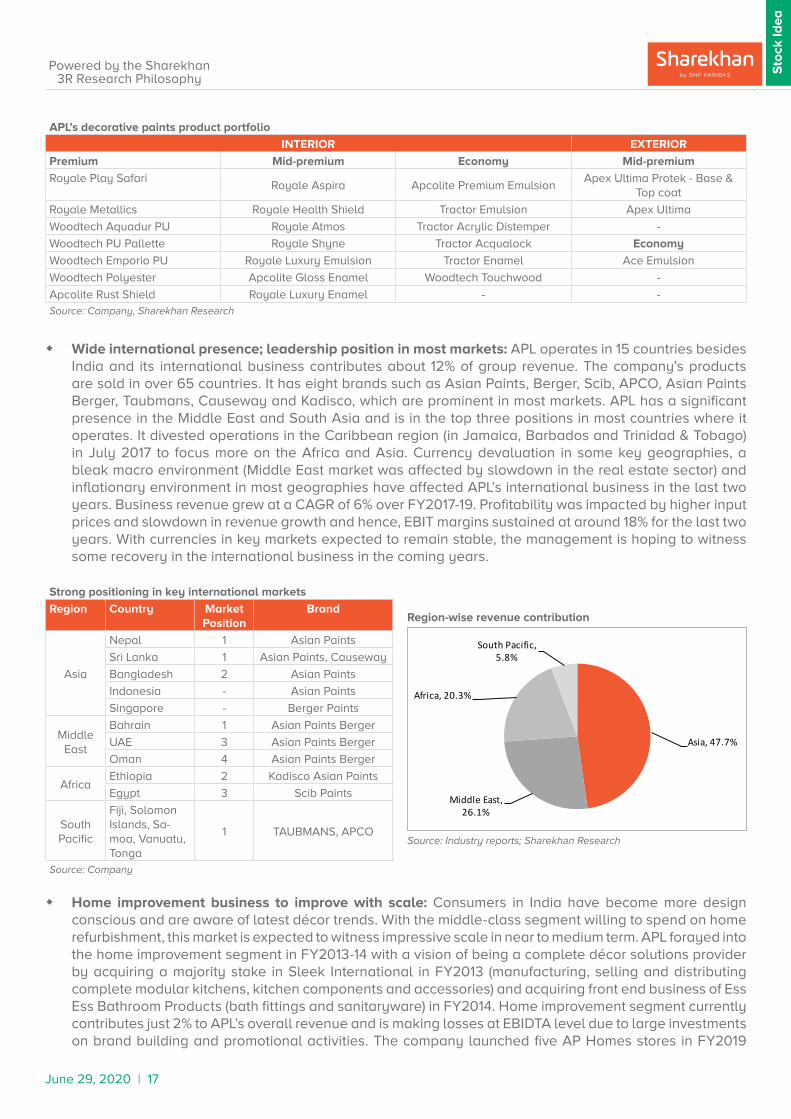
� Wide international presence; leadership position in most markets: APL operates in 15 countries besides India and its international business contributes about 12% of group revenue. The company’s products are sold in over 65 countries. It has eight brands such as Asian Paints, Berger, Scib, APCO, Asian Paints Berger, Taubmans, Causeway and Kadisco, which are prominent in most markets. APL has a significant presence in the Middle East and South Asia and is in the top three positions in most countries where it operates. It divested operations in the Caribbean region (in Jamaica, Barbados and Trinidad & Tobago) in July 2017 to focus more on the Africa and Asia. Currency devaluation in some key geographies, a bleak macro environment (Middle East market was affected by slowdown in the real estate sector) and inflationary environment in most geographies have affected APL’s international business in the last two years. Business revenue grew at a CAGR of 6% over FY2017-19. Profitability was impacted by higher input prices and slowdown in revenue growth and hence, EBIT margins sustained at around 18% for the last two years. With currencies in key markets expected to remain stable, the management is hoping to witness some recovery in the international business in the coming years.
APL’s decorative paints product portfolio
INTERIOR EXTERIOR
Premium Mid-premium Economy Mid-premium
Royale Play SafariRoyale Aspira Apcolite Premium Emulsion
Apex Ultima Protek - Base & Top coat
Royale Metallics Royale Health Shield Tractor Emulsion Apex Ultima
Woodtech Aquadur PU Royale Atmos Tractor Acrylic Distemper -
Woodtech PU Pallette Royale Shyne Tractor Acqualock Economy
Woodtech Emporio PU Royale Luxury Emulsion Tractor Enamel Ace Emulsion
Woodtech Polyester Apcolite Gloss Enamel Woodtech Touchwood -
Apcolite Rust Shield Royale Luxury Enamel - -Source: Company, Sharekhan Research
Strong positioning in key international markets
Region Country Market Position
Brand
Asia
Nepal 1 Asian Paints
Sri Lanka 1 Asian Paints, Causeway
Bangladesh 2 Asian Paints
Indonesia - Asian Paints
Singapore - Berger Paints
Middle East
Bahrain 1 Asian Paints Berger
UAE 3 Asian Paints Berger
Oman 4 Asian Paints Berger
AfricaEthiopia 2 Kadisco Asian Paints
Egypt 3 Scib Paints
South Pacific
Fiji, Solomon Islands, Sa-moa, Vanuatu, Tonga
1 TAUBMANS, APCO
Source: Company
Source: Industry reports; Sharekhan Research
Asia, 47.7%
Middle East, 26.1%
Africa, 20.3%
South Pacific, 5.8%
� Home improvement business to improve with scale: Consumers in India have become more design conscious and are aware of latest décor trends. With the middle-class segment willing to spend on home refurbishment, this market is expected to witness impressive scale in near to medium term. APL forayed into the home improvement segment in FY2013-14 with a vision of being a complete décor solutions provider by acquiring a majority stake in Sleek International in FY2013 (manufacturing, selling and distributing complete modular kitchens, kitchen components and accessories) and acquiring front end business of Ess Ess Bathroom Products (bath fittings and sanitaryware) in FY2014. Home improvement segment currently contributes just 2% to APL’s overall revenue and is making losses at EBIDTA level due to large investments on brand building and promotional activities. The company launched five AP Homes stores in FY2019
Region-wise revenue contribution

June 29, 2020 | 18
Sto
ck Id
ea
Powered by the Sharekhan3R Research Philosophy
which is a multi-category décor store, where consumer will be able to avail integrated décor consultancy across categories ranging from paints, bath fittings, kitchen, sanitary ware, wall papers, furniture, tiles, etc. under one roof. We expect the home improvement segment to maintain its strong growth momentum and an increase in scale of the business should help in improving the profitability in the coming years.
� APL to deliver 10% CAGR revenue growth over FY2020-23E: APL continued to report double-digit volume growth in its domestic decorative paints segment. Product launches, lower-end emulsion and distempers are growing much faster than premium products due to a shift happening from unorganised to organised products and putty is growing at a strong pace. The company clocked double-digit volume growth in FY2020, however, realisations declined in Q4FY2020 from 18% growth in Q1FY2020 due to change in the mix to low-priced products. This trend is likely to sustain in the near term. Moreover, automobile sales saw a considerable dip in FY2020 due to a slowdown in demand affecting APL’s industrial paint sales. Overall, APL’s consolidated revenue grew by 5% in FY2020 (with a volume growth of 11% in the domestic decorative paints business).
Performance of home improvement segment Revenue of Sleek International over FY2015-20
Source: Company, Sharekhan Research Source: Company, Sharekhan Research
254308 335
417458
-42 -39 -32 -53 -70-100
0
100
200
300
400
500
FY16 FY17 FY18 FY19 FY20
Rs. i
n cr
ore
Revenue EBIT
2
9
6
10 1011
21
10
1614
11
3
0
5
10
15
20
25
Q1F
Y18
Q2F
Y18
Q3F
Y18
Q4F
Y18
Q1F
Y19
Q2F
Y19
Q3F
Y19
Q4F
Y19
Q1F
Y20
Q2F
Y20
Q3F
Y20
Q4F
Y20
(%)
Volume Growth (%)
Trend of volume growth over the past three years
Source: Company, Sharekhan Research
Impacted due to lockdown in March amid COVID-19
The spread of COVID-19 would affect APL’s performance in FY2021 as consumers would defer their home refurbishment by 6-8 months till the time stability returns. Q1FY2021 will be affected by lockdown and non-availability of manpower for paint activities. If the situation stabilises by August-September, we should expect gradual recovery in Q3FY2021. We expect substantial improvement in sales volume by FY2022, which is likely to sustain in FY2023, driven by 1) deferment of house-refurbishment activities; 2) expected recovery in rural demand; and 3) regaining of momentum in the auto sector.
122135
158173
214238
0
50
100
150
200
250
FY15 FY16 FY17 FY18 FY19 FY20
Rs. i
n cr
ore
Revenue
June 29, 2020 | 19
Sto
ck Id
ea
Powered by the Sharekhan3R Research Philosophy
Sto
ck Id
ea
Powered by the Sharekhan3R Research Philosophy
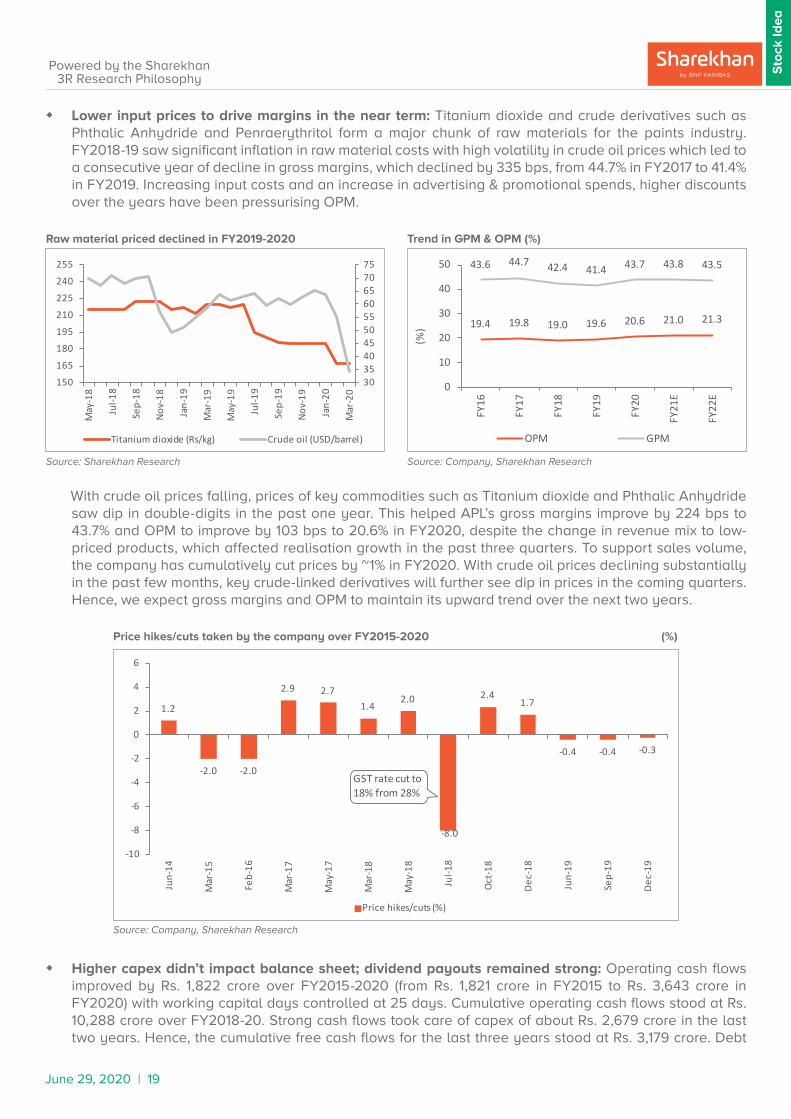
� Lower input prices to drive margins in the near term: Titanium dioxide and crude derivatives such as Phthalic Anhydride and Penraerythritol form a major chunk of raw materials for the paints industry. FY2018-19 saw significant inflation in raw material costs with high volatility in crude oil prices which led to a consecutive year of decline in gross margins, which declined by 335 bps, from 44.7% in FY2017 to 41.4% in FY2019. Increasing input costs and an increase in advertising & promotional spends, higher discounts over the years have been pressurising OPM.
Raw material priced declined in FY2019-2020 Trend in GPM & OPM (%)
Source: Sharekhan Research Source: Company, Sharekhan Research
19.4 19.8 19.0 19.6 20.6 21.0 21.3
43.6 44.7 42.4 41.4 43.7 43.8 43.5
0
10
20
30
40
50
FY16
FY17
FY18
FY19
FY20
FY21
E
FY22
E
(%)
OPM GPM
30354045505560657075
150
165
180
195
210
225
240
255
May
-18
Jul-1
8
Sep-
18
Nov
-18
Jan-
19
Mar
-19
May
-19
Jul-1
9
Sep-
19
Nov
-19
Jan-
20
Mar
-20
Titanium dioxide (Rs/kg) Crude oil (USD/barrel)
With crude oil prices falling, prices of key commodities such as Titanium dioxide and Phthalic Anhydride saw dip in double-digits in the past one year. This helped APL’s gross margins improve by 224 bps to 43.7% and OPM to improve by 103 bps to 20.6% in FY2020, despite the change in revenue mix to low-priced products, which affected realisation growth in the past three quarters. To support sales volume, the company has cumulatively cut prices by ~1% in FY2020. With crude oil prices declining substantially in the past few months, key crude-linked derivatives will further see dip in prices in the coming quarters. Hence, we expect gross margins and OPM to maintain its upward trend over the next two years.
Price hikes/cuts taken by the company over FY2015-2020 (%)
Source: Company, Sharekhan Research
1.2
-2.0 -2.0
2.9 2.71.4
2.0
-8.0
2.41.7
-0.4 -0.4 -0.3
-10
-8
-6
-4
-2
0
2
4
6
Jun-
14
Mar
-15
Feb-
16
Mar
-17
May
-17
Mar
-18
May
-18
Jul-1
8
Oct
-18
Dec
-18
Jun-
19
Sep-
19
Dec
-19
Price hikes/cuts (%)
GST rate cut to 18% from 28%
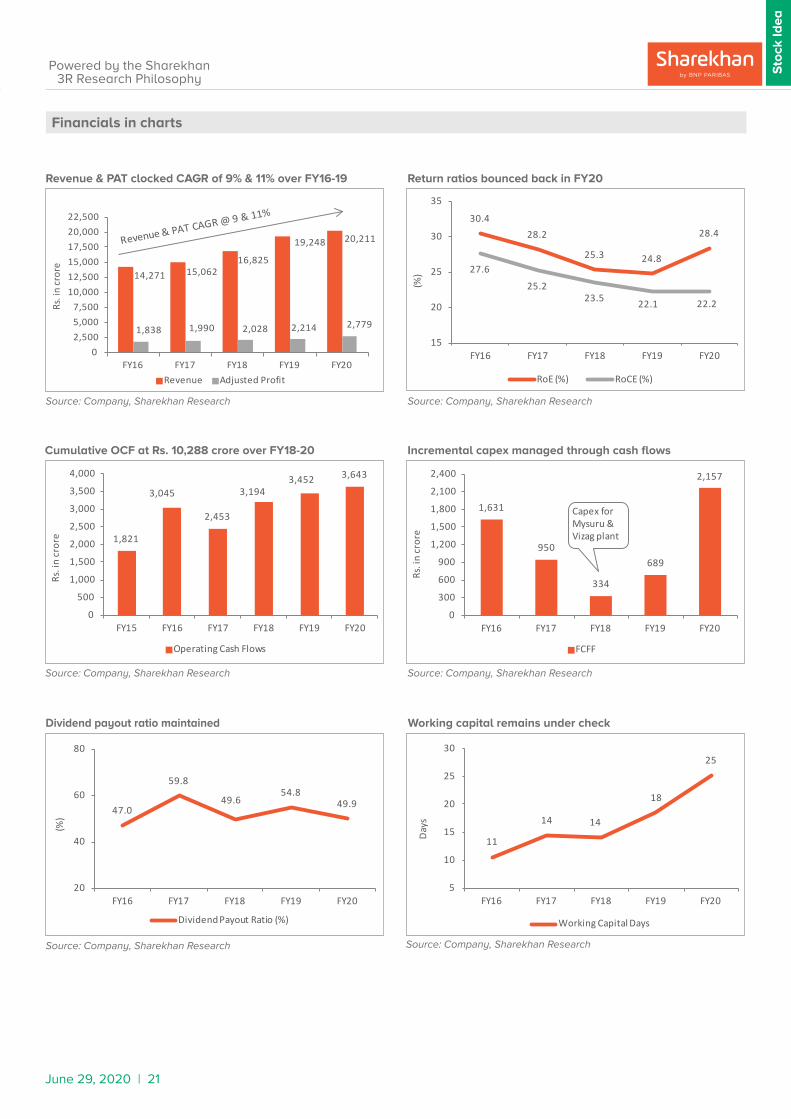
� Higher capex didn’t impact balance sheet; dividend payouts remained strong: Operating cash flows improved by Rs. 1,822 crore over FY2015-2020 (from Rs. 1,821 crore in FY2015 to Rs. 3,643 crore in FY2020) with working capital days controlled at 25 days. Cumulative operating cash flows stood at Rs. 10,288 crore over FY2018-20. Strong cash flows took care of capex of about Rs. 2,679 crore in the last two years. Hence, the cumulative free cash flows for the last three years stood at Rs. 3,179 crore. Debt

June 29, 2020 | 20
Sto
ck Id
ea
Powered by the Sharekhan3R Research Philosophy
to equity remained unchanged at 0.1x as capex was largely funded through internal accruals. Average dividend payout over FY2017-20 stood at 53.5%. Despite higher capex, the return ratios remained strong in the upwards of 20%, with RoE and RoCE standing at 28.4% and 22.2%, respectively, in FY2020.
� Domestic operations recovering gradually; demand to recover fully in FY2022: APL has re-opened all manufacturing plants across businesses (decorative and home Improvement and industrial operations) to a limited capacity or even to a full capacity in some geographies. Most markets have opened up and on an average, production is back to 60-70% of pre-COVID levels. It has also opened about 85% of its warehouses across the country to cater to some of the markets which are opening up. Demand is picking up in smaller towns and cities with some of the earlier incomplete painting jobs now showing some movement. Tier-III cities and rural markets are doing well and contribution from rural markets is expected to be higher in the near term (urban and rural contribution to be around 50:50). Recovery is slower in metros and tier-I cities and will take some time to pick up. There is a higher demand for value-for-money products as compared to premium-end products. International operations have been impacted to varying extent based on the spread of the pandemic and the restrictions on business activities placed by the respective government authorities. The company is working closely with retailers and has helped them to restart their businesses by sanitising their shops and offering medical insurance schemes for workers. The company has also started a safe painting campaign to enable customers to paint their houses even in a pandemic. Moreover, as per the need of the situation, the company has forayed into the hand/surface sanitiser category with the launch of the Viroprotek range of hand and surface sanitisers. APL is in a comfortable liquidity position to meet its near-term obligations. It has implemented stringent cost control measures across the organisation to conserve cash to address any evolving situation resulting from the pandemic.
June 29, 2020 | 21
Sto
ck Id
ea
Powered by the Sharekhan3R Research Philosophy
Sto
ck Id
ea
Powered by the Sharekhan3R Research Philosophy
Source: Company, Sharekhan Research
Cumulative OCF at Rs. 10,288 crore over FY18-20
Source: Company, Sharekhan Research
Return ratios bounced back in FY20
Incremental capex managed through cash flows
Source: Company, Sharekhan Research
Financials in charts
Revenue & PAT clocked CAGR of 9% & 11% over FY16-19
Source: Company, Sharekhan Research
Dividend payout ratio maintained
Source: Company, Sharekhan Research
Working capital remains under check
Source: Company, Sharekhan Research
14,271 15,06216,825
19,248 20,211
1,838 1,990 2,028 2,214 2,779
02,5005,0007,500
10,00012,50015,00017,50020,00022,500
FY16 FY17 FY18 FY19 FY20
Rs. i
n cr
ore
Revenue Adjusted Profit
30.428.2
25.3 24.8
28.4
27.6
25.223.5 22.1 22.2
15
20
25
30
35
FY16 FY17 FY18 FY19 FY20
(%)
RoE (%) RoCE (%)
1,821
3,045
2,453
3,1943,452 3,643
0
500
1,000
1,500
2,000
2,500
3,000
3,500
4,000
FY15 FY16 FY17 FY18 FY19 FY20
Rs. i
n cr
ore
Operating Cash Flows
1,631
950
334
689
2,157
0
300
600
900
1,200
1,500
1,800
2,100
2,400
FY16 FY17 FY18 FY19 FY20
Rs. i
n cr
ore
FCFF
Capex for Mysuru & Vizag plant
47.0
59.8
49.654.8
49.9
20
40
60
80
FY16 FY17 FY18 FY19 FY20
(%)
Dividend Payout Ratio (%)
11
14 14
18
25
5
10
15
20
25
30
FY16 FY17 FY18 FY19 FY20
Day
s
Working Capital Days
June 29, 2020 | 22
Sto
ck Id
ea
Powered by the Sharekhan3R Research Philosophy
Valuations - Leadership positioning, sturdy balance sheet and strong dividend payout justifies premium valuation
APL’s leadership position in domestic decorative paints industry, focus on becoming a leading player in the home improvement segment, sturdy balance sheet and strong dividend payout justifies its premium valuations. Sustained product launches, expansion of distribution reach and shift from unbranded to branded products will be key growth levers in the near to medium term.
Outlook
FY2021 will be affected by COVID-19; Strong recovery likely in FY2022: In FY2020, APL’s consolidated revenues grew by 5% driven by 11.2% volume growth. APL’s FY2020 performance was affected by tepid demand in rural markets and slowdown in the auto industry. Volume growth was higher compared to overall growth mainly on account of strong double-digit growth in the bottom-of-pyramid products (including emulsions and putty). April and May are some important months for painting activities but the business was lost due to lockdown. After easing of the lockdown, the company has witnessed recovery in tier-III/rural markets, but is yet to see a material recovery in metros. Hence, FY2021 is expected to be affected by COVID-19. However, strong recovery is anticipated in FY2022 with pent-up demand for painting, willingness to spend more on home improvement and recovery in the auto/industrial coatings segment. We expect substantial improvement in sales volume by FY2022, which is likely to sustain in FY2023, driven by 1) deferment of house refurbishment activities; 2) expected recovery in rural demand; and 3) regaining of momentum in the auto sector (auto paints contributes less than 20% of domestic sales). On the other hand, lower input prices would ease out some pressure on the margins in the near term.
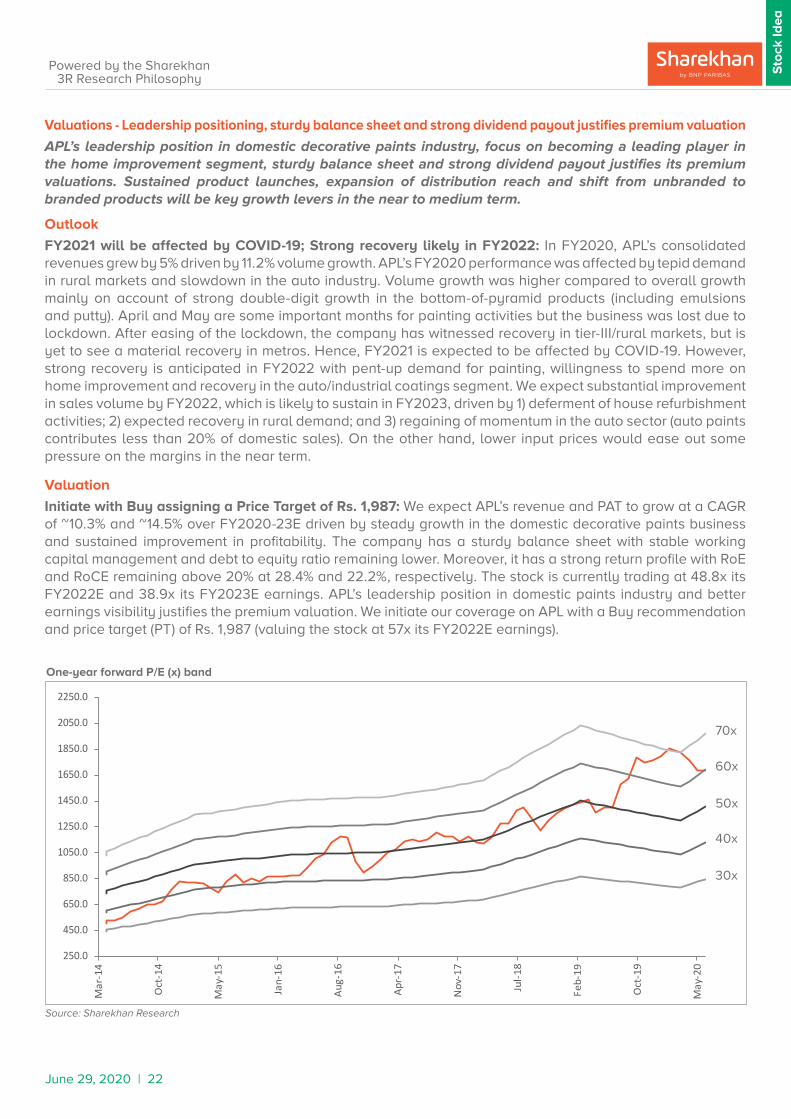
Valuation
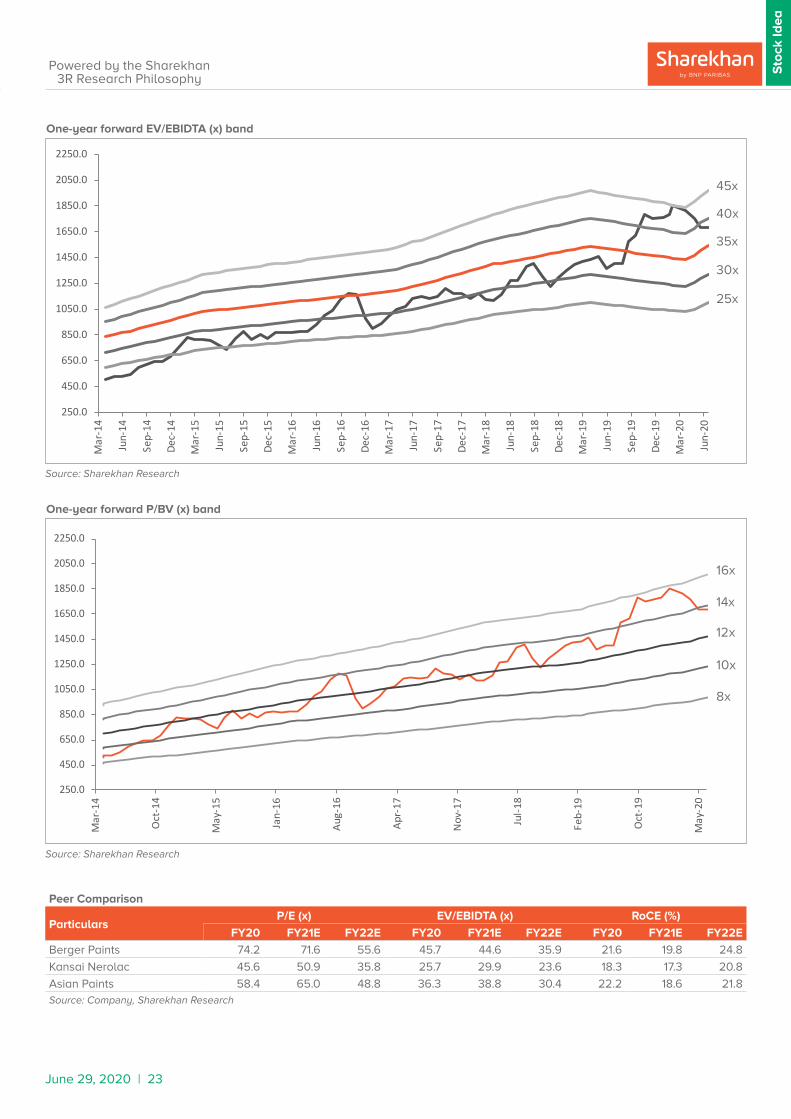
Initiate with Buy assigning a Price Target of Rs. 1,987: We expect APL’s revenue and PAT to grow at a CAGR of ~10.3% and ~14.5% over FY2020-23E driven by steady growth in the domestic decorative paints business and sustained improvement in profitability. The company has a sturdy balance sheet with stable working capital management and debt to equity ratio remaining lower. Moreover, it has a strong return profile with RoE and RoCE remaining above 20% at 28.4% and 22.2%, respectively. The stock is currently trading at 48.8x its FY2022E and 38.9x its FY2023E earnings. APL’s leadership position in domestic paints industry and better earnings visibility justifies the premium valuation. We initiate our coverage on APL with a Buy recommendation and price target (PT) of Rs. 1,987 (valuing the stock at 57x its FY2022E earnings).
Source: Sharekhan Research
One-year forward P/E (x) band
70x
60x
50x
40x
30x
250.0
450.0
650.0
850.0
1050.0
1250.0
1450.0
1650.0
1850.0
2050.0
2250.0
Mar
-14
Oct
-14
May
-15
Jan-
16
Aug-
16
Apr-
17
Nov
-17
Jul-1
8
Feb-
19
Oct
-19
May
-20
June 29, 2020 | 23
Sto
ck Id
ea
Powered by the Sharekhan3R Research Philosophy
Sto
ck Id
ea
Powered by the Sharekhan3R Research Philosophy
Peer Comparison
ParticularsP/E (x) EV/EBIDTA (x) RoCE (%)
FY20 FY21E FY22E FY20 FY21E FY22E FY20 FY21E FY22E
Berger Paints 74.2 71.6 55.6 45.7 44.6 35.9 21.6 19.8 24.8
Kansai Nerolac 45.6 50.9 35.8 25.7 29.9 23.6 18.3 17.3 20.8
Asian Paints 58.4 65.0 48.8 36.3 38.8 30.4 22.2 18.6 21.8Source: Company, Sharekhan Research
Source: Sharekhan Research
Source: Sharekhan Research
One-year forward EV/EBIDTA (x) band
One-year forward P/BV (x) band
45x
16x
40x
14x
35x
12x
30x
10x
25x
8x
250.0
450.0
650.0
850.0
1050.0
1250.0
1450.0
1650.0
1850.0
2050.0
2250.0
Mar
-14
Jun-
14
Sep-
14
Dec-
14
Mar
-15
Jun-
15
Sep-
15
Dec-
15
Mar
-16
Jun-
16
Sep-
16
Dec-
16
Mar
-17
Jun-
17
Sep-
17
Dec-
17
Mar
-18
Jun-
18
Sep-
18
Dec-
18
Mar
-19
Jun-
19
Sep-
19
Dec-
19
Mar
-20
Jun-
20
250.0
450.0
650.0
850.0
1050.0
1250.0
1450.0
1650.0
1850.0
2050.0
2250.0
Mar
-14
Oct
-14
May
-15
Jan-
16
Aug-
16
Apr-
17
Nov
-17
Jul-1
8
Feb-
19
Oct
-19
May
-20
June 29, 2020 | 24
Sto
ck Id
ea
Powered by the Sharekhan3R Research Philosophy
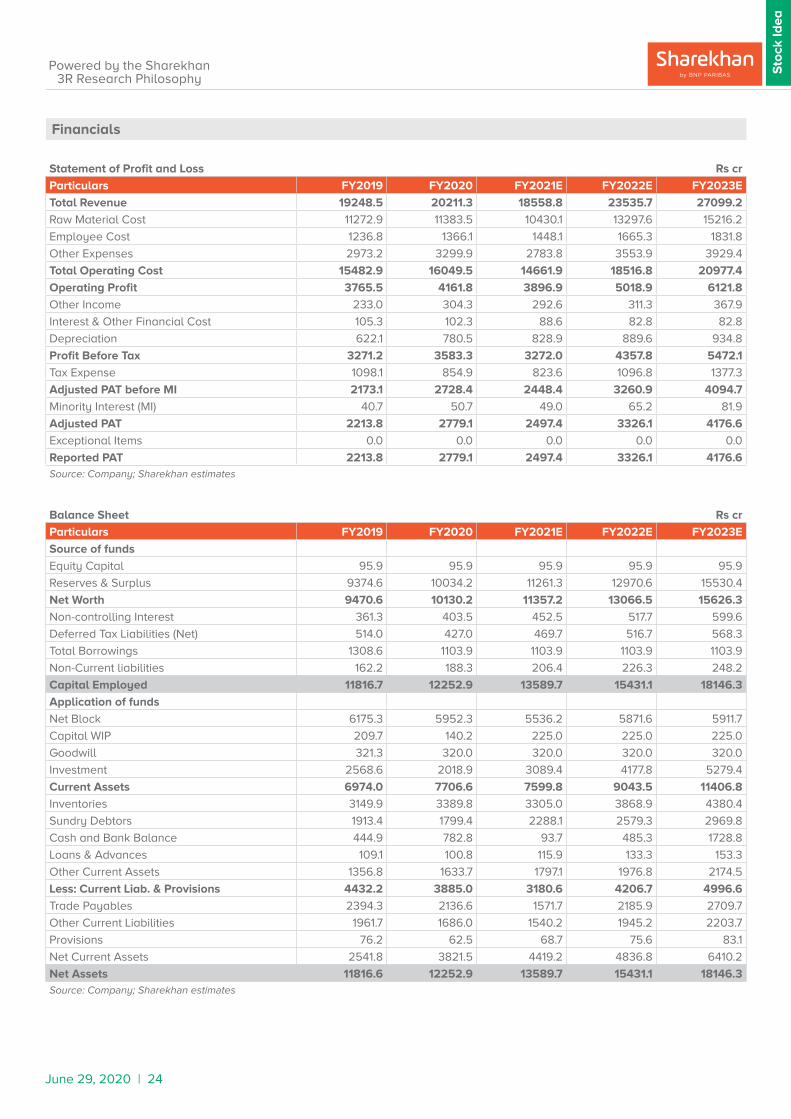
Statement of Profit and Loss Rs cr
Particulars FY2019 FY2020 FY2021E FY2022E FY2023E
Total Revenue 19248.5 20211.3 18558.8 23535.7 27099.2
Raw Material Cost 11272.9 11383.5 10430.1 13297.6 15216.2
Employee Cost 1236.8 1366.1 1448.1 1665.3 1831.8
Other Expenses 2973.2 3299.9 2783.8 3553.9 3929.4
Total Operating Cost 15482.9 16049.5 14661.9 18516.8 20977.4
Operating Profit 3765.5 4161.8 3896.9 5018.9 6121.8
Other Income 233.0 304.3 292.6 311.3 367.9
Interest & Other Financial Cost 105.3 102.3 88.6 82.8 82.8
Depreciation 622.1 780.5 828.9 889.6 934.8
Profit Before Tax 3271.2 3583.3 3272.0 4357.8 5472.1
Tax Expense 1098.1 854.9 823.6 1096.8 1377.3
Adjusted PAT before MI 2173.1 2728.4 2448.4 3260.9 4094.7
Minority Interest (MI) 40.7 50.7 49.0 65.2 81.9
Adjusted PAT 2213.8 2779.1 2497.4 3326.1 4176.6
Exceptional Items 0.0 0.0 0.0 0.0 0.0
Reported PAT 2213.8 2779.1 2497.4 3326.1 4176.6Source: Company; Sharekhan estimates
Balance Sheet Rs cr
Particulars FY2019 FY2020 FY2021E FY2022E FY2023E
Source of funds
Equity Capital 95.9 95.9 95.9 95.9 95.9
Reserves & Surplus 9374.6 10034.2 11261.3 12970.6 15530.4
Net Worth 9470.6 10130.2 11357.2 13066.5 15626.3
Non-controlling Interest 361.3 403.5 452.5 517.7 599.6
Deferred Tax Liabilities (Net) 514.0 427.0 469.7 516.7 568.3
Total Borrowings 1308.6 1103.9 1103.9 1103.9 1103.9
Non-Current liabilities 162.2 188.3 206.4 226.3 248.2
Capital Employed 11816.7 12252.9 13589.7 15431.1 18146.3
Application of funds
Net Block 6175.3 5952.3 5536.2 5871.6 5911.7
Capital WIP 209.7 140.2 225.0 225.0 225.0
Goodwill 321.3 320.0 320.0 320.0 320.0
Investment 2568.6 2018.9 3089.4 4177.8 5279.4
Current Assets 6974.0 7706.6 7599.8 9043.5 11406.8
Inventories 3149.9 3389.8 3305.0 3868.9 4380.4
Sundry Debtors 1913.4 1799.4 2288.1 2579.3 2969.8
Cash and Bank Balance 444.9 782.8 93.7 485.3 1728.8
Loans & Advances 109.1 100.8 115.9 133.3 153.3
Other Current Assets 1356.8 1633.7 1797.1 1976.8 2174.5
Less: Current Liab. & Provisions 4432.2 3885.0 3180.6 4206.7 4996.6
Trade Payables 2394.3 2136.6 1571.7 2185.9 2709.7
Other Current Liabilities 1961.7 1686.0 1540.2 1945.2 2203.7
Provisions 76.2 62.5 68.7 75.6 83.1
Net Current Assets 2541.8 3821.5 4419.2 4836.8 6410.2
Net Assets 11816.6 12252.9 13589.7 15431.1 18146.3Source: Company; Sharekhan estimates
Financials

June 29, 2020 | 25
Sto
ck Id
ea
Powered by the Sharekhan3R Research Philosophy
Sto
ck Id
ea
Powered by the Sharekhan3R Research Philosophy
Key Ratios Rs cr
Particulars FY2019 FY2020 FY2021E FY2022E FY2023E
Margins (%)
GPM 41.4 43.7 43.8 43.5 43.9
OPM 19.6 20.6 21.0 21.3 22.6
NPM 11.5 13.8 13.5 14.1 15.4
Tax rate 33.6 23.9 25.2 25.2 25.2
As a percentage of revenue (%)
Raw Material Cost 58.6 56.3 56.2 56.5 56.2
Employee Cost 6.4 6.8 7.8 7.1 6.8
Other Expenses 15.4 16.3 15.0 15.1 14.5
Financial ratios
Debt / Equity (x) 0.1 0.1 0.1 0.1 0.1
Inventory days 60 61 65 60 59
Debtor days 36 32 45 40 40
Payable days 78 69 55 60 65
Working capital cycle 18 25 55 40 34
Adjusted EPS (Rs.) 23.1 29.0 26.0 34.7 43.5
Cash EPS (Rs.) 29.6 37.1 34.7 44.0 53.3
Dividend Per Share (Rs.) 10.5 12.0 11.0 14.0 14.0
Dividend Payout Ratio (%) 54.8 49.9 50.9 48.6 38.7
Book Value Per Share (Rs.) 98.7 105.6 118.4 136.2 162.9
RoNW (%) 24.8 28.4 23.2 27.2 29.1
RoCE (%) 22.1 22.2 18.6 21.8 23.3
Valuation ratios
CMP (Rs.) 1692 1692 1692 1692 1692
P/E (x) 73.3 58.4 65 48.8 38.9
Mcap (Rs. crore) 162297 162297 162297 162297 162297
Market cap / Sales (x) 8.4 8 8.7 6.9 6
Enterprise Value (Rs. crore) 161986 162105 162717 162238 160892
EV / Sales (x) 8.4 8 8.8 6.9 5.9
EV / EBIDTA (x) 40.5 36.3 38.8 30.4 24.8
Price / Book value (BV) 17.1 16 14.3 12.4 10.4
Dividend yield (%) 0.6 0.7 0.7 0.8 0.8
Growth ratios (%)
Revenue 14.4 5.0 -8.2 26.8 15.1
Operating profit 17.8 10.5 -6.4 28.8 22.0
Profit before tax 8.2 9.5 -8.7 33.2 25.6
Adjusted PAT 9.2 25.5 -10.1 33.2 25.6
EPS 9.2 25.5 -10.1 33.2 25.6Source: Company; Sharekhan estimates
Cash Flow Statement Rs cr
Particulars FY2019 FY2020 FY2021E FY2022E FY2023E
Cash flow from operating activities 2879.7 2643.9 2057.6 4209.6 4803.5
Cash flow from investing activities -2628.6 75.4 -1569.7 -2315.3 -2078.7
Cash flow from financing activities -210.9 -2381.4 -1177 -1502.8 -1481.2
Net change in cash and cash equivalents 40.3 337.9 -689.1 391.5 1243.5
Opening cash balance 404.7 444.9 782.8 93.7 485.3
Closing cash balance 444.9 782.8 93.7 485.3 1728.8
Free Cash Flows (FCFF) 688.7 2157.1 1560.1 2984.6 3828.5
Free Cash Flows to Equity (FCFE) 1471.6 1952.4 1560.1 2984.6 3828.5Source: Company; Sharekhan estimates

June 29, 2020 | 26
Sto
ck Id
ea
Powered by the Sharekhan3R Research Philosophy
About company
APL is the largest paint company in India with a market leadership of over 50 years and stands among the top 10 paint companies in the world. The company has 27 paint manufacturing plants in 16 countries, serving customers in over 65 countries globally. The company offers paints – decorative and industrial, wall coverings and waterproofing along with kitchen and bath fittings, adhesives and services. Deco India, including decorative paints, water proofing, wall coverings and adhesives, constitutes almost 83% to the company’s total revenue, whereas the industrial coatings space including automotive and non-automotive constitutes only 3%, through two 50:50 joint ventures with PPG industries Inc., USA (AP-PPG). The international business contributes ~12% to the total revenue mainly dominated by Nepal, Sri Lanka and Bahrain. A small portion is contributed by kitchen and bath fittings through its subsidiary Sleek International Pvt. Ltd. (Sleek Kitchens) and Ess Ess Bath Fittings.
Investment theme
The rising middle-income group, fast urbanisation, shift from unorganised to organised space; and improving penetration in rural markets are some of the key revenue drivers for paint companies in the near to medium term. APL, with a leadership position in the decorative paint business and strong brand portfolio, will continue to deliver good earnings growth in the near term. APL is expected to benefit from its recent capacity expansion, vast distribution network, product innovation, and growth in its premium products. Key Risks
� Increased raw-material prices: Any significant increase in crude prices and other input costs will affect the company’s profitability.
� Slowdown in economic growth: Any slowdown in economic growth will affect repainting demand, which constitutes almost 70% of the total paint demand.
� Slowdown in the auto industry: Further sluggishness in demand in the auto industry or slowdown in infrastructure development will affect the industrial coatings segment.
Additional Data
Key management personnel
Amit Syngle Managing Director & CEO
Ashwin Dani Chairman
R J Jeyamurugan CFO & Company SecretarySource: Bloomberg
Top 10 shareholders
Sr. No. Holder Name Holding (%)
1 Teesta Retail Private Limited 4.9
2 Life Insurance Corporation of India 2.8
3 Vanguard Group Inc 1.1
4 SBI Funds Management Private Limited 1.1
5 Blackrock Inc 0.9
6 Axis Asset Management Co Ltd 0.7
7 JP Morgan Chase & Co 0.6
8 ICICI Prudential Asset Management 0.6
9 Capital Group Cos 0.6
10 UTI Asset Management Co Ltd 0.4Source: Bloomberg
Sharekhan Limited, its analyst or dependant(s) of the analyst might be holding or having a position in the companies mentioned in the article.

June 29, 2020 | 27
Sto
ck Id
ea
Powered by the Sharekhan3R Research Philosophy
Sto
ck Id
ea
Powered by the Sharekhan3R Research Philosophy
Understanding the Sharekhan 3R Matrix
Right Sector
Positive Strong industry fundamentals (favorable demand-supply scenario, consistent
industry growth), increasing investments, higher entry barrier, and favorable
government policies
Neutral Stagnancy in the industry growth due to macro factors and lower incremental
investments by Government/private companies
Negative Unable to recover from low in the stable economic environment, adverse
government policies affecting the business fundamentals and global challenges
(currency headwinds and unfavorable policies implemented by global industrial
institutions) and any significant increase in commodity prices affecting profitability.
Right Quality
Positive Sector leader, Strong management bandwidth, Strong financial track-record,
Healthy Balance sheet/cash flows, differentiated product/service portfolio and
Good corporate governance.
Neutral Macro slowdown affecting near term growth profile, Untoward events such as
natural calamities resulting in near term uncertainty, Company specific events
such as factory shutdown, lack of positive triggers/events in near term, raw
material price movement turning unfavourable
Negative Weakening growth trend led by led by external/internal factors, reshuffling of
key management personal, questionable corporate governance, high commodity
prices/weak realisation environment resulting in margin pressure and detoriating
balance sheet
Right Valuation
Positive Strong earnings growth expectation and improving return ratios but valuations
are trading at discount to industry leaders/historical average multiples, Expansion
in valuation multiple due to expected outperformance amongst its peers and
Industry up-cycle with conducive business environment.
Neutral Trading at par to historical valuations and having limited scope of expansion in
valuation multiples.
Negative Trading at premium valuations but earnings outlook are weak; Emergence of
roadblocks such as corporate governance issue, adverse government policies
and bleak global macro environment etc warranting for lower than historical
valuation multiple.Source: Sharekhan Research