Asian Paints - company update-Sep-13-EDEL - Myirisbreport.myiris.com/ES1/ASIPAIIA_20130918.pdf ·...
16
Edelweiss Research is also available on www.edelresearch.com, Bloomberg EDEL <GO>, Thomson First Call, Reuters and Factset. Edelweiss Securities Limited Our channel checks infuse confidence about the robust demand scenario in coming quarters for Asian Paints. This is largely on the back of good rural demand, low per capita consumption, stronger marriage season, innovations and increase in distribution. Pick up in demand backed by good monsoon will be seen in Q2FY14 and October month before Diwali which is the peak season. Foray into home solution through Sleek and company’s further evaluation of entry into the other categories of the home décor segment will bring synergy from the vast distribution network of paint dealers. Maintain ‘BUY’. Volume growth improves amidst slowdown Slowdown in discretionary spends has affected most consumer companies (HUL witnessed only 2% YoY growth in Personal Care segment in Q1FY14) but Asian Paints has seen robust volume growths amidst slowdown (double digit volume growth in Q1FY14) due to: (a) Market share gains (competitors witnessing single digit growth and unorganized players impacted adversely during times of commodity cost pressure), (b) Higher number of marriage days (20% higher YoY), (c) Innovations (launch of the premium product Aspira), (d) 90% of painting demand from repainting, while only 10% comes from fresh painting and (e) Per capita consumption of paints in India being one of the lowest when compared to many other countries (one fourth of that in China). Price hikes being reviewed; Khandala plant to pressurise margins Asian Paints has till date taken 3 price hikes effective from May 1, August 1 and September 1 of 1.2%, 1% and 1.8% respectively. Further price hikes are constantly being reviewed to counter the rupee depreciation. The Khandala plant, which will operate at only 35% of its capacity in FY14, will exert pressure on margins initially till the time it is stabilized. However, synergies in form of distribution and freight will start to flow in. Outlook and valuations: Growing strong; maintain ‘BUY’ At CMP the stock is trading at P/E of 32.7x and 26.1x on FY14E and FY15E, respectively. We are also positive on new growth drivers like water proofing and Sleek businesses. We maintain ‘BUY/Sector Performer’ with TP of INR513 at 30x FY15E P/E multiple. COMPANY UPDATE ASIAN PAINTS Blooms amid gloom EDELWEISS 4D RATINGS Absolute Rating BUY Rating Relative to Sector Performer Risk Rating Relative to Sector Medium Sector Relative to Market Overweight MARKET DATA (R: ASPN.BO, B: APNT IN) CMP : INR 446 Target Price : INR 513 52-week range (INR) : 525 / 343 Share in issue (mn) : 959.2 M cap (INR bn/USD mn) : 421 / 6,618 Avg. Daily Vol.BSE/NSE(‘000) : 971.6 SHARE HOLDING PATTERN (%) Current Q4FY13 Q3FY13 Promoters * 52.8 52.8 52.8 MF's, FI's & BK’s 7.8 7.9 8.5 FII's 19.4 19.4 18.6 Others 20.0 19.9 20.1 * Promoters pledged shares (% of share in issue) : 8.7 PRICE PERFORMANCE (%) Stock Nifty EW Consumer Goods Index 1 month 0.4 4.2 9.2 3 months (2.5) 1.6 16.8 12 months 14.0 7.7 40.8 Abneesh Roy +91 22 6620 3141 [email protected] Pooja Lath +91 22 6620 3075 [email protected] India Equity Research| Consumer Goods September 18, 2013 Financials Year to March FY12 FY13 FY14E FY15E Revenues (INR mn) 96,322 109,707 130,253 153,391 Rev. growth (%) 24.7 13.9 18.7 17.8 EBITDA (INR mn) 15,088 17,319 20,459 24,298 Net profit (INR mn) 9,887 11,139 13,064 16,408 Shares outstanding (mn) 959 959 959 959 Diluted EPS (INR) 10.3 11.6 13.6 17.1 EPS growth (%) 17.3 12.7 17.3 25.6 Diluted P/E (x) 43.3 38.4 32.7 26.1 EV/EBITDA (x) 28.0 24.3 20.4 16.9 ROAE (%) 40.1 36.3 35.0 36.3
Transcript of Asian Paints - company update-Sep-13-EDEL - Myirisbreport.myiris.com/ES1/ASIPAIIA_20130918.pdf ·...
Edelweiss Research is also available on www.edelresearch.com, Bloomberg EDEL <GO>, Thomson First Call, Reuters and Factset. Edelweiss Securities Limited
Our channel checks infuse confidence about the robust demand scenario in coming quarters for Asian Paints. This is largely on the back of good rural demand, low per capita consumption, stronger marriage season, innovations and increase in distribution. Pick up in demand backed by good monsoon will be seen in Q2FY14 and October month before Diwali which is the peak season. Foray into home solution through Sleek and company’s further evaluation of entry into the other categories of the home décor segment will bring synergy from the vast distribution network of paint dealers. Maintain ‘BUY’.
Volume growth improves amidst slowdown Slowdown in discretionary spends has affected most consumer companies (HUL witnessed only 2% YoY growth in Personal Care segment in Q1FY14) but Asian Paints has seen robust volume growths amidst slowdown (double digit volume growth in Q1FY14) due to: (a) Market share gains (competitors witnessing single digit growth and unorganized players impacted adversely during times of commodity cost pressure), (b) Higher number of marriage days (20% higher YoY), (c) Innovations (launch of the premium product Aspira), (d) 90% of painting demand from repainting, while only 10% comes from fresh painting and (e) Per capita consumption of paints in India being one of the lowest when compared to many other countries (one fourth of that in China). Price hikes being reviewed; Khandala plant to pressurise margins Asian Paints has till date taken 3 price hikes effective from May 1, August 1 and September 1 of 1.2%, 1% and 1.8% respectively. Further price hikes are constantly being reviewed to counter the rupee depreciation. The Khandala plant, which will operate at only 35% of its capacity in FY14, will exert pressure on margins initially till the time it is stabilized. However, synergies in form of distribution and freight will start to flow in.
Outlook and valuations: Growing strong; maintain ‘BUY’ At CMP the stock is trading at P/E of 32.7x and 26.1x on FY14E and FY15E, respectively. We are also positive on new growth drivers like water proofing and Sleek businesses. We maintain ‘BUY/Sector Performer’ with TP of INR513 at 30x FY15E P/E multiple.
COMPANY UPDATE
ASIAN PAINTS Blooms amid gloom
EDELWEISS 4D RATINGS
Absolute Rating BUY
Rating Relative to Sector Performer
Risk Rating Relative to Sector Medium
Sector Relative to Market Overweight
MARKET DATA (R: ASPN.BO, B: APNT IN)
CMP : INR 446
Target Price : INR 513
52-week range (INR) : 525 / 343
Share in issue (mn) : 959.2
M cap (INR bn/USD mn) : 421 / 6,618
Avg. Daily Vol.BSE/NSE(‘000) : 971.6
SHARE HOLDING PATTERN (%)
Current Q4FY13 Q3FY13
Promoters * 52.8 52.8 52.8
MF's, FI's & BK’s 7.8 7.9 8.5
FII's 19.4 19.4 18.6
Others 20.0 19.9 20.1 * Promoters pledged shares (% of share in issue)
: 8.7
PRICE PERFORMANCE (%)
Stock Nifty
EW Consumer Goods Index
1 month 0.4 4.2 9.2
3 months (2.5) 1.6 16.8
12 months 14.0 7.7 40.8
Abneesh Roy +91 22 6620 3141 [email protected] Pooja Lath +91 22 6620 3075 [email protected]
India Equity Research| Consumer Goods
September 18, 2013
FinancialsYear to March FY12 FY13 FY14E FY15ERevenues (INR mn) 96,322 109,707 130,253 153,391 Rev. growth (%) 24.7 13.9 18.7 17.8 EBITDA (INR mn) 15,088 17,319 20,459 24,298 Net profit (INR mn) 9,887 11,139 13,064 16,408 Shares outstanding (mn) 959 959 959 959 Diluted EPS (INR) 10.3 11.6 13.6 17.1 EPS growth (%) 17.3 12.7 17.3 25.6 Diluted P/E (x) 43.3 38.4 32.7 26.1 EV/EBITDA (x) 28.0 24.3 20.4 16.9 ROAE (%) 40.1 36.3 35.0 36.3

Consumer Goods
2 Edelweiss Securities Limited
Key Takeaways
Demand: The demand scenario for the company has been good and it has not seen any deterioration in the trend. Demand is expected to pick up in Q2FY14 and in the month of October, before the festive season, Diwali, where demand is usually at its peak. However, the company also sees a lot of painting work being carried on in the non-Diwali season as labour cost and its availability becomes easy post the Diwali season. Good monsoon is also expected to push demand in rural India in the coming quarters. The effect of economic slowdown is not much in rural areas but is more in urban markets. We expect the company to benefit from the strong monsoon and elongated marriage season.
Industry growth rate: The growth rate of the paint industry is 1.5-2x that of the GDP growth rate.
Volume Growth: The company, witnessed a double digit volume growth in Q1FY14. The main drivers of the volume growth are: (1) Lower per capita consumption of paints in India compared to other countries (one fourth of that in China) (2) Presence of unorganized players in the industry from which the company gains market share when the commodity costs pressure is higher and (3) High penetration of the company and high aspirations (change in mind set of the people about painting, more and more women participation in selection of paints etc).
Price hike: Asian Paints has taken 3 price hikes YTD14 totaling ~4% overall price hike. The price hikes were taken on May 1, 2013 of 1.2%, August 1, 2013 of 1% and another price hike of 1.8% on September 1, 2013. To counter the effect of the rupee depreciation the price increase in constantly being reviewed by the company. However as of now no more increase in prices is being considered.
Historically, the company has not taken a price increase in the month of September but the same has been done this year to counter the rupee depreciation impact. Asian Paints tries to maintain and operate within a range of gross margin and being a market leader, passes on the price when it is affecting the company provided as long as it doesn’t distort the market of the company.
Raw material: 35% of the total raw material cost of the company is linked to the dollar.
Ad spends: Will like to maintain ad spends to sales percentage of ~2.5-3%.
Premiumisation: The company believes that over a long term, the up-trading and premiumisation would continue and improve the mix of the company. The lower segment is growing as it is up-trading from Chuna to Distemper while the upper segment is growing because of the new products.
Sleek acquisition: Asian Paints had acquired 51% in the modular kitchen company Sleek in FY13, the integration process of which is going on. The same will be reported as a part of the consolidated financials of the company in FY14.
Home Décor: We expect that Asian Paints will explore all the opportunities in the Home Décor space. There is a lot of opportunity in the home improvement space in the country which the company can leverage upon on the back of its vast distribution network. Asian Paints has a good consumer connect and brand recall which can be used to leverage upon the home improvement segment.
Aspira: The new product Asian Paints Aspira has received a promising response in the areas where it has been launched. It has not been launched pan India. The product is 40% costlier than the Asian Paints Royale and is at a price point of ~INR600 per litre.

Asian Paints
3 Edelweiss Securities Limited
Market share: As per our channel checks Asian Paints has gained market share to some extent.
Competition: The competitive intensity has been high as everyone is optimistic about the demand in India. This has resulted in an increase in the investment activity by the competition for the purpose of improving the capacity. It takes ~3-4 years to set up a plant for the purpose of improving capacity.
The main game changer and the differentiator in the competitive environment is the quality of the service levels that a company gives to the dealer.
Khandala plant: The plant will operate at ~35% of its capacity by this year end. We believe that the company will sort the power issue relating to the plant soon. Over the longer term there will be cost saving in terms of distribution because of the new plant.
Construction chemical: It is a very small segment for Asian Paints and is seen as an ancillary segment which will always be a small part of the volumes of the company.
International business: Q1FY14 was good as far as the international business is concerned. Middle East and Asian region did well but Egypt continues to suffer because of political turmoil. The company is vigilantly looking for acquisition in the international regions.
Acquisitions: Asian Paints is looking for M&A activities outside India and will look for opportunities in the emerging markets where the business scenario is akin to India.
Depots: Asian Paints has more than 100 depot locations.
Dealers: The company has a network of around 32,000 dealers.
Tinting machine: Asian Paints added 1,000 machines YoY and has total of ~23,000 machines. Cost of one tinting machine is ~INR0.15mn.
Colour Idea store: The Colour Idea store has seen a good response from dealers. The company will like to keep these stores limited in number and thus will not have too many stores in the same region. Each store requires an investment of INR2.5-3mn which is shared by the dealer and the company both.
Other key developments Home Décor set to grow Asian Paints forayed into the Home Décor segment through the acquisition of 51% stake in the leading modular kitchen company, Sleek, in FY13. The process of the integration of Sleek is going on smoothly for the company and the same will be integrated into the financials of the company in FY14. Asian Paints continues to explore opportunities in the home improvement segment that can be sold through the same distribution channels as that of the paints. This will help bring synergies as Asian Paints has a vast network of ~32,000 dealers spread across the country. The home décor segment has a huge potential to grow and the company continues to evaluate opportunities in it. Asian Paints has a good consumer connect and brand recall which can be used to leverage upon the home improvement segment. In cities like Mumbai where it rains heavily waterproofing is considered as precedent to paint and most of the paint customers wants waterproofing solutions. With the entry into the waterproofing segment, Asian Paints addressed the needs of these customers. Similarly with the foray into the home improvement segment with Sleek and its likely entry into more

Consumer Goods
4 Edelweiss Securities Limited
segments in this category, Asian Paints will be able to leverage upon its channel to fulfill the home improvement queries of the paint customers. Recently Asian Paints completed acquisition of Sleek Group as it approved the infusion of INR997.8mn for 51% stake by subscription to equity shares of Sleek International Private Limited (SIPL). The company further infused INR196.9mn as a second tranche to the transaction with a corresponding proportionate infusion by the existing promoters of SIPL.
Premium launch - `Royale Aspira’ - doing well Asian Paints which launched its premium product under the Royale brand, Royale Aspira has received a promising response in markets where it was test launched. This product, which is currently present in only some of the markets, will be rolled out pan India over a period of time. Royale Aspira, is the international gold standard in paints and is regarded as one of the most advanced paints in the world technologically. The product is ~40% costlier than the normal Asian Paints Royale paint and is at a price point of ~INR600 per litre. This premium paints Aspira gives a five-year performance warranty and has features like anti-microbial properties, water beading technology (water when it comes in contact with a Royale Aspira surface, it does not wet, penetrate, trickle down, or spot), crack bridging ability, fire safety and security and is environmental friendly.
Asian Paints launched ‘Har Ghar Kuch Kehta Hai’ Asian Paints is sponsoring a new show, ‘Har Ghar Kuch Kehta Hai’ on the TV channel ‘Colors’. This serial is a 10-part series features celebrities talking about their childhood memories and the house where they spent their childhood. The show is an Indian adaptation of the serial ‘The House That Made Me’. This programme is funded by Asian Paints, and will strengthen its consumer connect and brand recognition among viewers. The show is a collaborated effort put forth by Colors, BBC Worldwide Productions India and Asian Paints, with all parties being equal stakeholders in India. The programme shows the viewers the journey of celebrities from their childhood and will try to inspire the viewers to make their home beautiful. Asian Paints through this promotion strategy will try to get an emotional link with the consumers and to leverage upon this is also running a contest online that invite people to tell the story of their home and how they have created that special home. Further to the branding of ‘Har Ghar Kuch Kehta Hai’ Asian Paints has also launched a new ad campaign that also tries to build up an emotional link of the consumer with their homes and shows the chemistry between the wife and the husband and the delight wife gets to be in the house that has the same look-and-feel as her parent’s house.
Stake increased in Berger International Limited, Singapore Asian Paints has also recently acquired a further 25.72% of additional stake (from Aegis Estates Ltd) through its wholly owned subsidiary Asian Paints (International) Limited in Berger International Limited, Singapore (BIL). Asian Paints earlier had a 50.10% stake in BIL which is listed on the stock exchange in Singapore (SGX-ST). Berger International Limited has no operation in India but has operations in Middle East countries like Egypt, Baharain, UAE, Singapore and Caribbean regions (Jamaica, Barbados and Trinidad and Tobago). Asian Paints intends to acquire the remaining 24.18% stake in BIL so that it can become a wholly owned subsidiary of Asian Paints and the same can be delisted from Singapore Stock Exchange for which it intends to come out with a voluntary unconditional cash offer. BIL is a profitable company and earned a profit of INR64.14mn in Q1FY14 increasing from INR26.12mn in Q1FY13.

Asian Paints
5 Edelweiss Securities Limited
Expat inflow increasing As per a news article there has been a significant increase in the remittances coming from abroad in states like Kerala etc which in turn will lead to increase in the discretionary spending like paints. In CY13 Kerala has already reported 36% YoY growth in the inflow of expat money which brings in more money in the hand of the people leading to an increase in the discretionary spends. With the depreciation of rupee the remittances have also increased in states like Punjab which will also benefit from the strong monsoon due to which the agricultural income will increase.
Fig. 1:Asian Paints Har Ghar Kuch Kehta Hai – New programme on Colors
Chart 1: Sales growth moderates
Source: Company, Edelweiss research
0.0
7.0
14.0
21.0
28.0
35.0
Q1F
Y10
Q2F
Y10
Q3F
Y10
Q4F
Y10
Q1F
Y11
Q2F
Y11
Q3F
Y11
Q4F
Y11
Q1F
Y12
Q2F
Y12
Q3F
Y12
Q4F
Y12
Q1F
Y13
Q2F
Y13
Q3F
Y13
Q4F
Y13
Q1F
Y14
(%)

Consumer Goods
6 Edelweiss Securities Limited
Chart 2: Titanium dioxide price has start to move up
Chart 3: Price movement in brent crude oil – affects major part of raw materials
Chart 4: EBITDA margin contracts by 119bps YoY
Source: Company, Edelweiss research
120.0
155.0
190.0
225.0
260.0
295.0
Sep-
08
Dec
-08
Mar
-09
Jun-
09
Sep-
09
Dec
-09
Mar
-10
Jun-
10
Sep-
10
Dec
-10
Mar
-11
Jun-
11
Sep-
11
Dec
-11
Mar
-12
Jun-
12
Sep-
12
Dec
-12
Mar
-13
Jun-
13
Sep-
13
(TiO
2 -I
NR/
kg)
0
1,700
3,400
5,100
6,800
8,500
May
-09
Aug
-09
Nov
-09
Feb-
10
May
-10
Aug
-10
Nov
-10
Feb-
11
May
-11
Aug
-11
Nov
-11
Feb-
12
May
-12
Aug
-12
Nov
-12
Feb-
13
May
-13
Aug
-13
(INR/
barr
el)
0.0
5.0
10.0
15.0
20.0
25.0
Q1F
Y10
Q2F
Y10
Q3F
Y10
Q4F
Y10
Q1F
Y11
Q2F
Y11
Q3F
Y11
Q4F
Y11
Q1F
Y12
Q2F
Y12
Q3F
Y12
Q4F
Y12
Q1F
Y13
Q2F
Y13
Q3F
Y13
Q4F
Y13
Q1F
Y14
(%)

Asian Paints
7 Edelweiss Securities Limited
Table 1: Standalone snapshot (INR mn)
Source: Company, Edelweiss research
Table 2: Price changes summary
Source: Company, Edelweiss research
Year to March Q1FY14 Q1FY13 % Change Q4FY13 % ChangeNet sales 23,197 20,540 12.9 22,299 4.0 COGS 12,948 11,621 11.4 12,501 3.6 Staff costs 1,353 1,044 29.6 1,049 29.0 Other expenditure 4,704 3,828 22.9 5,209 (9.7) Total expenditure 19,005 16,493 15.2 18,758 1.3 EBITDA 4,192 4,047 3.6 3,540 18.4 Depreciation 530 274 93.7 401 32.1 EBIT 3,662 3,774 (3.0) 3,139 16.7 Interest 48 78 (38.7) 69 (30.5) Other income 522 252 107.1 437 19.3 PBT 4,136 3,948 4.8 3,508 17.9 Tax expenses 1,297 1,202 7.9 1,112 16.6 Net profit 2,839 2,746 3.4 2,396 18.5 As % of net revenuesCOGS 55.8 56.6 (76) 56.1 (24) Staff expenses 5.8 5.1 75 4.7 113 Others 20.3 18.6 164 23.4 (308) EBITDA 18.1 19.7 (163) 15.9 220 PAT 12.2 13.4 (113) 10.7 150 Tax rate 31.3 30.4 90 31.7 (35)
Date Price hikeSep-13 1.8 Aug-13 1.0 May-13 1.2 Jan-13 (0.2) May-12 3.2 Mar-12 2.1 Mar-12 1.4 Dec-11 2.2 Jul-11 1.3 Jun-11 2.5 May-11 4.4 Q4FY11 1.0 Dec-10 3.0 Aug-10 1.2 Jul-10 2.6 May-10 4.2
Consumer Goods
8 Edelweiss Securities Limited
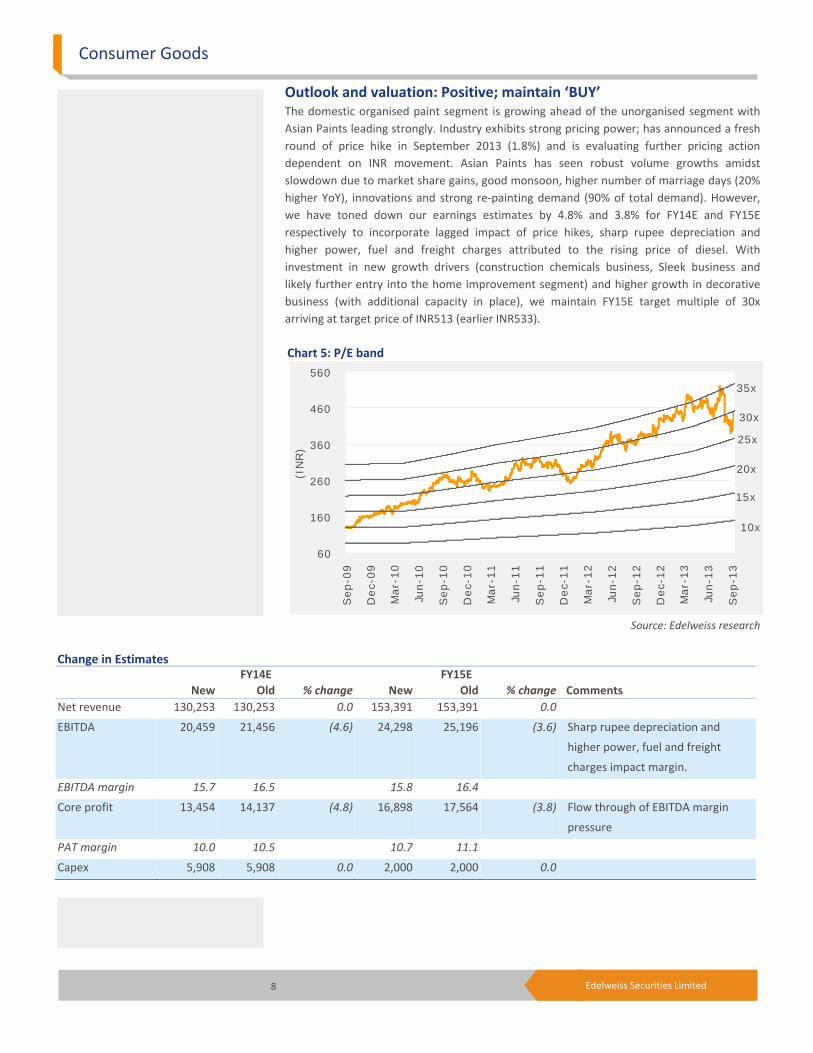
Outlook and valuation: Positive; maintain ‘BUY’ The domestic organised paint segment is growing ahead of the unorganised segment with Asian Paints leading strongly. Industry exhibits strong pricing power; has announced a fresh round of price hike in September 2013 (1.8%) and is evaluating further pricing action dependent on INR movement. Asian Paints has seen robust volume growths amidst slowdown due to market share gains, good monsoon, higher number of marriage days (20% higher YoY), innovations and strong re-painting demand (90% of total demand). However, we have toned down our earnings estimates by 4.8% and 3.8% for FY14E and FY15E respectively to incorporate lagged impact of price hikes, sharp rupee depreciation and higher power, fuel and freight charges attributed to the rising price of diesel. With investment in new growth drivers (construction chemicals business, Sleek business and likely further entry into the home improvement segment) and higher growth in decorative business (with additional capacity in place), we maintain FY15E target multiple of 30x arriving at target price of INR513 (earlier INR533). Chart 5: P/E band
Source: Edelweiss research
60
160
260
360
460
560
Sep-0
9
Dec-
09
Mar-
10
Jun-1
0
Sep-1
0
Dec-
10
Mar-
11
Jun-1
1
Sep-1
1
Dec-
11
Mar-
12
Jun-1
2
Sep-1
2
Dec-
12
Mar-
13
Jun-1
3
Sep-1
3
(IN
R)
10x
15x
20x
25x
30x
35x
Change in Estimates FY14E FY15E New Old % change New Old % change Comments Net revenue 130,253 130,253 0.0 153,391 153,391 0.0
EBITDA 20,459 21,456 (4.6) 24,298 25,196 (3.6) Sharp rupee depreciation and
higher power, fuel and freight
charges impact margin.
EBITDA margin 15.7 16.5 15.8 16.4
Core profit 13,454 14,137 (4.8) 16,898 17,564 (3.8) Flow through of EBITDA margin
pressure
PAT margin 10.0 10.5 10.7 11.1
Capex 5,908 5,908 0.0 2,000 2,000 0.0

Asian Paints
9 Edelweiss Securities Limited
Company Description Asian Paints is the largest paints company in India and figures among the top 10 players in the world. The company has 25 manufacturing plants in 17 countries, serving consumers in 65 countries globally. The decorative segment accounts for almost 70% of the overall paints market. Paints sales in domestic and international markets contributed 81% and 13%, respectively, to the company’s consolidated revenue; chemical sales accounted for the balance. Among Asian Paints’ international businesses, while the Middle East contributes the lion’s share at 51% to revenue, the Caribbean contributes 14%. Asia and South Pacific contribute 27% and 8%, respectively.
Investment Theme The paints industry is expected to post robust volume growth led by strong repainting demand and from construction. Growth in the repainting segment, accounting for about 90% of decorative demand, is on account of a relatively strong economy. Further, expected growth in construction activity over the next five years creates opportunity for fresh painting. Though Asian Paints is expected to grow ahead of the market on account of its pricing strategy at the lower end, higher growth in premium products, brand equity and distribution strength (over 32,000 dealers compared to Berger’s 9,500 and Kansai’s 6,500), moderation in real estate and auto segments can act as barrier.
Key Risks A slowdown in the economy is the biggest risk for the paints industry, as about 75% of demand for decorative paints arises from repainting, which, in turn, depends heavily on the country’s economic condition. A rise in crude oil price and rupee depreciation could hurt the company’s margin as crude derivatives account for majority of Asian Paints’ input costs.
10 Edelweiss Securities Limited
Consumer Goods
Financial Statements
Income statement (INR mn)
Year to March FY12 FY13 FY14E FY15E
Net revenue 96,322 109,707 130,253 153,391
Materials costs 57,953 64,385 75,830 89,110
Employee costs 5,260 6,236 8,024 9,413
Other Expenses 13,921 16,541 20,168 23,791
Advertisement & sales costs 4,101 5,227 5,772 6,779
EBITDA 15,088 17,319 20,459 24,298
Depreciation & Amortization 1,211 1,546 2,109 2,101
EBIT 13,876 15,773 18,350 22,198
Other income 1,074 1,145 1,601 2,197
Interest expenses 410 367 310 255
Profit before tax 14,541 16,552 19,641 24,139
Provision for tax 4,335 4,957 6,187 7,242
Net profit 10,206 11,595 13,454 16,898
Minority interest (319) (456) (390) (490)
Profit after minority interest 9,887 11,139 13,064 16,408
Shares outstanding (mn) 959 959 959 959
Diluted EPS (INR) 10.3 11.6 13.6 17.1
Dividend per share (INR) 4.0 4.6 5.4 6.8
Dividend payout (%) 38.8 39.6 40.0 40.0
Common size metrics
Year to March FY12 FY13 FY14E FY15E
Materials costs 60.2 58.7 58.2 58.1
Employee expenses 5.5 5.7 6.2 6.1
Advertising & sales costs 4.3 4.8 4.4 4.4
Other expenses 14.5 15.1 15.5 15.5
Depreciation 1.3 1.4 1.6 1.4
Interest expenditure 0.4 0.3 0.2 0.2
EBITDA margins 15.7 15.8 15.7 15.8
EBIT margins 14.4 14.4 14.1 14.5
Net profit margins 10.3 10.2 10.0 10.7
Growth ratios (%)
Year to March FY12 FY13 FY14E FY15E
Revenues 24.7 13.9 18.7 17.8
EBITDA 13.6 14.8 18.1 18.8
PBT 15.4 13.8 18.7 22.9
Net profit 17.3 12.7 17.3 25.6
EPS 17.3 12.7 17.3 25.6
Key Assumptions
Year to March FY12 FY13 FY14E FY15E
Macro
GDP(Y-o-Y %) 6.2 5.0 4.8 6.0
Inflation (Avg) 8.9 7.4 5.2 6.0
Repo rate (exit rate) 8.5 7.5 6.8 6.0
USD/INR (Avg) 48.0 54.5 62.0 60.0
Company
Sales assumptions
Sales growth - paints, enamels, varnish – std 25.2 14.9 19.5 19.0
Sales growth - phthalic anhydride, etc - std 43.1 11.3 4.8 8.0
Volume growth - standalone 11.7 4.5 10.0 9.0
Pricing change - standalone 13.5 10.4 9.5 10.0
Subsidiary net sales growth 20.3 19.8 9.8 14.8
Cost assumptions
Excise as % of Gross Sales - standalone 9.0 10.6 9.0 9.0
Excise as % of Gross Sales - subsidiaries 3.3 2.9 3.3 3.2
Titanium Dioxide (as % of COGS) 32.1 32.3 31.8 33.0
Crude Linked RM (as % of COGS) 20.4 17.3 20.2 20.8
Packing Material (as % of COGS) 14.7 14.9 14.5 14.6
COGS as % of sales (Consol) 60.2 58.7 58.2 58.1
COGS as % of sales (standalone) 59.6 57.8 57.6 57.3
Staff costs as % of sales (Consol) 5.5 5.7 6.2 6.1
Staff costs as % of sales (standalone) 4.3 4.8 4.6 4.6
A&P as % of sales (Consol) 4.3 4.8 4.4 4.4
A&P as % of sales (Domestic) 4.3 4.8 4.6 4.6
Financial assumptions
Tax rate (Consol) 29.8 29.9 31.5 30.0
Capex (INR mn) 6,903 7,230 5,908 2,000
Debtor days 26 29 26 27
Inventory days 91 97 92 93
Payable days 74 77 76 77
Cash conversion cycle (days) 43 50 42 43
Depreciation as % of gross block 5.9 5.6 6.0 5.7
Yield on cash 11.0 11.1 15.5 14.5

11 Edelweiss Securities Limited
Asian Paints
Peer comparison valuation
Market cap Diluted PE (X) EV/EBITDA (X) ROAE (%)
Name (USD mn) FY14E FY15E FY14E FY15E FY14E FY15E
Asian Paints 6,618 32.7 26.1 20.4 16.9 35.0 36.3
Colgate 2,608 30.1 25.9 21.4 18.2 114.9 105.1
Dabur 4,658 31.9 26.0 23.9 19.2 38.8 37.7
GlaxoSmithKline Consumer Healthcare 3,151 39.4 33.6 27.4 23.1 34.0 33.3
Godrej Consumer 4,543 35.7 29.4 25.4 20.6 20.6 21.6
Hindustan Unilever 21,311 37.2 33.6 27.9 24.5 106.7 88.3
ITC 41,914 29.8 25.0 19.3 16.2 36.4 38.8
Nestle Ltd 7,564 39.2 32.1 22.6 18.9 57.7 53.3
Median - 34.0 27.7 23.3 19.0 37.6 38.3
AVERAGE - 34.4 28.9 23.5 19.7 55.5 51.8
Source: Edelweiss research
Cash flow metrics
Year to March FY12 FY13 FY14E FY15E
Operating cash flow 8,561 10,989 16,966 16,603
Investing cash flow (7,645) (7,970) (5,908) (2,000)
Financing cash flow (3,266) (6,007) (6,265) (9,123)
Net cash flow (2,350) (2,989) 4,793 5,479
Capex (6,903) (7,230) (5,908) (2,000)
Dividends paid (4,459) (5,155) (6,105) (7,668)
Profitability & efficiency ratios
Year to March FY12 FY13 FY14E FY15E
ROAE (%) 40.1 36.3 35.0 36.3
ROACE (%) 52.5 46.0 43.7 44.7
Inventory day 91 97 92 93
Debtors days 26 29 26 27
Payable days 74 77 76 77
Cash conversion cycle (days) 43 50 42 43
Current ratio 1.4 1.4 1.5 1.7
Debt/EBITDA 0.2 0.1 0.1 0.1
Interest coverage 36.5 46.2 64.3 95.5
Operating ratios
Year to March FY12 FY13 FY14E FY15E
Total asset turnover 3.2 3.0 3.0 3.0
Fixed asset turnover 6.0 5.1 4.9 5.4
Equity turnover 3.9 3.6 3.5 3.4
Valuation parameters
Year to March FY12 FY13 FY14E FY15E
Diluted EPS (INR) 10.3 11.6 13.6 17.1
Y-o-Y growth (%) 17.3 12.7 17.3 25.6
CEPS (INR) 11.9 13.7 16.2 19.8
Diluted PE (x) 43.3 38.4 32.7 26.1
Price/BV (x) 15.6 12.6 10.5 8.6
EV/Sales (x) 4.4 3.8 3.2 2.7
EV/EBITDA (x) 28.0 24.3 20.4 16.9
Dividend yield (%) 0.9 1.0 1.2 1.5
Balance sheet (INR mn)
As on 31st March FY12 FY13 FY14E FY15E
Equity capital 959 959 959 959
Reserves & surplus 26,526 32,884 39,842 48,582
Shareholders funds 27,485 33,843 40,801 49,541
Minority interest (BS) 1,367 1,608 1,998 2,488
Borrowings 3,411 2,510 2,660 1,460
Deferred tax liability 928 1,544 1,544 1,544
Sources of funds 33,191 39,504 47,003 55,032
Tangible assets 12,340 23,657 23,548 23,448Intangible assets 251 311 311 311
CWIP (incl. intangible) 6,171 592 4,500 4,500
Total net fixed assets 18,761 24,560 28,359 28,258
Goodwill on consolidation 415 442 442 442
Non current investments 697 1,501 1,501 1,501
Current Investments 2,850 1,306 1,306 1,306
Cash and equivalents 6,243 7,520 12,313 17,792
Inventories 15,989 18,303 19,113 22,705
Sundry debtors 7,813 9,809 9,278 11,347
Loans and advances 3,294 3,211 3,211 3,211
Other current assets 1,059 1,215 1,215 1,215
Total current assets (ex cash) 28,155 32,538 32,818 38,477
Trade payable 12,625 14,416 15,789 18,799
Others current liabilities 11,306 13,946 13,946 13,946
Net current assets (ex cash) 4,225 4,176 3,082 5,733
Uses of funds 33,191 39,504 47,003 55,032
Book value per share (INR) 28.7 35.3 42.5 51.6
Free cash flow (INR mn)
Year to March FY12 FY13 FY14E FY15E
Net profit 9,887 11,139 13,064 16,408
Add : Non cash charge 1,940 2,369 2,809 2,846
Gross cash flow 11,827 13,508 15,873 19,253
Less: Changes in WC 3,266 2,519 (1,094) 2,651
Operating cash flow 8,561 10,989 16,966 16,603
Less: Capex 6,903 7,230 5,908 2,000
Free cash flow 1,658 3,759 11,058 14,603

12 Edelweiss Securities Limited
Consumer Goods
Top 10 holdings
Perc. Holding Perc. Holding
Ojasvi Trading Pvt Ltd 4.90 Life Insurance Corp Of India 4.63
Oppenheimerfunds Incorporated 1.83 Aberdeen Asset Management Plc 1.63
Virtus Emerging Markets 1.02 Harris Trust & Savings Bank 1.02
Vanguard Group Inc 0.89 Vontobel Asset Management Ag 0.73
JP Morgan Chase & Co 0.56 Blackrock Fund Advisors 0.45
*as per last available data
Insider Trades Reporting Data Acquired / Seller B/S Qty Traded 20 Mar 2013 Geetanjali Trading & Investmen Sell 26455 20 Mar 2013 Smiti Holding & Trading Compan Buy 26455 14 Mar 2013 Smiti Holding & Trading Compan Buy 12000020 Feb 2013 Jalaj A Dani Sell 120000
*in last one year
Bulk Deals Data Acquired / Seller B/S Qty Traded Price No Data Available
*in last one year
Additional Data
Directors Data Ashwin Choksi Non-executive Chairman Ashwin Dani Non-executive Vice ChairmanAbhay Vakil Non-executive Director K.B.S. Anand MD & CEO Mahendra Choksi Non-executive Director Amar Vakil Non-executive Director Mrs Ina Dani Non-executive Director Ms. Tarjani Vakil Non-Executive Independent DirectorDipankar Basu Non-Executive Independent Director Deepak Satwalekar Non-Executive Independent DirectorR. A. Shah Non-Executive Independent Director S. Sivaram Non-Executive Independent DirectorMahendra Shah Non-Executive Independent Director S. Ramadorai Non-Executive Independent DirectorM. K. Sharma Non-Executive Independent Director
Auditors - Shah & Co- Chareted Accountants, B S R & Associates - Charted Accountants
*as per last annual report

13 Edelweiss Securities Limited
Company Absolute
reco
Relative
reco
Relative
risk
Company Absolute
reco
Relative
reco
Relative
Risk
Asian Paints BUY SP M Bajaj Corp BUY SP M
Colgate HOLD SP M Dabur BUY SO M
Emami BUY SP H GlaxoSmithKline Consumer
Healthcare
HOLD SP M
Godrej Consumer BUY SO H Hindustan Unilever HOLD SU L
ITC BUY SO L Marico BUY SO M
Nestle Ltd HOLD SP L United Spirits BUY SO H
RATING & INTERPRETATION
ABSOLUTE RATING
Ratings Expected absolute returns over 12 months
Buy More than 15%
Hold Between 15% and - 5%
Reduce Less than -5%
RELATIVE RETURNS RATING
Ratings Criteria
Sector Outperformer (SO) Stock return > 1.25 x Sector return
Sector Performer (SP) Stock return > 0.75 x Sector return
Stock return < 1.25 x Sector return
Sector Underperformer (SU) Stock return < 0.75 x Sector return
Sector return is market cap weighted average return for the coverage universe within the sector
RELATIVE RISK RATING
Ratings Criteria
Low (L) Bottom 1/3rd percentile in the sector
Medium (M) Middle 1/3rd percentile in the sector
High (H) Top 1/3rd percentile in the sector
Risk ratings are based on Edelweiss risk model
SECTOR RATING
Ratings Criteria
Overweight (OW) Sector return > 1.25 x Nifty return
Equalweight (EW) Sector return > 0.75 x Nifty return
Sector return < 1.25 x Nifty return
Underweight (UW) Sector return < 0.75 x Nifty return

14 Edelweiss Securities Limited
Consumer Goods
Edelweiss Securities Limited, Edelweiss House, off C.S.T. Road, Kalina, Mumbai – 400 098. Board: (91-22) 4009 4400, Email: [email protected]
Vikas Khemani Head Institutional Equities [email protected] +91 22 2286 4206
Nischal Maheshwari Co-Head Institutional Equities & Head Research [email protected] +91 22 4063 5476
Nirav Sheth Head Sales [email protected] +91 22 4040 7499
Coverage group(s) of stocks by primary analyst(s): Consumer Goods Asian Paints, Bajaj Corp, Colgate, Dabur, Godrej Consumer, Emami, Hindustan Unilever, ITC, Marico, Nestle Ltd, GlaxoSmithKline Consumer Healthcare, United Spirits
Distribution of Ratings / Market Cap
Edelweiss Research Coverage Universe
Rating Distribution* 127 44 8 180* 1 stocks under review
Market Cap (INR) 112 54 14
Date Company Title Price (INR) Recos
Recent Research
28-Aug-13 Godrej Consumer Products
Poised to scale growth terrain; Visit Note
806 Buy
22-Aug-13 Consumer Goods
Slower sales; improving margin; Result Review
13-Aug-13 Marico Soaring high: Volumes getting back on track; Result Update
203 Buy
> 50bn Between 10bn and 50 bn < 10bn
Buy Hold Reduce Total
Rating Interpretation
Buy appreciate more than 15% over a 12-month period
Hold appreciate up to 15% over a 12-month period
Reduce depreciate more than 5% over a 12-month period
Rating Expected to

15 Edelweiss Securities Limited
Asian Paints
DISCLAIMER General Disclaimer:
This report has been prepared by Edelweiss Securities Limited (Edelweiss). Edelweiss, its holding company and associate companies are a full service, integrated investment banking, portfolio management and brokerage group. Our research analysts and sales persons provide important input into our investment banking activities. This report does not constitute an offer or solicitation for the purchase or sale of any financial instrument or as an official confirmation of any transaction. The information contained herein is from publicly available data or other sources believed to be reliable, but we do not represent that it is accurate or complete and it should not be relied on as such. Edelweiss or any of its affiliates/ group companies shall not be in any way responsible for any loss or damage that may arise to any person from any inadvertent error in the information contained in this report. This report is provided for assistance only and is not intended to be and must not alone be taken as the basis for an investment decision. The user assumes the entire risk of any use made of this information. Each recipient of this report should make such investigation as it deems necessary to arrive at an independent evaluation of an investment in the securities of companies referred to in this report (including the merits and risks involved), and should consult his own advisors to determine the merits and risks of such investment. The investment discussed or views expressed may not be suitable for all investors. We and our affiliates, group companies, officers, directors, and employees may: (a) from time to time, have long or short positions in, and buy or sell the securities thereof, of company (ies) mentioned herein or (b) be engaged in any other transaction involving such securities and earn brokerage or other compensation or act as advisor or lender/borrower to such company (ies) or have other potential conflict of interest with respect to any recommendation and related information and opinions. This information is strictly confidential and is being furnished to you solely for your information. This information should not be reproduced or redistributed or passed on directly or indirectly in any form to any other person or published, copied, in whole or in part, for any purpose. This report is not directed or intended for distribution to, or use by, any person or entity who is a citizen or resident of or located in any locality, state, country or other jurisdiction, where such distribution, publication, availability or use would be contrary to law, regulation or which would subject Edelweiss and affiliates/ group companies to any registration or licensing requirements within such jurisdiction. The distribution of this report in certain jurisdictions may be restricted by law, and persons in whose possession this report comes, should inform themselves about and observe, any such restrictions. The information given in this report is as of the date of this report and there can be no assurance that future results or events will be consistent with this information. This information is subject to change without any prior notice. Edelweiss reserves the right to make modifications and alterations to this statement as may be required from time to time. However, Edelweiss is under no obligation to update or keep the information current. Nevertheless, Edelweiss is committed to providing independent and transparent recommendation to its client and would be happy to provide any information in response to specific client queries. Neither Edelweiss nor any of its affiliates, group companies, directors, employees, agents or representatives shall be liable for any damages whether direct, indirect, special or consequential including lost revenue or lost profits that may arise from or in connection with the use of the information. Past performance is not necessarily a guide to future performance. The disclosures of interest statements incorporated in this report are provided solely to enhance the transparency and should not be treated as endorsement of the views expressed in the report. Edelweiss Securities Limited generally prohibits its analysts, persons reporting to analysts and their dependents from maintaining a financial interest in the securities or derivatives of any companies that the analysts cover. The information provided in these reports remains, unless otherwise stated, the copyright of Edelweiss. All layout, design, original artwork, concepts and other Intellectual Properties, remains the property and copyright Edelweiss and may not be used in any form or for any purpose whatsoever by any party without the express written permission of the copyright holders. Analyst Certification:
The analyst for this report certifies that all of the views expressed in this report accurately reflect his or her personal views about the subject company or companies and its or their securities, and no part of his or her compensation was, is or will be, directly or indirectly related to specific recommendations or views expressed in this report. Analyst holding in the stock: No. Edelweiss shall not be liable for any delay or any other interruption which may occur in presenting the data due to any reason including network (Internet) reasons or snags in the system, break down of the system or any other equipment, server breakdown, maintenance shutdown, breakdown of communication services or inability of the Edelweiss to present the data. In no event shall the Edelweiss be liable for any damages, including without limitation direct or indirect, special, incidental, or consequential damages, losses or expenses arising in connection with the data presented by the Edelweiss through this presentation.

16 Edelweiss Securities Limited
Consumer Goods
Access the entire repository of Edelweiss Research on www.edelresearch.com
Disclaimer for U.S. Persons
This research report is a product of Edelweiss Securities Limited, which is the employer of the research analyst(s) who has prepared the research report. The research analyst(s) preparing the research report is/are resident outside the United States (U.S.) and are not associated persons of any U.S. regulated broker-dealer and therefore the analyst(s) is/are not subject to supervision by a U.S. broker-dealer, and is/are not required to satisfy the regulatory licensing requirements of FINRA or required to otherwise comply with U.S. rules or regulations regarding, among other things, communications with a subject company, public appearances and trading securities held by a research analyst account.
This report is intended for distribution by Edelweiss Securities Limited only to "Major Institutional Investors" as defined by Rule 15a-6(b)(4) of the U.S. Securities and Exchange Act, 1934 (the Exchange Act) and interpretations thereof by U.S. Securities and Exchange Commission (SEC) in reliance on Rule 15a 6(a)(2). If the recipient of this report is not a Major Institutional Investor as specified above, then it should not act upon this report and return the same to the sender. Further, this report may not be copied, duplicated and/or transmitted onward to any U.S. person, which is not the Major Institutional Investor.
In reliance on the exemption from registration provided by Rule 15a-6 of the Exchange Act and interpretations thereof by the SEC in order to conduct certain business with Major Institutional Investors, Edelweiss Securities Limited has entered into an agreement with a U.S. registered broker-dealer, Enclave Capital, LLC ("Enclave").
Transactions in securities discussed in this research report should be effected through Enclave Capital, LLC.
Disclaimer for U.K. Persons
The contents of this research report have not been approved by an authorised person within the meaning of the Financial Services and Markets Act 2000 ("FSMA").
In the United Kingdom, this research report is being distributed only to and is directed only at (a) persons who have professional experience in matters relating to investments falling within Article 19(5) of the FSMA (Financial Promotion) Order 2005 (the “Order”); (b) persons falling within Article 49(2)(a) to (d) of the Order (including high net worth companies and unincorporated associations); and (c) any other persons to whom it may otherwise lawfully be communicated (all such persons together being referred to as “relevant persons”).
This research report must not be acted on or relied on by persons who are not relevant persons. Any investment or investment activity to which this research report relates is available only to relevant persons and will be engaged in only with relevant persons. Any person who is not a relevant person should not act or rely on this research report or any of its contents. This research report must not be distributed, published, reproduced or disclosed (in whole or in part) by recipients to any other person.
Disclaimer for Canadian Persons
This research report is a product of Edelweiss Securities Limited ("ESL"), which is the employer of the research analysts who have prepared the research report. The research analysts preparing the research report are resident outside the Canada and are not associated persons of any Canadian registered adviser and/or dealer and, therefore, the analysts are not subject to supervision by a Canadian registered adviser and/or dealer, and are not required to satisfy the regulatory licensing requirements of the Ontario Securities Commission, other Canadian provincial securities regulators, the Investment Industry Regulatory Organization of Canada and are not required to otherwise comply with Canadian rules or regulations regarding, among other things, the research analysts' business or relationship with a subject company or trading of securities by a research analyst.
This report is intended for distribution by ESL only to "Permitted Clients" (as defined in National Instrument 31-103 ("NI 31-103")) who are resident in the Province of Ontario, Canada (an "Ontario Permitted Client"). If the recipient of this report is not an Ontario Permitted Client, as specified above, then the recipient should not act upon this report and should return the report to the sender. Further, this report may not be copied, duplicated and/or transmitted onward to any Canadian person.
ESL is relying on an exemption from the adviser and/or dealer registration requirements under NI 31-103 available to certain international advisers and/or dealers. Please be advised that (i) ESL is not registered in the Province of Ontario to trade in securities nor is it registered in the Province of Ontario to provide advice with respect to securities; (ii) ESL's head office or principal place of business is located in India; (iii) all or substantially all of ESL's assets may be situated outside of Canada; (iv) there may be difficulty enforcing legal rights against ESL because of the above; and (v) the name and address of the ESL's agent for service of process in the Province of Ontario is: Bamac Services Inc., 181 Bay Street, Suite 2100, Toronto, Ontario M5J 2T3 Canada.
Copyright 2009 Edelweiss Research (Edelweiss Securities Ltd). All rights reserved