ASIAN JOURNAL OF RESEARCH IN BUSINESS … · Due to this they offer the benefit of trading like a...
29
Volume 2, Issue 6 (June, 2012) ISSN: 2249‐7307 AJRBEM Journal of Asian Research Consortium 48 http://www.aijsh.org A Peer Reviewed International Journal of Asian Research Consortium AJRBEM: ASIAN JOURNAL OF RESEARCH IN BUSINESS ECONOMICS AND MANAGEMENT EXCHANGE TRADED FUNDS: AN INDIAN PERSPECTIVE MR.PRASANNA K.BARAL* *Sr.Faculty in Commerce, Kalinga Bharati Resdential College, Pira Bazar, Bhanpur, Gopalpur, Cuttack, Odisha. ABSTRACT The last two decades witnessed new product innovations in the financial markets across the globe. Designing of new innovative financial products which promise to meet investors’ return expectations as market conditions and global risk appetite change is of a great challenge for the professionals in the financial markets. In recent years, investors are looking for alternative investment vehicles to structured products which gave birth to a new kind of cost and tax-efficient financial instrument, i.e. Exchange Traded Funds popularly known as, ETFs. The investment professionals are always in search of new and sophisticated investment strategies and ETFs can provide them new ways to form building blocks of investment strategies. The present paper studies the growth trend of ETFs and a comparative study of Index based ETFs and Gold based ETFs in India. KEYWORDS: Index based ETFs; Gold based ETFs, Sophisticated investment strategies,structured product. ______________________________________________________________________________ 1. INTRODUCTION ETFs are one of the most innovative new financial products to emerge from the financial industry in the last two decades. Since the launch of the first ETF in the Canada in 1990, ETFs have opened a new panorama of investment opportunities. Exchange-traded funds (ETFs) have gained a wider acceptance as financial instruments whose unique advantages over mutual funds have caught the eye of many investors. These instruments are beneficial for investors that find it difficult to master the tricks of the trade of analyzing and picking stocks for their portfolio.
Transcript of ASIAN JOURNAL OF RESEARCH IN BUSINESS … · Due to this they offer the benefit of trading like a...
Volume 2, Issue 6 (June, 2012) ISSN: 2249‐7307
AJRBEM
Journal of Asian Research Consortium 48
http://w
ww.aijsh.org
A P e e r R e v i e w e d I n t e r n a t i o n a l J o u r n a l o f A s i a n R e s e a r c h C o n s o r t i u m
AJRBEM:
A S I A N J O U R N A L O F R E S E A R C H I N B U S I N E S S
E C O N O M I C S A N D M A N A G E M E N T
EXCHANGE TRADED FUNDS: AN INDIAN PERSPECTIVE
MR.PRASANNA K.BARAL*
*Sr.Faculty in Commerce,
Kalinga Bharati Resdential College, Pira Bazar, Bhanpur,
Gopalpur, Cuttack, Odisha.
ABSTRACT The last two decades witnessed new product innovations in the financial markets across the globe. Designing of new innovative financial products which promise to meet investors’ return expectations as market conditions and global risk appetite change is of a great challenge for the professionals in the financial markets. In recent years, investors are looking for alternative investment vehicles to structured products which gave birth to a new kind of cost and tax-efficient financial instrument, i.e. Exchange Traded Funds popularly known as, ETFs. The investment professionals are always in search of new and sophisticated investment strategies and ETFs can provide them new ways to form building blocks of investment strategies. The present paper studies the growth trend of ETFs and a comparative study of Index based ETFs and Gold based ETFs in India. KEYWORDS: Index based ETFs; Gold based ETFs, Sophisticated investment strategies,structured product.
______________________________________________________________________________
1. INTRODUCTION
ETFs are one of the most innovative new financial products to emerge from the financial industry in the last two decades. Since the launch of the first ETF in the Canada in 1990, ETFs have opened a new panorama of investment opportunities. Exchange-traded funds (ETFs) have gained a wider acceptance as financial instruments whose unique advantages over mutual funds have caught the eye of many investors. These instruments are beneficial for investors that find it difficult to master the tricks of the trade of analyzing and picking stocks for their portfolio.
Volume 2, Issue 6 (June, 2012) ISSN: 2249‐7307
AJRBEM
Journal of Asian Research Consortium 49
http://w
ww.aijsh.org
Exchange Traded Funds are essentially Index Funds that are listed and traded on exchanges like stocks. Until the development of ETFs, this was not possible before. Globally, ETFs have opened a whole new way of investment opportunities to Retail as well as Institutional Money Managers. They enable investors to gain broad exposure to entire stock markets in different Countries and specific sectors with relative ease, on a real-time basis and at a lower cost than many other forms of investments.
2. OBJECTIVES
1: To study the concept of Exchange Traded Funds.
2: To study the growth trend of Exchange Traded Funds.
3: To make a comparative study of Index based ETFs Vis-À-Vis Gold based ETFs in Indian.
3. LITERATURE REVIEW
Kostovetsky (2003), studied relative performance of the ETFs and Index mutual funds from the investors’ point of view. He reported key areas of differences between the two to lie in management fees, shareholders transaction fees, taxation efficiency, and the qualitative factors transaction convenience, short selling, and ability to margin. His core finding was that Index mutual funds are better suited for small investors and ETFs are preferable by large investors.
Johnson, W.L. (2008), studied 20 foreign country ETFs and the underlying index returns from 1997 to 2006 for the existence and sources of daily and monthly tracking errors. He found except for one case, market segmentation/integration of the foreign country was a significant source of tracking error. He also concluded “variables such as foreign index positive returns relative to the US index and whether the foreign exchange trades 12 simultaneously with the US markets were significant explanatory variables in the correlation coefficients between ETFs and their underlying home index”.
Rompotis (2009a), evaluated performance and trading characteristics of 73 iShare ETFs from October 3, 2005 to September 29, 2006 covering 250 daily observations. The finding was that iShares fail to accurately replicate the performance of their underlying indexes, they trade at a premium to their NAV, their tracking errors 13 are strongly correlated with the expenses and risk, and that the premium was correlated positively with tracking error and negatively with the volume.
Rompotis (2009b), studied 20 vanguard ETFs and 12 Vanguard index mutual funds belonging to the same family in order to examine the existence and reasons for interfamily competition between ETFs and Index mutual funds sponsored by the same entity. The study’s main findings were that ETFs and index mutual funds on average present similar returns and risks, both of these investment vehicles produce lower returns than their benchmarks, they both have low tracking errors, and their tracking errors are positively correlated with expenses.
Volume 2, Issue 6 (June, 2012) ISSN: 2249‐7307
AJRBEM
Journal of Asian Research Consortium 50
http://w
ww.aijsh.org
4. RESEARCH METHODOLOGY
The data for the study has been derived basically from secondary sources. The secondary sources include internet, journals, magazines and publications of various research bodies like, SEBI, ICAR, NSE, BSE and Handbook of BlackRock. The parameters for evaluating the performance are Risk, Return, Expenses Ratio, and Reward to Variability. The statistical tools like Standard Deviation, Beta, Sharpe Ratio and Treynors ratio are used for data analysis. The data has been properly analysed and interpreted to draw conclusion and inferences.
5. EXCHANGE TRADED FUNDS: CONCEPTUAL BACKGROUND
ETFs are index tracking open ended registered funds or unit investment trusts that invest in a portfolio of stocks designed to track the performance and dividend yield of a specific index. They are essentially mutual fund schemes or index funds that are listed and traded on exchanges like stocks. Due to this they offer the benefit of trading like a stock. They are priced continually and can be bought or sold throughout the trading day.
An ETF is a basket of stocks that reflects the composition of an Index, like S&P CNX Nifty or BSE Sensex. The ETFs trading value is based on the net asset value of the underlying stocks that it represents. Think of it as a Mutual Fund that you can buy and sell in real-time at a price those changes throughout the day. As it tracks a Benchmark Index, the return expectation is the same as that of the Index. For example, if for a particular period, say from 1st February 2012 to 31st of March 2012, the ROI on Nifty is 10%, then the NAV of the ETF that tracks Nifty should also be around 10%. The minor difference in return between the NAV and the Benchmark Indices could be because of the fact that there would be some cost involved in managing the ETF.
CREATION AND REDEMPTION OF ETF
ETFs are different from Mutual funds in the sense that ETF units are not sold to the public for cash. Instead, the Asset Management Company that sponsors the ETF (Fund) takes the shares of companies comprising the index from various categories of investors like authorized participants, large investors and institutions. In turn, it issues them a large block of ETF units. Since dividend may have accumulated for the stocks at any point in time, a cash component to that extent is also taken from such investors. In other words, a large block of ETF units called a "Creation Unit" is exchanged for a "Portfolio Deposit" of stocks and "Cash Component".
The number of outstanding ETF units is not limited, as with traditional mutual funds. It may increase if investors deposit shares to create ETF units; or it may reduce on a day if some ETF holders redeem their ETF units for the underlying shares. These transactions are conducted by sending creation / redemption instructions to the Fund. The Portfolio Deposit closely approximates the proportion of the stocks in the index together with a specified amount of Cash Component. This "in-kind" creation / redemption facility ensures that ETFs trade close to their fair value at any given time.
Volume 2, Issue 6 (June, 2012) ISSN: 2249‐7307
AJRBEM
Journal of Asian Research Consortium 51
http://w
ww.aijsh.org
Some investors may prefer to hold the creation units in their portfolios. While others may break-up the creation units and sell on the exchanges, where individual investors may purchase them just like any other shares.
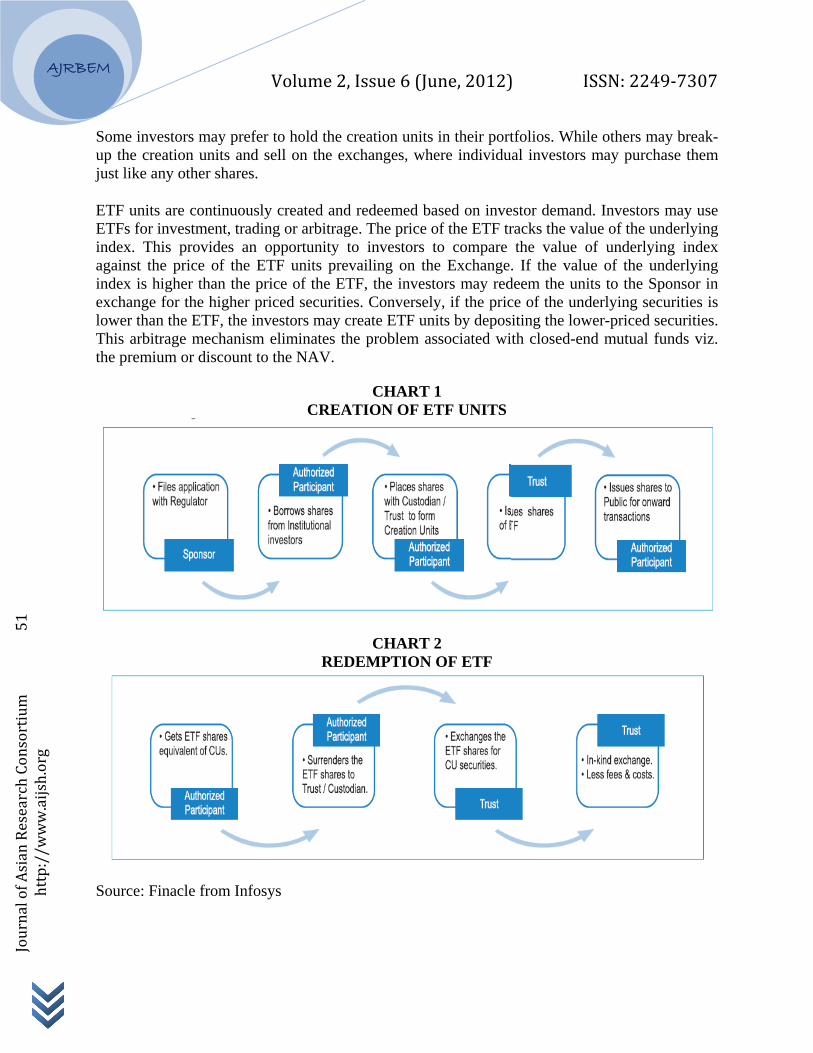
ETF units are continuously created and redeemed based on investor demand. Investors may use ETFs for investment, trading or arbitrage. The price of the ETF tracks the value of the underlying index. This provides an opportunity to investors to compare the value of underlying index against the price of the ETF units prevailing on the Exchange. If the value of the underlying index is higher than the price of the ETF, the investors may redeem the units to the Sponsor in exchange for the higher priced securities. Conversely, if the price of the underlying securities is lower than the ETF, the investors may create ETF units by depositing the lower-priced securities. This arbitrage mechanism eliminates the problem associated with closed-end mutual funds viz. the premium or discount to the NAV.
CHART 1 CREATION OF ETF UNITS
CHART 2 REDEMPTION OF ETF
Source: Finacle from Infosys
Volume 2, Issue 6 (June, 2012) ISSN: 2249‐7307
AJRBEM
Journal of Asian Research Consortium 52
http://w
ww.aijsh.org
ETFS AND OTHER MUTUAL FUNDS
In essence, ETFs trade like stocks and therefore offer a degree of flexibility unavailable with traditional mutual funds. Specifically, investors can trade ETFs throughout the trading day as in stocks. In comparison, in a traditional mutual fund, investors can purchase units only at the fund's NAV, which is published at the end of each trading day. In fact, investors cannot purchase ETFs at the closing NAV. This difference gives rise to an important advantage of ETFs over traditional funds: ETFs are immediately tradable and consequently, the risk of price differential between the time of investment and time of trade is substantially less in the case of ETFs.
ETFs are cheaper than traditional mutual funds and index funds in terms of fees. However, while investing in an ETF, an investor pays a commission to the broker. The tracking error of ETFs is generally lower than traditional index funds due to the "in-kind" creation / redemption facility and the low expense ratio. This "in-kind" creation / redemption facility ensures that long-term investors do not suffer at the cost of short-term investor activity. ETFs can be bought / sold through trading terminals anywhere across the country. The following Table 1 presents a comparative view of ETFs and other funds.
TABLE 1
ETFS VS. OPEN ENDED FUNDS VS. CLOSE ENDED FUNDS
Parameter Open Ended Fund Closed Ended Fund Exchange Traded Fund
Fund Size Flexible Fixed Flexible
NAV Daily Daily Real Time
Liquidity Provider
Fund itself Stock Market Stock Market/Fund itself
Sale Price At NAV plus load, if any
Significant Premium/Discount to NAV
Very close to actual NAV of Scheme
Availability Fund itself Through Exchange where listed
Through Exchange where listed/Fund itself
Portfolio Disclosure
Monthly Monthly Daily/Real-time
Uses Equitising Cash - Equitising Cash,Hedging,Arbitrage
Intra-Day Trading
Not Possible Expensive Possible at low cost
Source: NSE
Volume 2, Issue 6 (June, 2012) ISSN: 2249‐7307
AJRBEM
Journal of Asian Research Consortium 53
http://w
ww.aijsh.org
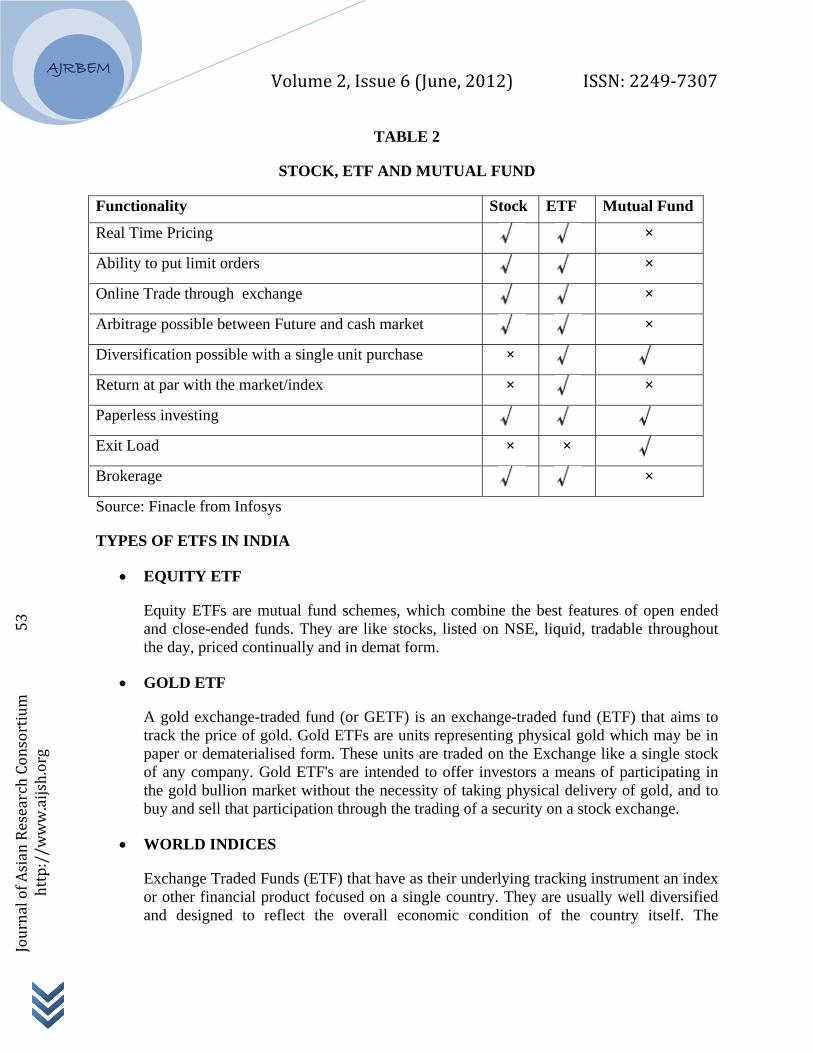
TABLE 2
STOCK, ETF AND MUTUAL FUND
Functionality Stock ETF Mutual Fund
Real Time Pricing ×
Ability to put limit orders ×
Online Trade through exchange ×
Arbitrage possible between Future and cash market ×
Diversification possible with a single unit purchase × Return at par with the market/index × ×
Paperless investing Exit Load × × Brokerage ×
Source: Finacle from Infosys
TYPES OF ETFS IN INDIA
• EQUITY ETF
Equity ETFs are mutual fund schemes, which combine the best features of open ended and close-ended funds. They are like stocks, listed on NSE, liquid, tradable throughout the day, priced continually and in demat form.
• GOLD ETF
A gold exchange-traded fund (or GETF) is an exchange-traded fund (ETF) that aims to track the price of gold. Gold ETFs are units representing physical gold which may be in paper or dematerialised form. These units are traded on the Exchange like a single stock of any company. Gold ETF's are intended to offer investors a means of participating in the gold bullion market without the necessity of taking physical delivery of gold, and to buy and sell that participation through the trading of a security on a stock exchange.
• WORLD INDICES
Exchange Traded Funds (ETF) that have as their underlying tracking instrument an index or other financial product focused on a single country. They are usually well diversified and designed to reflect the overall economic condition of the country itself. The
Volume 2, Issue 6 (June, 2012) ISSN: 2249‐7307
AJRBEM
Journal of Asian Research Consortium 54
http://w
ww.aijsh.org
underlying index chosen is often the major index of the principal exchange within the country.
• DEBT ETF
Debt ETFs that invest in bonds or debt securities are known as bond or debt ETFs. They thrive during economic recessions because investors pull their money out of the stock market and into bonds (for example, government treasury bonds or those issues by companies regarded as financially stable). These ETFs are linked to money or debt funds, with the aim of providing money market returns.
Liquid BeES (Goldman Sachs Liquid Exchange Traded Scheme) is the first money market ETF (Exchange Traded Fund) in the world. The investment objective of the Scheme is to provide money market returns. Liquid BeES will invest in a basket of call money, short-term government securities and money market instruments of short and medium maturities. It is listed and traded on the NSE - Capital Market Segment and is settled on a T+2 Rolling basis.
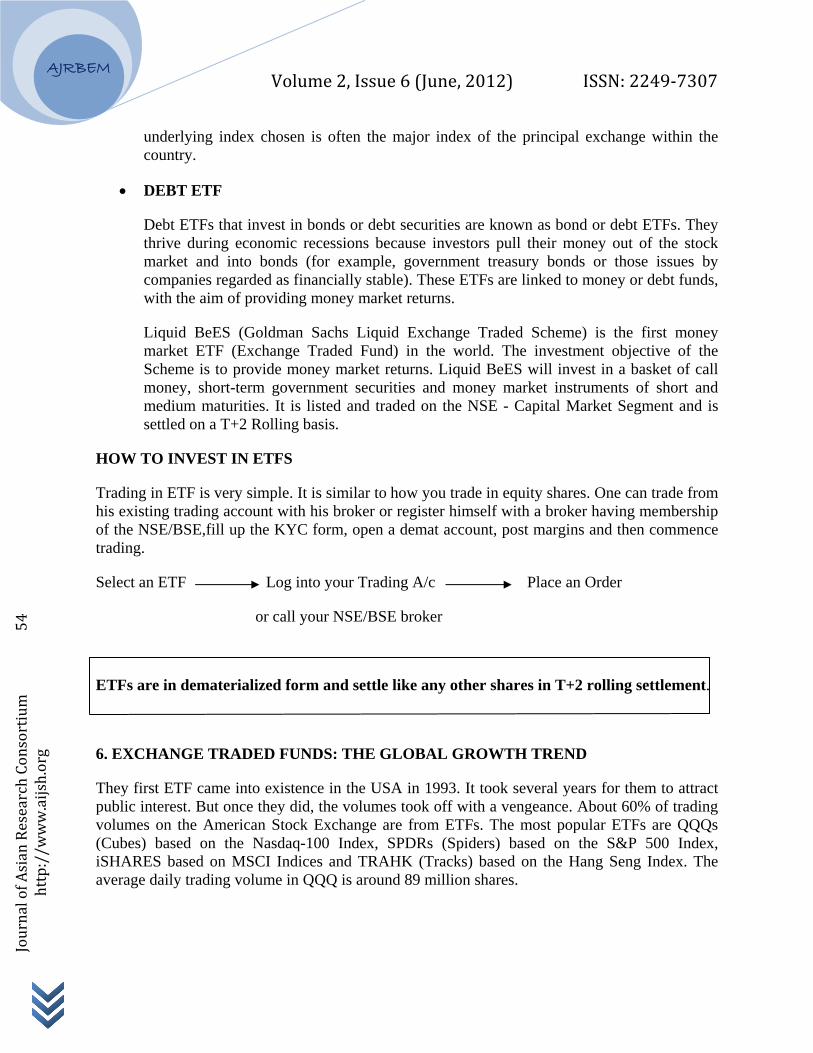
HOW TO INVEST IN ETFS
Trading in ETF is very simple. It is similar to how you trade in equity shares. One can trade from his existing trading account with his broker or register himself with a broker having membership of the NSE/BSE,fill up the KYC form, open a demat account, post margins and then commence trading.
Select an ETF Log into your Trading A/c Place an Order
or call your NSE/BSE broker
ETFs are in dematerialized form and settle like any other shares in T+2 rolling settlement.
6. EXCHANGE TRADED FUNDS: THE GLOBAL GROWTH TREND
They first ETF came into existence in the USA in 1993. It took several years for them to attract public interest. But once they did, the volumes took off with a vengeance. About 60% of trading volumes on the American Stock Exchange are from ETFs. The most popular ETFs are QQQs (Cubes) based on the Nasdaq-100 Index, SPDRs (Spiders) based on the S&P 500 Index, iSHARES based on MSCI Indices and TRAHK (Tracks) based on the Hang Seng Index. The average daily trading volume in QQQ is around 89 million shares.
Volume 2, Issue 6 (June, 2012) ISSN: 2249‐7307
AJRBEM
Journal of Asian Research Consortium 55
http://w
ww.aijsh.org
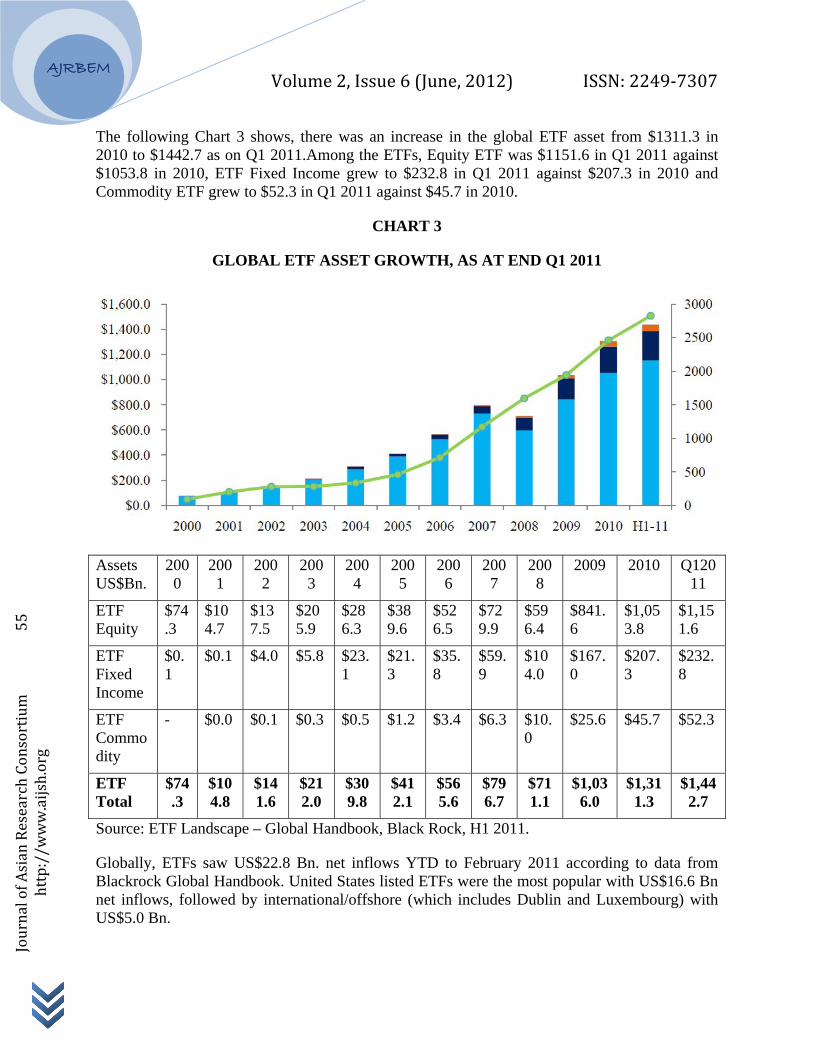
The following Chart 3 shows, there was an increase in the global ETF asset from $1311.3 in 2010 to $1442.7 as on Q1 2011.Among the ETFs, Equity ETF was $1151.6 in Q1 2011 against $1053.8 in 2010, ETF Fixed Income grew to $232.8 in Q1 2011 against $207.3 in 2010 and Commodity ETF grew to $52.3 in Q1 2011 against $45.7 in 2010.
CHART 3
GLOBAL ETF ASSET GROWTH, AS AT END Q1 2011
Assets US$Bn.
2000
2001
2002
2003
2004
2005
2006
2007
2008
2009 2010 Q12011
ETF Equity
$74.3
$104.7
$137.5
$205.9
$286.3
$389.6
$526.5
$729.9
$596.4
$841.6
$1,053.8
$1,151.6
ETF Fixed Income
$0.1
$0.1 $4.0 $5.8 $23.1
$21.3
$35.8
$59.9
$104.0
$167.0
$207.3
$232.8
ETF Commodity
- $0.0 $0.1 $0.3 $0.5 $1.2 $3.4 $6.3 $10.0
$25.6 $45.7 $52.3
ETF Total
$74.3
$104.8
$141.6
$212.0
$309.8
$412.1
$565.6
$796.7
$711.1
$1,036.0
$1,311.3
$1,442.7
Source: ETF Landscape – Global Handbook, Black Rock, H1 2011.
Globally, ETFs saw US$22.8 Bn. net inflows YTD to February 2011 according to data from Blackrock Global Handbook. United States listed ETFs were the most popular with US$16.6 Bn net inflows, followed by international/offshore (which includes Dublin and Luxembourg) with US$5.0 Bn.
Volume 2, Issue 6 (June, 2012) ISSN: 2249‐7307
AJRBEM
Journal of Asian Research Consortium 56
http://w
ww.aijsh.org
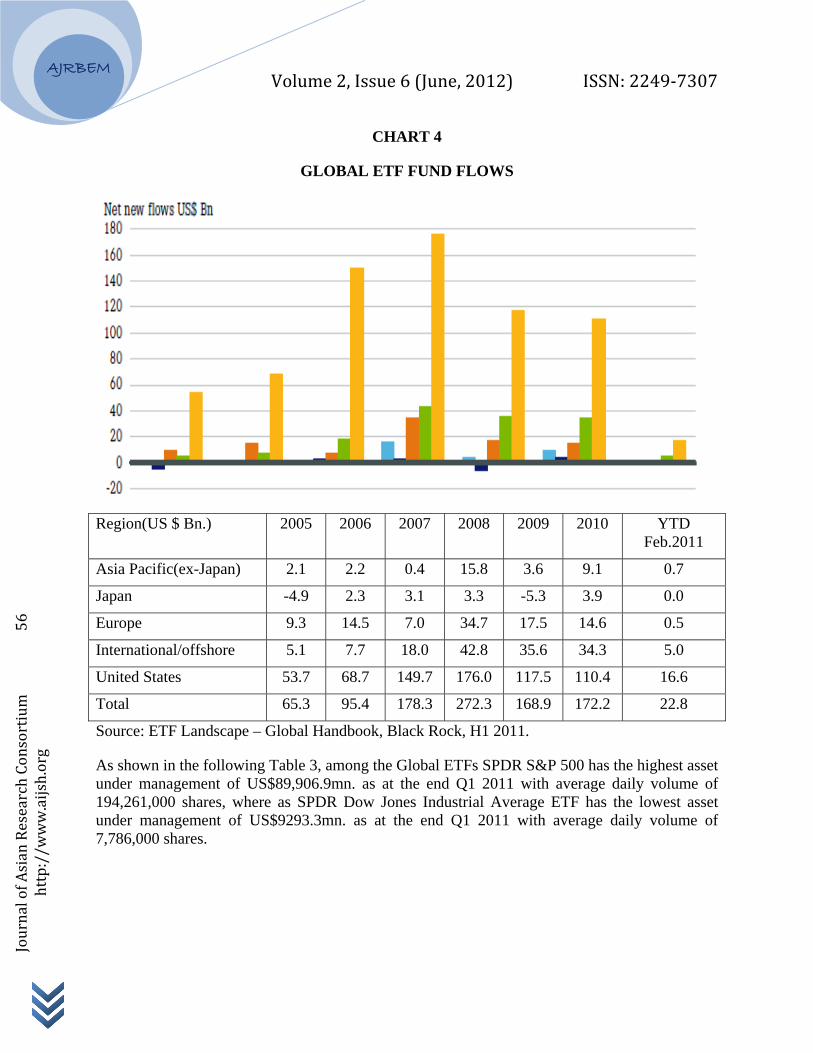
CHART 4
GLOBAL ETF FUND FLOWS
Region(US $ Bn.) 2005 2006 2007 2008 2009 2010 YTD Feb.2011
Asia Pacific(ex-Japan) 2.1 2.2 0.4 15.8 3.6 9.1 0.7
Japan -4.9 2.3 3.1 3.3 -5.3 3.9 0.0
Europe 9.3 14.5 7.0 34.7 17.5 14.6 0.5
International/offshore 5.1 7.7 18.0 42.8 35.6 34.3 5.0
United States 53.7 68.7 149.7 176.0 117.5 110.4 16.6
Total 65.3 95.4 178.3 272.3 168.9 172.2 22.8
Source: ETF Landscape – Global Handbook, Black Rock, H1 2011.
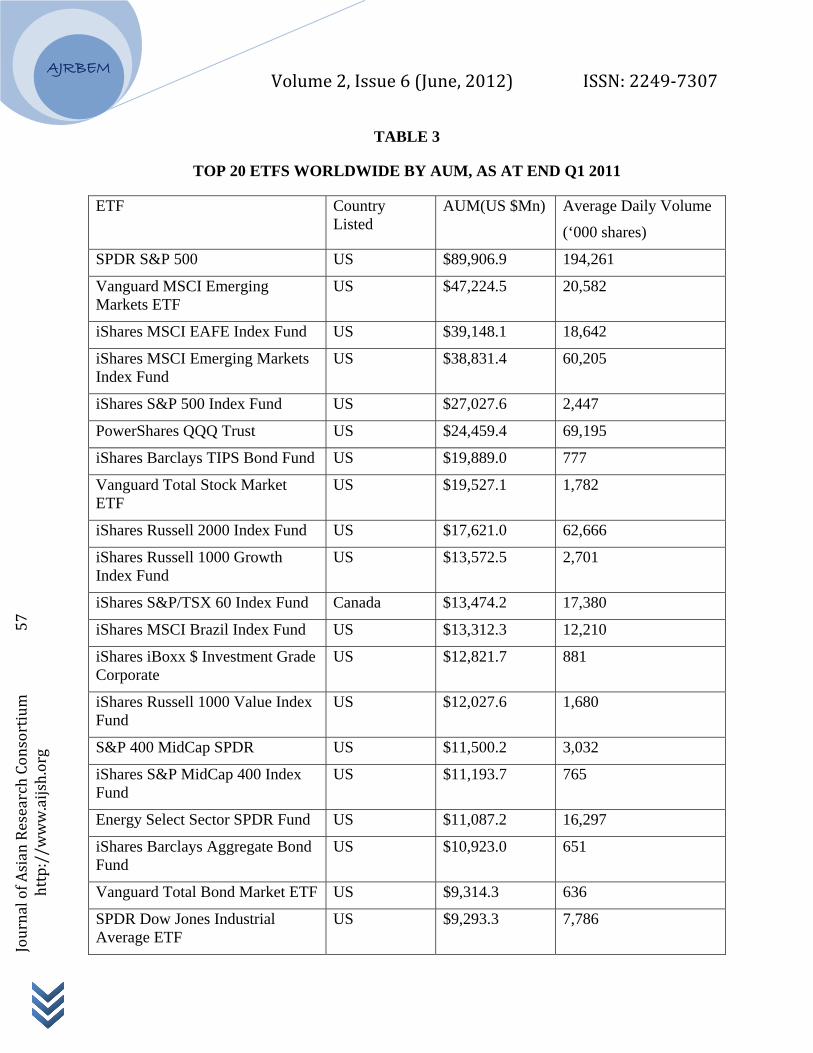
As shown in the following Table 3, among the Global ETFs SPDR S&P 500 has the highest asset under management of US$89,906.9mn. as at the end Q1 2011 with average daily volume of 194,261,000 shares, where as SPDR Dow Jones Industrial Average ETF has the lowest asset under management of US$9293.3mn. as at the end Q1 2011 with average daily volume of 7,786,000 shares.
Volume 2, Issue 6 (June, 2012) ISSN: 2249‐7307
AJRBEM
Journal of Asian Research Consortium 57
http://w
ww.aijsh.org
TABLE 3
TOP 20 ETFS WORLDWIDE BY AUM, AS AT END Q1 2011
ETF Country Listed
AUM(US $Mn) Average Daily Volume
(‘000 shares)
SPDR S&P 500 US $89,906.9 194,261
Vanguard MSCI Emerging Markets ETF
US $47,224.5 20,582
iShares MSCI EAFE Index Fund US $39,148.1 18,642
iShares MSCI Emerging Markets Index Fund
US $38,831.4 60,205
iShares S&P 500 Index Fund US $27,027.6 2,447
PowerShares QQQ Trust US $24,459.4 69,195
iShares Barclays TIPS Bond Fund US $19,889.0 777
Vanguard Total Stock Market ETF
US $19,527.1 1,782
iShares Russell 2000 Index Fund US $17,621.0 62,666
iShares Russell 1000 Growth Index Fund
US $13,572.5 2,701
iShares S&P/TSX 60 Index Fund Canada $13,474.2 17,380
iShares MSCI Brazil Index Fund US $13,312.3 12,210
iShares iBoxx $ Investment Grade Corporate
US $12,821.7 881
iShares Russell 1000 Value Index Fund
US $12,027.6 1,680
S&P 400 MidCap SPDR US $11,500.2 3,032
iShares S&P MidCap 400 Index Fund
US $11,193.7 765
Energy Select Sector SPDR Fund US $11,087.2 16,297
iShares Barclays Aggregate Bond Fund
US $10,923.0 651
Vanguard Total Bond Market ETF US $9,314.3 636
SPDR Dow Jones Industrial Average ETF
US $9,293.3 7,786
Volume 2, Issue 6 (June, 2012) ISSN: 2249‐7307
AJRBEM
Journal of Asian Research Consortium 58
http://w
ww.aijsh.org
Source: ETF Landscape – Global Handbook, Black Rock, H1 2011.
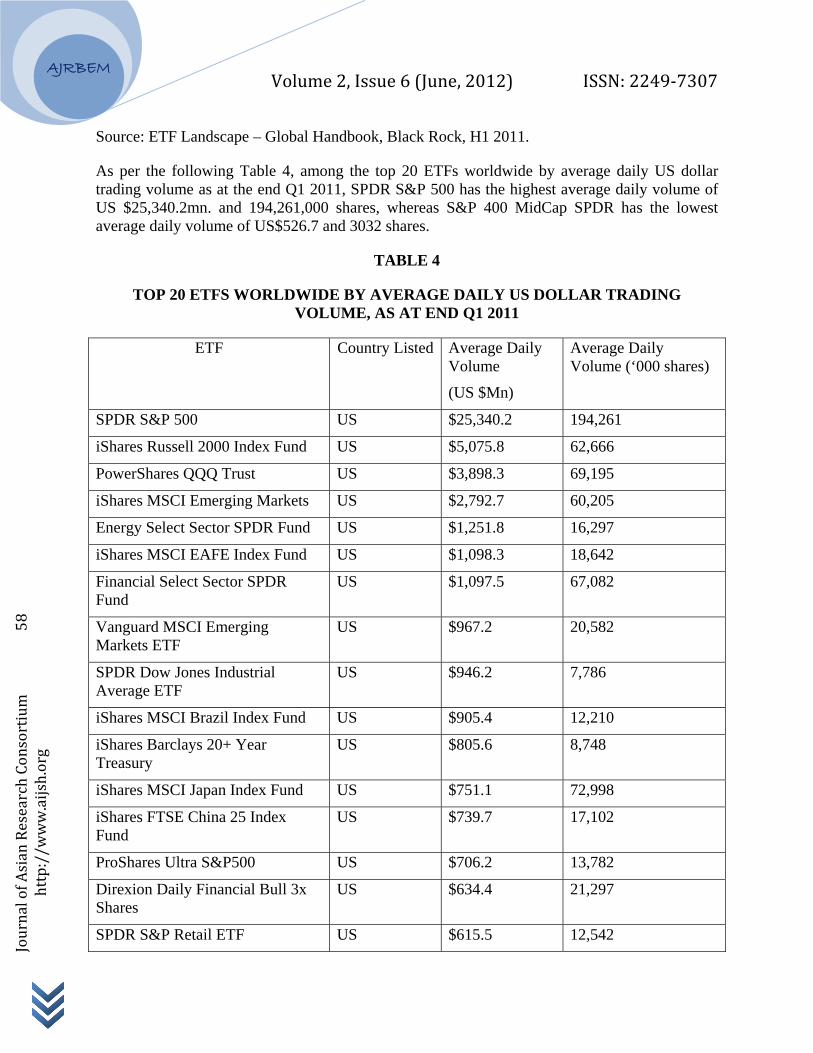
As per the following Table 4, among the top 20 ETFs worldwide by average daily US dollar trading volume as at the end Q1 2011, SPDR S&P 500 has the highest average daily volume of US $25,340.2mn. and 194,261,000 shares, whereas S&P 400 MidCap SPDR has the lowest average daily volume of US$526.7 and 3032 shares.
TABLE 4
TOP 20 ETFS WORLDWIDE BY AVERAGE DAILY US DOLLAR TRADING VOLUME, AS AT END Q1 2011
ETF Country Listed Average Daily Volume
(US $Mn)
Average Daily Volume (‘000 shares)
SPDR S&P 500 US $25,340.2 194,261
iShares Russell 2000 Index Fund US $5,075.8 62,666
PowerShares QQQ Trust US $3,898.3 69,195
iShares MSCI Emerging Markets US $2,792.7 60,205
Energy Select Sector SPDR Fund US $1,251.8 16,297
iShares MSCI EAFE Index Fund US $1,098.3 18,642
Financial Select Sector SPDR Fund
US $1,097.5 67,082
Vanguard MSCI Emerging Markets ETF
US $967.2 20,582
SPDR Dow Jones Industrial Average ETF
US $946.2 7,786
iShares MSCI Brazil Index Fund US $905.4 12,210
iShares Barclays 20+ Year Treasury
US $805.6 8,748
iShares MSCI Japan Index Fund US $751.1 72,998
iShares FTSE China 25 Index Fund
US $739.7 17,102
ProShares Ultra S&P500 US $706.2 13,782
Direxion Daily Financial Bull 3x Shares
US $634.4 21,297
SPDR S&P Retail ETF US $615.5 12,542
Volume 2, Issue 6 (June, 2012) ISSN: 2249‐7307
AJRBEM
Journal of Asian Research Consortium 59
http://w
ww.aijsh.org
Direxion Daily Small Cap Bull 3x Shares
US $612.9 7,834
Industrial Select Sector SPDR Fund
US $601.7 16,477
ProShares UltraShort S&P500 US $587.3 26,818
S&P 400 MidCap SPDR US $526.7 3,032
Source: ETF Landscape – Global Handbook, Black Rock, H1 2011.
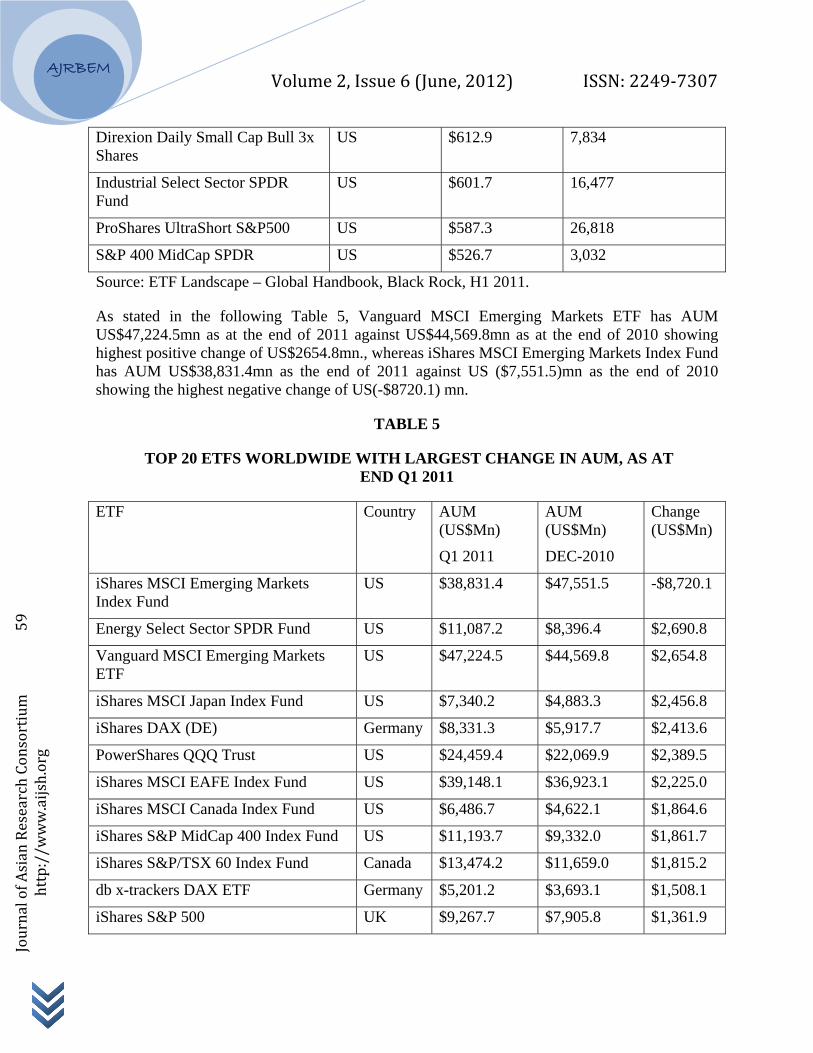
As stated in the following Table 5, Vanguard MSCI Emerging Markets ETF has AUM US$47,224.5mn as at the end of 2011 against US$44,569.8mn as at the end of 2010 showing highest positive change of US$2654.8mn., whereas iShares MSCI Emerging Markets Index Fund has AUM US$38,831.4mn as the end of 2011 against US ($7,551.5)mn as the end of 2010 showing the highest negative change of US(-$8720.1) mn.
TABLE 5
TOP 20 ETFS WORLDWIDE WITH LARGEST CHANGE IN AUM, AS AT END Q1 2011
ETF Country AUM (US$Mn)
Q1 2011
AUM (US$Mn)
DEC-2010
Change (US$Mn)
iShares MSCI Emerging Markets Index Fund
US $38,831.4 $47,551.5 -$8,720.1
Energy Select Sector SPDR Fund US $11,087.2 $8,396.4 $2,690.8
Vanguard MSCI Emerging Markets ETF
US $47,224.5 $44,569.8 $2,654.8
iShares MSCI Japan Index Fund US $7,340.2 $4,883.3 $2,456.8
iShares DAX (DE) Germany $8,331.3 $5,917.7 $2,413.6
PowerShares QQQ Trust US $24,459.4 $22,069.9 $2,389.5
iShares MSCI EAFE Index Fund US $39,148.1 $36,923.1 $2,225.0
iShares MSCI Canada Index Fund US $6,486.7 $4,622.1 $1,864.6
iShares S&P MidCap 400 Index Fund US $11,193.7 $9,332.0 $1,861.7
iShares S&P/TSX 60 Index Fund Canada $13,474.2 $11,659.0 $1,815.2
db x-trackers DAX ETF Germany $5,201.2 $3,693.1 $1,508.1
iShares S&P 500 UK $9,267.7 $7,905.8 $1,361.9
Volume 2, Issue 6 (June, 2012) ISSN: 2249‐7307
AJRBEM
Journal of Asian Research Consortium 60
http://w
ww.aijsh.org
iShares Russell 1000 Value Index Fund US $12,027.6 $10,697.1 $1,330.5
iShares MSCI Brazil Index Fund US $13,312.3 $12,012.5 $1,299.9
Market Vectors Russia ETF US $3,934.0 $2,638.5 $1,295.5
Vanguard Total Stock Market ETF US $19,527.1 $18,236.0 $1,291.1
Vanguard Dividend Appreciation ETF US $5,850.6 $4,608.9 $1,241.7
iShares S&P 500 Index Fund US $27,027.6 $25,799.2 $1,228.4
db x-trackers MSCI Emerging Market TRN Index ETF
Germany $5,068.8 $6,263.3 -$1,194.5
iShares iBoxx $ High Yield Corporate Bond Fund
US $8,561.5 $7,376.7 $1,184.8
Source: ETF Landscape – Global Handbook, Black Rock, H1 2011.
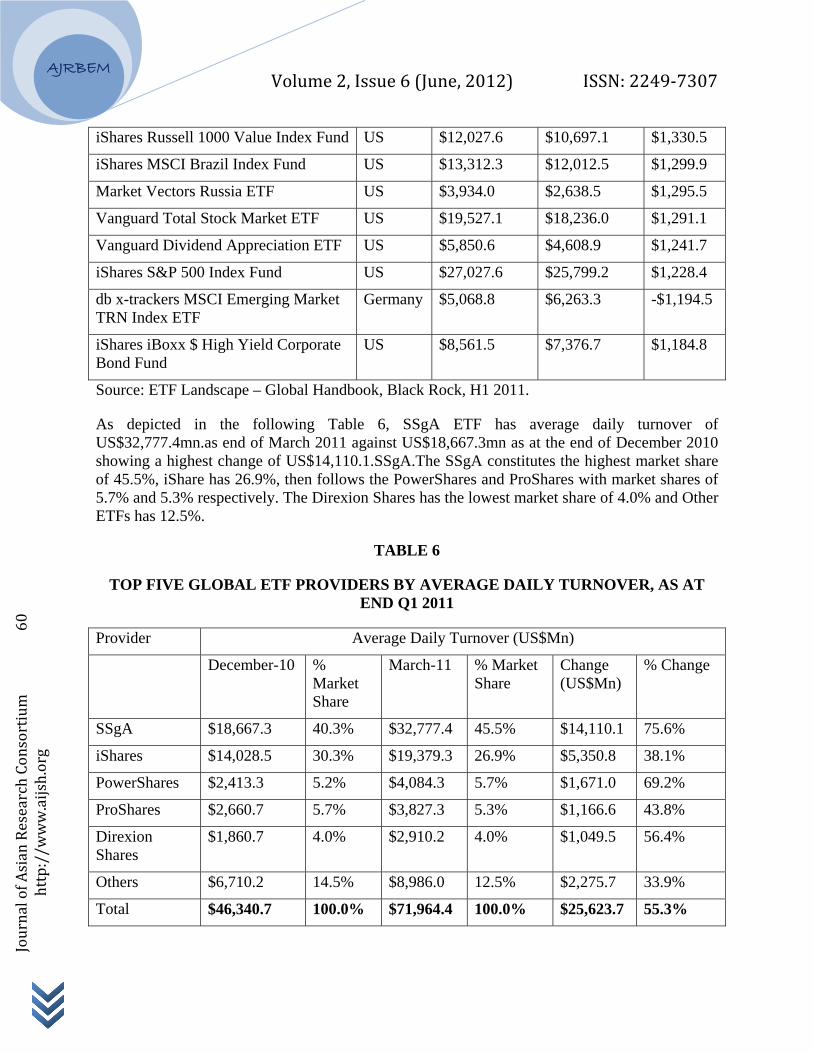
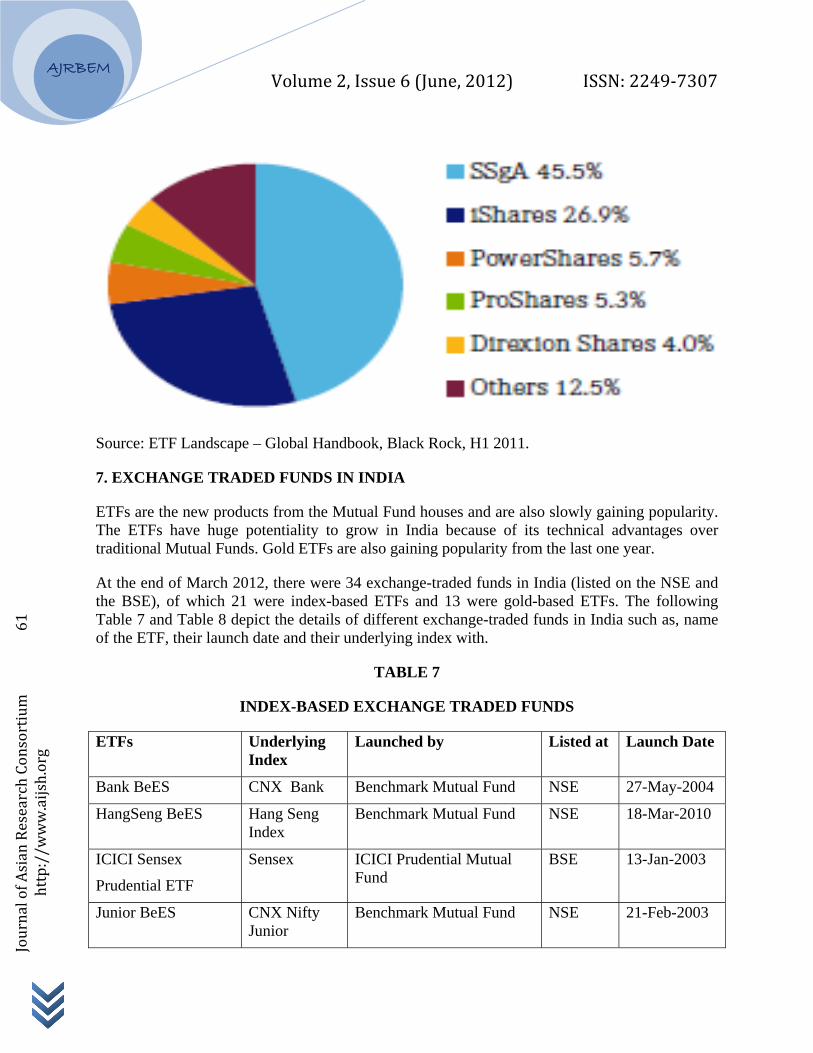
As depicted in the following Table 6, SSgA ETF has average daily turnover of US$32,777.4mn.as end of March 2011 against US$18,667.3mn as at the end of December 2010 showing a highest change of US$14,110.1.SSgA.The SSgA constitutes the highest market share of 45.5%, iShare has 26.9%, then follows the PowerShares and ProShares with market shares of 5.7% and 5.3% respectively. The Direxion Shares has the lowest market share of 4.0% and Other ETFs has 12.5%.
TABLE 6
TOP FIVE GLOBAL ETF PROVIDERS BY AVERAGE DAILY TURNOVER, AS AT END Q1 2011
Provider Average Daily Turnover (US$Mn)
December-10 % Market Share
March-11 % Market Share
Change (US$Mn)
% Change
SSgA $18,667.3 40.3% $32,777.4 45.5% $14,110.1 75.6%
iShares $14,028.5 30.3% $19,379.3 26.9% $5,350.8 38.1%
PowerShares $2,413.3 5.2% $4,084.3 5.7% $1,671.0 69.2%
ProShares $2,660.7 5.7% $3,827.3 5.3% $1,166.6 43.8%
Direxion Shares
$1,860.7 4.0% $2,910.2 4.0% $1,049.5 56.4%
Others $6,710.2 14.5% $8,986.0 12.5% $2,275.7 33.9%
Total $46,340.7 100.0% $71,964.4 100.0% $25,623.7 55.3%
Volume 2, Issue 6 (June, 2012) ISSN: 2249‐7307
AJRBEM
Journal of Asian Research Consortium 61
http://w
ww.aijsh.org
Source: ETF Landscape – Global Handbook, Black Rock, H1 2011.
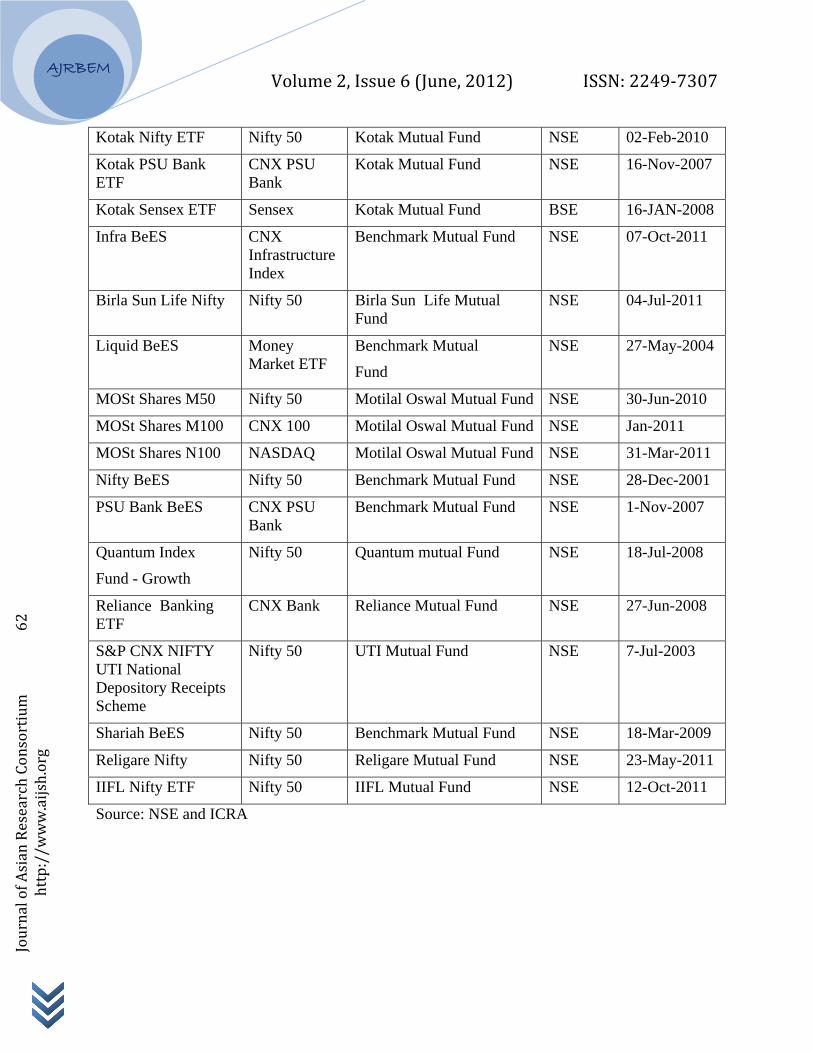
7. EXCHANGE TRADED FUNDS IN INDIA
ETFs are the new products from the Mutual Fund houses and are also slowly gaining popularity. The ETFs have huge potentiality to grow in India because of its technical advantages over traditional Mutual Funds. Gold ETFs are also gaining popularity from the last one year.
At the end of March 2012, there were 34 exchange-traded funds in India (listed on the NSE and the BSE), of which 21 were index-based ETFs and 13 were gold-based ETFs. The following Table 7 and Table 8 depict the details of different exchange-traded funds in India such as, name of the ETF, their launch date and their underlying index with.
TABLE 7
INDEX-BASED EXCHANGE TRADED FUNDS
ETFs Underlying Index
Launched by Listed at Launch Date
Bank BeES CNX Bank Benchmark Mutual Fund NSE 27-May-2004
HangSeng BeES Hang Seng Index
Benchmark Mutual Fund NSE 18-Mar-2010
ICICI Sensex
Prudential ETF
Sensex ICICI Prudential Mutual Fund
BSE 13-Jan-2003
Junior BeES CNX Nifty Junior
Benchmark Mutual Fund NSE 21-Feb-2003
Volume 2, Issue 6 (June, 2012) ISSN: 2249‐7307
AJRBEM
Journal of Asian Research Consortium 62
http://w
ww.aijsh.org
Kotak Nifty ETF Nifty 50 Kotak Mutual Fund NSE 02-Feb-2010
Kotak PSU Bank ETF
CNX PSU Bank
Kotak Mutual Fund NSE 16-Nov-2007
Kotak Sensex ETF Sensex Kotak Mutual Fund BSE 16-JAN-2008
Infra BeES CNX Infrastructure Index
Benchmark Mutual Fund NSE 07-Oct-2011
Birla Sun Life Nifty Nifty 50 Birla Sun Life Mutual Fund
NSE 04-Jul-2011
Liquid BeES Money Market ETF
Benchmark Mutual
Fund
NSE 27-May-2004
MOSt Shares M50 Nifty 50 Motilal Oswal Mutual Fund NSE 30-Jun-2010
MOSt Shares M100 CNX 100 Motilal Oswal Mutual Fund NSE Jan-2011
MOSt Shares N100 NASDAQ Motilal Oswal Mutual Fund NSE 31-Mar-2011
Nifty BeES Nifty 50 Benchmark Mutual Fund NSE 28-Dec-2001
PSU Bank BeES CNX PSU Bank
Benchmark Mutual Fund NSE 1-Nov-2007
Quantum Index
Fund - Growth
Nifty 50 Quantum mutual Fund NSE 18-Jul-2008
Reliance Banking ETF
CNX Bank Reliance Mutual Fund NSE 27-Jun-2008
S&P CNX NIFTY UTI National Depository Receipts Scheme
Nifty 50 UTI Mutual Fund NSE 7-Jul-2003
Shariah BeES Nifty 50 Benchmark Mutual Fund NSE 18-Mar-2009
Religare Nifty Nifty 50 Religare Mutual Fund NSE 23-May-2011
IIFL Nifty ETF Nifty 50 IIFL Mutual Fund NSE 12-Oct-2011
Source: NSE and ICRA
Volume 2, Issue 6 (June, 2012) ISSN: 2249‐7307
AJRBEM
Journal of Asian Research Consortium 63
http://w
ww.aijsh.org
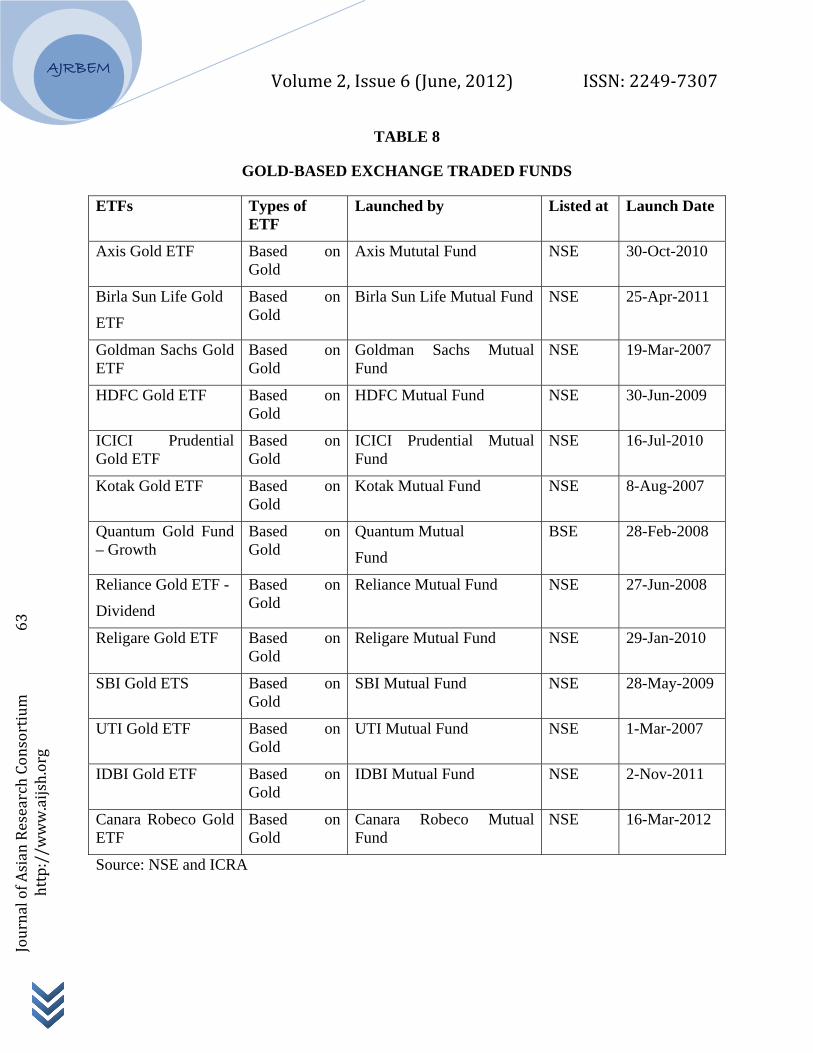
TABLE 8
GOLD-BASED EXCHANGE TRADED FUNDS
ETFs Types of ETF
Launched by Listed at Launch Date
Axis Gold ETF Based on Gold
Axis Mututal Fund NSE 30-Oct-2010
Birla Sun Life Gold
ETF
Based on Gold
Birla Sun Life Mutual Fund NSE 25-Apr-2011
Goldman Sachs Gold ETF
Based on Gold
Goldman Sachs Mutual Fund
NSE 19-Mar-2007
HDFC Gold ETF Based on Gold
HDFC Mutual Fund NSE 30-Jun-2009
ICICI Prudential Gold ETF
Based on Gold
ICICI Prudential Mutual Fund
NSE 16-Jul-2010
Kotak Gold ETF Based on Gold
Kotak Mutual Fund NSE 8-Aug-2007
Quantum Gold Fund – Growth
Based on Gold
Quantum Mutual
Fund
BSE 28-Feb-2008
Reliance Gold ETF -
Dividend
Based on Gold
Reliance Mutual Fund NSE 27-Jun-2008
Religare Gold ETF Based on Gold
Religare Mutual Fund NSE 29-Jan-2010
SBI Gold ETS Based on Gold
SBI Mutual Fund NSE 28-May-2009
UTI Gold ETF Based on Gold
UTI Mutual Fund NSE 1-Mar-2007
IDBI Gold ETF Based on Gold
IDBI Mutual Fund NSE 2-Nov-2011
Canara Robeco Gold ETF
Based on Gold
Canara Robeco Mutual Fund
NSE 16-Mar-2012
Source: NSE and ICRA
Volume 2, Issue 6 (June, 2012) ISSN: 2249‐7307
AJRBEM
Journal of Asian Research Consortium 64
http://w
ww.aijsh.org
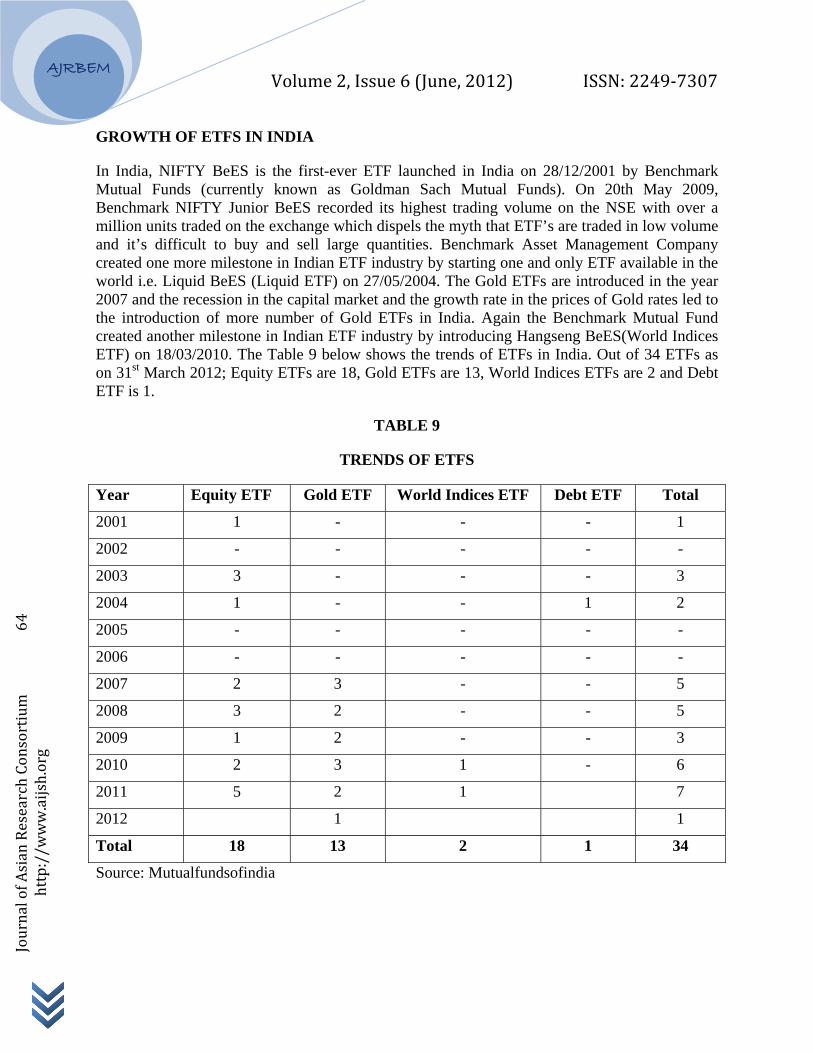
GROWTH OF ETFS IN INDIA
In India, NIFTY BeES is the first-ever ETF launched in India on 28/12/2001 by Benchmark Mutual Funds (currently known as Goldman Sach Mutual Funds). On 20th May 2009, Benchmark NIFTY Junior BeES recorded its highest trading volume on the NSE with over a million units traded on the exchange which dispels the myth that ETF’s are traded in low volume and it’s difficult to buy and sell large quantities. Benchmark Asset Management Company created one more milestone in Indian ETF industry by starting one and only ETF available in the world i.e. Liquid BeES (Liquid ETF) on 27/05/2004. The Gold ETFs are introduced in the year 2007 and the recession in the capital market and the growth rate in the prices of Gold rates led to the introduction of more number of Gold ETFs in India. Again the Benchmark Mutual Fund created another milestone in Indian ETF industry by introducing Hangseng BeES(World Indices ETF) on 18/03/2010. The Table 9 below shows the trends of ETFs in India. Out of 34 ETFs as on 31st March 2012; Equity ETFs are 18, Gold ETFs are 13, World Indices ETFs are 2 and Debt ETF is 1.
TABLE 9
TRENDS OF ETFS
Year Equity ETF Gold ETF World Indices ETF Debt ETF Total
2001 1 - - - 1
2002 - - - - -
2003 3 - - - 3
2004 1 - - 1 2
2005 - - - - -
2006 - - - - -
2007 2 3 - - 5
2008 3 2 - - 5
2009 1 2 - - 3
2010 2 3 1 - 6
2011 5 2 1 7
2012 1 1
Total 18 13 2 1 34
Source: Mutualfundsofindia
AJRB
Journal of Asian Research Consortium 65
http://w
ww.aijsh.org
BEM
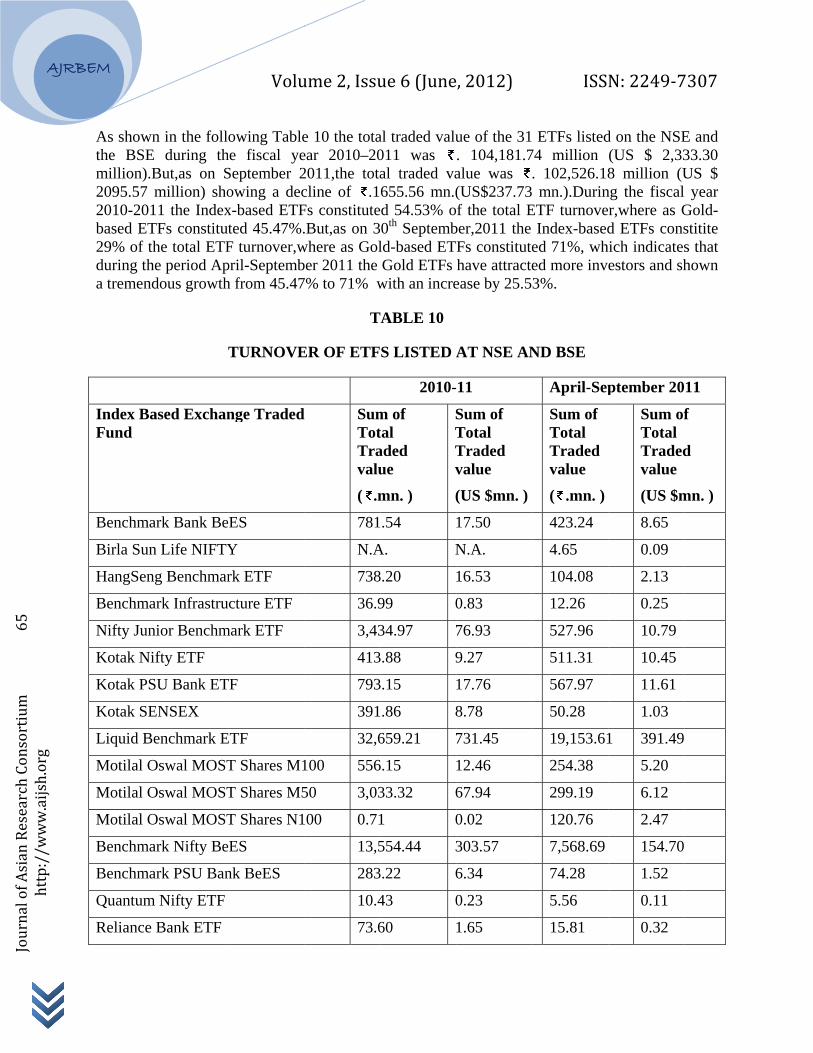
As shownthe BSEmillion).B2095.57 2010-201based ET29% of tduring tha tremend
Index BaFund
Benchma
Birla Sun
HangSen
Benchma
Nifty Jun
Kotak Ni
Kotak PS
Kotak SE
Liquid B
Motilal O
Motilal O
Motilal O
Benchma
Benchma
Quantum
Reliance
n in the follE during thBut,as on Smillion) sho
11 the IndexTFs constitutthe total ETFhe period Apdous growth
ased Exchan
ark Bank Be
n Life NIFTY
ng Benchmar
ark Infrastru
nior Benchm
ifty ETF
SU Bank ET
ENSEX
Benchmark E
Oswal MOST
Oswal MOST
Oswal MOST
ark Nifty Be
ark PSU Ban
m Nifty ETF
Bank ETF
Volu
owing Tablehe fiscal yeSeptember 2owing a decx-based ETFted 45.47%.F turnover,wpril-Septembh from 45.47
TURNOVE
nge Traded
eES
Y
rk ETF
ucture ETF
mark ETF
TF
ETF
T Shares M1
T Shares M5
T Shares N1
eES
nk BeES
ume 2, Issu
e 10 the totaear 2010–202011,the totacline of .1Fs constitute.But,as on 3
where as Golber 2011 the 7% to 71% w
T
ER OF ETF
d SumTotTravalu
( .m
781
N.A
738
36.9
3,43
413
793
391
32,6
100 556
50 3,03
00 0.71
13,5
283
10.4
73.6
ue 6 (June
al traded valu011 was al traded va655.56 mn.(d 54.53% o0th Septembld-based ETGold ETFs
with an incre
ABLE 10
S LISTED A
2010-
m of tal aded ue
mn. )
STTv
(
.54
A. N
8.20
99 0
34.97 7
.88 9
.15
.86 8
659.21 7
6.15
33.32 6
1 0
554.44 3
.22 6
43 0
60
, 2012)
ue of the 31. 104,181.7alue was (US$237.73f the total E
ber,2011 the Fs constitutehave attracte
ease by 25.5
AT NSE AN
-11
Sum of Total Traded value
(US $mn. )
17.50
N.A.
16.53
0.83
76.93
9.27
17.76
8.78
731.45
12.46
67.94
0.02
303.57
6.34
0.23
1.65
ISS
ETFs listed74 million . 102,526.18 mn.).Durin
ETF turnoveIndex-based
ed 71%, whed more inv3%.
ND BSE
April-Sep
Sum of Total Traded value
( .mn. )
423.24
4.65
104.08
12.26
527.96
511.31
567.97
50.28
19,153.61
254.38
299.19
120.76
7,568.69
74.28
5.56
15.81
N: 2249‐7
d on the NSE(US $ 2,338 million (U
ng the fiscal r,where as Gd ETFs cons
hich indicatesestors and sh
ptember 20
Sum ofTotal Tradedvalue
(US $m
8.65
0.09
2.13
0.25
10.79
10.45
11.61
1.03
1 391.49
5.20
6.12
2.47
154.70
1.52
0.11
0.32
7307
E and 33.30 US $ year Gold-stitite s that hown
11
f
d
mn. )
Volume 2, Issue 6 (June, 2012) ISSN: 2249‐7307
AJRBEM
Journal of Asian Research Consortium 66
http://w
ww.aijsh.org
Religare Nifty ETF N.A. N.A. 23.12 0.47
Benchmark Sharia BeES 9.90 0.22 3.79 0.08
ICICI Sensex Prudential ETF 5.06 0.11 0.83 0.02
Nifty UTI SUNDER ETF 36.54 0.82 9.14 0.19
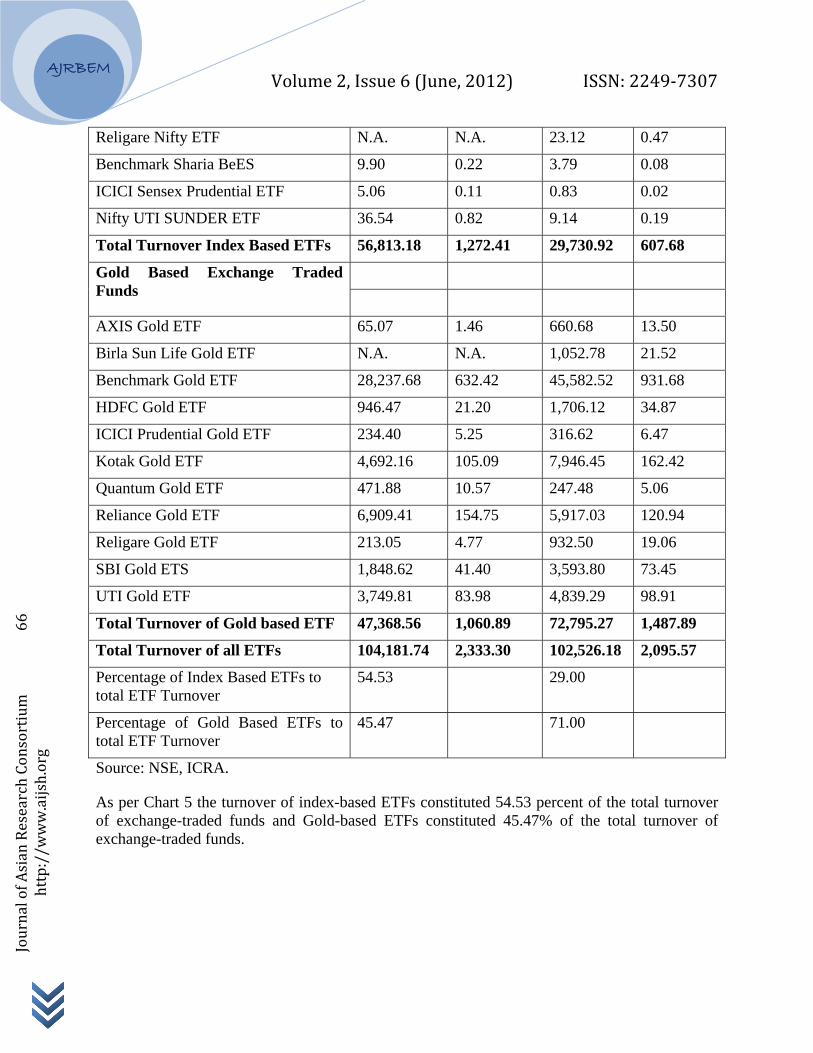
Total Turnover Index Based ETFs 56,813.18 1,272.41 29,730.92 607.68
Gold Based Exchange Traded Funds
AXIS Gold ETF 65.07 1.46 660.68 13.50
Birla Sun Life Gold ETF N.A. N.A. 1,052.78 21.52
Benchmark Gold ETF 28,237.68 632.42 45,582.52 931.68
HDFC Gold ETF 946.47 21.20 1,706.12 34.87
ICICI Prudential Gold ETF 234.40 5.25 316.62 6.47
Kotak Gold ETF 4,692.16 105.09 7,946.45 162.42
Quantum Gold ETF 471.88 10.57 247.48 5.06
Reliance Gold ETF 6,909.41 154.75 5,917.03 120.94
Religare Gold ETF 213.05 4.77 932.50 19.06
SBI Gold ETS 1,848.62 41.40 3,593.80 73.45
UTI Gold ETF 3,749.81 83.98 4,839.29 98.91
Total Turnover of Gold based ETF 47,368.56 1,060.89 72,795.27 1,487.89
Total Turnover of all ETFs 104,181.74 2,333.30 102,526.18 2,095.57
Percentage of Index Based ETFs to total ETF Turnover
54.53 29.00
Percentage of Gold Based ETFs to total ETF Turnover
45.47 71.00
Source: NSE, ICRA.
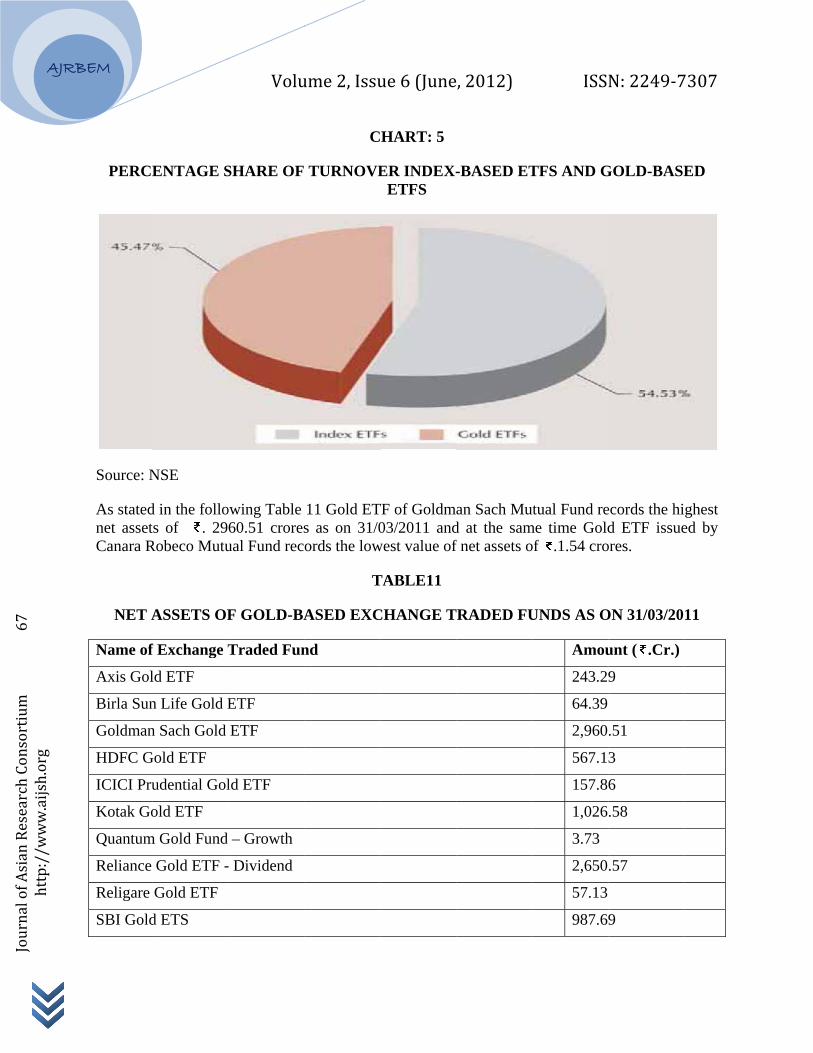
As per Chart 5 the turnover of index-based ETFs constituted 54.53 percent of the total turnover of exchange-traded funds and Gold-based ETFs constituted 45.47% of the total turnover of exchange-traded funds.
AJRB
Journal of Asian Research Consortium 67
http://w
ww.aijsh.org
BEM
PERC
Source: N
As statednet assetCanara R
NET A
Name of
Axis Gol
Birla Sun
Goldman
HDFC G
ICICI Pru
Kotak Go
Quantum
Reliance
Religare
SBI Gold
ENTAGE S
NSE
d in the follots of . 29Robeco Mutu
ASSETS OF
f Exchange T
ld ETF
n Life Gold E
n Sach Gold
Gold ETF
udential Gol
old ETF
m Gold Fund
Gold ETF -
Gold ETF
d ETS
Volu
SHARE OF
owing Table 60.51 croresual Fund rec
F GOLD-BA
Traded Fun
ETF
ETF
ld ETF
– Growth
- Dividend
ume 2, Issu
C
TURNOVE
11 Gold ETs as on 31/0ords the low
T
ASED EXC
nd
ue 6 (June
HART: 5
ER INDEX-ETFS
TF of Goldm03/2011 and
west value of
TABLE11
CHANGE T
, 2012)
-BASED ET
an Sach Mud at the samf net assets o
RADED FU
ISS
TFS AND G
utual Fund reme time Goldof .1.54 cro
UNDS AS O
Amou
243.2
64.39
2,960
567.1
157.8
1,026
3.73
2,650
57.13
987.6
N: 2249‐7
GOLD-BASE
ecords the hid ETF issue
ores.
ON 31/03/20
unt ( .Cr.)
9
.51
3
6
.58
.57
9
7307
ED
ghest ed by
11
AJRB
Journal of Asian Research Consortium 68
http://w
ww.aijsh.org
BEM
UTI Gold
IDBI Go
Canara R
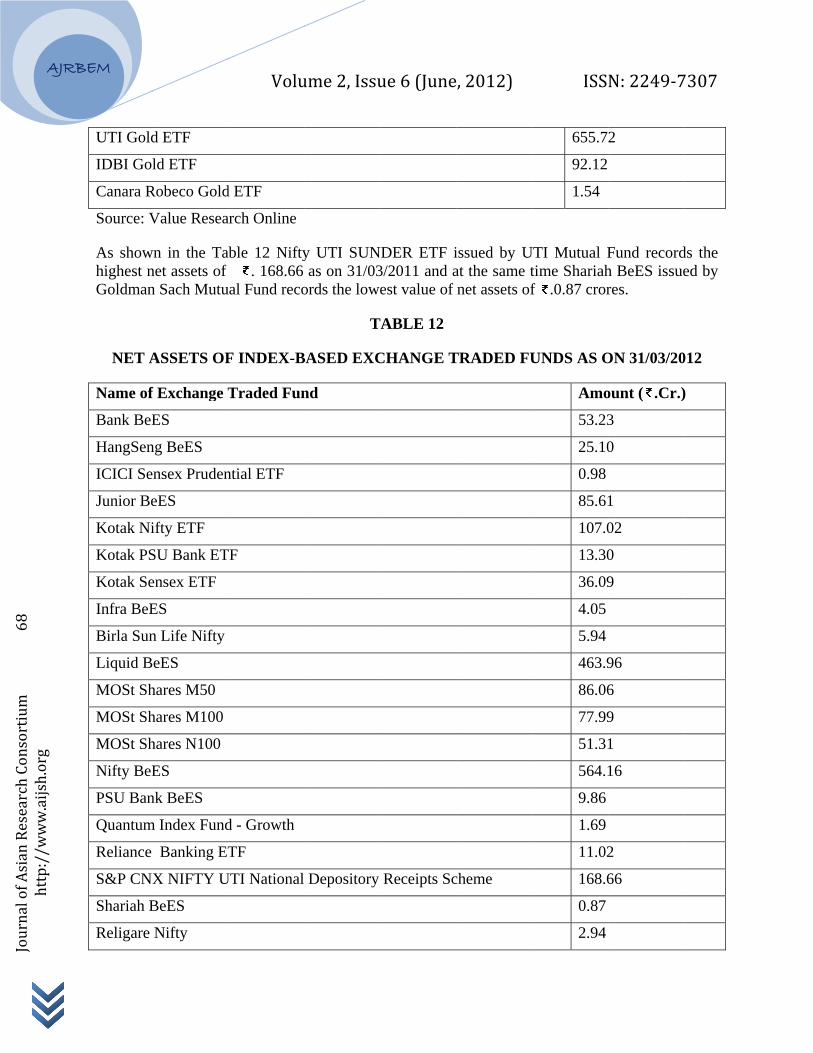
Source: V
As showhighest nGoldman
NET A
Name of
Bank BeE
HangSen
ICICI Se
Junior Be
Kotak Ni
Kotak PS
Kotak Se
Infra BeE
Birla Sun
Liquid B
MOSt Sh
MOSt Sh
MOSt Sh
Nifty BeE
PSU Ban
Quantum
Reliance
S&P CN
Shariah B
Religare
d ETF
ld ETF
Robeco Gold
Value Resea
wn in the Tanet assets of n Sach Mutu
ASSETS OF
f Exchange T
ES
ng BeES
ensex Pruden
eES
ifty ETF
SU Bank ET
ensex ETF
ES
n Life Nifty
BeES
hares M50
hares M100
hares N100
ES
nk BeES
m Index Fund
Banking ET
X NIFTY U
BeES
Nifty
Volu
d ETF
arch Online
able 12 Nifty . 168.66
ual Fund reco
F INDEX-B
Traded Fun
ntial ETF
TF
d - Growth
TF
UTI National
ume 2, Issu
y UTI SUNas on 31/03
ords the lowe
T
BASED EXC
nd
Depository
ue 6 (June
NDER ETF i3/2011 and aest value of
ABLE 12
CHANGE T
Receipts Sc
, 2012)
issued by Uat the same tnet assets of
TRADED FU
cheme
ISS
655.72
92.12
1.54
UTI Mutual Ftime Shariahf .0.87 cror
UNDS AS O
Amo
53.23
25.10
0.98
85.61
107.0
13.30
36.09
4.05
5.94
463.9
86.06
77.99
51.31
564.1
9.86
1.69
11.02
168.6
0.87
2.94
N: 2249‐7
2
Fund recordh BeES issueres.
ON 31/03/20
ount ( .Cr.)
3
0
1
02
0
9
96
6
9
1
16
2
66
7307
ds the ed by
012
)
Volume 2, Issue 6 (June, 2012) ISSN: 2249‐7307
AJRBEM
Journal of Asian Research Consortium 69
http://w
ww.aijsh.org
IIFL Nifty ETF 28.22
Source: Value Research Online
8. PERFORMANCE EVALUATION OF INDEX BASED ETFS VIS-À-VIS GOLD BASED ETFS
The performance evaluation of ETFs and Index Funds is made with the help of select parameters viz., Return, Risk and Expenses Ratio.
RETURNS OF ETFS IN INDIA
Performance of ETFs in terms of returns measures both the short term performance and long term performance. The short term performance is expressed in terms of 1month return, 3months return and 6 months return whereas, the long term performance is expressed in terms of 1 year return. In terms of 1month return of index-based ETFs, MOST Shares N100 ETF issued by Motilal Oswal Mutual Fund has given the highest return of 8.69% and Kotak PSU Bank ETF of Kotak Mahindra Mutual Fund and PSU Bank BeES ETF of Goldman Sach Mutual Fund have given the lowest return of -3.16%. In terms of 3 months return of index-based ETFs, Kotak PSU Bank ETF of Kotak Mahindra Mutual Fund has given the highest return of 25.76 % and Liquid Benchmark ETF of Goldman Sach Mutual Fund has given the lowest return of 1.50%. Similarly, in terms of 6 months return of index-based ETFs, Motilal Oswal MOST Shares N100 has given the highest return of 34.99 % and Benchmark Infrastructure ETF of Goldman Sach Mutual Fund has given the lowest return of 1.43%.So far as long term performance is concerned, except three ETFs such as HangSeng Benchmark ETF, Liquid Benchmark ETF and Motilal Oswal MOST Shares N100 all other ETFs have negative performance. Motilal Oswal MOST Shares N100 has given the highest return of 34.40 in terms of 1 year return and Benchmark Bank BeES of Goldman Sach Mutual Funds has given the highest negative return of -9.24 in terms of longterm performance.
Volume 2, Issue 6 (June, 2012) ISSN: 2249‐7307
AJRBEM
Journal of Asian Research Consortium 70
http://w
ww.aijsh.org
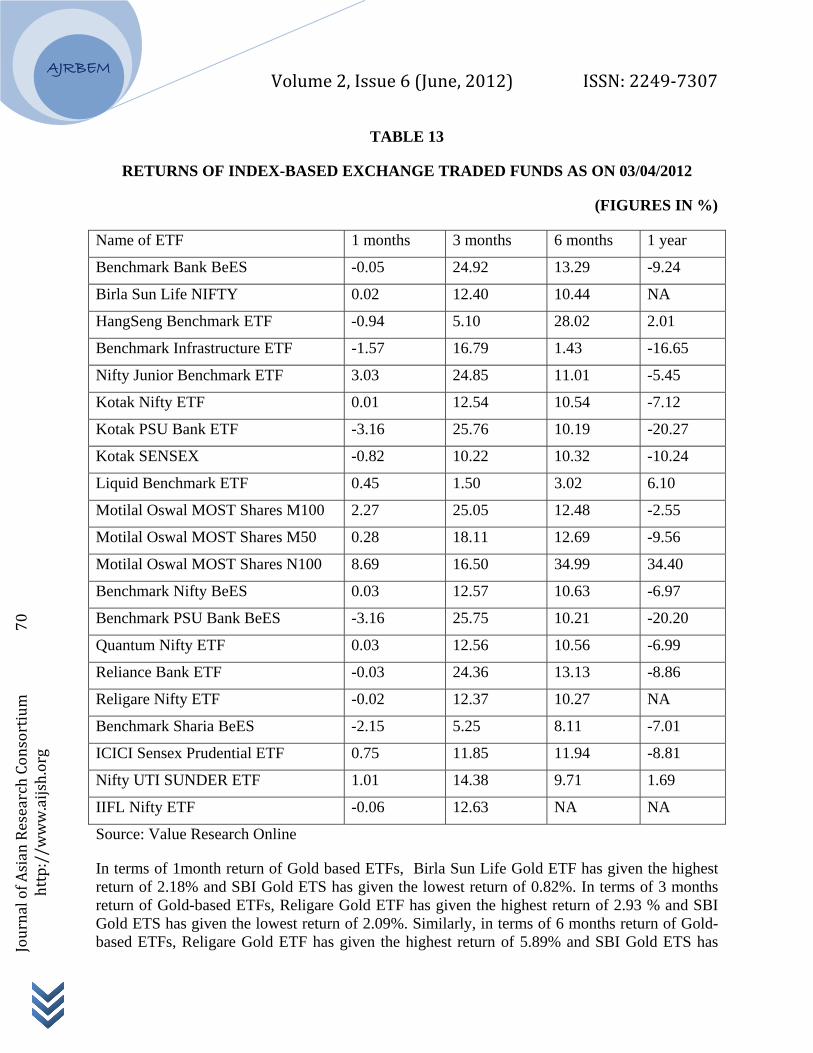
TABLE 13
RETURNS OF INDEX-BASED EXCHANGE TRADED FUNDS AS ON 03/04/2012
(FIGURES IN %)
Name of ETF 1 months 3 months 6 months 1 year
Benchmark Bank BeES -0.05 24.92 13.29 -9.24
Birla Sun Life NIFTY 0.02 12.40 10.44 NA
HangSeng Benchmark ETF -0.94 5.10 28.02 2.01
Benchmark Infrastructure ETF -1.57 16.79 1.43 -16.65
Nifty Junior Benchmark ETF 3.03 24.85 11.01 -5.45
Kotak Nifty ETF 0.01 12.54 10.54 -7.12
Kotak PSU Bank ETF -3.16 25.76 10.19 -20.27
Kotak SENSEX -0.82 10.22 10.32 -10.24
Liquid Benchmark ETF 0.45 1.50 3.02 6.10
Motilal Oswal MOST Shares M100 2.27 25.05 12.48 -2.55
Motilal Oswal MOST Shares M50 0.28 18.11 12.69 -9.56
Motilal Oswal MOST Shares N100 8.69 16.50 34.99 34.40
Benchmark Nifty BeES 0.03 12.57 10.63 -6.97
Benchmark PSU Bank BeES -3.16 25.75 10.21 -20.20
Quantum Nifty ETF 0.03 12.56 10.56 -6.99
Reliance Bank ETF -0.03 24.36 13.13 -8.86
Religare Nifty ETF -0.02 12.37 10.27 NA
Benchmark Sharia BeES -2.15 5.25 8.11 -7.01
ICICI Sensex Prudential ETF 0.75 11.85 11.94 -8.81
Nifty UTI SUNDER ETF 1.01 14.38 9.71 1.69
IIFL Nifty ETF -0.06 12.63 NA NA
Source: Value Research Online
In terms of 1month return of Gold based ETFs, Birla Sun Life Gold ETF has given the highest return of 2.18% and SBI Gold ETS has given the lowest return of 0.82%. In terms of 3 months return of Gold-based ETFs, Religare Gold ETF has given the highest return of 2.93 % and SBI Gold ETS has given the lowest return of 2.09%. Similarly, in terms of 6 months return of Gold-based ETFs, Religare Gold ETF has given the highest return of 5.89% and SBI Gold ETS has
Volume 2, Issue 6 (June, 2012) ISSN: 2249‐7307
AJRBEM
Journal of Asian Research Consortium 71
http://w
ww.aijsh.org
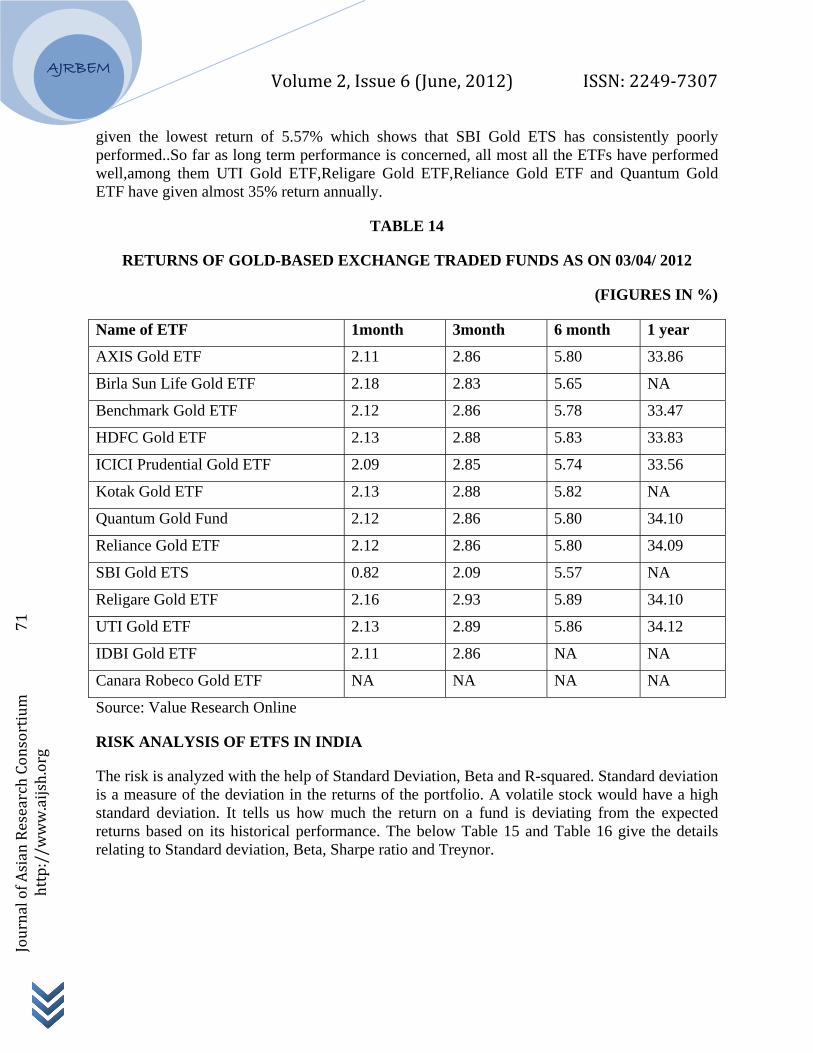
given the lowest return of 5.57% which shows that SBI Gold ETS has consistently poorly performed..So far as long term performance is concerned, all most all the ETFs have performed well,among them UTI Gold ETF,Religare Gold ETF,Reliance Gold ETF and Quantum Gold ETF have given almost 35% return annually.
TABLE 14
RETURNS OF GOLD-BASED EXCHANGE TRADED FUNDS AS ON 03/04/ 2012
(FIGURES IN %)
Name of ETF 1month 3month 6 month 1 year
AXIS Gold ETF 2.11 2.86 5.80 33.86
Birla Sun Life Gold ETF 2.18 2.83 5.65 NA
Benchmark Gold ETF 2.12 2.86 5.78 33.47
HDFC Gold ETF 2.13 2.88 5.83 33.83
ICICI Prudential Gold ETF 2.09 2.85 5.74 33.56
Kotak Gold ETF 2.13 2.88 5.82 NA
Quantum Gold Fund 2.12 2.86 5.80 34.10
Reliance Gold ETF 2.12 2.86 5.80 34.09
SBI Gold ETS 0.82 2.09 5.57 NA
Religare Gold ETF 2.16 2.93 5.89 34.10
UTI Gold ETF 2.13 2.89 5.86 34.12
IDBI Gold ETF 2.11 2.86 NA NA
Canara Robeco Gold ETF NA NA NA NA
Source: Value Research Online
RISK ANALYSIS OF ETFS IN INDIA
The risk is analyzed with the help of Standard Deviation, Beta and R-squared. Standard deviation is a measure of the deviation in the returns of the portfolio. A volatile stock would have a high standard deviation. It tells us how much the return on a fund is deviating from the expected returns based on its historical performance. The below Table 15 and Table 16 give the details relating to Standard deviation, Beta, Sharpe ratio and Treynor.
Volume 2, Issue 6 (June, 2012) ISSN: 2249‐7307
AJRBEM
Journal of Asian Research Consortium 72
http://w
ww.aijsh.org
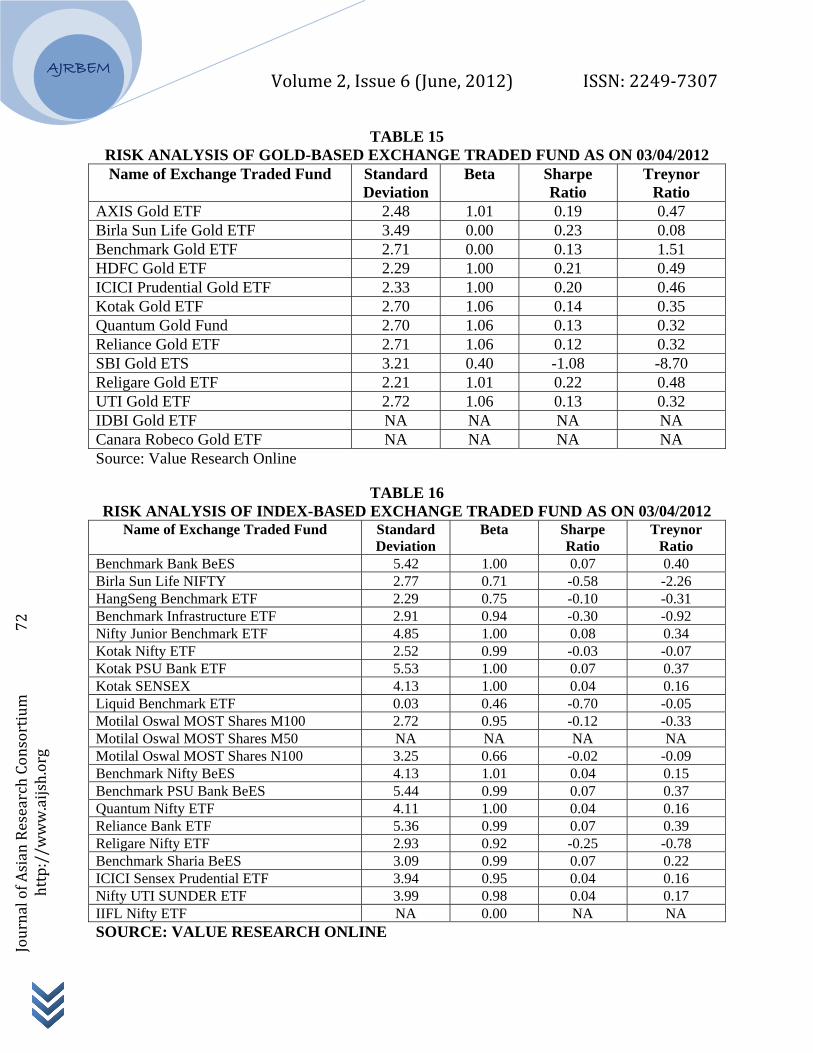
TABLE 15 RISK ANALYSIS OF GOLD-BASED EXCHANGE TRADED FUND AS ON 03/04/2012 Name of Exchange Traded Fund Standard
Deviation Beta Sharpe
Ratio Treynor
Ratio AXIS Gold ETF 2.48 1.01 0.19 0.47 Birla Sun Life Gold ETF 3.49 0.00 0.23 0.08 Benchmark Gold ETF 2.71 0.00 0.13 1.51 HDFC Gold ETF 2.29 1.00 0.21 0.49 ICICI Prudential Gold ETF 2.33 1.00 0.20 0.46 Kotak Gold ETF 2.70 1.06 0.14 0.35 Quantum Gold Fund 2.70 1.06 0.13 0.32 Reliance Gold ETF 2.71 1.06 0.12 0.32 SBI Gold ETS 3.21 0.40 -1.08 -8.70 Religare Gold ETF 2.21 1.01 0.22 0.48 UTI Gold ETF 2.72 1.06 0.13 0.32 IDBI Gold ETF NA NA NA NA Canara Robeco Gold ETF NA NA NA NA Source: Value Research Online
TABLE 16 RISK ANALYSIS OF INDEX-BASED EXCHANGE TRADED FUND AS ON 03/04/2012
Name of Exchange Traded Fund Standard Deviation
Beta Sharpe Ratio
Treynor Ratio
Benchmark Bank BeES 5.42 1.00 0.07 0.40 Birla Sun Life NIFTY 2.77 0.71 -0.58 -2.26 HangSeng Benchmark ETF 2.29 0.75 -0.10 -0.31 Benchmark Infrastructure ETF 2.91 0.94 -0.30 -0.92 Nifty Junior Benchmark ETF 4.85 1.00 0.08 0.34 Kotak Nifty ETF 2.52 0.99 -0.03 -0.07 Kotak PSU Bank ETF 5.53 1.00 0.07 0.37 Kotak SENSEX 4.13 1.00 0.04 0.16 Liquid Benchmark ETF 0.03 0.46 -0.70 -0.05 Motilal Oswal MOST Shares M100 2.72 0.95 -0.12 -0.33 Motilal Oswal MOST Shares M50 NA NA NA NA Motilal Oswal MOST Shares N100 3.25 0.66 -0.02 -0.09 Benchmark Nifty BeES 4.13 1.01 0.04 0.15 Benchmark PSU Bank BeES 5.44 0.99 0.07 0.37 Quantum Nifty ETF 4.11 1.00 0.04 0.16 Reliance Bank ETF 5.36 0.99 0.07 0.39 Religare Nifty ETF 2.93 0.92 -0.25 -0.78 Benchmark Sharia BeES 3.09 0.99 0.07 0.22 ICICI Sensex Prudential ETF 3.94 0.95 0.04 0.16 Nifty UTI SUNDER ETF 3.99 0.98 0.04 0.17 IIFL Nifty ETF NA 0.00 NA NA SOURCE: VALUE RESEARCH ONLINE
Volume 2, Issue 6 (June, 2012) ISSN: 2249‐7307
AJRBEM
Journal of Asian Research Consortium 73
http://w
ww.aijsh.org
STANDARD DEVIATION
It is found that among the Gold-Based ETFs, Birla Sun Life Gold ETF is having the highest risk i.e. 3.49per cent and HDFC Gold ETF has the lowest risk i.e. 2.29 per cent. In the case of Index-Based ETF, Kotak PSU Bank ETF has the highest risk i.e., 5.53 per cent and Liquid Benchmark ETF has lowest risk i.e.0.03 per cent. The standard deviations of the Index-Based ETFs are higher than the Gold-Based ETFs. It means that the deviation of expected return is more in Index-Based ETFs than Gold-Based ETFs.
BETA VALUE
Beta measures the systematic risk and explains the nature of the volatility of the security return with that of the market return. If beta values are less than one, it means that Funds risk is less than the market risk; if it is one, it means the Funds risk is same as that of the market risk and if the beta is more than one, the risk of the Funds is greater than that of the market. Most of the Gold-Based ETFs have the beta values equal to 1 or more than 1, implying volatility in the returns of the ETFs is as same as that of the market or higher volatility in the returns of the ETFs. But, on the other hand, most of the Index-Based ETFs have the beta less than 1, implying lower volatility in the returns of the ETFs.
SHARPE RATIO
It shows the return to variability. Higher the ratio, better performance, in terms of the return for the risk taken. It is found that all the Gold-Based ETFs are showing a positive Sharpe ratio except SBI Gold ETS. But most of the Index-Based ETFs are showing negative Shrape ratio. According to Sharpe ratio, Gold ETFs are giving better performance for extra risk taken by the investors.
TREYNOR RATIO
This r ratio relates excess return over the risk-free rate to the additional risk taken; however, systematic risk is used instead of total risk. The higher the Treynor ratio, the better the performance of the portfolio under analysis. It is found that all the Gold-Based ETFs are showing positive Treynor ratio except SBI Gold ETS.But.most of Index-Based ETFs are showing negative Treynor ratio. According to Treynor ratio, Gold ETFs are giving better performance for extra market risk taken by the investors.
EXPENSES RATIO OF EXCHANGE TRADED FUNDS IN INDIA
An expense ratio tells as to how much a Fund costs. The amount is skimmed from the investors account and goes towards paying a Fund’s total annual expenses. It is expressed as a percentage of a Fund’s Net Assets. If an investor invests in an ETF with an expenses ratio of 0.20 per cent and has invested Rs.10, 000 in that fund, the investor has to pay Rs.20 a year in expenses. The tables below give the details of expenses ratio of the select schemes of ETFs as on 3rd April, 2012. It is found that almost all the Gold-Based ETFs have equal expense ratio except Birla Sun Life Gold ETF, which implies that all the Gold ETFs cost equally to the investor except Birla
Volume 2, Issue 6 (June, 2012) ISSN: 2249‐7307
AJRBEM
Journal of Asian Research Consortium 74
http://w
ww.aijsh.org
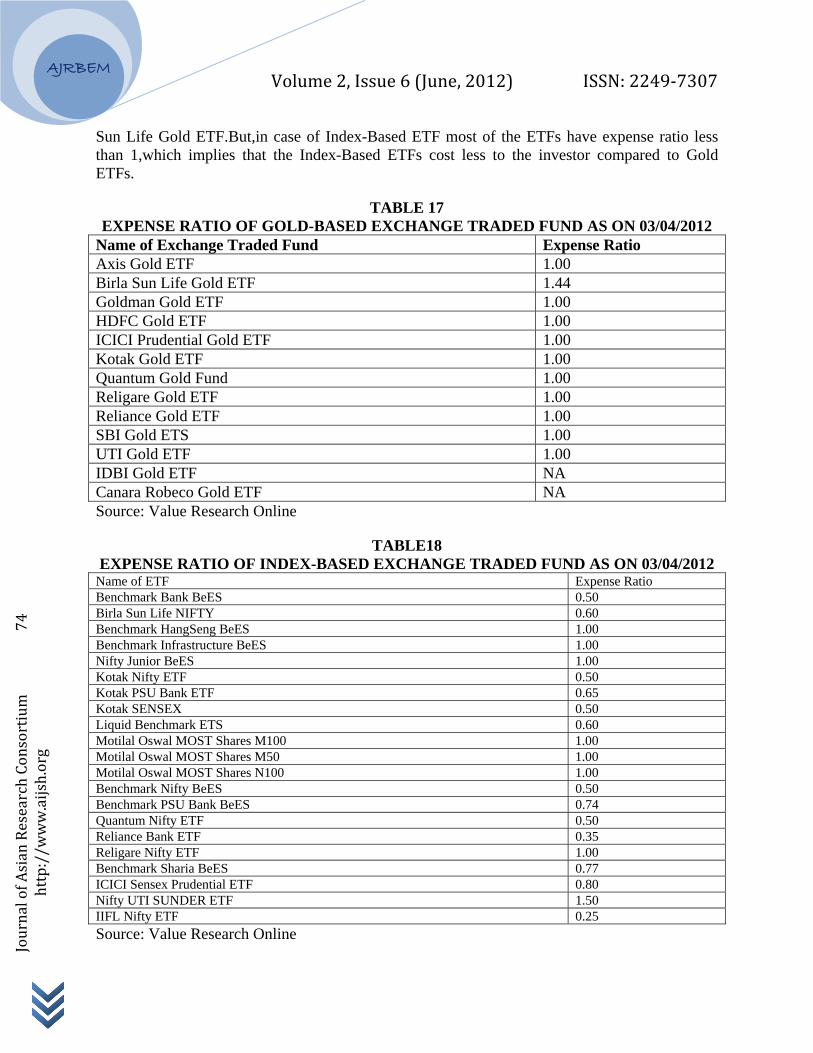
Sun Life Gold ETF.But,in case of Index-Based ETF most of the ETFs have expense ratio less than 1,which implies that the Index-Based ETFs cost less to the investor compared to Gold ETFs.
TABLE 17 EXPENSE RATIO OF GOLD-BASED EXCHANGE TRADED FUND AS ON 03/04/2012
Name of Exchange Traded Fund Expense Ratio Axis Gold ETF 1.00 Birla Sun Life Gold ETF 1.44 Goldman Gold ETF 1.00 HDFC Gold ETF 1.00 ICICI Prudential Gold ETF 1.00 Kotak Gold ETF 1.00 Quantum Gold Fund 1.00 Religare Gold ETF 1.00 Reliance Gold ETF 1.00 SBI Gold ETS 1.00 UTI Gold ETF 1.00 IDBI Gold ETF NA Canara Robeco Gold ETF NA Source: Value Research Online
TABLE18 EXPENSE RATIO OF INDEX-BASED EXCHANGE TRADED FUND AS ON 03/04/2012
Name of ETF Expense Ratio Benchmark Bank BeES 0.50 Birla Sun Life NIFTY 0.60 Benchmark HangSeng BeES 1.00 Benchmark Infrastructure BeES 1.00 Nifty Junior BeES 1.00 Kotak Nifty ETF 0.50 Kotak PSU Bank ETF 0.65 Kotak SENSEX 0.50 Liquid Benchmark ETS 0.60 Motilal Oswal MOST Shares M100 1.00 Motilal Oswal MOST Shares M50 1.00 Motilal Oswal MOST Shares N100 1.00 Benchmark Nifty BeES 0.50 Benchmark PSU Bank BeES 0.74 Quantum Nifty ETF 0.50 Reliance Bank ETF 0.35 Religare Nifty ETF 1.00 Benchmark Sharia BeES 0.77 ICICI Sensex Prudential ETF 0.80 Nifty UTI SUNDER ETF 1.50 IIFL Nifty ETF 0.25 Source: Value Research Online
Volume 2, Issue 6 (June, 2012) ISSN: 2249‐7307
AJRBEM
Journal of Asian Research Consortium 75
http://w
ww.aijsh.org
9. FINDINGS OF THE STUDY
1: ETFs have given better opportunity for the small investors in terms of diversified portfolio with a small amount of money. Benchmark AMC issued more number of ETFs than other AMCs.
2: All the ETFs have shown tremendous growth both globally and in India in the year 2011-12 compared to the year 2010-11.
2: Expense ratios of Gold ETFs are same. But compared to Index ETFs expense ratios of Gold ETFs are more. So, Index ETFs are cost less compared to Gold ETFs.
3: According to Treynor ratio, Gold ETFs are giving better performance for extra market risk taken by the investors compared to Index ETFs.
4: According to Sharpe ratio, Gold ETFs are giving better performance for extra risk taken by the investors compared to Index ETFs.
5: Most of the Gold-Based ETFs have the beta values equal to 1 or more than 1, implying volatility in the returns of the ETFs is as same as that of the market or higher volatility in the returns of the ETFs. But, on the other hand, most of the Index-Based ETFs have the beta less than 1, implying lower volatility in the returns of the ETFs.
10. CONCLUSION
ETFs are one of the most successful products introduced on exchanges in recent years. The ETFs are gaining popularity day by day compared to other forms of investments. The Asset Management Companies (AMCs) are putting their continuous efforts to innovate new ETF products. As the variety of financial indices is increasing, there has been a corresponding increase in the spectrum of ETF varieties available in the market. Due to recent increasing volatility in the equity markets the investment in gold has become the new ray of hope for investors. Therefore, there is a huge potentiality for the introduction of more gold ETF products in India. However, the ETFs can become a best investment alternative, provided, awareness is created among the investor.
REFERENCES
1: BlackRock-ETF Landscape Industry Review End Q1 2011.
2: Johnson, W. F. (2008). Tracking errors of exchange traded funds. Journal of Asset Management.
3: Kostovetsky, L. (2003). Index mutual funds and Exchange-traded funds: A comparison of two methods of passive investment. The Journal of Portfolio Management.
Volume 2, Issue 6 (June, 2012) ISSN: 2249‐7307
AJRBEM
Journal of Asian Research Consortium 76
http://w
ww.aijsh.org
4: Rompotis, G., G. (2009a). Performance and trading characteristics of iShares: An evaluation. The Icfai Journal of Applied Finance.
5: Rompotis, G., G. (2009b). Interfamily competition on index tracking: The case of the vanguard ETFs and index funds. Journal of Asset Management.
6: National Stock Exchanges of India Ltd.- Indian Securities Market A Review, Vol.XIV.2011.
7: Exchange Traded Funds-Challenging the Dominance of Mutual Funds-A Deloitte Research Report
WEBSITES
www.valurresearch.com
www.nseindia.com
www.bseindia.com
www.benchmarkfunds.com
www.amfiindia.com
www.mutualfundsindia.com
www.investiopedia.com