Asian Journal of Empirical Research EXPLORING THE IMPACT ... · EXPLORING THE IMPACT OF...
23
Asian Journal of Empirical Research, 2(4):118-140 118 EXPLORING THE IMPACT OF INFRASTRUCTURE, PAY INCENTIVES AND WORKPLACE ENVIRONMENT ON EMPLOYEES’ PERFORMANCE (A CASE STUDY OF SARGODHA UNIVERSITY) Saddat Hasnain Khan 1 Zarqa Azhar 2 Sajida Parveen 3 Farheen Naeem 4 Malik Muhammad Sohail 5 ABSTRACT It is acknowledged that work systems cannot only affect commitment, competence, cost effectiveness and congruence but also have long term consequence for workers’ well-being; there is some evidence to indicate that work systems designs may have effects on physical health, mental health and longevity of life itself. Conducive work environment ensures the wellbeing of employees as well as enables them to exert themselves to their roles with all vigor that may translate to higher productivity (Taiwo, 2009). This study aims to explore the impact of office facilities and workplace milieu on employees’ performance in a university of Sargodha. A sample of 150 respondents of male and female employees of both teaching and non teaching category was selected. Chi-square and Gamma test were applied to interpret the findings of study. Key Words: Infrastructure, Pay Incentives, Workplace Environment, Employees’ Performance INTRODUCTION Infrastructure has been defined in terms of the physical facilities (roads, airports, utility supply systems, communication systems, water and waste disposal systems etc.), and the services 1 Department of Sociology, University of Sargodha, Sargodha, Pakistan. 2 Department of Sociology, University of Sargodha, Sargodha, Pakistan. 3 Department of Sociology, GC University, Faisalabad, Pakistan. 4 Department of Sociology, GC University, Faisalabad, Pakistan. 5 Department of Sociology, GC University, Faisalabad, Pakistan.E-mail:[email protected] Asian Journal of Empirical Research journal homepage: http://aessweb.com/journal-detail.php?id=5004
Transcript of Asian Journal of Empirical Research EXPLORING THE IMPACT ... · EXPLORING THE IMPACT OF...

Asian Journal of Empirical Research, 2(4):118-140
118
EXPLORING THE IMPACT OF INFRASTRUCTURE, PAY INCENTIVES AND WORKPLACE ENVIRONMENT ON EMPLOYEES’ PERFORMANCE (A CASE STUDY OF SARGODHA UNIVERSITY)
Saddat Hasnain Khan1 Zarqa Azhar2
Sajida Parveen3 Farheen Naeem4
Malik Muhammad Sohail5
ABSTRACT
It is acknowledged that work systems cannot only affect commitment, competence, cost
effectiveness and congruence but also have long term consequence for workers’ well-being; there
is some evidence to indicate that work systems designs may have effects on physical health, mental
health and longevity of life itself. Conducive work environment ensures the wellbeing of employees
as well as enables them to exert themselves to their roles with all vigor that may translate to higher
productivity (Taiwo, 2009). This study aims to explore the impact of office facilities and workplace
milieu on employees’ performance in a university of Sargodha. A sample of 150 respondents of
male and female employees of both teaching and non teaching category was selected. Chi-square
and Gamma test were applied to interpret the findings of study.
Key Words: Infrastructure, Pay Incentives, Workplace Environment, Employees’ Performance
INTRODUCTION
Infrastructure has been defined in terms of the physical facilities (roads, airports, utility supply
systems, communication systems, water and waste disposal systems etc.), and the services
1Department of Sociology, University of Sargodha, Sargodha, Pakistan. 2Department of Sociology, University of Sargodha, Sargodha, Pakistan.
3Department of Sociology, GC University, Faisalabad, Pakistan.
4Department of Sociology, GC University, Faisalabad, Pakistan.
5Department of Sociology, GC University, Faisalabad, Pakistan.E-mail:[email protected]
Asian Journal of Empirical Research
journal homepage: http://aessweb.com/journal-detail.php?id=5004

Asian Journal of Empirical Research, 2(4):118-140
119
(Water, sanitation, transport, energy) flowing from facilities (CIDA, 1996). According to Cascio,
(2006) performance refers to the degree of achievement of the mission at work place that builds up
an employee job. According to Stannack, (1996) Mostly researcher’s used the term performance to
express the range of measurements of transactional efficiency and input & output efficiency.
Brenner, (2004) was of the opinion that “the ability to share knowledge throughout organizations
depends on how the work environment is designed to enable organizations to utilize work
environment as if it were an asset. This helps organizations to improve effectiveness and allow
employees to benefit from collective knowledge. In addition, Brenner (2004) argued that work
environment designed to suit employee’s satisfaction and free flow of exchange of ideas is a better
medium of motivating employees towards higher productivity. Work environment when
appropriately designed, motivates employees toward higher productivity. There are six factors
which contribute to a toxic work environment hence contributing to low productivity of workers.
The factors are: opaque management, biased boss, and company’s policies, working conditions,
interpersonal relationship and pay (Taiwo, 2009).
The influence of organizational environment, which is mostly composed of several organizational,
social and psychological elements, has been thoroughly examined in past two decades. In a number
of studies employees’ motivation, job satisfaction, job involvement, job performance, and health
are influenced by psycho-social environment of work organization (Srivastava, 1994). Although
many factors that affect the employee performance, job commitment, job satisfaction, working
Environment and motivation can be classified as such factors. A number of Studies, commitment
referred as psychological condition which describes the employees’ relations with organization
(Varol, 2010). Brill et al. (1984) ranked factors, which affect productivity according to their
importance. The factors are sequenced based on the significance: furniture, noise, flexibility,
comfort, communication, lighting, temperature and the air quality.
Table-1: Conceptual Framework
Background Variables
Infrastructure Workplace Environment
Dependent Variable
Gender Education Age Designation
Separate Office Internet Facilities
Pay Incentives Harassment Workload
Employees’ Performance
Objectives: 1) To determine the impact of working environment on university employees performance.
2) To check the impact of pay incentives on performance of university employees.

Asian Journal of Empirical Research, 2(4):118-140
120
3) To check the impact of infrastructure on employees performance of university of
Sargodha.
Workplace environment James (1996) concluded that the working as a team has significant impact on the satisfaction level
of employees as it affects their performance. It is essential to recognize to the significance of these
factors to boost the satisfaction level in the workforce. How employees perceive their work
environment can affect employee's commitment, motivation, and performance and also helps
organization to form a competitive edge. It is supported by research conducted by Brown et al.
(1996) that a motivational and empowered work climate influences employee's attitudes toward
work positively and improves work performance. An effective work environment management
entails making work environment attractive, creative, comfortable, satisfactory and motivating to
employees so as to give employees a sense of pride and purpose in what they do. Following are
some tools used to manage work environment to improve productivity. Noise control, contaminants
and hazard control, enhancing friendly and encouraging human environment, job fit, rewards,
feedback, work environment modeling, creating qualitative work life concepts and making physical
working conditions favorable (Taiwo, 2009).
Workplace design needs to take into account of a wide range of issues. Creating better and higher
performing workplace requires an awareness of how workplace impacts behavior and how behavior
itself drives workplace performance. The relationship between work, the workplace and the tools of
work, workplace becomes an essential part of work itself. Increasing workplace understanding is
built on the identification that space has different characteristics: it performs different functions and
there are different ways people work. People work individually and interact with others and this
requires different workplace solutions (Chandrasekar, 2011).How workspace is designed and
occupied affects not only how people feel, but also their work performance, their commitment to
their employer, and the creation of new knowledge in the organization. These are the cornerstones
of the level of research known as the environmental psychology of workspace (Vischer, 2008).
According to Abdulla et al. (2010) Environmental factors represent the immediate job environment
that contains skills required to perform a job, authority, autonomy, relationship with supervisors
and co-workers and other working conditions.
EMPLOYEE’S PERFORMANCE Cummings and Schwab, (1973) argue that performance is ultimately an individual phenomenon
with environmental factors influencing performance mainly through their effect on the individual
determinants of performance – ability and motivation. According to Collis and Montgomery,
(1995) employee performance has been shown to have a significant positive effect on
organizational performance. According to Adams, (1965) people are motivated to seek social
equity in the rewards they receive for high performance. He suggests that the outcome from job

Asian Journal of Empirical Research, 2(4):118-140
121
includes; pay recognition, promotion, social relationship and intrinsic reward. To get these rewards
various inputs needs to be employed by the employees to the job as time, experience, efforts,
education and loyalty. He also suggests that, people tend to view their outcomes and inputs as a
ratio and then compare these ratios with others and turn to become motivated if this ratio is high.
Identifying and selecting the best employees for particular jobs is an important task for
organizations. High-performing workers are perfect since employee performance directly impacts
the organization’s bottom line. Poor performers can cost their employer money through the loss of
production and in the costs of turnover and training (Cooper and Cartwright, 1994). According to
Suhartini, (1995) employee performance is a combined result of effort, ability, and perception of
tasks. High performance is a step towards the achievement of organizational goals and tasks.
Therefore, efforts are needed to improve employee performance. Employee performance is the
fundamental element of any organization and the most important factor for the success of the
organization and its performance. It is true that most of the organizations are dependent on its
employees, but one or two employee cannot change the organization’s future. The organization’s
performance is the shared and combined effort of all of its employees. Performance is the key multi
character factor intended to attain outcomes which has a major connection with planned objectives
of the organization (Sabir et al. 2012).
INFRASTRUCTURE
Office environment The office environment in which employees work and carry out most of their activities can impact
on their productivity. The quality and quantity of work generated by employees are influenced by
the office environment (Keeling and Kallaus, 1996). While Quible, (1996) points out those poor
environmental conditions can cause inefficient worker productivity as well as reduce their job
satisfaction, which in turn will impact on the financial well-being of the organization. Most people
spend 50% of their lives within indoor environments, which greatly influence their mental status,
actions, abilities and performance (Sundstrom, 1994). Better outcomes and increased productivity
is assumed to be the result of better workplace environment. Better physical environment of office
will boosts the employees and finally improve their productivity. Various literature relate to the
study of multiple offices and office buildings shows that the factors such as dissatisfaction,
disorderly workplaces and the physical environment, loss of employees’ productivity (Carnevale,
1992; Clements- Croome, 1997).
Office environment can be divided into two components; physical and behavioral. The physical
environment relate to the office occupiers’ ability to physically connect with their office
environment. The behavioral environment is related to how well the office occupiers connect with
each other, and the impact the office environment can have on the behavior of the individual. The
physical environment with the productivity of its occupant falls into two main categories office
layout and office comfort, and the behavioral environment represents the two main components

Asian Journal of Empirical Research, 2(4):118-140
122
namely interaction and distraction(Amir and Sahibzada, 2010).Employees in different
organizations have various office designs. Every office has unique furniture and spatial
arrangements, lighting and heating arrangements and different levels of noise. This study analyzes
the impact of the office design factors on employees’ productivity. Literature reveals that good
office design has a positive effect on employees’ productivity and the same assumption is being
tested in this study for the offices of Saudi Aramco, project management in Saudi Arabia (Al-Anzi,
2009).
Office Furniture Administrative office managers should be knowledgeable about office furniture. The selection
improper office furniture may be carry out for a long time, as it is often difficult discarding the pre-
owned furniture, which is commonly purchased rather than leased or rented. Another issue, which
is important to consider in enhancing employee productivity, is by selecting and using proper
furniture and equipment, the important physical factors in the office (Keeling and Kallaus, 1996;
Quible et al. 1996). Selecting appropriate office furniture is an important consideration in which
office managers need to pay more attention to make sure that the ergonomic environment is
properly maintained. While ergonomic environment is important in increasing employee
productivity, adjustable office furniture, such as desks and chairs, which can support employees in
generating their work is recommended, to allow the work comfortably throughout the day (Burke,
2000).
WORKPLACE ENVIRONMENT AND EMPLOYEES PERFORMANCE
Incentives The literature meaning of word “reward” as it is something the offer by the organization to the
workers in response of their performance and contributions which are expected by the workers
mostly (Agarwal, 1998). According to (Opkara, 2002) job satisfaction is an outcome of different
factors like pay, promotion, the work itself, supervision, relationships with co-workers and
opportunities for promotions. The pay is a very important rather than other factor. A reward can be
extrinsic or intrinsic it can be a cash reward such as bounces or it can be recognition such as
naming a worker employee of the month, and at other times a reward refers to a tangible incentive,
reward is the thing that an organization gives to the employee in response of their performance so
that the employees become motivated for future positive behavior. In a corporate environment
rewards can take several forms. It includes the cash bonuses, recognition awards, free goods and
free trips. It is important that the rewards have a lasting impression on the employee and it will
continue to verify the employee’s perception that they are valued mostly (Sheikh et al. 2010).
According to (La Belle, 2005), different individuals have different perceptions of rewards. Some
individuals may consider cash as a sufficient reward for their efforts at work, while others may
consider holidays and material incentives (such as a car) as more rewarding in exchange for their

Asian Journal of Empirical Research, 2(4):118-140
123
work. In a study conducted by Probst and Brubaker, (2001) they concluded that the difference
between job satisfaction and dissatisfaction lies in the amount and the type of rewards provided or
given to the employees and the amount and the percentage and type of rewards that the employee
expects he/she deserves.
Different researcher conducted studies and found that job dissatisfaction is the outcome of
insecurity among employees (Ashford et al., 1989; Davy et al., 1991). Nguyen et al., (2003)
investigate relationship among job satisfaction and pay was conducted and it was also found that
job satisfaction is affected by the pay. According to Guest, (2004); Silla et al. (2005) important
factors like low job security, working conditions and the nature of work, low wages and lack of
promotion, low job autonomy have adverse affect on the level of job satisfaction of employees.
Employee’s intrinsic motivation can be defined as the source of motivation which actually comes
from performing a task for its own sake. Employees who are intrinsically motivated often perceive
that their work gives them a sense of accomplishment and achievement or they feel that they are
doing something worthy. Extrinsic motivation is the motivation that the employees perform to
avoid punishment or acquire material or social rewards. In this case, employees perform not for
their own sake but rather for their outcomes (George and Jones, 2005). Johnson et al. (1986)
contend that by providing employees with as much rewards as possible (in proportion to their work
efforts), employees are able to function more efficiently. They are also less likely to make mistakes
in their work, and managers are also able to successfully boost the morale of their employees.
Khan, (2005) explained the nature of government organizations in Pakistan and studied how to
motivate the performance of government employees. He suggested government organizations not
give many incentives to employees on the basis of their performance; their motivation level is low
as compare to private sector employees. He argued that due to job security and no fear of firing,
employees are not willing to work at their full potential. He argued that because government
organizations are similar to non -profit organizations, the same motivational techniques used in
non-profit organizations can be used in government sectors to motivate employees. Work
environment plays a key role in developing employees’ attitudes and behaviors. Motivation is also
dependent upon work environment.
In an incentive-based environment, incentive contracting is intended to reward personnel based on
performance. An incentive is normally given by an owner or manager to subordinates to encourage
them to perform better. The amount of the incentive is normally determined by the owner, and
subsequently negotiated with subordinates or. Owners usually offer incentive for early project
completion, high quality work delivery, or for less costly project completion. Incentive can be
either financial or non-financial, and may recognize personnel contribution to the entire project
process (Bubshait, 2003).

Asian Journal of Empirical Research, 2(4):118-140
124
Workload Workload refers to the intensity of job assignments. It is a source of mental stress for employees.
Stress is an active state of mind in which human being faces both an opportunity and constraint.
Allen, (1996) defined workload as the total amount of time a faculty member devotes to activities
like teaching, research, administration, and community services etc. A study conducted by Moy,
(2006) sais that Clerical and Professional Workers' Association found that 65.5% of workers
believed a five-day work week would help them better manage their private matters, where as half
of respondents believed that this practice would allow them to spend more time with their families
and improve their quality of life which helps in improving their productivity at work. Several
studies have highlighted the consequences of work overload. Workload stress can be defined as
unwillingness to come to work and a feeling of constant pressure accompanied by the general
physiological, psychological, and behavioral stress symptoms. Numerous studies found that job
stress influences the employees’ job satisfaction and their overall performance in their work.
Because most of the organizations now are more demanding for better job outcomes. In fact,
modern times have been called as the “age of anxiety and stress” (Rehman et al. 2012). Excessive
work interference with family is also associated with greater stress mostly, job burnout, increased
absenteeism and higher turnover (Sutton 2000; Anderson et al., 2002). According to Jex and Beehr,
(1991) strains associated with being overworked have been found to be uniformly negative across
behavioral, psychological, and physiological outcome domains. According to Kirchmeyer, (1995)
Researchers indicated negative links in between experience of work/nonworking conflict and
organizational commitment.
Long working hours may affect the physical condition of employees. The employees facing
workload have a moderate level of stress in which work to family conflict rises. Workers in stress
and having work to family conflict also have intention to quit the job because they are not
performing their social roles efficiently. In Pakistan, there is problem that employers are majorly
concerned with less staff and as a result, the workload of employees is increasing. Mostly,
employees of banks in Pakistan have increasing frustration due to heavy workload. Stress usually
generates from workload and workload extends working hours on jobs which ultimately disturbs
the incumbent’s roles in the family and society as well, because a worker has to fulfill other roles in
his life (Imam et al. 2010).
Harassment Harassment is a type of conflict that is difficult to manage for several reasons. First, harassment is
often surrounded by silence, unspoken words and allusion. Second, harassment is often a question
of perception. Harassment is highly subjective and speaks more to a person’s emotions than their
reason, particularly because it poses a threat to their psychological integrity and identity. Third,
harassment is an issue of power between individuals. In most cases, values, morality provide a
framework for and “civilize” the exercise of power. At the individual level, the uncivilized exercise
of power results in violence and psychological harassment. Moreover harassment is the modern-

Asian Journal of Empirical Research, 2(4):118-140
125
day “big bad wolf.” Some employees tend to cry wolf every time they are the target of behavior
that makes them uncomfortable, particularly when they are given an unsatisfactory performance
evaluation, when they are routinely monitored in an effort to improve their work performance
(Lévesque, 2007).
Workplace harassment means negative office interaction that affects the individual’s job by
affecting the terms and conditions and job decisions and such actions do not fall within the
boundaries of law. In a country like Pakistan, women have started working along men, side by side
in the organizations, and although women are being welcomed in the organizations across the
country, the traditional organizational settings are still male dominated in their setup and as a
result, women tend to face resistance in getting accepted as equals in the organizations (Nazir et al.
2011). Parker and Griffin, (2002) have studied gender harassment’s negative consequences on
distress and over performance demand.
According to (Lee, 2005) Psychological harassment and bullying are reduced when employers
promote a fair and team-based work climate; provide sufficient job autonomy and resources to their
workers so as to head-off unnecessary conflicts. When a supportive team environment exists,
victims will feel greater sense of empowerment and control, on the one hand, and bullies will have
fewer incentives to engage in dysfunctional, conflict-escalating behaviors, on the other. Another
recent study of a diverse occupational sample of 180 workers in the Canadian prairies found that
40% reported experiencing at least 1 of 45 specific acts indicative of psychological harassment or
bullying on a weekly basis for at least 6 months. An additional 10% of the sample reported
experiencing 5 or more such acts on a weekly basis for at least 6 months.
RESEARCH METHODOLOGY In order to investigate the research goals, a total of 150 respondents of male and female employees
of both teaching and non teaching category were selected. Selected participants answered a survey
questionnaire. Wimmer and Dominick, (2006) write, “Surveys are now used in all areas of life.
Businesses, consumer groups, politicians, and advertisers use them in their everyday decision-
making process”. Babbie, (1992) writes, “Surveys may be used for descriptive, explanatory, and
exploratory purposes. They are chiefly used in studies that have individual people as the units of
analysis”. The universe is set of all units that the research covers, or to which it can be generalized
(Neuman, 2006).The term “units” is employed because it is not necessarily people who are being
sampled-the researcher may want to sample from a universe of nations, regions, schools, etc.
(Bryman, 2001).The universe of this research comprised male and female employees of both
teaching and non teaching of employees of University of Sargodha. Sample was collected by
convenience and selective methods. The reason for sampling rather than collecting data from the
entire population, are self evident. In research investigations involving several hundreds or
thousands of elements, it would be practically impossible to collect data from, or test, or examine

Asian Journal of Empirical Research, 2(4):118-140
126
every element. Even if it were possible, it would be prohibitive in terms of time, cost and other
human resources. That’s why sampling to make a research feasible (Sekaran, 2010). Before the
collection of data from the specified sample, a pre-test was taken in the selected population. It gives
the researcher an opportunity to see weaknesses. The Reliability Statistics of the pre-testing was
“Cronbach's Alpha-.861”.
DATA ANALYSIS Part-A (Uni-variate analysis)
Table-1: Distribution of the respondent about their socio-economic background
Gender Frequency PercentageMale 75 50.0 Female 75 50.0 Age (in years) Up to 30 years 80 53.3 31 to 40 years 47 31.3 41 to 50 years 23 15.3 Education level Matric 7 4.7 Intermediate 20 13.3 Graduation 44 29.3 Master or above 79 52.7 Working position Teaching staff 75 50.0 Non-teaching staff 75 50.0
Table-1 shows that about a half (50.0%) of the respondents were males and other half of them were
females. Table presents the age distribution of the respondents. More than a half i.e. 53.3 percent of
the respondents had up to 30 years of age, little less than one-third i.e. 31.3 percent of them had 31-
40 years of age and 15.3 percent of them had 41-50 years of age. So majority of the respondents
belonged to young age group. Table visibly presents the educational level of the respondents. Table
shows that only 4.7 percent of the respondents were matriculated, while 13.3 percent of them were
intermediate, 29.3 percent of them were graduated and a majority of the respondents i.e. 52.7
percent of them had mastered or above level of education. Above findings shows that majority of
the respondents had graduation and above level of education. Table shows that a half (50.0%) of
the respondents was teaching staff of the Sargodha University and other 50.0 percent of them were
non-teaching staff.

Asian Journal of Empirical Research, 2(4):118-140
127
Table-2: Distribution of the respondents about to their opinion about the infrastructure
Respondents’ opinion about infrastructure
Strongly agree
Agree Neutral Disagree Strongly disagree
F. % F. % F. % F. % F. % Do you think that your furniture is according to your need
16 10.7 66 44.0 21 14.0 39 26.0 8 5.3
Do you think that your furniture is comfortable enough so that you can work without getting tired
17 11.3 47 31.3 37 24.7 28 18.7 21 14.0
Do you think that office environment influences your performance
83 55.3 53 35.3 11 7.3 3 2.0 0 0.0
Table-2 presents the respondents’ opinion about the infrastructure on their work place. Only 10.7
percent of the respondents were strongly agreed, a major proportion i.e. 44.0 percent of them were
agreed with the thinking that their furniture is according to their need, while 14.0 percent of them
were neutral, 26.0 percent of them were disagreed and remaining 5.3 percent of them were strongly
disagreed with the furniture of their workplace. Just 11.3 percent of the respondents were strongly
agreed, 31.3 percent of them were agreed with the thinking that their furniture is comfortable
enough so that they can work without getting tired, while 24.7 percent of them were neutral, 18.7
percent of them were disagreed and remaining 14.0 percent of them were strongly disagreed with
this opinion. A majority i.e. 55.3 percent of the respondents were strongly agreed, 35.3 percent of
them were agreed with the thinking that office environment influences on their performance, while
7.3 percent of them were neutral and 2.0 percent of them were disagreed with this opinion.
Table-3: Distribution of the respondents about their opinion about the room environment
Respondents’ opinion about room environment
Strongly agree
Agree Neutral Disagree Strongly disagree
F. % F. % F. % F. % F. % Do you think that your room temperature is pleasant enough for work
17 11.3 38 25.3 21 14.0 50 33.3 24 16.0
Do you think that good room temperature increase your work performance
88 58.7 50 33.3 8 5.3 4 2.7 0 0.0
Do you think that overall temperature of your workspace is Pleasant to work easily
28 18.7 31 20.7 30 20.0 50 33.3 11 7.3
Table-3 presents the respondents’ opinion about the room environment on their work place. Only
11.3 percent of the respondents were strongly agreed, about one-fourth i.e. 25.3 percent of them
were agreed with the thinking that their room temperature is pleasant enough for work, while 14.0
percent of them were neutral, 33.30 percent of them were disagreed and 16.0 percent of them were

Asian Journal of Empirical Research, 2(4):118-140
128
strongly disagreed with this opinion. A majority i.e. 58.7 percent of the respondents were strongly
agreed, about one-third i.e. 33.3 percent of them were agreed with the thinking that good room
temperature increase their work performance, while 5.3 percent of them were neutral, 2.7 percent
of them were disagreed with this opinion. About 18.7 percent of the respondents were strongly
agreed, 20.7 percent of them were agreed with the thinking that overall temperature of their
workspace is pleasant to work easily, while 20.0 percent of them were neutral, 33.3 percent of them
were disagreed and 7.3 percent of them were strongly disagreed with this opinion.
So the room temperature had a good impact on the employee’s performance.
Table-4: Distribution of the respondents about their own separate office
Having own separate office Frequency Percentage Yes 51 34.0 No 99 66.0 Total 150 100.0
Table-4 indicates that about one-third i.e. 34.0 percent of the respondents reported that they having
own separate office, while a large majority i.e. 66.0 percent of them never having a separate office.
Table-5: Distribution of the respondents about to their opinion about the separate office
Respondents’ opinion about the separate office
Strongly agree
Agree Neutral Disagree Strongly disagree
F. % F. % F. % F. % F. % Do you think that separate office is necessary to work effectively and efficiently
66 44.0 51 34.0 16 10.7 14 9.3 3 2.0
Do you think that separate offices can improve employees performance
67 44.7 57 38.0 16 10.7 8 5.3 2 1.3
Do you think that separate office is the need of every employee
34 22.7 50 33.3 24 16.0 28 18.7 14 9.3
Table-5 presents the respondents’ opinion about the separate office. A major proportion i.e. 44.0
percent of the respondents were strongly agreed, about one-third i.e. 34.0 percent of them were
agreed with the thinking that separate office is necessary to work effectively and efficiently, while
10.7 percent of them were neutral, 9.3 percent of them were disagreed and only 2.0 percent of them
were strongly disagreed with this opinion. So the separate office had very effective role in the
employee’s performance. A major proportion i.e. 44.7 percent of the respondents were strongly
agreed, more than one-third i.e. 38.0 percent of them were agreed with the opinion that separate
office can improve employees performance, while 10.7 percent of them were neutral, 5.3 percent of
them were disagreed and only 1.3 percent of them were strongly disagreed with this opinion. So
the separate office can improve employee’s performance. About 22.7 percent of the respondents
were strongly agreed, about one-third i.e. 33.3 percent of them were agreed with the opinion that

Asian Journal of Empirical Research, 2(4):118-140
129
separate office is the need of every employee, while 16.0 percent of them were neutral, 18.7
percent of them were disagreed and 9.3 percent of them were strongly disagreed with this opinion.
Table-6: Distribution of the respondents about their opinion about the internet facility
Respondents’ opinion about the internet facility
Strongly agree
Agree Neutral Disagree Strongly disagree
F. % F. % F. % F. % F. % Do you have access to internet facility at work place
53 35.3 66 44.0 7 4.7 18 12.0 6 4.0
Do you think that internet help you to work in efficient way
73 48.7 59 39.3 12 8.0 6 4.0 0 0.0
Do you think that favorable environmental conditions (internet facilities, comfortable temperature, separate offices etc) in the work place help you to complete your work task in time
100
66.7 46 30.7 3 2.0 1 0.7 0 0.0
Table-6 presents the respondents’ opinion about the internet facility. More than one-third i.e. 35.3
percent of the respondents were strongly agreed and a major proportion i.e. 44.0 percent of them
were agreed that they have access to internet facility at work place, while 4.7 percent of them were
neutral, 12.0 percent of them were disagreed and only 4.0 percent of them were strongly disagreed
with this facility. Little less than a half i.e. 48.7 percent of the respondents were strongly agreed,
39.3 percent of them were agreed with the thinking that internet help them to work in efficient way,
while 8.0 percent of them were neutral, 4.0 percent of them were disagreed with this opinion. So a
huge majority of them had opinion that the internet helps them to work in efficient way. A
significant majority i.e. 66.7 percent of the respondents were strongly agreed, 30.7 percent of them
were agreed with the thinking that favorable environmental conditions (internet facilities,
comfortable temperature, separate offices etc) in the work place help them to complete their work
task in time, while only 2.0 percent of them were neutral and only one respondent was disagreed
with this opinion.
Table-7 presents the respondents’ opinion about the incentives. More than one-third i.e. 37.3
percent of the respondents were strongly agreed and a major proportion i.e. 40.0 percent of them
were agreed with the thinking that employees are recognized as valuable work assets, while 20.7
percent of them were neutral, 2.0 percent of them were disagreed with this opinion. So majority of
them had thinking that employees are recognized as valuable work assets. About one-fourth i.e.
26.0 percent of the respondents were strongly agreed and 30.0 percent of them were agreed with
the opinion that have an opportunity for career advancement in their current organization.

Asian Journal of Empirical Research, 2(4):118-140
130
Table-7: Distribution of the respondents about their opinion about the incentives
Respondents’ opinion about the incentives
Strongly agree
Agree Neutral Disagree Strongly disagree
F. % F. % F. % F. % F. % Do you think that employees are recognized as valuable work assets
56 37.3 60 40.0 31 20.7 3 2.0 0 0.0
Do you have an opportunity for career advancement in your current organization
39 26.0 45 30.0 44 29.3 17 11.3 5 3.3
Do you have good opportunities to improve your skills here
41 27.3 69 46.0 24 16.0 10 6.7 6 4.0
Do you think that your job is secure
42 28.0 63 42.0 23 15.3 17 11.3 5 3.3
Do you think that your job status is satisfied
30 20.0 61 40.7 29 19.3 22 14.7 8 5.3
Do you think that your salary is appropriate to your work load
23 15.3 38 25.3 28 18.7 51 34.0 10 6.7
Do you think that promotions are made fairly on the basis of performance
16 10.7 32 21.3 41 27.3 30 20.0 31 20.7
Do you received recognition for your job accomplishment
19 12.7 56 37.3 38 25.3 27 18.0 10 6.7
Do you think that recognition improve your job performance
64 42.7 66 44.0 14 9.3 2 1.3 4 2.7
Do you think that rewards that you receive are less than job accomplishment
24 16.0 61 40.7 22 14.7 35 23.3 8 5.3
Do you think that better incentives can improve employees’ performance
86 57.3 48 32.0 8 5.3 6 4.0 2 1.3
Do you think that bonuses increase the employees performance
95 63.3 45 30.0 7 4.7 2 1.3 1 0.7
Do you think that extrinsic rewards are more important than intrinsic rewards
37 24.7 31 20.7 30 20.0 21 14.0 31 20.7
More than one-fourth i.e. 27.3 percent of the respondents were strongly agreed and a major
proportion i.e. 46.0 percent of them were agreed with the opinion that have good opportunity to
improve their skills here, while 16.0 percent of them were neutral, 6.7 percent of them were
disagreed and 4.0 percent of them were strongly disagreed with this opinion. More than one-fourth
i.e. 28.0 percent of the respondents were strongly agreed and a major proportion i.e. 42.0 percent of
them were agreed that their job is secure, while 15.3 percent of them were neutral, 11.3 percent of
them were disagreed and 3.3 percent of them were strongly disagreed with this opinion. About 40.7
percent were agreed with their thinking that their job status is satisfied, while 14.7 percent of them

Asian Journal of Empirical Research, 2(4):118-140
131
were disagreed with this opinion. About 15.3 percent of the respondents were strongly agreed that
their salary is appropriate to their work load, while 34.0 percent of them were disagreed and 6.7
percent of them were strongly disagreed with this opinion. About 10.7 percent of the respondents
were strongly agreed and 21.3 percent were them were agreed with their thinking that promotions
are made fairly on the basis of performance. About 12.7 percent of the respondents were strongly
agreed and more than one-third i.e. 37.3 percent were them were agreed with the opinion that they
received recognition for their job accomplishment, while 25.3 percent of them were neutral, 18.0
percent of them were disagreed and 6.7 percent of them were strongly disagreed with this opinion.
About 42.7 percent of the respondents were strongly agreed and a major proportion i.e. 44.0
percent of them were agreed with the thinking that recognition improve their job performance,
while 9.3 percent of them were neutral, 1.3 percent of them were disagreed and 2.7 percent of them
were strongly disagreed with this opinion.
About 16.0 percent of the respondents were strongly agreed and a major proportion i.e. 40.7
percent of them were agreed with the thinking that rewards they received are less than job
accomplishment, while 14.7 percent of them were neutral, 23.3 percent of them were disagreed and
5.3 percent of them were strongly disagreed with this opinion. Majorities i.e. 57.3 percent of the
respondents were strongly agreed and 32.0 percent of them were agreed with the thinking that
better incentives can improve employees’ performance, while 5.3 percent of them were neutral, 4.0
percent of them were disagreed and 1.3 percent of them were strongly disagreed with this opinion.
Large majorities i.e. 63.3 percent of the respondents were strongly agreed and 30.0 percent of them
were agreed with the thinking that bonuses increase the employee’s performance, while 4.7 percent
of them were neutral, 1.3 percent of them were disagreed and 0.7 percent of them were strongly
disagreed with this opinion. About one-fourth i.e. 24.7 percent of the respondents were strongly
agreed and 20.7 percent of them were agreed with the thinking that extrinsic rewards are more
important than intrinsic reward, while 20.0 percent of them were neutral, 14.0 percent of them were
disagreed and 20.7 percent of them were strongly disagreed with this opinion.
Table-8: Distribution of the respondents about offering any bonus to them in last year
Offering any bonus to them in previous year
Frequency Percentage
Yes 56 37.3 No 94 62.7 Total 150 100.0
Table-8 shows that more than one-third i.e. 37.3 percent of the respondents reported that their
institutions were offering any bonus to them in previous year, while a large majority i.e. 62.7
percent of them were replied negatively.

Asian Journal of Empirical Research, 2(4):118-140
132
Table-9: Distribution of the respondents about their opinion about harassment
Respondents’ opinion about harassment
Strongly agree
Agree Neutral Disagree Strongly disagree
F. % F. % F. % F. % F. % Do you ever observed or experienced harassment at workplace.
18 12.0 36 24.0 25 16.7 39 26.0 32 21.3
Do you think that Harassment is a big obstacle in the way of efficient work
63 42.0 59 39.3 22 14.7 4 2.7 2 1.3
Do you think that harassment is a big obstacle in the way of your promotion
50 33.3 49 32.7 27 18.0 21 14.0 3 2.0
Do you think that office Environment is suitable for female employees
36 24.0 51 34.0 35 23.3 19 12.7 9 6.0
Do you think that male officers make unfair use of their authority
26 17.3 36 24.0 36 24.0 33 22.0 19 12.7
Do you think that female employees have to face more harassment than male employees
44 29.3 62 41.3 12 8.0 21 14.0 11 7.3
Do you think that things like harassment create a stress full environment at workplace
84 56.0 46 30.7 11 7.3 7 4.7 2 1.3
Table-9 presents the respondents’ opinion about harassment. 12.0 percent of the respondents were
strongly agreed and about one-fourth i.e. 24.0 percent of them were agreed that they ever observed
or experienced harassment at workplace, while 16.7 percent of them were neutral, 26.0 percent of
them were disagreed and 21.3 percent of them were strongly disagreed with this opinion. So
majority of them had thinking that sampled employed had no harassment at their workplace. A
major proportion i.e. 42.0 percent of the respondents were strongly agreed and 39.3 percent of
them were agreed with the thinking that harassment is a big obstacle in the way of efficient work,
while 14.7 percent of them were neutral, 2.7 percent of them were disagreed and 1.3 percent of
them were strongly disagreed with this opinion. It is clear from the above findings that the
harassment is a big obstacle in the way of efficient work.
About one-third respondents were strongly agreed and 32.7 percent of them were agreed that
harassment is a big obstacle in the way of their promotion. While 18.0 percent of them were
neutral, 14.0 percent of them were disagreed and 2.0 percent of them were strongly disagreed with
this opinion. It is clear from the above findings that the harassment is a big obstacle in the way of
promotion. About one-fourth i.e. 24.0 percent of the respondents were strongly agreed and 34.0
percent of them were agreed with the thinking that office environment is suitable for female

Asian Journal of Empirical Research, 2(4):118-140
133
employees, while 23.3 percent of them were neutral, 12.7 percent of them were disagreed and 6.0
percent of them were strongly disagreed with this opinion.
About 17.3 percent of the respondents were strongly agreed and 24.0 percent of them were agreed
with the thinking that male officers make unfair use of their authority, while another 24.0 percent
of them were neutral, 22.0 percent of them were disagreed and 12.7 percent of them were strongly
disagreed with this opinion. About 29.3 percent of the respondents were strongly agreed and 41.3
percent of them were agreed with the thinking that female employees have to face more harassment
than male employees, while 8.0 percent of them were neutral, 14.0 percent of them were disagreed
and 7.3 percent of them were strongly disagreed with this opinion. So a large majority of the
respondents had female emplo6yees have to face more harassment than male employees. Majorities
i.e. 56.0 percent of the respondents were strongly agreed and 30.7 percent of them were agreed
with the thinking that things like harassment create a stressful environment at workplace, while 7.3
percent of them were neutral, 4.7 percent of them were disagreed and 1.3 percent of them were
strongly disagreed with this opinion. So harassment creates a stressful environment at workplace.
Table-10: Distribution of the respondents about their opinion about workload
Respondents’ opinion about workload
Strongly agree
Agree Neutral Disagree Strongly disagree
F. % F. % F. % F. % F. % Do you think your workload disturb your social life
36 24.0 60 40.0 18 12.0 25 16.7 11 7.3
Do you think that your workload is effects your health
40 26.7 57 38.0 18 12.0 25 16.7 10 6.7
Do you think that your workload force you to do over time work
30 20.0 49 32.7 31 20.7 28 18.7 12 8.0
Do you think too much workload creates stress
57 38.0 64 42.7 16 10.7 11 7.3 2 1.3
Do you think that too much workload negatively affect your performance
41 27.3 64 42.7 20 13.3 20 13.3 5 3.3
Do you think that comfortable environment can help you to complete your daily tasks easily
70 46.7 64 42.7 13 8.7 2 1.3 1 0.7
Do you think that challenging task improve your performance
63 42.0 62 41.3 18 12.0 6 4.0 1 0.7
Do you able to complete your work task in given time
57 38.0 66 44.0 18 12.0 6 4.0 3 2.0
Table-10 presents the respondents’ opinion about workload. 24.0 percent of the respondents were
strongly agreed and a major proportion i.e. 40.0 percent of them were agreed with the thinking that

Asian Journal of Empirical Research, 2(4):118-140
134
their workload disturbed their social life, while 12.0 percent of them were neutral, 16.7 percent of
them were disagreed and 7.3 percent of them were strongly disagreed with this opinion. So
majority of them had thinking that workload disturbed their social life. More than one-fourth i.e.
26.7 percent of the respondents were strongly agreed and 38.0 percent of them were agreed with
the thinking that their workload is effects their health, while 12.0 percent of them were neutral,
16.7 percent of them were disagreed and 6.7 percent of them were strongly disagreed with this
opinion.
More than one-fifth i.e. 20.0 percent of the respondents were strongly agreed and 32.7 percent of
them were agreed with the thinking that their workload force them do over time work, while 20.7
percent of them were neutral, 18.7 percent of them were disagreed and 8.0 percent of them were
strongly disagreed with this opinion. About 38.0 percent of the respondents were strongly agreed
and 42.7 percent of them were agreed with the thinking that too much workload create stress, while
10.7 percent of them were neutral, 7.3 percent of them were disagreed and only 1.3 percent of them
were strongly disagreed with this opinion. So a huge majority of the respondents had thinking that
too much workload creates stress.
About 27.3 percent of the respondents were strongly agreed and 42.7 percent of them were agreed
with the thinking that too much workload negatively affect their performance, 13.3 percent of them
were neutral and another 13.3 percent of them were disagreed and 3.3 percent of them were
strongly disagreed with this opinion. A major proportion i.e. 46.7 percent of the respondents were
strongly agreed and 42.7 percent of them were agreed with the thinking that comfortable
environment can help them to complete their daily tasks easily, 8.7 percent of them were neutral
and 1.3 percent of them were disagreed and 0.7 percent of them were strongly disagreed with this
opinion.
A major proportion i.e. 40.0 percent of the respondents were strongly agreed and 41.3 percent of
them were agreed with the thinking that challenging task improve their performance, 12.0 percent
of them were neutral, 4.0 percent of them were disagreed and 0.7 percent of them were strongly
disagreed with this opinion. About 38.0 percent of the respondents were strongly agreed and 44.0
percent of them were agreed with the thinking that challenging task improve their performance,
12.0 percent of them were neutral, 4.0 percent of them were disagreed and 0.7 percent of them were
strongly disagreed with this opinion. The indexation is pasted in Table-11.
Table-12 presents the association between infrastructure and employees performance. Chi-square
value shows a non-significant association between infrastructure of work place and employee’s
performance. Gamma value also shows no relationship between the variables. It means
infrastructure of work place had no impact on employee’s performance. So the hypothesis “It is
more likely that better infrastructure have positive impact on employees performance of university
of Sargodha” is rejected.

Asian Journal of Empirical Research, 2(4):118-140
135
Table-11: Indexation
Variable No. of items in Matrix Question
No. of categories in Index variable
Min. Score
Max. Score
Mean Score
SD Alpha value
Employees performance
19 5 41 71 56.58 4.59 .7826
Infrastructure 2 5 2 10 5.56 2.23 .8704 Workplace environment
8 5 7 25 15.65 3.66 .7309
Incentives 5 5 6 21 12.78 2.64 .6801 Harassment 6 5 8 26 14.64 3.46 .6826 Workload 6 5 6 22 12.82 4.04 .7071
PART-B (Bivariate Analysis)
Testing Of Hypotheses
Hypothesis 1: Better infrastructure has positive impact on employees’ performance
Table-12: Association between infrastructure and employees performance
Infrastructure Employees performance Total
Low Medium High Low
11 33 13 57 19.3% 57.9% 22.8% 100.0%
Medium
14 26 17 57 24.6% 45.6% 29.8% 100.0%
High 4 22 10 36 11.1% 61.1% 27.8% 100.0%
Total
29 81 40 150 19.3% 54.0% 26.7% 100.0%
Chi-square = 8.85 d.f = 4 significance = 0.426NS Gamma = 0.096 NS= non-significant
Hypothesis 2: Better incentives for employees at workplace can improve the employees’
performance
Table-13 presents the association between incentive and employees’ performance. Chi-square value
shows a significant association between incentives and employee’s performance. Gamma value
also shows positive relationship between the variables. It means incentives had positive impact on
employee’s performance. So the hypothesis “It is more likely that better incentives for employees
at workplace can improve the employees’ performance” is accepted.

Asian Journal of Empirical Research, 2(4):118-140
136
Table-13: Association between incentives place environment and employees performance
Incentives Employees performance Total
Low Medium High Low
10 12 5 27 37.0% 44.4% 18.5% 100.0%
Medium
15 64 23 102 14.7% 62.7% 22.5% 100.0%
High 4 5 12 21 19.0% 23.8% 57.1% 100.0%
Total
29 81 40 150 19.3% 54.0% 26.7% 100.0%
Chi-square = 9.58 d.f = 4 significance = 0.042 *Gamma = 0.314*= Significant
Hypothesis-3: Workload affects the employee’s performance negatively
Table-14: Association between workload and employees performance
Workload Employees performance Total
Low Medium High Low
7 27 9 43 16.3% 62.8% 20.9% 100.0%
Medium
18 36 23 77 23.4% 46.8% 29.9% 100.0%
High 4 18 8 30 13.3% 60.0% 26.7% 100.0%
Total
29 81 40 150 19.3% 54.0% 26.7% 100.0%
Chi-square = 3.80 d.f = 4 Significance = 0.433NS Gamma = 0.063 NS= non-significant
Table-14 presents the association between workload and employees’ performance. Chi-square
value shows a non-significant association between workload and employee’s performance. Gamma
value also shows no relationship between the variables. It means workload also had no impact on
employees’ performance. So the hypothesis “It is more likely that too much workload affects the
employees performance negatively” is rejected.
Hypothesis-4: female employees have to face more harassment at workplace than male
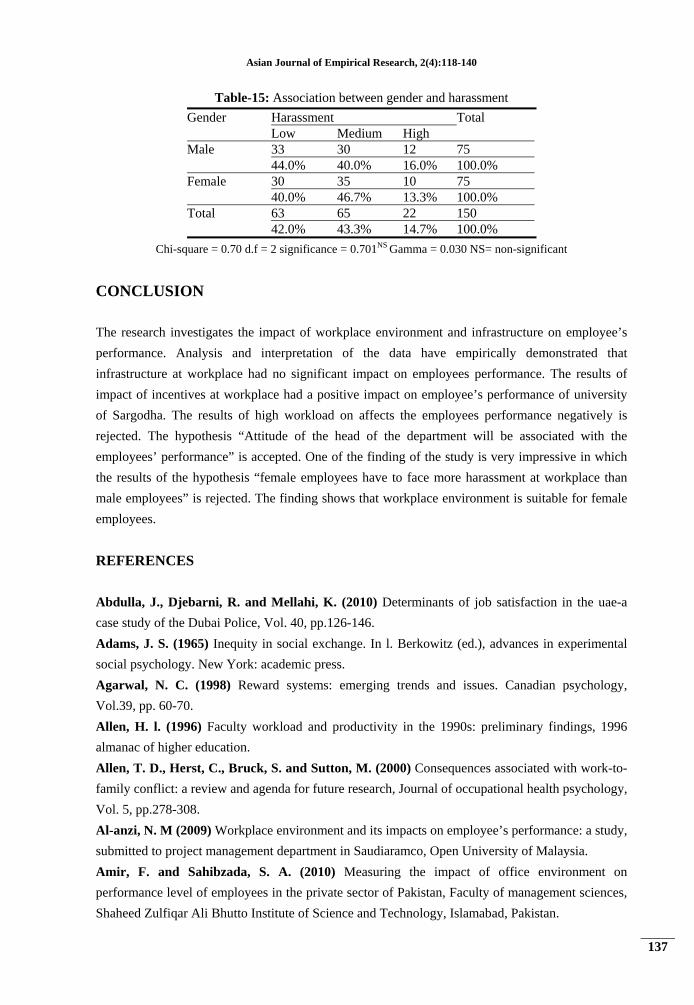
Table-15 presents the association between gender and facing harassment. Chi-square value shows a
non-significant association between gender and harassment. Gamma value also shows no
relationship between the variables. It means gender discrimination was not found between the
employees of Sargodha University. So the hypothesis “I It is more likely that female employees
have to face more harassment at workplace than male employees” is rejected.
Asian Journal of Empirical Research, 2(4):118-140
137
Table-15: Association between gender and harassment
Gender Harassment Total
Low Medium High Male
33 30 12 75 44.0% 40.0% 16.0% 100.0%
Female
30 35 10 75 40.0% 46.7% 13.3% 100.0%
Total 63 65 22 150 42.0% 43.3% 14.7% 100.0%
Chi-square = 0.70 d.f = 2 significance = 0.701NS Gamma = 0.030 NS= non-significant
CONCLUSION
The research investigates the impact of workplace environment and infrastructure on employee’s
performance. Analysis and interpretation of the data have empirically demonstrated that
infrastructure at workplace had no significant impact on employees performance. The results of
impact of incentives at workplace had a positive impact on employee’s performance of university
of Sargodha. The results of high workload on affects the employees performance negatively is
rejected. The hypothesis “Attitude of the head of the department will be associated with the
employees’ performance” is accepted. One of the finding of the study is very impressive in which
the results of the hypothesis “female employees have to face more harassment at workplace than
male employees” is rejected. The finding shows that workplace environment is suitable for female
employees.
REFERENCES
Abdulla, J., Djebarni, R. and Mellahi, K. (2010) Determinants of job satisfaction in the uae-a
case study of the Dubai Police, Vol. 40, pp.126-146.
Adams, J. S. (1965) Inequity in social exchange. In l. Berkowitz (ed.), advances in experimental
social psychology. New York: academic press.
Agarwal, N. C. (1998) Reward systems: emerging trends and issues. Canadian psychology,
Vol.39, pp. 60-70.
Allen, H. l. (1996) Faculty workload and productivity in the 1990s: preliminary findings, 1996
almanac of higher education.
Allen, T. D., Herst, C., Bruck, S. and Sutton, M. (2000) Consequences associated with work-to-
family conflict: a review and agenda for future research, Journal of occupational health psychology,
Vol. 5, pp.278-308.
Al-anzi, N. M (2009) Workplace environment and its impacts on employee’s performance: a study,
submitted to project management department in Saudiaramco, Open University of Malaysia.
Amir, F. and Sahibzada, S. A. (2010) Measuring the impact of office environment on
performance level of employees in the private sector of Pakistan, Faculty of management sciences,
Shaheed Zulfiqar Ali Bhutto Institute of Science and Technology, Islamabad, Pakistan.

Asian Journal of Empirical Research, 2(4):118-140
138
Anderson, S. E. (2002) Formal organizational initiatives and informal workplace practices: links
to work-family conflict and job-related outcomes. Journal of management, Vol. 28, pp.787-810
Ashford, S., Lee, C. and Bobko, P. (1989) Content, causes, and consequences of job insecurity: a
theory-based measure and substantive test. Academy Management Journal, Vol. 32, pp. 803-829.
Babbie, E. (1992) The practice of social research (6th edition). Wadsworth group: a division of
Thomson learning, inc, California.
Billings, A. G. and Moos, R. S. (1982) Work stress and the stress-buffering roles of work and
family resources, Journal of Occupational Behavior, Vol. 3, pp. 215-232.
Brenner, P. (2004) Workers physical surrounding, impact bottom line accounting: smarts
pros.com.
Brill, M., Margulis, S. and Konar, E. B. (1984) Using office design to increase productivity.
Workplace Design and Productivity. buildings/iaq, pp.495-500.
Brown, S. P. and Leigh, T. W. (1996) A new look at psychological climate and its relationship to
job involvement, effort, and performance, Journal of Applied Psychology, Vol. 81, pp. 358-368.
Bryman, A. (2001) Social research methods. Oxford university press.
Bubshait, A. A. (2003) Incentives/disincentives contracts and its effects on industrial projects.
International Journal of Project Management, Vol. 21, pp. 63-70.
Burke, A. (2000) The challenge of seating selection. Ergonomic supplement, Vol. 69, pp. 70-72.
Carnevale, D. G. (1992) Physical settings of work, Public Productivity and Management Review,
Vol. 15, pp. 423-436.
Cascio, W. F. (2006) Managing human resources: productivity, quality of life, profits. Mcgraw-
Hillirwin.
Chandrasekar, K. (2011) Workplace environment and its impact on organizational performance
in public sector organizations, International Journal of Enterprise Computing and Business
Systems, Vol. 7, pp. 17-18.
Clements-Croome, D. J. (1997) Specifying indoor climate, in book naturally ventilated buildings.
Collis, D. J. and Montgomery, C. A. (1995) Competing on resources, Harvard business review,
Vol. 73, pp.118-128.
Cooper, C. L. and Cartwright, S. (1994) Healthy mind, healthy organization: a proactive
approach to occupational stress. Human Relations, Vol. 47, pp. 455-471.
Cummings, I. l. and Schwab, D. P. (1973) Performance in organizations: determinants and
appraisal. Glenview: Scott, Foresman and Company.
Davy, J., Kinicki, A., Scheck, C. (1991) Developing and testing a model of survivor responses to
layoffs. Journal of Vocational Behavior, Vol. 38, pp. 302-317.
Deci, E. and Ryan, R. (2000) The and why of goal pursuits: human needs and the self-
determination of behavior. Psychological Inquiry, Vol. 4, pp.227-269.
George, J. M. and Jones, G. R. (2005) Understanding and managing organizational behavior 4th
edition. New jersey. Pearson prestige hall.

Asian Journal of Empirical Research, 2(4):118-140
139
Guest, D. E. (2004) Flexible employment contracts, the psychological contract and employee
outcomes. an analysis and review of the evidence. International Journal of Management and
Review, Vol. 5/6, pp.1-19.
Imam, H., Qureshi, T. M. and Khan, M. A. (2011) The retrenchment effect on job performance
with mediating effect of work life balance, African Journal of Business Management, Vol. 5, pp.
8642-8648.
James, D. (1996) Forget downsizing, now its participative redesign, and bus. Review Weekly,
Vol.18, pp. 70-72.
Jex, S. M. and Beehr, T. A. (1991) Emerging theoretical and methodological issues in the study of
work-related stress. In k. M. Rowland & g. R. Ferris (eds.), research in personnel and human
resources management, Vol. 9, pp. 311–365.
Johnson, R. A., Neelankavil, J.P. and Jadhav, A. (1986) Developing the executive resource.
Business horizons, pp. 29–33.
Katz, D, K. (1978) The social psychology of organizations. New York.
Keeling, B. I. and Kallaus, N. F. (1996) Administrative office management. 11th. ed.,
International Thompson Publishing, Ohio.
Khan, S. A. (2005) How to motivate good performance among government employees, Pakistan
Journal of Social Sciences, Vol.3, pp. 1138-1143.
Kirchmeyer, C. (1995) Managing the work-nonwork boundary: an assessment of organizational
responses, Human Relations, Vol. 48, pp.515-536.
Lee, R. T. (2005) Dealing with workplace harassment and bullying: some recommendations for
employment standards of Manitoba. University of Manitoba.
Lévesque, G. (2007) A relational model for managing employee performance in difficult situations
while preventing harassment. [email protected]
Miller, L. L. (1997) Not just weapons of the weak: gender harassment as a form of protest for
army men. Social Psychology Quarterly, Vol. 60, pp. 32-51.
Moy, P. (2006) 80 pc of worker support five-day week, South China Morning Post, HongKong.
Neuman, W. I. (2006) Social research method: qualitative and quantitative approaches. Dorling
Kindersley, Pvt Ltd.
Nguyen, A., Taylor, J. and Bradley, S. (2003) Relative pay and job satisfaction. some new
evidence, MPRA paper no 1382.
Opkarajo, J. O. (2002) The impact of salary differential on managerial job satisfaction.A study of
the gender gap and its implications for management education and practice in a developing
economy, Journal of Business and Development of Nation, pp. 65-92.
Parker, S. K. and Griffin, M. A. (2002) What is so bad about a little name-calling? negative
consequences of gender harassment for over performance demands and distress, Journal of
Occupational and Health Psychology, Vol. 7, pp. 195-210.
Quible, Z. K. (1996) Administrative office management: an introduction. 7th. Ed., Prentice-Hall,
New Jersey.

Asian Journal of Empirical Research, 2(4):118-140
140
Rehman, M., Irum, R., Tahir, N., Ijazz, A., Noor, U. and Salma, U. (2012) The impact of job
stress on employee job satisfaction: a study on private colleges of Pakistan, Journal of Business
Studies Quarterly, Vol. 3, pp. 50-56.
Sabir, M. S., Iqbal, J. J., Rehman, K., Shah, K. A. and Yameen, M. (2012) Impact of corporate
ethical values on ethical leadership and employee Performance, International Journal of Business
and Social Science, Vol. 3, pp. 163-171.
Sekaran. U. R. B. (2010) Research methods for business.
CIDA, (1996) promoting sustainable livelihoods, Stockholm: Swedish international co-operation
development agency.
Silla, I., Gracia, F, Peirojm. (2005) Job insecurity and health-related outcomes among different
types of temporary workers. Economic and Industrial Democracy, Vol. 26, pp. 89–117.
Srivastava, A. K. (2008) Effect of perceived work environment on employees job behavior and
organizational effectiveness, Journal of Applied Psychology Banarashindu, University, Varanasi.
Stannack, P. (1996) Perspective on employees performance, Management research news, Vol. l19,
pp. 38-40.
Sundstrom, E. (1994) office noise, satisfaction, and performance, Environment and Behavior,
Vol.26, pp. 195-222.
Taiwo, A. S. (2009) The influence of work environment on workers’ productivity: a case of
selected oil and gas industry in Lagos, Nigeria, African Journal of Business Management, Vol. 4,
pp. 299-307.
Tehrani, N. (2002) Managing organizational stress, www.cipd.co.uk.
Varol, F. (2010) The effect of organizational commitment and job satisfaction and employee
turnover intentions: an application of Konya province on the pharmaceutical sector employees.
Master thesis, Selcuk University, Konya, Turkey.
Vischer, J. C. (2008) Towards a user-centered theory of the built environment. Building Research
and Information, Vol. 36, pp.231-240.
Wimmer, R. D. and Dominick, J. R. (2006) Mass media research. Wadsworth group: a division
of Thomson Learning, California.