Asian Journal of Agriculture and Rural Development1)2019-AJARD-19-32.pdf · Madukoro Village in...
14
19 ANALYSIS OF HOUSEHOLD FOOD SECURITY POLICY: CASE OF FOOD SECURITY VILLAGE PROGRAMME, INDONESIA Muhamad Rusliyadi a Azaharaini Bin Hj. Mohd. Jamil b Ratna Tri Kumalasari c a Polytechnic of Agricultural Development Yogyakarta- Magelang, Agricultural Extension and Human Resource Development Agency, Ministry of Agriculture, Indonesia b Institute of Policy Studies, University of Brunei Darussalam, Brunei Darussalam c Agriculture Extension Officer, Agricultural and Food Security Office, Kebumen Regency, Indonesia [email protected] (Corresponding author) Corresponding author ARTICLE HISTORY: Received: 11-Feb-2019 Accepted: 01-Apr-2019 Online Available: 09- May-2019 Keywords: Food security, household level, Indonesia ABSTRACT The study analyzes food self-sufficiency village programme (DMP programme) at household level in the Central Java province of Indonesia. The data of DMP programme was collected by unstructured and semi structured questionnaires and Focus group discussions. The survey was conducted in four villages each consisting of 100 samples based on purposive and clustered sampling technique. The study compares the implication between indicators before and after the policy. It is found that the impact of the DMP programme on the villages was positive. The level of poverty in each village has been significantly reduced by 8-40% after the introduction of the Programme. The composite food security analysis at household level shows the positive impacts of the Programme. Contribution/ Originality This research is an original example of the use of food security analysis on a household level and is implemented in one of the government programs based on poverty and food security (food self- sufficiency programme). This research illustrates how a government policy can increase the food security of its people and contribute to poverty alleviation. DOI: 10.18488/journal.1005/2019.9.1/1005.1.19.32 ISSN (P): 2304-1455/ISSN (E):2224-4433 How to cite: Muhamad Rusliyadi, Azaharaini Bin Hj. Mohd. Jamil and Ratna Tri Kumalasari (2019). Analysis of household food security policy: case of food security village programme, Indonesia. Asian Journal of Agriculture and Rural Development, 9(1), 19-32. © 2019 Asian Economic and Social Society. All rights reserved. Asian Journal of Agriculture and Rural Development Volume 9, Issue 1 (2019): 19-32 http://www.aessweb.com/journals/5005
Transcript of Asian Journal of Agriculture and Rural Development1)2019-AJARD-19-32.pdf · Madukoro Village in...
19
ANALYSIS OF HOUSEHOLD FOOD SECURITY POLICY: CASE OF FOOD
SECURITY VILLAGE PROGRAMME, INDONESIA
Muhamad
Rusliyadia
Azaharaini Bin Hj.
Mohd. Jamil b
Ratna Tri
Kumalasari c
a Polytechnic of Agricultural Development Yogyakarta-
Magelang, Agricultural Extension and Human Resource
Development Agency, Ministry of Agriculture, Indonesia
b Institute of Policy Studies, University of Brunei
Darussalam, Brunei Darussalam
c Agriculture Extension Officer, Agricultural and Food
Security Office, Kebumen Regency, Indonesia
[email protected] (Corresponding author)
Corresponding
author
ARTICLE HISTORY:
Received: 11-Feb-2019
Accepted: 01-Apr-2019
Online Available: 09-
May-2019
Keywords: Food security,
household level,
Indonesia
ABSTRACT
The study analyzes food self-sufficiency village programme (DMP
programme) at household level in the Central Java province of
Indonesia. The data of DMP programme was collected by
unstructured and semi structured questionnaires and Focus group
discussions. The survey was conducted in four villages each
consisting of 100 samples based on purposive and clustered sampling
technique. The study compares the implication between indicators
before and after the policy. It is found that the impact of the DMP
programme on the villages was positive. The level of poverty in each
village has been significantly reduced by 8-40% after the introduction
of the Programme. The composite food security analysis at household
level shows the positive impacts of the Programme.
Contribution/ Originality
This research is an original example of the use of food security analysis on a household level and
is implemented in one of the government programs based on poverty and food security (food self-
sufficiency programme). This research illustrates how a government policy can increase the food
security of its people and contribute to poverty alleviation.
DOI: 10.18488/journal.1005/2019.9.1/1005.1.19.32
ISSN (P): 2304-1455/ISSN (E):2224-4433
How to cite: Muhamad Rusliyadi, Azaharaini Bin Hj. Mohd. Jamil and Ratna Tri Kumalasari
(2019). Analysis of household food security policy: case of food security village programme,
Indonesia. Asian Journal of Agriculture and Rural Development, 9(1), 19-32.
© 2019 Asian Economic and Social Society. All rights reserved.
Asian Journal of Agriculture and Rural Development Volume 9, Issue 1 (2019): 19-32
http://www.aessweb.com/journals/5005
Asian Journal of Agriculture and Rural Development, 9(1)2019: 19-32
20
1. INTRODUCTION
Food security policy will be a paramount concern for the economic development of many
countries for at least the next two decades (FAO, 2006). The rate of increase in population is rising
significantly in many countries, but especially in developing countries. Governments are trying to
address their food problems, and they need good analysis and implementation of development
policies, particularly in rural areas where most people live. Food security analysis, carried out at
national and household level is indispensable.
The challenges in food security development in general are linked to high population growth,
limited natural resources and shifting functions of agricultural soil, inadequate food sector
infrastructure, increased competition with imported merchandise in the marketplace, and the share
of poor people (Paasch et al., 2010; Mukadasi, 2018). Moreover, demand for food per capita
increases over time, driven by increased revenue, awareness of health and diet changes, caused by
the influence of globalization and various community activities. In Indonesia, poverty and the
attainment of food security have been the main problems. Food insecurity is widely experienced in
many regions and is positively linked to impoverishment (Weiler et al., 2014).
Rural development aims to achieve food security in a region. It requires integration and
collaboration of the aspects of availability, distribution, and consumption of food at a household
level. Therefore, a good system is a prerequisite for the realisation of food security by the Food
Self-Sufficiency Village Programme (DMP Programme).
The performance of DMP Programme has provided significant impact with some major indicators
such as poverty, income and food security in villages. However, rural areas have a classic problem;
the participation rate for farmers in the program is low and most farmers in villages face the
problem of limited capital resources hindering their success. Policy programs such as DMP
Programme need to be effectively developed in collaboration and cooperation with other sectors so
that the rural development targets focused on poverty reduction and maintenance of food security
at village level can be met (Darwis, 2012).
According to Darwis and Rusastra (2011), the DMP Programme was supported by agricultural and
non-agricultural capital programmes, as well as by rural financial institutions. It was facilitated by
agricultural extension workers and expert consultants. This programme is directed at several other
objectives; raising the availability of foodstuffs, growing the family unit entitlement, recovering
the efficiency of food supply and access programmes, enhancing the trade in local food items,
raising capital and industry options through the introduction of high-yielding varieties of seeds
which agricultural communities in rural areas can develop to increase income, as well as
improving the quality of food consumption handling at the household level, and so forth.
2. MATERIALS AND METHOD
This research is focused on the existing food security policy in Indonesia with regard to the DMP
Programme that has been implemented since 2006. The methodology used in the study was mainly
quantitative, but a qualitative approach was also used to enrich the findings of the quantitative
study. Primary data were analysed using Microsoft Excel and SPSS. The research site in Java
Island has the largest population in Indonesia. Central Java was chosen for this case study because
it constitutes 17% of the population experiencing poverty (CBS, 2011). Secondly, it has many
deprived villages as compared to other provinces. Four villages were selected purposively1.
1 Purposive sampling is also known as judgmental, selective, or subjective sampling, based on the
recommendation, of the Agricultural and Food Security Agency in Regency Level.
Asian Journal of Agriculture and Rural Development, 9(1)2019: 19-32
21
Two villages from Kebumen Regency, namely Kedung Dowo Village in Poncowarno District and
Selogiri Villlage in Karanggayam District, and the others in Magelang Regency, namely
Madukoro Village in Kajoran District and Candirejo Village in Borobudur District were selected.
These villages have been implementing the programme in varying stages with different
characteristics and success rates.
Data related to the DMP Programme and extension service were collected using unstructured and
semi-structured questionnaire. The survey was conducted in four villages; 100 samples from each,
using a purposive and clustered sampling technique based on some particular sample criteria.
Criteria of the sample chosen were based on farmer characteristics such as their level of wealth,
farmer leader, the village leader, and gender. The purposive sampling technique is a type of non-
probability sampling that is most effective when one needs to study a certain cultural domain with
knowledgeable experts within. Purposive sampling may also be used with both qualitative and
quantitative research techniques. This type of sampling can be very useful in situations when one
needs to reach a target sample quickly, and where sampling for proportionality is not the main
concern (Rusliyadi and Libin, 2018).
3. RESULTS AND DISCUSSION
3.1. Food security composite analysis at household level
Food security is achieved when every household can continuously have access physically and
economically to food items (FAO, 1996). Food security should also include availability,
accessibility, safety and sustainability. Accessibility represents when every household is able to
meet food self-sufficiency, food availability is the average amount of food needs at household
level, while food safety emphasize on the quality of food that meets the nutritional needs.
The indicators used in the analysis of food security at the household level are food availability,
food access and food consumption or absorption. An indicator of food availability is normative per
capita consumption for food production and normative consumption ratio. The ratio indicates
whether a region has a surplus production of cereals and tubers. The normative consumption ratio
is between the production of food commodity cereals (rice, maize, cassava, and sweet potato) net
of the normative population food consumption per day, which is as much as 300 grams of cereals
(DKP, 2005).
Food access has indicators that are expressed in the percentage of household poverty, working
people and the percentage of those who work less than 15 hours per week. The percentage of those
who did not finish elementary schooling, the percentage of households without access to
electricity, and the length of roads per square kilometer are indicators which reflect limitation
factors in accessing food at the village level (Katarzyna and Raqif, 2017).
Indicators of food consumption or absorption used in the study include; one-year life expectancy
of children (nos. /1000), underweight children less than 5 years of age (%), percentage of illiterate
women, percentage of children who are not immunised, percentage of people with access to clean
and safe water, percentage of people who reside further than five kilometers from the health
center, and the ratio of the people per physician.
The food production is calculated using three years average production (2010-2) of rice, maize,
cassava and sweet potatoes, since the main source of food energy comes from cereals and tubers.
The pattern of food consumption in Indonesia shows that nearly 50% of total caloric needs come
from cereal crops. For the average net production of cassava and sweet potatoes that are equivalent
to rice should be multiplied by 1/3 (1 kg of rice or corn is equivalent to 3 kg of cassava and sweet
potato in terms of calorific value). Per capita net availability of cereals is calculated by dividing

Asian Journal of Agriculture and Rural Development, 9(1)2019: 19-32
22
the total cereal availability by the population. Under the Indonesian consumption profile, the
normative consumption of cereals/day/capita is 300 grams (DKP, 2009).
3.1.1. Availability of food
The rural lifestyle suggests a low income stream that contributes to vulnerability to food insecurity
and to disease, since they cannot afford food prices. In most cases, only rice is being stored as food
commodities, harvested in the last season. Only a small amount of harvested rice is sold, so
normally people seek for other employment whenever they have free time (Falcon and Naylor,
2005).
The availability of adequate food is an absolute prerequisite for food security; however, it is not a
sufficient precondition to ensure food security at the household and individual level. Many efforts
have to be made to ensure the availability of food at village level. The key causes of non-
availability of cereals food in some districts include; (1) expansion of oil palm, black pepper,
rubber, cashew, and cocoa plantations (2) expansion of open-pit mining areas; (3) swamp areas;
(4) upland rice production systems that have low productivity; and (5) non-availability of arable
land with respect to population density. In addition, many areas of surplus cereal crops are often
affected by disasters due to deforestation, drought or flood. This threatens the sustainability of
production levels.
Table 1: Net cereal production per capita per day (G) and normative consumption ratio in
villages before and after programme implementation
No Indicators
Kebumen Regency Magelang Regency
Kedungdowo
Village
Selogiri
Village
Candirejo
Village
Madukoro
Village
Before After Before After Before After Before After
1 Net Cereal Production
per Capita per Day (g) 521 542 483 502 481 497 465 486
2 Normative
consumption ratio 0.58 0.55 0.62 0.60 0.62 0.60 0.65 0.62
Source: Authors’ own calculations (2013)
Note: Before: before programme implementation; After: after programme implementation (2013)2
Table 1 represents the indicators of food availability at selected sample village level. It showed a
positive outcome after the implementation of the DMP Programme. This specifies that, in the first
indicator, the net cereal production per capita per day (g) in all villages increased after the
implementation of programme. The highest increase was seen in Madukoro (21 grams). The level
of food security in the two villages was high. This result shows that the Programme can increase
agricultural production, especially in the cereal crops sector. This would be done with the support
of training activities and efforts to increase rice productivity through field extension services, that
is, provision of assistants in every village.
The normative consumption ratio is a key indicator in the context of food security in a region.
Food insecurity of the area is already self-sufficient or does not use this indicator as a reference.
The four villages showed that they have a medium surplus. After implementation of the DMP
Programme almost all the villages in the Kebumen Regency and Magelang Regency have shown a
positive response to a decrease in the value of the normative consumption ratio, which can be
interpreted as moving towards surplus food or food self-sufficiency.
2 Classification for normative consumption ratio: > 1.5 - high deficit, 1.25 - 1.50 - moderate deficit, 1.00 -
1.25 - low deficit, 0.75 - 1.00 - low surplus, 0.50 - 0.75 - moderate surplus, 0:50 - high surplus

Asian Journal of Agriculture and Rural Development, 9(1)2019: 19-32
23
3.1.2. Food access
Table 2 shows data before and after implementation of the DMP programme. The first indicator;
percentage of household poverty, shows that most villages were in a very vulnerable category
before implementation of the Programme. After implementation, however, the percentage of poor
households decreased significantly, especially in Selogiri (29.8%). The programme encouraged the
development of productive business activities, which increased the income of farmers. This
programme is not the only factor contributing to poverty reduction, there are also other
programmes, such as social safety assistance, social direct funds for community, rice for the poor
and other activities that has encouraged the villages to become independent in food self-
sufficiency. The other indirect impact of the DMP programme is the initiation of other
programmes in villages. The lowest percentage of poor people (34.53%) after implementing the
programme is found in Candirejo. The villagers, apart from being farmers, are also engaged in
tourism activities. Three out of four villages have the potential to become tourism villages because
of their natural resources.
Table 2: Food access indicators in villages before and after programme implementation
No Indicators
Kebumen Regency Magelang Regency
Kedungdowo
Village
Selogiri
Village
Candirejo
Village
Madukoro
Village
Before After Before After Before After Before After
1 Percentage of household
poverty 61.54 56.46 69.42 39.60 42.36 34.53 61.14 35.56
2
Percentage of people
working less than 15 hour
per weeks
12.36 8.62 14.65 12.59 9.26 8.21 10.32 7.85
3
Percentage of those who
did not finish elementary
schooling
28.75 25.67 34.56 32.20 20.21 18.95 25.87 23.23
4
Households without
access to electricity
(%)
3.53 3.24 3.50 3.45 1.45 1.22 1.32 1.27
5 The length of road per
square kilometre 2.3 4.5 2.7 3.8 4.6 6.3 1.3 1.9
Source: Authors’ own calculations (2013) 3
The second indicator is the percentage of people who work less than 15 hours per week. This is the
category of the community who are less productive. Ideally, the average person works at least 35
hours a week, assuming more than five hours a day. Kedungdowo shows a low percentage
(3.74%), before the Food Self-Sufficiency Village Programme was implemented prior to 2013.
This situation shows that the duration of Programme, which started from 2009, has been over an
extended period and should have reached the stage of self-sufficiency.
3 Note: Before: before programme implementation; After: after programme implementation (2013)
Classification:
Indicator 1: Percent of population below poverty line (%): ≥ 35 - Highly vulnerable, 25 - 35 - Vulnerable, 20 -
25 - Rather vulnerable, 15 - 20 – Quite resistant, 10 - 15 - Resistant, 0 - 10 - Highly resistant.
Indicator 2: Percentage of people working less than 15 hour per weeks (%): < 50 - Highly vulnerable, 50 - 30
- Vulnerable, 30 - 20 - Rather vulnerable, 20 - 10 – Quite resistant, 10 - 12:01 - Resistant, 0:01 - 0.0 - Highly
resistant.
Indicator 3: Percentage who did not finish elementary schooling ; ≥ 50 - Highly vulnerable, 40 - 50 -
Vulnerable, 30 - 40 - Rather vulnerable, 20 - 30 – Quite resistant, 10 - 20 - Resistant, 0 - 10 - Highly resistant
Indicator 4: Percentage of Population without access to electricity; ≥ 50 - Highly vulnerable, 40 - 50 -
Vulnerable, 30 - 40 - Rather vulnerable, 20 - 30 – Quite resistant, 10 - 20 - Resistant, 0 - 10 - Highly resistant.
Asian Journal of Agriculture and Rural Development, 9(1)2019: 19-32
24
When compared to the data of Central Java province, based on the number of hours of work in
August 2013, a total of 10.95 million people (68.60%) worked over 35 hours per week, while the
working population in the study area working less than 15 hours per week reached 1.33 million,
equivalent to 8.30% (CBS, 2013). These findings show that on average, jobless people at village
level are higher than the provincial level. Hence, the policy should pay attention to the real
condition of the people in the village by creating more job opportunities (Katarzyna and Raqif,
2017).
The third indicator is the percentage people who did not complete elementary schooling. This is an
important indicator in this study, since it is concerned with most of the population. The findings
show interesting results, that a number of people completed the elementary schooling after the
implementation of the Programme. This means that the more they are educated, the more
productive they are. Further, the table revealed that only a few villagers are living without access
to electricity (below 5%).
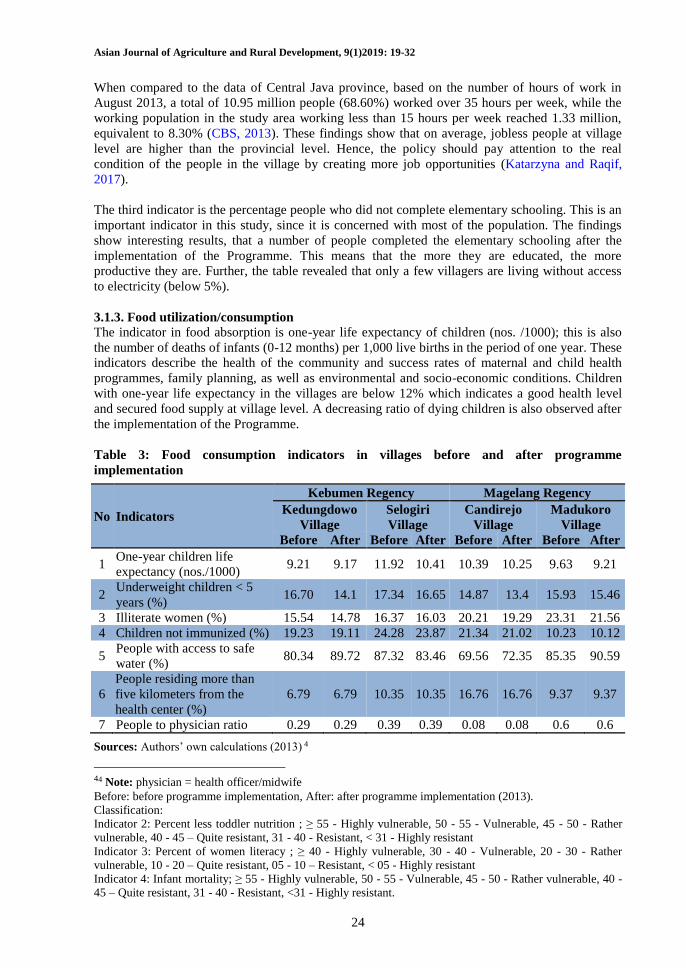
3.1.3. Food utilization/consumption
The indicator in food absorption is one-year life expectancy of children (nos. /1000); this is also
the number of deaths of infants (0-12 months) per 1,000 live births in the period of one year. These
indicators describe the health of the community and success rates of maternal and child health
programmes, family planning, as well as environmental and socio-economic conditions. Children
with one-year life expectancy in the villages are below 12% which indicates a good health level
and secured food supply at village level. A decreasing ratio of dying children is also observed after
the implementation of the Programme.
Table 3: Food consumption indicators in villages before and after programme
implementation
No Indicators
Kebumen Regency Magelang Regency
Kedungdowo
Village
Selogiri
Village
Candirejo
Village
Madukoro
Village
Before After Before After Before After Before After
1 One-year children life
expectancy (nos./1000) 9.21 9.17 11.92 10.41 10.39 10.25 9.63 9.21
2 Underweight children < 5
years (%) 16.70 14.1 17.34 16.65 14.87 13.4 15.93 15.46
3 Illiterate women (%) 15.54 14.78 16.37 16.03 20.21 19.29 23.31 21.56
4 Children not immunized (%) 19.23 19.11 24.28 23.87 21.34 21.02 10.23 10.12
5 People with access to safe
water (%) 80.34 89.72 87.32 83.46 69.56 72.35 85.35 90.59
6
People residing more than
five kilometers from the
health center (%)
6.79 6.79 10.35 10.35 16.76 16.76 9.37 9.37
7 People to physician ratio 0.29 0.29 0.39 0.39 0.08 0.08 0.6 0.6
Sources: Authors’ own calculations (2013) 4
44 Note: physician = health officer/midwife
Before: before programme implementation, After: after programme implementation (2013).
Classification:
Indicator 2: Percent less toddler nutrition ; ≥ 55 - Highly vulnerable, 50 - 55 - Vulnerable, 45 - 50 - Rather
vulnerable, 40 - 45 – Quite resistant, 31 - 40 - Resistant, < 31 - Highly resistant
Indicator 3: Percent of women literacy ; ≥ 40 - Highly vulnerable, 30 - 40 - Vulnerable, 20 - 30 - Rather
vulnerable, 10 - 20 – Quite resistant, 05 - 10 – Resistant, < 05 - Highly resistant
Indicator 4: Infant mortality; ≥ 55 - Highly vulnerable, 50 - 55 - Vulnerable, 45 - 50 - Rather vulnerable, 40 -
45 – Quite resistant, 31 - 40 - Resistant, <31 - Highly resistant.

Asian Journal of Agriculture and Rural Development, 9(1)2019: 19-32
25
The result shows that most villages are highly resistant (to absorption of food) due to less than
30% underweight children. The collaboration of DMP Programme with other programmes, such as
maternal and child health activities, and neighbourhood health centers in every village, has
resulted in low percentages of underweight children in the four villages. The percentage of
illiterate women in the villages in Table 3 is in the range 14 - 23%, which falls under the category
of ‘quite resistant’ (food absorption 10 - 20%), near to ‘rather vulnerable’ (food absorption 20 -
30%). Before the implementation of the DMP Programme, Madukoro recorded the highest
percentage for this indicator (23.31%). However, after implementation it decreased to 21.56%. The
DMP Programme is not aimed at purely educational purposes, rather it aims at providing more
intensive assistance to farmers through extension field services which ultimately should contribute
to the acquisition of modern farming skills by farmers.
3.2. Problems and Impacts of Implementing the Food Self-Sufficiency Policy
3.2.1. Problem of the self-sufficiency programme in villages
Social conditions in the study areas are mostly below average with key income coming from
agricultural activities which justify the implementation of the DMP programme. The four villages
are densely populated and some have more than 5,000 residents. A high population creates job
competition, especially in the agricultural sector, because more people depend on one sector. The
relatively low formal and informal education level of the people in most villages makes it
necessary to undertake greater effort to increase the level of knowledge of the people in order for
them to become more productive. Special efforts in the DMP Programme are expected to be
incorporated to enable the rural economy to be developed through enhancing people’s knowledge
of productive activities so as to develop society.
Socio-cultural attitudes of the people in the villages have contributed to the problems of
implementing the programme. Low participation in awareness-raising activities has led to a lag in
the programme in two villages in the Kebumen Regency. This is partly due to the lack of village
officials to publicize the programme to the community. The result is that the sustainability of the
programme is difficult to achieve. In Candirejo, the social and cultural aspects involve people’s
inability to be creative in the utilisation of the available resources. For example, people sell pandan
leaf directly to the merchants who visit the village. If the available resources such as pandan leaf
were sold in the form of ‘handcrafts’, this will give added value to the resources and the people
could earn more, rather than selling the resources in its ‘raw’ form. Limited capital availability is
also a major problem for many Indonesian farmers. In the programme the government disbursed
insufficient funds to meet the capital needs of the society. Agricultural technology used by farmers
in the most villages is thus, very rudimentary due to capital constraints yielding low productivity.
The low literacy rate is another problem to managing a productive business. This is obviously seen
in cultivation, maintenance and post-harvest activities in agriculture, animal husbandry and
fishery.
Other problems include the low knowledge of market dynamics and the length of the marketing
chain of agricultural products, which are sold at low prices by farmers. The programme connects
the farmer activities into affinity groups’ engagement in agriculture-based small businesses,
livestock, farms and home industry. All four villages under study have very few business networks
and strategies for marketing local products to other business partners or investors who can push
upwards the rural products to the district level and thus access reliable markets. Lack of
transportation facilities also affects market accessibility; this causes farmers to sell their products
Indicator 5: Percent of population with access clean water ; ≥ 70 - Highly resistant, 60 - 70 - Resistant, 50 - 60
– Quite resistant, 40 - 50 - Rather vulnerable, 30 - 40 - Vulnerable, < 30 - Highly vulnerable
Indicator 6: Percent of population living; > 5 km from the health center; ≥ 60 - Highly vulnerable, 50 - 60 -
Vulnerable, 40 - 50 - Rather vulnerable, 30 - 40 – Quite resistant, 20 - 30 - Resistant < 20 - Highly resistant.

Asian Journal of Agriculture and Rural Development, 9(1)2019: 19-32
26
to merchants who visit the village (middlemen), rather than selling to district-level or regency
traders at higher prices. Another problem is water availability which depends on topography as
both villages use water flowing from the hills, and it is very difficult to obtain ground water
directly. Dry-land farming practices rely on harvested rain water.
The problem indicators impacting poor/low income farmers’ groups are shown in the Table 1A
(appendix). The main reason for existing problems from agricultural service institutions’
perspective is the lack of understanding of the farmers’ challenges which is most significant at the
local government level. The difficulty in policy implementation is because the farmers’ problems
have not been well-explored and understood. This is because the civil servants have very limited
time to work in the field. They normally suggest good plans on papers, but fail to implement them
due to lack of information on the nature of the problem and possibly lack of commitment and
funding too.
The table further shows problems in the implementation of the DMP programme, affecting the
performance of farmer’s groups in most villages. For example, ‘limited access to inputs’ makes
farmers more dependent on other parties such as brokers/traders and this situation exacerbates the
persistence of poverty. Most villages need financial support to implement the DMP programme to
be able to meet the farmers’ needs. Lack of funds or capital contributes to the inability of farmer
groups to invest and become innovative. Other prominent issues are inadequate information, low
levels of knowledge and skills, and uncertainty. Access to information and knowledge are
important to farmers, as these may help mostly poorly educated farmers to access good prices for
their produces, which ultimately solves their problems.
3.2.2. Impact of the self-sufficiency village programme at village sites
Table 4 shows the survey results before and after programme implementation in 2013. The data
reveal the extent to which the Programme has benefited people in the four villages in terms of
social welfare, rural development, and poverty reduction. The income of the people has shown a
relative increase in all four villages after Programme implementation. Although it increased at
least 5-15%, this still benefits the farmer. The low involvement of farmers and rural communities
in the DMP programme was one of the reasons why people’s income has been low. The
programme needs more farmer involvement or participation so that the impact is more visible and
realised.
The main social problem in this research is poverty, because all other indicators (problems) tend to
contribute to the context of poverty. The information below is taken and processed from the data
of food self-sufficient villages and tabulation was done with village officers in each village and
was then adjusted with data from village monographs and Central Bureau of Statistics (CBS) at
sub-district level. The level of poverty in each village declined after the introduction of the DMP
programme by 8-40%. However, the poverty rate in the villages (34.5% to 56.5%) is relatively
higher than the national average in rural areas (14.3% to 16.0%) of Central Java province (CBS,
2013). Thus the provincial governments should introduce programmes that focus on empowering
rural communities to promote their economic activities. One example is the implementation of the
Food Self-Sufficiency Village programme which is complemented by other cross-sectoral
programmes.
The programme allocates funding for social assistance targeted at the poor households who
participate in farmer groups. With these funds, productive business activities have been
implemented, especially in agriculture, livestock, fisheries and small businesses, contributing to
households earning income in the community. Stimulation funding of 7143 US Dollars per village
from the government is hoping to become a revolving fund scheme for all citizens. The
development funds managed by the financial institutions have increased after a few years of DMP
Programme implementation. This increase is not very large significantly, except for Madukoro,

Asian Journal of Agriculture and Rural Development, 9(1)2019: 19-32
27
which has shown a significant level of increase at 78%. The affinity group of the village has
managed to achieve a good performance. Most of the funds in the villages are allocated to
livestock such as goats. At the start, the Food Self-Sufficiency Village programme started with 40
goats and this number has increased to 89 goats during the research period.
The increasing number of institutions for farmers’ groups has created a new cluster of affinity
groups that can make village economies act independently. This is reflected in the table below,
where there is an increase in farmer’s groups before and after programme implementation. These
groups are important because of their strengthening effect on the community groups. It is part and
parcel of building social capital, where a programme is initiated by groups which eventually
become self-reliant.
3.3. Responses to the Food Self-Sufficiency Programme for Poverty Reduction
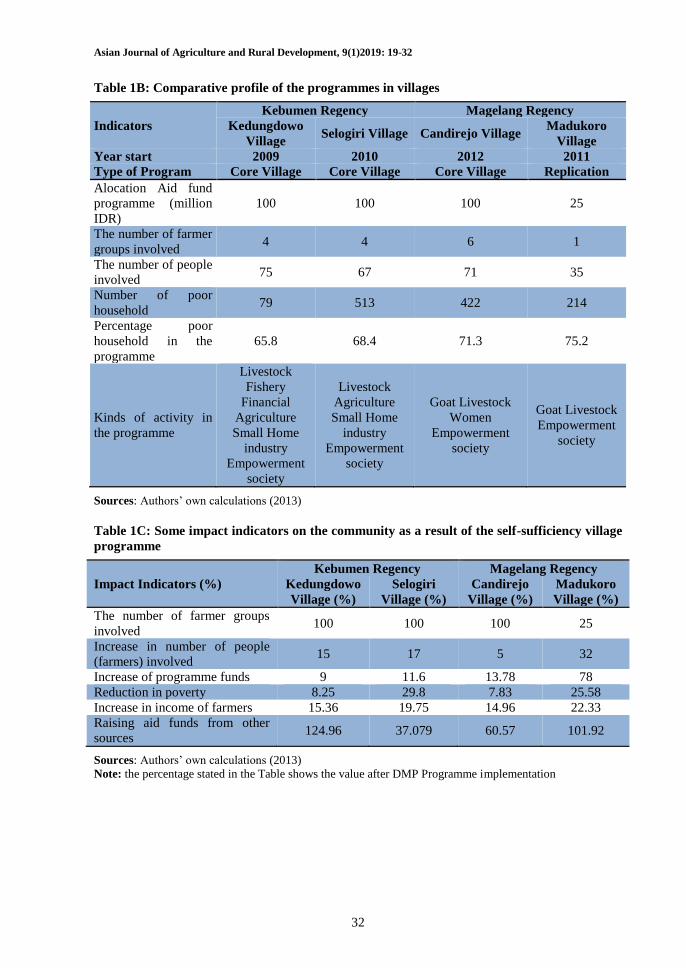
3.3.1. Comparative profile of the programmes in villages
The findings indicate the variability of implementation in each village. Although the villages are at
different stages of implementation, they have virtually the same issues. Poor household
involvement in the DMP programme is a major issue in all villages. The procedures outlined in the
programme’s activities are implemented by former leaders at district level involving over 60% of
poor households for each activity. This initiative can have a direct impact on poor families in
gaining their livelihood.
The impacts of the DMP programme on two regencies are different. Kebumen Regency is less
responsive to the programme compared to Magelang. The study confirms that the impacts and
adoption of the programme in Kebumen are producing lower results compared to Magelang. Local
government showed less concern for the programme in Kebumen as compared to Magelang
Regency. For example, the local government did not allocate a budget for a replication village in
DMP programme in Kebumen Regency. The regency is dependent on the central government for
funding. In contrast to this, in the Magelang Regency, local government allocated funds for
replication villages for DMP Programme development. In general, local government concern is
important in the rural sector development, which depends on leadership quality in terms of paying
attention and providing budget allocations.
3.3.2. Indicators of outcomes of the self-sufficiency village programme
The changes in the community after the implementation of the DMP programme are shown in
Table 5 and they are very impressive. The data show that there is a significant increase in the
amount of funds managed by farmer groups. The increase of 78% in Madukoro is unexpected,
because it is a village replication which received social grants that are relatively small compared to
other villages. This indicates that the DMP Programme enables augmentation of the local economy
through productive activities like animal husbandry (e.g., goats), home industries and fisheries.
The result shows that other programmes associated with the implementation of the DMP
programme are generating benefits every year. For example, some villages obtained funding of
more than a 100% increase. The collective efforts in implementation of the intensive DMP villages
programmes allocated to the Madukoro and Kedungdowo are working well for the endpoint of this
research study.

Asian Journal of Agriculture and Rural Development, 9(1)2019: 19-32
28
Table 4: Impact of the self-sufficiency village programme at village sites
No Indicators
Kebumen Regency Magelang Regency
Kedungdowo Village Selogiri Village Candirejo Village Madukoro Village
Before After Before After Before After Before After
1 Average income/month
(IDR) 1,457,920 1,681,902 1,393,342 1,647,436 1,467,850 1,687,667 1,290,245 1,589,000
2 Poverty (%) 61.54 56.46 69.42 39.62 42.36 34.53 61.14 35.56
3 Village aid fund/year
(Million IDR) 100 109 100 111.6 100 113.78 25 44.5
4 Institutional/farmers groups 2 5 3 6 2 6 2 4
5 Rice yields productivity
(ton/ha) 2.65 2.87 4.58 4.84 3.76 3.88 3.87 4.23
6 Livestock population (cows
and goats) 139 171 245 261 598 805 195 268
7
Average aid funding from
other sources/year
(Millions IDR)
65.3 146.9 193.1 264.7 76.86 123.42 46.39 93.67
8 Infrastructure - Rice barns and roads - Rice barns and roads - 3 km roads - 2 km roads
9 Participation of villagers in
the programme 75 86 68 71 65 72 78 83
10 Extension officer visit (per
month) 1 5 2 4 1 6 2 4
Sources: Authors’ own calculations (2013)
Note: Before: before Desa Mandiri Pangan implementation, After: after Desa Mandiri Pangan implementation (2013)

Asian Journal of Agriculture and Rural Development, 9(1)2019: 19-32
29
Table 5: Community gains from the DMP programme
Gains Indicator (%)
Kebumen Regency Magelang Regency
Kedungdowo
Village
Selogiri
Village
Candirejo
Village
Madukoro
Village
Farmers knowledge about the
Programme 87 67 93 78
Community response to the
Programme in terms of their
actions
76 69 72 87
Participation of community in
the Programme 86 71 72 83
Sources: Authors’ own calculations (2013)
4. CONCLUSION
Composite food security analysis at household level shows the positive impacts of DMP
programme implementation. This is shown by several indicators, including the rise of 4-7% in
food availability, reduction in poverty by 8-40%, and decrease in people working fewer than 15
hours per week by 10-20%.
In general, the impact of the DMP programme on the villages was positive. The level of poverty in
each village has been significantly reduced by 8-40% after the introduction of the programme. The
poverty rate in these villages (34.53% to 56.46%) is relatively higher than the national average in
rural Central Java (14.32% as compared to 15.99%) (CBS, 2013). This is the justification for
selecting the four villages to be the sites of the DMP programme. Thus the expectation is that the
national and provincial governments should introduce programmes of this nature in areas or
villages where the gap between the poverty level at the grassroots and the national average is high.
The programme introduced should be focused on empowering rural communities to enable them to
carry out their economic activities. Such empowerment should be complemented by other cross-
sectoral programmes that should be widely practiced throughout the entire country.
Funding: This study received no specific financial support.
Competing Interests: The authors declared that they have no conflict of interests. Contributors/Acknowledgement: All authors participated equally in designing and estimation of current
research. Views and opinions expressed in this study are the views and opinions of the authors, Asian Journal of
Agriculture and Rural Development shall not be responsible or answerable for any loss, damage or liability
etc. caused in relation to/arising out of the use of the content.
Reference
Central Bureau of Statistics (CBS) (2011). Indonesia in number book. Statistical Yearbook of
Indonesia 2011.
Central Bureau of Statistics (CBS) (2013). CBS Strategies Data, CV. Nasional Indah. Indonesia
Darwis, V. (2012). Food self-reliance movement through the village food resilience program:
analyses and constraints. Agricultural Policy Analysis Journal, 10(2), 159-179.
Darwis, V., & Rusastra, I. W. (2011). Optimizing rural community empowerment through
integrating PUAP and Desa mandiri pangan programs. Agricultural Policy Analysis
Journal. 9(2), 125-142
DKP (2005). A food insecurity atlas of Indonesia, 2005. Published by Dewan Ketahanan
Pangan in Jakarta, Indonesia.

Asian Journal of Agriculture and Rural Development, 9(1)2019: 19-32
30
DKP (2009). Panduan Penyusunan Peta Ketahanan dan Kerentanan Pangan di Indonesia: A
Food Security and Vulnerability Atlas of Indonesia (FSVA). Jakarta: Dewan Ketahanan
Pangan and World Food Programme.
Falcon, W. P., & Naylor, R. L. (2005). Rethinking food security for the twenty-first century.
American Journal of Agricultural Economics, 85, 1113-1127.
FAO (1996). Rome declaration on world food security and world food summit plan of action.
World Food Summit 13-17 November 1996. Rome.
FAO (2006). The State of Food Insecurity in the World 2006. Food and Agriculture Organization,
United Nations, Italy.
Katarzyna, B., & Raqif, T. H. (2017). An innovative approach to food security policy in
developing countries. Journal of Innovation & Knowledge 2, 39–44.
http://dx.doi.org/10.1016/j.jik.2016.01.007 www.elsevier.es/jik.
Mukadasi, B. (2018). Mixed cropping systems for sustainable domestic food supply of the
smallholder farming communities in Nakasongola District, Central Uganda. Canadian
Journal of Agriculture and Crops, 3(1), 42-54. DOI: 10.20448/803.3.1.42.54.
Paasch, A., Garbers, F., & Hirsch, T. (2010). Agricultural trade and the human right to food: the
case of small rice producers in Ghana, Honduras, and Indonesia. In F-T Gottwald et al.
(eds.), Food Ethics, DOI 10.1007/978-1-4419-5765-8_8, Springer Science Business Media,
LLC 2010. pp. 119–135.
Rusliyadi, M., & Libin, W. (2018). Agriculture development programs for poverty reduction
evidences from Indonesia and China - comparative study case. Asian Journal of Agriculture
and Rural Development, 8(2), 104-118.
Satriawan, B., Dan, O., & Henny, (2012). Upaya pengentasan kemiskinan pada petani
menggunakan model tindakan kolektif kelembagaan Pertanian. Jurnal Ekonomi
Pembangunan, 13(1), 96-112. DOI: 10.23917/jep.v13i1.185.
Weiler, A. M., Hergesheimer, C., Brisbois, B., Wittman, H., Yassi, A., & Spiegel, J. M. (2014).
Food sovereignty, food security and health equity: a meta-narrative mapping exercise.
Health Policy and Planning, 30(8), 1078-1092. DOI: /10.1093/heapol/czu109.

Asian Journal of Agriculture and Rural Development, 9(1)2019: 19-32
31
APPENDIX
Table 1A: Matrix showing the problems in general at research village sites for poverty and programme implementation
Problems due
to: Problems Indicators Farmer groups Agricultural service institutions
Village
officers Amount
Institutional
issues
Problems Problems Problems
Poverty Dependence
on Aid
Low
investment
capabilities
Function
not
optimal
Lack of
understanding of
farmers’ problems
Dependence
on funds
Farmer groups Limited access to input X X 2
Imperfect information X X X X 4
Limited availability of
technology X X 2
Low level of knowledge
and skills X X X X 4
Limitations of capital X X X 3
Moral hazard behaviour X 1
Price instability X X 2
Uncertainty X X X X 4
Price taker X X 2
High transaction cost X X X 3
Poor organisational
management X X X 3
Agricultural
service
institutions
Limited human
resources X X 2
Limited funding X X X 3
Village
officers Not the decision makers X X X 3
Number 10 6 8 4 6 4
Sources: Primary data and modified from Satriawan et al. (2012)
Asian Journal of Agriculture and Rural Development, 9(1)2019: 19-32
32
Table 1B: Comparative profile of the programmes in villages
Indicators
Kebumen Regency Magelang Regency
Kedungdowo
Village Selogiri Village Candirejo Village
Madukoro
Village
Year start 2009 2010 2012 2011
Type of Program Core Village Core Village Core Village Replication
Alocation Aid fund
programme (million
IDR)
100 100 100 25
The number of farmer
groups involved 4 4 6 1
The number of people
involved 75 67 71 35
Number of poor
household 79 513 422 214
Percentage poor
household in the
programme
65.8 68.4 71.3 75.2
Kinds of activity in
the programme
Livestock
Fishery
Financial
Agriculture
Small Home
industry
Empowerment
society
Livestock
Agriculture
Small Home
industry
Empowerment
society
Goat Livestock
Women
Empowerment
society
Goat Livestock
Empowerment
society
Sources: Authors’ own calculations (2013)
Table 1C: Some impact indicators on the community as a result of the self-sufficiency village
programme
Impact Indicators (%)
Kebumen Regency Magelang Regency
Kedungdowo
Village (%)
Selogiri
Village (%)
Candirejo
Village (%)
Madukoro
Village (%)
The number of farmer groups
involved 100 100 100 25
Increase in number of people
(farmers) involved 15 17 5 32
Increase of programme funds 9 11.6 13.78 78
Reduction in poverty 8.25 29.8 7.83 25.58
Increase in income of farmers 15.36 19.75 14.96 22.33
Raising aid funds from other
sources 124.96 37.079 60.57 101.92
Sources: Authors’ own calculations (2013)
Note: the percentage stated in the Table shows the value after DMP Programme implementation