
ASIAN DEVELOPMENT BANK PPA:IND 26223 … · asian development bank ppa:ind 26223 program...
30
ASIAN DEVELOPMENT BANK PPA:IND 26223 PROGRAM PERFORMANCE AUDIT REPORT (Loan No. 1208-IND) ON THE FINANCIAL SECTOR PROGRAM LOAN IN INDIA December 1999
Transcript of ASIAN DEVELOPMENT BANK PPA:IND 26223 … · asian development bank ppa:ind 26223 program...

ASIAN DEVELOPMENT BANK PPA:IND 26223
PROGRAM PERFORMANCE AUDIT REPORT (Loan No. 1208-IND)
ON THE
FINANCIAL SECTOR PROGRAM LOAN
IN
INDIA
December 1999

CURRENCY EQUIVALENTS
Currency Unit —Rupee/s (Re/Rs)
At Appraisal At Project Completion At Operations Evaluation
(October 1992) (December 1997) (May 1999) Rs1.00 = $0.0321 $0.0279 $0.0189 $1.00 = Rs31.13 Rs35.82 Rs42.27
ABBREVIATIONS
ADB − Asian Development Bank BFS − Board for Financial Supervision CB − commercial bank CD − certificate of deposit CMDP − Capital Market Development Program CP − commercial paper CRAR − capital to risk weighted assets ratio CRR − cash reserve ratio DFI − developing finance institution FSDP − Financial Sector Development Program FSPL − Financial Sector Program Loan GDP − gross domestic product IDBI − Industrial Development Bank of India IFCI − International Finance Corporation of India Ltd. ICICI − Industrial Credit and Investment Corporation of India Limited IMF − International Monetary Fund MOF − Ministry of Finance NBFC − nonbank financial company NPA − nonperforming asset OEM − Operations Evaluation Mission PPAR − program performance audit report PCR − program completion report RBI − Reserve Bank of India SBI − State Bank of India SEBI − Securiites Exchange Board of India SLR − statutory liquidity ratio
NOTES (i) The fiscal year (FY) of the Government ends on 31 March. (ii) In this report, “$” refers to US dollars.

3
Operations Evaluation Office, PE-540

CONTENTS
Page BASIC PROGRAM DATA ii EXECUTIVE SUMMARY iii I. BACKGROUND 1
A. Rationale 1 B. Formulation 1 C. Objectives and Scope at Appraisal 1 D. Financing Arrangements 2 E. Program Completion Report 2 F. Program Performance Evaluation 3
II. IMPLEMENTATION PERFORMANCE 6 A. Program Measures 6 B. Loan Covenants and Disbursements 6 C. Procurement and Use of Counterpart Funds 8 D. Performance of the Borrower 8 E. Performance of ADB 8
III. PROGRAM RESULTS 1 A. Achievement of the Objectives 1 B. Policy Implications of the Program 3 C. Financial Implications of the Loan 10 D. Socioeconomic and Environmental Implications 11
IV. CONCLUSION 1 A. Overall Assessment 1 B. Lessons Learned 2 C. Follow-Up Actions 3
APPENDIXES 19

BASIC PROGRAM DATA
Financial Sector Program (Loan 1208-IND) As per ADB KEY PROGRAM DATA ($ million) Loan Documents Actual Bank Loan Amount/Utilization 300.0 300.0 KEY DATES Expected Actual Fact-Finding 8-19 Jun 1992 Appraisal 10-26 Aug 1992 Board Approval 15 Dec 1992 Loan Agreement 15 Dec 1992 Loan Effectiveness 22 Dec 1992 Initial Disbursement 23 Dec 1992 Final Disbursement 30 Jun 1994 22 Dec 1994 Loan Closing 31 Dec 1995 4 Nov 1996 Program Completion 31 Mar 1996 31 Mar 1996 BORROWER Government of India EXECUTING AGENCIES Ministry of Finance, Reserve Bank of India MISSION DATA Type of Mission No. of Missions Person-days Fact-Finding 1 48 Appraisal 1 153 Aid Coordination Meeting 1 6 Tranche Review 1 10 Program Review 1 13 Operations Evaluation 1 60

EXECUTIVE SUMMARY
In July 1991, India went through an unprecedented crisis with the country’s foreign reserves totaling an equivalent of only two weeks of imports. Supported by the International Monetary Fund, World Bank and Asian Development Bank (ADB), the Government swiftly adopted a stabilization program and introduced wide-ranging structural reforms, an integral component of which was reforming the financial sector. ADB responded to the Government’s Development Policy Letter requesting assistance with a Financial Sector Program Loan (FSPL). The $300 million loan from ADB’s ordinary capital resources was approved on 15 December 1992. The counterpart funds generated by the loan were to be used by the Government to increase the capital of selected public sector banks as a preparatory step for such banks approaching the capital market and raising the additional capital necessary to meet new capital adequacy standards.
The overall objective of the FSPL was to promote a diversified, competitive, and market-based financial sector so as to raise the allocative efficiency of available savings, increase the overall return on investments, and promote accelerated growth and development of the real economy. Toward such an objective, six specific goals were highlighted, namely, (i) enhanced private sector access to financial savings; (ii) reduction of bank intermediation costs; (iii) enhanced competition and diversity in banking and development finance institution (DFI) sectors; (iv) development of autonomous, financially sound banks and DFIs; (v) development of government securities and money markets; and (vi) capital market development. The Program covered 58 policy measures: 20 were to be completed prior to Board approval; 29 to be completed prior to the release of the second tranche, of which 8 were made part of the loan covenants; and 9 were to be achieved by the end of the Program in March 1996. Overall, the FSPL is rated generally successful. The Program was appropriately designed, effectively implemented, and contributed significantly to the country’s financial sector development. Of the 55 implemented measures, 37 were done as originally scheduled, while 18 encountered delays. The delayed measures were eventually implemented before the submission of the program completion report in December 1997. While the Government did not comply with the required reduction of interest charges on the cash reserve balances, partial compliance was noted on (i) phasing out of the export refinancing facility, and (ii) review of the priority sector credit program toward a rationalization of the priority credit. The major achievements of the FSPL were: (i) reduction of the cash reserve ratio and statutory liquidity ratio for banks; (ii) liberalization of interest rates; (iii) entry of domestic and foreign private banks; (iv) strengthened operational autonomy of the public sector commercial banks; (v) removal of the privileged tax treatment and funding opportunities for DFIs; (vi) enhanced competition, strengthened supervisory framework, and introduction of capital adequacy and other prudential norms for banks and DFIs; (vii) recapitalization and increase in public share holding in banks and DFIs; (viii) establishment of the auction and primary dealers systems for the government security market; (ix) development of money market instruments including certificates of deposit and commercial papers; and (x) strengthened legal, regulatory and institutional framework for the capital market.
Three of the six specific goals of the Program have been substantially achieved, i.e., (i) enhanced competition and diversity in banking and DFI sectors; (ii) development of autonomous, financially sound banks and DFIs; and (iii) development of the capital market.

2
Partial achievement was noted on (i) reduction of bank intermediation costs, and (ii) development of government securities and money markets. Achievement of enhanced private access to financial savings was marginal. However, further progress toward the latter three objectives is expected in view of the relevance and gestation periods of the concerned program and non-program measures implemented to date. The effective linkages among the program components and the sustained reform momentum are the other supportive factors.
While the policy enhancement effects of the FSPL could not be fully quantified, the relevance of the program loan could be explained in terms of the balance-of-payment contribution and the adjustment cost support. In particular, the first tranche release of the FSPL was effective and timely in sustaining the macroeconomic stability of the country, which was a precondition in implementing structural reform measures. Furthermore, the FSPL supported the Government in undertaking the most costly aspect of the financial sector reform, i.e., recapitalization of public sector banks.
Notwithstanding the relatively satisfactory performance of the FSPL, ADB needs to monitor the sustainability of the Program impacts to assist the Government in further improving the sector performance. The performance indicators identified in this program performance audit report should be updated, particularly, in monitoring the three pending objectives where the Program impacts have yet to fully appear. Among others, ADB needs to closely examine the existing constraints in the sector, such as (i) the underdeveloped government securities market and the weak distribution systems, (ii) remaining inefficiencies in the nationalized banks, (iii) remaining allocative distortion such as priority and export refinancing schemes, (iv) need for strengthening the regulatory and supervisory framework for nonbank financial companies, (v) issues of the nonperforming assets of financial institutions, and (vi) weak asset-liability management of financial institutions. As to the capital markets, implementation performance and the interim impacts of the Capital Market Development Program need to be assessed to identify the needed follow-up actions. This evaluation highlights several lessons learned. India’s steady liberalization of the financial sector could be attributed to the Government’s comprehensive and cautious approach in placing priority on economic stability. While considering the pace of the progress in other sectors’ reforms, the Government has maintained solid authorship especially in the timing and sequencing of the financial reforms. In terms of supporting bank recapitalization, ADB should carefully assess the capacity of the Government, and should expect to offer technical inputs such as determining the methodology and eligibility for recapitalization. In this regard, ADB could analyze the results of bank recapitalization in developing member countries, and consolidate the findings as the basis for such technical inputs. Another lesson is the importance of clearly identified program measures. The policy matrix should avoid setting ambiguous and unspecified targets. Finally, the need for performance indicators can not be overemphasized. ADB’s monitoring activities in the FSPL could have been more solid if performance indicators had been identified at formulation. In setting measurable targets with appropriate indicators, the growth potential of a concerned sector and structural rigidities hindering full use of this potential need to be fully discussed with the Government. This would enhance the Government’s confidence in dealing with the reform measures and thus would be a key aspect of the program loans by which ADB could maximize value added in the Government’s policy formulation.

I. BACKGROUND
A. Rationale
1. India had pursued a heavily regulated inward-oriented development strategy after its independence. The change in the policy perspective was felt at the end of the 1980s, when partial economic deregulation measures were adopted to promote industry and trade. An expansionary fiscal policy was also pursued to support industrialization. This policy mix contributed to the building up of an excessive demand on the macroeconomic front, while distortions across the sectors remained rigid and substantial. Given these underlying conditions, the fragility of the economy became apparent when a series of negative external events, such as the rise in oil prices, loss of remittance resulting from the Gulf War, and a reduction in exports to the former Soviet Union hit the country. The consequence was an unprecedented crisis with the country’s foreign reserves totaling an equivalent of only two weeks of imports by July 1991. Supported by the International Monetary Fund (IMF), World Bank, and the Asian Development Bank (ADB), the Government swiftly adopted a stabilization program and introduced wide-ranging structural reforms. An integral part of all these was financial sector reform.
B. Formulation
2. In July 1991, the Indian Government established a high-level committee on the financial system (the Narasimham Committee)1 to discuss the direction of the financial sector reform. The committee’s report presented to the Parliament in December 1991, together with several other specialized committee reports, formed the basis of the Government program for the financial sector reform. ADB’s positive response to the Government’s request for policy-based lending in the financial sector was based on the two financial sector studies2 conducted at the end of the 1980s. Policy dialogues during two program processing missions resulted in the policy matrix, which was supported by the Government’s development policy letter. While identifying some specific objectives and measures as primary targets, the Financial Sector Program Loan (FSPL) generally supported the Government’s financial sector reform effort.
C. Objectives and Scope at Appraisal
3. The overall objective of the FSPL was to promote a diversified, competitive, and market-based financial sector so as to raise the allocative efficiency of available savings, increase the 1 The Committee was set up by the Government in 1991 under the chairmanship of Shri M. Narasimham to examine
all aspects relating to the structure, organization, functions and procedures of the financial system in India. 2 TA 1007-IND: Financial Sector Profile Study, for $48,500, approved on 13 July 1988 and Study of Capital Market in
India, ADB (1989). These studies highlighted several fundamental issues confronting India’s financial sector: (i) high and unsustainable budget deficits with the resulting preemption of banking sector resources by the Government, (ii) Government interference in the credit allocation mechanism through subsidized programs for priority sectors, (iii) rigidities in the monetary management and banking policies, (iv) distorted interest rate structure, (v) inadequate regulatory framework and weak supervision for financial institutions, (vi) underdeveloped Government securities and money market operations, and (vii) inefficiencies in the capital markets.

2
overall return on investments, and promote accelerated growth and development of the real economy. Toward such an objective, the Report and Recommendation of the President highlighted six specific goals: 3 (i) enhanced private sector access to financial savings; (ii) reduction of bank intermediation costs; (iii) enhanced competition and diversity in banking and development finance institution (DFI) sectors; (iv) development of autonomous, financially sound banks and DFIs; (v) development of government securities and money markets; and (vi) capital market development. The policy matrix covered 58 policy measures. Of these, 20 were to be completed prior to Board approval; 29 to be completed prior to the release of the second tranche, of which 8 were made part of the loan covenants; and 9 to be achieved by the end of the Program in March 1996.
D. Financing Arrangements
4. The FSPL of $300 million from ADB’s ordinary capital resources was approved on 15 December 1992. India’s exceptional financing requirements for Fiscal Year (FY) 1992/93, identified during the India Consortium Meeting held in June 1992, was the basis for ADB’s consideration of the size of the FSPL. The first installment of $150 million was to be released in December 1992, while the second installment of $150 million was to be released in June 1994. The loan proceeds were to be utilized to finance the foreign exchange costs of imports of items procured from ADB’s member countries, other than those specified in a negative list that ADB provided. The Government was to use the counterpart fund to increase the capital of selected public sector banks as a preparatory step for such banks to approach the capital market and raise the additional capital necessary to meet new capital adequacy standards.
E. Program Completion Report
5. After loan closing in November 1996, the program completion report (PCR) on the FSPL was circulated in December 1997. The PCR considered the FSPL as properly designed and effectively implemented, and highlighted the compliance with all the second tranche and end-of-the-program conditions.4 While the PCR did not specify the loan’s overall rating,5 many positive remarks6 were noted in several sections. In particular, the economic growth at an average rate
3 The Report and Recommendation of the President (RRP) showed slight, but not negligible, inconsistency in its
presentation among the loan summary, main text, and policy matrix. For instance, the loan summary and main text highlighted the “six specific goals”, while the policy matrix highlighted “nine specific objectives.” Inconsistency was also noted in the wording of these objectives/goals. For example, the loan summary highlighted “reducing intermediation costs and distortions in the banking system,” corresponding to “reduction of bank intermediation costs” in the main text (para. 68), and “increase the efficiency of the financial sector by reducing intermediation costs” in the policy matrix. The program performance audit report (PPAR) basically follows the wording used in the main text of the RRP, including the policy matrix.
4 Appendix 2 of the PCR detailed the status of 30 key conditions—26 measures were categorized as “complied with,” three as “satisfactorily complied with,” and one as “substantially complied with.” However, the three categories used were not well defined. The status of the policy action relating to the rationalization of the priority credit limits, which was not covenanted but was one of the measures to be achieved prior to the release of the second tranche, was not adequately analyzed in the PCR.
5 Since 1995 (PAI No.7.03, issued in June 1995), PCRs have been required to indicate overall rating. The PCR for the FSPL was circulated to the Board in December 1997.
6 Refer to para. 6 of the PCR which stated “the FSPL has been a successful operation from the viewpoint of both design and sequencing of financial sector reforms and timely compliance with stipulated policy actions.” Refer also to para. 57, which stated “the FSPL has been well implemented and successfully operated.”

3
of 7.0 percent over the period 1994/95 to 1997/987 was highlighted as the major contribution of the FSPL. The PCR also highlighted other major achievements of the FSPL as follows: (i) development of indirect instruments for monetary management, (ii) increased savings rate and efficiency gains in financial intermediation, (iii) interest rate liberalization, (iv) development of the Government securities market, (v) growth in the volume of financial intermediation, and (vi) improved performance of commercial banks.8
6. The PCR recommendations included (i) further reduction of SLR and CRR; (ii) improvement of agriculture and housing credits; (iii) reduction of mandatory priority credit programs; (iv) elimination of interest rate subsidies, respectively, for loans below Rs200,000 and for export finance; (v) phasing the cash credit system; (vi) creation of an effective linkage among money, capital and foreign exchange markets; (vii) restructuring and privatization of some public sector banks; (viii) improvement of the risk management system of public sector banks; (ix) tightening of prudential regulations and supervision for financial institutions; (x) strengthening of nonbank financial companies (NBFCs); (xi) reform of the insurance sector and pension and provident funds; (xii) easing the constraints on secondary trading of debts; and (xiii) reform of State-level public sector financial institutions.
F. Program Performance Evaluation
7. Macroeconomic Overview. Table 1 compares India’s macroeconomic situation before and after the crisis. The average gross domestic product (GDP) growth rates of these two periods were broadly the same at around 6.4 percent, while the growth rate in the crisis year (1991/92) dropped to 0.4 percent. The same growth rates, but with slightly less total investment, higher private investment, less total consumption, reduced government spending, and higher export/GDP ratio, imply gradual improvement in the allocative efficiency of the economy. Presumably, there was progress in structural reforms, with macroeconomic stability as the key underlying factor. Paras. 8-9 briefly discuss the macroeconomic development after the crisis as background of this evaluation, which will primarily focus on the structural aspects of the economy, especially the financial sector reform. 8. On the fiscal front, the average overall central government deficit/GDP ratio declined in the post-crisis period. The central government debt/GDP ratio decreased consequently, though the central government interest payment/GDP ratio continued to rise. Apparently, there was a rise in the Government’s funding costs despite downtrends in both domestic and international market interest rates during the period. This reflected market based funding steadily replacing the concessional portion of the government debts. This was consistent with a declining trend in the ratio of Reserve Bank of India’s (RBI’s) claims on Government to GDP. On the monetary front, the pace of the aggregate money growth had been largely stable throughout the two periods, while the foreign assets/money supply ratio increased significantly in the latter period. This showed that RBI had sterilized the massive capital inflows after the crisis to mitigate their monetary impact. 7 Apparently, the FY1997/98 growth being referred to was projected. The updated estimate of economic growth for
the period was 6.9 percent. 8 The following indicators were referred to in the PCR as performance benchmarks: (i) statutory liquidity ratio (SLR)
and cash reserve ratio (CRR); (ii) ratio of savings rate and broad money (M3) to gross domestic product; (iii) commercial banks’ deposit and lending rates, yields of the Government securities, and interest rates on certificates of deposits and commercial papers; (iv) diversification of the Government securities and evolution of yield curves; (v) commercial banks’ credits to the private sector; and (vi) profitability and capital adequacy of major banks.

4
9. On the external front, a significant increase in foreign reserves was noted during the post-crisis period. The average foreign reserves/months of imports ratio nearly doubled. The reduction of the current account deficit/GDP ratio was a key contributing factor, although this was partly offset by the lower net financial inflows. A major difference could be noted in the composition of the financial flows. Direct and portfolio investments, which were not observed before the crisis, became major items in the financial account in 1997. In contrast, the Government external borrowing/GDP ratio decreased. Meanwhile, the annual rate of depreciation of the rupee had been maintained at the same level in both periods, which had been broadly in line with the annual increase in the consumer price index (CPI).
Table 1. Comparison of Key Macroeconomic Indicators: Pre- and Post-Crisis Periods (percent)
Period Average (unless specified otherwise)
Indicators Pre-Crisis Post-Crisis
1. GDP growth rate 2. Total investment/GDP 3. Private investment/GDP 4. Total consumption/GDP 5. Private consumption/GDP 6. Exports/GDP 7. Central government deficit/GDP 8. Central government debt/GDP 9. Central government interest payment/ GDP 10. RBI’s claims on Government/GDP 11. Aggregate money growth 12. Foreign assets/money supply 13. Foreign reserves/months of imports 14. Current account deficit/GDP 15. Foreign direct and portfolio investment/GDP 16. Government external borrowing/GDP 17. Annual rate of depreciation of the rupee 18. Annual increase in CPI
1986/87-1990/91 6.4 23.9 18.8
76.9 64.9
5.1 8.4
54.0 (end-March 1991) 3.4 (FY1990/91)
16.8 (end-1990) 16.9 (end-1988 to end-1990)
1.4 (end-1990) 1986-1990 3.0 2.2
0 1.1 10.0 10.0
1992/93 -1997/98 6.4 23.4 19.4
73.3 62.6
8.0 5.4
44.3 (end-March 1998) 4.0 (FY1997/98)
6.5 (end-1997)
16.7(end-1992 to end-1998) 6.5 (end-1997) 1992-1997
5.9 1.1
1.4 (1997) 0.1 10.0 10.0
CPI = consumer price index, GDP = gross domestic product, RBI = Reserve Bank of India. Source: Appendix 2, Table A2.1.
10. Scope of the Program Performance Audit Report (PPAR). The brief macroeconomic review highlighted gradual improvement in allocative efficiency, and macroeconomic stability, as well as the emergence of private foreign capital during the post-crisis period (Table 1). Against this background, one of the focal points of this PPAR is the implication of the financial sector reform on the country’s economic recovery, with focus on domestic resource allocations. A review of the PCR findings on program implementation, and an assessment of the program results based on the performance indicators and other information obtained during the Operations Evaluation Mission (OEM) in April 19999 were the key inputs to this study. The
9 The OEM, comprising T. Ito, (evaluation specialist/mission leader), A. Tadle (evaluation analyst), and G. H.
Deolalkar (local expert) visited New Delhi during 8-10 April (mission leader only), and 21-26 April, and Mumbai on

5
performance rating was based on the assessment of the implementation performance of the Program, achievement of the objectives, relevance of the program measures, and financial implications of the Loan. Sustainability of the key reform measures, the adjustment dynamics, and structural rigidity of India’s financial sector were also considered.
10-21 April 1999. During the OEM, meetings were held with the Ministry of Finance (MOF), RBI, Exchange Board of India, and other concerned agencies.

6
II. IMPLEMENTATION PERFORMANCE
A. Program Measures
11. The implementation of the program measures was generally satisfactory (Appendix 1). Out of a total of 58 program measures, 55 have been implemented to date.10 The Government did not comply with the reduction of interest on CRR balances,11 while partial compliance was noted on (i) phasing out of the export refinancing facility,12 and (ii) review of the priority sector credit program for a rationalization of the priority credit.13 The major achievements of the FSPL were: (i) reduction of the CRR and SLR for banks; (ii) interest rates liberalization; (iii) entry of domestic and foreign private banks; (iv) strengthened operational autonomy of public sector commercial banks; (v) removal of the privileged tax treatment and funding opportunities for DFIs; (vi) enhanced competition, strengthened supervisory framework, and introduction of capital adequacy and other prudential norms for banks and DFIs; (vii) recapitalization and increase in public share holding in banks and DFIs; (viii) establishment of the auction and primary dealers systems for the government securities market; (ix) development of money market instruments, including the certificate of deposit (CD) and commercial paper (CP); and (x) a strengthened legal, regulatory, and institutional framework for the capital market. 12. Meanwhile, some PCR recommendations have at least partially been implemented. These include (i) improvement of housing credit, (ii) restructuring and privatization of some public sector banks, (iii) improvement of the risk management system of public sector banks, and (iv) tightening of prudential regulations and supervision for DFIs. The implications of the key program measures and PCR recommendations for financial sector development are detailed in Chapter III.
B. Loan Covenants and Disbursements
13. The first tranche was released in December 1992 as initially planned. The second tranche was released six months after the due date14 mainly because of delays in complying with three policy covenants: (i) measurable and substantial progress toward reducing CRR and SLR by March 1996; (ii) instituting prudential and accounting norms for NBFCs; and (iii) progressive phasing out of the ceiling on bank deposit interest rates. Progress was noted in institutionalizing the prudential guidelines for NBFCs by June 1994 and reduction of the SLR by October 1994, but the covenant on the liberalization of bank deposit rates was waived when the
10 Of the 55 implemented measures, 37 were complied with as originally scheduled while 18 encountered some
delays. All the 18 delayed measures were implemented before the submission of the PCR in December 1997. 11 The PCR did not explicitly highlight noncompliance with this program measure, nor provided any specific
information besides an increase in the effective rate of return on CRR from 3.5 percent to 4.0 percent in October 1997.
12 Given that the export refinancing facility is yet to be phased out, the PCR’s remark indicating “satisfactory compliance” is questionable.
13 Contrary to the PCR finding of full compliance, rationalization of priority credit was only partially achieved. 14 The Review Mission to assess the release of the second tranche was fielded in June 1994, which was the original
scheduled date of the second tranche release.

7
second tranche was released.15 The Government complied with all the loan covenants when the banks were free to fix the interest rate on term deposits with a maturity of over one year in July 1996.
15 The Government intended to lift the interest rate cap on fixed deposits as inflationary trends start to stabilize; the
health of the banking system is restored; and the newly created supervisory body becomes operational.

8
C. Procurement and Use of Counterpart Funds
14. The loan proceeds were used to reimburse imports other than those specified in the negative list. All eligible imports were from ADB’s member countries, with more than 30 percent from the US, followed by Singapore with about 16 percent. The procurement of eligible import items for withdrawal of the loan was in line with ADB’s standard procedures. As specified in the Loan Agreement, the rupee counterpart funds generated by the loan proceeds of the FSPL were to support the recapitalization of the public sector banks. Such recapitalization efforts showed progress during program implementation.
D. Performance of the Borrower
15. The Executing Agency for the FSPL was the Ministry of Finance (MOF), with the RBI playing a key role in implementing the banking reform and developing the government securities and money markets. The Securities Exchange Board of India (SEBI) was a key agency for the capital market component. With the strong authorship of the reform shown by these concerned agencies, the program management was broadly satisfactory. The Government submitted semiannual implementation reports and completion reports on time, following the loan agreement conditionalities.
E. Performance of ADB
16. The FSPL was monitored both at ADB headquarters and in the field by the Resident Mission, as part of ADB’s economic and policy consultative missions. Two Program Review Missions were also conducted during loan implementation: in June 1994 prior to the release of the second tranche and in December 1996 right after loan closing. In addition to these missions, the implementation and completion reports prepared by the Government were the primary sources of information for ADB’s monitoring activities. Nonetheless, the accomplishment of the program objectives were not clearly captured because performance indicators were not defined at program formulation.16 For the purposes of this evaluation, the OEM introduced a set of key performance indicators (Table 2).
16 Para. 110 of the RRP noted that “semiannual implementation reports and completion report should focus on the
accomplishment of the program objectives, and needed to be submitted in such form, in such detail and within such period as ADB may reasonably request.” However, ADB did not specify the details of these reports and the required performance indicators.

III. PROGRAM RESULTS
A. Achievement of the Objectives
17. The achievement of the program objectives/goals was assessed on the basis of the key performance indicators as shown in Table 2, supplemented by field interviews. Based on statistical tables (Appendix 2), the indicators primarily comprised annual averages for 1988-1991 (pre-program period) and 1993-1997 (period during and after the program implementation). The achievement levels are classified into three categories: substantial, partial, and marginal.

2
Table 2. Key Performance Indicators and Achievement of Objectives
Objective, Performance Indicators
Period Average Achievement of Objectives
1. Private access to financial savings - Commercial banks’ (CBs’) claims on private sector/GDP (%) - CBs’ reserves/GDP (%) - CBs’ reserves and claims on Government/GDP (%) - CBs’ total assets/GDP (%)
1987-1990 27.63 5.76 15.06 42.69
1992-1997 23.71 5.02 16.12 39.84
Marginal
2. Intermediation costs - Reserve money/quasi money (%) a - CBs’ noninterest expenses/CBs’ average assets (%) - CBs’ noninterest expenses/CBs’ interest income (%) - Net interest income/working funds (spread) (%) b
1987-1990 51.37
FY 1988/89-1991/92 3.32 FY 1987/88 - 1991/92 36.44 2.55
1992–1998 47.91 FY 1992/93-1996/97 4.47 47.63 2.89
Partial
3. Competition and diversity Entry of new banks (no.) CBs’ noninterest income / CBs’ total income (%)
FY 1987/88-1991/92 na
10.03
End-March1998 23
FY 1992/93 -1996/97 12.94
Substantial
4. Financial soundness and autonomy - Tier 1 risk-weighted capital ratio of nationalized CBs (%) - Tier 1 risk-weighted capital/ratios of DFIs (%) IDBI IFCI ICICI - Share of nongovernment equity holding (%) SBI State Bank of Bikaner and Jaipur State Bank of Travancore Oriental Bank of Commerce Dena Bank Bank of Baroda Bank of India Corporation Bank IDBI IFCI
FY 1988/89-1991/92 3.33
End-Mar 1991 11.2 10.8 10.6
End-Mar 1991 0 0 0 0 0 0 0 0 0 0
FY 1992/93-996/97 9.45
End-Mar 1998
13.7 12.7 13.0
End-Mar 1998
40.2 25.0 24.0 33.5 29.0 33.1 23.0 31.6 25.4 50.0
Substantial
5. Government securities and money markets c Refer to Figure 2 and Table 4 of this report.
na
na
Partial d
6. Capital market - Market capitalization/GDP (%) - Trade value/GDP (%)
1989-91(Average) 14.4 7.4
1992-98 (Average) 33.3 7.8
Substantial
GDP = gross domestic product, DFI = development finance institution, IDBI = Industrial Development Bank of India, IFCI = International Finance Corporation of India Ltd., SBI = State Bank of India, na = not available. a Reserve money is defined as currency in circulation plus the required and excess reserves of banks, while quasi money is
composed of time deposit. The variable, therefore, is a measure of the (i) efficiency in banks’ term-deposit mobilization; (ii) excess reserves, as proxy for efficiency of banks in the use of funds; and (iii) required reserves, which represent a degree of financial repression. Accordingly, a lower ratio of reserve money to quasi money broadly indicates a more efficient function of financial intermediation.
b Working funds include debt, deposits, reserves and capital.

3
c Due to lack of appropriate performance indicators covering the assessment period, measurements were based on financial data only after 1991 and findings from field interviews.
d This rating is based on (i) significant achievement in the development of the government securities market, and (ii) marginal achievement in the development of the money market.
Source: Appendix 2.
18. Table 2 shows substantial achievement on three out of six objectives: (i) enhanced competition and diversity in banking and DFI sectors; (ii) development of autonomous, financially sound banks and DFIs; and (iii) development of the capital market. Partial achievement was noted on (i) reduction of bank intermediation costs, and (ii) development of government securities and money markets. Achievement of enhanced private access to financial savings was marginal.
B. Policy Implications of the Program
19. This section discusses the implications of the performance indicators and other information obtained during the OEM, and assesses broadly the Program’s contributions to India’ financial sector development. In addition to program measures, key non-program measures, if any, will be highlighted in assessing the relevance especially of those program components where certain achievements had been observed. Issues in the program design and implementation, as well as structural rigidities and adjustment dynamics, will be analyzed for those program components where substantial achievements had not been attained.
1. Enhanced Private Access to Financial Savings
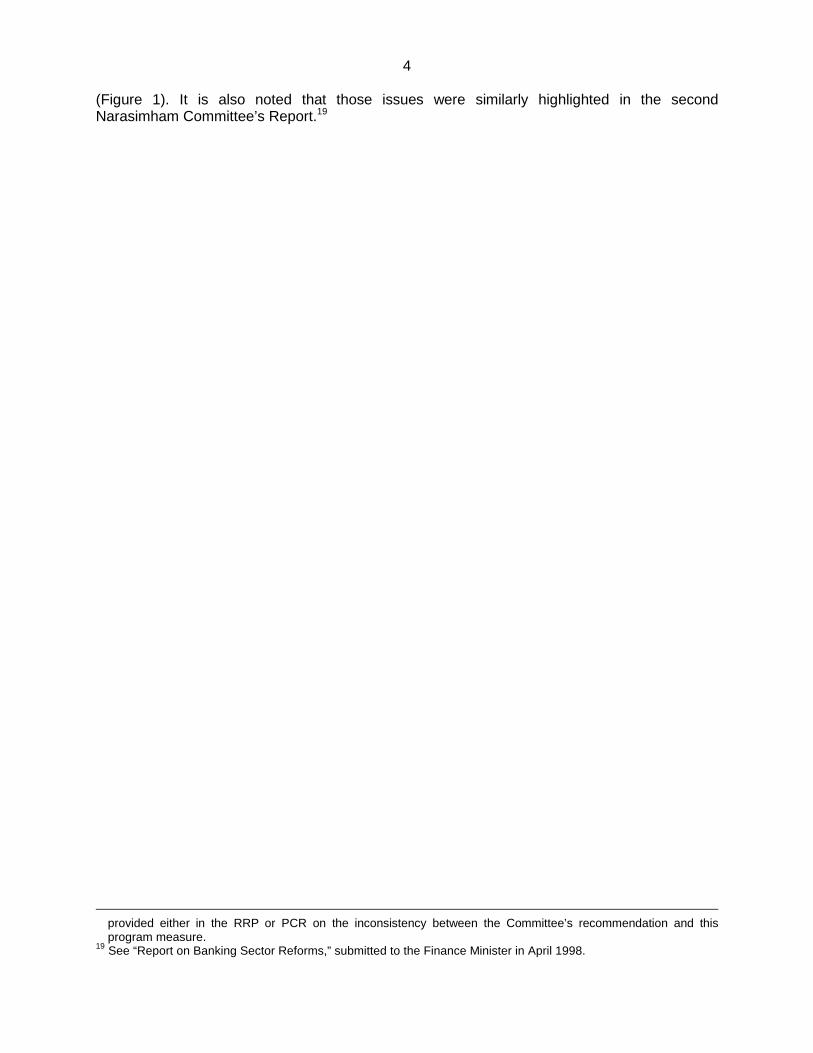
20. The decreasing trend in commercial banks’ (CBs’) assets relative to GDP implied a declining role of banks as financial intermediaries during the post-program period. The development of nonbank channels, such as the capital market and foreign direct investment, could be one of the potential explanations for the increased private investment. The reduction of CBs’ reserves retained in RBI was more than offset by CBs’ increased claims on the Government, which in effect, replaced RBI’s claims on the Government. Consequently, private access to financial savings (banks’ lending resource) had not been enhanced as targeted under the Program. 21. The above outcomes could be explained by the (i) slower-than-expected pace of the reduction in the fiscal deficit; (ii) significant shift in the Government’s funding from concessional sources to market-based borrowing from CBs; (iii) limited investors’ base and premature distribution system in the Government’s securities market; (iv) CBs’ growing concern with their portfolio quality and limited investment opportunities; and (v) the market environment, which made the government securities’ yield attractive enough for CBs to tap. Hence, the scope of this component seemed narrow against the broad objective. More focus could have been placed on the pace of fiscal reform and financial recovery of commercial banks. Nonetheless, reduction of the CRR17 and SLR was apparently the key initial step18 in achieving the far-reaching objective
17 In the monetary policy announcement for the second half of 1999/2000, RBI lowered the CRR from 10 to 9 percent
in two stages of 0.5 percent point each, on 6 and 16 November 1999. 18 Reduction of the interest rate on CRR, the only pending program measure under this component, is not considered
critical in achieving the objective. In fact, the Narasimham Committee recommended that RBI should pay interest rates on CRR deposits above the basic minimum related to banks’ average cost of deposits. No explanation was
4
(Figure 1). It is also noted that those issues were similarly highlighted in the second Narasimham Committee’s Report.19
provided either in the RRP or PCR on the inconsistency between the Committee’s recommendation and this program measure.
19 See “Report on Banking Sector Reforms,” submitted to the Finance Minister in April 1998.

5
Figure 1. Cash Reserve Ratio vs Statutory Liquidity Ratio
2. Reduction of Bank Intermediation Costs
22. The reserve money/quasi-money ratio, one of the conventional indicator on intermediation costs, had improved, reflecting the change in the CBs’ asset structures. This was apparently the outcome of the reduction in the reserve requirement. However, the key financial data of CBs showed little improvement in their operational efficiency. Moreover, progress in the CBs’ financial restructuring during 1992-1996 resulted in a significant drop in their profits. Under the circumstances, most of the surplus resources generated by reduction of the reserve requirement were retained in the banking system, instead of being passed on to depositors and borrowers. This was reflected in the higher interest rate spreads for CBs, as measured by CBs’ net interest income relative to average assets. 23. Rationalization of the priority credit scheme (including the export refinance facility and subsidies on export credits)20 and interest rate liberalization, which were key program measures of this component, remain relevant in achieving this FSPL objective in the medium term. The same can be said for the reduction of CRR and SLR, and also the competition measures addressed in other components. The review of the priority credit has not resulted in significant rationalization of the credit allocation of CBs, and the export refinance facility is yet to be phased out. The delay in deposit rate liberalization and the rigidity of interest rates even after the liberalization were the other discouraging aspects of the Program. Moreover, the Government’s general principle in proceeding with the banking reform, putting more priority on “stability,” and avoiding the closure of major CBs, might naturally limit the competition and prevent the narrowing of banks’ interest rate spreads. Nonetheless, the efficiency gains of some CBs in the form of improved customer service were reported to have gradually appeared.
20 Quantification of the impacts of these measures, which were not estimated at program formulation, would require
further assessment.
0
5
10
15
20
25
30
35
40
45
1988
1989
1990
1991
1992
1993
1994
1995
1996
1997
1998
1999
Fiscal Year
Rat
io (%
)
Cash Reserve RatioStatutory Liquidity Ratio

6
3. Enhanced Competition and Diversity in Banking and DFI Sectors21
24. Improved customer service in some banks was apparently the outcome of enhanced competition. In turn, the increased noninterest income of CBs indicated diversification of their operations. The entry of the Industrial Development Bank of India (IDBI) and Industrial Credit and Investment Corporation of India Ltd. (ICICI) in commercial banking, by establishing their subsidiaries, showed diversification of DFIs activities as well. The removal of privileged funding and operational opportunities and tax treatment for DFIs, and the entry of a number of foreign and private banks were reported to have significantly contributed to the above achievements. Meanwhile, the Narasimham Committee recommended two relevant measures, which were not included in the Program. These were (i) gradual replacement of consortium lending by participative lending, and (ii) DFIs’ extension of working capital loans and banks’ extension of term lending. The stipulation relating to the formulation of a compulsory consortium was abolished accordingly, and DFIs are now resorting to syndication/participation in lending. The term structures of DFIs’ and CBs’ credits have reportedly been diversified, since the ceiling imposed on the banking system for the grant of a term loan for any single project was removed in September 1997.
4. Development of Autonomous and Financially Sound Banks and DFIs22
25. Clearly, the significantly improved risk-weighted capital ratio of CBs, after several rounds of Government capital injection and subsequent equity funding in the market, was the major achievement of the FSPL (Table 3 and Box 1). To date, the State Bank of India (SBI), two associates of SBI, and five nationalized banks have publicly issued their shares. The Government shareholding in IDBI and International Finance Corporation of India Ltd. (IFCI) has also declined to 75 percent and 50 percent, respectively. With the introduction of key prudential and disclosure norms, a strengthened regulatory and supervisory framework for sound banking was another major achievement of the Program (Appendix 3).23 Market perceptions on issues related to nonperforming assets (NPAs) were mixed.24 A detailed review of the portfolio of the recently created banks would be required to further assess the efficacy of the above prudential norms, as well as the sustainability of the banks’ capital adequacy ratios. The second Narasimham Committee report accordingly focused on the NPAs as one of the key issues for the second phase of the banking sector reform. Meanwhile, the program measures on branch licensing, recruitment of officers, and appointment of chief executive officers/board members, together with diversification of ownership, enhanced the autonomy of the public sector banks. While legal actions were taken to permit public issues for IDBI and IFCI, as envisaged under the
21 This component corresponds to C and H of the policy matrix. 22 This component corresponds to D, E, and F of the policy matrix. 23 In early 1990s, RBI’s approach has apparently shifted away from a combination of over regulation and under
supervision of banks. Indian courts at both High Court and Special Court levels reportedly played active roles in enhancing this transition.
24 The recent inspection carried out by RBI revealed that the gross NPAs of the Indian commercial banks amounted to around Rs469 billion (estimated at around 16 percent of the total loan portfolio of banks) against the Rs436 billion reported by banks (see Express Investment Week, 29 March–4 April 1999). A recent report on Indian NPA by Credit Lyonnais Securities Asia (India’s NPL Problem–How Bad Is It?, December 1998) estimates gross bank NPA to rise to Rs772 billion by March 2000, if NPA norms were tightened to one quarter default against the current practice of two quarter default, and if “evergreening” were checked. According to this report, DFIs are more prone to the NPL problem than banks are. Among the three key DFIs, IFCI is considered to have the highest NPA ratio.

7
Program, degrees of autonomy in IFCI’s and IDBI’s operations remained in question. Meanwhile, ICICI has reportedly strengthened its autonomy and financial viability. According to the second Narasimham Committee Report, the regulatory framework for NBFCs, 25 which was briefly addressed under the FSPL, has remained an issue.
Table 3. Recapitalization of Nationalized Banks
(Rs million)
Capital Allocated 1994/95
Capital Allocated (Tier 1)
Name of Bank
Capital Contribution
of Government
(Tier 1) 1992/93-1993/94
Tier 1
Tier 2a
1995/96
1996/97
1997/98
Total Capital
Contribution
Capital Returned
to Government
Public Issuance
of Sharesb
Current Statusc
Allahabad Bank 1,550 3,562 1,016 1,600 0 0 7,728 0 R Andhra Bank 1,800 1,843 0 0 1,650 0 5,293 0 Bank of Baroda 4,500 0 0 0 0 0 4,500 3,810 PI Bank of India 6,350 8,483 3,482 0 0 0 18,316 934 PI Bank of Maharastra 1,850 3,341 0 800 0 0 5,991 0 Canara Bank 4,400 0 0 0 0 6,000 10,400 0 Central Bank of India 4,900 6,324 0 0 5,000 0 16,224 0 R Corporation Bank 750 0 0 0 0 0 750 300 PI Dena Bank 1,800 61 722 0 0 0 2,583 0 PI Indian Bank 2,550 2,309 1,809 0 0 17,500 24,169 0 SR Indian Overseas Bank 7,050 2,586 1,327 0 0 0 10,963 0 Oriental Bank of Communication 800 0 0 0 0 0 800 0 PI Punjab and Sind Bank 2,450 1,160 0 720 1,500 0 5,830 0 R Punjab National Bank 4,900 0 0 0 0 0 4,900 1,383 SR Syndicate Bank 6,800 2,785 887 1,720 0 0 12,193 0 Uco Bank 5,350 5,155 0 1,100 540 3,500 15,645 0 SR Union Bank of India 2,300 0 0 0 0 0 2,300 0 R United Bank of India 2,150 5,388 0 2,560 3,380 0 13,478 0 Vijaya Bank 1,150 623 0 0 3,020 0 4,793 0 Total 63,400 43,625 9,245 8,500 15,090 27,000 166,861 0 New Bank of India d
600 — — — — — 600 — — — Total Contribution 64,000 43,625 9,246 8,500 15,090 27,000 167,461 6,428
a Injection of Tier 2 capital to six banks was supported by the World Bank's Financial Sector Development Project, approved in 1995. b PI means that shares were publicly issued. c Unless otherwise specified, autonomy is secured; R means under review by Reserve Bank of India (RBI); and SR means under special review by RBI. d Punjab National Bank merged with New Bank of India in 1993/94.
Source: Reserve Bank of India.
25 “The failure in 1997 of a relatively sizable and high-profile entity, CRB Capital Market Ltd., dealt a blow to the
confidence of retail investors, resulting in a fight for quality that exacerbated funding and liquidity stresses for a number of NBFCs. A slowing domestic economy has resulted in weaker asset quality, while competition for viable lending opportunities from foreign players and, to a lesser extent, the increasingly liberalized banking system, have seen a contraction in the spreads that have underpinned the sector’s profitability. The likely implementation of regulatory standards on assets classification and provisions, together with more stringent capital requirements, will result in continued stress in the medium term, while the recent introduction of restrictions on deposit gathering has already resulted in additional funding pressures.” Source: Bank Industry Risk Analysis: India, December 1, 1998, Standard & Poors Credit Analysis Service.

8
Box 1. Performance of Recapitalized Banks Government capital injection for eight banks was completed by end-1994/95. The banks showed improved performance in terms of the eligibility criteria set by RBI for granting autonomy, i.e., (i) net profit record consistent for three years, (ii) capital to risk weighted assets ratio (minimum of 8 percent), (iii) net NPAs below 9 percent, and (iv) net owned funds above Rs1 billion. Meanwhile, the net loss experienced by one of them in 1996 made it ineligible for autonomy. The rest of the 11 banks received repeat capitalization support from the Government between 1995 and 1998. Of these, four banks secured autonomy from the RBI/Government in 1998. Three of the remaining eight banks (including the one that lost autonomy in 1996) remain especially weak. The performance of the three banks has been under the special review of the Government Committee.
5. Government Securities and Money Markets
26. Figure 2 shows a sharp increase in the trading volume of government securities in the secondary markets. Among the key program measures were the (i) introduction of the auction system for treasury bills with maturity of 364 days and dated securities in 1992; (ii) 91-day treasury bills in 1993; and (iii) 14-day treasury bills in 1997, with the institution of the primary and satellite dealers system. RBI announced the guidelines for primary dealers for government securities in 1995. In 1996, six entities received approval to operate as primary dealers. Subsequently, the guidelines for satellite dealers were announced in 1996. To date, 13 and 7 entities have been accredited as primary and satellite dealers, respectively. The issuance of new instruments such as zero coupon bonds, partly paid stock, floating rate bonds and capital index bonds, and listing of the government securities on the National Stock Exchange in 1994 were among the key non-program measures.
Figure 2: Secondary Market Trading Volumes 27. Table 4 shows a limited impact of the relaxation and liberalization measures on CD and CP, the core program measures related to the money market. Field interviews also confirmed the limited achievement of the money market to date. Recognizing the development of the
0
50
100
150
200
250
Sep-94 Mar-95 Sep-95 Mar-96 Sep-96 Mar-97 Sep-97 Mar-98 Sep-98
Mon
thly
Vol
ume
(Rs
billi
on) Central Government Securities
Treasury Bills
Source: Primary Dealers Association of India.

9
money market as a precondition for the effective and efficient introduction of indirect instruments for monetary management, RBI has implemented several non-program measures, especially since 1997. These are the (i) extension of entry permission for the interbank call market, (ii) exemption of interbank liabilities from CRR and SLR stipulations, (iii) introduction of interest swap and other derivative instruments, and (iv) establishment of asset-liability management systems in banks. The Government expects the impacts of the above measures to appear, when the banks’ asset-liability management systems and an electronic dealing system are effectively put in place.
Table 4. Outstanding Volume of Certificate of Deposit and Commercial Paper (Rs million)
Certificate of Deposit Commercial Papers
Date
Total Outstanding
Date
Total Outstanding
26 Jul 1991
4,846 —
—
24 Jan 1992 5,655 — — 24 Jul 1992 7,800 — — 22 Jan 1993 9,962 — — 23 Jul 1993 11,997 31 Jul 1993 1,454 21 Jan 1994 5,780 31 Jan 1994 3,717 22 Jul 1994 5,347 31 Jul 1994 4,211 20 Jan 1995 6,708 31 Jan1995 1,530 20 Jul 1995 12,094 31 Jul 1995 582 19 Jan 1996 17,934 31 Jan 1996 89 19 Jul 1996 18,203 31 Jul 1996 218 31 Jan 1997 10,759 31 Jan 1997 408 18 Jul 1997 9,219 31 Jul 1997 2,085 30 Jan 1998 9,732 31 Jan 1998 4,724 05 Jun 1999 10,945 31 Jul 1998 4,102
– = zero magnitude. Source: Annual Reports of RBI.
6. Capital Market Development
28. The performance indicators show the quantitative development of the market. Field interviews confirm the improvement of the qualitative aspects. The foundation of such achievements had been laid by the establishment of the SEBI Act and capital adequacy standards for members of stock exchanges, and the repeal of the Capital Issue Act as key program measures. Among the key non-program measures implemented during 1993-1995 were the establishment of the National Stock Exchange and the National Securities Depository Ltd., and the amendment to the SEBI Foreign Institutional Investors Regulations. Several other relevant measures were subsequently implemented under ADB’s Capital Market Development Program (CMDP). 26 An assessment of ADB’s overall contributions to capital market development would require further review of the impact of those measures implemented under CMDP.
26 Loan 1408-IND: Capital Market Development Program, for $250 million, approved on 28 November 1995.

10
C. Financial Implications of the Loan
29. Balance-of-Payments (BOP) Support. India’s BOP structure has changed. As noted earlier, private capital flows gradually replaced public sector borrowing in the financial account. In retrospect, this transition is considered to have been successful, in view of the swift stabilization and growth recovery in the economy. Apparently, the timely use of IMF credit (Table 5) significantly supported this transition, while quick-disbursing loans from the World Bank and ADB also partly offset the sudden drop in the Government’s investment liabilities.27 Assistance from multilateral sources, including the FSPL, contributed not merely in providing liquidity but also in laying the foundation of the economic transformation. Subsequent foreign private capital inflows indicated a significant gain of investors’ confidence in the Government’s commitment to the key sector reforms. Table 5. Foreign Reserves and Use of IMF Credit during the Crisis (May 1991-April 1993)
Item
Jan
Feb
Mar
Apr
May
Jun
Jul
Aug
Sep
Oct
Nov
Dec
1991 A
—
—
—
—
1,335
1,187
1,403
1,190
1,906
2,464
2,752
3,627
1991 B — — — — 0 0 166 0 469 0 85 0 1992 A 2,793 3,080 4,171 4,115 3,909 4,347 4,463 4,255 3,946 3,910 3,520 4,187 1992 B 185 0 0 0 0 462 0 0 0 0 0 462 1993 A 4,071 4,039 4,828 5,149 — — — — — — — — 1993 B 0 231 0 0 — — — — — — — —
IMF = International Monetary Fund. A = total reserves minus gold ($ million, end of month) of the country. B = all purchases (excluding reserve tranche purchase) from IMF (SDR million). Source: IMF, International Financial Statistics, several editions. 30. Adjustment Cost Support. The fiscal costs of the Program were mainly associated with financial outlays such as (i) higher interest payments due to increased market-based funding, and (ii) capital injection to the nationalized banks.28 The higher Government funding costs ensured the former, although its precise quantification would require further assessment. The latter, which amounted to about Rs200 billion ($5.5 billion)29 by 1997/98 or equivalent to 1.3 percent of GDP in 1997/98, was also supported by the capital restructuring component of the World Bank’s Financial Sector Development Project (FSDP) of $350 million. The FSPL did not specify the eligibility criteria and method of capital injection. In contrast, the FSDP specified six banks as eligible for Tier 2 capital injection.30 RBI officials admitted that the value added of the FSPL in terms of technical inputs in proceeding with the banks’ recapitalization was less than
27 The Consortium Meeting held in June 1992 identified India’s exceptional financing requirements for 1992/93 at $3.4
billion against the estimated private investment flows of $200 million. Out of $3.4 billion, about $300 million was to be provided by quick-disbursing loans from ADB, while $1.6 billion was to be funded by IMF and $1.0 billion by the World Bank. ADB’s actual contribution was $275 million, comprising the FSPL’s first tranche of $150 million and the second tranche of $125 million for the Hydrocarbon Sector Program Loan. Private investment flows in 1993 were far beyond what was projected at the Consortium Meeting in June 1992.
28 Refer to Schedule 5 of the Loan Agreement and policy matrix F.2.(iii), “Facilitate measures enabling recapitalization of banks through access to capital markets. Equity injection to public sector banks by the Government will only be provided as a preparatory step to banks approaching the capital market.”
29 Based on the annual average exchange rate of Rs37.2=$1.0. 30 This implies that the FSPL must have supported those banks that were not supported by the World Bank.

11
that of the FSDP. But they noted ADB’s quick response at the critical juncture through the FSPL, and highlighted the loan’s flexible arrangement on the use of counterpart fund. 31. The policy enhancement effects of the FSPL in relation to the above fiscal contributions are not fully quantifiable. Interviews with concerned Government officials revealed mixed perceptions. Many officials admitted that ADB’s loan from its ordinary capital resources could be attractive even for deficit financing under certain market conditions. They recognized that the request for the FSPL reflected such market conditions in 1992, and that the loan contributed to some extent in enhancing the Government’s capital injection to banks.31 Some other officials noted that the comparison of actual funding costs from hard and nonhard currencies has no sound basis. In this regard, they felt that the fiscal implications of this type of loans should not be overly highlighted. Although not the case with the FSPL as earlier discussed, this observation raises a fundamental question on the policy enhancement effect of a program loan to a country with little BOP problems.
D. Socioeconomic and Environmental Implications
32. The first Narasimham Committee report recommended that the scope of priority sector credit be reduced from 40 to 10 percent of the total bank credit. This recommendation has not been implemented, reflecting the Government's social and political concern about the vulnerability of the groups covered by this scheme. Meanwhile, the FSPL addressed the need for a review and rationalization of the priority credit without providing details. Such a review by the Government resulted in an expansion of the scope of the program. Under the present dispensation, 10 percent of the net bank credit within the priority sector is earmarked for lending to weaker sections. A major portion of this lending is on the account of Government-sponsored poverty reduction and income generation schemes. Noting the special needs of the vulnerable group, the second Narasimham Committee report reconsidered and concluded that the current practice might continue. Nonetheless, the committee continued to be critical of the remaining elements of interest subsidy and overprotection for small borrowers in the priority sector credit program. 33. No significant adverse social impacts occurred during program implementation; for example, no major retrenchment programs were reported as a result of the enhanced competition and financial restructuring. This, however, could be a reflection of the slow progress in rationalization of the major commercial banks. The Program did not specifically focus either on women as beneficiaries or on the environmental aspects.
31 If that were the case, a result of the recapitalization would be among the most critical parameters in assessing the
achievements of the FSPL. To date, most recapitalized banks except three are reportedly on the recovery track, while the loan portfolios of some remain weak.

IV. CONCLUSION
A. Overall Assessment
34. Overview of Financial Sector Development. Despite the rising private investment ratio during the assessment period, money and banking data showed negative growth in the volume of financial intermediation relative to GDP. But banks’ balance sheets showed significant recovery in their financial viability and enhanced autonomy; commercial orientation and competition among financial institutions were evident. These implied that the reforms resulted in qualitative—though not quantitative—impacts to the banking system, especially in reducing its fragility and upgrading the quality of public and private lending. Such improvement has contributed to maintaining macroeconomic stability and, presumably, gradually improving allocative efficiency in the economy. Both quantitative and qualitative developments also noted in the capital market partly offset the reduction in bank lending and contributed to attracting foreign portfolio investment. 35. Program Performance and Achievement of the Objectives. The Program was appropriately designed and effectively implemented, and contributed significantly to the country’s financial sector development. The substantial achievements in the three objectives and the relevance of the concerned program measures are noted. Further progress toward the three other objectives is also expected in view of the relevance and gestation periods of the concerned program and non-program measures implemented to date. The effective linkages among the program components and the reform momentum are the other supportive factors. As major achievements of the FSPL, for instance, improved competition, diversity, and autonomy and financial viability of banks will be the key factors in reducing the intermediation costs in the long term. Diversification of ownership in government securities, along with the creation of efficient distribution systems will gradually shift banks’ credit allocation from the Government to the private sector. With the proper risk management system of banks, especially their asset-liability management in place, the money market is expected to be more active. Considering the recommendations of the second Narasimham Committee report and that of other experts,32 which highlighted the remaining portion of the reform agenda including those discussed above, the Government is committed to proceed with the second phase of the financial sector reform. 36. BOP and Adjustment Cost Supports. As far as financial implications are concerned, the relevance of the FSPL could be explained by two key factors. The first was the BOP contribution. In particular, the first installment of the FSPL was effective and timely in sustaining the macroeconomic stability of the country, which was a precondition in implementing the structural reform measures. Second, the FSPL supported the Government in proceeding with the most costly aspect of the financial sector reform, i.e., recapitalization of the public sector banks. 37. In view of the above, the FSPL is rated as generally successful.
32 These include a recent report of the former chairman of SBI.

2
B. Lessons Learned
38. Government Authorship, Prioritization, and Sequencing of Reforms. India has steadily liberalized the financial sector without experiencing any major banking crisis. Such an outcome could be attributed to the Government’s comprehensive and cautious approach in putting a priority on economic stability. While considering the pace of progress in reforms in the other sectors, the Government has maintained solid authorship especially in the timing and sequencing of the financial reforms. In principle, several important steps were taken: (i) strengthening of the legal, regulatory, and supervisory framework; (ii) rehabilitation of institutions with the recapitalization and financial restructuring of major banks; and (iii) liberalization and commercialization of the sector. Swift macroeconomic stabilization and a conservative approach to capital account liberalization on the external front could be the other factors that contributed to the successful undertaking of the financial sector reform program. 39. Support for Bank Recapitalization. The World Bank and ADB differed in their approach to support of bank recapitalization. In contrast to the FSPL, RBI highlighted the significant technical inputs provided under the World Bank’s FSDP during their policy dialogue, especially in determining the methodology and eligibility for recapitalization. But RBI also appreciated ADB’s FSPL, noting the somewhat flexible arrangement in the use of the counterpart fund. Feedback from RBI confirmed that FSPL and FSDP were complementary. It is believed that accountability in ADB’s approach largely depends on the capacity of the recipient Government/Executing Agency to handle the program. India was apparently one of such cases where the extent of accountability was maintained. In general, ADB should carefully assess government capacity, especially when assisting in the recapitalization of banks, and should expect to offer technical inputs depending on the needs. In this regard, ADB could analyze the results of bank recapitalization in developing member countries, and consolidate the findings as the basis for the needed technical inputs in the future. 40. Implications of the Financial Intermediation Costs. The allocation of surplus resources obtained by the reduction in intermediation costs depends on market conditions and the policy environment. In the case of India, the Government implicitly admitted that such gains were taken by the financial institutions instead of passing them on to the depositors and borrowers. The consideration behind this was the immediate need for recovery in the financial strength of banks. Nonetheless, the long-term goal should be increased benefits for borrowers and depositors, which could be ultimately measured by the interest rate spreads. To achieve such a long-term goal, the remaining impediments limiting the transfer of benefits to depositors and borrowers need to be removed. ADB should have a clear perspective on these aspects when addressing the issues in intermediation costs. 41. Clarity in Program Measures. The policy matrix should avoid setting unspecified targets. Some FSPL measures as stated in the policy matrix were not clear including: (i) “gradual” reduction of interest rate on CRR; (ii) reduce “substantially” interest rate subsidy on priority credits; (iii) “gradually” phase out export refinancing; (iv) ceiling on bank deposit interest rates “progressively” phased out; and (v) “progressively” reduce, with a view to eliminating, cross holding of equity. 42. Need for Performance Indicators. Identification of effective performance indicators at formulation would have made ADB’s monitoring activities in the FSPL more solid and efficient. In setting measurable targets with appropriate indicators, the growth potential of a concerned sector and the structural rigidities hindering full use of this potential need to be fully discussed

3
with the Government. This would enhance Government confidence in dealing with the reform measures and thus would be a key aspect of the program loans by which ADB could maximize value added in policy formulation by the Government.
C. Follow-Up Actions
43. In monitoring the sustainability of the program impacts and further improvement of sector performance, ADB needs to update the performance indicators identified under this PPAR. Especially in monitoring the three pending objectives, in which the program impacts have yet to fully appear, ADB should pay attention, among others, to the following constraints: (i) the less developed government securities market and the weak distribution systems, (ii) remaining inefficiencies in nationalized banks, (iii) remaining allocative distortion such as priority and export refinancing schemes, (iv) need for strengthening of the regulatory and supervisory framework for NBFCs, (v) NPA issues of financial institutions, and (vi) weak asset-liability management of financial institutions. As to the capital markets, the implementation performance and the interim impacts of the CMDP need to be assessed to identify the needed follow-up actions.

4
APPENDIXES
Cited on Number Title Page (page, para. no.) 1 Implementation Performance of Program Measures 19 5, 11 2 Statistical Tables 32 6, 17 3 Current Regulatory Framework for Banks, DFIs/RFIs, and NBFCs 38 10, 25


![ASIAN DEVELOPMENT BANK PPA: KGZ 28394 - adb.org · asian development bank ppa: kgz 28394 program performance audit report on the agriculture sector program (loan 1407-kgz[sf]) in](https://static.fdocuments.us/doc/165x107/5b23532a7f8b9ae3158b53f5/asian-development-bank-ppa-kgz-28394-adborg-asian-development-bank-ppa.jpg)


![ASIAN DEVELOPMENT BANK PCR:PAK · ASIAN DEVELOPMENT BANK PCR:PAK 16143 PROJECT COMPLETION REPORT ON THE RURAL ACCESS ROADS PROJECT (Loan 1401-PAK[SF]) IN ... FIDIC ― International](https://static.fdocuments.us/doc/165x107/5eb9e50e8a79af1b9b6f4dea/asian-development-bank-pcrpak-asian-development-bank-pcrpak-16143-project-completion.jpg)
![ASIAN DEVELOPMENT BANK - OECD.org · asian development bank ppa: nep 24321 project performance audit report on the kathmandu urban development project (loan 1240-nep[sf]) in nepal](https://static.fdocuments.us/doc/165x107/5acc25437f8b9a27628c2939/asian-development-bank-oecd-development-bank-ppa-nep-24321-project-performance.jpg)

![ASIAN DEVELOPMENT BANK€¦ · ASIAN DEVELOPMENT BANK PCR:NEP 25088 PROJECT COMPLETION REPORT ON THE MICROCREDIT PROJECT FOR WOMEN (Loan 1237-NEP[SF]) IN NEPAL September 2003. CURRENCY](https://static.fdocuments.us/doc/165x107/5fda4ccf5b2f3a5cdb30f130/asian-development-bank-asian-development-bank-pcrnep-25088-project-completion-report.jpg)


![ASIAN DEVELOPMENT BANK PPA:SRI 24320€¦ · ASIAN DEVELOPMENT BANK PPA:SRI 24320 PROGRAM PERFORMANCE AUDIT REPORT ON THE SECOND AGRICULTURE PROGRAM (Loan 1127-SRI[SF]) IN SRI LANKA](https://static.fdocuments.us/doc/165x107/5f60ce67f6974c41723ca2e3/asian-development-bank-ppasri-24320-asian-development-bank-ppasri-24320-program.jpg)