
ASIAN DEVELOPMENT BANK · Bogor and Palembang Urban Development Project, Loan I 292-lNO: Eastern...
69
ASIAN DEVELOPMENT BANK PCR: INO 24068 11 PROJECT COMPLETION REPORT [ii 1:1 CENTRAL JAVA AND Di. YOGYAKARTA URBAN DEVELOPMENT (SECTOR) PROJECT (Loan No. 1198-INO) Ii II I 'I.] I,i May 2000
Transcript of ASIAN DEVELOPMENT BANK · Bogor and Palembang Urban Development Project, Loan I 292-lNO: Eastern...

ASIAN DEVELOPMENT BANK PCR: INO 24068
11
PROJECT COMPLETION REPORT
[ii 1:1
CENTRAL JAVA AND Di. YOGYAKARTAURBAN DEVELOPMENT (SECTOR) PROJECT
(Loan No. 1198-INO)
Ii
II I 'I.] I,i
May 2000
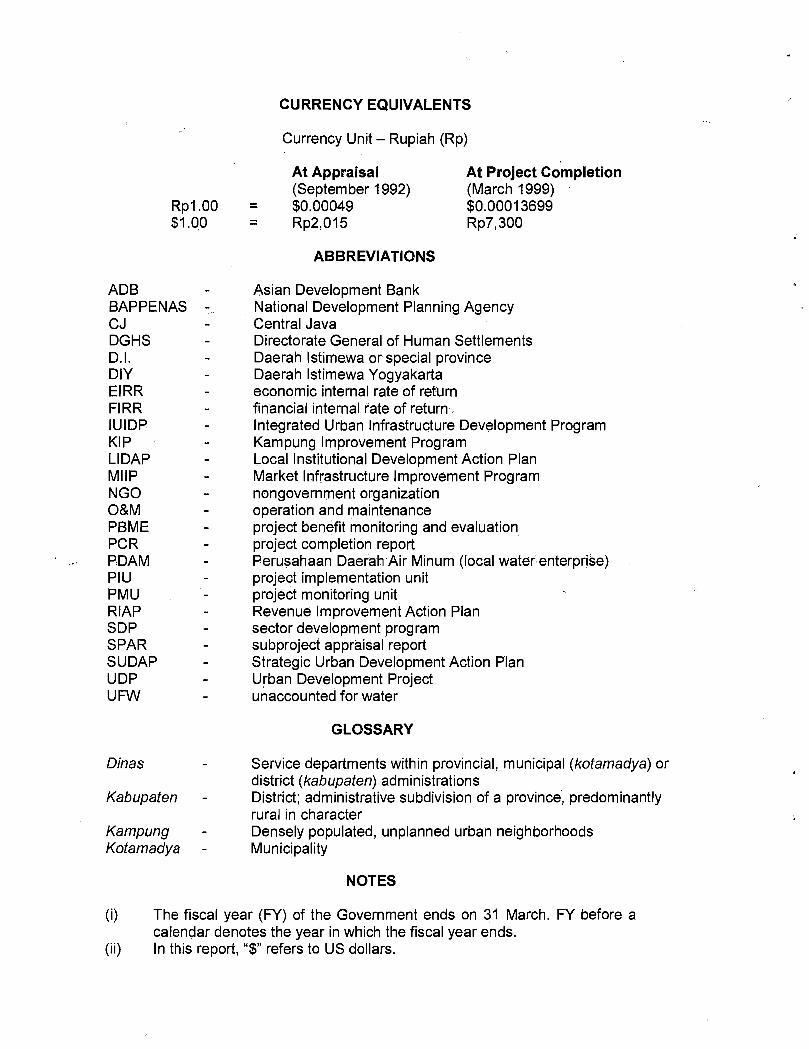
CURRENCY EQUIVALENTS
Currency Unit - Rupiah (Rp)
At Appraisal At Project Completion(September1992) (March 1999)
Rpl.00 = $0.00049 $0.00013699
$1.00 = Rp2,015 Rp7,300
ABBREVIATIONS
ADB - Asian Development Bank
BAPPENAS - National Development Planning AgencyCJ - Central JavaDGHS - Directorate General of Human SettlementsDi. - Daerah Istimewa or special provinceDIY - Daerah Istimewa YogyakartaEIRR - economic internal rate of returnFIRR - financial internal rate of returnIUIDP - Integrated Urban Infrastructure Development ProgramKIP - Kampung Improvement ProgramLIDAP - Local Institutional Development Action PlanMIIP - Market Infrastructure Improvement ProgramNGO - nongovernment organizationO&M - operation and maintehancePBME - project benefit monitoring and evaluationPCR - project completion reportPDAM - Perusahaan Daerah Air Minum (local water enterprise)PIU - project implementation unitPMU - project monitoring unitRIAP - Revenue Improvement Action PlanSDP - sector development programSPAR - subproject appraisal reportSUDAP - Strategic Urban Development Action PlanUDP - Urban Development ProjectUFW - unaccounted for water
GLOSSARY
Dinas - Service departments within provincial, municipal (kotamadya) ordistrict (kabupaten) administrations
Kabupaten - District; administrative subdivision of a province, predominantlyrural in character
Kampung - Densely populated, unplanned urban neighborhoodsKotamadya - Municipality
NOTES
(i) The fiscal year (FY) of the Government ends on 31 March. FY before acalendar denotes the year in which the fiscal year ends.
(ii) In this report, "$" refers to US dollars.
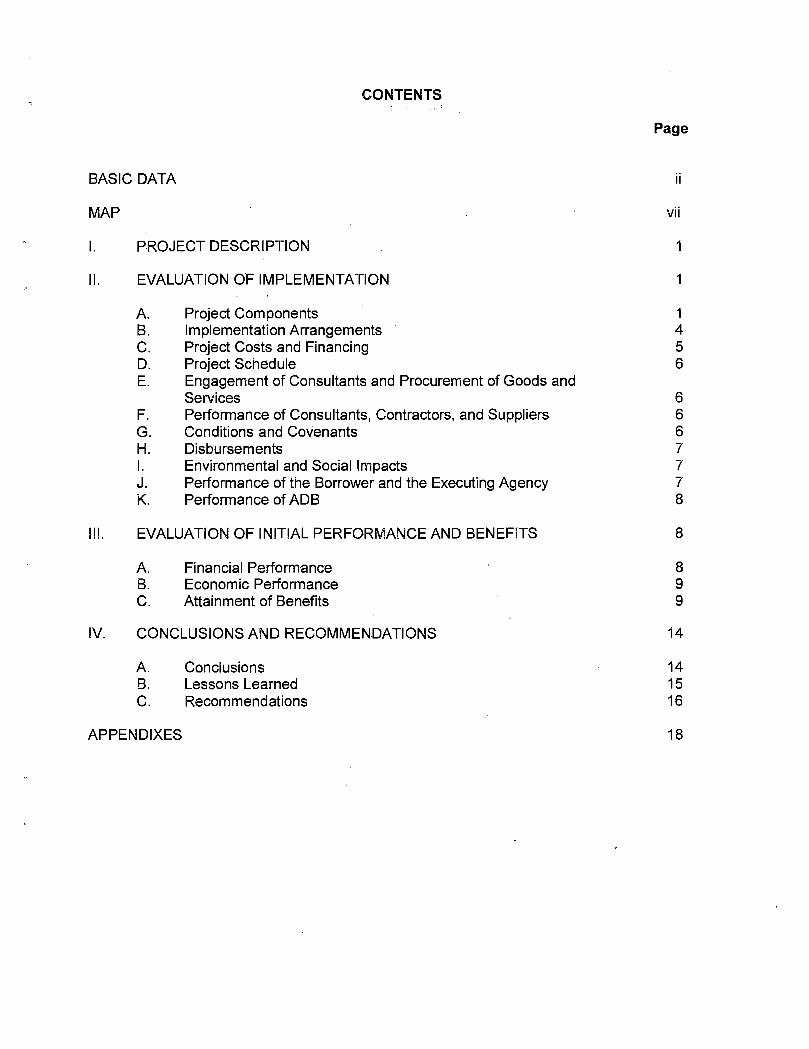
CONTENTS
Page
BASIC DATA
II
MAP vii
I. PROJECT DESCRIPTION
I
II. EVALUATION OF IMPLEMENTATION
1
A. Project Components 1
B. Implementation Arrangements
4C. Project Costs and Financing
5
D. Project Schedule
6E. Engagement of Consultants and Procurement of Goods and
Services
6F. Performance of Consultants, Contractors, and Suppliers
6
G. Conditions and Covenants
6H. Disbursements
7I. Environmental and Social Impacts
7
J. Performance of the Borrower and the Executing Agency
7K. Performance of ADB
8
III. EVALUATION OF INITIAL PERFORMANCE AND BENEFITS
8
A. Financial Performance
8B. Economic Performance
9
C. Attainment of Benefits
9
IV. CONCLUSIONS AND RECOMMENDATIONS
14
A. Conclusions
14B. Lessons Learned
15C. Recommendations
16
APPENDIXES
18

BASIC DATA
B.
Loan Identification
1. Country2. Loan Number3. Project Title
4. Borrower5. Executing Agency
6. Amount of Loan
7. PCR Number
Loan Data
1. Appraisal- Date Started- Date Completed
2. Loan Negotiations- Date Started- Date Completed
3. Date of Board Approval
4. Date of Loan Agreement
5. Date of Loan Effectiveness- In Loan Agreement-Actual
6. Closing Date- In Loan Agreement- Actual- Number of Extensions
7. Terms of Loan- Interest Rate- Maturity- Grace Period
8. Terms of Relending- Interest Rate- Maturity- Grace Period
Indonesia1198-INOCentral Java and D.l. Yogyakarta UrbanDevelopment (Sector) ProjectRepublic of IndonesiaDirectorate General of Human Settlements(DGHS) in Ministry of Public Works (MPW)$150.0 million in ordinary capital resources(OCR)INO 564
24 July 199214 August 1992
26 October 199229 October 1992
26 November 1992
10 February 1993
11 May 199324 March 1993
30 September 199831 March 19991I
Variable25 years5 years
11.75 percent220 years5 years
The loan account is kept open, pending settlement by the Borrower of $0.21 million related to disbursements.2
Includes banking fee of 0.75 percent per annum.

Appraisal Estimate
94.0
• 156.0
250.0
($ millionActual
91.3
102.5
193.8
mi
9. Disbursements
a. Dates
Initial Disbursement Final Disbursement Time Interval29 September 1993 13 December 1999 6.2 years
Closing Date Time IntervalEffective Date Original Actual, (from original (from actual
closing date) closing date)24 March 1993 30 September 1998 31 March 1999 5.5 years 6.0 years
b. Amount($ million)
Reallocation
Original and Amount UndisbursedCategory Allocation Cancellation Disbursed Balance
I Civil Works 54.5 (1.3) 53.2 0
1A Equipment&Materials 12.0 17.9 29.9 0(ICB/IS)
lB Equipment and Materials 35.6 (32.9) •2.5 0(LCB)
1C Consulting Services (ICB) 10.6 (1.7) 8.9 0
1D Consulting Services (LCB) 17.3 (6.6) 10.7 0
1 E Civil Works Crash Program 0.0 (0.8) 0.8 0
03 Interest During Construction 20.0 0.0 20.0 0
Total 150.0 24,0 126.0 0
9. Local Costs (Financed)
- Amount- Percentage of Local Costs- Percentage of Total Cost
C. Project Data
1. Project Cost
Cost
Foreign Exchange
Local Currency
Total
$34.7 million.24 percent18 percent

iv
2. Financing Plan($ million)
Item Appraisal Estimate Actual
Foreign Local Total Foreign Local Total
A Implementation Costs
Borrower-financed 0.0 90.0 90.0 0.0 57.8 57.8
ADB-financed 74.0 56.0 130.0 71.3 34.7 106.0
Subtotal (A) 74.0 146.0 220.0 71.3 92.5 163.8B Interest During Construction
Borrower-financed' 0.0 100 10.0 0.0 10.0 10.0
ADB-financed 20.0 0.0 20.0 20.0 0.0 20.0
Subtotal (B) 20.0 10.0 30.0 20.0 10.0 30.0
Total 94.0 156.0 250.0 91.3 102.5 193.8
3. Cost Breakdown by Project Components($ million)
Item Appraisal Estimate Actual
Foreign Local Total Foreign Local Total
Part AImprovement Of Urban Infrastructure and Services
1. By Cost Category
Land 0.0 16.0 16.0 0.0 0.2 0.2
Civil Works 28.0 73.0 101.0 30.2 69.5 100.0
Equipment and Materials 34.0 29.0 63.0 32.6 7.,8 40.4
Incremental O&M and 0.0 9.0 9.0 0.0 1.0 1.0Staffing
Design and Supervision 6.0 7.0 13.0 2.5 9.1 11.6
Civil Works Crash 0 0 0 0 0 0 0 3 0 5 0 8Program
Subtotal (1) . 68.0 134.0 202.0 65.6 88.1 153.7
2. By Subsector
Water Supply 19.0 23.0 42.0 29.0, 25.1 54.6
Drainage 11.0 27.0 38.0 7.6 16.2 23.9
Sanitation ' 3.0 11.0 14.0 6.7, 10.6 17.4
Solid Waste 7.0 18.0 25.0, 9.1:H 6.9 16.2
Roads 24.0 43.0 67.0 9.8 22.0 32.0
KIP/MIIP/Guided Land 4.0 12.0 16.0 .4 7.3 10.7Development
Subtotal (2) 68.0 134.0 202.0 65.6 88.1 153.7
V
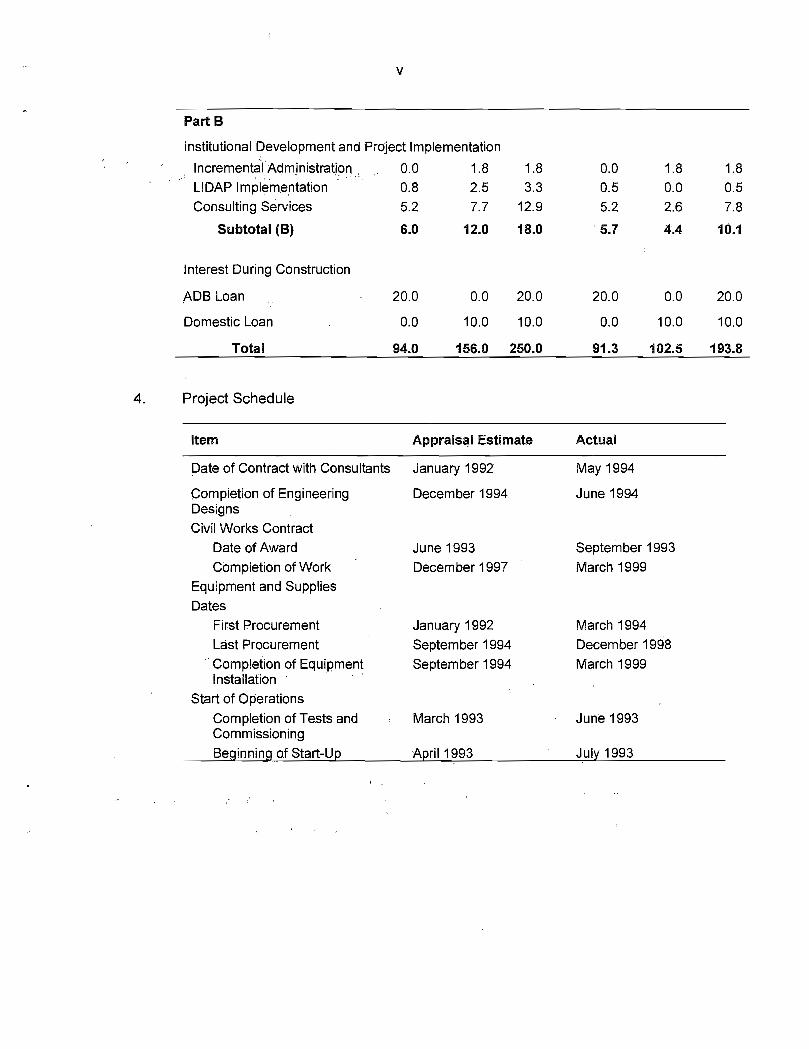
Part B
Institutional Development and Project Implementation
Incremental Administration 0 0 1 8 1 8 0 0LIDAP Implementation 0.8 2.5 3.3 0.5Consulting Services 5.2 7.7 12.9 5.2
Subtotal (B) 6.0 12.0 18.0 5.7
Interest Durina Construction
1.8 1.8
0.0 0.5
2.6 7.8
4.4 10.1
ADB Loan 20.0 0.0 20.0 20.0 0.0 20.0
Domestic Loan 0.0 10.0 10.0 0.0 10.0 10.0
Total 94.0 156.0 250.0 91.3 102.5 193.8
Project Schedule
Item Appraisai Estimate Actual
Date of Contract with Consultants January 1992 May 1994
Completion of Engineering December 1994 June 1994DesignsCivil Works Contract
Date of AWard June 1993 September 1993Completion of Work December 1997 March 1999
Equipment and SuppliesDates
First Procurement January 1992 March 1994Last Procurement September 1994 December 1998Completion of Equipment September 1994 March 1999Installation
Start of Operations
• Completionof Tests and March 1993 June 1993CommissioningBeginning of Start-Up April 1993 • • July 1993

vi
0. Data on ADB Missions
Name of MissiOn
No.of No.ofDate PersonS Person-
Specialization ofMembers1
Appraisal 24 Jul-14 Aug 1992 5 110 b, d, e, f, i
Review223 May-I Jun 1994 2 20 a, i
Review327 Sep-9 Oct 1993 2 26 a, f
Review48-13 Dec 1994 1 6 a
Midterm Review530 Jul-11 Aug 1995 3 39 a, h, i
Review61-14 Dec 1995 2 28 a, g
Review76-20 Dec 1996 3 45 a, b, g
Review816-26Jun 1997 2 22 a,i
SPAM915-19 Dec 1997 1 5 a
SLAM 1 ° 12-l4Jan 1998 5 15 a,g
SPAM 1131 Aug-I Sep 1998 3 6 a, b, g
Review1223-27 Nov 1998 2 10 a, b
Project Completion Review 6-17 Dec 1999 4 39 b, C, h, i
Total 371I
a-engineer/project officer, b-urban development specialist, c-urban economist 1 d-financial analyst, e-counsel,f-programs officer, g-project implementation officer, h-project administration supporting staff/assistant projectanalyst, i-staff consultant.
2 Undertaken in conjunction with Loan 1077-lNO: Botabek Urban Development Project.Undertaken in conjunction with Loan 1077-INO: Botabek Urban Development Project.Undertaken in conjunction with Loan 768-INO: Second Bandung Urban Development Project.Undertaken in conjunction with midterm review of Loan 1 077-INO: Botabek Urban Development Project.
6 Undertaken in conjunction with Loan 1111 -INO: Bogor and Palembang Urban Development Project.Undertaken in conjunction with Loan 1111 -INO: Bogor and Palembang Urban Development Project.
8 Special Project Administration Mission in conjunction with Loan 111 1-INO: Bogor and Palembang UrbanDevelopment Project.Special Loan Administration Mission in conjunction with Loan 1111-lNO: Bogor and Palembang UrbanDevelopment Project.
Loan Administration Mission; also joined in by the project manager, programs manager, and residentrepresentative, Indonesia Resident Mission (IRM).Special Loan Administration Mission in conjunction with Special Project Administration Mission for Loan Illi-INO:Bogor and Palembang Urban Development Project, Loan I 292-lNO: Eastern Islands Urban Development (Sector)Project, Loan 1384-INO: West Java Urban Development (Sector) Project.
12 in conjunction with Loan 1111-INO: Bogor and Palembang Urban Development Project.

INDONESIA
CENTRAL JAVA AND D.IYOGYAKARTAURBAN DEVELOPMENT PROJECT
(as completed)
705
WEST
JAVA
iICi0T0ioi.
I Subproject Location
® National Capital
Municipal Boundary
— — Provincial Boundary SOS
International Boundary
Boundaries are not necessarily authoritative.
109°Ei1O°E 130°E
INDONESIA
- 5°Th\ South cliiiia Sea Philippine Sea5°N-
/ / eJebea Sea
ç
k{_-.J PACnICOCEAIs 0
0
JAKARTA Java Seas
- -
J®ri /
lOoS0
Arefura Sea10 S
IND!AN OCEAN
110°E 130°E
tU0E
Jepara
"4KUdus 'Pati
Rembang
/ ) ! I/ Demak
/ ," - —./ 1 " I Kendal / \
/'J----7°S -
,! Tegal / Pekalongan Batang ,' , ' 1 \ Blora j/ Brebes Pemalang
emarang Grobogan / E A ST J A V A- I - - - - -
I I /' i_
'- -. .. .- )..I ___ I(--
Temanggung // / / Salatiga I IN--' \ Purbolingga I /CENTRLAVN'II ( -- Srageri
/ ' i3anjarnegara 'r'. III\ Banyumas / cç' / \
) Wonosobo Magelang Boyolali "p- 0 10 20 30 40 50-' LIIacap ••__ ,,. ..----..' .'-- __%_. I -,
"--I / I 'i 'Sj 'v' "s .. : " ' Karanganyar
Kebumen"\ Puorejo / ''Sleman! Kiaten Sukohrjo
/ / c ' / I
- C.. / II
•< ,-// KuIonprog' "'
I / YOGYA.KARTA / wonogiri •../- Bantul \-8°S
/ Gunung Kidul18
I'I
IIILWIE

I. PROJECT DESCRIPTION
1. The objectives of the Project were to (i) improve the urban environment andurban living conditions, in particular, in the low-income areas; and (ii) minimizeimpediments to economic growth by providing infrastructure in the subsectors coveredunder the Integrated Urban Infrastructure Development Program (IUIDP). The Projectalso aimed to strengthen (i) the capabilities of the provincial and local governmentsconcerned in urban management, local resource mobilization and financialmanagement, institutional assessment, and human resources and organizationaldevelopment, and (ii) their administrative capabilities in planning, project implementation,environmental management, operation and maintenance (O&M), and land management.
2. The Project helped the Government of Indonesia achieve its urban sectorobjectives and targets, and provided funds for its urban infrastructure investment plan inthe provinces of Central Java (CJ) and D.I. Yogyakarta (DIY). The Project funded 37local governments as compared with 38 envisaged at appraisal. The 37 subprojectsconsisted of 7 group A 1 (4 in CJ Urban Development Project [UDP] and 3 in DIY UDP),22 group B (all in CJ UDP), and 8 group C (6 in CJ UDP and 2 in DIY UDP) subprojects.The Project covered 64 secondary cities and 173 urban infrastructure componentsincluding water supply (27), urban roads (26), sanitation (25), Kampung ImprovementProgram/Market Infrastructure Improvement Program (KIP/MIIP) (32), solid waste (34),and drainage (29). In accordance with the principles of the IUIDP approach, the Projectaimed at combining the physical, subsectoral, and institutional linkages of the various.project components.
3. The Project consisted of two main parts:
(I) Part A - Improve urban infrastructure of the standard IUIDP subsectors:water supply, wastewater treatment and sanitation, solid wastemanagement, urban roads, urban drainage, KIP, MIIP, and landdevelopment. Provide consulting services for detailed engineering designand construction supervision.
(ii) Part B - Strengthen (a) the institutional capabilities of the central,provincial, and local governments in urban management, local resourcemobilization, and financial management; and (b) their technicaladministration capabilities in planning, environmental management, O&M,and land management.
IL EVALUATION OF IMPLEMENTATION
A. Project Components
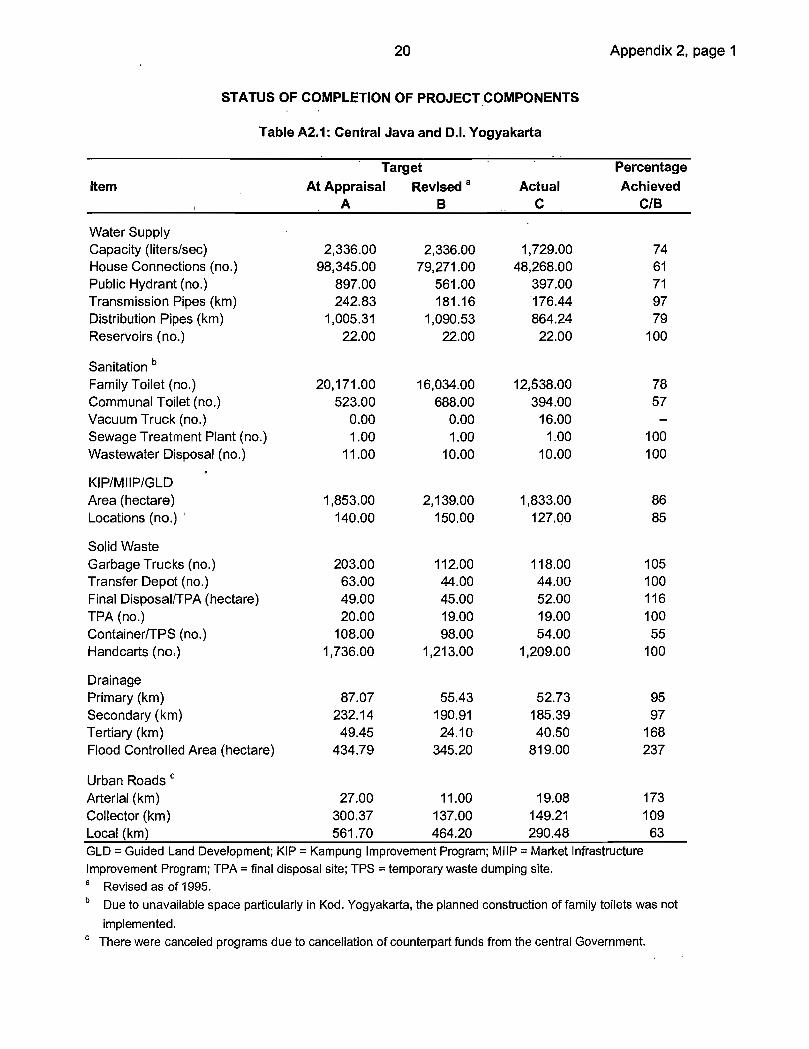
4. A chronology of the milestone events of project implementation is in Appendix 1,and an outline of the project components as appraised and actually implemented is inAppendix 2. The targets at appraisal were revised in 1995.after completion of all thesubproject appraisals for group A, B, and C subprojects.
The subprojects were divided into three groups based on a set of selection criteria established atappraisal. Group A subprojects comprised those that met all the selection criteria. GroupA subprojectswere larger in scale, ranging from Rp18,000 million ($8.8 million equivalent) to Rp67,000. million ($33million equivalent). Group B subprojects comprised those that met the selection criteria but subprojectsummaries were not prepared at appraisal. Group C comprised subprojects that had not yet met theselection criteria at appraisal. Group B and C subprojects were smaller in scale with the majority underRplO,000 million ($4.9 million equivalent). All values based on Rpl.00 = $O.00049.

2
5. The allocation of funds by province and by subsector is presented in Appendix 3.Seventy-two percent of the total infrastructure project cost was allocated to CJ, 28percent to DIY. In terms of sector distribution, water supply had the highest share (34percent) of the total project cost, while KIP/MIIP had the least funding with only 6 percentof the total cost. In terms of allocation of funds by subproject group, group A subprojects(in CJ and DIY) obtained 48.7 percent, group B subprojects (in CJ only) 42.9 percent,and group C subprojects (in CJ and DIY) 8.4 percent. The investments in CJ werespread over many small rural subprojects, whereas in DIY these were shared by a fewrelatively large subprojects in a more urban setting. Due to the large number ofsubprojects in CJ, implementation was slower than in DIY because staff in many localgovernments in CJ were unfamiliar with the procedures. Project implementation wasaffected by the economic and financial crisis from late 1997, resulting in fundingshortages in the local governments and other implementing agencies concerned.Notwithstanding these difficulties, the physical components were largely completed inaccordance with the revised targets in both CJ and DIY, as shown in Appendix 2.
1. Water Supply
6. The water supply components in CJ and DIY included the construction offacilities to supply an additional capacity of 1,730 liters per second, over 48,200 newwater connections, nearly 400 public hydrants, 22 reservoirs, and over 880 kilometers ofpipes. All these subcomponents were generally completed as designed except for theinstallation of house connections and pipelines (including tertiary distribution) inKabupaten (Kab.) Semarang (CJ group B). The problem in Perusahaan Daerah AirMinum (PDAM) Kab. Semarang was due to the overly optimistic investment plan startingwith capital investment from the central Government loan, followed by self-financedhouse connections. With limited borrowing capacity, house connection works weredelayed. As a result, over 50 percent of the water supply components in Kab. Semaranghave yet to be installed.
2. Sanitation
7. This component was mainly implemented in DIY. Over 12,500 family toilets wereconstructed, 16 sludge trucks were purchased, a sewerage treatment unit was installed,and 394 communal toilets and 10 wastewater disposal facilities were installed. Thedemand for low-cost sanitation components, particularly the communel toilets, wasoverestimated in the more urbanized areas, particularly for Kotamadya (Kod.)Yogyakarta where there were no appropriate sites available. As household incomelevels rose, the demand for individual in-house facilities replaced that for the publicfacilities provided by the Project. Sludge equipment in Kab. Klaten was underutilized,partly due to inadequate awareness of the potential beneficiaries.
3. Kampung Improvement Program, Market Infrastructure ImprovementProgram, and Guided Land Development
8. The KIP and MIIP were generally successfully implemented, despite theirdispersed locations. A combined total of 127 sites and 1,833 hectares (ha) of KIP/MIIPwere improved. The achievement was close to the estimated target (140 sites, 1,853 ha)at appraisal but lower than the revised target (150 sites, 2,139 ha). Furthermore, the KIPand MllP facilities have been adequately maintained as a result of strong communityparticipation, with minimum financial support from the local government. It was likewise

3
noted that additional improvements to the Asian Development Bank (ADB)-funded KIPand MIIP facifities were largely undertaken by the communities. Land development, e.g.,guided land development, to support low-income housing programs was one of theproject components at appraisal. Implementation of this component was incorporatedinto the KIP and MIIP subprojects.
4. Solid Waste
9. This component was mainly implemented in the more urbanized areas in group A(CJ and DIY) and group B municipalities and districts. Some 1,210 handcarts and 118garbage trucks were purchased; 44 transfer depots and 19 disposal sites (52 hectares)were developed; and 54 container units were provided. The Project supported a two-stage collection process typical, in Indonesian towns. This involved locally organizedcollections from within residential areas, temporary storage in container units or transferstations, and local government transfer to final dump sites. The approach is sound, andthe facilities provided have been fully utilized. A solid waste fee is collected frOm bothdomestic households and commercial establishments. Collection is higher in the largercities such as Kod. Yogyakarta than in less urbanized areas.
10. About 53 kilometers of primary drains, 185 kilometers of secondary drains, and40 kilometers of tertiary drains were constructed. Flood control areas cover 819hectares, more than double the revised target. The component supported part of thedrainage master plans in some cities such as Kod. Yogyakarta and Kab. Klaten. In someproject areas in small municipalities, drainage is integrated with community-based KIPand urban road components.
6. Urban Roads.
11. Nineteen kilometers of arterial roads, 149 kilometers of collector roads, and 290kilometers of local roads were built. The component met about 75 percent of the targetsin both CJ and DIY. This was partly due to the cancellation of the central Government'scounterpart funds for some of the subprojects. Road maintenance is largely shared byprovincial and local governments. Some communities are involved in maintaining localroads.
7. Community-Based Labor-Intensive Work
12. At the onset of the drastic economic and financial downturn, the Governmentquickly responded with a community-based labor-intensive work program to help themost vulnerable poor communities and maintain social stability. The program was addedto the Project in February 1998 for $1.5 million. The program was similar to the KIP, butwas based on community initiatives using labor from the beneficiary and neighboringcommunities. Details of the program were presented in several reports.2
2 Memorandum of understanding (MOU) between the Government and ADB dated 14 January 1998, back-to-office report (BTOR) dated 10 February 1998, and BTOR, by the Indonesian Resident Mission, dated 9December 1998.

4
8. Institutional Support
13. All packages under the institutional support component were essentiallycompleted in both CJ and DIY. In , DIY a similar institutional capacity-building project,funded by a bilateral assistance (Swiss Development Corporation), was implemented incoordination with ADB. This arrangement resulted in more responsive institutionalsupport to the local governments in DIY. However, in the case of CJ, due to the greaternumber of municipalities involved, some packages encountered delays, particularly thesupport for subproject preparation to local governments. There was also sloW progressin preparing institutional and financial action plans. Appendix 4 gives an overview of theactual implementation of the institutional support components compared with estimatesat appraisal. A specific coordinator was appointed by the Directorate General of HumanSettlements (DGHS) to strengthen the institutional activities and to speed upimplementation. Progress was made but local governments feel there is a need for moreintensive skills transfer and interaction with the consultants, particularly for the RevenueImprovement Action Plan (RIAP) and Local Institutional Development Action Plan(LIDAP). The financially capable local governments, mostly in the group A districts andmunicipalities, had no problem implementing institutional capacity-building resources aswell as financial management and revenue enhancement programs. In DIY province,Kod. Yogyakarta jointly implemented these measures with smaller and financiallyweaker local governments. In CJ, due to the limited resources and the larger number ofdistricts and municipalities covered, difficulties were encountered in obtaining consensusand support from local governments on the implementation of financial managementmeasures.
14. Experience and knowledge gained by project management unit (PMU) andproject implementation unit (PIU) staff from the training and institutional strengtheningprograms have in general been good; their capability to work on future urbandevelopment projects is increased. While DGHS, the Executing Agency, has compliedwith the loan covenant on submitting project benefit monitoring and evaluation (PBME)reports, regular benefit monitoring and evaluation must be continued to ensure effectiveimplementation of the LIDAP3 and RIAP.
B. Implementation Arrangements
15. DGHS of the Ministry of Public Works was the lead Executing Agency for theProject. The Central Project Management Office under DGHS provided overall projectimplementation supervision, monitoring, and coordination of subproject implementation.Policy coordination was provided by an interministerial committee, the NationalCoordination Team for Urban Development, under the national development planningboard, BAPPENAS. The Ministry of Home Affairs (MOHA) was responsible forinstitutional development support for local governments concerned and handled RIAPsand LIDAPs at the central level. The provincial governments, through their provincialPMUs, provincial project management offices (PMOs), and provincial project financeoffices (PFOs), played a key role in coordinating all local governments and assisting
For example, following the pilot projects undertaken for six subproject areas, it was realized that the localgovernments have difficulty implementing the action plans. The Ministry of Home Affairs initiated a studyto prepare strategic urban development action plans (SUDAPs) for six other subproject areas. TheSUDAPs were prepared by the local governments, local communities, and NGOs, setting out the vision aswell as preparing urban development action plans to realize the vision. The SUDAPs were found to bemore appropriate for implementation by the local governments.

5
them in both planning and implementing the subprojects. At the local level, the PMUs,PMOs, PFOs, and PlUs were established for subproject implementation. Appendix 5presents the overall organization structure for CJ and DIY-UDP project implementationat the central and local government levels. The complex implementation arrangementsresulted in substantial delays in some institutional support packages. The delays wererelated to (i) complex government procedures at the central, provincial, and local levels,and inadequate interagency coordination; (ii) insufficient numbers of skilled staff; and (iii)inadequate counterpart funds.
16. The Project's implementation arrangements were decentralized in accordancewith the !UIDP concept. The sector project format was a major contributing factor. Allproject offices were set up basically within the existing organizational structure. This wasaimed at facilitating the transition from implementation to O&M.
C. Project Costs and Financing
17. Actual project costs totaled $193.8 million equivalent 4 or 78 percent of the $250.0million projected at appraisal (Appendix 6). The actual foreign exchange and localcurrency costs were $91.3 million and $102.5 million equivalent, or 97 percent and 66percent of the estimates at appraisal. The lower local currency cost was due to thedevaluation of the Indonesia rupiah.
18. Actual ADB financing was $126 million, which is 84 percent of the loan amount of$150 million. The fluctuation of the rate of foreign exchange and inadequate counterpartfunding resulted in cancellation of $2.8 million in July 1998 as part of the portfoliorestructuring exercise to ease the Government's financial situation at the onset of the1997 financial downturn. A further $21.2 million was cancelled in December 1999.
Table 1: Financing Plan($ miUion)
Appraisal Estimate Actual Change from AppraisalForeign Local Total Foreign Local Total Foreign Local Total
Borrower- 0.0Financed
% of change
ADB- 94.0Financed
% of change
Total
100 100
56.0 150.0
0.0 67.8 67.8
91.3 34.7 126.0
0.0 (32.2) (32.2)
(32%) (32%)
(2.7) (21.3) (24.0)
(16%)
(56.2)94.0 156.0 250.0 91.3
(3%) (38%)
102.5 193.8 (2.7) (53.5)
% of change (3%) (34%) (22%)
The total project cost is subject to downward adjustment of $0.21 million, which was disbursed but is duefor reimbursement by the Borrower.

6
D. Project Schedule
19. The Project was originally scheduled to start in March 1993 and be completed bySeptember 1998, an implementation period of 66 months Actual project completion wasextended by six months to 31 March 1999. The actual project implementation scheduleas compared with the appraisal target is in Appendix 7. There was substantial delay inthe start-up of project implementation, i.e., three months for group A subprojects andnine months for groups B and C. Full-scale implementation for group A subprojectsstarted in 1995, whereas subprojects in groups B and C commenced in early 1996. Themain causes were overambitious targets at the planning stage and delays in therecruitment of the implementation advisers and finalization of the Government'sguidelines for the project implementation and borrowing procedures under the subsidiaryloan agreements. In many cases, finalizing subsidiary loan agreements (SLAs) took oneto two years. Availability of local counterpart funds also affected timely procurementaction, and consequently implementation.
E. Engagement of Consultants and Procurement of Goods and Services
20. Consulting services were provided for subproject preparation advisory services,and implementation support for the central, provincial, and local governments. Therewere delays in engaging consultants due to the time taken to determine complex workrequirements and clear internal Government procedures for the purpose. The matter is asystemic sector issue and needs to be dealt with in that light at an appropriate forum.
21. For local procurement (local competitive bidding), applicable Governmentprocedures were followed. The availability of counterpart funds often delayed thecontract awards to a varying degree, but not substantially. One case of irregularactivities involving procurement was found by the state auditor (BPKP). At their request,ADB investigated the matter and appropriate actions were taken by the Government andADB.5
F. Performance of Consultants, Contractors, and Suppliers
22. Except in isolated cases, the performance of consultants, contractors, andsuppliers was satisfactory. Consultant support was particularly important for thepreparation of the pilot LIDAPs and RIAPs. While the performance of the consultantswas found to be acceptable, there could be improvements in the transfer of knowledgefrom the consultants to the implementing agencies, through more systematic feedbackassessment to ensure that skills transfer has been successfully met. It is recommendedthat the central, provincial, and local governments keep an updated database ofconsultants, contractors, and suppliers, and an assessment of their performance onGovernment-funded projects for future reference.
G. Conditions and Covenants
23. The conditions and covenants under the Loan Agreement were generallycomplied with. However, submission of audit reports was not satisfactory, as they wereoften late and untranslated. ADB's suggestion to use private auditors was considered
The ADB Review Committee on Anticorruption conducted an independent investigation of the case. Thereport was communicated to the Government with a request to reimburse $207,741 to ADB.
7
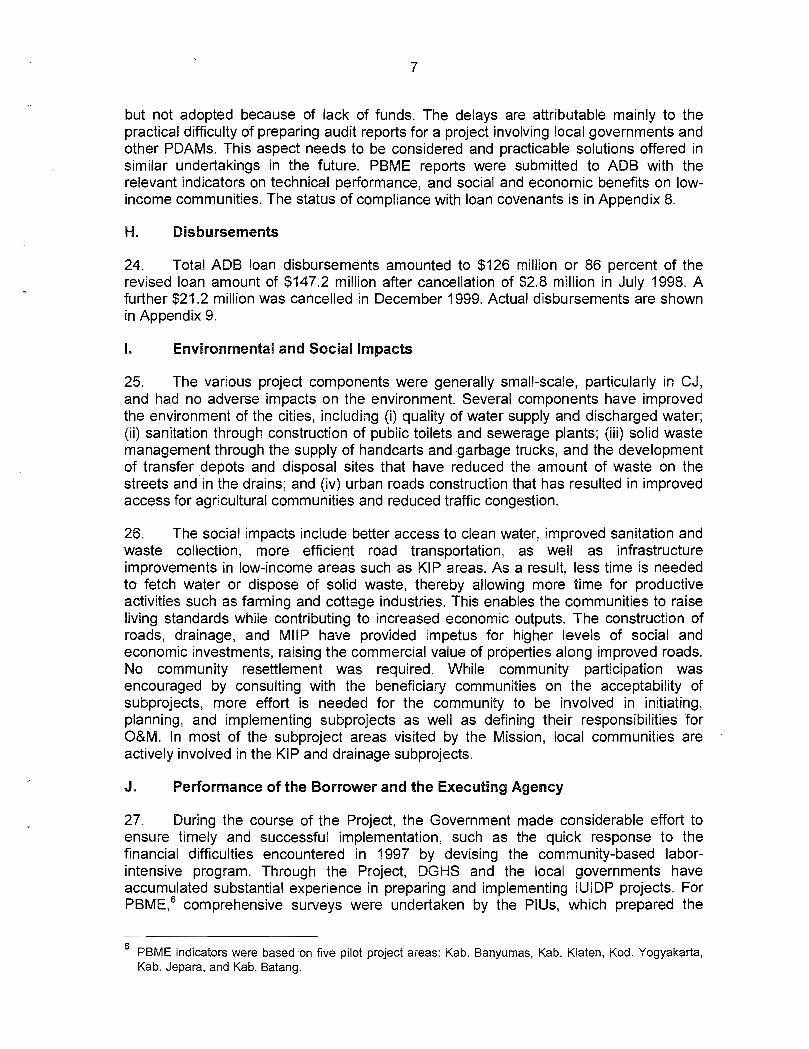
but not adopted because of lack of funds. The delays are attributable mainly to thepractical difficulty of preparing audit reports for a project involving local governments andother PDAM5. This aspect needs to be considered and practicable solutions offered insimilar undertakings in the future. PBME reports were submitted to ADB with ther&evant indicators on technical performance, and social and economic benefits on low-income communities. The status of compliance with loan covenants is in Appendix 8.
H. Disbursements
24. Total ADB loan disbursements amounted to $126 million or 66 percent of therevised loan amount of $147.2 million after cancellation of $2.8 million in July 1998. Afurther $21.2 million was cancelled in December 1999. Actual disbursements are shownin Appendix 9.
I. Environmental and Social Impacts
25. The various project components were generally small-scale, particularly in CJ,and had no adverse impacts on the environment. Several components have improvedthe environment of the cities, including (i) quality of water supply and discharged water;(ii) sanitation through construction of public toilets and sewerage plants; (iii) solid wastemanagement through the supply of handcarts and garbage trucks, and the developmentof transfer depots and disposal sites that have reduced the amount of waste on thestreets and in the drains; and (iv) urban roads construction that has resulted in improvedaccess for agricultural communities and reduced traffic congestion.
26. The social impacts include better access to clean water, improved sanitation andwaste collection, more , efficient road transportation, as well as infrastructureimprovements in low-income areas such as KIP areas. As a result, less time is neededto fetch water or dispose of solid waste, thereby allowing more time for productiveactivities such as farming and cottage industries. This enables the communities to raiseliving standards while contributing to increased economic outputs. The construction ofroads, drainage, and MIIP have provided impetus for higher levels of social andeconomic investments, raising the commercial value of properties along improved roads.No community resettlement was required. While community participation wasencouraged by consulting with the beneficiary communities on the acceptability ofsubprojects, more effort is needed for the community to be involved in initiating,planning, and implementing subprojects as well as defining their responsibilities "forO&M. In most of the subproject areas visited by the Mission, local communities areactively involved in the KIP and drainage subprojects.
J. Performance of the Borrower and the Executing Agency
27. During the course of the Project, the Government made considerable effort toensure timely and successful implementation, such as the quick response to thefinancial difficulties encountered in 1997 by devising the community-based labor-intensive program. Through the Project, DGHS and the local governments haveaccumulated substantial experience in preparing and implementing IUIDP projects. ForPBME, 6 comprehensive surveys were undertaken by the PlUs, which prepared the
6 PBME ndicators were based on five pilot project areas: Kab. Banyumas, Kab. Klaten, Kod. Yogyakarta,Kab. Jepara, and Kab. Batang.

8
relevant baseline data and monitoredwas undertaken in close coordinationdirection of DGHS, and was effectivetimely corrective actions.
K. Performance of ADB
the changes far project evaluation. This activitywith the Qentral and provincial PMUs under thein identifying project deficiencies and facilitating
28. During implementation, ADB provided a total input of 371 staff days and fielded12 review missions. Ten of the review missions were undertaken together with thereview of other projects. While the missions enabled ADB to support physical projectimplementation, more efforts could have been made on institutional development texamine development impacts. The project design was generally adequate. Theassessment of the implementation capacity of the participating agencies may have beensomewhat overoptimistic. The Indonesia Resident Mission assisted with disbursementsand Government liaison.
III. EVALUATION OF INITIAL PERFORMANCE AND BENEFITS
A. Financial Performance
29. One of the project objectives was to improve the financial capacity of localagencies. A major target was to improve the financial resource mobilization at the locallevel by increasing user charges and property taxation, and improving financialmanagement. Among sample local governments, 7 local revenues increased, in realterms, from 1.3 percent to 26 percent between FY1993 and FY1999 (Appendix 10).Contributing factors include more intensive revenue collection efforts (higher collectionefficiency), more defined revenue targets, and strict monitoring by the governments. Inall the sample local governments, local revenues ranged from 46 percent of total incomefor Kab. Klaten to 72 percent for Kod. Yogyakarta, and about 50-60 percent of totalincome for the others. 8 About 60-90 percent of total income was spent on routineexpenditures, such as improvement in services, leaving minimal surplus operatingincome for capital expenditures. The RIAP helped the local governments to focus on theneed for financial improvements, although some measures had been implemented to alimited extent due to economic difficulties encountered in the financial crisis since late1997.
30. Financial targets set for the PDAMs at appraisal included improving customercollections to about 90 percent of accounts receivables. Collection efficiency hasimproved to about 88 percent at present. Tariff increases were implemented by most ofthe PDAMs until the financial crisis in 1997 and 1998. In some cases the tariff increasewas substantial. PDAM Kod. Yogyakarta was permitted to increase the tariff by 75percent in phases; from Rp200 to Rp350 per cubic meter for households, allowing themto cover their debt service. However, the proposed tariff increase in Kab. Semarang wasnot approved in view of the pending financial restructuring. The financial performance ofsample PDAMs is in Appendix 11. Financial projections allow for tariff increases in 2000
Sample governments include Kab. Klaten, Kod. Yogyakarta and Kab. Bantul under group A, Kab.Pekalongan and Kab. Sukoharjo under group B, and Kab. Jepara under group C. PDAMS include PDAMKab. Kiaten and PDAM Kod. Yogyakarta under group A, POAM Kab. Pekalongan under group B, andPDAM Kab. Jepara under Group C.
The other sources of local government income comprised subsidies and grants from the central andprovincial governments.

9
in most PDAMs. With the current economic crisis, however, it is now unlikely that theseincreases will be implemented expeditiously. In most municipalities, it is understood thatthe increases will be implemented in phases in consultation with water users.
31 Financial reevaluation was undertaken for the revenue-generating projects,including water supply, solid waste, and sanitation components. The results werecompared with those in the subproject appraisal reports (SPARs) submitted to ADB priorto project implementation. Appendix 12 presents the methodology and summary resultsof the financial internal rate of return (FIRR) and econornicinternal rate of return (EIRR)calculations, which are based on actual field data. Generally, FIRRs for water supplywere higher than those at appraisal, due to successful implementation of water supplyprojects, particularly in increasing production capacity and expanding service coverage.Only PDAM Kab. Semarang registered an FIRR below the weighted average cost ofcapital because of the delays encountered in house connections. The higher FIRRresults in Kab. Klaten, Bantul, and Kod. Yogyakarta were due to periodic increases andsubstantial adjustments in water tariff.
32. Solid waste management components have shown better results in the sampledistricts due to a larger number of households and effective community-based feecollection systems. For sanitation, the FlRRs were generall.y above the weightedaverage cost of capital. Local communities collect sanitation fees for the district, and aportion of the fees is kept. by the communities to maintain the facilities. Managementimprovement for O&M of solid waste and sanitation infrastructure is needed to reduceexpenditure on O&M.
B. Economic Performance
33. The economic internal rates of return (EIRRs) were reevaluated for nonrevenuegenerating components (urban. roads, drainage, and KIP/MIIP). The main assumptionsand the methodology adopted for the economic reevaluation, and detailed discussion ofthe results are also shown, in Appendix 12. Urban roads projects are generally separatedfrom drainage projects in the areas visited. For drainage, SPAR estimates wererelatively higher comparedwith actual EIRRs due to optimistic target benefits, e.g., muchhigher land value being assumed. For urban roads, the project benefits were realizedand in the more urbanized areas, benefits were higher than appraised. KIP/MIIPcomponents were also economically justified as a result of a higher increase in landvalues, in view of the estimated 12 percent opportunity cost of capital in 'Indonesia
C. Attainment of Benefits
Improvement in Urban Infrastructure and Services
34. Overall, the targets were met. A total of 8.7 million people9 are estimated to havebenefited from improved access to urban services as a result of the Project. This isabout 90 percent of the appraisal target of 9.7 million. The labor-intensive work programhelped mitigate the intensified poverty situation after the financial downturn in 1997. Thebeneficiary coverage for the different subproject components are summarized for eachsector in Appendix 13.
The number of beneficiaries is the aggregate of the number of people who have benefited from eachsubsector.

10
a. Water Supply
35. The water supply components benefited some 1.26 million persons (in 31districts), about 75 percent of the target. Service coverage for domestic users rose froman average of 33 percent to 47 perOent in CJ. Service coverage for hondomestic usersincreased from an average of 75 percent to 91 percent.
36. Water supply facilities installed under the Project are well maintained. However,improvements in the operational and financial performance of the PDAMs throughprudent management with the support of RIAPs and LIDAPs is necessary. The financial,crisis has affected the performance of smaller PDAMs. Progress has been made in UFWreduction, noW averaging about 27 percent in the project area, compared to averagesfrom 35 to 60 percent nationwide. The emphasis on UFW reduction efforts needs to becontinued and a periodic leakage investigation program should be established.10
b. Sanitation
37. About 1.97 million people are benefiting from the sanitation program,representing 107 percent of the estimated target at appraisal. Overall, this componenthas resulted in a cleaner environment and healthier conditions for the project areas,particularly in the more remote rural communities where poor families cannot afford tobuild toilets in their homes. While O&M is largely the responsibility of local communities,there is room for improvement by raising public awareness of the benefits of publicsanitation facilities, and by charging modest user fees.
c. KIP, MIIP, and Guided Land Development
38. Over 677,000 persons benefited from the three components, meeting theappraised target. KIP and MIIP resulted in better access roads, drainage, and solidwaste collection in various local communities covering 25 districts. The KIP and MIIPcomponents were well implemented because of extensive community participation, andbenefited the low-income populations in the project areas.
d. Solid Waste
39. Despite difficulties in locating appropriate disposal sites, some 2.74 millionpersons, or about 81 percent of the target during appraisal, benefited from the solidwaste management subproject. The increased level of services and reduced amoUnt ofwaste on the streets have had a positive impact on public health. Communityparticipation has been successful in the O&M of solid waste facilities in mostcommunities.
10 ADB has provided further assistance in the water supply sector. TA 3137-lNO: Water Supply andSanitation Sector Project, for $600,000, approved on 22 December 1998, provides assistance tooperationalize the Government's policy and regulations governing PDAMs. The scope includes (i)identifying capacity-building requirements for local governments and PDAM5; (ii) recommending steps toreduce UFW; (iii) determining needs for maintenance and rehabilitation of existing water supply andsanitation facilities; (iv) strengthening the regulatory and legal frameworks; and (v) providing institutionalstrengthening to facilitate increased public participation, transparency, governance, financing capability,and sustainable development.
11
e. Drainage
40. This component was implemented in 32 districts and municipalities, andbenefited about 1.17 million persons, about 10 percent more than the target at appraisal.Drainage improvement included construction of new drainage linkages and upgrading ofexisting drainage systems. Routine maintenance of drainage systems is largelyundertaken by the local communities with the local government providing periodicmaintenance checks.
Urban Roads
41. About 0.9 million people or 88 percent of the appraised target benefited fromimproved urban roads. The improvements and new construction have had a positiveimpact by reducing congestion and vehicle time-savings in the urban areas, as well asimproving accessibility to the urban markets for the agricultural communities.
2. Integrated Urban Development and Management
42. The IUIDP was aimed at decentralizing urban development, enhancing the urbanfinancial resource base and financial management, and improving urban managementcapacity at the local levels, Through the provision of training as part of the institutionaldevelopment and capacity building components of the Project, progress was made in theinstitutional strengthening of local governments. However, more still needs to be done atthe local government level, in terms of planning for long-term development programsand the delivery of services. In particular, urban economic development planning at thelocal level still relies on public rather than private investment. While the RIAP and LIDAPhave been effective, a more focused approach through the Strategic UrbanDevelopment Action Plan (SUDAP) was found to be more appropriate (footnote 3). TheSUDAP is a planning approach aimed at enhancing urban management and urbanperformance by involving all stakeholders, i.e., all levels of government, professionalorganizations, nongovernment organizations (NGO5), business organizations,community groups, etc., to identify a vision for the region or municipality. Thus, specificneeds of stakeholders, deficiencies in existing public facilities and services, and localapproach in project design were identified in the pilot plans.
43. Insufficient funding and inadequate programming are still common weaknessesin some local governments. The new local autonomy policy to be implemented in 2000will transfer more responsibility and accountability to the local governments. The centralGovernment may need to provide local governments with more training andassistancéin rehabilitating and upgrading existing infrastructure, as well as improving O&M toensure sustainability of benefits. Communities must be involved to ensure thatinfrastructure projects meet actual demand and willingness to pay for services. The ADBCommunity and Local Government Support Sector Development Program loans 11 areexpected to stimulate local autonomy and fiscal decentralization.
Loan 1 677-INO: Community and Local Government Support Sector Development Program (poHcy loan),for $200 million, approved on 25 March 1999; and Loan 1678-INO: Community and Local GovernmentSupport Sector Development Program (investment project loan), for $120 million, approved on 25 March1999, focus on increasing of community participation in subprojebt formulation, planning, andimplementation, and policy initiatives to reform local government structures.

12
3. Training and Institutional Strengthening
44. While local governments have gained valuable experience in subprojectappraisal, as well as in the planning and executing of projects, efforts to enhance thecapability of local governments in preparing, evaluating, and approving subprojectsshould be continued. Institutional strengthening for DIY achieved better results due toearlier capacity building support from the Swiss Development Corporation. TheGovernment should develop a program to avoid losing trained staff to other agencies.Further efforts in this area, such as the ADB-funded loan project on capacity building,12may be utilized. It is recommended that selection Of participants for workshops andtraining should be carefully' made. Seminar and training materials should also beupgraded by incorporating lessons learned from previous training programs.
4. Participatory Development
45. The Project aimed to increase community ownership of subprojects. While therehas been active community participation in the KIP, public involvement in the O&M ofother public infrastructure and services varies. Each PIU was expected to undertake apublic information and public awareness campaign focusing on the use of projectfacilities and to encourage active community participation. The success of thesecampaigns varies and further efforts to promote community involvement are required.
5. Sustainability of Benefits
46. Institutional capacity building at the local level under the Project has improvedthe capability of local government officials in urban infrastructure development andfinancial management. The existing Government policy on decentralization of urban•infrastructure and services assumes greater mobilization of local fund resources andborrowing capacity. Due to the current economic situation and limited budget at all levelsof Government, there is a need for the local governments to improve their O&Mefficiency.
47. Although the Project has achieved its objectives to improve urban livingconditions in the project area, sustainability of project benefits has been affected by theeconomic crisis since mid-1997. Cutbacks in consumption have led to falling waterrevenues and lower tax collections for some districts and municipalities. O&M costs haveincreased due to inflation. Imported items were particularly affected by the currencydevaluation, and this has had a severe impact on PDAM operations. Declining revenuesand increasing O&M costs caused cash flow problems for some PDAMs. Constraints onlocal government expenditures are impeding future investments and the allocatioh ofsufficient funds for O&M and debt service. However, the situation is expected to improveas the economy stabilizes.
48. Under the Government's new initiatives, which focus on local autonomy anddecentralization, there will be a different environment for implementation of futureprojects and an enhanced need for capacity building at the local level. Three TAs' 3 wereapproved under the ADB loan, Community and Local Government Support Sector
12 Loan 1572-INO: Capacity Building in Urban Infrastructure Management, for $42 million, approved on 4November 1997.
13 TA 3177-lNO: Capacity Building to Support Decentralized Administrative Systems, for $500,000,approved on 25 March 1999; TA 31 78-INO: Capacity Building to Support District Level BudgetarySystems, for $460,000, approved on 25 March 1999; and TA 3179-INO: Capacity Building onParticipatory Planning, Monitoring, and Evaluation, for $540,000, approved on 25 March 1999.

13
Dev&opment Program (footnote 11). The TAs will provide capacity building at the locallevel to support implementation of the Government's initiatives. By improving thecapacity for community-based activities, the TAs are expected to strengthen thedecentralization efforts, thereby enhancing cost effectiveness and promotingsustainability of benefits.
6. Community Participation
49. Community participation was initially limited to determining the location of projectfacilities, such as public taps, family toilets, communal toilets, and temporary wastedumping sites under the subsectors of water supply, sanitation, solid waste, and KIP. Atthe construction stage, community-based labor was used in physical works. Tostrengthen community participation, an intensive public information campaign needs tobe undertaken by the local governments prior to project completion to increase people'sawareness of the O&M benefits. The communities, particulary those in less urbanizedareas, need to become more involved in initiating, planning, and implementingsubprojects. In some communities, a community organization for managing solid wastecollectively was formed to collect fees and to manage the collection and transportation of•the waste to the transfer stations. Transport of the waste from the transfer station to thefinal disposal site is undertaken by the local public works agencies. Such organizationstructure reduces the burden on the local governments in operations administration andshould be encouraged.
50. The Project benefited the poor communities within the project area, particularlysmaller municipalities, which have much lower tax revenues and thus cannot afford toprovide adequate infrastructure facilities to the poor in remote areas. The poor compriseabout 20-40 percent of the population in these municipalities.
51. In most of the project sites visited, it was noted that the poor benefited the mostfrom the upgrading of local roads and drainage canals, and the provision of family andcommunal toilets in kampungs. There has been a positive impact in terms of the poorpaying lower transport cost per km (30-40 percent lower). Prior to construction of thelocal roads under the Project, children in poor families had to walk severa' kilometers toreach school. Now they are served by public transport. Likewise, farmers used to haveto pay high rent for cargo vehicles because the roads were not paved. With theconstruction of urban roads under the Project, cargo transport vehicles now chargefarmers lower rates to bring their products to market. Statistics indicate that incomes offarmers have increased by about 20-30 percent despite the economic crisis, because ofincreased accessibility to markets.
52. The construction of sanitation facilities improved health conditions of the poorcommunities. Communal toilets were constructed in the kampungs for use by poorfamilies who cannot afford to build their own toilets. The provision of this basic servicehas improved the living conditions of the poor through better prevention of disease. Theavailability of disposal sites for domestic wastes has benefited poor families in terms of acleaner environment. Poverty is reduced where some poor families are employed towork in the landfill and disposal sites providing them with an income source. Thedrainage component has a positive impact on the poor as the reduction in flooding ofmajor agricultural areas has eliminated damage to their homes and property. Many poorfamilies have also been hired as construction laborers in these projects. The costsavings from this component are about Rp200,000 per family.

14
8. Issues and Follow-On Efforts Required
53. The financial and economic crises in Indonesia have resulted in jobs lost,declining incomes, and increasing costs in many of the project towns. Some PDAMs areencountering financial difficulties from increased O&M costs and declining revenues dueto closure of many commercial and business establishments. Furthermore, decreasinglocal government revenue collections have resulted in reduced capital expenditure, thuslimiting future investments and the allocation, of sufficient funds for O&M of urbaninfrastructure. The Government has taken action to improve the situation, includingemployment generation through labor-intensive works, accelerating the decentralizationof government establishing transparent electoral processes, institutionalizing communityparticipation, and increasing NGO involvement. Sustainability of benefits is beingfollowed up by mobilizing community participation in service delivery and maintenance ofexisting facilities. Some of the issues noted in the Project, including the need for strongercommunity participation, increased decentralization, and enhanced capacity building oflocal governments, were addressed in the ADB Sector Development Program loan(footnote 11).
54. There is a need for the provincial government in Central Java to promote the jointundertaking of urban infrastructure facilities for sanitation, solid waste and drainage forôost-effective utilization of resources, cost-efficient O&M, and delivery of services. Thesanitation and solid waste facilities in Kab. Bantul, DIY are a model of such a project. Itis jointly operated by the local governments of Kab. Bantul, Kod. Yogyakarta, and Kab.Sleman; the O&M is the responsibility of the provincial DIY government.
55. Under the local autonomy decree, which promotes decentralization of power andresponsibility to the local governments, the delivery of basic services will rely solely onthe local governments. There is a need to further enhance the institutional and financialcapabilities of the local governments, as well as involve local communities and NGOs inthe provision and maintenance of urban infrastructure facilities. Future projects shouldbe more process-oriented rather than product-oriented, and should provide guidance onmanifesting a transparent and efficient implementation process.
IV. CONCLUSIONS AND RECOMMENDATIONS
A. CoAclusions
56 Notwithstanding the adverse impact on the revenue generation subprojects as aresult of the financial crisis, the Project has largely achieved its objectives and isassessed as generally successful. Most of the project components were completedexcept for some shortfall in water supply (only 61 percent of house connectionsachieved) and sanitation (only 51 percent of communal toilets built). The financial andeconomic viability of selected subcomponents has been generally affirmed in real termsfor revenue generating and nonrevenue generating components. The FIRRs weregenerally higher than the SPAR results at appraisal as a result of expansion of theservice area and more effective collection of user fees through local communityorganizations. The EIRRs were generally lower than estimated at appraisal for urbanroads, KIP, and drainage facilities, but exceeded the opportunity cOst of capital of 12percent. The estimated EIRRs in the SPAR were based on very optimistic conditionsand high economic growth projections. Due to the financial crisis, which resulted indownscaling of some high-impact sector projects, a more moderate level of benefit was
15
obtained. Project facilities are in operation and have for the most part been maintainedby local governments and communities. The financial crisis is likely to have an impact ontheir sustainability. Proposed major water supply tariff increases scheduled for 1999 and2000 have been postponed or revised to a phased program for the majority of thePDAMs, and there is a potential decrease in tax collection by the local governments.Nevertheless, more focus on optimizing existing investments should have a positiveeffect on the maintenance of project facilities. With the newly elected government andthe undertaking of the Reformation Program, Indonesia is expected to return to a morestable economic situation where benefits of the Project will be sustained.
57. As a sector loan, the Project has achieved its objectives to improve the variousurban subsectors under the IUIDP. Importantly, progress was made in strengthening theinstitutional capacities of the provincial and local governments. Government officialsacquired skills and experience in financial management, organization development,project planning and implementation, O&M, and community participation. While there isstill room for further improvement, these skills have prepared local governments to takeon. more responsibilities for urban infrastructure development and management underthe Government's new local autonomy law and decentralization policy.
58. Local communities have benefited from the physical components in upgradingtheir living standards and quality of life. At least 90 percent of the target populationidentified at appraisal . benefited from better urban infrastructure services. Localgovernments have also improved their institutional capacity for planning andimplementing small-scale projects. . Financial management at the local level has alsoimproved as a result of training under the Projedt. As the new Government isdecentralizing greater autonomy and financial responsibilities to local governments, theProject has provided , local officials with strengthened skills in project planning,implementation, and monitoring. In light of the greater emphasis on accountability,autonomy, and effective and efficient service provision at the local government levels,capacity building may still be needed, particularly in the financially weaker districts.
59. Project implementation provides some important lessons (Appendix 14):
(I) Decentralization of responsibility and ownership. Althbugh localcommunities have been involved in initiating planning, and implementingsubprojects under the IUIDP, there needs to be better coordination andsupervision by all levels of Government during implementation. Theinvolvement of beneficiary communities in developing projects will fosterproject ownership, thus ensuring adequate O&M.
(ii) Institutional strengthening at the local level for an IUIDP. Demandanalysis and user surveys for willingness and ability to pay should bedone thoroughly and accurately by the local governments at the outset offuture IUIDPs. Identification of appropriate sites for sanitation facilitiesand consultation with beneficiaries concerned should be undertaken.
(iii) Maintenance of project facilities. Projects should continue to provide astructural approach to identify responsibility for the maintenance of projectfacilities shared by two or more local governments. There should beregular reviews by ADB to ensure proper implementation. Capacity
16
building for O&M at the local levels should be included in the overallproject design.
(iv) Local borrowing capacity. Shortages of central and loôal governmentcounterpart funds can adversely impact on smooth projectimplementation. Mobilization of local sources of funds is critical to theimplementation of new Government policies on deôentralization of urbandevelopment and services and on lOcal autonomy. Future projects shouldcontinue to strengthen the revenue-generating capabilities of localgovernments.
(v) Implementation arrangements. Timely and accountable projectimplementation requires clear delineation of the responsibilities of eachparticipating agency. Technical assistance should have been provided notonly for the planning of the LIDAP but also its implementation.
C. Recommendations
1. Project Related
60. The Government and DGHS should consider the following:
(i) Strengthen linkages with future and related development plans bydecentralizing project planning and design by the local governments.Provide training and institutional strengthening at the local level,particularly in preparing and implementing the LIDAP and RIAP. Thetraining should focus more on specific needs and take into considerationdifferences in absorption capacity for implementing structural andinstitutional changes.
(ii) Improve the financial performance of local governments and weakPDAMs by improving financial management and enhancing userawareness of the need for timely tariff increases to improve revenue tocover O&M expenses and debt service. Recruit professional financialmanager for PDAMs. Mobilize community groups to maintain small-scaleproject facilities.
(iii) Improve auditing procedures of financial statements and their submissionto comply with the loan covenants. Closely coordinate the submission ofthe audited financial statements by the various agencies.
(iv) Provide or develop more effective and extensive public information,education, and communication programs to increase the community'sawareness of the project facilities and their usage, as well as theimportance of O&M of the facilities. Such programs should be designed atthe local level.
2. General
61. The Project has enabled new directions for policy dialogue in the following areas:
(i) Decentralization and Devolution of Authority. In support of theGovernment's new fiscal decentralization law (Law No. 25/1999), whichdecentralizes more power and financial responsibility to the local
17
governments, future projects should (a) emphasize improving the abilityof local governments to deliver sustainable municipal services, ratherthan only on building new infrastructure; (b) balance the provision ofphysical infrastructure with complementary activities to promote economicdevelopment, employment creation, and income generation; (c) promotejoint undertaking of sector projects by two or more local governments tomaximize the use of government financial resources; and (d) design tobetter fit the organizational structure of local and provincial governmentsto ensure efficient implementation and effective mOnitoring and evaluationof project benefits. ADB has provided continued assistance in support ofthe Government's thrust to decentralize urban development activities inaccordance with the newly enacted laws on regional autonomy and fiscaldecentralization.14
(ii) Full Cost Recovery and Loca' Revenue Improvement. Greaterattention should be given to O&M budget provision given the recenteconomic situation. O&M programs should clearly define the maintenanceresponsibilities of local governments and the communities. To encouragelocal governments to make adequate provision for maintenance, it maybe necessary to include this item in the local government expenditurebudget.
(iii) Urban Poverty Reduction. To ensure that benefits' reach areas. of urbanpoverty at the local level, future projects should focus on specific areaswithin cities. Local governments would be responsible for identifyingpriority areas of urban deprivation and for developing urban renewalstrategies for comprehensive improvement and development. A balanceof formal private sector and community-based initiatives with governmentfacilitation would be more cost effective and affordable. The localgovernments should initiate the identification of areas suitable for urbanupgrading, then undertake the work with NGOs, community groups,landowners, and other private entities tO ensure that physical andeconomic benefits of development can be directed to the targeted poorcommunities.
(iv) FoHow-On Project The. country's political and economic situation isexpected to improve over the next few years. There is an opportunity for afollow-on loan project with similar project components in CJ and DIY, but::with better coordination by public agencies, NGOs, the private sector, andlocal communities. The project could provide assistance with theimplementation of the decentralization and local autonomy policies withemphasis on (i) supporting community participation to ensure a demand-driven approach; (ii) increasing public-private partnerships in basicservices; (iii) improving O&M efficiency of existing and new facilities; (iv)improving access of the poor to urban services; and (iv) enhancing thecapacity of local governments in administrative and revenue functions,fiscal planning, and budgetary procedures.
14 TA 3326-INO: Urban SectorDevelopmentin a Decentralized Environment, for $600,000 million, approvedon 8 December 1999. The objective of the TA is to promote more efficient and effective urbandevelopment and management in Indonesia, and to enhance the awareness of local governments of themeasures necessary to meet the requirements of decentralization.

APPENDIXES
25
4,13
27
5,15
30
5,17
31
6,19
32
7,23
36
7,24
37
8,29
44
8,30
18
Number Title Page Cited on(page, para.)
I Chronology of Milestone Events 19 1, 4
2 Status of Completion of Project Components 20 1 4
3 Allocation of Infrastructure Project Investments by Province 23 2, 5and Subsector
4 Summary of Consulting Services and Training
5 Organization Structure of Project Implementation
6 Project Cost At Appraisal and Actual
7 Project Implementation Schedule
8 Status of Compliance with Loan Covenants
9 Actual Loan Disbursements
10 Financial Performance of Sample Local Governments
11 Financial Statements of Sample Water Supply Enterprises(PDAMs)
12 Economic and Financial Analyses
13 Project Benefits and Impacts
14 Lessons Learned and Actions Taken or To Be Taken
49 9, 31
55 9,34
57 15,59

19
Appendix 1
CHRONOLOGY OF MILESTONE EVENTS
1992 November - Loan approval
1993 February - Loan signing (10 February 1993)1993 March - Loan effectiveness (24 March 1993)1992 July - Actual start of implementation
(advance action)
1993 September - First disbursement
1998 July - Reallocation of loan proceeds1998 July - Cancellation of loan savings
1998 September - Original date of physical completion
1998 September - Original date of loan closing1999 March - First extension of loan closing date1999 March - Physical completion
- Final disbursement
- Cancellation of $21.2 million from ordinarycapital resources
- Closing of loan account1
1999 December - Project completion review by the AsianDevelopment Bank
1 The loan account is kept open pending settlement by the Borrower of $0.21 million related to disbursements.
20,171.00523.00
0.001.00
11.00
1,853.00140.00
16,034.00688.00
0.001.00
10.00
2,139.00150.00
12,538.00394.00
16.001.00
10.00
1,833.00127.00
8685
7857
100100
203.0063.0049.0020.00
108.001,736.00
112.0044.0045.0019.0098.00
1,213.00
118.0044.0052.0019.0054.00
1,209.00
10510011610055
100
87.07
55.43
52.73
95
232.14
190.91
185.39
97
49.45
24.10
40.50
168
434.79
345.20
819.00
237
20
Appendix 2, page 1
STATUS OF COMPLETION OF PROJECT COMPONENTS
Table A2.1: Central Java and Di. Yogyakarta
Target Percentage
Item At Appraisal Revised a Actual AchievedA B C C/B
Water SupplyCapacity (Uters/sec)
2,336.00
2,336.00
1,729.00
74House Connections (no.)
98,345.00
79,271.00
48,268.00
61Public Hydrant (no.)
897.00
561.00
397.00
71Transmission Pipes (km)
242.83
181.16
17644
97Distribution Pipes (km)
1,005.31
1,090.53
864.24
79Reservoirs (no.)
22.00
22.00
22.00
100
Sanitation b
Family Toilet (no.)Communal Toilet (no.)Vacuum Truck (no.)Sewage Treatment Plant (no.)Wastewater Disposal (no.)
KIP/MIIP/GLDArea (hectare)Locations (no.)
Solid WasteGarbage Trucks (no.)Transfer Depot (no.)Final DisposallTPA (hectare)TPA (no.)Container/TPS (no.)Handcarts (no)
DrainagePrimary (km)Secondary (krn)Tertiary (km)Flood Controlled Area (hectare)
Urban Roads C
Arterial (km) 27.00 11.00 19.08 173Collector (km) 300.37 137.00 149.21 109Local (km) 561.70 464.20 290.48 63GLD = Guided Land Development; KIP = Kampung Improvement Program; MIIP = Market InfrastructureImprovement Program; TPA = final disposal site; TPS = temporary waste dumping site.a Revised as of 1995.b Due to unavailable space particularly in Kod. Yogyakarta, the planned construction of family toilets was not
implemented.C There were canceled programs due to cancellation of counterpart funds from the central Government.

21 Appendix 2, page 2
Tábe A2.2: Central Java
Target PercentageItem At Appraisal Revised a Actual Achieved
A B C C/B
Water SupplyCapacity (liters/sec) 1,751.00 1,751.00 1,144.00 65House Connections (no.) 98,345.00 75,439.00 43,479.00 58Public Hydrant (no.) 897.00 377.00 239.00 63Transmission Pipes (km) 242.83 176.24 171,52 97Distribution Pipes (km) 1,005.31 909.99 713.14 78Reservoirs (no.) 22.00 20.00 19.00 95
SanitationFamilyToilet(no.) . 7,771.00 4,514.00 4,514.00 100Communal Toilet (no.) 521.00 686.00 394.00. 57Vacuum Truck (no.) 0.00 ' 0.00 10.00 -Sewage Treatment'Plant (no.) 0,00 0.00 ' 0.00 -Wastewater Disposal (no.) ' 11.00 10.00 10.00 100
KIP/MUP/GLDArea (hectare) '1,155.00 ' ' 1,313,00 1,165.00 89Locations (no.) " 102.00 ' 112.00 94.00 . 84
Solid WasteGarbage Trucks (no.) 181.00 91.00 90.00 99Transfer Depot (no.) , 59.00 40.00 41.00 , 103Final DisposalITPA (hectare) , 38.00 . 34.00 '35.60 105TPA(no.) ". 18.00 ' 17.00. 17.00 , . 100,Container/TPS (no.) ' 26.00 . 16.00 5.00 31Handcarts (no.) "1,199.00 676.00 696.00 103
DrainagePrimary (km) , ' 72.00 44.76 35.12 78Secondary (km) , 191.00 147.40 123.43 84Tertiary (km) 34.00 , 16.75 , 15.99 95Flood Controlled Area (hectare) 418.00 327.00 ' 819.00 " 250
Urban Roads b
Arterial (km) ' " , " 27.00 ' 11.00 10.85 99Collector (km) ' ". 264.00 , 137.00 137.49 ' 100Local (km) . 389.00... '' ' . 289.00 ,289.00 100GLD = Guided Land Development; KIP = KampuAg Improvement Program; MIIP = Market InfrastructureImprovement Program; IPA = final disposal site; TPS = temporary waste dumping site.a Revised as of 1995.b There were canceled programs due to cancellation of counterpart funds from the central Government.

12,400.002.000.001.000.00
11,520.002.000.001.000.00
8,024.00 70
0.00 0
6.00 -
1.00 100
0.00 -
13375
1451006096
28.003.00
16.002.00
49.00513.00
21.004.00
11.002.00
82.00537.00
22.004.00
11.002.00
82.00537.00
15.07
10.67
17.61
165
41.14
43.51
61.96
142
15.45
7.35
24.51
333
16.79
18.20
0.09
0
22
Appendix 2, page 3
Table A2.3: 0.1. Yogyakarta
Target PercentageItem At Appraisal Revised a Actual Achieved
A B C C/B
Water SupplyCapacity (liters/sec) 585.00 585.00 585.00 100House Connections (no) 3 832 00 3,832 00 4,789 00 125Public Hydrant (no.) 184.00 184.00 158.00 86Transmission Pipes (km) 4.50 4.92 4.92 100Distribution Pipes (km) 180.04 180.54 171.10 95Reservoirs (no.) 2.00 2.00 3.00 150
Sanitation b
Family Toilet (no.)Communal Toilet (no.)Vacuum Truck (no.)Sewage Treatment Plant (no.)Wastewater Disposal (no.)
KIP/MIIP/GLDArea (hectare)
698.00
826.00
668.00
81Locations (no.)
38.00
38.00
5.00
13
Solid WasteGarbage Trucks (no.)Transfer Depot (no.)Final Disposal/TPA (hectare)TPA (no.)Container/TPS (no.)Handcarts (no.)
DrainagePrimary (km)Secondary (km)Tertiary (km)Flood Controlled Area (hectare)
Urban Roads C
Arterial (km) 0.00 0.00 8.23 -Collector(km) 36.37 0.00 11.72 -Local (km) 172.70 175.20 1.48GLD = Guided Land Development; KIP = Kampung Improvement Program; MIIP Market InfrastructureImprovement Program TPA = final disposal site TPS = temporary waste dumping sitea Revised as of 1995.b Due to unavailable space particularly in Kod. Yogyakarta, the planned construction of family toilets was not
implemented.There were canceled programs due to cancellation of counterpart funds from the central Government.

11,076
5,477
0
1,631
3,832
0
136
40,478
39,137
0
1,204
0
0
136
4,061
857
0
1,700
311
757
435
4,902
0
926
1,186
1,555
1,098
136
21,732
5,472
1,398
3,280
7,987
3,068
527
9,713
9,645
0
0
0
0
68
8,932
6,325
0
1,126
751
526
204
6,972
3,574
58
788
1,532
952
68
11,489
5,893
100
1,932
2,478
790
296
7,536
562
0
1,067
4,815
814
279
15,915
1,266
764
3,753
6,329
3,650
152
4,810
0
640
1401
0
2,702
68
4,116
0
388
665
2,178
817
68
9,599
5,217
373
1,215
1,245
1,412
136
5,525
2,356
389
363
1,806
611
0
3,979
0
404
637
1,962
908
68
9,482
3,805
122
710
3,397
1,092
355
3,598
0
812
854
0
292
1,640
3,265
880
0
834
0
1,130
420
4,334
0
141
792
1,536
1,247
619
1,089
1,021
0
0
0
0
68
4,419
2,525
1,131
763
0
0
0
197,022
94,013
7,646
25,900
41,715
21.868
5,880
1,770
0
0
663
0
0
642
10,210
5,827
465
1,047
1,840
1,093
0
2,675
2,675
404
0
0
0
0
7,330
4,990
0
753
904
605
0
3,896
0
78
861
1,149
993
893
2,482
0
0
626
629
393
587
28,363
13,492
947
3,950
4,522
3,084
2,122
23 Appendix 3, page 1
llI
1. Of the total infrastructure project cost of Rp459.1 billion, Central Java obtained Rp330.9billion, or 72 percent of the' total infrastructure cost, while Di. Yogyakarta's share is Rpl 28.1billion, or 28 percent of total infrastructure project cost. The D.l. Yogyakarta project areacomprises five local governments, while Central Java has 35 local governments. Table A3presents the various project amounts by local government.
2. In terms of sectoral distribution of infrastructure projects, water supply has the largestshare of 34 percent of the total cost; urban roads, 24 percent; drainage, 15 percent; solid waste,12 percent; sanitation, 9 percent; and Kampung Improvement Program/Market InfrastructureImprovement Program (KIP/MIIP), 6 .percent. Table A3 presents the various projects bysubsector.
Table A3. Project Cost of Infrastructure for Central Java and Di. Yogyakarta(Rp million)
Local Government Total Project Water Sanitation Solid Urban Drainage KIP/MIIPCost Supply Waste Roads
CENTRAL JAVAGroup A (4)Kab. Klaten 18,306 3,509 213 1,068 8,316 3,000 2,200Kab. Banyumas 34,534 16,277 942 2,691 7,755 4,769 2,100Kab. Cilacap 31,575 10,789 1,590 2,773 5,589 8,670 2,164Kod. Pekalongan 21,146 5,881 737 3,787 6,203 3,184 1,354
Subtotal (Group A) 105,561 36,456 3,482 10,319 27,863 19,623 7,818
Group B (22)Kab. KendalKab. SemarangKab. BrebesKab. TegalKab. PemalangKab. WonogiriKab. Boyo!aliKab. SukoharjoKab. BatangKab. PekalonganKod. TegalKab. KudusKab. GroboganKab. PatiKab. BloraKab. KaranganyarKab. TemanggungKab. WonosoboKab. KebumenKab. PurworejoKab. BanjarnegaraKod. Magelang
Subtotal (Group B)
Group C (6)Kod. SalatigaKab. JeparaKab. DemakKab. RembangKab. MagelangKab. Purbalingga
Subtotal (Group C)
Total (CJ) 330,945 143,961 12,074 40,169 74,100 44,575 15,820
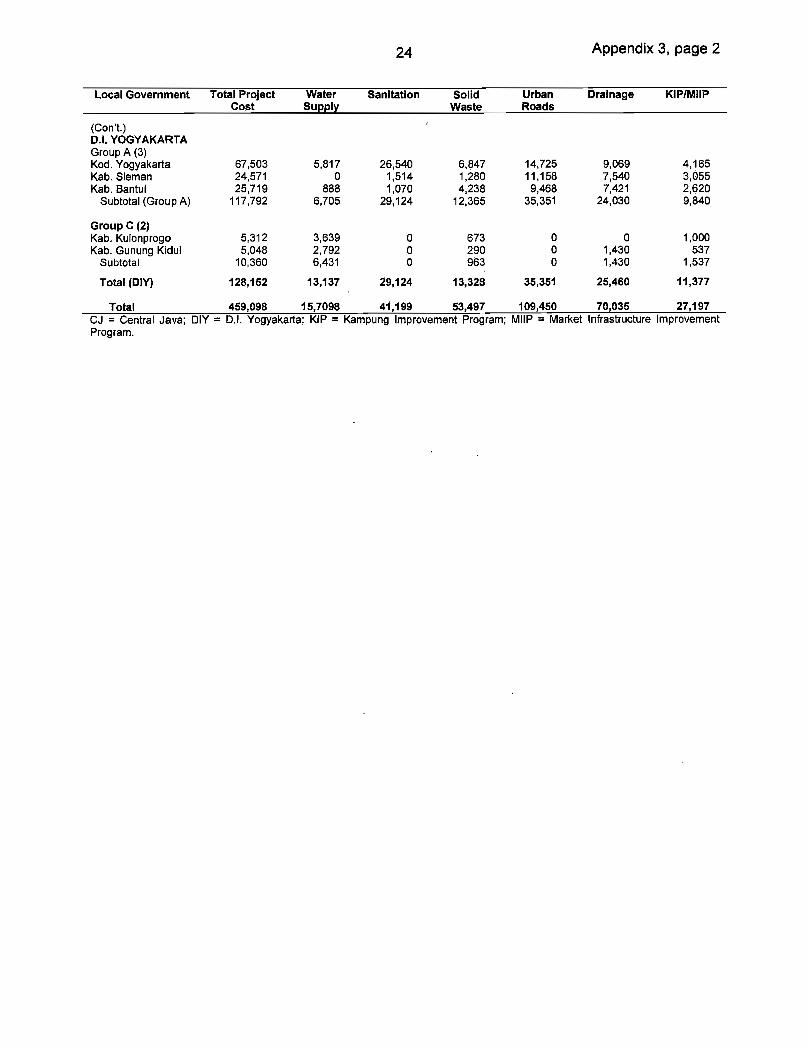
24 Appendix 3, page 2
Local Government Total Project Water Sanitation Solid Urban Drainage KIP/MIIPCost Supply Waste Roads
(Cont.)D.l. YOGYAKARTAGroup A (3)Kod. Yogyakarta 67503 5,817 26,540 6,847 14,725 9,069 4,165Kab. Sleman 24,571 0 1,514 1,280 11,158 7,540 3,055Kab. Bantul 25,719 888 1,070 4,238 9,468 7,421 2620
Subtotal (Group A) 117,792 6,705 29,124 12365 35351 24,030 9840
Group C (2)Kab. Kulonprogo 5,312 3,639 0 673 0 0 1,000Kab. Gunung Kidul 5,048 2,792 0 290 0 1,430 537
Subtotal 10,360 6,431 0 963 0 1,430 1,537
Total (DIY) 128 152 13137 29,124 13328 35351 25460 11 377
Total 459,098 15,7098 41,199 53,497 109,450 70,035 27,197CJ = Central Java; DIY = Dl, Yogyakarta; KIP = Kampung Improvement Program; MIIP = Market Infrastructure ImprovementProgram.
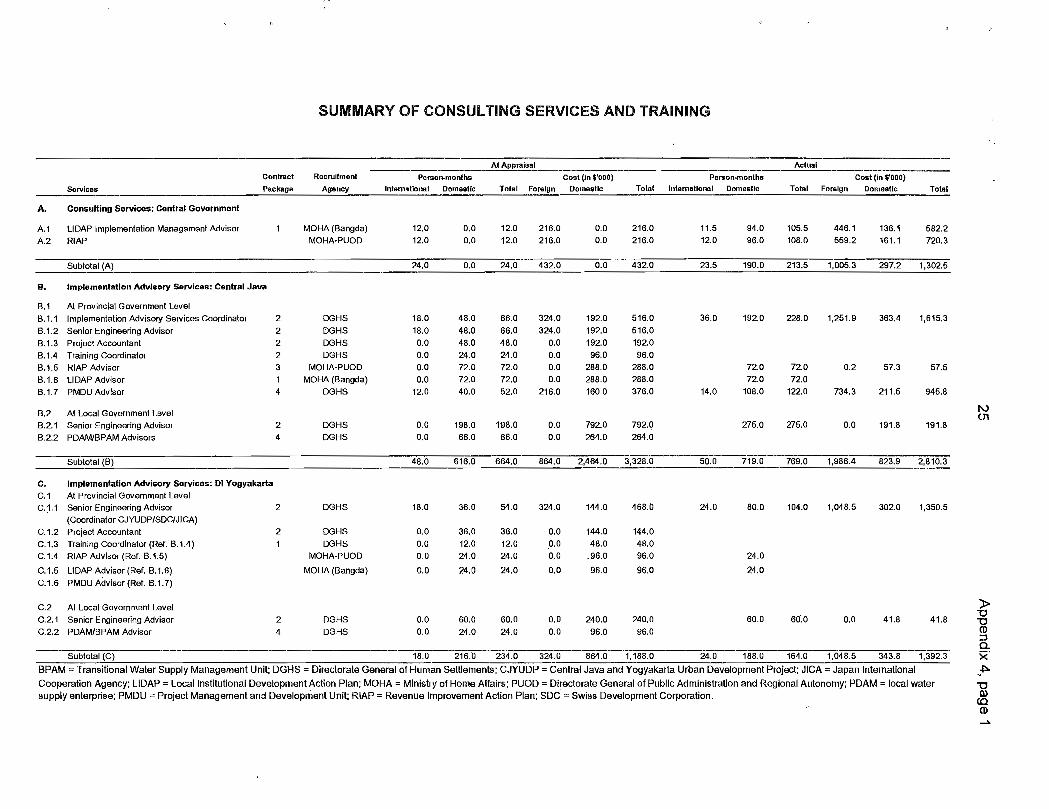
ti r1z&.iZ€I.] iUJI I.[eI1 4'A I. ill I II [c
At Appraisal Actual
Contract Recruitment Person-months Coat (in $000) Parson-months Cost (in $000)
Services Package Agency International Domestic Total Foreign Domestic Total International. Domestic Total Foreign Domestic Total
A. Consulting Services: Central Government
A.1 LIDAP Implementation Management Advisor I MOHA(Bangda) 12.0 0.0 12.0 216.0 0.0 216.0 11.5 94.0 105.5 446.1 136.1 582.2
A.2 RIAP MOHA-PUOD 12.0 0.0 12.0 216.0 0.0 216.0 12.0 96.0 108.0 559.2 161.1 720.3
Subtotal (A) 24.0 0.0 24.0 432.0 0.0 432.0 23.5 190.0 213.5 1,005.3 297.2 1,302.5
B. Implementation Advisory Services: Central Java
B.1 At Provincial Government Level6.1.1 Implementation Advisory Services Coordinator 2 DGHS 18.0 48.0 66.0 324.0 192.0 516.0 36.0 192.0 228.0 1,251.9 363.4 1,615.3
6.1.2 Senior Engineering Advisor 2 DGHS 18.0 48.0 66.0 324.0 192.0 516,0
B.1.3 Project Accountant 2 DGHS 0.0 48.0 48.0 0.0 192.0 192.0
B.1.4 Training Coordinator 2 DGHS 0.0 24.0 24.0 0.0 96.0 96.0
6.1.5 RIAP Advisor 3 MOl-IA-PUOD 0.0 72.0 72.0 0.0 288.0 288.0 72.0 72.0 0.2 57.3 57.5
6.1.6 LIDAPAdvisor 1 MOHA(Bangda) 0.0 72.0 72.0 0.0 288.0 288.0 72.0 72.0
B.1.7 PMDU Advisor 4 DGHS 12.0 40.0 52.0 216,0 160.0 376,0 14.0 108.0 122.0 734,3 211,5 945.8
B,2 Al Local Government LevelB.2.1 Senior Engineering Advisor 2 DGHS 0.0 198.0 198.0 0.0 792.0 792.0 275,0 275.0 0.0 191.8 191.8
B.2.2 PDAM/BPAM Advisors 4 DGHS 0,0 66.0 66.0 0.0 264.0 264.0
otaI (B) 48.0 616.0 664.0 864.0 2,46328.0 50.0 719.0 769.0 1, 986.4 8239 28103
C. Implementation Advisory Services: DI YogyakartaC.1 At Provincial Government LevelC.1.1 Senior Engineering Advisor 2 DGHS 18.0 36.0 54.0 324,0 144.0 468.0 24.0 80.0 104.0 1,048.5 302.0 1,350.5
(Coordinator CJYUDP/SDC/JICA)C.1.2 Project Accountant 2 DGHS 0.0 36.0 36.0 0.0 144.0 144.0
C.1.3 Training Coordinator (Ref. 6.1.4) 1 DGF-IS 0.0 12.0 12.0 0.0 48.0 48.0
C,j,4 RlAPAdvisor(Ref. B.1.5) MOHA-PUOD 0.0 24.0 24.0 0.0 .96.0 96.0 24.0
C.1.5 LIDAPAdvisor(Ref. B.1.6) MOHA(Bangda) 0.0 24.0 24.0 0.0 96.0 96.0 24.0
C.1.6 PMDU Advisor (Ref. B.1.7)
C.2 At Local Government LevelC,2,1 SeniorEngineeringAdvisor 2 DGHS 0.0 60.0 60.0 0.0 240.0 240,0 60.0 60.0 0.0 41.8 41.8
C.2.2 PDAM/BPAM Advisor 4 DGHS 0.0 24.0 24.0 0.0 96.0 96.0
________________________________________________ ______________________________________ 0Subtolal (C) 18.0 216,0 234,0 324.0 864.0 1,188.0 24.0 188.0 164.0 1,048.5 343.8 1,392.3 5
BPAM = Transitional Water Supply Management Unit; DGHS = Directorate General of Human Settlements; CJYUDP = Central Java and Yogyakarta Urban Development Project; JICA = Japan International
Cooperation Agency; LIDAP = Local Institutional Development Action Plan; MOHA = Ministry of Home Affairs; PUOD = Directorate General of Public Administration and Regional Autonomy; PDAM = local watersupply enterprise; PMDU = Project Management and Development Unit; RIAP = Revenue Improvement Action Plan; SDC = Swiss Development Corporation.
CD

At Appraisal ActualContract Recruitment Person-months Cost (in $000) Person-months Cost (in $'OOO)
SERVICES Package Agency International Domestic Total Foreign Domestic Total International Domestic Total Foreign Local Total
0. PJMISS PreparationAdvisory Team 5 DGHS 60.0 420.0 480.0 1080.0 1680.0 2760.0 60.0 420.0 480.0 1,626.1 763.1 2,389.2
Subtotal (D) 60.0 420.0 480.0 1080.0 1,680.0 2,760.0 60.0 420.0 480.0 1,626.1 763.1 2389.2
E. Urban Management Strengthening - StudiesE.1 Urban Management PlanningE.1.1 Strategic Urban Development and Action Planning MOHA (Bangda) 12.0 84.0 96.0 216.0 336.0 552.0 120 130.0 142.0 561.5 158.8 720.3
in Selected TK II Bappeda
E.2 Urban Environmental Aspects ManagementE.2.1 Environmental Management Systems DGHS 12.0 130.0 142.0 216.0 520.0 736.0 12.0 104,0 116.0 737.2 137.1 874.3
Strengthening and Strategy Developmentin Selected Topics
E.3 Urban Management O&ME.3.1. O&M Management Systems Strengthening DGHS 18.0 75.0 93.0 324.0 300.0 624.0E.3.2 Implementation of POMMS MOHA-PUOD 12.0 72.0 84.0 216.0 255.0 504.0 12.0 72.0 84.0 503.5 145.0 648.5
E.4 Urban Development Management DGHS 24.0 108.0 132.0 432.0 432,0 864.0 24.0 108.0 132.0 874.1 251.7 1,125.8 0)
Subtotal (E) 78.0 469.0 547.0 1,404.0 1,876.0 3,280.0 60.0 414.0 474.0 2,676.3 692.6 3,368.9
Total for Institutional Developmentand Project Implementation (A-E) 228.0 1,721.0 1,949.0 4,104.0 6,884.0 10,988.0 217.5 1,931.0 2,100.5 8,342.6 2,920.6 11,263.2
F. Training and Other Incidental costs DGHS W/ 1MG 1,000.0 1,000.0 2,000.0 0.0 290,0 290.0 1,983.7 580.3 2,564.0
Overall Total - 228.0 1,721.0 1,949.0 5,104.0 7,884.0 12,988.0 217.5 2,221.0 2,390.5 10,326.3 3,500.9 13,827.2DGHS = Directorate General of Human Settlements; MOHA = Ministry of Home Affairs; O&M = operation and maintenance; POMMS = performance-oriented O&M management system; TK II = level II local government.
-D-DCD
0><
(aCD

27Appendix 5, page 1
Ministerof BAPPENAS EMinisterofMinisterofPublic Works Finance Home Affairs
DGHS Deputy II DJBUMN DJ PuodDGHD....... . ................. L DJBangda
I.
CPMOCPFO
Kawil PUJateng
Governor
Provincial
I
IAP SekldaBappeda
L..ton TeamTK
L_.Ji ConsultantI dv is PPMI.I IPPMO/Prov
forTK U
PIMPRONAT
PIMPROTK
WalkotalBupati
KOHTK.I
Sekwilda L!, Bappeda Dias pu anTKII TKII 1PDAMTKI
Walkota/ .1Bupati
[ KOI-jTKI
.1 .Dias PU and :=:. Bappeda SekwildaPDAMTKIL TK II
Same asfor Di.Yogyakarta
1eam
HPPMU
H PPMU = _to PM4
wH PIMPROTKI
csuIantPPMU PMO - PFO
/LocGov.
IL
I P11.1PIMPRO
TKII.ControlConsultantReport
= = = = Consultant SupportCoordination
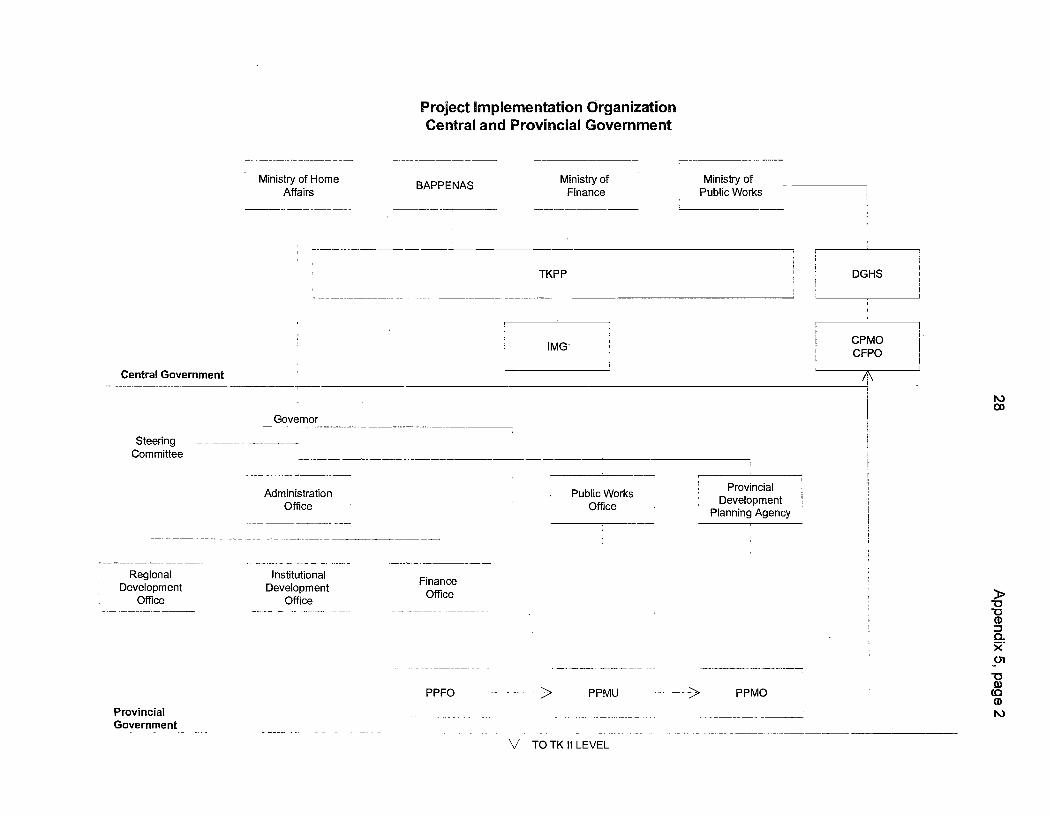
Ministry of HomeBAPPENAS
AffairsMinistry of
Finance
TKPP
1MG
Ministryof _____________Public Works
DGHS
CPMOCFPO
ProvincialDevelopment
Planning Agency
Public WorksOffice
p')
0CD
0x
CoCDN.)
Project Implementation OrganizationCentra' and Provincial Government
Central Government
Govrnor
Steeng -Committee ______
AdministrationOffice
Regional InstitutionalFinance
Development DevelopmentOfficeOffice Office
PPFO PPMU -- ----> PPMO
Provincial ______Government
V TOTKIILEVEL

SteeringCommittee
Head of Head ofPMO PMU
ProgramAsst RIAP Asst LIDAP General Technical Financial General
and Investment
Head ofPFO r')
CO
Administrative I Operations
Technical
TechnicalStaff
Staff
Urban RoadIncrease Central Provincial Grant from
Fund from Project ManagerWater Supply Government Government Central
Central SubloariCapacity Fund Fund Government
Government
-DCD
0x01
Ca
CD
()
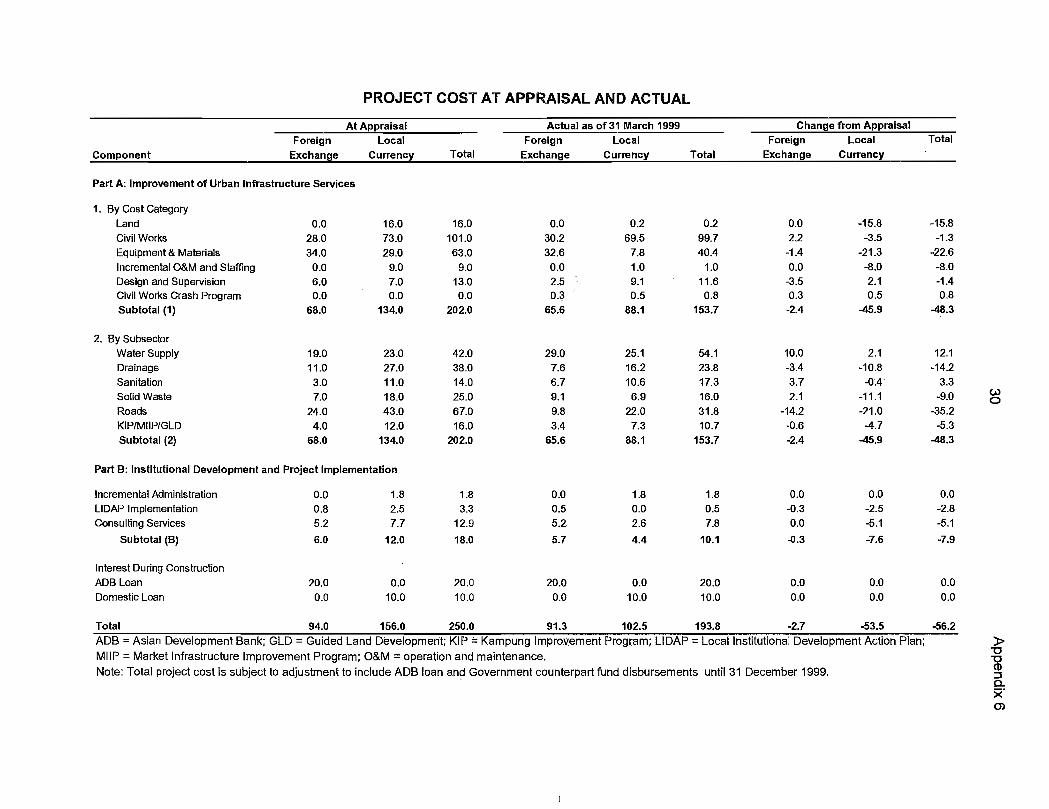
c)0
54.123.817.316.031.810.7
153.7
29.07.66.79.19.83.4
65.6
12.1-14.2
3.3-9.0
-35.2-5.3
-48.3
2.1-10.8
-11.1-21.0-4.7
-45.9
10.0-3.43.72.1
-14.2-0.6-2.4
25.116.210.66.9
22.07.3
88.1
2. By SubsectorWater SupplyDrainageSanitationSolid WasteRoadsKIP/MIIP/GLDSubtotal (2)
19.0 23.0 42.0
11.0 27.0 38.0
3.0 11.0 14.0
7.0 18.0 25.0
24.0 43.0 67.0
4.0 12.0 16.0
68.0 134.0 202.0
0.0 1.80.5 0.05.2- 2.6
5.7 4.4
20.0 0.00.0 10.0
1.8 0.0
0.5 -0.3
7.8 0.0
10.1 -0.3
20.0 0.0
10.0 0.0
0.0 0.0
-2.5 -2.8
-5.1 -5.1
-7.6 -7.9
0.0 0.0
0.0 0.0
PROJECT COST AT APPRAISAL AND ACTUAL
At Appraisal Actual as of 31 March 1999 Change from Appraisal
Foreign Local Foreign Local Foreign Local Total
Component Exchange Currency Total Exchange Currency Total Exchange Currency
Part A: Improvement of Urban Infrastructure Services
1. By Cost CategoryLand 0.0 16.0 16.0 0.0 0.2 0.2 0.0 -15.8 -15.8Civil Works 28.0 73.0 101.0 30.2 69.5 99.7 2.2 -3.5 -1.3Equipment & Materials 34.0 29.0 63.0 32.6 7.8 40.4 -1.4 -21.3 -22.6Incremental O&M and Staffing 0.0 9.0 9.0 0.0 1.0 1.0 0.0 -8.0 -8.0Design and Supervision 6.0 7.0 13.0 2.5 9.1 11.6 -3.5 2.1 -1.4Civil Works Crash Program 0.0 0.0 0.0 0.3 0.5 0.8 0.3 0.5 0.8Subtotal (1) 68.0 134.0 202.0 65.6 88.1 153.7 -2.4 -45.9 -48.3
Part B: Institutional Development and Project Implementation
Incremental Administration 0.0 1.8
1.8LIDAP Implementation 0.8 2.5
3.3
Consulting Services 5.2 7.7
12.9
Subtotal (B) 6.0 12.0
18.0
Interest During ConstructionADB Loan 20.0 0.0 20.0Domestic Loan 0.0 10.0 10.0
Total 94.0 156.0 250.0 91.3 102.5 193.8 -2.7 -53.5 -56.2ADB Asian Development Bank; GLD = Guided Land Development; KIP = Kampung Improvement Program; LIDAP = Local Institutional Development Action Plan;MIIP = Market Infrastructure Improvement Program; O&M = operation and maintenance. -oNote: Total project cost is subject to adjustment to include ADB loan and Government counterpart fund disbursements until 31 December 1999.
CD
x0)

PROJECT IMPLEMENTATION SCHEDULEAt Appraisal and Actual (By Activity)
1992 1993 1994 1995 1996 1997 1998 1999Coriponent I II III IV I II III IV I II III IV II III IV I II III IV II III Il I U III IVPart A
(a) Subproject Investment Program
- Preconstruction Activities
- S
- Construction/Implementation fGroup A
Others
Part B
(I) Subproject Formulation
- Consultant Recruitment
- Subproject Preparation I'AJ
Feasibility Design... .
(ii) Other Project Implementation and
Urban Management Support
- Support to DGHS.
- Support to MOHAC-
- Support to Urban Roads Dir. -.- J.,, .L. L J
- Support to Province and Level II
-IUlDPTraining-:- . _,,J.
- - _L -
-BME
- Environmental Monitoring
I ij. J I I LJI I I I I I I I I I I JBME = benetit monitoring evaluation; DGHS = Directorate Gen7f Hum ettIements; IUIDP = Integrated Urban Infrastructure Development Program; MOHA = Ministry of Home Affairs. ,,,,$
/
()-
CD
a-x—1
- Appraisal Schedule Approval Effectivity Original closing Revised closing- Actual Implementation Nov-92 Mar-93 . date Sep-98 date Mar-99
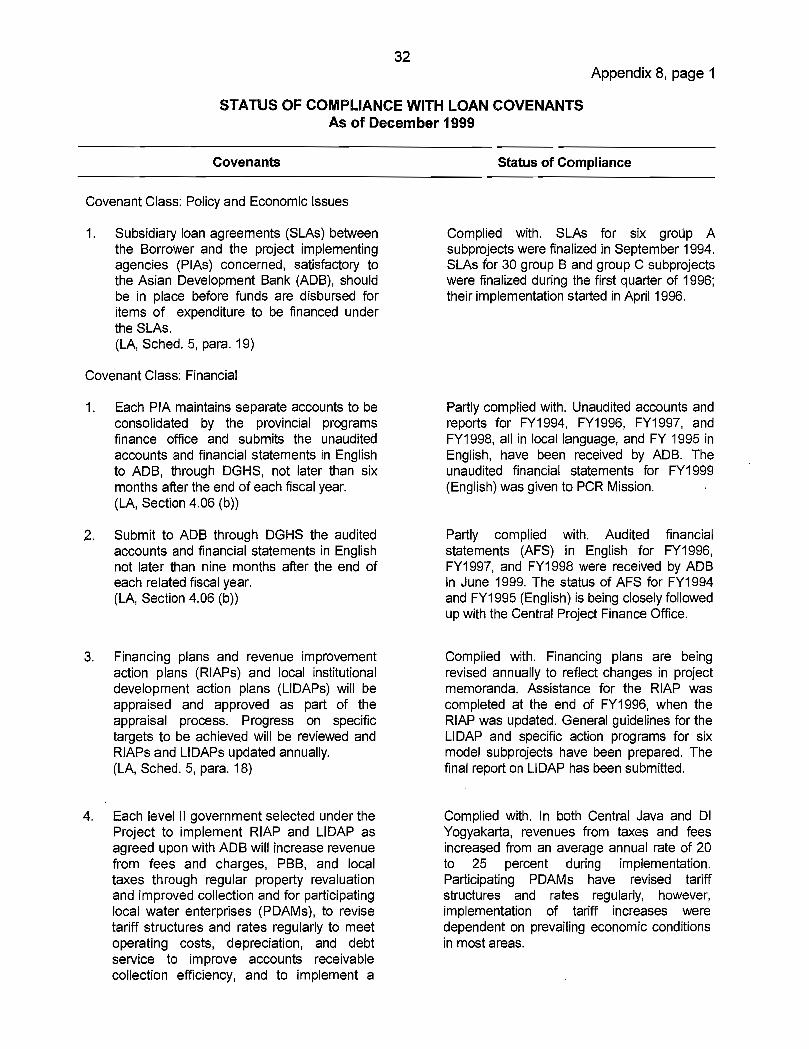
32Appendix 8, page 1
STATUS OF COMPUANCE WITH LOAN COVENANTSAs of December 1999
Covenants
Covenant Class: Policy and Economic Issues
Subsidiary loan agreements (SLAs) betweenthe Borrower and the project implementingagencies (PIAs) concerned, satisfactory tothe Asian Development Bank (ADB), shouldbe in place before funds are disbursed foritems of expenditure to be financed underthe SLAs.(LA, Sched. 5, para. 19)
Covenant Class: Financial
Each PIA maintains separate accounts to beconsolidated by the provincial programsfinance office and submits the unauditedaccounts and financial statements in Englishto ADB, through DGHS, not later than sixmonths after the end of each fiscal year.(LA, Section 4.06 (b))
2. Submit to ADB through DGHS the auditedaccounts and financial statements in Englishnot later than nine months after the end ofeach related fiscal year.(LA, Section 4.06 (b))
3. Financing plans and revenue improvementaction plans (RIAPs) and local institutionaldevelopment action plans (LIDAP5) will beappraised and approved as part of theappraisal process. Progress on specifictargets to be achieved will be reviewed and,RIAP5 and LIDAPs updated annually.(LA, Sched. 5, para. 18)
Status of Compliance
Complied with. SLAs for six group Asubprojects were finalized in September 1994.SLAs for 30 group B and group C subprojectswere finalized during the first quarter of 1996;their implementation started in April 1996.
Partly complied with. Unaudited accounts andreports for FY1994, FY1996, FY1997, andFYI 998, all in local language, and FY 1995 inEnglish, have been received by ADB. Theunaudited financial statements for FYI 999(English) was given to PCR Mission.
Partly complied with. Audited financial'statements (AFS) in English for FY1996,FYI997, and FY1998 were received by ADBin June 1999. The status of AFS for FYi 994and FYI 995 (English) is being closely followedup with the Central Project Finance Office.
Complied with. Financing plans are beingrevised annually to reflect changes in projectmemoranda. Assistance for the RIAP wascompleted at the end of FYI996, when theRIAP was updated. General guidelines for theLIDAP and specific action programs for 'sixmodel subprojects have been prepared. The'final report on LIDAP has been submitted.
Complied with. In both Central Java and DlYogyakarta, revenues from taxes and feesincreased from an average annual rate of 20to 25 percent during implementation.Participating PDAMs have revised tariffstructures and rates regularly, however,implementation of tariff increases weredependent on prevailing economic conditionsin most areas.
4. Each level II government selected under theProject to implement RIAP and LIDAP asagreed upon with ADB will increase revenuefrom fees and charges, PBB, and localtaxes through regular property revaluationand improved collection and for participatinglocal water enterprises (PDAMs), to revisetariff structures and rates regularly to meetoperating costs, depreciation, and debtservice to improve accounts receivablecollection efficiency, and to implement a
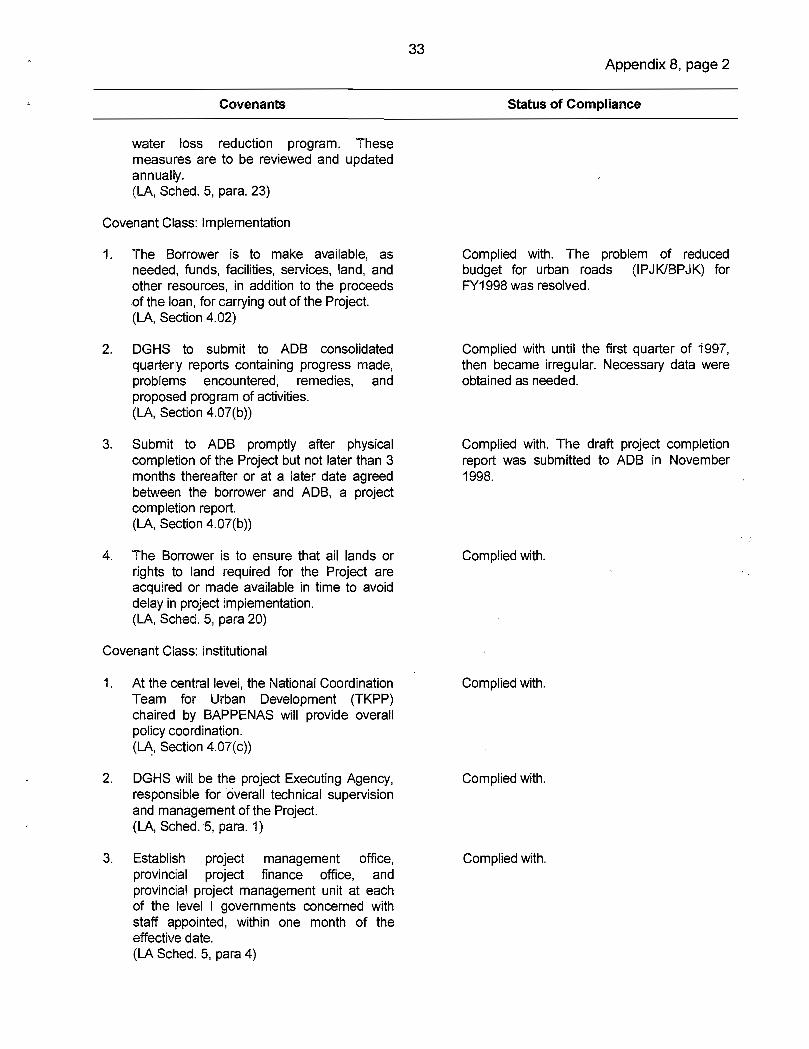
Complied with.
33Appendix 8, page 2
Covenants Status of Compliance
water loss reduction program. Thesemeasures are to be reviewed and updatedannually.(LA, Sched. 5, para. 23)
Covenant Class: Implementation
I The Borrower is to make available, asneeded, funds, facilities, services, land, andother resources, in addition to the proceedsof the loan, for carrying out of the Project.(LA, Section 4.02)
2. DGHS to submit to ADB consolidatedquarterly reports containing progress made,problems encountered, remedies, andproposed program of activities.(LA, Section 4.07(b))
3. Submit to ADB promptly after physicalcompletion of the Project but not later than 3months thereafter or at a later date agreedbetween the borrower and ADB, a projectcompletion report.(LA, Section 4.07(b))
4. The Borrower is to ensure that all lands orrights to land required for the Project areacquired or made available in time to avoiddelay in project implementation.(LA, Sched. 5, para 20)
Covenant Class: Institutional
Complied with. The problem of reducedbudget for urban roads (IPJK/BPJK) forFYi 998 was resolved.
Complied with until the first quarter of 1997,then became irregular. Necessary data wereobtained as needed.
Complied with. The draft project completionreport was submitted to ADB in November1998.
Complied with.
1. At the central level, the National CoordinationTeam for Urban Development (TKPP)chaired by BAPPENAS will provide overallpolicy coordination.(LA, Section 4.07(c))
2. DGHS will be the project Executing Agency,responsible for overall technical supervisionand management of the Project.(LA, Sched. 5, para. 1)
3. Establish project management office,provincial project finance office, andprovincial project management unit at eachof the level I governments concerned withstaff appointed, within one month of theeffective date.(LA Sched. 5, para 4)
Complied with.
Complied with.

34Appendix 8, page 3
Covenants
4. Establish project finance offices (FF0) andproject management units (PMU) at each ofthe level II governments concerned with staffappointed, within one month of approval oftheir respective subproject appraisal reports(SPAR).(LA, Sched. 5, para 5(a))
5. The Borrower will ensure that projectdirectors are appointed to PPMUs andproject managers to PMUs.(LA, Sched. 5, para. 6)
6. The Borrower will submit to ADB for itsapproval, within one year of the effectivedate, a training program and makearrangements for the trainees to serve theProject for a reasonable period of time afterreturn from training.(LA, Sched. 5, para. 20)
Covenant Class: Operational
Make arrangement satisfactory to ADB forinsurance of the project facilities consistentwith sound practice.(LA, Section 4.05 (a)
2. Insure, or cause to be insured, the goods tobe imported for the Project and to befinanced out of the proceeds of the loanagainst hazards incident to acquisition,transportation, and delivery thereto to placeof use.(LA, Section 4.05 (b))
3. Borrower to ensure 0&M of project facilitiesin which level II agencies are responsible.PDAMs and BPAMs are responsible for O&Mof water supply and the level II governmentsconcerned through dinas will be responsiblefor O&M of sanitation, drainage, solid wastemanagement, urban roads, and MIIPfacilities.(LA, Sched. 5, para. 21)
Status of Compliance
Complied with.
Complied with.
Complied with. All training programs werecompleted.
Complied with.
Complied with.
Complied with. Performance-oriented O&Mmanagement system (POMMS) helpedenhance O&M capabilities of localgovernments. Assistance for POMMS wascompleted in March 1996. As part of thisassistance, a performance system has beenprepared for Kab. Kiaten, which was used asa model by other local governments. Also inDl Yogyakarta, public-private partnership wasactively sought to ensure adequate 0&Mwithout financially burdening localgovernments. The target for public/privateratio was 30/70.

35Appendix 8, page 4
Status of ComplianceCovenants
4. The PMU is to develop and implement acoordinated public information and educationcampaign, focusing on the proper use of thefacilities and on encouraging activeparticipation of community-basedorganizations and informal groups.(LA, Sched. 5, para. 22)
A special, comprehensive review will beundertaken at the end of the first year of theeffective date. Many start-up activitiesincluding the preparation of additionalsubproject digests and action for the RIAPand LIDAP need to be completed by the endof the first year of the effective date. Amidterm review of all aspects of the Projectwill be carried out by the Borrower and ADB,at the end of the second year of the effectivedate. Results of the midterm review includingan evaluation of the progress made inrelation to the targets set and consultationwith women and community groups will bediscussed by the Borrower and ADB.(LA, Sched. 5, para. 25)
6. The Borrower will ensure comprehensivebenefit monitoring and evaluation (BME)activities are carried out, under thesupervision and guidance, of DGHS, toensure that the project facilities are managedefficiently and project benefits aremaximized.(LA, Sched. 5, para. 26)
Covenant Class: Operational
Annual reports on BME will be furnished toADB through DGHS throughout projectimplementation, continuing one year beyondsubmission of the project completion report.(LA, Sched. 5, para. 27)
Complied with. Provincial and localgovernments have been launching publiceducation campaigns on a regular basis topromote community awareness of theseaspects before the need arises.
Complied with. The midterm review wasundertaken in July-August 1995.
Complied with. In Central Java, the BMEprogram developed by DGHS was modified byeach local government. Basic BME indicatorshave been selected by these localgovernments and basic data sets collected. InYogyakarta, the BME program was finalized atthe end of March 1996, and all localgovernments concerned have completed BMEfor the project purposes (monitoring iscontinuing as regular activities).
Complied with. ADB received first the BMEreport for Central Java (FY1995). The draftfinal BME report was submitted to ADB inNovember 1998. Findings of the project BMEwere essentially positive.

ACTUAL LOAN DISBURSEMENTSAs of 31 December 1999
($ miflion)
Approval Date: 22 November 1992
Effective Date: 24 March 1993
Closing Date: 31 March 1999
Undisbursed Unutilized
Original. Cancellation Revised Actual Contract Balance! %
Category Component, Allocation 16-Jul-98 Allocation Contracts Disbursement Balance For Cancellation Utilized
A B C (B-C) (A-C) - (CIA)
01 Civil Works 54.540 (1.600) 52.940 54.472 53.170 1.302 (0.230) 100%
O1A Equipment and Materials 12.000 0.000 12.000 30.734 29.919 0,815 (17.919) 249%
OIB Equipment and Materials 35.560 (2.800) 32.760 2.502 2.494 0.008 30.266 8%
O1C Consulting Services 10.643 0.000 10.643 8.957 8.886 0.071 1.757 83%
OlD Consulting Services 17.257 0.000 17.257 10.986 10.675 0.311 6.582 62%
OlE Civil Works Crash Program 0 000 1 600 1 600 0 847 0 842 0 005 0 758 53%
Total Before IDC and IA 130.000 (2.800) 127.200 108.498 105.986 2.512 21 .214 83%
03 Interest during Construction 20.000 0.000 20.000 0.000 20.000 (20.000) 0000 100%
Grand Total 150.000 (2.800) 147.200 108.498 125.986 (17.488) 21.214 86%IA = imprest account IDC interest dunng construction
CD
x(0
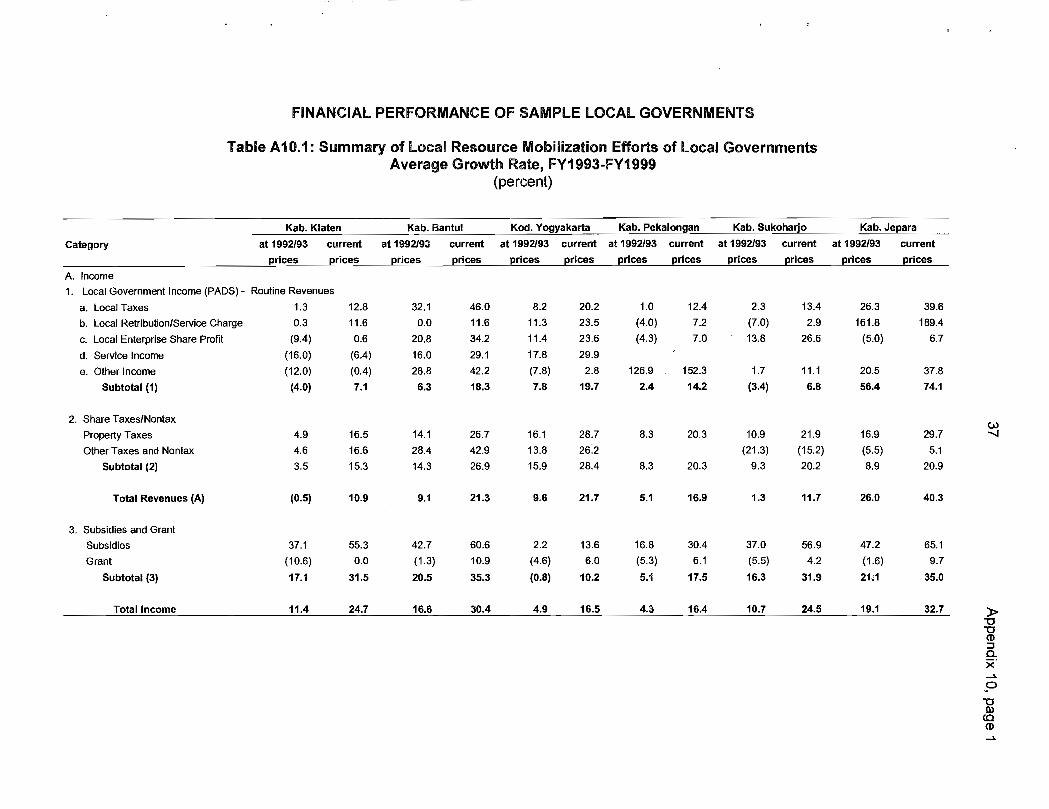
FINANCIAL PERFORMANCE OF SAMPLE LOCAL GOVERNMENTS
Table AIO.I: Summary of Local Resource Mobmzation Efforts of Local GovernmentsAverage Growth Rate, FYI 993-FYI 999
(percent)
Kab. Klaten Kab. Bantul Kod. Yogyakarta Kab. Pekalongan Kab. Sukoharjo Kab. Jepara
Category at 1992193 current at 1992/93 current at 1992(93 current at 1992/93 current at 1992/93 current at 1992/93 current
prices prices prices prices prices prices prices prices prices prices prices prices
A. Income1. Local Government Income (PADS) - Routine Revenues
a. Local Taxes 1.3 12.8 32.1 46.0 8.2 20.2 1.0 12.4 2.3 13.4 26.3 39.6
b. Local Retribution/Service Charge 0.3 11.6 0.0 11.6 11.3 23.5 (4.0) 7.2 (7.0) 2.9 161.8 189.4
c. Local Enterprise Share Profit (9.4) 0.6 20.8 34.2 11.4 23.6 (4.3) 7.0 13.8 26.6 (5.0) 6.7
d. Service Income (16.0) (6.4) 16.0 29.1 17.8 29.9
e. Other Income (12.0) (0.4) 28.8 42.2 (7.8) 2.8 126.9 152.3 1.7 11.1 20.5 37.8
Subtotal (1) (4.0) 7.1 6.3 18.3 7.8 19.7 2.4 14.2 (3.4) 6.8 56.4 74.1
2. Share Taxes/Nontax c)Property Taxes 4.9 16.5 14.1 26.7 16.1 28.7 8.3 20.3 10.9 21.9 16.9 29.7
OtherTaxes and Nontax 4.6 16.6 28.4 42.9 13.8 26:2 (21.3) (15.2) (5.5) 5.1
Subtotal (2) 3.5 15.3 14.3 26.9 15.9 28.4 8.3 20.3 9.3 20.2 8.9 20.9
Total Revenues (A) (0.5) 10.9 9.1 21.3- 9.6 21.7 5.1 16.9 1.3 11.7 26.0 40.3
3. Subsidies and Grant
Subsidies 37.1 55.3 42.7 60.6 2.2 13.6 16.8 30.4 37.0 56.9 47.2 65.1
Grant (10.6) 0.0 (1.3) 10.9 (4.6) 6.0 (5.3) 6.1 (5.5) 4.2 (1.6) 9.7
Subtotal (3) 17.1 31.5 20.5 35.3 (0.8) 10.2 5.1 17.5 16.3 31.9 211 35.0
Total Income 11.4 24.7 16.6 30.4 4.9 16.5 4.3 16.4 10.7 24.5 19.1 32.7
1,CD
a-x
C
0)
CD
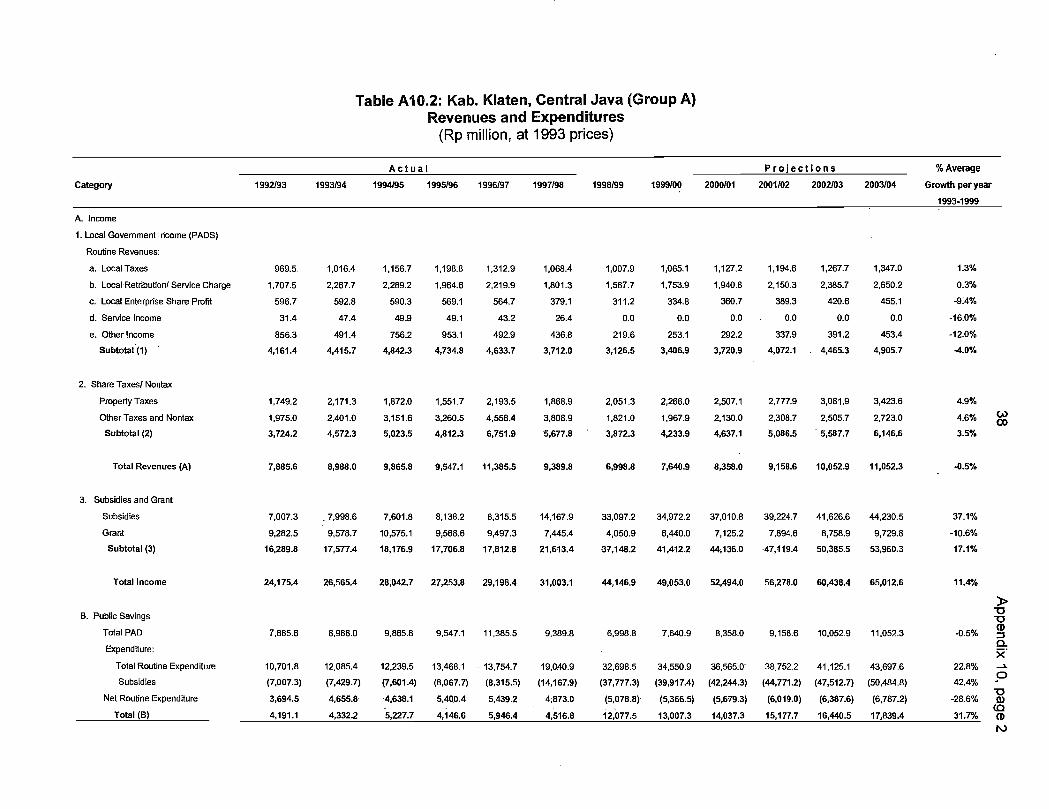
2,051.3 2,266.0 2,507.1
1,821.0 1,967.9 2,130.0
3,872.3 4,233.9 4,637.1
6,998.8 7,640.9 8,358.0
2,777.9 3,081.9 3,423.6
2,308.7 2,505.7 2,723.0
5,086.5 - 5,587.7 6,146.6
9,158.6 10,052.9 11,052.3
4.9%
4.6%
3.5%
- -0.5%
7,007.3
7,998.6
9,282.5
9,578.7
16,289.8
17,577.4
24,175.4
26,565.4
37.1%
-10.6%
17.1%
11.4%
Table A1O.2: Kab. Klaten, Central Java (Group A)Revenues and Expenditures
(Rp million, at 1993 prices)
Actual Projections %Average
Category 1992/93 1993/94 1994/95 1995/96 1996/97 1997/98 1998/99 1999/00 2000/01 2001/02 2002/03 2003/04 Growth per year
1993-1999
A. Income
1. Local Government Income (PADS)
Routine Revenues: -
a. LocalTaxes 969.& 1016.4 1,156.7 1,198.6 1,312.9 1,068.4 1,007.9 1,065.1 1,127.2 1,194.6 1,267.7 1,347.0 1.3%
b. Local-Retribution! Service Charge 1,707.5 2,267.7 2,289.2 1,964.6 2,219.9 1,801.3 1,587.7 1,753.9 1,940.8 2,150.3 2385.7 2,650.2 0.3%
c. Local Enterprise Share Profit 596.7 592.8 590.3 569.1 564.7 379.1 311.2 334.8 360.7 389.3 420.6 455.1
d.Servicelncome 31.4 47.4 49.9 49.1 43.2 26.4 0.0 0.0. 0.0 -- 0.0 0.0 0.0 -16.0%
e. Other Income 856.3 491.4 756.2 953.1 492.9 436.8 219.6 253.1 292.2 337.9 391.2 453.4 -12.0%
Subtotal (1) 4,161.4 4,415.7 4,842.3 4,734.8 4,633.7 3,712.0 3,126.5 3,406.9 3,720.9 4,072.1 4,465.3 4,905.7 -4.0%
2. Share Taxes! Noñtax
Property Taxes 1,749.2 2,171.3 1,872.0 1,551.7 2,193.5 1,868.9
OtherTaxes and Nontax 1,975.0 2,401.0 3,151.6 3,260.5 4,558.4 3,808.9
Subtotal (2) 3,724.2 4,572.3 5,023.5 4,812.3 6,751.9 5,677.8
Total Revenues (A) 7,885.6 8,988.0 9,865.8 - 9,547.1 11,385.5 9,389.8
3. Subsidies and Grant
Subsidies
Grant
Subtotal (3)
Total Income
7,601.8 8,138.2 8,315.5
10,575.1 9,568.6 9,497.3
18,176.9 17,706.8 17,812.8
28,042.7 27,253.8 29,198.4
14,167.9 33,097.2 34,972.2 37,010.8 39,224.7 41,626.6 44,230.5
7,445.4 4,050.9 6,440.0 7,125.2 7,894.6 8,758.9 9,729.8
21,613.4 -37,148.2 41,412.2 44,136.0 -47,119.4 50,385.5 53,960.3
31,003.1 44,146.9 49,053.0 52,494.0 56,278.0 60,438.4 65,012.6
B. Public Savings
Total PAD 7,885.6 8,988.0 9,865.8 9,547.1 11,3855 9369.8 6,998.8 7,64119 8,358.0 9158.6 10,052.9 11,052.3 -0.5%
Expenditure: -
Total Routine Expenditure 10,701.8 12085.4- 12,239.5 13,468.1 - 13,754.7 19,040.9 32698.5 34,550.9 36,565.11 38,7522 - 41,125.1 43,697.6 22.8% -
Subsidies (7,007.3) (7,429.7) (7,601.4) (8,067.7) (8,315.5) (14,167.9) (37,777.3) (39,917.4) (42,244.3) (44,771.2) (47,512.7) (50,484.8) 42.4%
Net Routine Expenditure 3,694.5 - 4,655.8- -4,638.1 5,400.4 - 5439.2 4;873.0 (5,078.8)- (5,366.5) - (5,679.3) (6,019.0) (6,387.6) (6,787.2) -28.6%
Total (B) 4,191.1 4,332.2 5,227.7 4,146.6 5,946.4 4,516.8 12,077.5 13,007.3 14,037.3 15,177.7 16,440.5 17,839.4 31.7%r")

Tab'e A1O,,3: Kab. Bantu, Centra Java (Group A)Revenues and Expenditures
(Rp miuion, at 1993 prices)
Actual Projections %Average
Category 1992193 1993(94 1994195 1995/96 1996/97 1997/98 1998/99 1999(00 2000/01 2001(02 2002103 2003/04 Growth per year
1993-1999
A. Income
1. Local Government Income (PADS)
Routine Revenues:
a. Local Taxes 199.9 204.6 339.3 659.7 939.2
b. Local Retribution/Service Charg 1,828.2 1,666.6 1,865.7 1,801.3 2,216.9
c. Local Enterprise Share Profit 96.6 101.5 90.0 211.3 275.9
d. Service Income 88.0 76.6 179.4 185.8 184.0
e. Other Income 241.8 281.4 284:3 462.6 221.8
Subtotal (1) 2,454.5 2,330.7 2,758.7 3,320.6 3,837.8
2. Share Taxes/ Nontax
PropertyTaxes 1,407.1 1,980.7 2,679.7 3,052.8 3,917.5
OtherTaxesandNontax 26.7 44.5 55.0 112.8 96.9
Subtotal (2) 1,433.8 2,025.1 2,734.7 3,165.6 4,014.4
Total Revenues (A) 3,888.3 4,355.9 5,493.4 6,486.3 7,852.2
3. Subsidies and Grant
Subsidies 4,125.5 4,521.2 4,432.0 5,235.1 5,544.6
Grant 7,847.5 7,515.7 7,202.9 6,511.9 7,289.6
Subtotal (3) 11,973.0 12,036.9 11,634.9 11,747.0 12,834.1
Total Income (A) 15,861.3 16,392.8 17,128.3 18,233.2 20,686.3
735.7 806.1 1,065.1 1,127.2 1,194.6 1,267.7 1,347.0 32.1%
1,907.5 1,737.4 1,753.9 1,940.8 2,150.3 2,385.7 2,650.2 0.0%
233.6 188.9 334.8 360.7 389.3 420.6 455.1 20.8%
149.0 136.1 0.0 0.0 0.0 0.0 0.0 16.0%
190.5 493.5 253.1 292.2 337.9 391.2 453.4 28.8%
3,216.4 3,361.9 3,406.9 3,720.9 4,072.1 4,465.3 4,905.7 6.3%
3,205.6 2,712.0 2,266.0 2,507.1 2,777.9 3,081.9 3,423.6 14.1%
90.0 86.5 1,967.9 2,130.0 2,308.7 2,505.7 2,723.0 28.4%
3,295.6 2,798.5 4,233.9 4,637.1 5,086.5 5,587.7 6,146.6 14.3%
6,511.9 6,160.4 7,640.9 8,358.0 9,158.6 10,052.9 11,052.3 9.1%
8,888.1 23,476.9 34,972.2 37,010.8 39,224.7 41,626.6 44,230.5 42.7%
7,221.6 7,170.9 6,440.0 7,125.2 7,894.6 8,758.9 9,729.8 -1.3%
16,109,1 30,647.8 41,412.2 44,136.0 47,119.4 50,385.5 53,960.3 20.5%
22,621.6 36,808.2 49,053.0 52,494.0 56,278.0 60,438.4 65,012.6 16.6%
B. Public Savings
Total PAD 3,888.3 4,355.9 5,493.4 6,486.3 7,852.2 6,511.9 6,160.4 7,640.9 8,358.0 9,158.6 10,052.9 11,052.3 9.1%
Expenditure:
Total Routine Expenditure 6,158.0 6,504.8 6,788.3 8,066.6 9,129.9 12,987.4 27,737.7 34,550.9 36,565.0 38,752.2 41,125.1 43,697.6 33.0%
Subsidies 4,125.5 4,521.2 4,432.0 5,235.1 5,544.6 8,888.1 23,476.9 (39,917.4) (42,244.3) (44,771.2) (47,512.7) (50,484.8) 42.7%
Net Routine Expenditure 10,283.5 11,026.0 11,220.3 13,301.6 14,674.5 21,875.5 51,214.7 (5,366.5) (5,679.3) (6,019.0) (6,387.6) (6,787.2) 36.8%
Total (5) (6,395.2) (6,670.1) (5,726.8) (6,815.4) (6,822.2) (15,363.6) (45,054.3) 13,007.3 14,037.3 15,177.7 16,440.5 17,839.4 126.0%
>-o
CD
Q
-o0)
ccCD0)
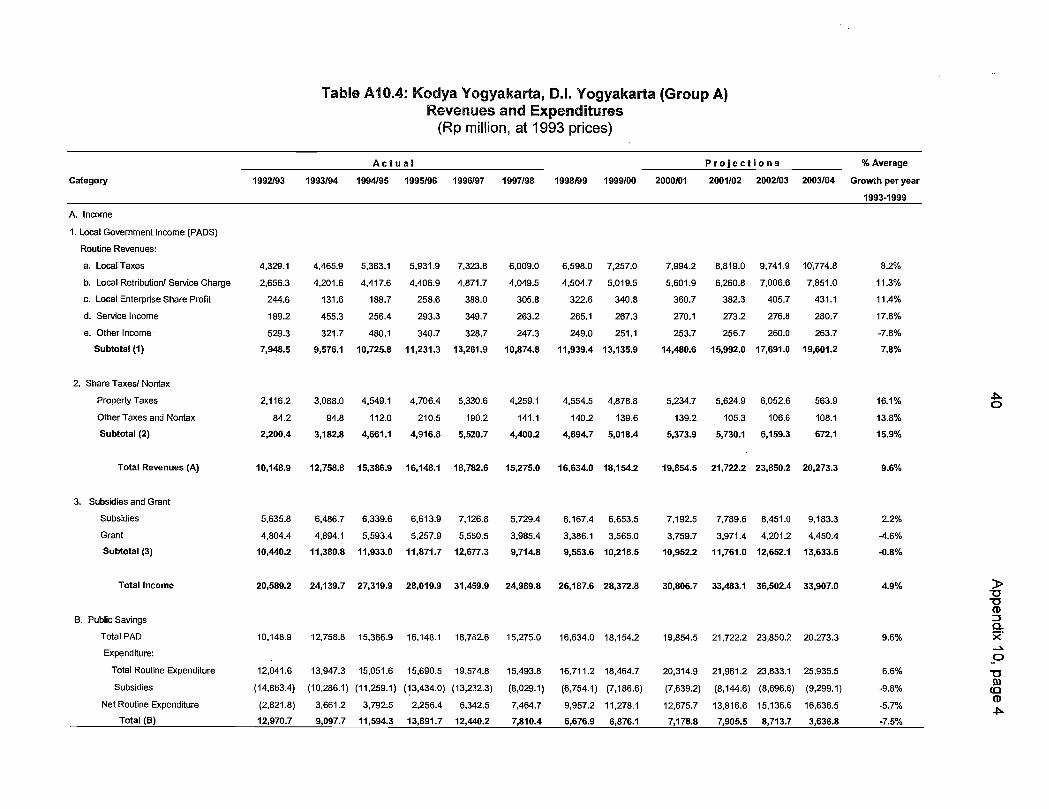
Category
A. Income
1. Local Government Income (PADS)
Routine Revenues:
a. Local Taxes
b. Local Retribution! Service Charge
c. Local Enterprise Share Profit
d. Service Income
e. Other Income
Subtotal (I)
2. Share Taxes! Nontax
Property Taxes
Other Taxes and Nontax
Subtotal (2)
Total Revenues (A)
3. Subsidies and Grant
Subsidies
Grant
Subtotal (3)
Table A1O.4: Kodya Yogyakarta, DL Yogyakarta (Group A)Revenues and Expenditures
(Rp million, at 1993 prices)
Actual Projections %Average
1992/93 1993/94 1994/95 1995/96 1996/97 1997/98 1998/99 1999/00 2000/01 2001/02 2002/03 2003104 Growth per year
1993-1999
4,329.1 4,465.9 5,383.1 5,931.9 7,323.8 6,009.0 6,598.0 7,257.0 7,994.2 8,819.0 9,741.9 10774.8 8.2%
2,656.3 4,201.6 4,417.6 4,406.9 4,871.7 4,049.5 4,504.7 5,019.5 5,601.9 6,260.8 7,006.6 7,851.0 11.3%
244.6 131.6 188.7 258.6 388.0 305.8 322.6 340.8 360.7 382.3 405.7 431.1 11.4%
189.2 455.3 256.4 293.3 349.7 263.2 265.1 267.3 270.1 273.2 276.8 280.7 17.8%
529.3 321.7 480.1 340.7 328.7 247.3 249.0 251.1 253.7 256.7 260.0 263.7 -7.8%
7,948.5 9,576.1 10,725.8 11,231.3 13,261.9 10,874.8 11,939.4 13,135.9 14,480.6 15,992.0 17,691.0 19,601.2 7.8%
2116.2 3,088.0 4,549.1 4,706.4 5,330.6 4,259.1 4,554.5 4,878.8 5,234.7 5,624.9 6,052.6 563.9
16.1%
84.2 94.8 112.0 210.5 190.2 141.1 140.2 139.6 139.2 105.3 106.6 108.1
13.8%
2,200.4 3,182.8 4,661.1 4,916.8 5,520.7 4,400.2 4,694.7 5,018.4 5,373.9 5,730.1 6,159.3 672.1
15.9%
10,148.9 12,758.8 15,386.9 16,148.1 18,782.6 15,275.0 16,634.0 18,154.2 19,854.5 21,722.2 23,850.2 20,273.3
9.6%
5,635.8 6,486.7 6,339.6 6,613.9 7,126.8 5,729.4 6,167.4 6,653.5 7,192.5 7,789.6 8,451.0 9,183.3
2.2%
4804.4 4,894.1 5,593.4 5,257.9 5,550.5 3,985.4 3,386.1 3,565.0 3,759.7 3,971.4 4,201.2 4,450.4 -4.6%
10,440.2 11,380.8 11,933.0 11,871.7 12,677.3 9,714.8 9,553.6 10,218.5 10,952.2 11,761.0 12,652.1 13,633.6 -0.8%
0
Total Income
20,589.2 24,139.7 27,319.9 28,019.9 31,459.9 24,989.8 26,187.6 28,372.8 30,806.7 33,483.1 36,502.4 33,907.0
4.9%
CDB. Public Savings
Total PAD 10,148.9 12,758.8 15,386.9 16,148.1 18,782.6 15,275.0 16,634.0 18,154.2 19,854.5 21,722.2 23,850.2 20,273.3 9.6%
><
Expenditure: . - 0Total Routine Expenditure 12,041.6 13,947.3 15,051.6 15,690.5 19,574.8 15,493.8 16,711.2 18,464.7 20,314.9 21,961.2 23,833.1 25,935.5 6.6%
Subsidies (14,863.4) (10,286.1) (11,259.1) (13,434.0) (13,232.3) (8,029.1) (6,754.1) (7,186.6) (7,639.2) (8,144.6) (8,696.6) (9,299.1) -9.8% 0)
Net Routine Expenditure (2,821.8) 3,661.2 3,79Z5 2,256.4 6,342.5 7,464.7 9,957.2 11,278.1 12,675.7 13,816.6 15,136.6 16,636.5 CD
Total (B) 12,970.7 9,097.7 11,594.3 13,891.7 12,440.2 7,810.4 6,676.9 6,876.1 7,178.8 7,905.5 8,713.7 3,636.8 .7.5%

% Average
Growth per year
1993-1999
1.0%
-4.0%
-4.3%
126.9%
2.4%
8.3%
8.3%
5.1%
16.8%
-5.3%
5.1%
4.3%
0CD
x
5.1% -0
11.2%
0)cr
16.8%
CD
4.2%
19.1%
Category
A. Income
1. Local Government Income (PADS)
Routine Revenues:
a. Local Taxes
b. Local Retribution! Service Charge
c. Local Enterprise Share Profit
d. Service Income
e. Other Income
Subtotal (1)
2. Share Taxes/Nontax
Property Taxes
Other Taxes and Nontax
Subtotal (2)
Total Revenues (A)
3. Subsidies and Grant
Subsidies
Grant
Subtotal (3)
Total Income
B. Public Savings
Total PAD
Expenditure:
Total Routine Expenditure
Subsidies
Net Routine Expenditure
Total (B)
Tab'e A1O.5: Kab. Pekaongan, Centra' Java (Group B)Revenues and Expenditures
(Rp million, at 1993 prices)
Actual__________________________
1992/93
1993/94 1994/95 1995/96 1996/97 1997/98 1999/98
795.0
858.0
25.0
0.0
71.0
1,749.0
1 .420.0
0.0
1,420.0
3,169.0
882.2 1,165.8 996.9 988.1 791.4 775.4
933.6 956.4 1,131.3 933.6 739.0 628.2
29.0 13.7 15.6 21.6 19.3 13.3
0.0 0.0 0.0 0.0 0.0 0.0
122.4 979.5 210.9 97.8 130.5 245.1
1,967.3 3,115.4 2,354.7 2,041.0 1,680.2 1,662.1
1,437.4 2,182.1 2,013.3 2,411.2 1,916.6 2,022.1
0.0 0.0 0.0 0.0 0.0 0.0
1,437.4 - 2,182.1 2,013.3 2,411.2 1,916.6 2,022.1
3,404.7 5,297.4 4,368.0 4,452.2 3,596.8 3,684.1
2,832.0 3511.2 3,276.9 3,382.8 3,561.9 3,831.6 6,407.7
4,835.0 3,892.5 3,483.8 3,493.0 3,829.1 3,393.0 3,390.3
7,667.0 7,403.7 6,760.7 6,875.8 7,391.0 7,224.6 9,797.9
10,836.0 10,808.4 12,058.1 11,243.8 11,843.3 10,821.4 13,482.1
3,169.0 3,404.7 5,297.4 4,368.0 4,452.2 3,596.8 3,684.1
5,099.0 6,101.9 6,197.4 6,660.9 6,967.9 6,701.1 9,211.8
(2,832.0) (3,511.2) (3,276.9) (3,382.8) (3,561.9) (3,831.6) (6,407.7)
2,267.0 2,590.7 2,920.5 3,278.1 3,406.0 2,869.5 2,804.1
902.0 814.0 2,376.9 1,089.8 1,046.3 727.3 880.0

Category
A. Income
1. Local Government Income (PADS)
Routine Revenues:
a. Local Taxes
b. Local Retribution/ Service Charge
c. Local Enterprise Share Profit
d. Service Income
e. Other Income
Subtotal (1)
2. Share Taxes/Nontax
Property Taxes
Other Taxes and Nontax
Subtotal (2)
Total Revenues (A)
3. Subsidies and Grant
Subsidies
Grant
Subtotal (3)
Total Income
2.3%
-7.0%
13.8%
1.7%
-3.4%
10.9%
-21.3% -
9.3% M
1.3%
37.0%
-5.5%
16.3%
10.7%
Table A1O.6: Kab. Sukoharjo, Central Java (Group B)Revenues and Expenditures
(Rp mflhion, at 1993 prices)
Actual Projections %Average
1992/93 1993/94 1994/95 1995196 1996/97 1997/98 1998/99 1999/00 2000/01 2001/02 2002/03 2003/04 Growth per year
1993-1999
1,284.4 1,650.9 1,622.9 1,744.6 1,817.9
1,350.3 1,359.7 1,371.4
1,385.4 1,401.5 1,419.7
1,440.0
2,568.9 2,538.6 2,562.1 2,555.6 2,443.5
1,522.1 1,532.7 1,545.9
1,561.7 1,579.8 1,600.4
1,623.2
69.1 106.2 101.3 151.4 146.6
127.0 127.9 129.0
130.3 131.8 133.6
135.5
0.0 0.0 0.0 0.0
0.0 0.0 0.0
0.0 0.0 0.0
0.0
640.2 1,024.8 425.5 460.4 689.5
343.2 345.6 348.6
352.1 356.2 360.9
366.0
4,562.5 5,320.5 4,711.8 4,911:9 5,097.5
3,342.8 3,365.9 -- 3,394.9
3429.5 3,469.4 3,514.5
3,564.6
1,930.6 2,553.0 2,983.1 3,819.8 4,866.3 2,915.1 2,935.3 2,960.6 2,990.8 3,025.6 3,064.9 3,108.6
181.6 211.9 206.3 206.2 164.4 0.0 0.0 0.0 0.0 0.0 0.0 0.0
2,112.3 2,764.9 3,189.4 4,026.0 5,030.7 2,915.1 2,935.3 -2,960.6 2,990.8 3,025.6 3,064.9 3,108.6
6,674.8 8,085.4 7,901.2 8,937.9 10,128.2 6,257.9 6,301.2 6,355.5 6,420.3 6,495.1 6,579.5 6,673.3
4,756.2 4,708.3 5,233.5 5,275.1 11,180.4 22,189.4 22,343.0 22,535.6 22,765.3 23,030.3 23,329.6 23,662.2
7,313.9 8,574.7 6,559.5 7,150.2 7,482.1 4,422.3 4,452.9 4,491.3 4,537.0 4,589.g 4,649.5 4715.8
12,070.1 13,283.0 11,793.1 12,425.3 18,662.6 26,611.7 26,795.9 27,026.9 27,302.3 27,620.2 27,979.1 28,378.0
18,744.9 21,368.4 19,694.2 21,363.2 28,790.7 32,869.6 33,097.1 33,382.4 33,722.6 34,115.2 34,558.6 35,051.3
B. Public Savings
Total PAD 6,674.8 8,085.4 7,901.2 8,937.9 10,128.2 6,257.9 6,301.2 6,355.5 6,420.3 6,495.1 6,579.5 6,673.3 1.3% )Expenditure:
Total Routine Expenditure 3,338.0 4,104.5 3,922.8 4,086.4 4,757.3 3,763.9 3,789.9 3,822.6 3,861.6 3,906.5 3,957.3 4,013.7 3.2%
Subsidies 4,756.2 4,708.3 5,233.5 5,275.1 11,180.4 22,189.4 22,343.0 22,535.6 22,765.3 23,030.3 23,329.6 23,662.2 37.0% -
Net Routine Expenditure 8,094.2 8,812.8 9,156.3 9,361.4 15,937.7 25,953.3 26,132.9 26,358.2 26,626.8 26,936.8 27,286.9 27,675.9 24.8% ><
Total (B) (1,419.4) (727.4) (1,255.2) (423.5) (5,809.5) (19,695.4) (19,831.7) (20,002.7) (20,206.5) (20,441.8) (20,707.4) (21,002.6) -360.0% Q
0)
CD0)

Table A1O.7: Kab, Jepara, Central Java (Group C)Revenues and Expenditures
(Rp million, at 1993 prices)
Actual %AverageCategory 1992/93 1993/94 1994/95 1995/96 1996/97 1997/98 1999/98 Growth per year
1993-1999A. Income1. Local Government Income (PADS)
Routine Revenues:a. Local Taxes 265.0 323.4 483.8 625.8 856.7 716.6 976.9 26.3%b. Local Retribution/Service Charge 2,069.0 245.8 2,570.9 2,647.7 3,153.7 3,504.8 6,295.9 161 .8%c. Local Enterprise Share Profit 93.0 82.2 95.7 105.5 109.0 97.9 60.5 -5.0%d. Service Income 0.0 0.0 0.0 0.0 0.0 0.0 0.0e. Other Income 166.0 172.9 241.9 498.4 356.0 526.2 281.0 20.5%
Subtotal (1) 2,593.0 824.3 3,392.3 3,877.3 4,475.4 4,845.5 7,614.4 56.4%
2. Sharelaxes/NonTaxProperty Taxes 775.0 914.0 1,635.9 1,489.1 2,422.4 1,987.2 1,368.2 16.9%Other Taxes and Non-Tax 553.0 646.7 767.5 837.5 978.4 672.2 245.1 -5.5%Subtotal (2) 1,328.0 1,560.7 2,403.4 2,326.6 3,400.7 2,659.4 1,613.3 8.9%
Total Revenues (A) 3,921.0 2,385.0 5,795,7 6,203.9 7,876.1 7,504.8 9,227.7 26.0%
3. Subsidies and GrantSubsidies 3,634.0 4,302.8 4,133.3 4,757.8 5,081.3 7,938.5 23,085.1 47.2%Grant 7,928.0 8,749.5 8,630.8 7,610.9 8,735.8 7,274.9 6,943.1 -1.6%Subtotal (3) 11,562.0 13,052.3 12,764.1 12,368.8 13,817.2 15,213.4 30,028.2 21.1%
Total Income 15,483.0 15,437.4 18,559.8 18,572.7 21,693.3 22,718.2 39,255.9 19.1%
B. Public SavingsTotal PAD 3,921.0 2,385.0 5,795.7 6,203.9 7,876.1 7,504.8 9,227.7 26.0%Expenditure: .9
Total Routine Expenditure 6,813.0 7,949.5 8,215.4 9,503.1 10,944.0 13,094.1 28,524.1 31.4%Subsidies (3,634.0) (4,302.8) (4,133.3) (4,757.8) (5,081.3) (7,938.5) (23,085.1) 47.2%
Net Routine Expenditure 3,179.0 3,646.7 4,082.1 4,745.3 5,862.7 5,155.6 5,439.0 10.0%Total (B) 742.0 (1,261.7) 1,713.7 1,458.6 2,013.4 2,349.2 3,788.7 -67.5%

FINANCIAL STATEMENTS OF SAMPLE WATER SUPPLY ENTERPRISES (PDAMs)
Table Alti: PDAM Klaten, Central Java Financial Statements(Rp million, at 1993 prices)
Item
1992 1993 1994 1995 1996 1997 1998 Average Growth
1993-1998
Revenues
WaterBillings 485.9 6O9.0 687.1 847.7 907.8 1,114.5 910.3 12.2%
Nonwater Revenues 116.6 75.4 163.1 193.8 201.5 197.3 170.2 14.6%
Other Revenue 11.0 14.8 21.5 16.2 15.7 24.3 19.0 14.1%
Subtotal 613.5 699.2 871.7 1,057.7 1,125.0 1,336.1 1,099.5 11.2%
ExpensesStaff Costs 132.3 191.7 202.9 225.2 302.8 325.5 286.8 15.3%
Fuel and Electricity Costs 22.3 21.0 20.4 19.6 14.7 2.9 11.4 30.0%
Chemical Cost 2.6 2.6 2.8 2.9 4.3 3.6 14.8 59.7%
Maintenance Cost 31.9 32.7 64.4 56.8 59.6 72.4 88.3 22.7%
Administrative and General Cost 54.1 55.2 60.2 67.3 71.8 111.5 70.5 8.0%
Other Cost 7.7 6.4 (2.5) 1.2 0.4 0.9 1.2 -37.0%
Water Retribution 6.4 25.6 25.4 30.3 40.3 45.3 32.6 56.1%
Subtotal 257.3 335.2 373.6 403.3 493.9 562.1 505.6 12.7%
Profit and Cost Before Depreciation 356.2 364.0 498.1 654.4 631.1 774.0 593.9 11.0%
Depreciation 284.5 279.7 418.5 719.1 548.0 669.9 568.0 17.2%
Amortization 4.7 6.8 3.2 16.1 7.4 3.5 3.1 46.8%
Amortization and Depreciation 289.2 286.5 421.7 735.2 555.4 673.4 571.1 17.0%
Net Income Before Interest 67.0 77.5 76.4 (80.7) 75.7 100.6 22.8 -71.6%
Interest and Bank Cost 1792 144.4 119.7 96.5 115.9 128.9 87.6 -9.4%
NetincomeAfterinterest (112.2) (66.9) (43.3) (177.2) (40.2) (28.3) (64.8) 42.7%
Other Revenue 52.8 42.7 22.8 37.0 36.3 (5.4) 113.2
Net Income Before Tax (59.4) (24.2) (20.4) (140.2) (3.9) (33.6) 48.4
Tax
Net Income After Tax (59.4) (24.2) (20.4) (140.2) (3.9) (33.6) 48.4Ca
CD
-

Item 1992 1993 1994 1995 1996 1997 1998 Average Growth1993-1998
(Con't.)Balance Sheet
Current Assets
Cash in Bank 132.5 97.3 262.7 467.9 413.6 482.0 666.2 44.1%Accounts Receivable 47.3 66.7 68.9 100.6 107.6 161.8 159.7 24.4%Other Receivables 7.9 3.4 2.8 3.9 3.7 12.6 4.1 22.4%Other Current Assets 0.0 3.9 13.9 40.9 70.9 110.9 206.1Inventory 249.2 253.8 314.6 299.0 402.7 713.0 849.6 25.3%OtherAssets 4.3 12.3 7.1 17.2 73.8 72.6 55.0 98.1%
Subtotal 441.2 437.4 670.0 929.5 1,072.3 1,552.9 1,940.7 29.4%
Fixed AssetsFixed Assets 4,716.6 4,937.6 6,349.6 7,578.9 8,138.9 11,099.1 14,064.7 20.5%Less: Accumulated Depreciation 2,094.6 2,374.2 2,822.1 3,663.4 4,364.8 5,262.5 6,324.7 20.3%
Subtotal 2,622.0 2,563.4 3,527.5 3,915.5 3,774.1 5,836.6 7,740.0 21.7%
OtherAssets 1.4 47.7 12.7 0.0 12.9 0.0 4.6Work in Progress 50.7 132.3 190.4 177.1 233.4 248.3 572.4 61.1%Materials and Supplies 4.2 6.8 3.4 18.9 9.4 9.4 1.0 48.0%
Total Assets 3,119.5 3,187.6 4,404.0 5,041.0 5,102.1 7,647.2 10,258.7 23.3%
Liabilities and Equity
Current Liabilities 0.5 41.2Short-Term Obligation 0.6 3.2 2.9 3.9 5.7 6.0 20.4Other Debt 14.5 18.0 5.5 4.0 7.7 7.3 -14.2%Tax Payable 1.0 6.1 2.6 1.0 7.1 13.0 23.5Interest Debt 568.1 705.4 826.7 764.0 449.3 444.3 439.4 -1.6%OtherCurrent Liabilities 201.8 158.3 92.0 92.0 81.6 88.6 96.3 -9.6%
Total Current Liabilities 786.0 891.0 929.7 864.9 551.4 559.7 620.8 -2.2%CD
Long-Term Debt 1,509.9 1,489.8 1,475.2 1,386.2 1,896.0 1,840.6 1,821.0 4.1% :3
><
Equity
Retained Earnings (1,704.7) (1,728.9) (1,750.8) (1,914.8) (2,070.2) (2,024.6) (1,966.8) 2.5%Capital and Grants 2,528.5 2,535.6 3,749.9 4,704.9 4,725.0 7,266.8 9,783.6 27.1%
Subtotal 823.8 806.7 1,999.1 2,790.1 2,654.8 5,242.2 7,816.8 54.5%
Total Liabilities and Equity 3,119.7 3,187.5 4,404.0 5,041.2 5,102.2 7,642.5 10,258.6 23.3%

Table Al 1.2: PDAM Yogyakarta Audited Financial Statements(Rp million, at 1993 prices)
Item
1993 1994 1995 1996 1997 1998 Average Growth1993-1998
Income Statement
Revenue 3,542 4,143 3,950 3,670 4,346 3,653 1.5%
Water Billings 3,030 3,693 3585 3355 3,662 3,312 2.4%
OtherRevenue 512 450 365 316 684 341 4.4%
Operating ExpendituresOperating Cost 1,004 1,115 1,084 1,040 1,257 1,287 5.4%
Operating Expenses 577 549 569 588 608 515 -2.0%
General and Administration 145 158 243 298 175 135 4.2%
Total Operating Costa 1,726 1,749 1,896 1,926 2,040 1,937 2.4%
GrossRevenuefromOperations 1,816 2,394 2,054 1,745 2,307 1,716 1.8%
Depreciation 1,163 1,096 1,231 1,175 1,184 903 -4.2%
Net Income Before Interest 653 1,298 823 570 1,123 813 20.2%
Interest 547 982 535 525 619 433 4.0%
Net Operating Income 106 316 288 45 504 380
Other Income/Expenditure 269 267 263 270 293 575 21.0%
Income Tax 137 190 145 40 177 282 69.1%
Net Income AfterTax 238 393 406 275 620 673 34.2%
Balance Sheet
AssetsCurrent Assets
Cash 2,382 3,875 4,205 4,644 5,317 7,751 28.4%
Accounts Receivable 701 658 963 933 1,217 1,136 12.2%
Inventory 746 787 1,043 1,425 1,043 1,053 9.8%
OtherCurrentAssets 110 184 184 292
Total Current Assets 3,939 5,504 6,395 7,002 7,577 10,232 21.7%
Fixed Assets 16,665 17,485 19,254 21,347 24,108 24755 8.3%
Accumulated Depreciation 5,560 6,704 8,049 9,476 10,897 12,458 17.5%
Net Fixed Assets 11,105 10781: 11,205 11,871 13.211 12,297 2.3%
Workin Progress 236 9 256 17 16 10
OtherAssets 446 325 484 904 684 510 11.8%
Total Assets 15,726 16,619 18,340 19,794 21,488 23,049 8.0%
Liabilities and EquityCurrent Liabilities
Account Payable 10 57 546 219 59 20 2.4%Other Currant LiabiliUes 2,248 3,124 3,738 4,574 5,778 6,109 2.4%
Total Current Liabilities 2,258 3,181 4,284 4,793 5,837 6,129 2.4%OtherLiabilities 619 650 708 1021 871 1,417 2.4%
Long-Term Debt 6,953 6,846 7,119 7,669 7,714 7,548 8.3%Total Liabilities 9,830 10,677 12,111 13,483 14,422 15,094 17.5%
Capital and Grants 5,609 5,521 5,626 5,737 5,942 5,941 2.3%
Retained Earnings 287 421 603 574 1,124 2,014
Total Equity 5,896 5,942 6,229 6311 7,066 7,955 11.8%Total Liabilities and Equity 15,726 16,619 18,340 19,794 21,488 23,049 8.0%
0)
-D-aCD
0.><--
-aCOCD0)

Table A11.3: PDAM Pekalongan, Centra Java Audited Financial Statements
(Rp million, at 1993 prices)
Item 1993 1994 1995 1996 1997 1998 Average Growth1993-1998
Income Statement
Revenue 607 605 654 830 723 664 2.7%Water Billings 443 454 495 498 514 599 6.4%Other Revenue 164 151 159 332 209 65 0.0%
Total Operating Expenditures
Operating Cost 157 181 200 220 216 270 11.8%Operating Expenses 127 143 145 164 198 169 6.6%General and Administration 86 88 107 66 103 85 4.7%
Total Operating Costs 370 412 452 450 516 524 7.4%Gross Revenue from Operations 237 193 202 380 207 141 -0.7%Depreciation 340 310 406 384 344 336 0.8%Net Income Before Interest (103) (117) (204) (5) (137) (195)Interest 12 77 66 68Net Operating Income (103) (117) (216) (82) (203) (263) 42.8%Other IncornelExpenditure - 7 13 22 28 17 53 71.2%Income TaxNetlncpmeAfterTax (96) (104) (194) (54) (186) (210) 56.1%
Balance Sheet
Assets -'1
Current AssetsCash 40 48 293 87 82 22 76.2%Account Receivable 91 94 139 192 115 171 19.6%Inventory 28 52 85 114 535 403 105.6%Other Current Assets 206 227 251 276 299 333 10.1%
Total Current Assets 365 421 768 669 1,031 929 25.8%Fixed Assets 5,494 5,728 6,388 7,326 7,466 7,661 7.0%
Accumulated Depreciation 2,154 2,486 2,961 3,446 3,907 4,535 16.1%NotFixedAssets 3,340 3,242 3.427 3,880 3,559 3,126 -0.9%Workin Progress 1,481 2,501
Other Assets 25 25 62 41 26 30 18.6%Total Assets 3,730 3,688 4,257 4,590 6,097 6,586 12.6%
Liabilities and EquityCurrent Liabilities
Account Payable 2 5 27 2 105 5 CDOtherCurrentLiabilities 11 21 143 157 128 321
Total Current Liabilities 13 26 170 159 233 326Other Liabilities 26 30 68 77 49 58 27.5%Long-term Debt 400 707 2,417 3,225
Total Liabilities 39 56 638 943 2,699 3,609CapitalandGrants 4,975 5,027 5,242 5,339 5,339 5,339 1.4%Retained Earnings (1,284) (1,395) (1,623) (1,692) (1,941) (2,362) 13.1% CD
Total Equity 3,691 3,632 3,619 3,647 3,398 2,977 -4.1%Total Liabilities and Equity - 3,730 3,688 4,257 4,590 6,097 6,586 12.6%

Table A11.4: PDAM Jepara, Central Java Financial Statements(Rp million, at 1993 prices)
Item 1993 1994 1995 1996 1997 1998 Average Growth________________________ 1993-1998
IncomeStatement - ____________________________________________________________________
Revenue 339 519 393 470 715 846 23.8%Water Billings 270 344 353 387 566 482 14.2%Other Revenue 69 175 40 83 149 364 81.3%
Total Operating ExpendituresOperating Cost 76 134 143 154 187 181 21.8%Operating Expenses 83 80 75 41 58 81 5.1%General and Administration 123 102 193 183 200 157 11.0%
Total Operating Costs 282 316 411 378 446 420 9.2%Gross Revenue from Operations 57 203 (18) 91 269 426 -41.9%Depreciation 417 351 703 486 477 369 5.8%Net Income Before Interest (360) (149) (721) (395) (207) 57 21.3%Interest 3 35 166Net Operating Income (360) (149) (721) (398) (243) (109) 37.6%Other Income/Expenditure 26 7 11 11 8 7Income TaxNetlncomeAfterTax (334) (142) (710) (387) (235) (102) 40.2%Balance Sheet
AssetsCurrent Assets
Cash 92 238 182 14 211 345Accounts Receivable 150 159 97 112 131 162 4.6%Inventory 76 118 81 297 708 188 71.1%OtherCurrentAssets 24 19 19 34
Total Current Assets 318 515 384 442 1,069 729 32.3%Fixed Assets 3,394 3,698 3,845 4,695 5,460 7,352 17.2%
Accumulated Depreciation 417 794 1,616 2.238 2,877 3,567 57.0%Net Fixed Assets 2,977 2,904 2.229 2,457 2,583 3785 7.2%Work in Progress
Other Assets 64 28 20 43 69 201 56.4%Total Assets 3,359 3,447 2,633 2,942 3,721 4,715 8.8%
Liabilities and EquityCurrent Liabilities
Account Payable 20 39 3 0.0%OtherCurrent Liabilities 1 11 11 32 87 147
Total Current Liabilities 1 31 11 71 90 147Other Liabilities 86 54 47 75 105 260 39.4%Long-Term Debt 678 1,571 2,253Total Liabilities 87 85 58 824 1,766 2,660Capital and Grants 3,606 3,847 4,325 4,396 - 4,599 4,947 6.6%Retained Earnings (334) (485) (1,750) (2,278) (2,644) (2,892) 72.3%
Total Equity 3,272 3,362 2,575 2,118 1,955 2,055 -8.2%Total Liabilities and Equity 3,359 3,447 2,633 2,942 3,721 4,715 8.8%
-DCD
x
-D0)
CDCDth

49 Appendix 12, page 1
ECONOMIC AND FINANCIAL ANALYSES
A. General Assumptions and.Methodology
I The reevaluation of a sample of subproject components was undertaken by the AsianDevelopment Bank (ADB) staff consultant based on project completion report data, which werevalidated and supplemented from the field visits and interviews with various local officials,domestic consultants, and community leaders in the project. areas visited by, the Mission. InCentral Java, the Mission visited Kab. Klaten, Sleman, and Bantul (group A), and Kab.Semarang and Sukoharjo (group b). In Di. Yogyakarta, the Mission visited Kod. Yogyakarta(group A) and Kab. Kulonprogo (group C). The results of discussions held with Central Java andD.I. Yogyakarta provincial governments and other participating local governments (mostly groupB and C districts) provided useful inputs in assessing the relative development impact of small-scale project components on the low-income project areas, and the merits of undertakingproject benefit monitoring and evaluation (PBME) activities to identify project deficiencies andmeasures undertaken to sustain the projectbenefits.
2. The financial internal rate of return (FIRR) was computed for revenue-generatingsubprojects of water supply, solid, waste, and sanitation. Market Infrastructure ImprovementProgram (MllP) is excluded from the financial reevaluation as there is no actual fee charged forthe 'MIIP facilities. The economic internal rate of return (EIRR) was computed for nonrevenue-generating 'subprojects' for drainage, urban roads, and the Kampung Improvement Program(KIP). The methodology .for calculation was similar to the evaluation methodology used in theSubproj'ect Appraisal Report (SPAR) and in.. the Govenment's PCR for all the subprojectcomponents. The actual FIRRs and EIRRs were compared with SPAR results and arepresented in Table Al2.1 and Table Al2.2.
3. In the economic evaluation, the investment costs were converted to economic costs bydeducting duties, taxes, and other transfer payments. Costs and revenue streams wereconverted to 1999 constant prices using 1989 as the base year in the consumer price index.
4. The FIRR and EIRR results were compared to the weighted average of capital cost(WACO) and the prevailing economic opportunity costof capital (EOCC) in Indonesia. TheWACO was computed at 12.84 percentwhile the EOCC is 12 percent.1
B. Revenue Projections
5. The formula for computing; the revenue projections (financial benefits) for 'the differentsubprojects follow:
-i1iJ,i
R = (HHWC x R0) + (CMWC x R1)
Where: ' H
R = RevenueHHWC = Household water consumption in cubic meters (m3)CMWC= Commercial establishments water consumption in m3R3= Water rates per m3 for households in Rp
1 ADB estimate for indonesia, 1999.
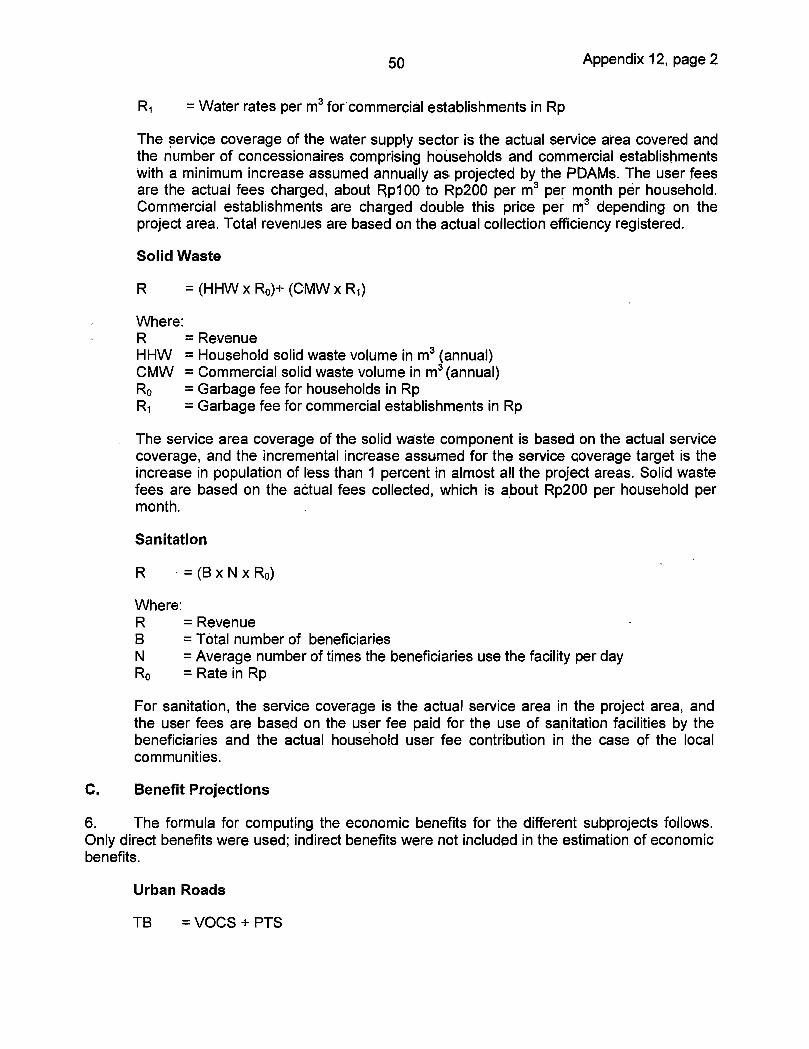
50 Appendix 12, page 2
R 1= Water rates per m3 forcommerciàl establishments in Rp
The service coverage of the water supply sector is the actual service area covered andthe number of concessionaires comprising households and commercial establishmentswith a minimum increase assumed annually as projected by the PDAMs. The user feesare the actual fees charged, about Ip100 to Rp200 per ru 3 per month per household.Commercial establishments are charged double this price per m 3 depending on theproject area. Total revenues are based on the actual collection efficiency registered.
Solid Waste
R =(HHWxR0)+(CMWxR1)
Where:R = RevenueHHW = Household solid waste volume in m 3 (annual)CMW = Commercial solid waste volume in m 3 (annual)
= Garbage fee for households in RpR1= Garbage fee for commercial establishments in Rp
The service area coverage of the solid waste component is based on the actual servicecoverage, and the incremental increase assumed for the service coverage target is theincrease in population of less than 1 percent in almost all the project areas. Solid wastefees are based on the aôtual fees collected, which is about Rp200 per household permonth.
Sanitation
R =(BxNxR0)
Where:R = RevenueB = Total number of beneficiariesN = Average number of times the beneficiaries use the facility per dayR0= Rate in Rp
For sanitation, the service coverage is the actual service area in the project area, andthe user fees are based on the user fee paid for the use of sanitation facilities by thebeneficiaries and the actual household user fee contribution in the case of the localcommunities.
C. Benefit Projections
6. The formula for computing the economic benefits for the different subprojects follows.Only direct benefits were used; indirect benefits were not included in the estimation of economicbenefits.
Urban Roads
TB = VOCS + PTS

51Appendix 12, page3
WhereTB Total benefitsVOCS Vehic!e operating cost savingsPTS Passenger time savings
Where:VOCS = (Incremental traffic volurre) x (Ave. vehicle operating cost) x (Road length)PTS = (Ave passenger load/vehicle) x (Minimum salary per hour) x (Minutes saved)
It is noted that théré were indirect minimal increases in land value as a result of theimprovement works of prqject roads but since these are existing roads, only the traffic-related benefits were used. These cbmprise mainly the vehicle operating cost savings inthe improved traffic roads in rural and urban areas. In addition, passenger time savingsis calculated for the improved roads in the urban areas.
Drainage
TB = (NHH x DC0)^ (NCE x DC1)
Where:TB = Total benefitsNHH = Incremental number of households affected by floodingNCE = Incremental number of commercial establishments affected by floodingDC0 = Estimated damage cost to householdsDC 1 = Estimated damage cost to commercial establishments
It is noted that there were minimal increases in the land value of the affectedcommunities and these constitute the indirect benefits as a result of the project.However, in the estimation of benefits, only direct benefits were considered comprisingmainly the reduction in the cost of damage to properties due to flooding.
TB =LACxLV
Where:TB = Total benefitsLAC = Incremental increase in land area covered by the ProjectLV = Increase in land values due to the Project
Since the KIP projects are mostly small-scale projects and comprise severalcomponents of solid waste, drainage, sanitation, and pavement improvement of minorstreets in the more densely populated areas, the measurable benefit that can beattributed is the increase in land value, assumed to be minimal in real terms due to thenegative effect of the economic crisis in the regional economy. The data used is basedon interviews with community leaders and some residents in the project areas visited.
D. Evaluation Results
7. The summarized results of the financial evaluation are presented in Table Al2.1, whilethe results of the economic analysis are presented in Table Al 2.2. These are compared with the
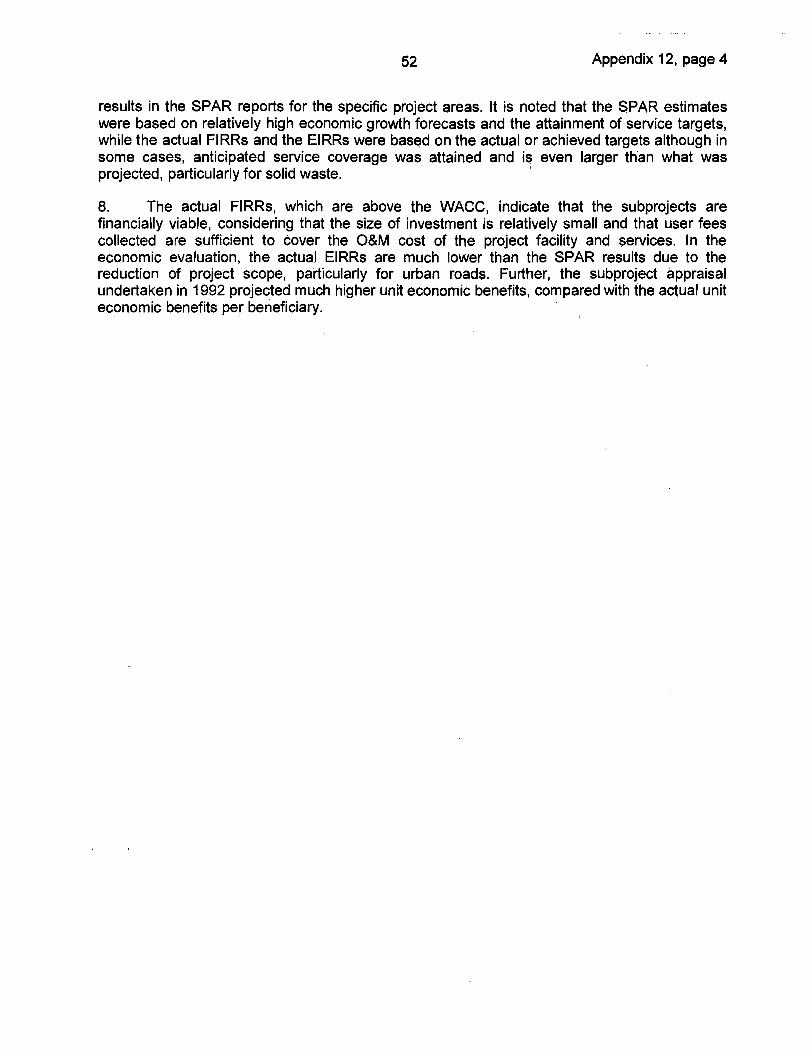
52 Appendix 12, page 4
results in the SPAR reports for the specific project areas. It is noted that the SPAR estimateswere based on relatively high economic growth forecasts and the attainment of service targets,while the actual FIRRs and the EIRRs were based on the actual or achieved targets although insome cases, anticipated service coverage was attained and is even larger than what wasprojected, particularly for solid waste.
8. The actual FIRRs, which are above the WACO, indicate that the subprojects arefinancially viable, considering that the size of investment is relatively small and that user feescollected are sufficient to cover the O&M cost of the project facility and services In theeconomic evaluation, the actual EIRRs are much lower than the SPAR results due to thereduction of project scope, particularly for urban roads Further, the subproject appraisalundertaken in 1992 projected much higher unit economic benefits, compared with the actual uniteconomic benefits per beneficiary.
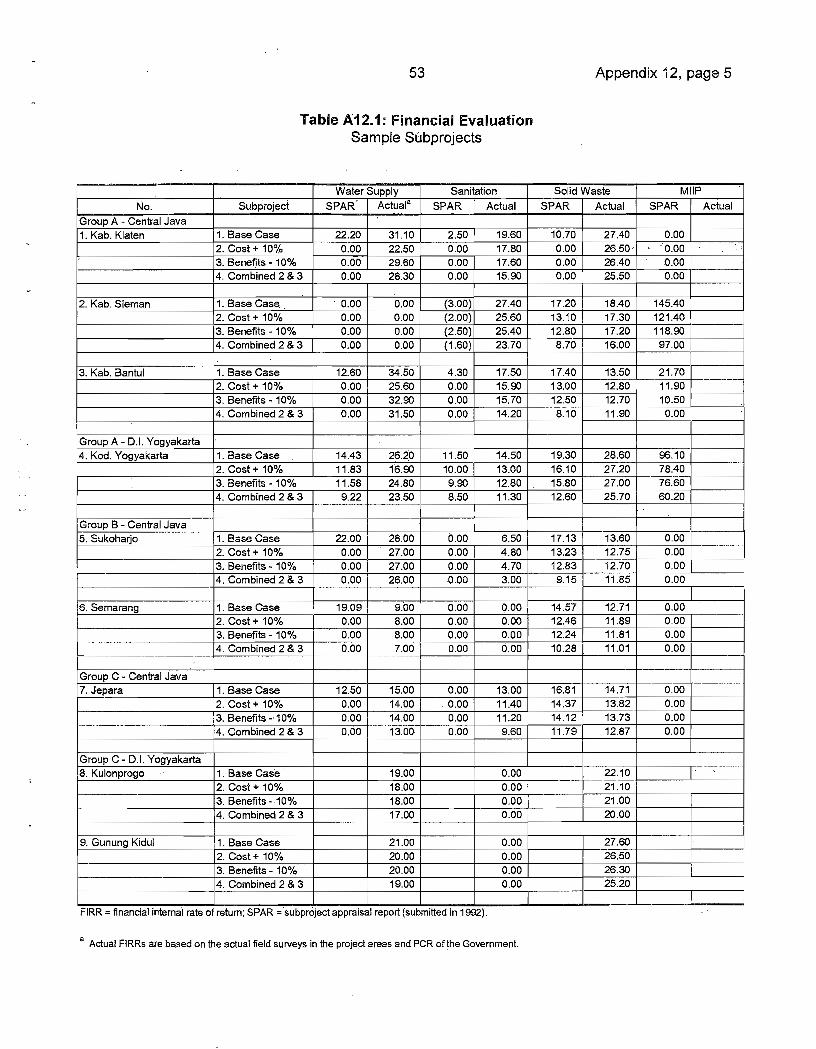
53 Appendix 12, page 5
Table Al2.1: Financial EvaluationSample SUbprojects
_______________ Water Supply Sanitation Solid Waste MIIP
No. Subproject SPAR Actual SPAR Actual SPAR Actual SPAR Actual
GroupA - Central Java ________________ ________ ________ ________ ________ ________ ________ ________ ________1. Kab. Klaten 1. Base Case 22.20 31.10 2.50 19.60 10.70 27.40 0.00 _____________________________ 2. Cost + 10% 0.00 22.50 0.00 17.80 0.00 26.50 0.00 ____________________________ 3. Beneflts- 10% 0.00 29.60 0.00 17.60 0.00 26.40 0.00 _____________________________ 4. Combined 2 & 3 0.00 28.30 0.00 15.90 0.00 25.50 0.00 ________
2. Kab. Sleman 1.. Base Case.. 0.00 0.00 (3.00) 27.40 17.20 18.40 145.40 ____________________________ 2. Cost+ 10% . 0.00 0.00 (2.00) 25.60 13.10 17.30 121.40 ___________________________ 3. Benefits- 10% . 0.00 0.00 (2.50) 25.40 12.80 17.20 118.90 ____________________________ 4. Combined 2 & 3 0.00 0.00 (1.60) 23.70 8.70 16.00 97.00 ________
3. Kab. Bantul 1. Base Case 12.60 34.50 4.30 17.50 . 17.40 13.50 21.70 ___________________________ 2. Cost+ 10% 0.00 25.60 0.00 15.90 13.00 12.80 - 11.90 -_____________________ 3. Benefits - 10% 0.00 32.90 0.00 - 15.70 12.50 . 12.70 10.50 ___________________________ 4.Combined2&3 0.00 31.50 0.00 14.20 8.10 11.90 0.00 _______
GroupA - D.l.Yogyakarta . -_____ _______ _______ _______4.Kod.Yogyakarta 1.BaseCase. 14.43 26.20 11.50 14.50 .19.30 28.60 96.10 ____________________________ 2.Cost+10% 11.83 16.90 10.00 13.00 16.10 27.20 78.40 ___________________________ 3.Benefits-.10% 11.58 24.80 9.90 12.80 15.80 27.00 76.60 _________________________ 4.Combined 2&3 9.22 23.50 8.50 11.30 12.60 25.70 60.20 _______
GroupB-CentralJava5.Sukoharjo 1.BaseCase 22.00 28.00 boo 6.50 - 17.13 13.60 0.00 ________
______________ 2.Cost+10% .0.00 27.00 0.00 4.80 13.23 12.75 0.00 _________________________ 3.Benefits - 10% 0.00 27.00 0.00 4.70 12.83 12.70 0.00 _________________________ 4.Combined2&3 0.00 26.00 0.00 3.00 9.15 11.85 0.00 ________
6.Sernarang 1.BaseCase 19.09 9:00 0.00 0.00 14.57 12.71 0.00
__________________ 2.Cost+10% 0.00 8.00 0.00 0.00 12.46 11.89 0.00 _______
- 3.Benefits-10% 0.00 8.00 0.00 0.00 12.24 11.81 0.00 _______-___________________ 4.Combined2&3 0.00 7.00 0.00 0.00 10.28 11.01 0.00 _______
GroupC-CentralJava _______________ ________ _______ ________ ________ ________ ________ ________ ________7.Jepara 1.BaseCase 12.50 15.00 0.00 13.00 16.81 14.71 0.00 ____________________________ 2.Cost+10% 0.00 14.00 :0.00 11.40 14.37 13.82 0.00 ___________________________ 3.Benefits -10% 0.00 .14.00 0.00 11.20 14.12 13.73 0.00 __________________________ 4.Combined2&3 0.00 13.00 0.00 9.60 11.79 12.87 0.00 _______
GroupC-Dl.Yogyakarta _______________ ________ _______ ________ ________ ________ ________ ________8.Kulonprogo __. 1.BaseCase ________ 19.00 ________ 0.00 ________ 22.10 ________ ____________________________ 2.Cost+10% _______ 18.00 _______ 0.00 _______ 21.10 _______ _________________________- 3.Benefits-.i0% _______ 18.00 _______ 0.00 _______ 21.00 _______ _____________________________ 4.Combined2&3 ________ 17.00 ________ 0.00 ________ 20.00 ________ ________
9.GunurrgKidul 1.BaseCase ________ 21.00 ________ 0.00 ________ 27.60 ________ ________-___________________ 2.Cost+10% _______ 20.00 _______ 0.00 _______ 26.50 _______ _____________________________ 3.Benefits - 10% ________ 20.00 ________ 0.00 ________ 26.30 ________ ____________________________ 4. Combined2 & 3 _______ 19.00 _______ 0.00 25.20 _______ _______
FIRR = financial internal rate of return; SPAR = subproject appraisal report (submitted in 1992). . 0
a Actual FIRRs are based on the actual field surveys in the project areas and PCR of the Government.
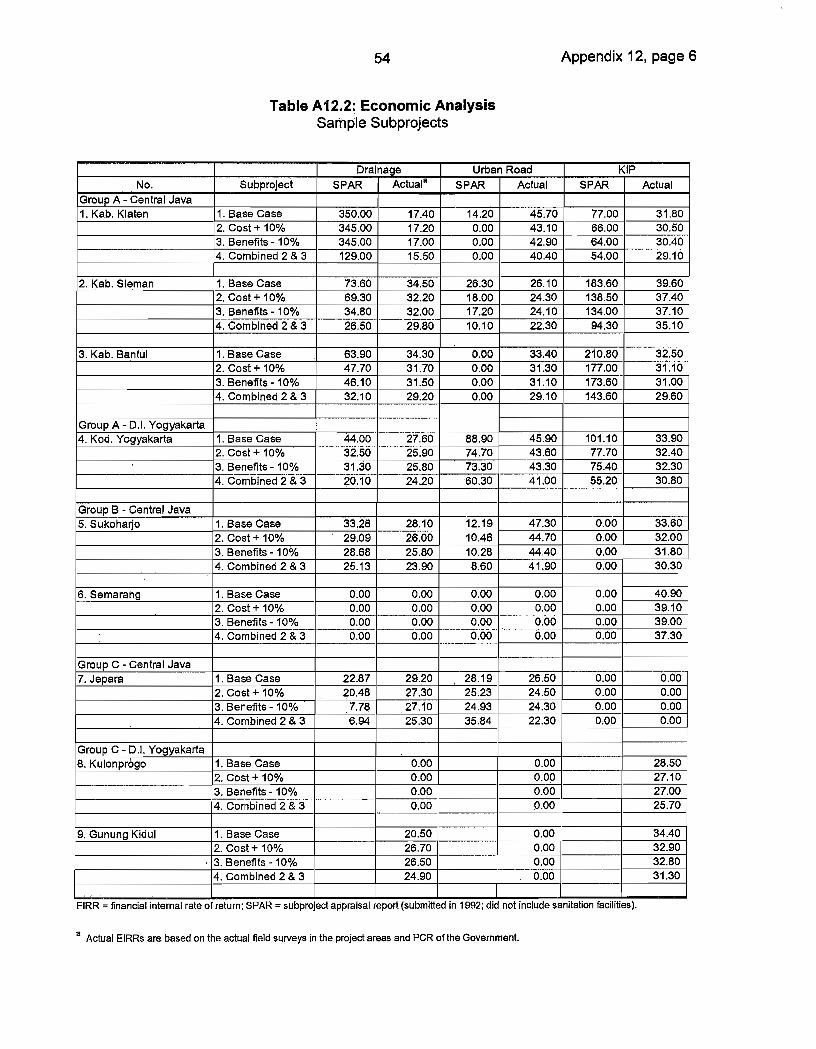
54 Appendix 12, page 6
Table Al2.2: Economic AnalysisSample Subprojects
_____________________ ________________ Drainage Urban Road ________KIPNo. Subproject SPAR Actuala SPAR Actual SPAR Actual
GroupA -Central Java ________________ ________ _________ ________ _________ _________ _________1. Kab. Klaten 1. Base Case 350.00 17.40 14.20 45.70 77.00 31.80___________________ 2. Cost+ 10% 345.00 17.20 0.00 43.10 66.00 30.50_____________________ 3. Benefits - 10% 345.00 17.00 - 0.00 42.90 64.00 30.40____________________ 4. Combined 2 & 3 - 129.00 15.50 0.00 40.40 54.00 29.10
2 Kab Sleman I Base Case 73 60 3450 26 30 26 10 - 183 60 3960___________________ 2. Cost+ 10% 69.30 32.20 18.00 24.30 138.50 - 37.40___________________ 3. Benefits-10% 34.80 32.00 17.20 24.10 134.00 37.10____________________ 4.Combined2&3 26.50 29.80 10.10 22.30 94.30 35.10
3.Kab.Bantul 1.BaseCase 63.90 34.30 0.00 33.40 210.80 32.50___________________ 2.Cost+10% 47.70 31.70 0.00 31.30 177.00 31.10___________________ 3.Benefits-10% 46.10 31.50 0.00 31.10 173.60 31.00____________________ 4.Combined2&3 32.10 29.20 0.00 29.10 143.60 29.60
GroupA - D.l.Yogyakarta _____________ _______ _______ _______ ________ _______ ________4.Kod.Yogyakarta 1.Base_Case 44.00 27.60 88.90 45.90 101.10 33.90__________________ 2_Cost+10% 3250 2590 7470 4360 -7770 3240___________________ 3. Benefits- 10% 31.30 25.80 73.30 43.30 75.40 32.30____________________ 4. Combined 2 & 3 20.10 24.20 60.30 41.00 55,20 30.80
GroupB - Central Java ________________ _________ _________ _________ _______ _________5. Sukoharjo 1. Base Case 33,28 28,10 12.19 47.30 0.00 33.60
____________________ 2. Cost + 10% 29.09 26.00 10,46 44.70 0.00 32.00
___________________ 3. Benefits- 10% 28.68 25.80 10.28 44.40 0.00 31.80
____________________ 4. Combined 2 & 3 25.13 23.90 8.60 41.90 0.00 30.30
6.Semarang 1. Base Case 0.00 0.00 0.00 0.00 0.00 40.90
____________________ 2. Cost + 10% 0.00 0.00 0.00 0.00 0.00 39.10___________________ 3. Benefits- 10% 0.00 0,00 0.00 0.00 0.00 39.00
____________________ 4. Combined 2 & 3 0.00 0.00 0.00 0.00 0.00 37.30
GroupC - Central Java -_______ _________7. Jepara 1. Base Case 22.87 29.20 28.19 26,50 0.00 0.00
____________________ 2. Cost + 10% 20.48 27.30 25.23 24.50 0.00 0.00___________________ 3. Benefits- 10% 7.78 27.10 24.93 24.30 0.00 0.00
-__________________ 4. Combined 2 & 3 6.94 25.30 35.84 22.30 0.00 0.00
GroupC - Dl. Yogyakarta _______________ ________ ________ ________ ________ ________ _________8. Kulonprógo 1. Base Case ________ 0.00 ________ 0.00 28.50
_________________ 2. Cost+ 10% ________ 0.00 ________ 0.00 27.10- 3. Benefits - 10% _________ 0.00 ________ 0.00 - 27.00___________________- 4. Combined 2 & 3 ________ 0.00 ________ 0.00 ________ - 25.70
9. Gunung Kidul 1. Base Case ________ 20.50 ________ 0.00 ________ 34.40
_____________________ 2.Cost+10% _________ 26.70 ________ 0.00 _________ 32.90
_____________________ 3.Benefits-10% _________ 26.50 ________ 0.00 ______- 32.80
_________________ 4.Combined2&3 _______ 24,90 _______ 0.00 _______ 31.30
FIRR = financial internal rate of return; SPAR = subproject appraisal report (submitted in 1992; did not include sanitation facilities).
Actual EIRRs are based on the actual field surveys in the project areas and PCR of the Government.

55 Appendix 13, page 1
PROJECT BENEFITS AND IMPACTS
Table A13.1: Central Java and D.I. Yogyakarta
Number of BeneficiariesaComponent Appraisal Actual Achievement
Estimate as of Project (%)Completion
Water Supply 1,695,000 1,265,000 74.6
Sanitation 1,837,000 1,967,000 107.1
Solid Waste 3,384,000 2,742,000 81.0
Drainage 1,064,000 1,168,000 109.7
Urban Roads 1,035,000 908,000 87.7
KIP/MIIP/GLD 666,000 677,000 101 7
KIP = Kampung Improvement Program; MIIP = Market Infrastructure Improvement Program; GLD = Guided LandDevelopment.
a Beneficiaries in one category might be included in another.
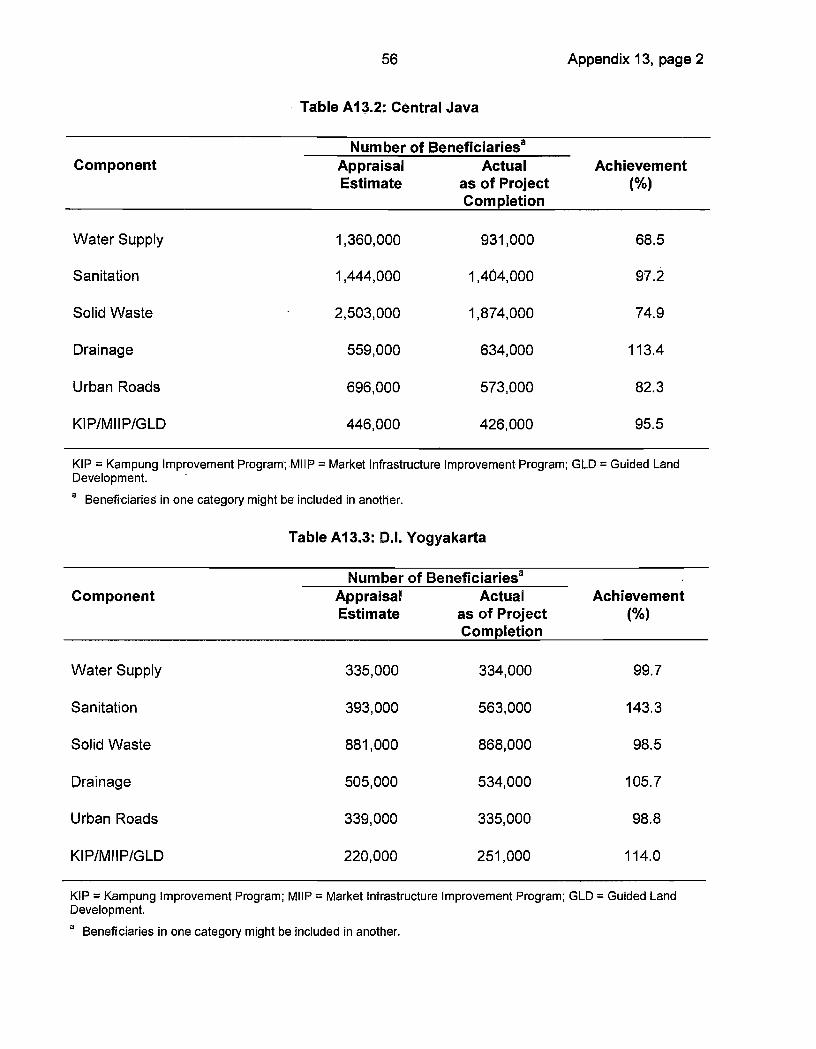
56 Appendix 13, page 2
Table A13.2: Central Java
Number of BeneficiariesaComponent Appraisal Actual Achievement
Estimate as of Project (%)Completion
Water Supply 1,360,000 931,000 68.5
Sanitation 1,444,000 1,404,000 97.2
Solid Waste 2,503,000 1,874,000 74.9
Drainage
559,000
634,000
113.4
Urban Roads
696,000
573,000
82.3
KIP/MIIP/GLD
446,000
426,000
95.5
KIP = Kampung Improvement Program; MIIP = Market Infrastructure Improvement Program; GLD = Guided LandDevelopment. -
Beneficiaries in one category might be included in another.
Table A133: Di. Yogyäkarta
Number of BeneficiariesaComponent Appraisal Actual Achievement
Estimate as of Project (%)Completion
Water Supply 335,000 334,000 99.7
Sanitation
393,000
563,000
143.3
Solid Waste
881,000
868,000
98.5
rainage
505,000
534,000
105.7
Urban Roads
339000
335,000
98.8
KIP/MIIP/GLD 220,000 251,000 114.0
KIP = Kampung Improvement Program; MIIP = Market Infrastructure Improvement Program; GLD = Guided LandDevelopment.
a Beneficiaries in one category might be included in another.

57
Appendix 14, page 1
LESSONS LEARNED AND ACTIONS TAKEN OR TO BE TAKEN
ISSUES
Integrated Urban InfraltructureDevelopment Program (IUJDP)
Future IUIDPs should aim to integrateIUIDPs with complementary programsto promote economic development,poverty reduction; employmentcreation, and income generation.Funding mechanisms for labor-intensive schemes covering microprojects such as slum upgrading andother basic infrastructure provision bycommunity groups should beencouraged. Programs need to beless prescriptive and made moreflexible and responsive to localcircumstances. This suggests that asector rather than a project approachis more appropriate for supportingIUIDPs.
B. Local Institutional CapacityBuilding
Institutional strengthening was not assuccessful as the physical works.Increased emphasis On institutionaldevelopment is heeded, focusing onneeds assessment at the field leveli.e., bottom-up planning approach toproject design and capacity building.
ACTIONS TAKEN/TO BE TAKEN
Recent ADB-assisted urban developmentprojects are mostly based on a sectorlending modality to enable developmentsubprojects that meet current needs andallow for flexibility in the work to be doneduring implementation. Rather thanthrough project implementation alone,public-private partnerships are encouragedto stimulate economic activities in the longterm. Community involvement, self-helpapproaches, and the use of labor-intensivemethodologies will all contribute toincreased employment opportunities whileattaining economy and efficiency.
Subsequent urban development projectshave institutional capacity building as amain objective, often physical aspects as ademonstration ground for the institutionalstrengthening efforts. The AsianDevelopment Bank (ADB) technicalassistance (TA) 3326-lNO: Urban SectorDevelopment in a DecentralizedEnvironment currently being implementedis aimed at enhancing the awareness oflocal governments of the measuresnecessary to meet the requirements ofdecentralization and its impacts on urbandevelopment.
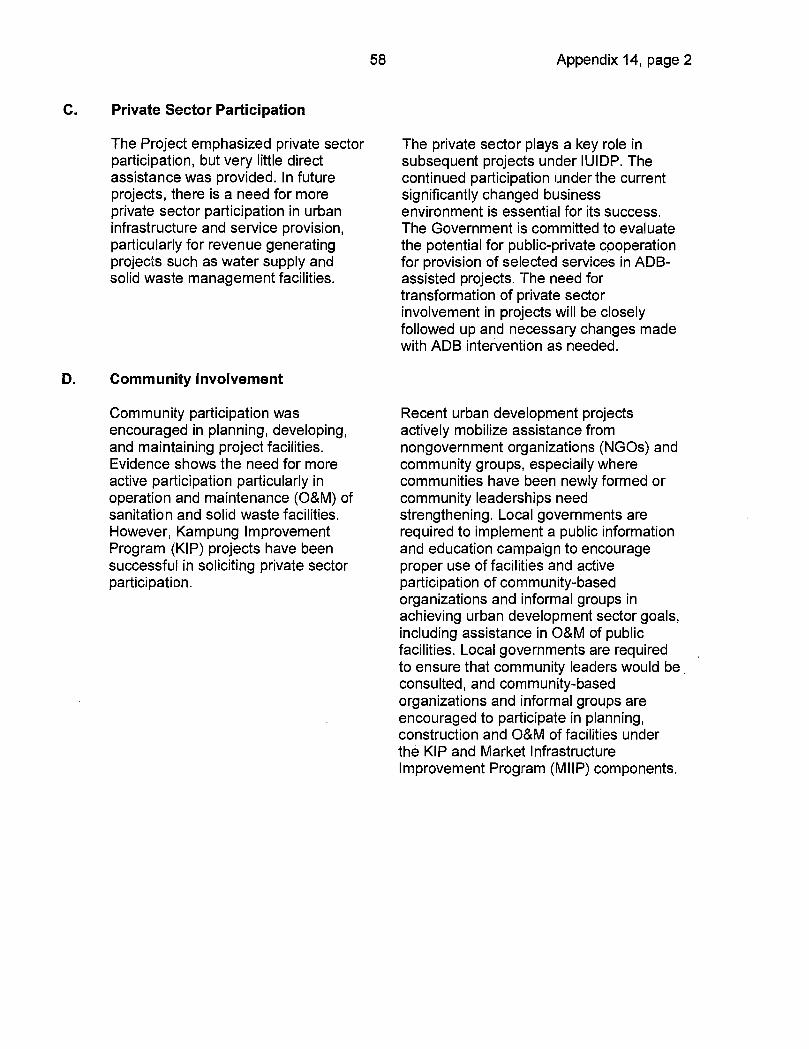
58
Appendix 14, page 2
C. Private Sector Participation
The Project emphasized private sectorparticipation, but very little directassistance was provided. In futureprojects, there is a need for moreprivate sector participation in urbaninfrastructure and service provision,particularly for revenue generatingprojects such as water supply andsolid waste management facilities.
D. Community Involvement
Community participation wasencouraged in planning, developing,and maintaining project facilities.Evidence shows the need for moreactive participation particularly inoperation and maintenance (O&M) ofsanitation and solid waste facilities.However, Kampung ImprovementProgram (KIP) projects have beensuccessful in soliciting private sectorparticipation.
The private sector plays a key role insubsequent projects under IUIDP. Thecontinued participation under the currentsignificantly changed businessenvironment is essential for its success.The Government is committed to evaluatethe potential for public-private cooperationfor provision of selected services in ADB-assisted projects. The need fortransformation of private sectorinvolvement in projects will be closelyfollowed up and necessary changes madewith ADB intervention as needed.
Recent urban development projectsactively mobilize assistance fromnongovernment organizations (NGOs) andcommunity groups, especially wherecommunities have been newly formed orcommunity leaderships needstrengthening. Local governments arerequired to implement a public informationand education campaign to encourageproper use of facilities and activeparticipation of community-basedorganizations and informal groups inachieving urban development sector goals,including assistance in O&M of publicfacilities. Local governments are requiredto ensure that community leaders would beconsulted, and community-basedorganizations and informal groups areencouraged to participate in planning,construction and O&M of facilities underthe KIP and Market InfrastructureImprovement Program (MIIP) components.

59 Appendix 14, page 3
E. Water Supply Enterprises (PDAMs)
Assistance is required for operationaland institutional improvement of theautonomous water supply enterprise(PDAMs), and the reduction ofunaccounted for water (UFW).
ADB focused on promoting operation andservice of the PDAMs through corporate
• planning, UFW reduction, economic pricingof water, and improved financialmanagement. The ongoing TA 3137-I NO:Water Supply and Sanitation SectorProject is aimed at providing institutionalstrengthening for local governments andPDAMs to implement the Government'spolicy and regulations governing PDAMs.
F. Implementation Arrangement
Revenue income improvement actionplans (RIAP5) and local institutionaldevelopment action plans (LIDAPs)were prepared for participatingagencies, but there is a need toimprove their acceptance andintegration with other managementtools.
The current standard implementationarrangements provide project managementunits (PM Us) as part of the permanentorganization setup. In subsequent projects,all participating local governments wererequired to update their RIAPs and LIDAPsto include (i) institutional strengtheningmeasures; (ii) improvement of O&M forsolid waste management, environmentalsanitation, and drainage components; • (iii)potential for public-private cooperation;and (iv) financial improvements coveringmeasures to increase tariffs for sanitationand solid waste management, includingoperating costs and debt service,'increasing revenues and collections fromfees, charges and property taxes throughregular reevaluations of property, andimproving financial, management byintroducing management accounting andreporting systems. The change in project'focus from the product to the process has,been supported by emphasizing capaoity-•,building aspects in recent ADB-assistedprojects. The project framework is used tokeep the project focus for longer termimpacts.

Subsequent urban development projectshave taken into,account affordability andthe willingness to pay by the beneficiariesto ensure, financial viability.
Subsequent urban development projects'require the establishment of O&M costestimates by local governments and theagencies as a condition for subprojectscreening. Cost recovery to support O&Mactivities is envisioned through appropriatetariffs and mobilization of the privatesector.
Components under subsequent projectsare determined based on a demandsurvey. Project monitoring will be based onsocial and economic benefits. Monitoringprograms will be improved to be morecomprehensive and will be testedregularly.
60
Appendix 14, page 4
G. Affordability
The economic and monetary crisisshould lead to a reassessment ofstandards and approaches. With lowerincome resulting from the economiccontraction, projects for immediateundertaking should be designed to bemore affordable to the beneficiaries.
O&M Activities
There is a need to institutionalizeO&M activities under the IUIDP.Consideration should be given tofollowing the principles under theperformance-oriented maintenanceand management system. Under thisprogram, local governments willinventory infrastructure facilitiesowned by them, establishmaintenance cost estimates anddetermine annual budgetsaccordingly.
[1
Project Benefits
Achievements in projectimplementation were measuredlargely in terms of physical andfinancial accomplishment instead ofbenefits actually accrued tobeneficiaries. Monitoring based on aservice delivery focus is required.Better baseline data should becollected. There should be regularfollow-up monitoring on the impact ofthe Project on its intendedbeneficiaries.
J. Environment and Health
Future projects should better addressenvironmental and health problems.
Appropriate safeguards for theenvironment have been built intosubsequent projects. These include theprotection of environmentally sensitiveareas around water sources, improving thedisposal of wastewater, controllinggroundwater extraction, and safeguardingthe interests of downstream users of springwater sources.

![Kathmandu Urban Development Project (Loan 1240-NEP[SF])](https://static.fdocuments.us/doc/165x107/577ce6d91a28abf10393be2e/kathmandu-urban-development-project-loan-1240-nepsf.jpg)


![PROJECT COMPLETION REPORT ON THE URBAN ...ASIAN DEVELOPMENT BANK PCR: VAN 23616 PROJECT COMPLETION REPORT ON THE URBAN INFRASTRUCTURE PROJECT (Loan No. 1448-VAN [SF]) TO VANUATU June](https://static.fdocuments.us/doc/165x107/60af9a4e1a7f4f59226d8ffb/project-completion-report-on-the-urban-asian-development-bank-pcr-van-23616.jpg)

