Asia Pacific Dailyasiaresearch.daiwacm.com/eg/cgi-bin/files/Daily01Jul16.pdfSee important...
29
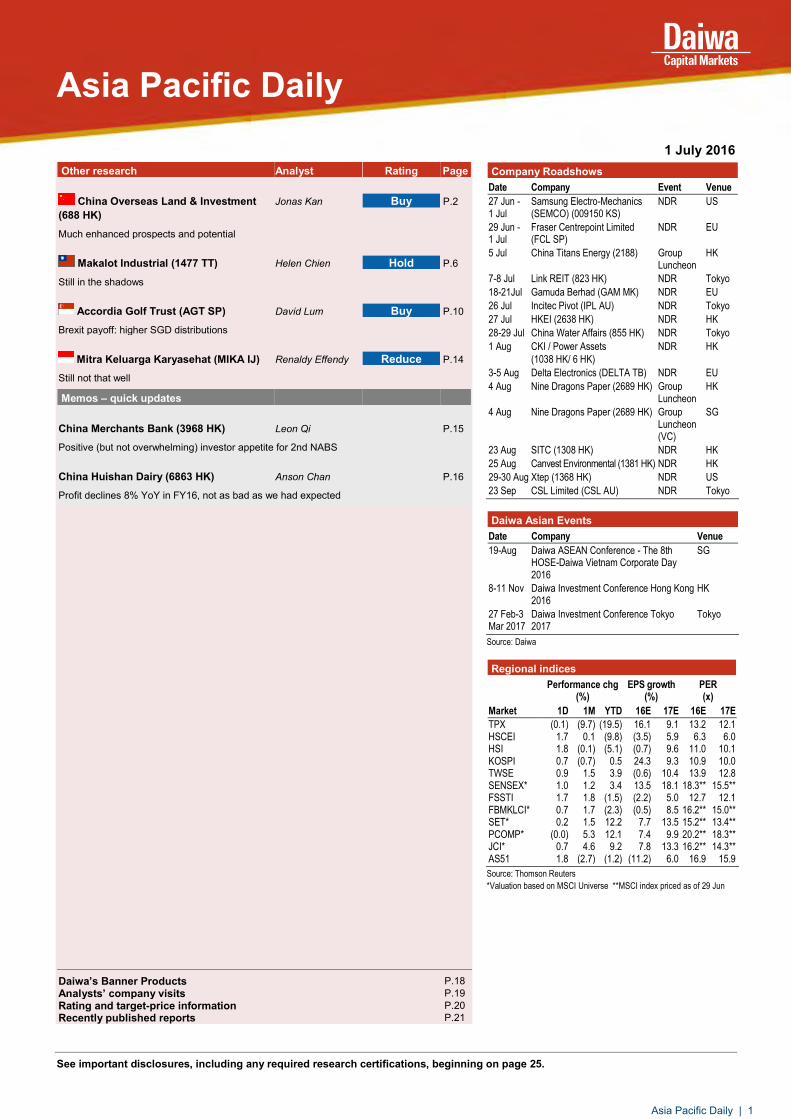
Asia Pacific Daily See important disclosures, including any required research certifications, beginning on page 25. 1 July 2016 Other research Analyst Rating Page China Overseas Land & Investment (688 HK) Jonas Kan Buy P.2 Much enhanced prospects and potential Makalot Industrial (1477 TT) Helen Chien Hold P.6 Still in the shadows Accordia Golf Trust (AGT SP) David Lum Buy P.10 Brexit payoff: higher SGD distributions Mitra Keluarga Karyasehat (MIKA IJ) Renaldy Effendy Reduce P.14 Still not that well Memos – quick updates China Merchants Bank (3968 HK) Leon Qi P.15 Positive (but not overwhelming) investor appetite for 2nd NABS China Huishan Dairy (6863 HK) Anson Chan P.16 Profit declines 8% YoY in FY16, not as bad as we had expected Daiwa’s Banner Products P.18 Analysts’ company visits P.19 Rating and target-price information P.20 Recently published reports P.21 Company Roadshows Date Company Event Venue 27 Jun - 1 Jul Samsung Electro-Mechanics (SEMCO) (009150 KS) NDR US 29 Jun - 1 Jul Fraser Centrepoint Limited (FCL SP) NDR EU 5 Jul China Titans Energy (2188) Group Luncheon HK 7-8 Jul Link REIT (823 HK) NDR Tokyo 18-21Jul Gamuda Berhad (GAM MK) NDR EU 26 Jul Incitec Pivot (IPL AU) NDR Tokyo 27 Jul HKEI (2638 HK) NDR HK 28-29 Jul China Water Affairs (855 HK) NDR Tokyo 1 Aug CKI / Power Assets (1038 HK/ 6 HK) NDR HK 3-5 Aug Delta Electronics (DELTA TB) NDR EU 4 Aug Nine Dragons Paper (2689 HK) Group Luncheon HK 4 Aug Nine Dragons Paper (2689 HK) Group Luncheon (VC) SG 23 Aug SITC (1308 HK) NDR HK 25 Aug Canvest Environmental (1381 HK) NDR HK 29-30 Aug Xtep (1368 HK) NDR US 23 Sep CSL Limited (CSL AU) NDR Tokyo Daiwa Asian Events Date Company Venue 19-Aug Daiwa ASEAN Conference - The 8th HOSE-Daiwa Vietnam Corporate Day 2016 SG 8-11 Nov Daiwa Investment Conference Hong Kong 2016 HK 27 Feb-3 Mar 2017 Daiwa Investment Conference Tokyo 2017 Tokyo Source: Daiwa Regional indices Performance chg (%) EPS growth (%) PER (x) Market 1D 1M YTD 16E 17E 16E 17E TPX (0.1) (9.7) (19.5) 16.1 9.1 13.2 12.1 HSCEI 1.7 0.1 (9.8) (3.5) 5.9 6.3 6.0 HSI 1.8 (0.1) (5.1) (0.7) 9.6 11.0 10.1 KOSPI 0.7 (0.7) 0.5 24.3 9.3 10.9 10.0 TWSE 0.9 1.5 3.9 (0.6) 10.4 13.9 12.8 SENSEX* 1.0 1.2 3.4 13.5 18.1 18.3** 15.5** FSSTI 1.7 1.8 (1.5) (2.2) 5.0 12.7 12.1 FBMKLCI* 0.7 1.7 (2.3) (0.5) 8.5 16.2** 15.0** SET* 0.2 1.5 12.2 7.7 13.5 15.2** 13.4** PCOMP* (0.0) 5.3 12.1 7.4 9.9 20.2** 18.3** JCI* 0.7 4.6 9.2 7.8 13.3 16.2** 14.3** AS51 1.8 (2.7) (1.2) (11.2) 6.0 16.9 15.9 Source: Thomson Reuters *Valuation based on MSCI Universe **MSCI index priced as of 29 Jun Asia Pacific Daily | 1
-
Upload
hoangduong -
Category
Documents
-
view
220 -
download
0
Transcript of Asia Pacific Dailyasiaresearch.daiwacm.com/eg/cgi-bin/files/Daily01Jul16.pdfSee important...
Asia Pacific Daily
See important disclosures, including any required research certifications, beginning on page 25.
1 July 2016 Other research Analyst Rating Page
China Overseas Land & Investment (688 HK)
Jonas Kan Buy P.2
Much enhanced prospects and potential
Makalot Industrial (1477 TT) Helen Chien Hold P.6
Still in the shadows
Accordia Golf Trust (AGT SP) David Lum Buy P.10
Brexit payoff: higher SGD distributions
Mitra Keluarga Karyasehat (MIKA IJ) Renaldy Effendy Reduce P.14
Still not that well Memos – quick updates
China Merchants Bank (3968 HK) Leon Qi P.15
Positive (but not overwhelming) investor appetite for 2nd NABS
China Huishan Dairy (6863 HK) Anson Chan P.16
Profit declines 8% YoY in FY16, not as bad as we had expected
Daiwa’s Banner Products P.18 Analysts’ company visits P.19 Rating and target-price information P.20 Recently published reports P.21
Company Roadshows Date Company Event Venue
27 Jun - 1 Jul
Samsung Electro-Mechanics (SEMCO) (009150 KS)
NDR US
29 Jun - 1 Jul
Fraser Centrepoint Limited (FCL SP)
NDR EU
5 Jul China Titans Energy (2188) Group Luncheon
HK
7-8 Jul Link REIT (823 HK) NDR Tokyo
18-21Jul Gamuda Berhad (GAM MK) NDR EU
26 Jul Incitec Pivot (IPL AU) NDR Tokyo
27 Jul HKEI (2638 HK) NDR HK
28-29 Jul China Water Affairs (855 HK) NDR Tokyo
1 Aug CKI / Power Assets
(1038 HK/ 6 HK)
NDR HK
3-5 Aug Delta Electronics (DELTA TB) NDR EU
4 Aug Nine Dragons Paper (2689 HK) Group Luncheon
HK
4 Aug Nine Dragons Paper (2689 HK) Group Luncheon (VC)
SG
23 Aug SITC (1308 HK) NDR HK
25 Aug Canvest Environmental (1381 HK) NDR HK
29-30 Aug Xtep (1368 HK) NDR US
23 Sep CSL Limited (CSL AU) NDR Tokyo
Daiwa Asian Events Date Company Venue
19-Aug Daiwa ASEAN Conference - The 8th HOSE-Daiwa Vietnam Corporate Day 2016
SG
8-11 Nov Daiwa Investment Conference Hong Kong 2016
HK
27 Feb-3 Mar 2017
Daiwa Investment Conference Tokyo 2017
Tokyo
Source: Daiwa
Regional indices
Performance chg (%)
EPS growth (%)
PER (x)
Market 1D 1M YTD 16E 17E 16E 17E
TPX (0.1) (9.7) (19.5) 16.1 9.1 13.2 12.1 HSCEI 1.7 0.1 (9.8) (3.5) 5.9 6.3 6.0 HSI 1.8 (0.1) (5.1) (0.7) 9.6 11.0 10.1 KOSPI 0.7 (0.7) 0.5 24.3 9.3 10.9 10.0 TWSE 0.9 1.5 3.9 (0.6) 10.4 13.9 12.8 SENSEX* 1.0 1.2 3.4 13.5 18.1 18.3** 15.5** FSSTI 1.7 1.8 (1.5) (2.2) 5.0 12.7 12.1 FBMKLCI* 0.7 1.7 (2.3) (0.5) 8.5 16.2** 15.0** SET* 0.2 1.5 12.2 7.7 13.5 15.2** 13.4** PCOMP* (0.0) 5.3 12.1 7.4 9.9 20.2** 18.3** JCI* 0.7 4.6 9.2 7.8 13.3 16.2** 14.3** AS51 1.8 (2.7) (1.2) (11.2) 6.0 16.9 15.9
Source: Thomson Reuters
*Valuation based on MSCI Universe **MSCI index priced as of 29 Jun
Asia Pacific Daily | 1

See important disclosures, including any required research certifications, beginning on page 5
China Financials
What's new: We attended an analyst meeting organised by China Overseas Land & Investment (COLI) on the Circular it has just released related to its planned acquisition of CITIC’s property assets. The meeting reinforced our view that this is an important strategic deal which will further strengthen COLI’s long-term potential in the China property sector. What's the impact: Notably strengthened potential in various key markets. We see as positive that the actual size of CITIC’s landbank (31.6m sq m gross) has turned out to be larger than the figure announced in March 2016 (24m sq m gross) and that CITIC also has sizeable landbank in COLI’s major markets. Effectively, the deal will boost COLI’s landbank in 10 major cities (the 4 tier-1 cities plus Tianjin, Dalian, Qingdao, Suzhou, Foshan, Chengdu) by 1.4x to 14m sq m, thereby making it an even stronger player in these cities. End-2016E NAV revised up. We now factor in only a moderate new contribution from CITIC’s projects, but see room for stronger earnings and NAV uplift if COLI can quickly realise the full value of CITIC’s landbank and the synergies it could bring to its existing operation. Overall, we are revising up our 2016-18E EPS by 1-8%. In terms of NAV, we are revising up our end-2016E NAV by 3.1% to HKD39.80. While we estimate COLI’s net gearing ratio will rise from 6.8% at end-2015 to 36% post transaction, we see 36% as still a manageable level. Greatest significance is at the strategic level and relating to long-term prospects. We see this deal as a major M&A deal in China property in that it is about realising the value associated with a strong, efficient and low-financing cost player merging with another one at a comparable scale, but scores lower in all these metrics (see p.2); and we think there could be many such opportunities in China property in the years to come. Our read is that CITIC has highly valued the long-term benefits associated with having a major stake in COLI and we think this also highlights the “currency value” that could be commanded by the stronger players in China property. In all, we believe M&A will become an important supplementary driver for COLI’s earnings and business growth in the years ahead. What we recommend: We reiterate our Buy (1) rating and raise our 12-month TP to HKD31.80 (from HKD30.90), based on an unchanged 20% discount applied to our revised end-2016E NAV of HKD39.80. The key risk to our call is the deal not getting approval from the Chinese Government. How we differ: We believe COLI has now opened up M&A as a new growth engine, but this may have yet to be recognised by the market.
30 June 2016
Much enhanced prospects and potential
CITIC deal should notably strengthen COLI’s potential in key markets We view it as a major M&A deal in China property TP raised 3% to HKD31.80; end-2016E NAV now HKD39.80
Source: Daiwa forecasts
Source: FactSet, Daiwa forecasts
China Overseas Land & Investment (688 HK)
Target price: HKD31.80 (from HKD30.90)
Share price (29 Jun): HKD23.05 | Up/downside: +37.9%
Jonas Kan, CFA(852) 2848 4439
Forecast revisions (%)Year to 31 Dec 16E 17E 18E
Revenue change 6.8 7.5 8.7
Net profit change 1.3 4.4 7.8
Core EPS (FD) change 1.3 4.4 7.8
90
99
108
116
125
20
22
24
26
28
Jun-15 Sep-15 Dec-15 Mar-16 Jun-16
Share price performance
Ch Ov Land (LHS) Relative to HSI (RHS)
(HKD) (%)
12-month range 20.65-27.65
Market cap (USDbn) 32.54
3m avg daily turnover (USDm) 53.08
Shares outstanding (m) 10,956
Major shareholder China Overseas Holdings (55.1%)
Financial summary (HKD)Year to 31 Dec 16E 17E 18E
Revenue (m) 173,390 204,251 232,658
Operating profit (m) 48,753 58,116 66,753
Net profit (m) 33,870 39,530 45,020
Core EPS (fully-diluted) 3.091 3.608 4.109
EPS change (%) 10.6 16.7 13.9
Daiwa vs Cons. EPS (%) (7.2) (4.6) (2.6)
PER (x) 7.5 6.4 5.6
Dividend yield (%) 2.9 3.1 3.4
DPS 0.660 0.720 0.790
PBR (x) 1.0 0.9 0.8
EV/EBITDA (x) 6.5 5.4 4.6
ROE (%) 15.5 15.1 15.2
Asia Pacific Daily | 2
2
China Overseas Land & Investment (688 HK): 30 June 2016
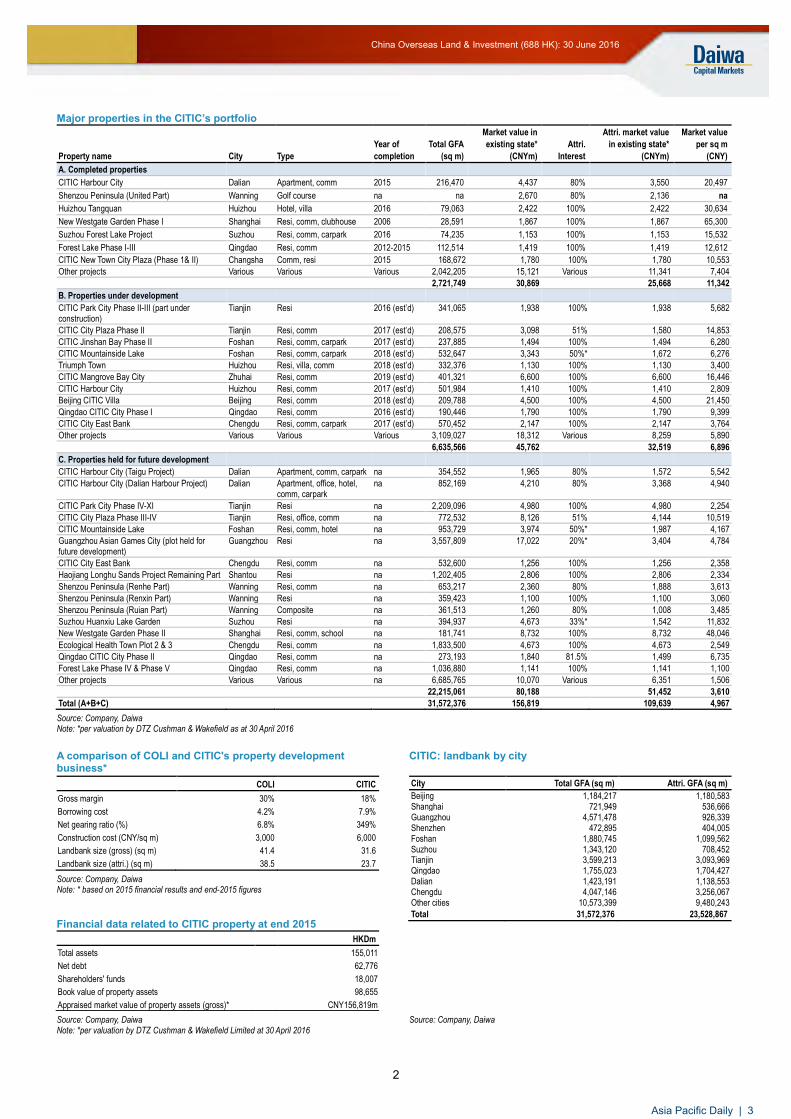
Major properties in the CITIC’s portfolio
Market value in Attri. market value Market value
Year of Total GFA existing state* Attri. in existing state* per sq m
Property name City Type completion (sq m) (CNYm) Interest (CNYm) (CNY)
A. Completed properties
CITIC Harbour City Dalian Apartment, comm 2015 216,470 4,437 80% 3,550 20,497
Shenzou Peninsula (United Part) Wanning Golf course na na 2,670 80% 2,136 na
Huizhou Tangquan Huizhou Hotel, villa 2016 79,063 2,422 100% 2,422 30,634
New Westgate Garden Phase I Shanghai Resi, comm, clubhouse 2006 28,591 1,867 100% 1,867 65,300
Suzhou Forest Lake Project Suzhou Resi, comm, carpark 2016 74,235 1,153 100% 1,153 15,532
Forest Lake Phase I-III Qingdao Resi, comm 2012-2015 112,514 1,419 100% 1,419 12,612
CITIC New Town City Plaza (Phase 1& II) Changsha Comm, resi 2015 168,672 1,780 100% 1,780 10,553
Other projects Various Various Various 2,042,205 15,121 Various 11,341 7,404
2,721,749 30,869 25,668 11,342
B. Properties under development
CITIC Park City Phase II-III (part under construction)
Tianjin Resi 2016 (est’d) 341,065 1,938 100% 1,938 5,682
CITIC City Plaza Phase II Tianjin Resi, comm 2017 (est’d) 208,575 3,098 51% 1,580 14,853
CITIC Jinshan Bay Phase II Foshan Resi, comm, carpark 2017 (est’d) 237,885 1,494 100% 1,494 6,280
CITIC Mountainside Lake Foshan Resi, comm, carpark 2018 (est’d) 532,647 3,343 50%* 1,672 6,276
Triumph Town Huizhou Resi, villa, comm 2018 (est’d) 332,376 1,130 100% 1,130 3,400
CITIC Mangrove Bay City Zhuhai Resi, comm 2019 (est’d) 401,321 6,600 100% 6,600 16,446
CITIC Harbour City Huizhou Resi, comm 2017 (est’d) 501,984 1,410 100% 1,410 2,809
Beijing CITIC Villa Beijing Resi, comm 2018 (est’d) 209,788 4,500 100% 4,500 21,450
Qingdao CITIC City Phase I Qingdao Resi, comm 2016 (est’d) 190,446 1,790 100% 1,790 9,399
CITIC City East Bank Chengdu Resi, comm, carpark 2017 (est’d) 570,452 2,147 100% 2,147 3,764
Other projects Various Various Various 3,109,027 18,312 Various 8,259 5,890
6,635,566 45,762 32,519 6,896
C. Properties held for future development
CITIC Harbour City (Taigu Project) Dalian Apartment, comm, carpark na 354,552 1,965 80% 1,572 5,542
CITIC Harbour City (Dalian Harbour Project) Dalian Apartment, office, hotel, comm, carpark
na 852,169 4,210 80% 3,368 4,940
CITIC Park City Phase IV-XI Tianjin Resi na 2,209,096 4,980 100% 4,980 2,254
CITIC City Plaza Phase III-IV Tianjin Resi, office, comm na 772,532 8,126 51% 4,144 10,519
CITIC Mountainside Lake Foshan Resi, comm, hotel na 953,729 3,974 50%* 1,987 4,167
Guangzhou Asian Games City (plot held for future development)
Guangzhou Resi na 3,557,809 17,022 20%* 3,404 4,784
CITIC City East Bank Chengdu Resi, comm na 532,600 1,256 100% 1,256 2,358
Haojiang Longhu Sands Project Remaining Part Shantou Resi na 1,202,405 2,806 100% 2,806 2,334
Shenzou Peninsula (Renhe Part) Wanning Resi, comm na 653,217 2,360 80% 1,888 3,613
Shenzou Peninsula (Renxin Part) Wanning Resi na 359,423 1,100 100% 1,100 3,060
Shenzou Peninsula (Ruian Part) Wanning Composite na 361,513 1,260 80% 1,008 3,485
Suzhou Huanxiu Lake Garden Suzhou Resi na 394,937 4,673 33%* 1,542 11,832
New Westgate Garden Phase II Shanghai Resi, comm, school na 181,741 8,732 100% 8,732 48,046
Ecological Health Town Plot 2 & 3 Chengdu Resi, comm na 1,833,500 4,673 100% 4,673 2,549
Qingdao CITIC City Phase II Qingdao Resi, comm na 273,193 1,840 81.5% 1,499 6,735
Forest Lake Phase IV & Phase V Qingdao Resi, comm na 1,036,880 1,141 100% 1,141 1,100
Other projects Various Various na 6,685,765 10,070 Various 6,351 1,506
22,215,061 80,188 51,452 3,610
Total (A+B+C) 31,572,376 156,819 109,639 4,967
Source: Company, Daiwa Note: *per valuation by DTZ Cushman & Wakefield as at 30 April 2016
A comparison of COLI and CITIC's property development business*
CITIC: landbank by city
COLI CITIC
Gross margin 30% 18%
Borrowing cost 4.2% 7.9%
Net gearing ratio (%) 6.8% 349%
Construction cost (CNY/sq m) 3,000 6,000
Landbank size (gross) (sq m) 41.4 31.6
Landbank size (attri.) (sq m) 38.5 23.7
Source: Company, Daiwa Note: * based on 2015 financial results and end-2015 figures
Financial data related to CITIC property at end 2015
HKDm
Total assets 155,011
Net debt 62,776
Shareholders' funds 18,007
Book value of property assets 98,655
Appraised market value of property assets (gross)* CNY156,819m
City Total GFA (sq m) Attri. GFA (sq m)
Beijing 1,184,217 1,180,583 Shanghai 721,949 536,666 Guangzhou 4,571,478 926,339 Shenzhen 472,895 404,005 Foshan 1,880,745 1,099,562 Suzhou 1,343,120 708,452 Tianjin 3,599,213 3,093,969 Qingdao 1,755,023 1,704,427 Dalian 1,423,191 1,138,553 Chengdu 4,047,146 3,256,067 Other cities 10,573,399 9,480,243
Total 31,572,376 23,528,867
Source: Company, Daiwa Note: *per valuation by DTZ Cushman & Wakefield Limited at 30 April 2016
Source: Company, Daiwa
Asia Pacific Daily | 3

3
China Overseas Land & Investment (688 HK): 30 June 2016
Financial summary Key assumptions
Profit and loss (HKDm)
Cash flow (HKDm)
Source: FactSet, Daiwa forecasts
Year to 31 Dec 2011 2012 2013 2014 2015 2016E 2017E 2018E
Recognized sales vol. ('000 sq m GFA) 4,290 5,400 6,628 7,780 12,260 14,300 16,800 19,000
Completed investment properties (m sq
ft)4 5 7 14 19 20 22 24
Gross rental income (HKDm) 373 585 858 1,643 1,915 2,280 2,560 2,890
Year to 31 Dec 2011 2012 2013 2014 2015 2016E 2017E 2018E
Property development 49,432 61,407 78,615 134,022 143,695 167,849 198,312 226,318
Property rental 373 585 858 1,643 1,915 2,280 2,560 2,890
Other Revenue 1,527 2,589 2,996 2,840 2,464 3,261 3,379 3,450
Total Revenue 51,332 64,581 82,469 138,505 148,074 173,390 204,251 232,658
Other income 1,109 225 904 2,651 2,877 1,650 1,680 1,720
COGS (30,660) (39,855) (55,647) (99,196) (105,763) (121,049) (141,953) (161,463)
SG&A (1,177) (1,124) (1,486) (1,933) (2,182) (2,722) (3,103) (3,215)
Other op.expenses (720) (912) (1,331) (2,057) (2,031) (2,516) (2,759) (2,947)
Operating profit 19,884 22,914 24,909 37,970 40,975 48,753 58,116 66,753
Net-interest inc./(exp.) (106) 220 (290) (545) (574) (584) (626) (689)
Assoc/forex/extraord./others 3,988 6,288 3,773 1,261 977 4,998 4,666 5,850
Pre-tax profit 23,765 29,422 28,392 38,686 41,378 53,167 62,156 71,914
Tax (8,207) (10,590) (9,297) (15,163) (13,077) (18,756) (22,063) (26,304)
Min. int./pref. div./others (94) (110) (135) (551) (739) (541) (563) (590)
Net profit (reported) 15,464 18,722 18,960 22,972 27,562 33,870 39,530 45,020
Net profit (adjusted) 13,020 15,800 18,960 22,972 27,562 33,870 39,530 45,020
EPS (reported)(HKD) 1.892 2.291 2.320 2.811 2.795 3.091 3.608 4.109
EPS (adjusted)(HKD) 1.593 1.933 2.320 2.811 2.795 3.091 3.608 4.109
EPS (adjusted fully-diluted)(HKD) 1.595 1.936 2.320 2.811 2.795 3.091 3.608 4.109
DPS (HKD) 0.330 0.410 0.470 0.550 0.610 0.660 0.720 0.790
EBIT 19,884 22,914 24,909 37,970 40,975 48,753 58,116 66,753
EBITDA 19,942 22,984 24,993 38,061 41,070 48,853 58,219 66,860
Year to 31 Dec 2011 2012 2013 2014 2015 2016E 2017E 2018E
Profit before tax 23,765 29,422 28,392 38,686 41,378 53,167 62,156 71,914
Depreciation and amortisation 58 70 84 91 95 100 103 107
Tax paid (8,308) (11,225) (8,367) (13,647) (11,769) (16,880) (19,857) (23,674)
Change in working capital (4,604) (8,543) 2,315 7,680 39,621 11,230 11,850 11,850
Other operational CF items (3,696) 2,212 (747) 795 996 (983) (775) (1,304)
Cash flow from operations 7,216 11,936 21,677 33,605 70,320 46,634 53,477 58,893
Capex (164) (172) (30,145) (33,973) (81,326) (127,210) (42,960) (46,960)
Net (acquisitions)/disposals (8,625) (7,346) 0 0 0 0 0 0
Other investing CF items 0 0 0 0 0 0 0 0
Cash flow from investing (8,788) (7,518) (30,145) (33,973) (81,326) (127,210) (42,960) (46,960)
Change in debt 7,482 2,518 0 0 0 0 0 0
Net share issues/(repurchases) 0 0 0 0 42,806 29,724 0 0
Dividends paid (2,585) (3,157) (3,678) (4,495) (5,916) (7,231) (7,998) (8,655)
Other financing CF items (990) (1,362) (1,236) (1,358) (1,383) (1,380) (1,380) (1,380)
Cash flow from financing 3,907 (2,001) (4,913) (5,853) 35,507 21,113 (9,378) (10,035)
Forex effect/others 0 0 0 0 0 0 0 0
Change in cash 2,335 2,417 (13,381) (6,221) 24,501 (59,464) 1,139 1,898
Free cash flow 7,052 11,765 (8,467) (368) (11,006) (80,576) 10,517 11,933
Asia Pacific Daily | 4
4
China Overseas Land & Investment (688 HK): 30 June 2016
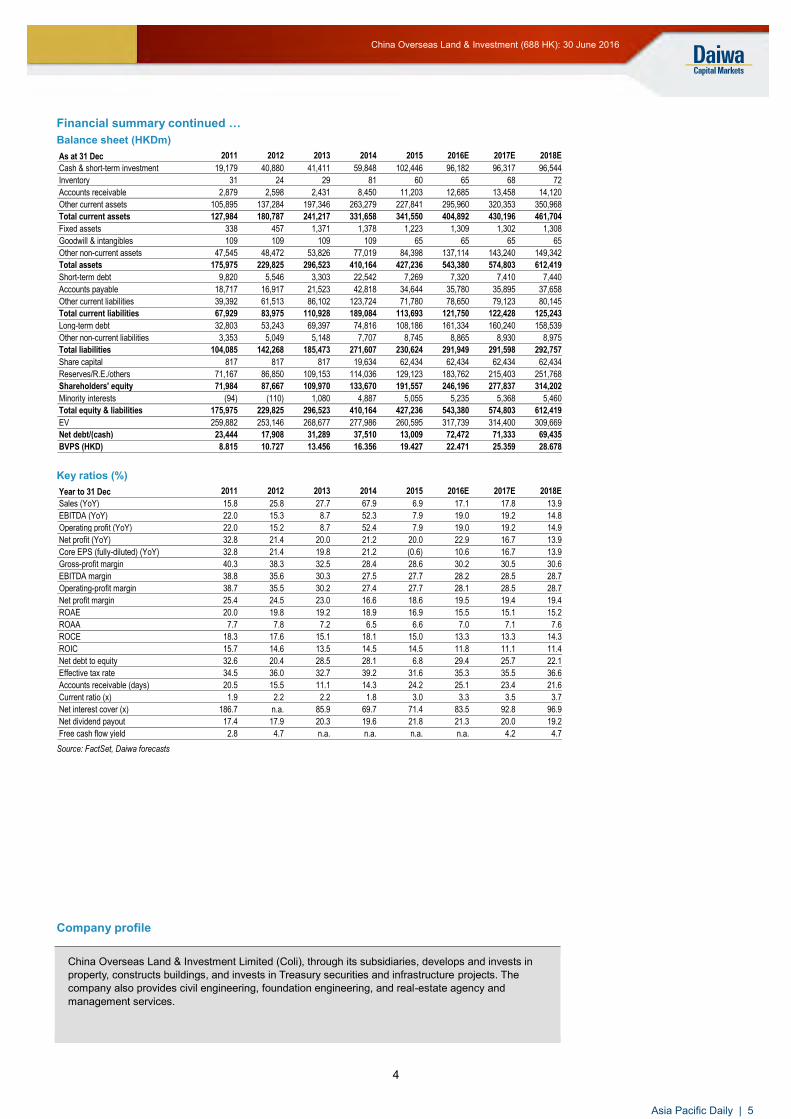
Financial summary continued … Balance sheet (HKDm)
Key ratios (%)
Source: FactSet, Daiwa forecasts
As at 31 Dec 2011 2012 2013 2014 2015 2016E 2017E 2018E
Cash & short-term investment 19,179 40,880 41,411 59,848 102,446 96,182 96,317 96,544
Inventory 31 24 29 81 60 65 68 72
Accounts receivable 2,879 2,598 2,431 8,450 11,203 12,685 13,458 14,120
Other current assets 105,895 137,284 197,346 263,279 227,841 295,960 320,353 350,968
Total current assets 127,984 180,787 241,217 331,658 341,550 404,892 430,196 461,704
Fixed assets 338 457 1,371 1,378 1,223 1,309 1,302 1,308
Goodwill & intangibles 109 109 109 109 65 65 65 65
Other non-current assets 47,545 48,472 53,826 77,019 84,398 137,114 143,240 149,342
Total assets 175,975 229,825 296,523 410,164 427,236 543,380 574,803 612,419
Short-term debt 9,820 5,546 3,303 22,542 7,269 7,320 7,410 7,440
Accounts payable 18,717 16,917 21,523 42,818 34,644 35,780 35,895 37,658
Other current liabilities 39,392 61,513 86,102 123,724 71,780 78,650 79,123 80,145
Total current liabilities 67,929 83,975 110,928 189,084 113,693 121,750 122,428 125,243
Long-term debt 32,803 53,243 69,397 74,816 108,186 161,334 160,240 158,539
Other non-current liabilities 3,353 5,049 5,148 7,707 8,745 8,865 8,930 8,975
Total liabilities 104,085 142,268 185,473 271,607 230,624 291,949 291,598 292,757
Share capital 817 817 817 19,634 62,434 62,434 62,434 62,434
Reserves/R.E./others 71,167 86,850 109,153 114,036 129,123 183,762 215,403 251,768
Shareholders' equity 71,984 87,667 109,970 133,670 191,557 246,196 277,837 314,202
Minority interests (94) (110) 1,080 4,887 5,055 5,235 5,368 5,460
Total equity & liabilities 175,975 229,825 296,523 410,164 427,236 543,380 574,803 612,419
EV 259,882 253,146 268,677 277,986 260,595 317,739 314,400 309,669
Net debt/(cash) 23,444 17,908 31,289 37,510 13,009 72,472 71,333 69,435
BVPS (HKD) 8.815 10.727 13.456 16.356 19.427 22.471 25.359 28.678
Year to 31 Dec 2011 2012 2013 2014 2015 2016E 2017E 2018E
Sales (YoY) 15.8 25.8 27.7 67.9 6.9 17.1 17.8 13.9
EBITDA (YoY) 22.0 15.3 8.7 52.3 7.9 19.0 19.2 14.8
Operating profit (YoY) 22.0 15.2 8.7 52.4 7.9 19.0 19.2 14.9
Net profit (YoY) 32.8 21.4 20.0 21.2 20.0 22.9 16.7 13.9
Core EPS (fully-diluted) (YoY) 32.8 21.4 19.8 21.2 (0.6) 10.6 16.7 13.9
Gross-profit margin 40.3 38.3 32.5 28.4 28.6 30.2 30.5 30.6
EBITDA margin 38.8 35.6 30.3 27.5 27.7 28.2 28.5 28.7
Operating-profit margin 38.7 35.5 30.2 27.4 27.7 28.1 28.5 28.7
Net profit margin 25.4 24.5 23.0 16.6 18.6 19.5 19.4 19.4
ROAE 20.0 19.8 19.2 18.9 16.9 15.5 15.1 15.2
ROAA 7.7 7.8 7.2 6.5 6.6 7.0 7.1 7.6
ROCE 18.3 17.6 15.1 18.1 15.0 13.3 13.3 14.3
ROIC 15.7 14.6 13.5 14.5 14.5 11.8 11.1 11.4
Net debt to equity 32.6 20.4 28.5 28.1 6.8 29.4 25.7 22.1
Effective tax rate 34.5 36.0 32.7 39.2 31.6 35.3 35.5 36.6
Accounts receivable (days) 20.5 15.5 11.1 14.3 24.2 25.1 23.4 21.6
Current ratio (x) 1.9 2.2 2.2 1.8 3.0 3.3 3.5 3.7
Net interest cover (x) 186.7 n.a. 85.9 69.7 71.4 83.5 92.8 96.9
Net dividend payout 17.4 17.9 20.3 19.6 21.8 21.3 20.0 19.2
Free cash flow yield 2.8 4.7 n.a. n.a. n.a. n.a. 4.2 4.7
Company profile
China Overseas Land & Investment Limited (Coli), through its subsidiaries, develops and invests in property, constructs buildings, and invests in Treasury securities and infrastructure projects. The company also provides civil engineering, foundation engineering, and real-estate agency and management services.
Asia Pacific Daily | 5

See important disclosures, including any required research certifications, beginning on page 5
Taiwan Consumer Discretionary
What's new: We had a call with Makalot’s management on 30 June to get an update on its business outlook for 2H16. We expect the headwinds in its mass market products segment to continue, on lower orders from Kohl’s, Target, etc. However, we expect orders for its sportswear segment to keep growing on increased orders from Gap group, Under Armour and its other clients. What's the impact: Mass market orders still suffering, but sportswear orders should grow faster. We now forecast orders from Kohl’s and Target to decline by 15-20% YoY in 2016 (vs. previous forecast of 5-10% YoY decline) on softer end demand. However, we now expect 20% of its 2016 total revenue from sportswear orders (previously 18%), translating into 70% YoY revenue growth in 2016, up from 12% in 2015, on orders from Under Armour (golf and running series), Gap fit and Old Navy active. Focusing on shipment growth in 2H16. Given the weak industry outlook, Makalot now targets to focus on shipment growth in 2H16 instead of ASP growth. Besides, we expect the likely 8 new clients on its 2016 order book, including Joe Fresh (Canada-based), Oakley (US), SanMar (US), Cabela’s (US), along with a Japanese and a US client, and two potential pure sportswear clients to offset some of the order decline from its existing clients in the mass market segment. New JV plant in 2H16 should help tap the upstream space. Makalot plans to set up a second JV fabric mill in Vietnam (targets to start mass production in October 2016), which would focus on synthetic knitted base fabric for performance sportswear, to grow its sportswear segment. Earnings revisions. We cut our 2016-18E revenue by 5.6-7.3% and net profit by 13.0-16.0% as we factor in weaker-than-expected demand from mass market products and rush orders; the gross margin is likely to suffer from lower utilisation and low ASP orders. What we recommend: We reiterate our Hold (3) rating on Makalot but cut our 12-month target price to TWD142 (from TWD170). Our new TP is based on a 2016-17E EPS (previously 2016E EPS) and PER of 15x (from 16x), which is below the stock’s past 5-year average PER of 18x, ranging at 11-29x. We expect improving ROE (19.8-25.5% over 2016-18E) and dividend yields (5.0-6.9% over 2016-18E) to provide a floor for the shares. Key upside/downside risks: better/worse-than-expected sales growth from its main clients. How we differ: Our 2016-18E EPS are 10.1-17.2% below consensus, as we are less positive on Makalot’s gross margin expansion in 2016-18.
30 June 2016
Still in the shadows
Overall demand from mass market products continues to be weak… …however, sportswear orders remain solid Reiterating our Hold (3) rating; lowering TP to TWD142
Source: Daiwa forecasts
Source: FactSet, Daiwa forecasts
Makalot Industrial (1477 TT)
Target price: TWD142.00 (from TWD170.00)
Share price (30 Jun): TWD150.50 | Up/downside: -5.6%
Helen Chien(886) 2 8758 6254
Forecast revisions (%)Year to 31 Dec 16E 17E 18E
Revenue change (5.6) (7.3) (7.3)
Net profit change (16.0) (15.9) (13.0)
Core EPS (FD) change (16.1) (16.0) (13.1)
60
80
100
120
140
140
178
215
253
290
Jun-15 Sep-15 Dec-15 Mar-16 Jun-16
Share price performance
Makalot In (LHS)Relative to TWSE Index (RHS)
(TWD) (%)
12-month range 141.50-289.50
Market cap (USDbn) 0.92
3m avg daily turnover (USDm) 8.58
Shares outstanding (m) 198
Major shareholder Li-Pian Zhou (Chairman) (4.0%)
Financial summary (TWD)Year to 31 Dec 16E 17E 18E
Revenue (m) 23,583 25,233 27,757
Operating profit (m) 2,145 2,547 2,996
Net profit (m) 1,753 2,051 2,439
Core EPS (fully-diluted) 8.631 10.102 12.010
EPS change (%) (18.9) 17.0 18.9
Daiwa vs Cons. EPS (%) (17.2) (14.9) (10.1)
PER (x) 17.4 14.9 12.5
Dividend yield (%) 5.0 5.8 6.9
DPS 7.5 8.8 10.4
PBR (x) 3.5 3.3 3.0
EV/EBITDA (x) 10.2 8.5 7.2
ROE (%) 19.8 23.0 25.5
Asia Pacific Daily | 6
2
Makalot Industrial (1477 TT): 30 June 2016
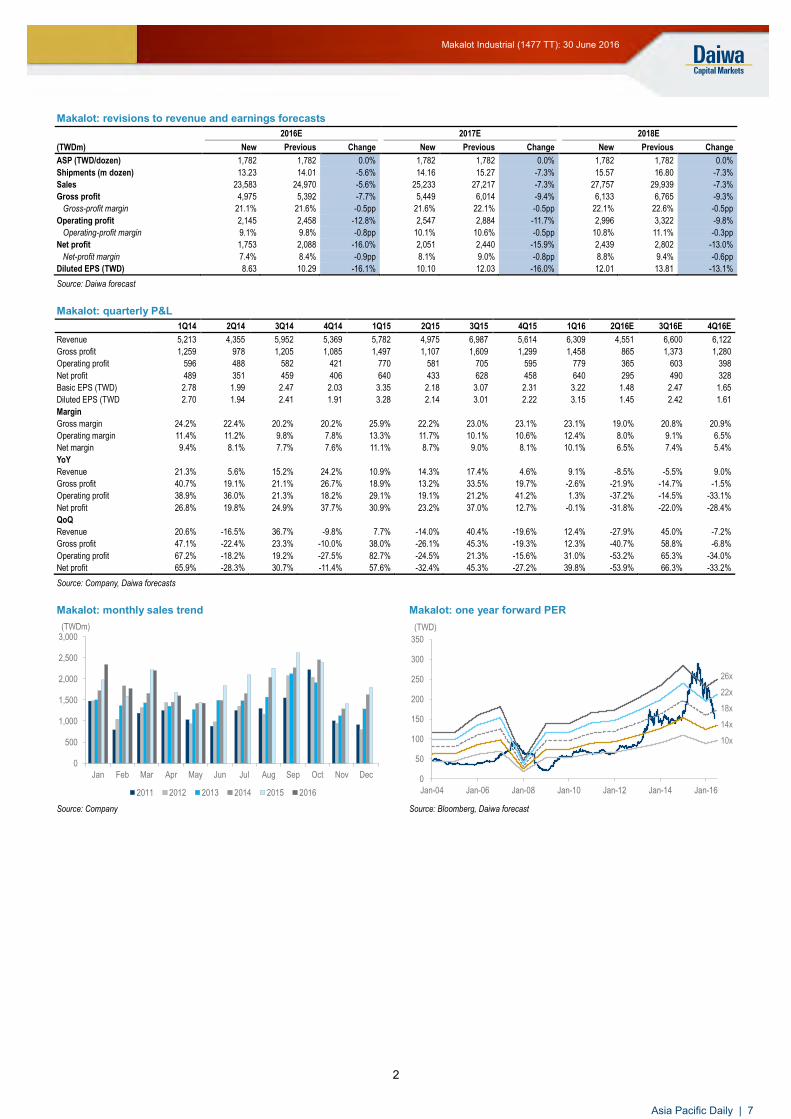
Makalot: revisions to revenue and earnings forecasts
2016E 2017E 2018E
(TWDm) New Previous Change New Previous Change New Previous Change
ASP (TWD/dozen) 1,782 1,782 0.0% 1,782 1,782 0.0% 1,782 1,782 0.0%
Shipments (m dozen) 13.23 14.01 -5.6% 14.16 15.27 -7.3% 15.57 16.80 -7.3%
Sales 23,583 24,970 -5.6% 25,233 27,217 -7.3% 27,757 29,939 -7.3%
Gross profit 4,975 5,392 -7.7% 5,449 6,014 -9.4% 6,133 6,765 -9.3%
Gross-profit margin 21.1% 21.6% -0.5pp 21.6% 22.1% -0.5pp 22.1% 22.6% -0.5pp
Operating profit 2,145 2,458 -12.8% 2,547 2,884 -11.7% 2,996 3,322 -9.8%
Operating-profit margin 9.1% 9.8% -0.8pp 10.1% 10.6% -0.5pp 10.8% 11.1% -0.3pp
Net profit 1,753 2,088 -16.0% 2,051 2,440 -15.9% 2,439 2,802 -13.0%
Net-profit margin 7.4% 8.4% -0.9pp 8.1% 9.0% -0.8pp 8.8% 9.4% -0.6pp
Diluted EPS (TWD) 8.63 10.29 -16.1% 10.10 12.03 -16.0% 12.01 13.81 -13.1%
Source: Daiwa forecast
Makalot: quarterly P&L
1Q14 2Q14 3Q14 4Q14 1Q15 2Q15 3Q15 4Q15 1Q16 2Q16E 3Q16E 4Q16E
Revenue 5,213 4,355 5,952 5,369 5,782 4,975 6,987 5,614 6,309 4,551 6,600 6,122
Gross profit 1,259 978 1,205 1,085 1,497 1,107 1,609 1,299 1,458 865 1,373 1,280
Operating profit 596 488 582 421 770 581 705 595 779 365 603 398
Net profit 489 351 459 406 640 433 628 458 640 295 490 328
Basic EPS (TWD) 2.78 1.99 2.47 2.03 3.35 2.18 3.07 2.31 3.22 1.48 2.47 1.65
Diluted EPS (TWD 2.70 1.94 2.41 1.91 3.28 2.14 3.01 2.22 3.15 1.45 2.42 1.61
Margin
Gross margin 24.2% 22.4% 20.2% 20.2% 25.9% 22.2% 23.0% 23.1% 23.1% 19.0% 20.8% 20.9%
Operating margin 11.4% 11.2% 9.8% 7.8% 13.3% 11.7% 10.1% 10.6% 12.4% 8.0% 9.1% 6.5%
Net margin 9.4% 8.1% 7.7% 7.6% 11.1% 8.7% 9.0% 8.1% 10.1% 6.5% 7.4% 5.4%
YoY
Revenue 21.3% 5.6% 15.2% 24.2% 10.9% 14.3% 17.4% 4.6% 9.1% -8.5% -5.5% 9.0%
Gross profit 40.7% 19.1% 21.1% 26.7% 18.9% 13.2% 33.5% 19.7% -2.6% -21.9% -14.7% -1.5%
Operating profit 38.9% 36.0% 21.3% 18.2% 29.1% 19.1% 21.2% 41.2% 1.3% -37.2% -14.5% -33.1%
Net profit 26.8% 19.8% 24.9% 37.7% 30.9% 23.2% 37.0% 12.7% -0.1% -31.8% -22.0% -28.4%
QoQ
Revenue 20.6% -16.5% 36.7% -9.8% 7.7% -14.0% 40.4% -19.6% 12.4% -27.9% 45.0% -7.2%
Gross profit 47.1% -22.4% 23.3% -10.0% 38.0% -26.1% 45.3% -19.3% 12.3% -40.7% 58.8% -6.8%
Operating profit 67.2% -18.2% 19.2% -27.5% 82.7% -24.5% 21.3% -15.6% 31.0% -53.2% 65.3% -34.0%
Net profit 65.9% -28.3% 30.7% -11.4% 57.6% -32.4% 45.3% -27.2% 39.8% -53.9% 66.3% -33.2%
Source: Company, Daiwa forecasts
Makalot: monthly sales trend Makalot: one year forward PER
Source: Company Source: Bloomberg, Daiwa forecast
0
500
1,000
1,500
2,000
2,500
3,000
Jan Feb Mar Apr May Jun Jul Aug Sep Oct Nov Dec
(TWDm)
2011 2012 2013 2014 2015 2016
0
50
100
150
200
250
300
350
Jan-04 Jan-06 Jan-08 Jan-10 Jan-12 Jan-14 Jan-16
(TWD)
22x
1
1
26x
14x
18x
10x
Asia Pacific Daily | 7

3
Makalot Industrial (1477 TT): 30 June 2016
Financial summary Key assumptions
Profit and loss (TWDm)
Cash flow (TWDm)
Source: FactSet, Daiwa forecasts
Year to 31 Dec 2011 2012 2013 2014 2015 2016E 2017E 2018E
ASP (TWD) (dozen) 1,853.4 1,732.2 1,704.2 1,800.3 1,800.3 1,782.3 1,782.3 1,782.3
Shipments (m dozen) 8.2 9.2 10.5 11.6 13.0 13.2 14.2 15.6
Consolidated gross margin (%) 20.9 19.9 19.9 21.7 23.6 21.1 21.6 22.1
Year to 31 Dec 2011 2012 2013 2014 2015 2016E 2017E 2018E
US 13,870 14,168 15,785 18,215 18,893 18,394 19,177 20,540
Japan 0 159 896 1,358 3,153 3,773 4,542 5,551
Other Revenue 1,253 1,540 1,230 1,316 1,313 1,415 1,514 1,665
Total Revenue 15,123 15,867 17,911 20,889 23,359 23,583 25,233 27,757
Other income 0 0 0 0 0 0 0 0
COGS (11,966) (12,712) (14,344) (16,362) (17,847) (18,608) (19,784) (21,624)
SG&A (1,709) (1,671) (1,943) (2,440) (2,861) (2,830) (2,902) (3,137)
Other op.expenses 0 0 0 0 0 0 0 0
Operating profit 1,449 1,484 1,624 2,087 2,650 2,145 2,547 2,996
Net-interest inc./(exp.) (23) (8) (38) (45) (28) (22) (62) (35)
Assoc/forex/extraord./others (20) (38) 61 52 69 30 34 34
Pre-tax profit 1,406 1,438 1,647 2,095 2,691 2,153 2,520 2,996
Tax (293) (261) (304) (389) (514) (400) (469) (557)
Min. int./pref. div./others (2) (1) (1) (0) (18) 0 0 0
Net profit (reported) 1,111 1,175 1,342 1,705 2,159 1,753 2,051 2,439
Net profit (adjusted) 1,111 1,175 1,342 1,705 2,159 1,753 2,051 2,439
EPS (reported)(TWD) 6.639 6.887 7.716 9.268 10.898 8.815 10.316 12.265
EPS (adjusted)(TWD) 6.639 6.887 7.716 9.268 10.898 8.815 10.316 12.265
EPS (adjusted fully-diluted)(TWD) 6.375 6.634 7.382 8.959 10.642 8.631 10.102 12.010
DPS (TWD) 5.887 6.012 7.486 8.291 9.520 7.492 8.769 10.425
EBIT 1,449 1,484 1,624 2,087 2,650 2,145 2,547 2,996
EBITDA 1,632 1,677 1,827 2,347 2,955 2,562 2,990 3,467
Year to 31 Dec 2011 2012 2013 2014 2015 2016E 2017E 2018E
Profit before tax 1,406 1,438 1,647 2,095 2,691 2,153 2,520 2,996
Depreciation and amortisation 183 193 203 260 305 417 443 471
Tax paid (293) (261) (281) (337) (452) (400) (469) (557)
Change in working capital (817) 878 (575) (800) 933 1,301 237 236
Other operational CF items (2) 17 (2) 72 100 28 52 25
Cash flow from operations 476 2,264 993 1,291 3,576 3,499 2,782 3,170
Capex (394) (252) (3,238) (470) (766) (803) (771) (771)
Net (acquisitions)/disposals 26 5 2 38 18 0 0 0
Other investing CF items (9) (2) (144) (99) (33) 33 33 33
Cash flow from investing (377) (249) (3,380) (530) (780) (770) (738) (738)
Change in debt 139 353 1,183 (1,100) (97) 1,197 (300) (300)
Net share issues/(repurchases) 0 0 0 2,115 0 0 0 0
Dividends paid (734) (994) (1,029) (1,311) (1,473) (1,886) (1,490) (1,744)
Other financing CF items 0 4 18 (16) 19 0 0 0
Cash flow from financing (595) (637) 171 (312) (1,551) (689) (1,790) (2,044)
Forex effect/others 63 (43) 42 99 97 0 0 0
Change in cash (433) 1,336 (2,175) 547 1,342 2,039 255 388
Free cash flow 83 2,012 (2,245) 821 2,811 2,696 2,011 2,399
Asia Pacific Daily | 8
4
Makalot Industrial (1477 TT): 30 June 2016
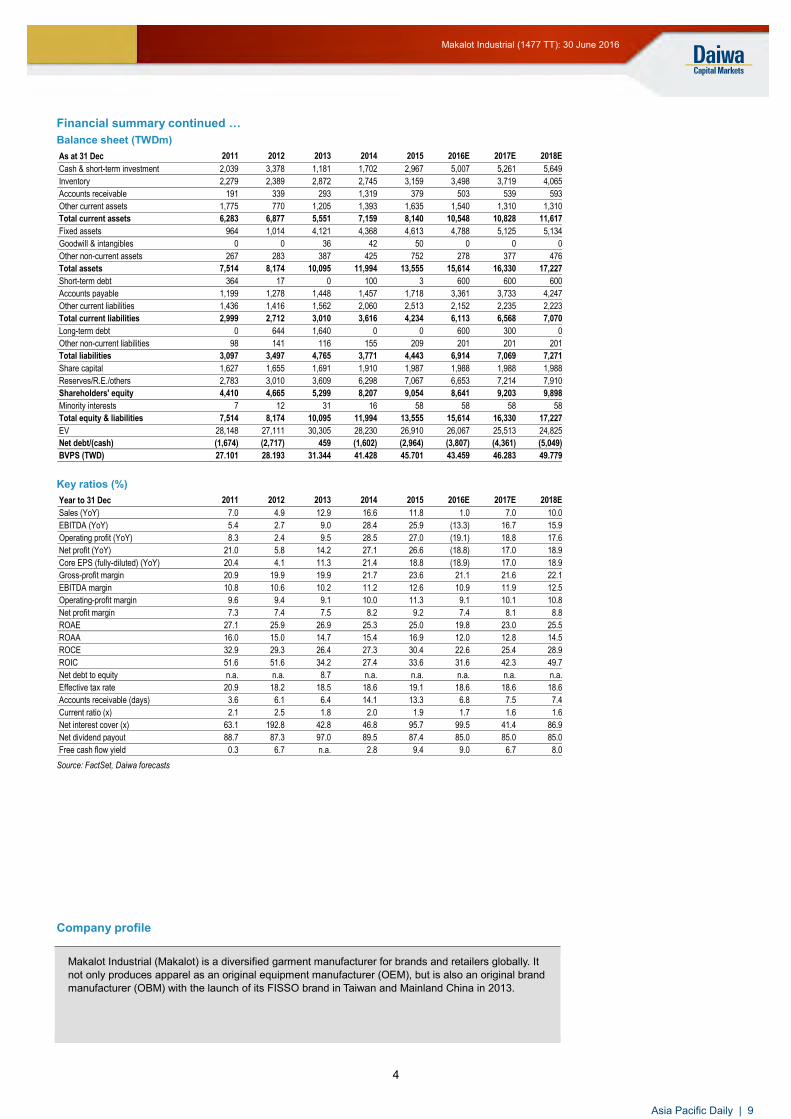
Financial summary continued … Balance sheet (TWDm)
Key ratios (%)
Source: FactSet, Daiwa forecasts
As at 31 Dec 2011 2012 2013 2014 2015 2016E 2017E 2018E
Cash & short-term investment 2,039 3,378 1,181 1,702 2,967 5,007 5,261 5,649
Inventory 2,279 2,389 2,872 2,745 3,159 3,498 3,719 4,065
Accounts receivable 191 339 293 1,319 379 503 539 593
Other current assets 1,775 770 1,205 1,393 1,635 1,540 1,310 1,310
Total current assets 6,283 6,877 5,551 7,159 8,140 10,548 10,828 11,617
Fixed assets 964 1,014 4,121 4,368 4,613 4,788 5,125 5,134
Goodwill & intangibles 0 0 36 42 50 0 0 0
Other non-current assets 267 283 387 425 752 278 377 476
Total assets 7,514 8,174 10,095 11,994 13,555 15,614 16,330 17,227
Short-term debt 364 17 0 100 3 600 600 600
Accounts payable 1,199 1,278 1,448 1,457 1,718 3,361 3,733 4,247
Other current liabilities 1,436 1,416 1,562 2,060 2,513 2,152 2,235 2,223
Total current liabilities 2,999 2,712 3,010 3,616 4,234 6,113 6,568 7,070
Long-term debt 0 644 1,640 0 0 600 300 0
Other non-current liabilities 98 141 116 155 209 201 201 201
Total liabilities 3,097 3,497 4,765 3,771 4,443 6,914 7,069 7,271
Share capital 1,627 1,655 1,691 1,910 1,987 1,988 1,988 1,988
Reserves/R.E./others 2,783 3,010 3,609 6,298 7,067 6,653 7,214 7,910
Shareholders' equity 4,410 4,665 5,299 8,207 9,054 8,641 9,203 9,898
Minority interests 7 12 31 16 58 58 58 58
Total equity & liabilities 7,514 8,174 10,095 11,994 13,555 15,614 16,330 17,227
EV 28,148 27,111 30,305 28,230 26,910 26,067 25,513 24,825
Net debt/(cash) (1,674) (2,717) 459 (1,602) (2,964) (3,807) (4,361) (5,049)
BVPS (TWD) 27.101 28.193 31.344 41.428 45.701 43.459 46.283 49.779
Year to 31 Dec 2011 2012 2013 2014 2015 2016E 2017E 2018E
Sales (YoY) 7.0 4.9 12.9 16.6 11.8 1.0 7.0 10.0
EBITDA (YoY) 5.4 2.7 9.0 28.4 25.9 (13.3) 16.7 15.9
Operating profit (YoY) 8.3 2.4 9.5 28.5 27.0 (19.1) 18.8 17.6
Net profit (YoY) 21.0 5.8 14.2 27.1 26.6 (18.8) 17.0 18.9
Core EPS (fully-diluted) (YoY) 20.4 4.1 11.3 21.4 18.8 (18.9) 17.0 18.9
Gross-profit margin 20.9 19.9 19.9 21.7 23.6 21.1 21.6 22.1
EBITDA margin 10.8 10.6 10.2 11.2 12.6 10.9 11.9 12.5
Operating-profit margin 9.6 9.4 9.1 10.0 11.3 9.1 10.1 10.8
Net profit margin 7.3 7.4 7.5 8.2 9.2 7.4 8.1 8.8
ROAE 27.1 25.9 26.9 25.3 25.0 19.8 23.0 25.5
ROAA 16.0 15.0 14.7 15.4 16.9 12.0 12.8 14.5
ROCE 32.9 29.3 26.4 27.3 30.4 22.6 25.4 28.9
ROIC 51.6 51.6 34.2 27.4 33.6 31.6 42.3 49.7
Net debt to equity n.a. n.a. 8.7 n.a. n.a. n.a. n.a. n.a.
Effective tax rate 20.9 18.2 18.5 18.6 19.1 18.6 18.6 18.6
Accounts receivable (days) 3.6 6.1 6.4 14.1 13.3 6.8 7.5 7.4
Current ratio (x) 2.1 2.5 1.8 2.0 1.9 1.7 1.6 1.6
Net interest cover (x) 63.1 192.8 42.8 46.8 95.7 99.5 41.4 86.9
Net dividend payout 88.7 87.3 97.0 89.5 87.4 85.0 85.0 85.0
Free cash flow yield 0.3 6.7 n.a. 2.8 9.4 9.0 6.7 8.0
Company profile
Makalot Industrial (Makalot) is a diversified garment manufacturer for brands and retailers globally. It not only produces apparel as an original equipment manufacturer (OEM), but is also an original brand manufacturer (OBM) with the launch of its FISSO brand in Taiwan and Mainland China in 2013.
Asia Pacific Daily | 9

See important disclosures, including any required research certifications, beginning on page 5
Japan Financials
What's new: AGT’s unit price has been lacklustre post-Brexit, which would seem at odds with the strong price recovery seen by most of the other Singapore-listed yield stocks (now trading even higher than their 23 June [pre-Brexit] close). We see this as another example of the market ignoring the merits of AGT. We reiterate our Buy (1) rating on the stock. What's the impact: In retrospect, it is probably not surprising that many yield stocks in Singapore are performing better after Brexit as the outcome has lowered expectations of Fed rate hikes, prolonging the low overall interest-rate environment. From 23-29 June, the 10-year SGS yield fell by 14bps to 1.9%. The combination of high yield and perceived defensiveness is apparently in vogue again, but the market has neglected the unit price of AGT, which has barely budged. We believe the pricing discrepancy is unjustified because the Brexit fallout provides AGT with one clear benefit over the other Singapore-listed yield stocks: a stronger JPY that translates directly into higher DPU forecasts. According to Daiwa’s Yen 4Sight report, 28 June 2016, we expect a stronger JPY and have lowered our JPY:USD forecast for end-1Q17 to 102 from 110. Using our new forecast and the spot SGD:USD rate of 1.35, we lower our JPY:SGD assumption (for all periods) to 75.6 from 79.9, and revise up our DPU forecasts by 5.7% for FY17-19. We also raise our DDM-derived 12-month TP to SGD0.90 from SGD0.89 (including the 2HFY16 dividend). Furthermore, we don’t believe investors should assume that AGT will be neglected forever. AGT has been the best-performing stock (excluding privatisations) under our coverage in Singapore YTD (15% YTD vs. 6.3% for the FSTREI and -3.1% for the FSSTI). At some stage, we expect the market to price in the positive fundamentals from a stronger JPY. Finally, another positive unit-price catalyst could come from unit buybacks. AGT raised the possibility of using retained income for unit buybacks in its 3QFY16 results presentation (announced on 10 February 2016). Judging by AGT’s deep discounts to NAV and fair value, we believe unit buybacks, if implemented from FY17, could be highly DPU accretive. What we recommend: We reaffirm our Buy (1) rating and believe its recurrent DPU yields of 11.6-12% cannot be ignored for long. A downside risk would be unforeseen weather-related disruptions on operating performance in the coming months. How we differ: We are the only research house to cover AGT.
30 June 2016
Brexit payoff: higher SGD distributions
s
A stronger JPY vs. the SGD is a positive Brexit outcome for AGT Revising up our DPU forecasts for FY17-19 by 5.7% Reaffirming our Buy (1) rating with a higher TP of SGD0.90
Source: Daiwa forecasts
Financial summary (JPY)
Year to 31 Mar 17E 18E 19E
Revenue (bn) 52.72 52.42 52.48
Operating profit (bn) 8.68 8.42 8.47
Net profit (bn) 5.58 5.36 5.41
Core EPS (fully-diluted) 5.073 4.878 4.920
EPS change (%) (14.4) (3.8) 0.9
Daiwa vs Cons. EPS (%) n.a. n.a. n.a.
PER (x) 8.9 9.3 9.2
Dividend yield (%) 12.0 11.6 11.7
DPU 5.452 5.260 5.295
DPU (SGD) 0.0721 0.0696 0.0700
PBR (x) 0.6 0.6 0.6
EV/EBITDA (x) 6.9 7.0 6.8
ROE (%) 6.8 6.6 6.7
Source: FactSet, Daiwa forecasts
Accordia Golf Trust (AGT SP)
Target price: SGD0.900 (from SGD0.890)
Share price (29 Jun): SGD0.600 | Up/downside: +50.0%
David Lum, CFA(65) 6329 2102
Forecast revisions (%)Year to 31 Mar 17E 18E 19E
Revenue change - - -
Net profit change - - -
Core EPS (FD) change - - -
80
89
98
106
115
0.45
0.51
0.58
0.64
0.70
Jun-15 Sep-15 Dec-15 Mar-16 Jun-16
Share price performance
Accordia G (LHS) Relative to FSSTI (RHS)
(SGD) (%)
12-month range 0.480-0.690
Market cap (USDbn) 0.48
3m avg daily turnover (USDm) 0.91
Shares outstanding (m) 1,099
Major shareholder Accordia Golf (28.9%)
Asia Pacific Daily | 10

2
Accordia Golf Trust (AGT SP): 30 June 2016
AGT: earnings and DPU-forecast changes AGT: Daiwa DDM valuation
JPYbn FY17E FY17E
FY18E FY18E
FY19E FY19E
Year to March Prev New Chg Prev New Chg Prev New Chg
Revenue 52.55 52.72 0.0% 52.44 52.42 0.0% 52.48 52.48 0.0%
Expenses (42.12) (44.04) 0.0% (42.06) (44.00) 0.0% (44.01) (44.01) 0.0%
Operating profit 10.44 8.68 0.0% 10.39 8.42 0.0% 8.47 8.47 0.0%
Net profit 7.89 5.58 0.0% 7.84 5.36 0.0% 5.41 5.41 0.0%
EBITDA 13.84 12.09 0.0% 13.79 11.83 0.0% 11.89 11.89 0.0%
Distribution 6.02 5.99 0.0% 5.97 5.78 0.0% 5.82 5.82 0.0%
DPU (JPY) 5.478 5.452 0.0% 5.433 5.260 0.0% 5.295 5.295 0.0%
Distribution (SGDm) 70.01 79.27 5.7% 69.43 76.48 5.7% 72.84 76.99 5.7%
DPU (SGD) 0.0637 0.0721 5.7% 0.0632 0.0696 5.7% 0.0663 0.0700 5.7%
DPU yield
12.0%
11.6%
11.7%
Cost of equity 7.5%
Long-term growth rate -0.5%
Effective cap rate 8.0%
PV of 10-year DPU forecasts (SGD) 0.49
PV of terminal value (SGD) 0.41
DDM valuation (SGD) 0.90
Source: Daiwa forecasts
Source: Daiwa estimates
Daiwa Securities group subsidiary Daiwa PI Partners Co.Ltd. has extended to Accordia Golf Co, Ltd.(“Accordia Golf”) a loan facility with stock acquisition rights. Another Daiwa Securities group subsidiary, Daiwa Real Estate Asset Management Co. Ltd., has entered into an asset management agreement to provide advice to a godo kaisha SPC established for the purpose of acquiring from Accordia Golf shares in Accordia Golf subsidiaries owning golf courses. Daiwa Real Estate Asset Management Co. Ltd. owns a 51% stake in the trustee-manager that assumes the role of trustee and asset manager of Accordia Golf Trust, a tokumei kumiai (silent partnership) investor in the SPC. (Accordia Golf owns a 49% stake in the trustee-manager). When Accordia Golf Trust was listed on the Singapore Exchange, Daiwa Securities group was one of the underwriters and sellers of Accordia Golf Trust units in Japan and abroad (Daiwa Securities Co. Ltd. was sole seller in Japan). As a joint global coordinator, Daiwa Securities group subsidiary Daiwa Capital Markets Singapore Limited provided general advice concerning Accordia Golf Trust, including with regard to structuring the trust vehicle.
Asia Pacific Daily | 11
3
Accordia Golf Trust (AGT SP): 30 June 2016
Financial summary Key assumptions
Profit and loss (JPYbn)
Cash flow (JPYbn)
Source: FactSet, Daiwa forecasts
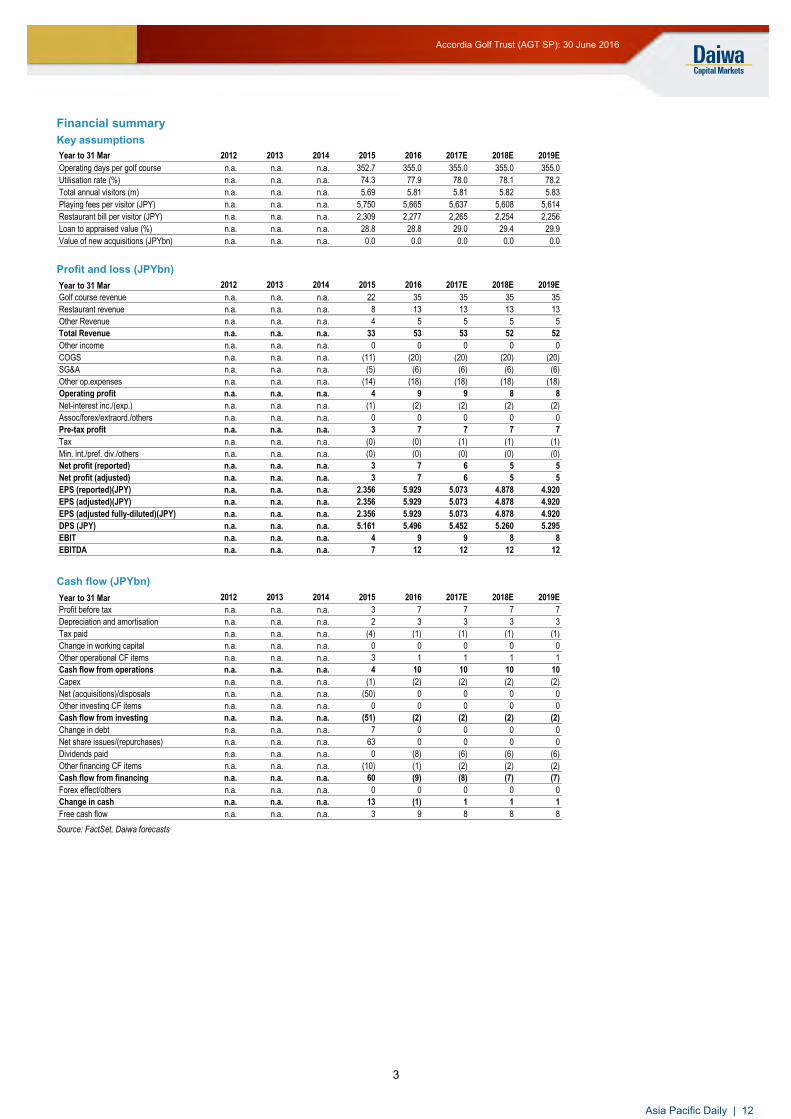
Year to 31 Mar 2012 2013 2014 2015 2016 2017E 2018E 2019E
Operating days per golf course n.a. n.a. n.a. 352.7 355.0 355.0 355.0 355.0
Utilisation rate (%) n.a. n.a. n.a. 74.3 77.9 78.0 78.1 78.2
Total annual visitors (m) n.a. n.a. n.a. 5.69 5.81 5.81 5.82 5.83
Playing fees per visitor (JPY) n.a. n.a. n.a. 5,750 5,665 5,637 5,608 5,614
Restaurant bill per visitor (JPY) n.a. n.a. n.a. 2,309 2,277 2,265 2,254 2,256
Loan to appraised value (%) n.a. n.a. n.a. 28.8 28.8 29.0 29.4 29.9
Value of new acquisitions (JPYbn) n.a. n.a. n.a. 0.0 0.0 0.0 0.0 0.0
Year to 31 Mar 2012 2013 2014 2015 2016 2017E 2018E 2019E
Golf course revenue n.a. n.a. n.a. 22 35 35 35 35
Restaurant revenue n.a. n.a. n.a. 8 13 13 13 13
Other Revenue n.a. n.a. n.a. 4 5 5 5 5
Total Revenue n.a. n.a. n.a. 33 53 53 52 52
Other income n.a. n.a. n.a. 0 0 0 0 0
COGS n.a. n.a. n.a. (11) (20) (20) (20) (20)
SG&A n.a. n.a. n.a. (5) (6) (6) (6) (6)
Other op.expenses n.a. n.a. n.a. (14) (18) (18) (18) (18)
Operating profit n.a. n.a. n.a. 4 9 9 8 8
Net-interest inc./(exp.) n.a. n.a. n.a. (1) (2) (2) (2) (2)
Assoc/forex/extraord./others n.a. n.a. n.a. 0 0 0 0 0
Pre-tax profit n.a. n.a. n.a. 3 7 7 7 7
Tax n.a. n.a. n.a. (0) (0) (1) (1) (1)
Min. int./pref. div./others n.a. n.a. n.a. (0) (0) (0) (0) (0)
Net profit (reported) n.a. n.a. n.a. 3 7 6 5 5
Net profit (adjusted) n.a. n.a. n.a. 3 7 6 5 5
EPS (reported)(JPY) n.a. n.a. n.a. 2.356 5.929 5.073 4.878 4.920
EPS (adjusted)(JPY) n.a. n.a. n.a. 2.356 5.929 5.073 4.878 4.920
EPS (adjusted fully-diluted)(JPY) n.a. n.a. n.a. 2.356 5.929 5.073 4.878 4.920
DPS (JPY) n.a. n.a. n.a. 5.161 5.496 5.452 5.260 5.295
EBIT n.a. n.a. n.a. 4 9 9 8 8
EBITDA n.a. n.a. n.a. 7 12 12 12 12
Year to 31 Mar 2012 2013 2014 2015 2016 2017E 2018E 2019E
Profit before tax n.a. n.a. n.a. 3 7 7 7 7
Depreciation and amortisation n.a. n.a. n.a. 2 3 3 3 3
Tax paid n.a. n.a. n.a. (4) (1) (1) (1) (1)
Change in working capital n.a. n.a. n.a. 0 0 0 0 0
Other operational CF items n.a. n.a. n.a. 3 1 1 1 1
Cash flow from operations n.a. n.a. n.a. 4 10 10 10 10
Capex n.a. n.a. n.a. (1) (2) (2) (2) (2)
Net (acquisitions)/disposals n.a. n.a. n.a. (50) 0 0 0 0
Other investing CF items n.a. n.a. n.a. 0 0 0 0 0
Cash flow from investing n.a. n.a. n.a. (51) (2) (2) (2) (2)
Change in debt n.a. n.a. n.a. 7 0 0 0 0
Net share issues/(repurchases) n.a. n.a. n.a. 63 0 0 0 0
Dividends paid n.a. n.a. n.a. 0 (8) (6) (6) (6)
Other financing CF items n.a. n.a. n.a. (10) (1) (2) (2) (2)
Cash flow from financing n.a. n.a. n.a. 60 (9) (8) (7) (7)
Forex effect/others n.a. n.a. n.a. 0 0 0 0 0
Change in cash n.a. n.a. n.a. 13 (1) 1 1 1
Free cash flow n.a. n.a. n.a. 3 9 8 8 8
Asia Pacific Daily | 12
4
Accordia Golf Trust (AGT SP): 30 June 2016
Financial summary continued … Balance sheet (JPYbn)
Key ratios (%)
Source: FactSet, Daiwa forecasts
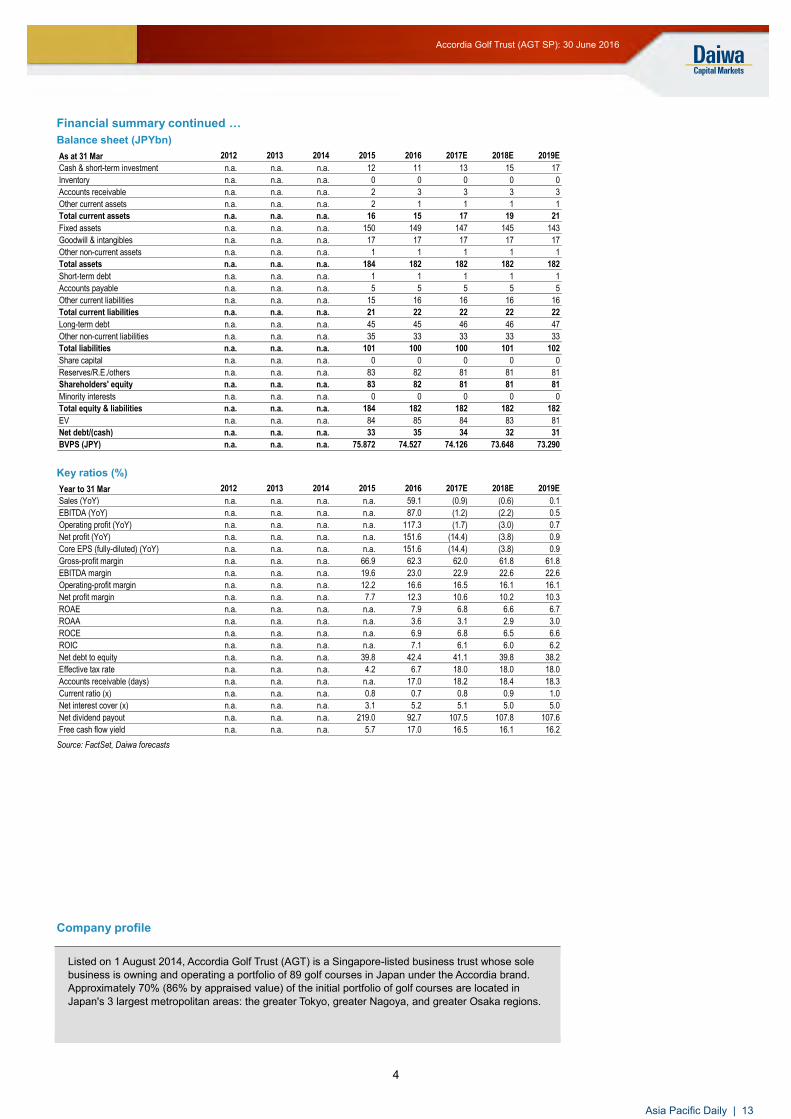
As at 31 Mar 2012 2013 2014 2015 2016 2017E 2018E 2019E
Cash & short-term investment n.a. n.a. n.a. 12 11 13 15 17
Inventory n.a. n.a. n.a. 0 0 0 0 0
Accounts receivable n.a. n.a. n.a. 2 3 3 3 3
Other current assets n.a. n.a. n.a. 2 1 1 1 1
Total current assets n.a. n.a. n.a. 16 15 17 19 21
Fixed assets n.a. n.a. n.a. 150 149 147 145 143
Goodwill & intangibles n.a. n.a. n.a. 17 17 17 17 17
Other non-current assets n.a. n.a. n.a. 1 1 1 1 1
Total assets n.a. n.a. n.a. 184 182 182 182 182
Short-term debt n.a. n.a. n.a. 1 1 1 1 1
Accounts payable n.a. n.a. n.a. 5 5 5 5 5
Other current liabilities n.a. n.a. n.a. 15 16 16 16 16
Total current liabilities n.a. n.a. n.a. 21 22 22 22 22
Long-term debt n.a. n.a. n.a. 45 45 46 46 47
Other non-current liabilities n.a. n.a. n.a. 35 33 33 33 33
Total liabilities n.a. n.a. n.a. 101 100 100 101 102
Share capital n.a. n.a. n.a. 0 0 0 0 0
Reserves/R.E./others n.a. n.a. n.a. 83 82 81 81 81
Shareholders' equity n.a. n.a. n.a. 83 82 81 81 81
Minority interests n.a. n.a. n.a. 0 0 0 0 0
Total equity & liabilities n.a. n.a. n.a. 184 182 182 182 182
EV n.a. n.a. n.a. 84 85 84 83 81
Net debt/(cash) n.a. n.a. n.a. 33 35 34 32 31
BVPS (JPY) n.a. n.a. n.a. 75.872 74.527 74.126 73.648 73.290
Year to 31 Mar 2012 2013 2014 2015 2016 2017E 2018E 2019E
Sales (YoY) n.a. n.a. n.a. n.a. 59.1 (0.9) (0.6) 0.1
EBITDA (YoY) n.a. n.a. n.a. n.a. 87.0 (1.2) (2.2) 0.5
Operating profit (YoY) n.a. n.a. n.a. n.a. 117.3 (1.7) (3.0) 0.7
Net profit (YoY) n.a. n.a. n.a. n.a. 151.6 (14.4) (3.8) 0.9
Core EPS (fully-diluted) (YoY) n.a. n.a. n.a. n.a. 151.6 (14.4) (3.8) 0.9
Gross-profit margin n.a. n.a. n.a. 66.9 62.3 62.0 61.8 61.8
EBITDA margin n.a. n.a. n.a. 19.6 23.0 22.9 22.6 22.6
Operating-profit margin n.a. n.a. n.a. 12.2 16.6 16.5 16.1 16.1
Net profit margin n.a. n.a. n.a. 7.7 12.3 10.6 10.2 10.3
ROAE n.a. n.a. n.a. n.a. 7.9 6.8 6.6 6.7
ROAA n.a. n.a. n.a. n.a. 3.6 3.1 2.9 3.0
ROCE n.a. n.a. n.a. n.a. 6.9 6.8 6.5 6.6
ROIC n.a. n.a. n.a. n.a. 7.1 6.1 6.0 6.2
Net debt to equity n.a. n.a. n.a. 39.8 42.4 41.1 39.8 38.2
Effective tax rate n.a. n.a. n.a. 4.2 6.7 18.0 18.0 18.0
Accounts receivable (days) n.a. n.a. n.a. n.a. 17.0 18.2 18.4 18.3
Current ratio (x) n.a. n.a. n.a. 0.8 0.7 0.8 0.9 1.0
Net interest cover (x) n.a. n.a. n.a. 3.1 5.2 5.1 5.0 5.0
Net dividend payout n.a. n.a. n.a. 219.0 92.7 107.5 107.8 107.6
Free cash flow yield n.a. n.a. n.a. 5.7 17.0 16.5 16.1 16.2
Company profile
Listed on 1 August 2014, Accordia Golf Trust (AGT) is a Singapore-listed business trust whose sole business is owning and operating a portfolio of 89 golf courses in Japan under the Accordia brand. Approximately 70% (86% by appraised value) of the initial portfolio of golf courses are located in Japan's 3 largest metropolitan areas: the greater Tokyo, greater Nagoya, and greater Osaka regions.
Asia Pacific Daily | 13
Asiamoney’s2013
Best DomesticEquity House
Corporate flash 30 June 2016
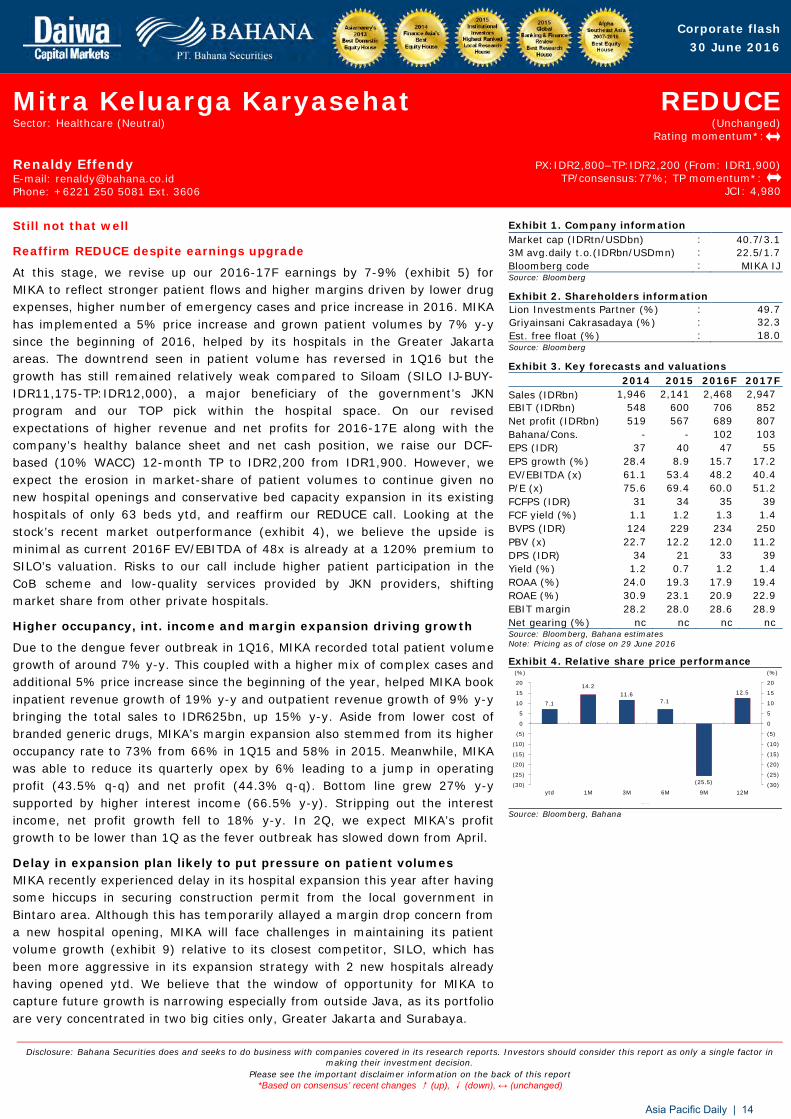
Disclosure: Bahana Securities does and seeks to do business with companies covered in its research reports. Investors should consider this report as only a single factor in making their investment decision.
Please see the important disclaimer information on the back of this report *Based on consensus’ recent changes ↑ (up), ↓ (down), ↔ (unchanged)
Mitra Keluarga Karyasehat Sector: Healthcare (Neutral)
REDUCE (Unchanged)
Rating momentum*:
Renaldy Effendy E-mail: [email protected] Phone: +6221 250 5081 Ext. 3606
PX:IDR2,800–TP:IDR2,200 (From: IDR1,900) TP/consensus:77%; TP momentum*:
JCI: 4,980
Still not that well
Reaffirm REDUCE despite earnings upgrade
At this stage, we revise up our 2016-17F earnings by 7-9% (exhibit 5) for MIKA to reflect stronger patient flows and higher margins driven by lower drug expenses, higher number of emergency cases and price increase in 2016. MIKA has implemented a 5% price increase and grown patient volumes by 7% y-y since the beginning of 2016, helped by its hospitals in the Greater Jakarta areas. The downtrend seen in patient volume has reversed in 1Q16 but the growth has still remained relatively weak compared to Siloam (SILO IJ-BUY-IDR11,175-TP:IDR12,000), a major beneficiary of the government’s JKN program and our TOP pick within the hospital space. On our revised expectations of higher revenue and net profits for 2016-17E along with the company’s healthy balance sheet and net cash position, we raise our DCF-based (10% WACC) 12-month TP to IDR2,200 from IDR1,900. However, we expect the erosion in market-share of patient volumes to continue given no new hospital openings and conservative bed capacity expansion in its existing hospitals of only 63 beds ytd, and reaffirm our REDUCE call. Looking at the stock’s recent market outperformance (exhibit 4), we believe the upside is minimal as current 2016F EV/EBITDA of 48x is already at a 120% premium to SILO’s valuation. Risks to our call include higher patient participation in the CoB scheme and low-quality services provided by JKN providers, shifting market share from other private hospitals.
Higher occupancy, int. income and margin expansion driving growth
Due to the dengue fever outbreak in 1Q16, MIKA recorded total patient volume growth of around 7% y-y. This coupled with a higher mix of complex cases and additional 5% price increase since the beginning of the year, helped MIKA book inpatient revenue growth of 19% y-y and outpatient revenue growth of 9% y-y bringing the total sales to IDR625bn, up 15% y-y. Aside from lower cost of branded generic drugs, MIKA’s margin expansion also stemmed from its higher occupancy rate to 73% from 66% in 1Q15 and 58% in 2015. Meanwhile, MIKA was able to reduce its quarterly opex by 6% leading to a jump in operating profit (43.5% q-q) and net profit (44.3% q-q). Bottom line grew 27% y-y supported by higher interest income (66.5% y-y). Stripping out the interest income, net profit growth fell to 18% y-y. In 2Q, we expect MIKA’s profit growth to be lower than 1Q as the fever outbreak has slowed down from April.
Delay in expansion plan likely to put pressure on patient volumes MIKA recently experienced delay in its hospital expansion this year after having some hiccups in securing construction permit from the local government in Bintaro area. Although this has temporarily allayed a margin drop concern from a new hospital opening, MIKA will face challenges in maintaining its patient volume growth (exhibit 9) relative to its closest competitor, SILO, which has been more aggressive in its expansion strategy with 2 new hospitals already having opened ytd. We believe that the window of opportunity for MIKA to capture future growth is narrowing especially from outside Java, as its portfolio are very concentrated in two big cities only, Greater Jakarta and Surabaya.
Exhibit 1. Company information Market cap (IDRtn/USDbn) : 40.7/3.1 3M avg.daily t.o.(IDRbn/USDmn) : 22.5/1.7 Bloomberg code : MIKA IJ Source: Bloomberg
Exhibit 2. Shareholders information Lion Investments Partner (%) : 49.7 Griyainsani Cakrasadaya (%) : 32.3 Est. free float (%) : 18.0 Source: Bloomberg
Exhibit 3. Key forecasts and valuations 2014 2015 2016F 2017F Sales (IDRbn) 1,946 2,141 2,468 2,947 EBIT (IDRbn) 548 600 706 852 Net profit (IDRbn) 519 567 689 807 Bahana/Cons. - - 102 103 EPS (IDR) 37 40 47 55 EPS growth (%) 28.4 8.9 15.7 17.2 EV/EBITDA (x) 61.1 53.4 48.2 40.4 P/E (x) 75.6 69.4 60.0 51.2 FCFPS (IDR) 31 34 35 39 FCF yield (%) 1.1 1.2 1.3 1.4 BVPS (IDR) 124 229 234 250 PBV (x)
22.7 12.2 12.0 11.2 DPS (IDR) 34 21 33 39 Yield (%) 1.2 0.7 1.2 1.4 ROAA (%) 24.0 19.3 17.9 19.4 ROAE (%) 30.9 23.1 20.9 22.9 EBIT margin 28.2 28.0 28.6 28.9 Net gearing (%) nc nc nc nc Source: Bloomberg, Bahana estimates Note: Pricing as of close on 29 June 2016
Exhibit 4. Relative share price performance
7.1
14.2 11.6
7.1
(25.5)
12.5
(30)
(25)
(20)
(15)
(10)
(5)
0
5
10
15
20
(30)
(25)
(20)
(15)
(10)
(5)
0
5
10
15
20
ytd 1M 3M 6M 9M 12M
(%) (%)
MIKA IJ relative to JCI Source: Bloomberg, Bahana
Asia Pacific Daily | 14
Important disclosures, including any required research certifications, are provided on the last three pages of this report.
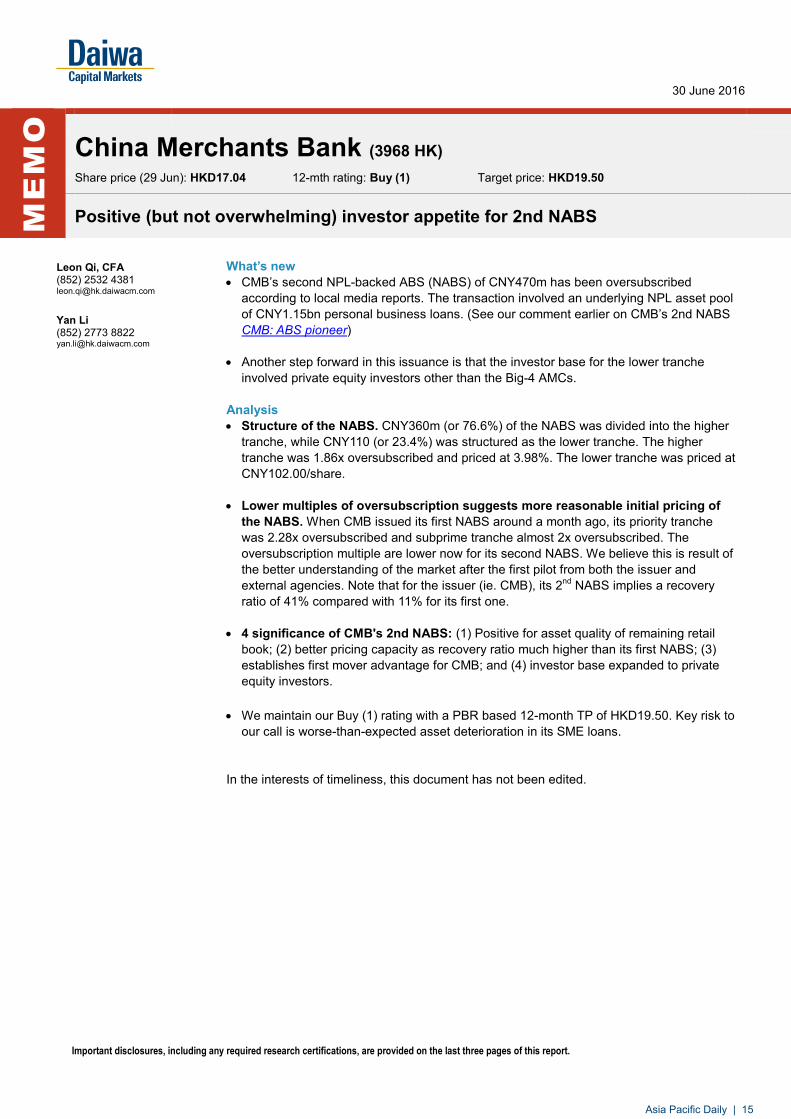
What’s new CMB’s second NPL-backed ABS (NABS) of CNY470m has been oversubscribed
according to local media reports. The transaction involved an underlying NPL asset pool of CNY1.15bn personal business loans. (See our comment earlier on CMB’s 2nd NABS CMB: ABS pioneer)
Another step forward in this issuance is that the investor base for the lower tranche
involved private equity investors other than the Big-4 AMCs. Analysis Structure of the NABS. CNY360m (or 76.6%) of the NABS was divided into the higher
tranche, while CNY110 (or 23.4%) was structured as the lower tranche. The higher tranche was 1.86x oversubscribed and priced at 3.98%. The lower tranche was priced at CNY102.00/share.
Lower multiples of oversubscription suggests more reasonable initial pricing of
the NABS. When CMB issued its first NABS around a month ago, its priority tranche was 2.28x oversubscribed and subprime tranche almost 2x oversubscribed. The oversubscription multiple are lower now for its second NABS. We believe this is result of the better understanding of the market after the first pilot from both the issuer and external agencies. Note that for the issuer (ie. CMB), its 2nd NABS implies a recovery ratio of 41% compared with 11% for its first one.
4 significance of CMB's 2nd NABS: (1) Positive for asset quality of remaining retail
book; (2) better pricing capacity as recovery ratio much higher than its first NABS; (3) establishes first mover advantage for CMB; and (4) investor base expanded to private equity investors.
We maintain our Buy (1) rating with a PBR based 12-month TP of HKD19.50. Key risk to
our call is worse-than-expected asset deterioration in its SME loans. In the interests of timeliness, this document has not been edited.
x
Country
30 June 2016
ME
MO
China Merchants Bank (3968 HK)
Share price (29 Jun): HKD17.04 12-mth rating: Buy (1) Target price: HKD19.50
Positive (but not overwhelming) investor appetite for 2nd NABS
Leon Qi, CFA (852) 2532 4381 [email protected]
Yan Li (852) 2773 8822 [email protected]
Asia Pacific Daily | 15
Important disclosures, including any required research certifications, are provided on the last three pages of this report.
What’s new: Huishan’s FY16 net profit (before revaluation gains/losses on biological assets) declined 8% YoY to CNY822m, vs a 5% YoY decline in 1HFY16. The results were 7% above our estimate and 13% above the Bloomberg consensus. Stripping out a disposal gain of CNY59m and the substantial rise in government grants (CNY102.9 m vs CNY17.5m in FY15), reported net profit would have declined 25% YoY (-21% in 1HFY16). The liquid milk ASP declined sharply by 13% YoY in 1HFY16 but stabilized in 2H (+1% YoY). The company proposed a final DPS of CNY1.25 cents (FY15: CNY1.53). We have a Sell (5) rating on Huishan due to its stretched valuation. We plan to provide more details after the analyst meeting on 30 Jun (Thur). Impact: Upstream: The raw milk ASP was down 9% YoY to CNY4.42/kg (-11% YoY in 1HFY16), in line with peers. External sales volume was up 3 % YoY only. The milk yield declined to 8.6 tonnes/cow/year in FY16 from 9.1 tonnes a year ago, as management wanted to control the overall cost efficiency and cut feed costs. Unit feed cost was down 10% YoY, thanks to increased use of corn silage planted in-house. The number of milkable cows increased 30% YoY to 96.3K heads, improving the overall operational efficiency as the proportion of milkable cows has now reached 48% (1HFY16: 45%). Downstream: (1) The sales volume of liquid milk products was up 32% YoY as Huishan increased its market share in pasteurized yogurt in Northeastern China, and promoted its UHT milk aggressively outside its hometown area (such as Eastern and Northern China). Fresh milk sales rebounded strongly in 2H16 (+36% YoY vs a 9% YoY decline in 1H) after production equipment relocations to new plants were completed. The gross margin of downstream products rebounded strongly in 2HFY16 to 33% (+3.3ppYoY) due to product mix improvements. (2) The sales volume of infant formula reached 2,891 tonnes (+7% YoY) with increasing contributions from the ultra-high-end Gold Queen, and the high-end Gold/Red label series. However, liquid milk remains the major revenue contributor (86% of total revenue). Other income: (1) Government subsidies increased from CNY102.9m last year to CNY17.5m, which we believe was attributable to Huishan’s investment in and acquisition of bio-waste to energy facilities from its parent company in 1HFY16. Financials: net gearing was 71% as of Mar-16 (vs 57% as of Sep-15) on CNY1.6bn of capex and c. HKD2bn of spending on share buybacks during FY16.
x
Country
30 June 2016
ME
MO
China Huishan Dairy (6863 HK)
Share price (29 Jun): HKD3.14 12-mth rating: Sell (5) Target price: HKD1.87
Profit declines 8% YoY in FY16, not as bad as we had expected
Anson Chan, CFA (852) 25324 350 [email protected]
Asia Pacific Daily | 16

China Huishan Dairy (6863 HK)
30 June 2016
2
Results at a glance
CNY m (12 months ended 31-Mar) FY16 FY15 (restated) YoY % Our est. Dev (%) 1HFY16 1HFY15 YoY % 2HFY16 2HFY15 YoY %
Sales of raw milk 947.2 1,028.3 -8 1,006.3 -6 503 554 -9 444 474 -6
Sales of processed products 3,579.3 2,895.0 24 3,463.5 3 1,634 1,441 13 1,945 1,454 34
Revenue 4,527 3,923 15 4,470 1 2,137 1,995 7 2,389 1,929 24
Gross profit 2,533 2,261 12 2,572 -2 1,145 1,138 1 1,388 1,123 24
Other income 182 34 434 202 -10 142 21 583 40 13 202
Selling expense -697 -595 17 -670 4 -330 -302 9 -367 -293 25
Administrative cost -435 -418 4 -408 7 -193 -186 4 -242 -233 4
Operating profit 1,583 1,281 24 1,314 20 1,135 977 16 449 304 47
Finance costs -682 -323 111 -623 9 -351 -156 125 -331 -167 98
Profit-before tax 856 958 -11 814 5 768 821 -6 88 137 -36
Tax -34 -60 -43 -46 -26 -16 -32 -50 -18 -28 -37
Reported net profit 822 898 -8 768 7 754 789 -5 69 109 -37
Net profit (ex-valuation gain) 660 868 -24 827 -20 383 484 -21 276 384 -28
Reported EPS (CNY) 0.060 0.062 -4 0.061 -2 0.054 0.055 -2 0.006 0.008 -14
(%) FY16 FY15 +/-pp Our est. +/-pp 1HFY16 1HFY15 +/-pp 2HFY16E 2HFY15 +/-pp
Gross margin 56.0 57.6 -1.7 57.5 -1.6 53.6 57.1 -3.5 58.1 58.2 -0.1
Net margin 18.2 22.9 -4.7 17.2 1.0 35.3 39.6 -4.3 2.9 5.7 -2.8
FY16 FY15 YoY % Our est. Dev (%) 1HFY16 1HFY15 YoY % 2HFY16E 2HFY15 YoY %
Sales volume (000 tonnes) 700,836 577,071 21 742,574 -6 356,200 279,453 27 344,636 297,618 16
Processed products 482,900 365,302 32 513,864 -6 242,500 168,559 44 240,400 196,743 22
Raw milk 217,936 211,769 3 228,711 -5 113,700 110,894 3 104,236 100,875 3
ASP of raw milk(CNY/kg) 4.42 4.87 -9 4.40 0 4.48 5.03 -11 4.26 4.70 -9
ASP of liquid milk (CNY/kg) 7.77 8.26 -6 7.41 5 7.39 8.50 -13 8.10 8.04 1
Milk yield (Tonne/year) 8.60 9.10 n.a. 8.52 1 8.70 9.10 n.a. n.a. n.a. n.a.
Unit feed cost (CNY/tonne) 1,413 1,573 -10 1,612 -12 1,570 1,648 -5 1,225 1,569 -22
No. of cows 200,892 180,331 11 194,920 3 190,911 162,394 18
No. of milkable cows 96,339 74,389 30 113,070 -15 86,801 65,312 33
Source: Company
Valuation and recommendation: We have a Sell (5) rating on the stock due to its stretched valuation (34x FY17E PER). Our SOTP-based 12-month TP of HKD1.87 includes (1) HKD1.70 (DCF-based) for the upstream business, and (2) HKD0.17 for the downstream business (12x FY16E PER). The key risk to our call: a strong rebound in milk prices. In the interests of timeliness, this document has not been edited.
Asia Pacific Daily | 17
Click for our latest editions
Korea Automobiles and
Components Sector
Korea Automobiles and Components Sector: Electric vehicles and smart cars: reinventing the wheel 23 June 2016
Apple and Tesla’s aggressive moves towards EVs and smart cars herald a new era and should give parts makers’ shares a leg up
We revise up our EV and smart-car forecasts on more stringent regulations, government support and falling component prices
Mando and Hanon (both Buys [1]) are our top picks; we also like HMC (Buy [1]) on a 6-month view
Sung Yop Chung (82) 2 787 9157 ([email protected])
Hong Kong Property Sector
Hong Kong Property Sector: It’s time to be more greedy than fearful 25 May 2016
Challenges abound, but we think the Hong Kong property market is more mature and sophisticated than many observers realise
Corporate fundamentals are stronger than industry fundamentals – a distinction that we think deserves more recognition
Significant investment value could be unlocked if family-owned property companies continue to modernise; reiterating Positive stance
Jonas Kan, CFA (852) 2848 4439 ([email protected])
Singapore Strategy
Singapore Strategy: Navigating choppy markets 8 April 2016
We identify optical communications as a key beneficiary of the rising Big Data/IoT cycle
We flag 2 demand drivers: 1) the continued expansion of global FTTX coverage, and 2) bandwidth upgrades at global datacentres
Food chain value proposition centres on epiwafer-growing — LandMark Opto (Buy [1]); WinSemi (Buy [1]) should also benefit
Ramakrishna Maruvada (65) 6499 6543 ([email protected]) Shane Goh (65) 6499 6546 ([email protected])
Taiwan Industrial PC
Sector
Taiwan Industrial PC Sector: Initiation: now they’re talking 23 March 2016
We highlight the Industrial PC sector as a major beneficiary of the ongoing rise of the Internet of Things (IoT)
The Industrial IoT megatrend, government-led efforts to modernize industrial bases, and M&A should be the key catalysts for the sector
We favour Ennoconn for its strong earnings and Advantech for its industry leadership; concerns over IA demand and opex for Adlink
Steven Tseng (886) 2 8758 6252 ([email protected]) Jack Lin (886) 2 8758 6253 ([email protected])
Daiwa research is available electronically on Bloomberg, Reuters, Thomson One Analytics, FactSet, Capital IQ and Daiwa’s L-ZONE. Please contact your Daiwa sales representative for more information.
Daiwa’s Banner Products
Asia Pacific Daily | 18
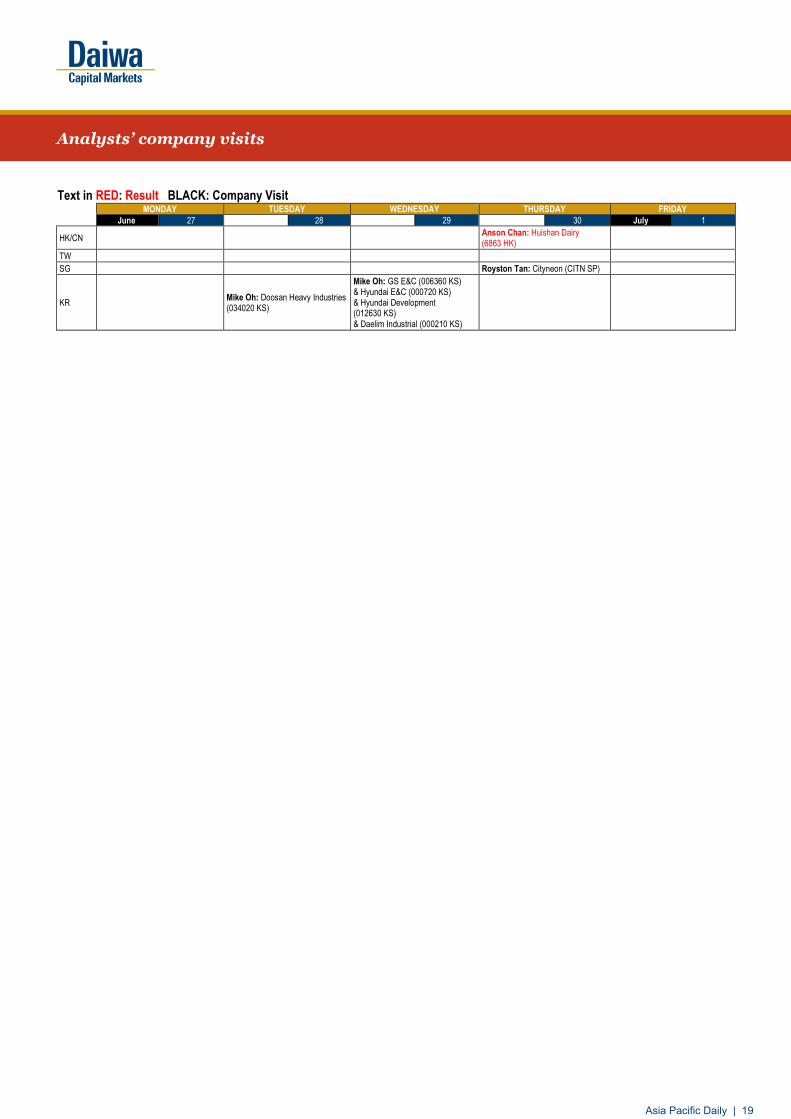
Text in RED: Result BLACK: Company Visit
MONDAY TUESDAY WEDNESDAY THURSDAY FRIDAY
June 27 28 29 30 July 1
HK/CN Anson Chan: Huishan Dairy (6863 HK)
TW
SG Royston Tan: Cityneon (CITN SP)
KR Mike Oh: Doosan Heavy Industries (034020 KS)
Mike Oh: GS E&C (006360 KS) & Hyundai E&C (000720 KS) & Hyundai Development (012630 KS) & Daelim Industrial (000210 KS)
Analysts’ company visits
Asia Pacific Daily | 19
Rating and target-price information
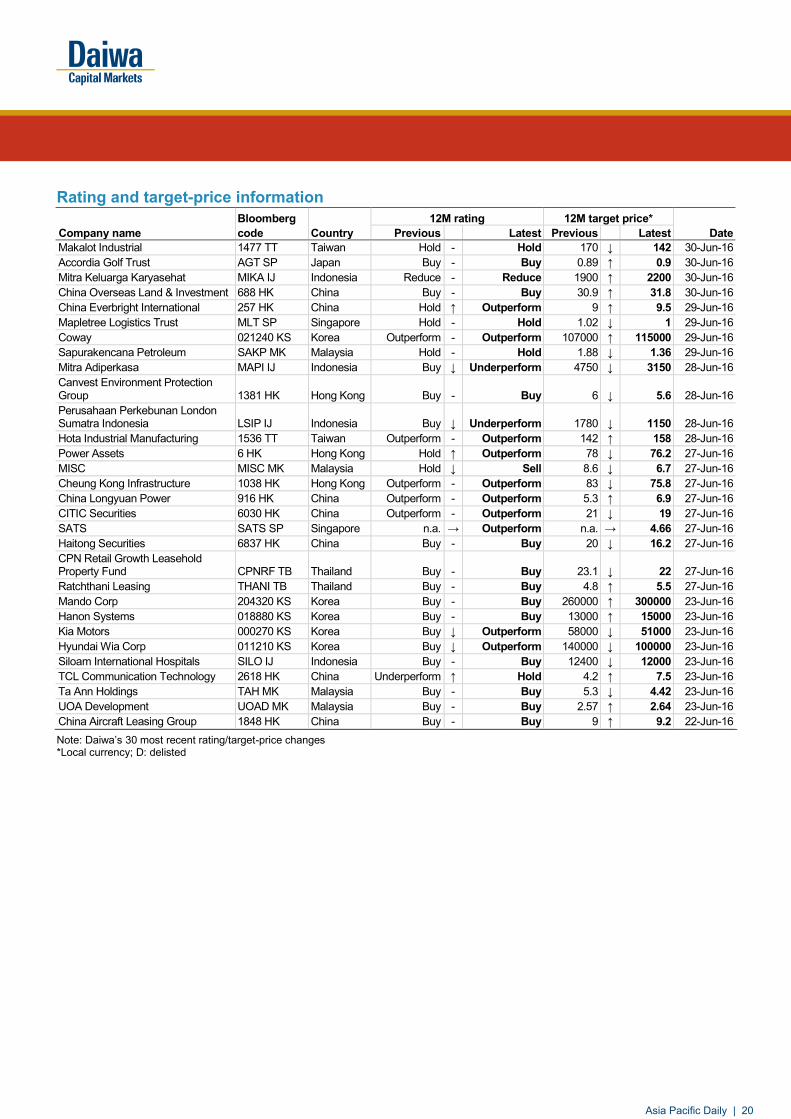
Bloomberg 12M rating 12M target price* Company name code Country Previous Latest Previous Latest Date Makalot Industrial 1477 TT Taiwan Hold - Hold 170 ↓ 142 30-Jun-16 Accordia Golf Trust AGT SP Japan Buy - Buy 0.89 ↑ 0.9 30-Jun-16 Mitra Keluarga Karyasehat MIKA IJ Indonesia Reduce - Reduce 1900 ↑ 2200 30-Jun-16 China Overseas Land & Investment 688 HK China Buy - Buy 30.9 ↑ 31.8 30-Jun-16 China Everbright International 257 HK China Hold ↑ Outperform 9 ↑ 9.5 29-Jun-16 Mapletree Logistics Trust MLT SP Singapore Hold - Hold 1.02 ↓ 1 29-Jun-16 Coway 021240 KS Korea Outperform - Outperform 107000 ↑ 115000 29-Jun-16 Sapurakencana Petroleum SAKP MK Malaysia Hold - Hold 1.88 ↓ 1.36 29-Jun-16 Mitra Adiperkasa MAPI IJ Indonesia Buy ↓ Underperform 4750 ↓ 3150 28-Jun-16 Canvest Environment Protection Group 1381 HK Hong Kong Buy - Buy 6 ↓ 5.6 28-Jun-16 Perusahaan Perkebunan London Sumatra Indonesia LSIP IJ Indonesia Buy ↓ Underperform 1780 ↓ 1150 28-Jun-16 Hota Industrial Manufacturing 1536 TT Taiwan Outperform - Outperform 142 ↑ 158 28-Jun-16 Power Assets 6 HK Hong Kong Hold ↑ Outperform 78 ↓ 76.2 27-Jun-16 MISC MISC MK Malaysia Hold ↓ Sell 8.6 ↓ 6.7 27-Jun-16 Cheung Kong Infrastructure 1038 HK Hong Kong Outperform - Outperform 83 ↓ 75.8 27-Jun-16 China Longyuan Power 916 HK China Outperform - Outperform 5.3 ↑ 6.9 27-Jun-16 CITIC Securities 6030 HK China Outperform - Outperform 21 ↓ 19 27-Jun-16 SATS SATS SP Singapore n.a. → Outperform n.a. → 4.66 27-Jun-16 Haitong Securities 6837 HK China Buy - Buy 20 ↓ 16.2 27-Jun-16 CPN Retail Growth Leasehold Property Fund CPNRF TB Thailand Buy - Buy 23.1 ↓ 22 27-Jun-16 Ratchthani Leasing THANI TB Thailand Buy - Buy 4.8 ↑ 5.5 27-Jun-16 Mando Corp 204320 KS Korea Buy - Buy 260000 ↑ 300000 23-Jun-16 Hanon Systems 018880 KS Korea Buy - Buy 13000 ↑ 15000 23-Jun-16 Kia Motors 000270 KS Korea Buy ↓ Outperform 58000 ↓ 51000 23-Jun-16 Hyundai Wia Corp 011210 KS Korea Buy ↓ Outperform 140000 ↓ 100000 23-Jun-16 Siloam International Hospitals SILO IJ Indonesia Buy - Buy 12400 ↓ 12000 23-Jun-16 TCL Communication Technology 2618 HK China Underperform ↑ Hold 4.2 ↑ 7.5 23-Jun-16 Ta Ann Holdings TAH MK Malaysia Buy - Buy 5.3 ↓ 4.42 23-Jun-16 UOA Development UOAD MK Malaysia Buy - Buy 2.57 ↑ 2.64 23-Jun-16 China Aircraft Leasing Group 1848 HK China Buy - Buy 9 ↑ 9.2 22-Jun-16 Note: Daiwa’s 30 most recent rating/target-price changes *Local currency; D: delisted
Asia Pacific Daily | 20

Recently published reports
Research reports* Subtitle No. of pages
Date of publication
China Everbright International Upgrading: refocusing on its waste-to-energy identity 17 28-Jun-16 China Longyuan Power Utilisation more protected, upside for both EPS & PER 20 27-Jun-16 SATS Multi-pronged growth catalysts 52 27-Jun-16 Singapore Strategy Brexit: surveying the damage 11 24-Jun-16 Samsung Electronics 2Q16E results preview and Investor Forum feedback 21 24-Jun-16 Supalai Public Co Ltd Leading by presales 16 24-Jun-16 Discovery Asia small-cap weekly 20 24-Jun-16 NetEase Initiation: raising its game 45 24-Jun-16 China Autos – PV Weekly Monitor 1-17 June: moderate sales growth 10 23-Jun-16 Korea Automobiles and Components Sector Electric vehicles and smart cars: reinventing the wheel 136 23-Jun-16 Bangkok Airways Pcl Not just a typical airline 20 23-Jun-16 Frasers Centrepoint Initiation: awaiting fruition of capital recycling pipeline 38 22-Jun-16 Frasers Commercial Trust Initiation: a value proposition 25 21-Jun-16 Alibaba Group Investor Day wrap: pedal to the metal 21 20-Jun-16 Discovery Asia small-cap weekly 17 17-Jun-16 Humedix Initiation: attractive play on ageing Asia 22 17-Jun-16 ASEAN Intelligence What matters this week 35 17-Jun-16 Karmarts Pcl Weak growth foundations 16 15-Jun-16 Tesco Lotus Retail Growth. Just a yield story 19 15-Jun-16 Taiwan Financials Sector Still a tough road ahead 32 14-Jun-16 Lifestyle Spin-off to unlock asset value 13 10-Jun-16 PTT Exp. & Production SELL into sentiment rally 13 10-Jun-16 Discovery Asia small-cap weekly 18 10-Jun-16 ASEAN Intelligence What matters this week 35 10-Jun-16 Gunkul Engineering Pcl More potential capacity 12 9-Jun-16 China Autos – PV Weekly Monitor 1-31 May: YoY sales growth fuelled by low base 10 7-Jun-16 Macau Gaming Sector Downgrading: 2H16 looks bleak 52 3-Jun-16 Discovery Asia small-cap weekly 18 3-Jun-16 Glow Energy Pcl SPP replacement benefits 13 3-Jun-16 Global Technology Sector Mid-cycle correction offers re-entry opportunities 29 3-Jun-16 ASEAN Intelligence What matters this week 123 3-Jun-16 Malaysia Strategy Battling perceptions 90 2-Jun-16 Hanwha Techwin Initiation: an empowered consolidator 24 2-Jun-16 COSCO Pacific Downgrading: lack of rebound momentum 14 2-Jun-16
*The 30 most recent reports published by Daiwa
Asia Pacific Markets Closed
Hong Kong China SG Malaysia Korea Taiwan Australia New
Zealand India Thailand Philippines Indonesia
Jun 16 9 9, 10 22 6 9, 10 13 6
Asia Pacific Daily | 21

Daiwa’s Asia Pacific Research Directory HONG KONG Takashi FUJIKURA (852) 2848 4051 [email protected] Regional Research Head John HETHERINGTON (852) 2773 8787 [email protected] Regional Deputy Head of Asia Pacific Research Rohan DALZIELL (852) 2848 4938 [email protected] Regional Head of Asia Pacific Product Management Kevin LAI (852) 2848 4926 [email protected] Chief Economist for Asia ex-Japan; Macro Economics (Regional) Jonas KAN (852) 2848 4439 [email protected] Head of Hong Kong and China Property Cynthia CHAN (852) 2773 8243 [email protected] Property (China) Leon QI (852) 2532 4381 [email protected] Banking (Hong Kong/China); Broker (China); Insurance (China) Anson CHAN (852) 2532 4350 [email protected] Consumer (Hong Kong/China) Adrian CHAN (852) 2848 4427 [email protected] Consumer (Hong Kong/China) Jamie SOO (852) 2773 8529 [email protected] Gaming and Leisure (Hong Kong/China) Dennis IP (852) 2848 4068 [email protected] Power; Utilities; Renewables and Environment (Hong Kong/China) John CHOI (852) 2773 8730 [email protected] Head of Hong Kong and China Internet; Regional Head of Small/Mid Cap Kelvin LAU (852) 2848 4467 [email protected] Head of Automobiles; Transportation and Industrial (Hong Kong/China) Brian LAM (852) 2532 4341 [email protected] Transportation – Railway; Construction and Engineering (China) Thomas HO (852) 2773 8716 [email protected] Custom Products Group PHILIPPINES Patricia Tamase (63) 2 797 3024 [email protected] Banking
SOUTH KOREA Sung Yop CHUNG (82) 2 787 9157 [email protected] Pan-Asia Co-head/Regional Head of Automobiles and Components; Automobiles; Shipbuilding; Steel Mike OH (82) 2 787 9179 [email protected] Banking; Capital Goods (Construction and Machinery) Iris PARK (82) 2 787 9165 [email protected] Consumer/Retail SK KIM (82) 2 787 9173 [email protected] IT/Electronics – Semiconductor/Display and Tech Hardware Thomas Y KWON (82) 2 787 9181 [email protected] Pan-Asia Head of Internet & Telecommunications; Software – Internet/On-line Game Kevin JIN (82) 2 787 9168 [email protected] Small/Mid Cap TAIWAN
Rick HSU (886) 2 8758 6261 [email protected] Head of Regional Technology; Head of Taiwan Research; Semiconductor/IC Design (Regional) Christie CHIEN (886) 2 8758 6257 [email protected] Banking; Insurance (Taiwan); Macro Economics (Regional) Steven TSENG (886) 2 8758 6252 [email protected] IT/Technology Hardware (PC Hardware) Christine WANG (886) 2 8758 6249 [email protected] IT/Technology Hardware (Automation); Pharmaceuticals and Healthcare; Consumer Kylie HUANG (886) 2 8758 6248 [email protected] IT/Technology Hardware (Handsets and Components) Helen CHIEN (886) 2 8758 6254 [email protected] Small/Mid Cap INDIA Punit SRIVASTAVA (91) 22 6622 1013 [email protected] Head of India Research; Strategy; Banking/Finance Saurabh MEHTA (91) 22 6622 1009 [email protected] Capital Goods; Utilities SINGAPORE
Ramakrishna MARUVADA (65) 6499 6543 [email protected] Head of Singapore Research; Telecommunications (China/ASEAN/India) Royston TAN (65) 6321 3086 [email protected] Oil and Gas; Capital Goods David LUM (65) 6329 2102 [email protected] Banking; Property and REITs Shane GOH (65) 64996546 [email protected] Small/Mid Cap (Singapore) Jame OSMAN (65) 6321 3092 [email protected] Telecommunications (ASEAN/India); Pharmaceuticals and Healthcare; Consumer (Singapore)
Asia Pacific Daily | 22

Daiwa’s Offices
Office / Branch / Affiliate Address Tel Fax
DAIWA SECURITIES GROUP INC
HEAD OFFICE Gran Tokyo North Tower, 1-9-1, Marunouchi, Chiyoda-ku, Tokyo, 100-6753 (81) 3 5555 3111 (81) 3 5555 0661
Daiwa Securities Trust Company One Evertrust Plaza, Jersey City, NJ 07302, U.S.A. (1) 201 333 7300 (1) 201 333 7726
Daiwa Securities Trust and Banking (Europe) PLC (Head Office) 5 King William Street, London EC4N 7JB, United Kingdom (44) 207 320 8000 (44) 207 410 0129
Daiwa Europe Trustees (Ireland) Ltd Level 3, Block 5, Harcourt Centre, Harcourt Road, Dublin 2, Ireland (353) 1 603 9900 (353) 1 478 3469
Daiwa Capital Markets America Inc. New York Head Office Financial Square, 32 Old Slip, New York, NY10005, U.S.A. (1) 212 612 7000 (1) 212 612 7100
Daiwa Capital Markets America Inc. San Francisco Branch 555 California Street, Suite 3360, San Francisco, CA 94104, U.S.A. (1) 415 955 8100 (1) 415 956 1935
Daiwa Capital Markets Europe Limited, London Head Office 5 King William Street, London EC4N 7AX, United Kingdom (44) 20 7597 8000 (44) 20 7597 8600
Daiwa Capital Markets Europe Limited, Frankfurt Branch Neue Mainzer Str. 1, 60311 Frankfurt/Main, Germany (49) 69 717 080 (49) 69 723 340
Daiwa Capital Markets Europe Limited, Paris Representative Office 17, rue de Surène 75008 Paris, France (33) 1 56 262 200 (33) 1 47 550 808
Daiwa Capital Markets Europe Limited, Geneva Branch 50 rue du Rhône, P.O.Box 3198, 1211 Geneva 3, Switzerland (41) 22 818 7400 (41) 22 818 7441
Daiwa Capital Markets Europe Limited, Moscow Representative Office
Midland Plaza 7th Floor, 10 Arbat Street, Moscow 119002, Russian Federation
(7) 495 641 3416 (7) 495 775 6238
Daiwa Capital Markets Europe Limited, Bahrain Branch 7th Floor, The Tower, Bahrain Commercial Complex, P.O. Box 30069, Manama, Bahrain
(973) 17 534 452 (973) 17 535 113
Daiwa Capital Markets Hong Kong Limited Level 28, One Pacific Place, 88 Queensway, Hong Kong (852) 2525 0121 (852) 2845 1621
Daiwa Capital Markets SG Limited 6 Shenton Way #26-08, OUE Downtown 2, SG 068809, Republic of SG
(65) 6220 3666 (65) 6223 6198
Daiwa Capital Markets Australia Limited Level 34, Rialto North Tower, 525 Collins Street, Melbourne, Victoria 3000, Australia
(61) 3 9916 1300 (61) 3 9916 1330
DBP-Daiwa Capital Markets Philippines, Inc 18th Floor, Citibank Tower, 8741 Paseo de Roxas, Salcedo Village, Makati City, Republic of the Philippines
(632) 813 7344 (632) 848 0105
Daiwa-Cathay Capital Markets Co Ltd 14/F, 200, Keelung Road, Sec 1, Taipei, Taiwan, R.O.C. (886) 2 2723 9698 (886) 2 2345 3638
Daiwa Securities Capital Markets Korea Co., Ltd. 20 Fl.& 21Fl. One IFC, 10 Gukjegeumyung-Ro, Yeongdeungpo-gu, Seoul, Korea
(82) 2 787 9100 (82) 2 787 9191
Daiwa Securities Co. Ltd., Beijing Representative Office Room 301/302,Kerry Center,1 Guanghua Road,Chaoyang District, Beijing 100020, People’s Republic of China
(86) 10 6500 6688 (86) 10 6500 3594
Daiwa (Shanghai) Corporate Strategic Advisory Co. Ltd. 44/F, Hang Seng Bank Tower, 1000 Lujiazui Ring Road, Pudong, Shanghai China 200120 , People’s Republic of China
(86) 21 3858 2000 (86) 21 3858 2111
Daiwa Securities Co. Ltd., Bangkok Representative Office 18th Floor, M Thai Tower, All Seasons Place, 87 Wireless Road, Lumpini, Pathumwan, Bangkok 10330, Thailand
(66) 2 252 5650 (66) 2 252 5665
Daiwa Capital Markets India Private Ltd 10th Floor, 3 North Avenue, Maker Maxity, Bandra Kurla Complex, Bandra East, Mumbai – 400051, India
(91) 22 6622 1000 (91) 22 6622 1019
Daiwa Securities Co. Ltd., Hanoi Representative Office Suite 405, Pacific Palace Building, 83B, Ly Thuong Kiet Street, Hoan Kiem Dist. Hanoi, Vietnam
(84) 4 3946 0460 (84) 4 3946 0461
DAIWA INSTITUTE OF RESEARCH LTD
HEAD OFFICE 15-6, Fuyuki, Koto-ku, Tokyo, 135-8460, Japan (81) 3 5620 5100 (81) 3 5620 5603
MARUNOUCHI OFFICE Gran Tokyo North Tower, 1-9-1, Marunouchi, Chiyoda-ku, Tokyo, 100-6756 (81) 3 5555 7011 (81) 3 5202 2021
New York Research Center 11th Floor, Financial Square, 32 Old Slip, NY, NY 10005-3504, U.S.A. (1) 212 612 6100 (1) 212 612 8417
London Research Centre 3/F, 5 King William Street, London, EC4N 7AX, United Kingdom (44) 207 597 8000 (44) 207 597 8550
Asia Pacific Daily | 23

Japan: Notes concerning market data and investment indicators Estimates by Daiwa Shares outstanding: Common shares outstanding (excl. treasury stock) Market cap: Based on shares outstanding and closing price as of indicated date EV: Market cap + interest-bearing debt – liquidity on hand EBITDA: Operating profit + depreciation ROE: Net income / average of start-FY and end-FY shareholders’ equity (for SEC-reporting firms net income attributable to
shareholders of the parent / average of start-FY and end-FY shareholders’ equity) Share Price Chart and per-share figures retroactively adjusted to reflect stock splits/reverse stock splits
Asia Pacific Daily | 24

Important Disclosures and Disclaimer This publication is produced by Daiwa Securities Group Inc. and/or its non-U.S. affiliates, and distributed by Daiwa Securities Group Inc. and/or its non-U.S. affiliates, except to the extent expressly provided herein. This publication and the contents hereof are intended for information purposes only, and may be subject to change without further notice. Any use, disclosure, distribution, dissemination, copying, printing or reliance on this publication for any other purpose without our prior consent or approval is strictly prohibited. Neither Daiwa Securities Group Inc. nor any of its respective parent, holding, subsidiaries or affiliates, nor any of its respective directors, officers, servants and employees, represent nor warrant the accuracy or completeness of the information contained herein or as to the existence of other facts which might be significant, and will not accept any responsibility or liability whatsoever for any use of or reliance upon this publication or any of the contents hereof. Neither this publication, nor any content hereof, constitute, or are to be construed as, an offer or solicitation of an offer to buy or sell any of the securities or investments mentioned herein in any country or jurisdiction nor, unless expressly provided, any recommendation or investment opinion or advice. Any view, recommendation, opinion or advice expressed in this publication may not necessarily reflect those of Daiwa Securities Group Inc., and/or its affiliates nor any of its respective directors, officers, servants and employees except where the publication states otherwise. This research report is not to be relied upon by any person in making any investment decision or otherwise advising with respect to, or dealing in, the securities mentioned, as it does not take into account the specific investment objectives, financial situation and particular needs of any person. Daiwa Securities Group Inc., Thanachart Securities, Affin Hwang Investment Bank Berhad, PT.Bahana Securities, their respective subsidiaries or affiliates, or their respective directors, officers and employees from time to time have trades as principals, or have positions in, or have other interests in the securities of the company under research including market making activities, derivatives in respect of such securities or may have also performed investment banking and other services for the issuer of such securities. The following are additional disclosures. Ownership of Securities For “Ownership of Securities” information, please visit BlueMatrix disclosure link at https://daiwa3.bluematrix.com/sellside/Disclosures.action. Investment Banking Relationship For “Investment Banking Relationship”, please visit BlueMatrix disclosure link at https://daiwa3.bluematrix.com/sellside/Disclosures.action. Portions of this publication are prepared by Affin Hwang Investment Bank Berhad (“Affin Hwang”) and reviewed by Daiwa Securities Group Inc. and/or its non-U.S. affiliates (collectively, “Daiwa”), and is distributed and/or originated from outside Malaysia by Daiwa Securities Group Inc. and/or its non-U.S. affiliates, except to the extent expressly provided herein. The role of Daiwa Securities Group Inc. and/or its non-U.S. affiliates in connection with this publication is solely limited to the review and distribution of this publication ; and Daiwa Securities Group Inc. and/or its non-U.S. affiliates are not involved in the preparation of this publication in any other way. This research is for Daiwa clients only and the publication and the contents hereof are intended for information purposes only, and may be subject to change without further notice. Other than disclosures relating to Daiwa, this research is based on current public information that Affin Hwang and Daiwa consider reliable, but we do not represent it is accurate or complete, and it should not be relied on as such. The analysts named in this report may have from time to time discussed with clients, including Daiwa’s salespersons and traders, or may discuss in this report, trading strategies that reference catalysts or events that may have a near-term impact on the market price of the equity securities discussed in this report, which impact may be directionally counter to the analysts' published price target expectations for such stocks. Any such trading strategies are distinct from and do not affect the analysts' fundamental equity rating for such stocks, which rating reflects a stock's return potential relative to its coverage group as described herein. Any use, disclosure, distribution, dissemination, copying, printing or reliance on this publication for any other purpose without our prior consent or approval is strictly prohibited. Neither Daiwa Securities Group Inc. nor any of its respective parent, holding, subsidiaries or affiliates, nor any of its respective directors, officers, servants and employees, represent nor warrant the accuracy or completeness of the information contained herein or as to the existence of other facts which might be significant, and will not accept any responsibility or liability whatsoever for any use of or reliance upon this publication or any of the contents hereof. Neither this publication, nor any content hereof, constitute, or are to be construed as, an offer or solicitation of an offer to buy or sell any of the securities or investments mentioned herein in any country or jurisdiction where such an offer or solicitation would be illegal nor, unless expressly provided, any recommendation or investment opinion or advice. Any view, recommendation, opinion or advice expressed in this publication constitutes the views of the analyst(s) named herein and does not necessarily reflect those of Daiwa Securities Group Inc. and/or its affiliates nor any of its respective directors, officers, servants and employees except where the publication states otherwise. This research report is not to be relied upon by any person in making any investment decision or otherwise advising with respect to, or dealing in, the securities mentioned, as it does not take into account the specific investment objectives, financial situation and particular needs of any person. Clients should consider whether any advice or recommendation in this research is suitable for their particular circumstances and, if appropriate, seek professional advice, including tax advice. The price and value of investments referred to in this research and the income from them may fluctuate. Past performance is not a guide to future performance future returns are not guaranteed, and a loss of original capital may occur. Fluctuations in exchange rates could have adverse effects on the value or price of, or income derived from, certain investments. Certain transactions, including those involving futures, options, and other derivatives, give rise to substantial risk and are not suitable for all investors. Investors should review current options disclosure documents in relation to such investments. Portions of this publication are prepared by PT. Bahana Securities and reviewed by Daiwa Securities Group Inc. and/or its affiliates, and distributed outside Indonesia by Daiwa Securities Group Inc. and/or its affiliates, except to the extent expressly provided herein. Certain copies of this publication may be distributed inside and outside of Indonesia by PT. Bahana Securities in accordance with relevant laws and regulations. This publication and the contents hereof are intended for information purposes only, and may be subject to change without further notice. Any use, disclosure, distribution, dissemination, copying, printing or reliance on this publication for any other purpose without our prior consent or approval is strictly prohibited. Any review does not constitute a full verification of the publication and merely provides a minimum check. Neither Daiwa Securities Group Inc. nor any of its respective parent, holding, subsidiaries or affiliates, nor any of its respective directors, officers, servants and employees, represent nor warrant the accuracy or completeness of the information contained herein or as to the existence of other facts which might be significant, and will not accept any responsibility or liability whatsoever for any use of or reliance upon this publication or any of the contents hereof. Neither this publication, nor any content hereof, constitute, or are to be construed as, an offer or solicitation of an offer to buy or sell any of the securities or investments mentioned herein in any country or jurisdiction nor, unless expressly provided, any recommendation or investment opinion or advice. Any view, recommendation, opinion or advice expressed in this publication constitutes the views of the analyst(s) named herein and does not necessarily reflect those of Daiwa Securities Group Inc. and/or its affiliates nor any of its respective directors, officers, servants and employees except where the publication states otherwise. This research report is not to be relied upon by any person in making any investment decision or otherwise advising with respect to, or dealing in, the securities mentioned, as it does not take into account the specific investment objectives, financial situation and particular needs of any person. Neither Daiwa Securities Group Inc. nor any of its affiliates is licensed to undertake any business within the Republic of Indonesia. Any display of any trade name or logo of the Daiwa Securities Group Inc. on this publication shall not be deemed to be an undertaking of any business within the Republic of Indonesia. Daiwa Securities Group Inc., its subsidiaries or affiliates, or its or their respective directors, officers and employees from time to time may have trades as principals, or have positions in, or have other interests in the securities of the company under research including derivatives in respect of such securities or may have also performed investment banking and other services for the issuer of such securities. The following are additional disclosures. Portions of this publication are prepared by Thanachart Securities Public Company Limited and distributed outside Thailand by Daiwa Securities Group Inc. and/or its non-U.S. affiliates except to the extent expressly provided herein. This publication and the contents hereof are intended for information purposes only, and may be subject to change without further notice. Any use, disclosure, distribution, dissemination, copying, printing or reliance on this publication for any other purpose without our prior consent or approval is strictly prohibited. Neither Thanachart Securities Public Company Limited (“Thanachart Securities”), Daiwa Securities Group Inc. nor any of their respective parent, holding, subsidiaries or affiliates, nor any of their respective directors, officers, servants and employees, represent nor warrant the accuracy or completeness of the information contained herein or as to the existence of other facts which might be significant, and will not accept any responsibility or liability whatsoever for any use of or reliance upon this publication or any of the contents hereof. Neither this publication, nor any content hereof, constitute, or are to be construed as, an offer or solicitation of an offer to buy or sell any of the securities or investments mentioned herein in any country or jurisdiction nor, unless expressly provided, any recommendation or investment opinion or advice. Any view, recommendation, opinion or advice expressed in this publication constitutes the views of the analyst(s) named herein and does not necessarily reflect those of Thanachart Securities, Daiwa Securities Group Inc. and/or their respective affiliates nor any of their respective directors, officers, servants and employees except where the publication states otherwise. This research report is not to be relied upon by any person in making any investment decision or otherwise advising with respect to, or dealing in, the securities mentioned, as it does not take into account the specific investment objectives, financial situation and particular needs of any person. All research reports are disseminated and available to our clients simultaneously through electronic publication to our internal client websites. Not all research content is redistributed to our clients or available to third-party aggregators, nor is Daiwa responsible for the redistribution of our research by third party aggregators. IMPORTANT This report is provided as a reference for making investment decisions and is not intended to be a solicitation for investment. Investment decisions should be made at your own discretion and risk. Content herein is based on information available at the time the report was prepared and may be amended or otherwise changed in the future without notice. We make no representations as to the accuracy or completeness. Daiwa Securities Co. Ltd. retains all rights related to the content of this report, which may not be redistributed or otherwise transmitted without prior consent. Ratings Issues are rated 1, 2, 3, 4, or 5 as follows:
Asia Pacific Daily | 25

1: Outperform TOPIX/benchmark index by more than 15% over the next 12 months. 2: Outperform TOPIX/benchmark index by 5-15% over the next 12 months. 3: Out/underperform TOPIX/benchmark index by less than 5% over the next 12 months. 4: Underperform TOPIX/benchmark index by 5-15% over the next 12 months. 5: Underperform TOPIX/benchmark index by more than 15% over the next 12 months. Benchmark index: TOPIX for Japan, S&P 500 for US, STOXX Europe 600 for Europe, HSI for Hong Kong, STI for SG, KOSPI for Korea, TWII for Taiwan, and S&P/ASX 200 for Australia. (Criteria above apply to rating assignments or updates from Jan 2015. For ratings assigned or updated prior to Jan 2015, criteria refer to performance vs. TOPIX/benchmark index over six months.) Japan Conflicts of Interest: Daiwa Securities Co. Ltd. may currently provide or may intend to provide investment banking services or other services to the company referred to in this report. In such cases, said services could give rise to conflicts of interest for Daiwa Securities Co. Ltd. Daiwa Securities Co. Ltd. and Daiwa Securities Group Inc.: Daiwa Securities Co. Ltd. is a subsidiary of Daiwa Securities Group Inc. Ownership of Securities: Daiwa Securities Co. Ltd. may currently, or in the future, own or trade either securities issued by the company referred to in this report or other securities based on such financial instruments. Daiwa Securities Group has filed major shareholding reports for the following companies of which it owns over 5% (as of 15 June 2016): ICHIKEN (1847); NISSEI BUILD KOGYO (1916); Accordia Golf (2131); Samty (3244); Sansei Landic (3277); MUGEN ESTATE (3299); Nippon Healthcare Investment Corporation (3308); KFC (3420); KI-STAR REAL ESTATE (3465); Billing System (3623); Enigmo (3665); Konoshima Chemical (4026); SEPTENI HOLDINGS (4293); Tri Chemical Laboratories (4369); RaQualia Pharma (4579); NOZAWA (5237); Nakayama Steel Works (5408); Toho Zinc (5707); TOKYO ROPE MFG. (5981); LINKBAL (6046); NS TOOL (6157); NAKAMURA CHOUKOU (6166); Kamakura Shinsho (6184); HIRATA Corporation (6258); SANSO ELECTRIC (6518); W-SCOPE (6619); MITSUMI ELECTRIC (6767); SUMIDA CORPORATION (6817); Ferrotec (6890); ENOMOTO (6928); Astmax (7162); GMO Click Holdings (7177); Nojima (7419); Daiko Denshi Tsushin (8023); Money Partners Group (8732); Daiwa Office Investment Corporation (8976); Japan Rental Housing Investments (8986); Cerespo (9625); Imperial Hotel (9708); PARKER CORPORATION (9845). Lead Management: Daiwa Securities Co. Ltd. has lead-managed public offerings and/or secondary offerings (excluding straight bonds) in the past twelve months for the following companies: DAIHO (1822); Yoshimura Food Holdings K.K. (2884); Torikizoku (3193); HOTLAND (3196); Activia Properties (3279); AEON REIT Investment Corporation (3292); Hulic Reit (3295); Nippon Healthcare Investment Corporation (3308); Tosei Reit Investment Corporation (3451); Kenedix Retail REIT Corporation (3453); KI-STAR REAL ESTATE (3465); SHOEI YAKUHIN (3537); Nousouken (3541); KOMEDA Holdings (3543); TECNOS JAPAN (3666); OPTiM (3694); Mynet (3928); BENEFIT JAPAN (3934); Globalway (3936); FUSO CHEMICAL (4368); OAT Agrio (4979); Interworks (6032); FIRSTLOGIC (6037); NIPPON VIEW HOTEL (6097); Brangista (6176); Japan Post Holdings (6178); GMO Media (6180); So-net Media Networks (6185); Atrae (6194); IWAKI (6237); TSUBAKI NAKASHIMA (6464); REFINVERSE (6531); Japan Investment Adviser (7172); Japan Post Insurance (7181); Japan Post Bank (7182); THE FIRST BANK OF TOYAMA (7184); ATOM (7412); TASAKI (7968); Kyokuto Boeki Kaisha (8093); ORIX JREIT (8954); HEIWA REAL ESTATE REIT (8966); Japan Hotel REIT Investment Corporation (8985); GAKKYUSHA (9769). (list as of 1 July 2016) The Affiliates of Daiwa Securities Group Inc.* engaged in investment banking service (lead-manager/joint lead-manager/co-manager of public offerings and/or secondary offerings [excluding straight bonds]) in the past twelve months for the following companies: econtext Asia Ltd (1390 HK); Accordia Golf Trust (AGT SP); Hua Hong Semiconductor Ltd (1347 HK); Mirae Asset Life Insurance Co Ltd (085620 KS). (list as of 1 September 2015) *Affiliates of Daiwa Securities Group Inc. for the purposes of this section shall mean any one or more of: Daiwa Capital Markets Hong Kong Limited, Daiwa Capital Markets SG Limited, Daiwa Capital Markets Australia Limited, Daiwa Capital Markets India Private Limited, Daiwa-Cathay Capital Markets Co., Ltd., Daiwa Securities Capital Markets Korea Co., Ltd. Notification items pursuant to Article 37 of the Financial Instruments and Exchange Law (This Notification is only applicable to where report is distributed by Daiwa Securities Co. Ltd.) If you decide to enter into a business arrangement with our company based on the information described in this report, we ask you to pay close attention to the following items. In addition to the purchase price of a financial instrument, our company will collect a trading commission* for each transaction as agreed beforehand with you. Since commissions may be
included in the purchase price or may not be charged for certain transactions, we recommend that you confirm the commission for each transaction. In some cases, our company also may charge a maximum of ¥ 2 million (including tax) per year as a standing proxy fee for our deposit of your securities, if you are a non-resident.
For derivative and margin transactions etc., our company may require collateral or margin requirements in accordance with an agreement made beforehand with you. Ordinarily in such cases, the amount of the transaction will be in excess of the required collateral or margin requirements.
There is a risk that you will incur losses on your transactions due to changes in the market price of financial instruments based on fluctuations in interest rates, exchange rates, stock prices, real estate prices, commodity prices, and others. In addition, depending on the content of the transaction, the loss could exceed the amount of the collateral or margin requirements.
There may be a difference between bid price etc. and ask price etc. of OTC derivatives handled by our company. Before engaging in any trading, please thoroughly confirm accounting and tax treatments regarding your trading in financial instruments with such experts as certified public accountants. * The amount of the trading commission cannot be stated here in advance because it will be determined between our company and you based on current market conditions and the content of each transaction etc. When making an actual transaction, please be sure to carefully read the materials presented to you prior to the execution of agreement, and to take responsibility for your own decisions regarding the signing of the agreement with our company. Corporate Name: Daiwa Securities Co. Ltd. Financial instruments firm: chief of Kanto Local Finance Bureau (Kin-sho) No.108 Memberships: Japan Securities Dealers Association, The Financial Futures Association of Japan, Japan Investment Advisers Association, Type II Financial Instruments Firms Association Disclosure of Interest of Thanachart Securities - Disclosure of Interest of Affin Hwang Investment Bank - Disclosure of Interest of Bahana Securities - Investment Banking Relationship Within the preceding 12 months, Bahana Securities has lead-managed public offerings and/or secondary offerings (excluding straight bonds) of the securities of the following companies: Merdeka Copper Gold Tbk PT (MDKA IJ); Anabatic Technologies Tbk PT (ATIC IJ); Aneka Tambang Persero Tbk PT (ANTM IJ). Hong Kong This research is distributed in Hong Kong by Daiwa Capital Markets Hong Kong Limited (大和資本市場香港有限公司) (“DHK”) which is regulated by the Hong Kong Securities and Futures Commission. Recipients of this research in Hong Kong may contact DHK in respect of any matter arising from or in connection with this research. Relevant Relationship (DHK) DHK may from time to time have an individual employed by or associated with it serves as an officer of any of the companies under its research coverage. Korea The developing analyst of this research and analysis material hereby states and confirms that the contents of this material correctly reflect the analyst’s views and opinions and that the analyst has not been placed under inappropriate pressure or interruption by an external party. Name of Analyst:
Asia Pacific Daily | 26
Disclosure of Analysts’ Interests If an analyst engaging in or a person who exercises influences on the preparation or publication of a Research Report containing recommendations for general investors to trade financial investment instruments with regard to which the analyst or the influential person has personal interests and if the recommendations contained in the Report may have impacts on the personal interests, Daiwa Securities Capital Markets Korea Co., Ltd.(“Daiwa Securities Korea”)shall ensure that the Analyst or the influential person notifies that he/she has personal interests with regard to: 1. The equity, the equity-linked bonds and the instruments with the subscription right to the equity issued by the legal entity covered in the Research Report (or the legal entity subject to the
investment recommendations); 2. The stock option granted by the legal entity covered in the Research Report (or the legal entity subject to the investment recommendations); or 3. The equity futures, the equity options and the equity-linked warrants backed by the equity prescribed in the preceding Paragraph 1 as the underlying assets. Legal Entities subject to Research Report Coverage Restrictions Daiwa Securities Korea hereby states and confirms that Daiwa Securities Korea has no conflicts of interests with the legal entity covered in this Research Report: 1. In that Daiwa Securities Korea does NOT offer direct or indirect payment guarantee for the legal entity by means of, for instance, guarantee, endorsement, provision of collaterals or the
acquisition of debts; 2. In that Daiwa Securities Korea does NOT own one-hundredth (or 1/100) or more of the total number of outstanding equities issued by the legal entity; 3. In that The legal entity is NOT an affiliated company of Daiwa Securities Korea pursuant to Sub-paragraph 3, Article 2 of the Monopoly Regulation and Fair Trade Act of Korea; 4. In that, although Daiwa Securities Korea offers advisory services for the legal entity with regard to an M&A deal, the size of the M&A deal does NOT exceed five-hundredths (or 5/100) of the
total asset size or the total number of equities issued and outstanding of the legal entity; 5. In that, although Daiwa Securities Korea acted in the capacity of a Lead Underwriter for the initial public offering of the legal entity, more than one-year has passed since the IPO date; 6. In that Daiwa Securities Korea is NOT designated by the legal entity as the ‘tender offer agent’ pursuant to the Paragraph 2, Article 133 of the Financial Services and Capital Market Act or
the legal entity is NOT the issuer of the equity subject to the proposed tender offer; this requirement, however applies until the maturity of the tender offer period; or 7. In that Daiwa Securities Korea does NOT have significant or material interests with regard to the legal entity. Disclosure of Prior Distribution to Third Party This report has not been distributed to the third party in advance prior to public release. The following explains the rating system in the report as compared to KOSPI, based on the beliefs of the author(s) of this report. "1": the security could outperform the KOSPI by more than 15% over the next 12 months, unless otherwise stated. "2": the security is expected to outperform the KOSPI by 5-15% over the next 12 months, unless otherwise stated. "3": the security is expected to perform within 5% of the KOSPI (better or worse) over the next 12 months, unless otherwise stated. "4": the security is expected to underperform the KOSPI by 5-15% over the next 12 months, unless otherwise stated. "5": the security could underperform the KOSPI by more than 15% over the next 12 months, unless otherwise stated. “Positive” means that the analyst expects the sector to outperform the KOSPI over the next 12 months, unless otherwise stated. “Neutral” means that the analyst expects the sector to be in-line with the KOSPI over the next 12 months, unless otherwise stated “Negative” means that the analyst expects the sector to underperform the KOSPI over the next 12 months, unless otherwise stated Additional information may be available upon request. SG This research is distributed in SG by Daiwa Capital Markets SG Limited and it may only be distributed in SG to accredited investors, expert investors and institutional investors as defined in the Financial Advisers Regulations and the Securities and Futures Act (Chapter 289), as amended from time to time. By virtue of distribution to these category of investors, Daiwa Capital Markets SG Limited and its representatives are not required to comply with Section 36 of the Financial Advisers Act (Chapter 110) (Section 36 relates to disclosure of Daiwa Capital Markets SG Limited’s interest and/or its representative’s interest in securities). Recipients of this research in SG may contact Daiwa Capital Markets SG Limited in respect of any matter arising from or in connection with the research. Australia This research is distributed in Australia by Daiwa Capital Markets Australia Limited and it may only be distributed in Australia to wholesale investors within the meaning of the Corporations Act. Recipients of this research in Australia may contact Daiwa Capital Markets Stockbroking Limited in respect of any matter arising from or in connection with the research. India This research is distributed in India to Institutional Clients only by Daiwa Capital Markets India Private Limited (Daiwa India) which is an intermediary registered with Securities & Exchange Board of India as a Stock Broker, Merchant Bank and Research Analyst. Daiwa India, its Research Analyst and their family members and its associates do not have any financial interest save as disclosed or other undisclosed material conflict of interest in the securities or derivatives of any companies under coverage. Daiwa India and its associates may have received compensation for any products other than Investment Banking (as disclosed) or brokerage services from the subject company in this report during the past 12 months. Unless otherwise stated in BlueMatrix disclosure link at https://daiwa3.bluematrix.com/sellside/Disclosures.action, Daiwa India and its associates do not hold more than 1% of any companies covered in this research report. There is no material disciplinary action against Daiwa India by any regulatory authority impacting equity research analysis activities as of the date of this report. Taiwan This research is distributed in Taiwan by Daiwa-Cathay Capital Markets Co., Ltd and it may only be distributed in Taiwan to institutional investors or specific investors who have signed recommendation contracts with Daiwa-Cathay Capital Markets Co., Ltd in accordance with the Operational Regulations Governing Securities Firms Recommending Trades in Securities to Customers. Recipients of this research in Taiwan may contact Daiwa-Cathay Capital Markets Co., Ltd in respect of any matter arising from or in connection with the research. Philippines This research is distributed in the Philippines by DBP-Daiwa Capital Markets Philippines, Inc. which is regulated by the Philippines Securities and Exchange Commission and the Phil ippines Stock Exchange, Inc. Recipients of this research in the Philippines may contact DBP-Daiwa Capital Markets Philippines, Inc. in respect of any matter arising from or in connection with the research. DBP-Daiwa Capital Markets Philippines, Inc. recommends that investors independently assess, with a professional advisor, the specific financial risks as well as the legal, regulatory, tax, accounting, and other consequences of a proposed transaction. DBP-Daiwa Capital Markets Philippines, Inc. may have positions or may be materially interested in the securities in any of the markets mentioned in the publication or may have performed other services for the issuers of such securities. For relevant securities and trading rules please visit SEC and PSE link at http://www.sec.gov.ph/irr/AmendedIRRfinalversion.pdf and http://www.pse.com.ph/ respectively. United Kingdom This research report is produced by Daiwa Securities Co. Ltd. and/or its affiliates and is distributed in the European Union, Iceland, Liechtenstein, Norway and Switzerland. Daiwa Capital Markets Europe Limited is authorised and regulated by The Financial Conduct Authority (“FCA”) and is a member of the London Stock Exchange and Eurex . This publication is intended for investors who are not Retail Clients in the United Kingdom within the meaning of the Rules of the FCA and should not therefore be distributed to such Retail Clients in the United Kingdom. Should you enter into investment business with Daiwa Capital Markets Europe’s affiliates outside the United Kingdom, we are obliged to advise that the protection afforded by the United Kingdom regulatory system may not apply; in particular, the benefits of the Financial Services Compensation Scheme may not be available. Daiwa Capital Markets Europe Limited has in place organisational arrangements for the prevention and avoidance of conflicts of interest. Our conflict management policy is available at http://www.uk.daiwacm.com/about-us/corporate-governance-regulatory. Germany This document is distributed in Germany by Daiwa Capital Markets Europe Limited, Niederlassung Frankfurt which is regulated by BaFin (Bundesanstalt fuer Finanzdienstleistungsaufsicht) for the conduct of business in Germany. Bahrain This research material is distributed in Bahrain by Daiwa Capital Markets Europe Limited, Bahrain Branch, regulated by The Central Bank of Bahrain and holds Investment Business Firm – Category 2 license and having its official place of business at the Bahrain World Trade Centre, South Tower, 7th floor, P.O. Box 30069, Manama, Kingdom of Bahrain. Tel No. +973 17534452 Fax No. +973 535113
Asia Pacific Daily | 27

United States This report is distributed in the U.S. by Daiwa Capital Markets America Inc. (DCMA). It may not be accurate or complete and should not be relied upon as such. It reflects the preparer’s views at the time of its preparation, but may not reflect events occurring after its preparation; nor does it reflect DCMA’s views at any time. Neither DCMA nor the preparer has any obligation to update this report or to continue to prepare research on this subject. This report is not an offer to sell or the solicitation of any offer to buy securities. Unless this report says otherwise, any recommendation it makes is risky and appropriate only for sophisticated speculative investors able to incur significant losses. Readers should consult their financial advisors to determine whether any such recommendation is consistent with their own investment objectives, financial situation and needs. This report does not recommend to U.S. recipients the use of any of DCMA’s non-U.S. affiliates to effect trades in any security and is not supplied with any understanding that U.S. recipients of this report will direct commission business to such non-U.S. entities. Unless applicable law permits otherwise, non-U.S. customers wishing to effect a transaction in any securities referenced in this material should contact a Daiwa entity in their local jurisdiction. Most countries throughout the world have their own laws regulating the types of securities and other investment products which may be offered to their residents, as well as a process for doing so. As a result, the securities discussed in this report may not be eligible for sales in some jurisdictions. Customers wishing to obtain further information about this report should contact DCMA: Daiwa Capital Markets America Inc., Financial Square, 32 Old Slip, New York, New York 10005 (Tel no.212-612-7000). Ownership of Securities: For “Ownership of Securities” information please visit BlueMatrix disclosure link at https://daiwa3.bluematrix.com/sellside/Disclosures.action. Investment Banking Relationships: For “Investment Banking Relationships” please visit BlueMatrix disclosure link at https://daiwa3.bluematrix.com/sellside/Disclosures.action. DCMA Market Making: For “DCMA Market Making” please visit BlueMatrix disclosure link at https://daiwa3.bluematrix.com/sellside/Disclosures.action. Research Analyst Conflicts: For updates on “Research Analyst Conflicts” please visit BlueMatrix disclosure link at https://daiwa3.bluematrix.com/sellside/Disclosures.action. The principal research analysts who prepared this report have no financial interest in securities of the issuers covered in the report, are not (nor are any members of their household) an officer, director or advisory board member of the issuer(s) covered in the report, and are not aware of any material relevant conflict of interest involving the analyst or DCMA, and did not receive any compensation from the issuer during the past 12 months except as noted: no exceptions. Research Analyst Certification: For updates on “Research Analyst Certification” and “Rating System” please visit BlueMatrix disclosure link at https://daiwa3.bluematrix.com/sellside/Disclosures.action. The views about any and all of the subject securities and issuers expressed in this Research Report accurately reflect the personal views of the research analyst(s) primarily responsible for this report (or the views of the firm producing the report if no individual analysts[s] is named on the report); and no part of the compensation of such analyst(s) (or no part of the compensation of the firm if no individual analyst[s)] is named on the report) was, is, or will be directly or indirectly related to the specific recommendations or views contained in this Research Report. The following explains the rating system in the report as compared to relevant local indices, unless otherwise stated, based on the beliefs of the author of the report. "1": the security could outperform the local index by more than 15% over the next 12 months. "2": the security is expected to outperform the local index by 5-15% over the next 12 months. "3": the security is expected to perform within 5% of the local index (better or worse) over the next 12 months. "4": the security is expected to underperform the local index by 5-15% over the next 12 months. "5": the security could underperform the local index by more than 15% over the next 12 months. Disclosure of investment ratings Rating Percentage of total Buy* 66.9% Hold** 19.7% Sell*** 13.5%
Source: Daiwa Notes: data is for single-branded Daiwa research in Asia (ex Japan) and correct as of 31 March 2016. * comprised of Daiwa’s Buy and Outperform ratings. ** comprised of Daiwa’s Hold ratings. *** comprised of Daiwa’s Underperform and Sell ratings. For stocks and sectors in Malaysia covered by Affin Hwang, the following rating system is in effect: Stocks: BUY: Total return is expected to exceed +10% over a 12-month period HOLD: Total return is expected to be between -5% and +10% over a 12-month period SELL: Total return is expected to be below -5% over a 12-month period NOT RATED: Affin Hwang Investment Bank Berhad does not provide research coverage or rating for this company. Report is intended as information only and not as a recommendation Sectors: OVERWEIGHT: Industry, as defined by the analyst’s coverage universe, is expected to outperform the KLCI benchmark over the next 12 months NEUTRAL: Industry, as defined by the analyst’s coverage universe, is expected to perform inline with the KLCI benchmark over the next 12 months UNDERWEIGHT: Industry, as defined by the analyst’s coverage universe is expected to under-perform the KLCI benchmark over the next 12 months Conflict of Interest Disclosure: Affin Hwang Ownership of Securities For “Ownership of Securities” information, please visit BlueMatrix disclosure Link at https://daiwa3.bluematrix.com/sellside/Disclosures.action. Investment Banking Relationships For “Investment Banking Relationship”, please visit BlueMatrix disclosure Link at https://daiwa3.bluematrix.com/sellside/Disclosures.action. Relevant Relationships Affin Hwang may from time to time have an individual employed by or associated with it serves as an officer of any of the companies under its research coverage. Affin Hwang market making Affin Hwang may from time to time make a market in securities covered by this research. For stocks and sectors in Indonesia covered by Bahana Securities, the following rating system is in effect: Stock ratings are based on absolute upside or downside, which is the difference between the target price and the current market price. Unless otherwise specified, these ratings are set with a 12-month horizon. It is possible that future price volatility may cause a temporary mismatch between upside/downside for a stock based on the market price and the formal rating. "Buy": the price of the security is expected to increase by 10% or more. "Hold": the price of the security is expected to range from an increase of less than 10% to a decline of less than 5%. "Reduce": the price of the security is expected to decline by 5% or more. Sector ratings are based on fundamentals for the sector as a whole. Hence, a sector may be rated “Overweight” even though its constituent stocks are all rated “Reduce”; and a sector may be rated “Underweight” even though its constituent stocks are all rated “Buy”. “Overweight”: positive fundamentals for the sector. “Neutral”: neither positive nor negative fundamentals for the sector. “Underweight”: negative fundamentals for the sector. Ownership of Securities For “Ownership of Securities” information, please visit BlueMatrix disclosure Link at https://daiwa3.bluematrix.com/sellside/Disclosures.action.
Asia Pacific Daily | 28
Investment Banking Relationships For “Investment Banking Relationship”, please visit BlueMatrix disclosure Link at https://daiwa3.bluematrix.com/sellside/Disclosures.action. Relevant Relationships (Bahana Securities) Bahana Securities may from time to time have an individual employed by or associated with it serves as an officer of any of the companies under its research coverage. Bahana Securities market making Bahana Securities may from time to time make a market in securities covered by this research. For stocks in Thailand covered by Thanachart Securities, the following rating system is in effect: Ratings are based on absolute upside or downside, which is the difference between the target price and the current market price. If the upside is 10% or more, the rating is BUY. If the downside is 10% or more, the rating is SELL. For stocks where the upside or downside is less than 10%, the rating is HOLD. Unless otherwise specified, these ratings are set with a 12-month horizon. Thus, it is possible that future price volatility may cause a temporary mismatch between upside/downside for a stock based on the market price and the formal rating. For the sector, Thanachart looks at two areas, ie, the sector outlook and the sector weighting. For the sector outlook, an arrow pointing up, or the word “Positive”, is used when Thanachart sees the industry trend improving. An arrow pointing down, or the word “Negative”, is used when Thanachart sees the industry trend deteriorating. A double-tipped horizontal arrow, or the word “Unchanged”, is used when the industry trend does not look as if it will alter. The industry trend view is Thanachart’s top-down perspective on the industry rather than a bottom-up interpretation from the stocks that Thanachart covers. An “Overweight” sector weighting is used when Thanachart has BUYs on majority of the stocks under its coverage by market cap. “Underweight” is used when Thanachart has SELLs on majority of the stocks it covers by market cap. “Neutral” is used when there are relatively equal weightings of BUYs and SELLs. Ownership of Securities For “Ownership of Securities” information, please visit BlueMatrix disclosure Link at https://daiwa3.bluematrix.com/sellside/Disclosures.action . Investment Banking Relationships For “Investment Banking Relationship”, please visit BlueMatrix disclosure Link at https://daiwa3.bluematrix.com/sellside/Disclosures.action . Relevant Relationships (Thanachart Securities) Thanachart Securities may from time to time have an individual employed by or associated with it serves as an officer of any of the companies under its research coverage. Thanachart Securities market making Thanachart Securities may from time to time make a market in securities covered by this research. Additional information may be available upon request. Japan - additional notification items pursuant to Article 37 of the Financial Instruments and Exchange Law (This Notification is only applicable where report is distributed by Daiwa Securities Co. Ltd.) If you decide to enter into a business arrangement with us based on the information described in materials presented along with this document, we ask you to pay close attention to the following items. In addition to the purchase price of a financial instrument, we will collect a trading commission* for each transaction as agreed beforehand with you. Since commissions may be included in
the purchase price or may not be charged for certain transactions, we recommend that you confirm the commission for each transaction. In some cases, we may also charge a maximum of ¥ 2 million (including tax) per year as a standing proxy fee for our deposit of your securities, if you are a non-resident of Japan. For derivative and margin transactions etc., we may require collateral or margin requirements in accordance with an agreement made beforehand with you. Ordinarily in such cases, the
amount of the transaction will be in excess of the required collateral or margin requirements. There is a risk that you will incur losses on your transactions due to changes in the market price of financial instruments based on fluctuations in interest rates, exchange rates, stock prices,
real estate prices, commodity prices, and others. In addition, depending on the content of the transaction, the loss could exceed the amount of the collateral or margin requirements. There may be a difference between bid price etc. and ask price etc. of OTC derivatives handled by us. Before engaging in any trading, please thoroughly confirm accounting and tax treatments regarding your trading in financial instruments with such experts as certified public accountants. *The amount of the trading commission cannot be stated here in advance because it will be determined between our company and you based on current market conditions and the content
of each transaction etc. When making an actual transaction, please be sure to carefully read the materials presented to you prior to the execution of agreement, and to take responsibility for your own decisions
regarding the signing of the agreement with us. Corporate Name: Daiwa Securities Co. Ltd. Financial instruments firm: chief of Kanto Local Finance Bureau (Kin-sho) No.108 Memberships: Japan Securities Dealers Association, Financial Futures Association of Japan Japan Securities Investment Advisers Association Type II Financial Instruments Firms Association
Asia Pacific Daily | 29