ASIA BOND MONITOR - AsianBondsOnline
48
ASIA BOND MONITOR JUNE 2013
Transcript of ASIA BOND MONITOR - AsianBondsOnline
ASIA BOND
MONITORJUNE 2013

ASIA BOND
MONITORJUNE 2013

The Asia Bond Monitor (ABM) reviews recent developments in East Asian local currency bond markets along with outlook, risks, and policy challenges. It covers the 10 members of the Association of Southeast Asian Nations (ASEAN) plus the People’s Republic of China; Hong Kong, China; and the Republic of Korea.
The ABM is a part of the Asia Bond Market Initiative (ABMI), an ASEAN+3 initiative supported by the Asian Development Bank and funded by the Government of Japan.
Download the ABM athttp://www.asianbondsonline.adb.org/documents/abm_jun_2013.pdf
How to reach us:Asian Development Bank Office of Regional Economic Integration6 ADB Avenue, Mandaluyong City1550 Metro Manila, PhilippinesTel +63 2 632 6688Fax +63 2 636 2183E-mail: [email protected]
The Asia Bond Monitor June 2013 was prepared by ADB’s Office of Regional Economic Integration and does not neces sarily reflect the views of ADB's Board of Governors or the countries they represent.
© 2013 Asian Development Bank
All rights reserved. Published 2013. Printed in the Philippines.
ISSN 2219-1526 (PDF)ISBN 978-92-9254-134-7 (PDF)Publication Stock No. RPS135686-2
Cataloging-in-Publication Data
Asian Development Bank.Asia Bond Monitor—June 2013.
Mandaluyong City, Philippines: Asian Development Bank, 2013.
1. Regionalism. 2. Subregional cooperation. 3. Economic development. 4. Asia.I. Asian Development Bank.
The views expressed in this publication are those of the authors and do not necessarily reflect the views and policies of the Asian Development Bank (ADB) or its Board of Governors or the governments they represent. ADB does not guarantee the accuracy of the data included in this publication and accepts no responsibility for any consequence of their use. Use of the term “country” does not imply any judgment by the authors or ADB as to the legal or other status of any territorial entity. “Asia” refers only to ADB’s Asian member economies.
ADB encourages printing or copying information exclusively for personal and noncommercial use with proper acknowledgment of ADB. Users are restricted from reselling, redistributing, or creating derivative works for commercial purposes without the express, written consent of ADB.
Asian Development Bank6 ADB Avenue, Mandaluyong City1550 Metro Manila, PhilippinesTel +63 2 632 4444Fax +63 2 636 4444www.adb.org
Printed on recycled paper.

Contents
Emerging East Asian Local CurrencyBond Markets: A Regional UpdateHighlights 2
Introduction: Global and Regional Market Developments 3
Bond Market Developments in the First Quarter of 2013 6
Policy and Regulatory Developments 21
Market Summaries 25
People’s Republic of China 25
Hong Kong, China 28
Indonesia 30
Republic of Korea 32
Malaysia 34
Philippines 36
Singapore 38
Thailand 40
Viet Nam 42


Emerging East Asian Local Currency Bond Markets: A Regional Update
1
D R A F T - U N D E R E M B A R G O
Emerging East Asian Local Currency Bond Markets:A Regional Update

Asia Bond Monitor
2
HighlightsLCY Bond Market Growth in Emerging East Asia
The quarter-on-quarter (q-o-q) growth rate •for emerging East Asia’s local currency (LCY) bond market in 1Q13 was 2.9%, slightly less than the 3.0% posted in 4Q12, as the region’s bond market reached US$6.7 trillion in size.1 Thisoutcomereflectedpositiveq-o-qgrowthrates from the region’s government (2.0%)and corporate (4.6%) bond sectors.
The most rapidly growing markets on a •q-o-q basis in 1Q13 were those of Viet Nam (20.8%); Indonesia (5.9%); Singapore (5.1%); Hong Kong, China (3.6%); the Republic of Korea (3.1%); and the People’s Republic of China (PRC) (3.0%). The growth of Viet Nam’s bond market came entirely from its government sector, which grew 21.8%q-o-q. Viet Nam’s corporate sector has shrunk in recent years, falling to only US$1.1 billion at the end of 1Q13. The growth of the Indonesian bond market was more balanced in 1Q13, with thegovernmentandcorporatesectorsrising6.2%and4.8%q-o-q,respectively.
The growth of Singapore’s bond market in •1Q13wasdrivenprimarilybya22.8%q-o-qrise in Monetary Authority of Singapore (MAS) bills outstanding, which reached US$30 billion in 1Q13. Singapore’s central governmentbills and bonds rose 2.9% q-o-q to reach US$118 billion, while corporate bonds grew 3.4% to reach US$104 billion.
1 Emerging East Asia comprises the People’s Republic of China; Hong Kong, China; Indonesia; the Republic of Korea; Malaysia; the Philippines; Singapore; Thailand; and Viet Nam.
The regional bond market’s year-on-year •(y-o-y) growth rate in 1Q13 was 12.1%, almost the same as in 4Q12. The y-o-y growth rate fortheregion’sgovernmentbondsectorwas8.3%, while the corporate sector expanded a more robust 19.5%. The two most rapidly growing corporate bond markets on a y-o-y basis were those of the PRC and Indonesia, which are the largest (US$1.1 trillion) and one of the smallest (US$20 billion) in the region,respectively.
LCY Bond Market Structural Developments in Emerging East Asia
ForeignholdingsofEastAsianLCYgovernment•bonds continued to rise in 1Q13, except in the Republic of Korea and Japan.2 Foreign holdings of Indonesian government bondsas a share of the total remained the highest in the region at 32.6% at end-March, while foreign holdings of Malaysian governmentbonds rose to 31.2%.
Government bond yields have shifted•downward since the end of 2012 in most marketsonthebackofmoderating inflationand mostly unchanged policy rates. The only exceptions to this were Hong Kong, China; Indonesia;andSingaporewheregovernmentyield curves have shifted upward for mostmaturities since the beginning of the year duetorisinginflationaryconcerns.
2 East Asia refers to the nine economies of emerging East Asia plus Japan.

Emerging East Asian Local Currency Bond Markets: A Regional Update
3
Introduction: Global and Regional Market Developments
Table A: Changes in Global Financial Conditions
2-Year Government Bond (bps)
10-Year Government Bond (bps)
5-Year Credit Default Swap Spread (bps)
Equity Index (%)
FX Rate (%)
Major Advanced Economies
United States (4) (9) 0 12.0 –
United Kingdom (8) (14) 6 9.0 4.6
Japan 3 (18) (16) 35.3 (11.0)
Germany 3 (10) (5) 4.0 0.3
Emerging East Asia
China, People's Rep. of (9) (10) 6 (4.0) 1.2
Hong Kong, China 3 25 (1) 0.4 (0.1)
Indonesia (13) 32 (1) 16.6 0.6
Korea, Rep. of (30) (39) 5 (1.7) (3.3)
Malaysia (8) (13) 7 1.7 0.5
Philippines (73) (132) (12) 21.6 (0.4)
Singapore (8) 7 0 6.3 (0.9)
Thailand (13) (12) (2) 14.8 4.5
Viet Nam (74) (70) – 14.7 (0.5)
Select European Markets
Greece (109) (162) 0 7.3 0.3
Ireland (89) (127) (29) 13.6 0.3
Italy (68) (56) (60) 3.0 0.3
Portugal (36) (128) (75) 10.5 0.3
Spain (117) (121) (50) 3.1 0.3
– = not available, ( ) = negative, bps = basis points, FX = foreign exchange.Notes:1. Data reflect changes between 1 January and 30 April 2013.2. For emerging East Asia, a positive (negative) value for the FX rate indicates the appreciation (depreciation) of the local currrency
against the US dollar. 3. For European markets, a positive (negative) value for the FX rate indicates the depreciation (appreciation) of the local currrency
against the US dollar.Source: Bloomberg LP, Institute of International Finance (IIF), and Thomson Reuters.
The East Asian economy continued on its path of gradual recovery during the first several months of 2013, supported by a more optimistic investor outlook and improvements in major financial market indicators, including falling bond yields and gains in most stock markets (Table A). However, the region’s currencies have followed divergent paths since the beginning of the year. For example, the Thai baht appreciated 4.5% against the United States (US) dollar in 1Q13, while the Korean won depreciated 3.3%.
Credit default swap (CDS) spreads in the region remained relatively stable in 1Q13 (Figure A), reflecting global investors’ increasing confidence
as fears of a eurozone breakup receded and CDS spreads for European countries declined (Figure B). Emerging market sovereign bond spreads also declined on the back of growing global investor confidence amid the strong performance of the US stock market in recent weeks (Figure C).
Bond yields in advanced countries continued to trend downward in 1Q13, and recently bond yields in the peripheral countries of the eurozone have also been declining (Figure D). Meanwhile, Japanese long-term bond yields fell as the Bank of Japan stepped up efforts to meet its 2.0% inflation target with increased bond purchases.

Asia Bond Monitor
4
Figure A: Credit Default Swap Spreadsa, b
(senior 5-year)
0
200
400
600
800
1,000
1,200
1,400
Dec-07
Jun-08
Nov-08
Apr-09
Oct-09
Mar-10
Aug-10
Jan-11
Jul-11
Dec-11
May-12
Apr-13
Oct-12
mid-spread in basis points
China, People's Rep. ofHong Kong, China
Korea, Rep. ofJapan
MalaysiaPhilippinesThailand
Indonesia
Figure B: Credit Default Swap Spreads for Select European Marketsa, b (senior 5-year)
1,800
1,600
1,400
1,200
1,000
800
600
400
200
0
40,000
35,000
30,000
25,000
20,000
15,000
10,000
5,000
0Dec-07
Jun-08
Nov-08
Apr-09
Oct-09
Mar-10
Aug-10
Jan-11
Jul-11
Dec-11
May-12
Oct-12
Apr-13
mid-spread in basis points mid-spread in basis points
Portugal
IrelandItaly
Greece
Spain
Ireland, Italy,Portugal, Spain Greece
0
200
400
600
800
1,000
1,200
Jan-07
Oct-07
Jul-08
May-09
Feb-10
Dec-10
Sep-11
Jun-12
Apr-13
basis points
Figure E: JPMorgan EMBI Sovereign Stripped Spreadsa,b
240
156207
139124
Figure C: US Equity Volatility and Emerging Market Sovereign Bond Spreadsb
1,0009008007006005004003002001000
basis pointsindex90
80
70
60
50
40
30
20
10
0
Figure F: Foreign Holdings of LCY Government Bonds in Select Asian Economiesc (% of total)c
%
0
5
10
15
20
25
30
40
35
Mar-04
Dec-04
Sep-05
Jun-06
Mar-07
Dec-07
Sep-08
Jun-09
Dec-10
Mar-10
Jun-12
Mar-13
Sep-11
Indonesia MalaysiaJapan ThailandKorea, Rep. of
Figure D: 10-Year Government Bond Yieldsb
(% per annum)
6
5
4
3
2
1
0
eurozone, Japan, UK, USGreece, Ireland, Italy,
Portugal, Spain60
50
40
30
20
10
0
JapanItalyIreland
eurozoneGreece
USUK
PortugalSpain
EMBIG SpreadVIX Index
China, People’s Republic ofIndonesiaMalaysiaPhilippinesViet Nam
Jan-06
Aug-06
Mar-07
Oct-07
Jun-08
Jan-09
Aug-09
Mar-10
Nov-10
Jan-12
Aug-12
Apr-13
Jun-11
Jan-06
Aug-06
Mar-07
Oct-07
Jun-08
Jan-09
Aug-09
Mar-10
Nov-10
Jan-12
Aug-12
Apr-13
Jun-11
9.51
8.75
17.64
32.59
31.24
VIX EMBIG Spread
EMBI = Emerging Markets Bond Index, EMBIG = Emerging Markets Bond Index Global, LCY = local currency, UK = United Kingdom, US = United States, VIX = Chicago Board Options Exchange Volatility Index.Notes:a In US$ and based on sovereign bonds.b Data as of end-April 2013.c Data as of end-March 2013 except for the Republic of Korea and Japan as of end-December 2012.Source: AsianBondsOnline, Bloomberg LP, and Thomson Reuters.

Emerging East Asian Local Currency Bond Markets: A Regional Update
5
Interest rates remained low in most advanced countries and held steady in emerging East Asia with a few exceptions.3 For example, sovereign spreads in Viet Nam tightened in 1Q13 and have risen slightly since the beginning of the year in the People’s Republic of China (PRC) (Figure E).
Finally, the shares of foreign holdings of the region’s local currency (LCY) government bonds continued to rise in 1Q13, except in the Republic of Korea and Japan. The share of foreign holdings of government bonds in Indonesia remained the highest in the region at 32.6% of the total, while foreign holdings of Malaysian bonds reached 31.2% (Figure F).
3 Emerging East Asia comprises the People’s Republic of China; Hong Kong, China; Indonesia; the Republic of Korea; Malaysia; the Philippines; Singapore; Thailand; and Viet Nam.

Asia Bond Monitor
6
Bond Market Developmentsin the First Quarter of 2013Size and Composition
Total bonds outstanding in emerging East Asia’s LCY bond market grew 2.9% q-o-q and 12.1% y-o-y to reach US$6.7 trillion at the end of 1Q13, reflecting continued robust q-o-q growth in the corporate bond market and modest improvement in the government sector.4
The quarter-on-quarter (q-o-q) growth rate for emerging East Asia’s local currency (LCY) bond market in 1Q13 was 2.9%, slightly less than the 3.0% posted in 4Q12 (Figure 1a). The most rapidly growing markets on a q-o-q basis in 1Q13 were in Viet Nam (20.8%); Indonesia (5.9%); Singapore (5.1%); Hong Kong, China (3.6%); the Republic of Korea (3.1%); and the People’s Republic of China (PRC) (3.0%) (Table 1).
The size of Viet Nam’s LCY bond market, although small by regional standards, almost tripled from US$12.3 billion in 1Q10 to US$30.2 billion in 1Q13. This growth, however, came entirely from the government sector as the corporate bond sector has declined in size in recent years to only US$1.1 billion.
The growth of the Indonesian bond market has been more balanced, with the government and corporate bond sectors rising 6.2% and 4.8% q-o-q, respectively, in 1Q13. The Indonesian government has estimated that its 2013 budget deficit will be the equivalent of 1.6% of gross domestic product (GDP), but the government still needs to reduce gasoline subsidies to reach its deficit target. The growth of the Singapore bond market in 1Q13 was driven primarily by a 22.8% q-o-q rise in Monetary Authority of Singapore (MAS) bills outstanding, which reached US$30 billion. Singapore’s central
4 Emerging East Asia comprises the People’s Republic of China; Hong Kong, China; Indonesia; the Republic of Korea; Malaysia; the Philippines; Singapore; Thailand; and Viet Nam.
government bills and bonds rose 2.9% q-o-q to reach US$118 billion, while corporate bonds grew 3.4% q-o-q to reach US$104 billion.
A q-o-q growth rate of 3.1% in the Republic of Korea’s bond market in 1Q13 was driven primarily by 3.7% growth in its corporate bond market, compared with growth of only 2.2% in the government bond market. The q-o-q growth rate of the government bond market, however, could rise later this year if a supplementary spending bill that would raise the budget deficit to 1.8% of GDP, from an original estimate of 0.3%, is successfully implemented.
Growth in the Hong Kong, China bond market in 1Q13 was driven mainly by the government sector, while the PRC’s 3.0% q-o-q growth rate was driven primarily by its robust corporate sector, which grew 6.4% in 1Q13. In addition, the PRC government recently exempted the corporate
Figure 1a: Growth of LCY Bond Markets in 4Q12 and 1Q13 (q-o-q, %)
LCY = local currency, q-o-q = quarter-on-quarter.Notes:1. Calculated using data from national sources.2. Growth rates are calculated from LCY base and do not include currency
effects. 3. Emerging East Asia growth figures are based on end-March 2013
currency exchange rates and do not include currency effects.4. For the Philippines, 1Q13 government bonds outstanding data carried
over from February 2013. For Singapore, corporate bonds outstanding data based on AsianBondsOnline estimates.
Source: People's Republic of China (ChinaBond); Hong Kong, China (Hong Kong Monetary Authority); Indonesia (Bank Indonesia and Indonesia Stock Exchange); Republic of Korea (EDAILY BondWeb and The Bank of Korea); Malaysia (Bank Negara Malaysia); Philippines (Bureau of the Treasury and Bloomberg LP); Singapore (Monetary Authority of Singapore, Singapore Government Securities, and Bloomberg LP); Thailand (Bank of Thailand); and Viet Nam (Bloomberg LP).
China, People's Rep. of
Emerging East AsiaViet NamThailand
SingaporePhilippines
MalaysiaKorea, Rep. of
IndonesiaHong Kong, China 1Q13
4Q12
–5 0 5 10 252015

Emerging East Asian Local Currency Bond Markets: A Regional Update
7
Table 1: Size and Composition of LCY Bond Markets
1Q12 4Q12 1Q13 Growth Rate (LCY-base %) Growth Rate (US$-base %)Amount
(US$ billion)
% share
Amount(US$
billion)
% share
Amount(US$
billion)
% share
1Q12 1Q13 1Q12 1Q13
q-o-q y-o-y q-o-q y-o-y q-o-q y-o-y q-o-q y-o-y
China, People's Rep. of (PRC) Total 3,448 100.0 3,811 100.0 3,937 100.0 1.7 8.2 3.0 12.6 1.7 12.5 3.3 14.2 Government 2,575 74.7 2,772 72.7 2,827 71.8 1.4 4.5 1.7 8.2 1.4 8.7 2.0 9.8 Corporate 874 25.3 1,040 27.3 1,110 28.2 2.6 20.6 6.4 25.3 2.5 25.4 6.8 27.1 Hong Kong, China Total 171 100.0 177 100.0 184 100.0 1.6 3.0 3.6 7.2 1.7 3.1 3.5 7.2 Government 91 53.0 93 52.7 100 54.7 0.3 3.5 7.6 10.5 0.3 3.7 7.4 10.5 Corporate 80 47.0 84 47.3 83 45.3 3.2 2.3 (0.7) 3.5 3.3 2.5 (0.9) 3.5 Indonesia Total 111 100.0 111 100.0 119 100.0 2.0 (1.6) 5.9 13.9 1.1 (6.3) 6.6 7.1 Government 94 84.7 92 82.8 98 83.0 1.4 (5.5) 6.2 11.6 0.5 (10.0) 6.8 4.9 Corporate 17 15.3 19 17.2 20 17.0 5.3 27.8 4.8 26.9 4.4 21.6 5.4 19.2 Korea, Rep. of Total 1,290 100.0 1,471 100.0 1,453 100.0 3.2 10.0 3.1 10.5 4.9 6.4 (1.2) 12.7 Government 531 41.2 572 38.9 560 38.6 2.4 4.6 2.2 3.5 4.2 1.2 (2.1) 5.6 Corporate 759 58.8 899 61.1 893 61.4 3.7 14.1 3.7 15.4 5.5 10.4 (0.7) 17.6 Malaysia Total 298 100.0 327 100.0 322 100.0 9.5 16.6 (0.4) 9.0 13.2 15.1 (1.5) 8.0 Government 179 60.2 196 59.9 190 59.1 10.2 16.7 (1.7) 7.1 13.9 15.2 (2.8) 6.1 Corporate 119 39.8 131 40.1 132 40.9 8.6 16.5 1.6 12.1 12.2 15.0 0.4 11.0 Philippines Total 83 100.0 99 100.0 99 100.0 5.1 12.8 (0.3) 13.7 7.4 14.0 0.1 19.6 Government 73 87.5 86 87.1 86 86.9 5.6 13.2 (0.6) 12.8 7.9 14.3 (0.1) 18.7 Corporate 10 12.5 13 12.9 13 13.1 1.9 10.4 1.1 19.8 4.1 11.5 1.6 25.9 Singapore Total 212 100.0 243 100.0 252 100.0 7.7 19.7 5.1 17.3 11.0 20.0 3.6 18.9 Government 129 60.8 142 58.2 148 58.9 5.4 21.4 6.4 13.7 8.7 21.7 4.8 15.3 Corporate 83 39.2 102 41.8 104 41.1 11.5 17.3 3.4 22.9 14.9 17.5 1.9 24.7 Thailand Total 250 100.0 279 100.0 294 100.0 8.4 13.1 1.1 11.8 11.0 11.1 5.7 17.8 Government 200 79.8 221 79.3 232 78.7 7.1 12.3 0.3 10.2 9.6 10.3 4.8 16.1 Corporate 51 20.2 58 20.7 63 21.3 14.0 16.5 4.4 17.9 16.6 14.5 9.1 24.3 Viet Nam Total 20 100.0 25 100.0 30 100.0 12.8 20.1 20.8 53.3 13.8 20.4 20.3 52.7 Government 18 89.9 24 95.7 29 96.5 14.8 23.7 21.8 64.6 15.8 23.9 21.3 63.9 Corporate 2 10.1 1 4.3 1 3.5 (2.3) (4.1) (1.6) (47.2) (1.5) (3.9) (2.0) (47.4)Emerging East Asia (EEA) Total 5,883 100.0 6,544 100.0 6,689 100.0 3.0 9.3 2.9 12.1 3.7 10.7 2.2 13.7 Government 3,888 66.1 4,198 64.2 4,272 63.9 2.4 5.9 2.0 8.3 3.0 7.8 1.7 9.9 Corporate 1,994 33.9 2,346 35.8 2,418 36.1 4.0 16.7 4.6 19.5 5.0 16.9 3.1 21.2 EEA excl. PRC Total 2,434 100.0 2,733 100.0 2,753 100.0 4.8 10.9 2.9 11.4 6.7 8.4 0.7 13.1 Government 1,314 54.0 1,426 52.2 1,445 52.5 4.5 8.6 2.6 8.4 6.4 6.2 1.3 10.0 Corporate 1,121 46.0 1,306 47.8 1,308 47.5 5.1 13.8 3.2 15.0 7.1 11.1 0.1 16.7 Japan Total 11,897 100.0 11,663 100.0 10,832 100.0 0.9 3.1 0.9 3.5 (6.4) 3.4 (7.1) (9.0) Government 10,826 91.0 10,672 91.5 9,934 91.7 0.9 3.6 1.1 4.3 (6.3) 3.9 (6.9) (8.2) Corporate 1,072 9.0 991 8.5 898 8.3 0.3 (1.6) (1.6) (4.7) (7.0) (1.2) (9.4) (16.2)Memo Item: CNH Total 53 100.0 53 100.0 55 100.0 19.6 273.5 3.3 2.9 19.5 288.4 3.6 4.4 Government 7 14.0 12 22.9 13 23.4 13.4 55.0 5.9 72.0 13.4 61.1 6.3 74.4 Corporate 45 86.0 41 77.1 42 76.6 20.7 385.1 2.5 (8.4) 20.6 404.3 2.9 (7.1)
( ) = negative, LCY = local currency, q-o-q = quarter-on-quarter, y-o-y = year-on-year.Notes:1. For the Philippines, 1Q13 government bonds outstanding data carried over from February 2013. For Singapore, corporate bonds outstanding data based on AsianBondsOnline
estimates.2. Corporate bonds include issues by financial institutions.3. CNH bonds are renminbi-denominated bonds issued in Hong Kong, China. Data include certificates of deposits and bonds issued by foreign companies.4. Bloomberg LP end-of-period LCY–US$ rates are used.5. For LCY base, emerging East Asia growth figures based on end-March 2013 currency exchange rates and do not include currency effects.6. Emerging East Asia comprises the People’s Republic of China; Hong Kong, China; Indonesia; the Republic of Korea; Malaysia; the Philippines; Singapore; Thailand; and Viet Nam.Source: People’s Republic of China (ChinaBond); Hong Kong, China (Hong Kong Monetary Authority); Indonesia (Bank Indonesia and Indonesia Stock Exchange); Republic of Korea (EDAILY BondWeb and The Bank of Korea); Malaysia (Bank Negara Malaysia); Philippines (Bureau of the Treasury and Bloomberg LP); Singapore (Monetary Authority of Singapore, Singapore Government Securities, and Bloomberg LP); Thailand (Bank of Thailand); Viet Nam (Bloomberg LP); and Japan (Japan Securities Dealers Association).
Asia Bond Monitor
8
Figure 1b: Growth of LCY Bond Markets in 4Q12 and 1Q13 (y-o-y, %)
LCY = local currency, y-o-y = year-on-year.Notes:1. Calculated using data from national sources.2. Growth rates are calculated from LCY base and do not include currency
effects. 3. Emerging East Asia growth figures are based on end-March 2013
currency exchange rates and do not include currency effects.4. For the Philippines, 1Q13 government bonds outstanding data carried
over from February 2013. For Singapore, corporate bonds outstanding data based on AsianBondsOnline estimates.
Source: People's Republic of China (ChinaBond); Hong Kong, China (Hong Kong Monetary Authority); Indonesia (Bank Indonesia and Indonesia Stock Exchange); Republic of Korea (EDAILY BondWeb and The Bank of Korea); Malaysia (Bank Negara Malaysia); Philippines (Bureau of the Treasury and Bloomberg LP); Singapore (Monetary Authority of Singapore, Singapore Government Securities, and Bloomberg LP); Thailand (Bank of Thailand); and Viet Nam (Bloomberg LP).
China, People's Rep. of
Emerging East AsiaViet NamThailand
SingaporePhilippines
MalaysiaKorea, Rep. of
IndonesiaHong Kong, China 1Q13
4Q12
0 10 20 30 605040
bond sector from taxation, which should further contribute to its growth in 2013.
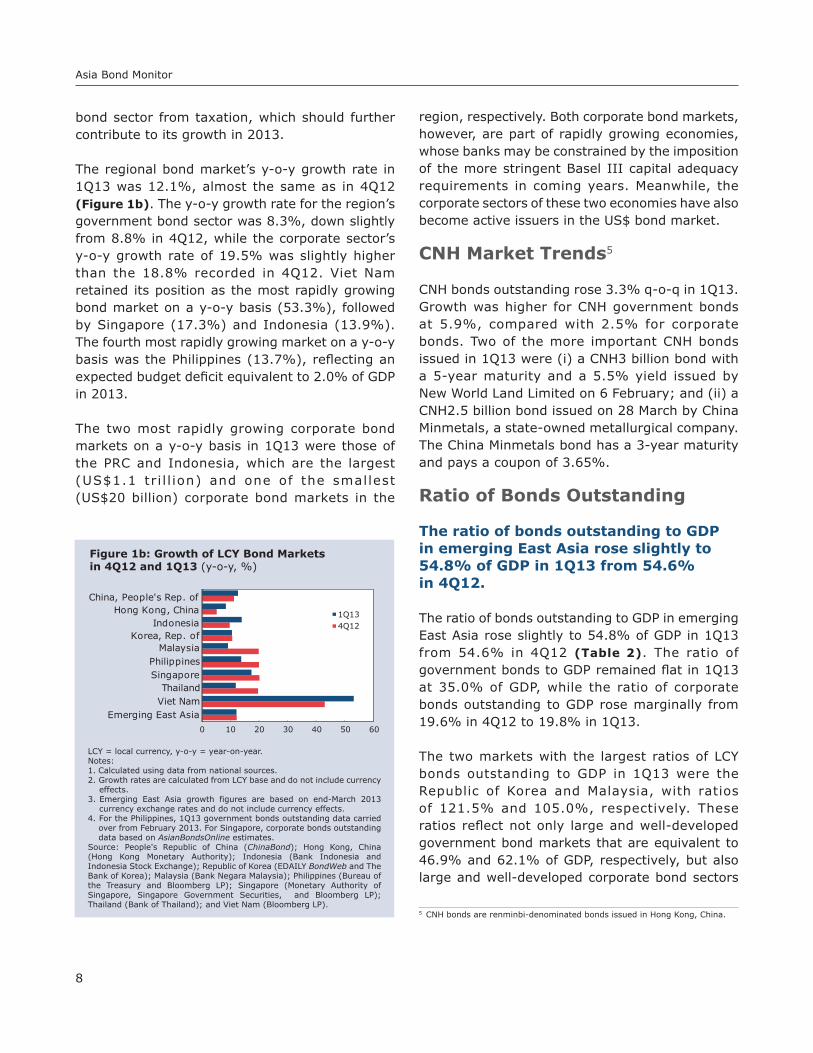
The regional bond market’s y-o-y growth rate in 1Q13 was 12.1%, almost the same as in 4Q12 (Figure 1b). The y-o-y growth rate for the region’s government bond sector was 8.3%, down slightly from 8.8% in 4Q12, while the corporate sector’s y-o-y growth rate of 19.5% was slightly higher than the 18.8% recorded in 4Q12. Viet Nam retained its position as the most rapidly growing bond market on a y-o-y basis (53.3%), followed by Singapore (17.3%) and Indonesia (13.9%). The fourth most rapidly growing market on a y-o-y basis was the Philippines (13.7%), reflecting an expected budget deficit equivalent to 2.0% of GDP in 2013.
The two most rapidly growing corporate bond markets on a y-o-y basis in 1Q13 were those of the PRC and Indonesia, which are the largest (US$1.1 tr i l l ion) and one of the smallest (US$20 billion) corporate bond markets in the
region, respectively. Both corporate bond markets, however, are part of rapidly growing economies, whose banks may be constrained by the imposition of the more stringent Basel III capital adequacy requirements in coming years. Meanwhile, the corporate sectors of these two economies have also become active issuers in the US$ bond market.
CNH Market Trends5
CNH bonds outstanding rose 3.3% q-o-q in 1Q13. Growth was higher for CNH government bonds at 5.9%, compared with 2.5% for corporate bonds. Two of the more important CNH bonds issued in 1Q13 were (i) a CNH3 billion bond with a 5-year maturity and a 5.5% yield issued by New World Land Limited on 6 February; and (ii) a CNH2.5 billion bond issued on 28 March by China Minmetals, a state-owned metallurgical company. The China Minmetals bond has a 3-year maturity and pays a coupon of 3.65%.
Ratio of Bonds Outstanding
The ratio of bonds outstanding to GDP in emerging East Asia rose slightly to 54.8% of GDP in 1Q13 from 54.6% in 4Q12.
The ratio of bonds outstanding to GDP in emerging East Asia rose slightly to 54.8% of GDP in 1Q13 from 54.6% in 4Q12 (Table 2). The ratio of government bonds to GDP remained flat in 1Q13 at 35.0% of GDP, while the ratio of corporate bonds outstanding to GDP rose marginally from 19.6% in 4Q12 to 19.8% in 1Q13.
The two markets with the largest ratios of LCY bonds outstanding to GDP in 1Q13 were the Republic of Korea and Malaysia, with ratios of 121.5% and 105.0%, respectively. These ratios reflect not only large and well-developed government bond markets that are equivalent to 46.9% and 62.1% of GDP, respectively, but also large and well-developed corporate bond sectors
5 CNH bonds are renminbi-denominated bonds issued in Hong Kong, China.

Emerging East Asian Local Currency Bond Markets: A Regional Update
9
that are equivalent to 74.7% and 42.9% of GDP, respectively.
Singapore, the market with the third-highest ratio of bonds to GDP, increased its ratio in 1Q13 to 89% from 86% in 4Q12 and 79.1% in 1Q12. This increase reflects a steady rise in the size of its government and corporate bond sectors over the last year, both in nominal terms and as a share of GDP.
The PRC bond market, the largest market in emerging East Asia, increased its ratio of bonds to GDP in 1Q13 to 46.2% from 45.7% in 4Q12. This increase was driven by a rise in its ratio of corporate bonds to GDP to 13.0% from 12.5% in 4Q12, while its government bond sector experienced a slight decline to 33.1% in 1Q13 from 33.3% in 4Q12. The ratio of PRC government bonds to GDP is in a range similar to those of the Philippines and Hong Kong, China, but is much less than those of the Republic of Korea, Malaysia, Singapore, and Thailand.
Issuance
LCY bond issuance in 1Q13 totaled US$803 billion, a 2.2% increase over 4Q12 driven by a 9.9% increase in issuance by the region’s central banks and monetary authorities, while issuance by central governments saw a modest 0.6% increase and corporate sector issuance declined.
LCY bond issuance in 1Q13 totaled US$803 billion, a 2.2% increase over 4Q12 (Table 3). This q-o-q increase, however, stemmed entirely from a 9.9% increase in issuance by central banks and monetary authorities, especially issuance by the Hong Kong Monetary Authority (HKMA). HKMA’s issuance in 1Q13 amounted to US$222 billion, equivalent to 57% of the region’s total issuance by central banks and monetary authorities of US$387 billion. The Bank of Thailand issued US$54 billion of bills and bonds. The next largest issues from central banks and monetary authorities came from The Bank of
Table 2: Size and Composition of LCY Bond Markets (% of GDP)
1Q12 4Q12 1Q13China, People’s Rep. of Total 44.9 45.7 46.2 Government 33.5 33.3 33.1 Corporate 11.4 12.5 13.0 Hong Kong, China Total 68.0 67.5 69.9 Government 36.0 35.6 38.2 Corporate 31.9 32.0 31.7 Indonesia Total 13.3 13.2 13.7
Government 11.2 11.0 11.4 Corporate 2.0 2.3 2.3Korea, Rep. of Total 117.1 123.0 121.5 Government 48.2 47.9 46.9 Corporate 68.9 75.2 74.7 Malaysia Total 101.9 106.6 105.0 Government 61.3 63.9 62.1 Corporate 40.5 42.8 42.9 Philippines Total 35.9 38.5 38.5 Government 31.5 33.5 33.5 Corporate 4.5 5.0 5.1 Singapore Total 79.1 86.0 89.0 Government 48.1 50.0 52.4 Corporate 31.0 35.9 36.6 Thailand Total 72.8 75.0 79.3 Government 58.1 59.5 62.4 Corporate 14.7 15.5 16.9 Viet Nam Total 15.6 17.7 20.5 Government 14.1 17.0 19.8 Corporate 1.6 0.8 0.7 Emerging East Asia Total 52.8 54.6 54.8 Government 34.9 35.0 35.0 Corporate 17.9 19.6 19.8 Japan Total 208.3 212.6 215.0 Government 189.6 194.6 197.2 Corporate 18.8 18.1 17.8
GDP = gross domestic product, LCY = local currency.Notes:1. Data for GDP is from CEIC. 1Q13 GDP figures carried over from 4Q12 except
for the People’s Republic of China, Indonesia, Viet Nam, and Japan.2. For the Philippines, 1Q13 government bonds outstanding data carried over
from February 2013. For Singapore, corporate bonds outstanding data based on AsianBondsOnline estimates.
Source: People’s Republic of China (ChinaBond); Hong Kong, China (Hong Kong Monetary Authority); Indonesia (Bank Indonesia and Indonesia Stock Exchange); Republic of Korea (EDAILY BondWeb and The Bank of Korea); Malaysia (Bank Negara Malaysia); Philippines (Bureau of the Treasury and Bloomberg LP); Singapore (Monetary Authority of Singapore, Singapore Government Securities, and Bloomberg LP); Thailand (Bank of Thailand); Viet Nam (Bloomberg LP); and Japan (Japan Securities Dealers Association).

Asia Bond Monitor
10
Table 3: LCY-Denominated Bond Issuance (gross)
Amount (LCY billion)
Amount (US$ billion)
Growth Rate(LCY-base %)
Growth Rate(US$-base %)
1Q13 %share 1Q13 %
share1Q13 1Q13
q-o-q y-o-y q-o-q y-o-yChina, People’s Rep. of (PRC)
Total 1,275 100.0 205 100.0 (9.7) 8.7 (9.4) 10.3 Government 724 56.8 117 56.8 (1.6) (2.9) (1.3) (1.5) Central Bank 0 0.0 0 0.0 – – – – Treasury and Other Govt. 724 56.8 117 56.8 (1.6) (2.9) (1.3) (1.5) Corporate 551 43.2 89 43.2 (18.5) 29.1 (18.3) 30.9
Hong Kong, China
Total 1,795 100.0 231 100.0 18.4 21.7 18.2 21.8 Government 1,734 96.6 223 96.6 18.3 25.4 18.1 25.4 Central Bank 1,727 96.2 222 96.2 18.0 25.3 17.8 25.3 Treasury and Other Govt. 7 0.4 1 0.4 133.3 40.0 132.9 40.0 Corporate 61 3.4 8 3.4 22.0 (33.3) 21.8 (33.3)
Indonesia
Total 113,036 100.0 12 100.0 29.7 15.6 30.5 8.6 Government 98,118 86.8 10 86.8 50.1 12.8 51.0 6.0 Central Bank 29,134 25.8 3 25.8 (23.8) 9.5 (23.4) 2.9 Treasury and Other Govt. 68,984 61.0 7 61.0 154.5 14.3 156.0 7.4 Corporate 14,918 13.2 2 13.2 (31.5) 38.1 (31.1) 29.8
Korea, Rep. of
Total 163,971 100.0 148 100.0 (3.7) (8.7) (7.7) (7.0) Government 66,249 40.4 60 40.4 (7.5) (2.3) (11.4) (0.3) Central Bank 43,090 26.3 39 26.3 (0.9) 1.9 (5.1) 3.9 Treasury and Other Govt. 23,159 14.1 21 14.1 (17.7) (9.2) (21.2) (7.4) Corporate 97,722 59.6 88 59.6 (0.9) (12.7) (5.1) (11.0)
Malaysia
Total 134 100.0 43 100.0 (3.8) (27.5) (4.9) (28.2) Government 104 78.1 34 78.1 (1.8) (22.0) (3.0) (22.7) Central Bank 77 57.9 25 57.9 (7.1) (27.9) (8.2) (28.6) Treasury and Other Govt. 27 20.2 9 20.2 17.3 2.1 16.0 1.2 Corporate 29 21.9 9 21.9 (10.2) (42.1) (11.2) (42.6)
Philippines
Total 215 100.0 5 100.0 37.2 (25.9) 37.9 (22.1) Government 196 90.9 5 90.9 39.0 (27.8) 39.6 (24.0) Central Bank 0 0.0 0 0.0 – – – –
Treasury and Other Govt. 196 90.9 5 90.9 39.0 (27.8) 39.6 (24.0) Corporate 20 9.1 0.5 9.1 21.9 0.0 22.5 5.1
Singapore
Total 93 100.0 75 100.0 4.4 (6.0) 2.8 (4.6) Government 89 95.6 72 95.6 2.5 (4.8) 1.0 (3.5) Central Bank 47 50.4 38 50.4 14.9 29.1 13.2 30.9 Treasury and Other Govt. 42 45.2 34 45.2 (8.5) (26.4) (9.8) (25.4) Corporate 4 4.4 3 4.4 71.2 (25.5) 68.6 (24.5)
Thailand
Total 2,198 100.0 75 100.0 (0.2) (25.5) 4.4 (21.5) Government 1,819 82.7 62 82.7 (2.1) (28.2) 2.3 (24.4) Central Bank 1,594 72.5 54 72.5 (5.9) (31.5) (1.6) (27.8) Treasury and Other Govt. 225 10.2 8 10.2 36.5 8.8 42.7 14.7 Corporate 380 17.3 13 17.3 10.2 (9.3) 15.2 (4.5)
continued on next page

Emerging East Asian Local Currency Bond Markets: A Regional Update
11
Amount (LCY billion)
Amount (US$ billion)
Growth Rate(LCY-base %)
Growth Rate(US$-base %)
1Q13 %share 1Q13 %
share1Q13 1Q13
q-o-q y-o-y q-o-q y-o-yViet Nam
Total 191,518 100.0 9 100.0 68.8 134.7 68.1 133.8 Government 191,518 100.0 9 100.0 69.1 134.7 68.3 133.8 Central Bank 112,857 58.9 5 58.9 92.7 270.3 91.8 268.8 Treasury and Other Govt. 78,661 41.1 4 41.1 43.7 53.9 43.1 53.3 Corporate 0 0.0 0 0.0 – – – –
Emerging East Asia (EEA)
Total – – 803 100.0 2.2 0.2 1.6 1.6 Government – – 591 73.6 6.5 1.3 6.2 2.6 Central Bank – – 387 48.2 9.9 6.5 9.8 7.9 Treasury and Other Govt. – – 204 25.4 0.6 (7.4) 0.02 (6.1) Corporate – – 212 26.4 (8.1) (2.6) (9.3) (1.0)
EEA excl. PRC
Total – – 598 100.0 7.1 (2.4) 6.0 (1.0) Government – – 475 79.4 8.7 2.3 8.2 3.7 Central Bank – – 387 64.7 9.9 6.5 9.8 7.9 Treasury and Other Govt. – – 88 14.7 3.6 (12.8) 1.8 (11.7) Corporate – – 124 20.6 1.2 (17.2) (1.6) (15.7)
Japan
Total 50,910 100.0 540 100.0 1.3 3.3 (6.7) (9.2) Government 48,183 94.6 511 94.6 2.7 5.3 (5.4) (7.4) Central Bank 0 0.0 0 0.0 – – – – Treasury and Other Govt. 48,183 94.6 511 94.6 2.7 5.3 (5.4) (7.4) Corporate 2,727 5.4 29 5.4 (18.2) (22.7) (24.7) (32.0)
– = not applicable, ( ) = negative, LCY = local currency, q-o-q = quarter-on-quarter, y-o-y = year-on-year.Notes:1. Corporate bonds include issues by financial institutions.2. Bloomberg LP end-of-period LCY–US$ rates are used.3. For LCY base, emerging East Asia growth figures are based on end-March 2013 currency exchange rates and do not include currency effects.Source: People’s Republic of China (ChinaBond); Hong Kong, China (Hong Kong Monetary Authority); Indonesia (Bank Indonesia, Indonesia Debt Management Of-fice, and Indonesia Stock Exchange); Republic of Korea (EDAILY BondWeb and The Bank of Korea); Malaysia (Bank Negara Malaysia); Philippines (Bloomberg LP); Singapore (Singapore Government Securities and Bloomberg LP); Thailand (Bank of Thailand); Viet Nam (Bloomberg LP); and Japan (Japan Securities Dealers Association).
Table 3 continued
Korea (US$39 billion) and the Monetary Authority of Singapore (US$38 billion).
Issuance of treasury bills, bonds, and other central government paper rose only 0.6% in 1Q13, while issuance of corporate bonds fell 8.1%. The PRC continued to issue the largest portion of treasury bills and bonds in the region, accounting for US$117 billion out of a regional total of US$204 billion worth of treasury bills, bonds, and other central government paper in 1Q13. The next largest issuers of treasuries and other central government bonds in 1Q13 were Singapore (US$34 billion) and the Republic of Korea (US$21 billion). Thailand, Indonesia, and the Philippines issued US$8 billion, US$7 billion, and
US$5 billion, respectively, of central government bills and bonds during the quarter, resulting in a 154.5% q-o-q issuance growth rate for Indonesian government bonds, 39.0% for the Philippines, and 36.5% for Thailand. (Indonesia typically frontloads its issuance program each year.)
The two largest issuers of corporate bonds in 1Q13 were the PRC and the Republic of Korea, which issued nearly identical amounts of US$89 billion and US$88 billion, respectively, and accounted for US$177 billion out of the region’s total corporate issuance of US$212 billion in 1Q13.
These developments in 2013 have been put into their historical perspective in Figures 2a, 2b,

Asia Bond Monitor
12
CB = central bank, LCY = local currency, PRC = People's Republic of China, SOE = state-owned enterprise.Notes:1. Includes data for the People's Republic of China; Hong Kong, China;
Indonesia; the Republic of Korea; Malaysia; the Philippines; Singapore; Thailand; and Viet Nam.
2. Bonds issued by state-owned entities are categorized as government bonds for the Philippines, Thailand, and Viet Nam.
3. For the PRC, government issuance includes policy bank bonds, local government bonds, and savings bonds.
4. For the Republic of Korea, government issuance includes bonds issued by Korea Development Bank, Korea National Housing Corp., and Seoul Metro (formerly Seoul Metropolitan Subway Corp.).
Source: AsianBondsOnline.
Figure 2a: Government (including SOE) and Central Bank Bond Issuance
900
800
700
600
500
400
300
200
100
0
US$ billion
Government and SOE Issuance Central Bank Issuance
1Q09 2Q09 3Q09 4Q09 1Q10 2Q10 3Q10 4Q10 1Q11 2Q11 3Q11 4Q11 1Q12 2Q12 3Q12 1Q134Q12
Figure 2b: Government (including SOE) and Corporate Bond Issuance
0
50
100
150
200
250
300
350
US$ billion
Government and SOE Issuance (excluding CB)
Total Issuance (excluding PRC) PRC Issuance
Corporate Issuance
Figure 2c: Total LCY Bond Issuance
0
100
200
300
400
500
600
700
800
US$ billion
1Q09 2Q09 3Q09 4Q09 1Q10 2Q10 3Q10 4Q10 1Q11 2Q11 3Q11 4Q11 1Q12 2Q12 3Q12 1Q134Q12
1Q09 2Q09 3Q09 4Q09 1Q10 2Q10 3Q10 4Q10 1Q11 2Q11 3Q11 4Q11 1Q12 2Q12 3Q12 1Q134Q12
and 2c. Issuance by governments and state-owned enterprises (SOEs) was roughly the same in 1Q13 as it was in 4Q12, after having risen to somewhat higher levels in the first 3 quarters of 2012 (Figure 2a). Issuance by central banks and monetary authorities continued to rise in 1Q13, following a previous rise in 4Q12 off of a low reached in 3Q12. Corporate issuance, however, declined in 1Q13 after having risen for 2 quarters in the second half of 2012 (Figure 2b). Finally, total issuance (excluding the PRC) and issuance from the PRC are contrasted in Figure 2c, which shows that in 1Q13 total issuance (excluding the PRC) rose slightly and issuance from the PRC declined for the second quarter in a row. The PRC did not issue any central bank bills or bonds in 1Q13, continuing a trend in place since the beginning of last year, while issuance of government bonds fell 1.6% q-o-q and issuance of corporate bonds fell a more substantial 18.5% due to a decline in issuance from commercial banks, mainly in the form of subordinated debt.
In early May, the People’s Bank of China (PBOC) resumed issuance of short-term 3-month bills for the first time in 17 months by issuing CNY10 billion of 3-month bills with an average coupon rate of 2.9%.
Bills-to-Bonds Ratios
The ratio of bills to bonds rose in five of the nine markets in emerging East Asia in 1Q13.
The ratio of bills to bonds issued by governments, central banks, and monetary authorities rose in Indonesia, the Republic of Korea, Singapore, and Viet Nam in 1Q13 (Figure 3a). This ratio also rose in Hong Kong, China, whose bills-to-bonds ratio of 4.60 at the end of 1Q13 was up from 4.34 at the end of 4Q12, putting it on a different scale than is depicted in Figure 3a. The major factor driving the rise in the bills-to-bonds ratios for these other markets was the significant issuance of bills by central banks and monetary authorities, as shown by the stocks of central bank and monetary authority bills outstanding in Figure 3b.

Emerging East Asian Local Currency Bond Markets: A Regional Update
13
Figure 3a: Total Bills-to-Bonds Ratios
Notes:1. Total bills comprise central bank bills plus treasury bills. Bonds
comprise long-term bonds (more than 1 year in maturity) issued by central governments and central banks.
2. Hong Kong, China is not included in the chart due to its much higher bills-to-bonds ratio.
Source: AsianBondsOnline.
1.20
1.00
0.80
0.60
0.40
0.20
0.00
Chi
na,
Peop
le’s
Rep
. of
Indo
nesi
a
Kor
ea,
Rep
. of
Mal
aysi
a
Phili
ppin
es
Sin
gapo
re
Thai
land
Vie
t N
am
1Q12 4Q12 1Q13
The trends in Figure 3b are consistent with the issuance data for central banks and monetary authorities presented earlier in Table 3. Hong Kong, China; the Republic of Korea; and Singapore issued significant amounts of central bank and monetary authority securities in 1Q13, while Indonesia and Viet Nam issued smaller amounts that nevertheless contributed to a significant rise in the stock of central bank bills in these two countries. Viet Nam’s small stock of central bank bills outstanding is explained by the fact that it only started issuing central bank bills last year.
Meanwhile, Indonesia has significantly reduced its stock of Sertifikat Bank Indonesia (SBI) in recent years. The stock of SBI hit a low of US$7 billion outstanding in September and October 2012 before rising as Bank Indonesia resumed issuance. SBI issued since February 2011 have a maturity of 9 months, compared with previous maturities of 1, 3, and 6 months. Thus, SBI now have an average maturity that is longer than most other central bank bills.
Figure 3b: Central Bank Bills Outstanding
Notes:1. The People’s Republic of China ceased issuance of central bank
bills in the beginning of 2012.2. The Philippines has no central bank bills outstanding. Source: AsianBondsOnline.
1009080706050403020100
Chi
na,
Peop
le’s
Rep
. of
Indo
nesi
a
Hon
g Kon
g,Chi
na
Kor
ea,
Rep
. of
Mal
aysi
a
Sin
gapo
re
Thai
land
Vie
t N
am
1Q12 4Q12 1Q13
US$ billion
Foreign Holdings
Foreign holdings of East Asian LCY government bonds rose in most markets in 1Q13.6
Foreign holdings of East Asian LCY government bonds rose in most markets in 1Q13 (Figure 4). The only exceptions were foreign holdings of Japanese government bonds (JGBs), which fell to 8.8% of total JGBs in December 2012 from 9.1% in September, and the Republic of Korea, where foreign holdings as a percentage of the total have trended downward since the middle of 2011. The largest increase of foreign holdings of government bonds over the past year was in Thailand, where the foreign share rose from 12.2% in March 2012 to 17.6% a year later.
Indonesia remains the emerging East Asian economy with the largest share of foreign holdings of its LCY government bonds. Foreign holdings of Indonesian government bonds stood at 32.6% of
6 East Asia refers to the nine economies of emerging East Asia plus Japan.

Asia Bond Monitor
14
the total in March, a slight decline from 33.0% in December 2012. Meanwhile, foreign holdings of Malaysian government bonds have risen over the last year to reach 31.2% in March, a level that is very close to the share of foreign holdings of government bonds in Indonesia.
These trends are not only the result of modestly higher yields than are currently available in the United States (US) or many European government bond markets, but also a perception that Asian credit quality is in many cases at least comparable—and in some cases even superior—to the credit quality of government bonds issued in advanced economies.
Government Bond Yield Curves
Most government yield curves have shifted downward since the end of 2012 on the back of moderating inflation and stable central bank policy rates.
Most government bond yield curves have shifted downward since the end of 2012 (Figure 5) on the back of inflation rates that have generally fallen since the middle of 2011 (Figures 6a, 6b);
a continued commitment to monetary easing policies in Europe, Japan, and the US; and mostly unchanged policy rates at central banks and monetary authorities in emerging East Asia (Figures 7a, 7b). The most important change in monetary policy among industrialized countries since the beginning of 2013 has been the Bank of Japan’s (BOJ) adoption of a more aggressive stance toward monetary easing, which has resulted in a dramatic downward shift of the Japanese yield curve. At its monetary policy meeting held on 22 May, BOJ announced that it will conduct money market operations targeting an increase in the monetary base of JPY60–JPY70 trillion annually, with a view toward returning the economy to sustainable growth and 2.0% annual inflation.
The yield curves of the Republic of Korea, Philippines, Thailand, Viet Nam, and (to a lesser extent) Malaysia have shifted downward. Among the central banks in these markets, only The Bank of Korea and the Bank of Thailand have changed their policy rates since the beginning of the year. The Bank of Korea reduced its 7-day repurchase rate by 25 basis points (bps) to 2.5% on 9 May, and the Bank of Thailand lowered its 1-day repurchase rate by 25 bps to 2.5% in meetings on 28–29 May. The State Bank of Viet Nam’s (SBV) prime lending rate—its official policy rate—has remained unchanged, but SBV did reduce other key rates on 13 May. SBV reduced its refinance rate, discount rate, and overnight interbank lending rate by 100 bps each to 7.0%, 5.0%, and 8.0%, respectively.
Bangko Sentral ng Pilipinas (BSP) kept its policy rates—the overnight borrowing rate and the lending rate—unchanged at its meeting on 25 April, but it did lower interest rates on its Special Deposit Account facility by 50 bps to 2.0% across all tenors.
The yield curves for Indonesia and Singapore, on the other hand, shifted upward in 1Q13 for most maturities as Indonesia and (to a lesser extent) Singapore have been facing rising inflationary pressures. Indonesia’s policy rate is currently the
LCY = local currency. Note: Data as of end-March 2013 except for the Republic of Korea and Japan as of end-December 2012.Source: AsianBondsOnline.
Figure 4: Foreign Holdings of LCY Government Bonds in Select Asian Economies (% of total)
%
0
5
10
15
20
25
30
40
35
Mar-04
Dec-04
Sep-05
Jun-06
Mar-07
Dec-07
Sep-08
Jun-09
Dec-10
Mar-10
Jun-12
Dec-13
Sep-11
Indonesia MalaysiaJapan ThailandKorea, Rep. of
31.24
32.59
8.75
17.64
9.51

Emerging East Asian Local Currency Bond Markets: A Regional Update
15
Time to maturity (years)31-Dec-1230-Apr-13
Time to maturity (years)31-Dec-1230-Apr-13
Time to maturity (years)31-Dec-1230-Apr-13
Time to maturity (years)31-Dec-1230-Apr-13
Time to maturity (years)31-Dec-1230-Apr-13
Time to maturity (years)31-Dec-1230-Apr-13
Time to maturity (years)31-Dec-1230-Apr-13
Time to maturity (years)31-Dec-1230-Apr-13
Time to maturity (years)31-Dec-1230-Apr-13
Time to maturity (years)31-Dec-1230-Apr-13
Time to maturity (years)31-Dec-1230-Apr-13
Time to maturity (years)31-Dec-1230-Apr-13
LCY = local currency. Source: Based on data from Bloomberg LP.
United StatesYield (%) Yield (%) Yield (%)
European Union Japan
0 2 4 6 8 10 12 14 16 18 20 22 0 2 4 6 8 10 12 14 16 0 2 4 6 8 10 12 14 16
0 4 8 12 16 20 24 28 32 0 4 8 12 16 20 24 28 32 0 4 8 12 16 20 24 28 32 36 40 44
0 1 2 3 4 5 6 7 8 9 10 11 0 2 4 6 8 10 12 14 16
0 2 4 6 8 10 12 14 16 18 20 22
0 4 8 12 16 20 24 28 32
0 2 4 6 8 10 12 14 16 18 20 22 0 3 6 9 12 15 18 21 24 27
Figure 5: Benchmark Yield Curves—LCY Bonds
China, People's Rep. ofYield (%) Hong Kong, ChinaYield (%) Yield (%) Indonesia
Yield (%) Yield (%) Yield (%)
0.4
0.0
0.8
1.2
0.0
0.5
1.0
1.5
2.0
2.5
2.4
2.7
3.0
3.3
3.6
–1.0
0.0
1.0
2.0
3.0
0.0
0.5
1.0
1.5
2.0
2.5
0.8
0.0
1.6
2.4
3.2
Korea, Rep. of Malaysia Philippines
Singapore Thailand Viet Nam
2.5
3.1
2.8
3.5
2.6
3.0
3.4
3.8
4.2
7.5
8.5
9.5
10.5
0.0
1.5
3.0
4.5
6.0
2.4
2.9
3.4
3.9
4.0
4.8
5.5
6.3
7.0
Yield (%) Yield (%) Yield (%)
3.9

Asia Bond Monitor
16
highest in the region after Viet Nam’s, although Indonesian consumer price inflation moderated to 5.6% in April from 5.9% in March, following an uptick earlier this year. Indonesian authorities remain reluctant to raise their policy interest rate, which is currently at a historic low of 5.75%. Singapore does not have an official policy rate, but the growth of MAS bills has been very brisk since MAS first began issuing bills as part of its money market operations in April 2011.
The yield curve of the PRC has tightened at its longer- and shorter-ends since the end of 2012, while remaining largely unchanged in the belly of the curve. The PRC’s annual inflation rate rose slightly in April to 2.4% from 2.1% in March, but remains well below a high of nearly 6.5% in mid-2011. Furthermore, the PRC’s monetary authorities remain concerned about excessive investment in housing and other speculative sectors, as well as capital inflows. Thus, after
Figure 6b: Headline Inflation Rates
China, People's Rep. of
Korea, Rep. of
MalaysiaPhilippinesJapan
–3
0
3
6
9
12
%
Note: Data as of end-March 2013 except for the Republic of Korea as of end-April 2013.Source: Bloomberg LP.
3.20
1.20
1.60
2.10
Jan-08 Aug-08 Sep-12 Apr-13Feb-12Jul-11May-10 Dec-10Oct-09Mar-09
–0.90
7.074.57
3.003.70
1.50
–0.10
Figure 6a: Headline Inflation Rates
Hong Kong, China
SingaporeIndonesia
ThailandViet Nam
–5
0
5
10
15
20
25
30
%
Note: Data as of end-April 2013 except for Hong Kong, China and Singapore as of end-March 2013.Source: Bloomberg LP.
Jan-08 Aug-08 Sep-12 Apr-13Feb-12July-11May-10 Dec-10Oct-09Mar-09
6.61
5.57
3.50
3.70
2.42
China, People's Rep. ofIndonesiaViet Nam
Note: Data as of end-April 2013.Source: Bloomberg LP except for Viet Nam (State Bank of Viet Nam).
3
6
9
12
15%
Jan-08 Oct-08 Jul-09 Apr-10 Jan-11 Oct-11 Jul-12 Jan-13
6.00
5.75
9.00
Figure 7b: Policy Rates
2.75
Hong Kong, ChinaKorea, Rep. ofMalaysia
PhilippinesThailand
Note: Data as of end-April 2013.Source: Bloomberg LP.
7
6
5
4
3
2
1
0
%
Jan-08 Oct-08 Jul-09 Apr-10 Jan-11 Oct-11 Jul-12 Jan-13
0.50
2.75
3.00
3.50
Figure 7a: Policy Rates
Emerging East Asian Local Currency Bond Markets: A Regional Update
17
modest reductions in the middle of 2012, they have left the key policy rates—the 1-year lending rate and the 1-year deposit rate—unchanged since then.
As mentioned earlier, the PBOC resumed issuance of short-term 3-month bills in May. Prior to this, the PBOC had been relying on reverse repurchase agreements to manage liquidity. Furthermore, the State Administration of Foreign Exchange (SAFE) issued new rules in early May to manage capital inflows, linking banks’ lower limit on the net open position (NOP) to the reference loan-to-deposit ratio (LDR); a bank’s lower limit on the NOP will be adjusted if its LDR exceeds the reference LDR.
The Hong Kong, China yield curve shifted upward at its longer-end in 1Q13. This seems to reflect the fact that annual inflation in Hong Kong, China has settled in a range between 3.0% and 4.5%. Consumer price inflation in Hong Kong, China fell to 3.6% y-o-y in March from 4.4% in February due to a decline in food prices.
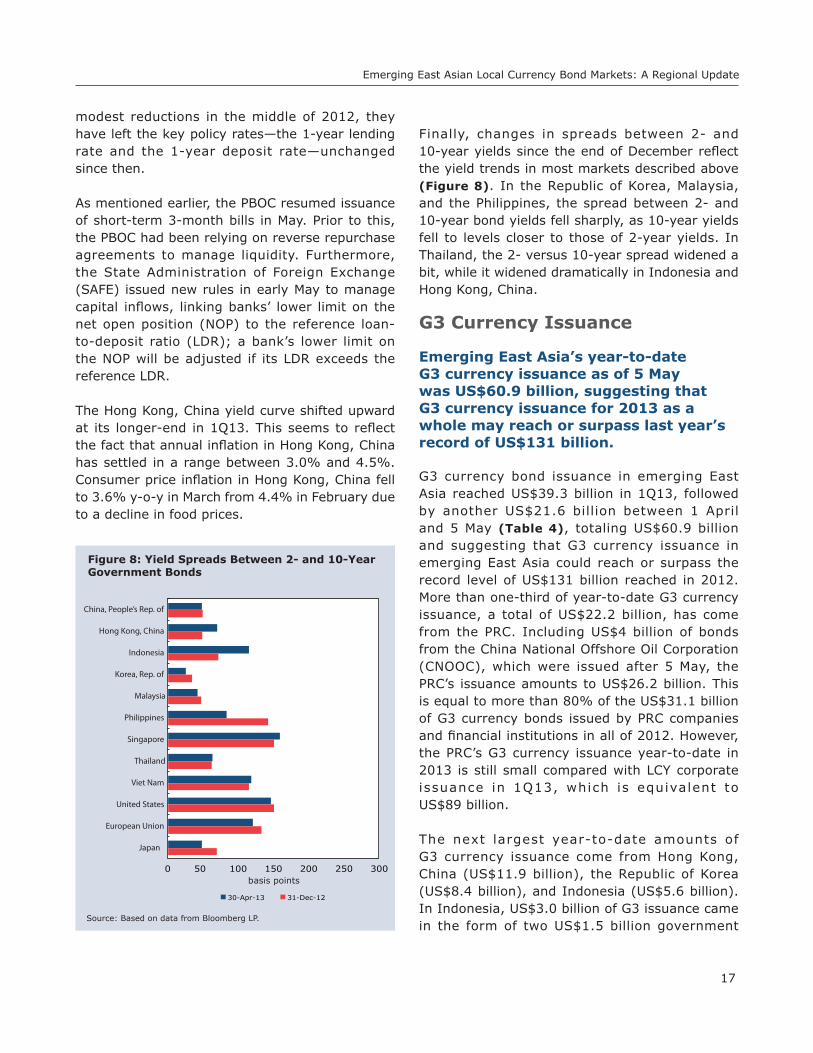
Finally, changes in spreads between 2- and 10-year yields since the end of December reflect the yield trends in most markets described above (Figure 8). In the Republic of Korea, Malaysia, and the Philippines, the spread between 2- and 10-year bond yields fell sharply, as 10-year yields fell to levels closer to those of 2-year yields. In Thailand, the 2- versus 10-year spread widened a bit, while it widened dramatically in Indonesia and Hong Kong, China.
G3 Currency Issuance
Emerging East Asia’s year-to-date G3 currency issuance as of 5 May was US$60.9 billion, suggesting that G3 currency issuance for 2013 as a whole may reach or surpass last year’s record of US$131 billion.
G3 currency bond issuance in emerging East Asia reached US$39.3 billion in 1Q13, followed by another US$21.6 billion between 1 April and 5 May (Table 4), totaling US$60.9 billion and suggesting that G3 currency issuance in emerging East Asia could reach or surpass the record level of US$131 billion reached in 2012. More than one-third of year-to-date G3 currency issuance, a total of US$22.2 billion, has come from the PRC. Including US$4 billion of bonds from the China National Offshore Oil Corporation (CNOOC), which were issued after 5 May, the PRC’s issuance amounts to US$26.2 billion. This is equal to more than 80% of the US$31.1 billion of G3 currency bonds issued by PRC companies and financial institutions in all of 2012. However, the PRC’s G3 currency issuance year-to-date in 2013 is still small compared with LCY corporate issuance in 1Q13, which is equivalent to US$89 billion.
The next largest year-to-date amounts of G3 currency issuance come from Hong Kong, China (US$11.9 billion), the Republic of Korea (US$8.4 billion), and Indonesia (US$5.6 billion). In Indonesia, US$3.0 billion of G3 issuance came in the form of two US$1.5 billion government
31-Dec-1230-Apr-13
Source: Based on data from Bloomberg LP.
Figure 8: Yield Spreads Between 2- and 10-Year Government Bonds
basis points
China, People’s Rep. of
Hong Kong, China
Indonesia
Korea, Rep. of
Malaysia
Philippines
Singapore
Thailand
Viet Nam
United States
European Union
Japan
0 50 100 150 200 250 300

Asia Bond Monitor
18
Table 4: G3 Currency Bond Issuance1Q13
Issuer US$ (million)
Issue Date
China, People's Rep. of 11,645MCE Finance 5.00% 2021 1,000 7-Feb-13Bestgain Real Estate 2.625% 2018 800 13-Mar-13Country Garden 7.5% 2023 750 10-Jan-13Agile Property 8.25% Perpetual 700 18-Jan-13Greentown China Holdings 8.50% 2018 700 4-Feb-13Others 7,695
Hong Kong, China 9,398Shimao Property 6.625% 2020 800 14-Jan-13Sun Hung Kai Properties 3.625% 2023 500 16-Jan-13Swire Properties 2.75% 2020 500 7-Mar-13Wheelock Finance 3.00% 2018 500 19-Mar-13Others 7,098
Indonesia 2,085Bank Rakyat Indonesia 2.95% 2018 500 28-Mar-13Gajah Tunggal 7.75% 2018 500 6-Feb-13Indo Energy Finance 6.375% 2023 500 24-Jan-13Others 585
Korea, Rep. of 5,461Hana Bank 1.375% 2016 500 5-Feb-13Korea Development Bank 1.00% 2016 500 22-Jan-13Korea Development Bank 1.50% 2018 500 22-Jan-13Korea Eximbank 1.75% 2018 500 27-Feb-13Korea Housing Finance Corp. 1.625% 2018 500 7-Mar-13Others 2,961
Malaysia 3,8451MDB Global Investments 4.40% 2023 3,000 19-Mar-13Sime Darby 2.053% 2018 400 29-Jan-13Others 445
Philippines 1,900JG Summit 4.375% 2023 750 23-Jan-13Petron Corporation 7.50% Perpetual 750 6-Feb-13ICTSI 4.625% 2023 400 16-Jan-13
Singapore 3,196Olam International 6.75% 2018 750 29-Jan-13Global A&T Electronics 10.00% 2019 625 7-Feb-13Stats Chippac 4.50% 2018 611 20-Mar-13Others 1,210
Thailand 1,795Krung Thai Bank 2.25% 2018 500 11-Mar-13Thai Oil 3.625% 2023 500 23-Jan-13Thai Oil 4.875% 2043 500 23-Jan-13Others 295
Viet Nam 0
Emerging East Asia Total 39,325
Memo Items:India 5,932Bharti Airtel International 5.125% 2023 1,500 11-Mar-13Reliance Industries 5.875% Perpetual 800 5-Feb-13Others 3,632Sri Lanka 281
Source: Bloomberg LP, newspaper and wire reports.
1 April–5 May 2013
Issuer US$ (million)
Issue Date
China, People's Rep. of 10,590Sinopec Capital 3.125% 2023 1,250 24-Apr-13Sinopec Capital 1.875% 2018 1,000 24-Apr-13Citic Securities 2.5% 2018 800 3-May-13CNPC General Capital 1.45% 2016 750 16-Apr-13CNPC General Capital 3.40% 2023 750 16-Apr-13Sinopec Capital 1.25% 2016 750 24-Apr-13Sinochem 5.00% Perpetual 600 2-May-13China State Construction Finance 3.125% 2018 500 2-Apr-13Citic Pacific 6.375% 2020 500 10-Apr-13CNPC General Capital 1.95% 2018 500 16-Apr-13Parkson Retail Group 4.5% 2018 500 3-May-13Sinopec Capital 4.25% 2043 500 24-Apr-13Sunac China Holdings 9.375% 2018 500 5-Apr-13Others 1,690
Hong Kong, China 2,520Yingde Gases Investment 8.125% 2018 425 22-Apr-13FPC Treasury 4.50% 2023 400 16-Apr-13New Cotai Capital 10.625% 2019 380 19-Apr-13China Oil and Gas Group 5.25% 2018 350 25-Apr-13Others 965
Indonesia 3,525Indonesia (Sovereign) 3.375% 2023 1,500 15-Apr-13Indonesia (Sovereign) 4.625% 2043 1,500 15-Apr-13TBG Global 4.625% 2018 300 3-Apr-13Comfeed Finance 6.00% 2018 225 2-May-13
Korea, Rep. of 2,954Korea Eximbank 2.00% 2020 988 30-Apr-13Korea Resources 2.125% 2018 500 2-May-13Korea Development Bank 0.607% 2014 395 30-Apr-13Korea Exchange Bank 2.00% 2018 350 2-Apr-13Daegu Bank 2.25% 2018 300 29-Apr-13Others 421
Malaysia 20
Philippines 1,350San Miguel Corporation 4.875% 2023 800 26-Apr-13Filinvest Dev’t Cayman Islands 4.25% 2020 300 2-Apr-13Megaworld Corporation 4.25% 2023 250 17-Apr-13
Singapore 450DBS Bank 0.3111% 2014 250 5-Apr-13Keppel GMTN 1.1711% 2020 200 5-Apr-13
Thailand 150Banpu 3.99% 2023 150 4-Apr-13
Viet Nam 0
Emerging East Asia Total 21,559
Memo Items:India 1,466State Bank of India 3.25% 2018 1,000 18-Apr-13Union Bank of India 3.625% 2018 350 25-Apr-13Export-Import Bank of India 1.00% 2019 116 22-Apr-13Sri Lanka 500

Emerging East Asian Local Currency Bond Markets: A Regional Update
19
bonds issued on 15 April: a 10-year bond carrying a coupon of 3.375% and a 30-year bond carrying a coupon of 4.625%.
In 2012, the Indonesian government issued a 10-year bond worth US$2 billion and carrying a coupon of 3.75%, and a 30-year bond worth US$1.75 bi l l ion with a coupon of 5.25%. Additionally, the Indonesian government last year issued a 10-year samurai bond in 2012, equivalent to US$692 million, at a coupon of 1.13%. The Indonesian government was able to issue its most recent US$ bonds in 2013 at significantly lower interest rates.
The more interesting aspect of Indonesia’s US$12.1 billion of G3 currency issuance in 2012 was that most of it (US$ 7.7 billion) was issuance by corporates rather than the government. Indonesia’s foreign currency (FCY) corporate issuance in 2012 was, in fact, larger than its LCY corporate issuance of US$7.1 billion, a trend that has continued into 2013. In 1Q13, Indonesia’s FCY issuance came entirely from corporates at a total of US$2.1 billion, compared with LCY corporate issuance of US$1.5 billion. Thus far in 2Q13, Indonesian corporates have issued US$ bonds amounting to US$525 million.
In the Philippines, the government has been a frequent issuer of US$ bonds in past years, but the Philippine government recently announced its intention not to issue any FCY bonds in the international market this year. The Philippine government last issued a US$500 million bond in December 2012 for the stated purpose of absorbing excess US$ liquidity in the domestic market, and, more recently, announced its intention to issue another US$500–US$750 million in the domestic market later this year.
G3 currency issuance from Philippine corporates, however, has risen sharply this year, with US$1.9 billion of new US$ corporate bonds issued in 1Q13 and US$1.35 billion issued between
1 April and 5 May. G3 corporate issuance in 1Q13 was almost four times as large as LCY issuance from Philippine corporates in 1Q13 (US$478 million). This relationship between the volume of Philippine peso and US$ issuance from the corporate sector will be interesting to watch in the remaining months of 2013.
Market Returns
Market returns in the bond and equity markets of emerging East Asia were much weaker in the first 4 months of 2013 than they were for 2012 as a whole.
The strongest performer in the iBoxx Asian Bond Fund Index in the first 4 months of 2013 was the Philippines with a return of 15.7% on a US$ unhedged total return basis (Table 5). The only other markets with positive returns during this period were Thailand (6.0%), the PRC (2.9%), and Malaysia (2.3%). All other markets reported negative returns on a US$ unhedged total return basis, although the Republic of Korea did post a 2.8% return on an LCY total return basis. Meanwhile, the region as a whole posted a US$ unhedged total return of 2.1%.
The performance of the Far East ex-Japan Index was also weak during the first 4 months of 2013, producing a US$ return of only 0.8% (Table 6). This primarily reflects declines in the Korean and PRC equity markets on both a US$ and LCY basis. The performances of other Asian markets were stronger. The Philippines’ equity market yielded returns of 20.7% and 21.0% on a US$ and LCY basis, respectively. Indonesia’s equity market was the second-best performing market in the region, generating a US$ return of 15.2% and an LCY return of 16.2%. The Thai equity market also performed well in the first 4 months of the year, generating a US$ return of 11.9%, while the equity markets of Singapore and Hong Kong, China delivered returns of between 5.0% and 7.0% on both a US$ and LCY basis.

Asia Bond Monitor
20
Table 6: MSCI Equity Index Returns
Market2011 Returns (%) 2012 Returns (%) Jan to Apr 2013 Returns (%)
LCY terms US$ terms LCY terms US$ terms LCY terms US$ terms
China, People's Rep. of (20.4) (20.3) 18.7 19.0 (3.3) (3.5)
Hong Kong, China (18.5) (18.4) 24.2 24.4 5.8 5.6
Indonesia 4.7 4.0 8.8 2.4 16.2 15.2
Korea, Rep. of (11.5) (12.8) 11.7 20.2 (3.8) (6.4)
Malaysia (0.2) (2.9) 6.8 10.8 2.2 2.7
Philippines (3.1) (3.2) 34.7 43.9 21.0 20.7
Singapore (20.0) (21.0) 19.2 26.4 6.5 5.6
Thailand (1.2) (5.6) 26.9 30.9 7.4 11.9
Far East ex-Japan Index (15.6) (16.8) 15.5 19.0 1.6 0.8
MSCI US – (0.1) – 13.5 – 12.1
– = not applicable, ( ) = negative, LCY = local currency, MSCI = Morgan Stanley Capital International, US = United States, YTD = year-to-date.Notes:1. Market indices are from MSCI country indexes. January to April 2013 returns reflect changes between end-December 2012 and end-April 2013 values.2. Far East ex-Japan includes the People’s Republic of China; Hong Kong, China; Indonesia; the Republic of Korea; Malaysia; the Philippines; Singapore; Taipei,China;
and Thailand.Source: AsianBondsOnline and Bloomberg LP.
Table 5: iBoxx Asian Bond Fund Index Family Returns
MarketModified Duration (years)
2011 Returns (%) 2012 Returns (%) Jan to Apr 2013 Returns (%)
LCY Total Return Index
US$ Unhedged Total Return
Index
LCY Total Return Index
US$ Unhedged Total Return
Index
LCY TotalReturn Index
US$ Unhedged Total Return
Index
China, People's Rep. of 6.58 5.6 10.4 2.4 3.6 1.8 2.9
Hong Kong, China 4.18 5.3 5.4 3.5 3.8 0.1 (0.04)
Indonesia 7.02 21.7 20.2 13.1 7.0 0.5 (0.4)
Korea, Rep. of 4.93 6.4 4.8 6.4 14.5 2.8 (0.1)
Malaysia 5.07 4.9 1.8 4.2 8.2 1.5 2.3
Philippines 8.18 15.9 15.8 10.4 17.9 16.0 15.7
Singapore 6.29 6.5 5.1 3.9 10.6 0.4 (0.7)
Thailand 5.08 5.0 0.3 3.3 6.5 1.9 6.0
Pan-Asian Index 5.71 – 7.0 – 7.9 – 2.1
HSBC ALBI 7.76 – 5.0 – 8.9 – 2.1
US Govt. 1–10 years 3.96 – 7.0 – 1.9 – 0.7
– = not applicable, ( ) = negative, ALBI = Asian Local Bond Index, LCY = local currency, US = United States, YTD = year-to-date.Notes:1. Asian Bond Fund (ABF) indices contain only government debt and government-guaranteed debt obligations.2. Market bond indices are from the iBoxx Index Family. January to April 2013 returns reflect changes between end-December 2012 and end-April 2013 values.3. Duration as of end-April 2013.Source: AsianBondsOnline and Bloomberg LP.

Emerging East Asian Local Currency Bond Markets: A Regional Update
21
Policy and Regulatory DevelopmentsPeople’s Republic of China
Taxes on Local Government Bonds Eliminated
On 26 April, the Ministry of Finance (MOF) and the State Administration of Taxation announced that interest received on local government bonds issued in 2012 by the MOF on behalf of local government units will no longer be subject to personal or corporate income taxes.
Hong Kong, China
RQFII Program List of Participants Expanded
On 7 March, the PRC expanded the list of allowable institutions participating in the Renminbi Qualified Foreign Institutional Investor (RQFII) program to include financial institutions registered in Hong Kong, China and Hong Kong, China units of PRC banks and insurance companies.
CNH HIBOR Fixing Launched
On 25 April, the Treasury Markets Association announced that it will launch the CNH Hong Kong Interbank Offer Rate (HIBOR) fixing in June. The fixing will provide an interest rate benchmark for financial contracts and will have tenors of overnight; 1 and 2 weeks; 1, 2, 3, and 6 months; and 1 year. The rates will be calculated based on the contributions of between 15 and 18 banks.
HKMA Removes Net Open Position and Liquidity Ratio Requirements for CNH
On 25 April, the Hong Kong Monetary Authority (HKMA) removed the net open position and liquidity ratio requirements for the CNH positions of authorized institutions. HKMA also said that despite the removal of these requirements, it expects authorized institutions to manage their foreign exchange and liquidity risks prudently.
Indonesia
Bank Indonesia Keeps Policy Rate Steady at 5.75%
Bank Indonesia’s (BI) Board of Governors decided on 14 May to keep its benchmark interest rate steady at a record-low level of 5.75%. Based on its assessment, the BI rate remains consistent with an annual inflation target of between 3.5% and 5.5%. BI said it will closely monitor inflation risks emanating from rising inflation expectations as the government has yet to decide whether or not to make any changes to its policy on fuel subsidies. Also, BI will continue to strengthen monetary operations through the absorption of excess liquidity using its longer-term instruments.
Indonesian Government Plans Debt Switch for US$ Global Bonds and Issuance of US$ Bonds Onshore
In May, the Indonesian government disclosed plans to conduct a debt switch of US$-denominated bonds for longer-term maturities as part of its liability management program. The government has been conducting debt switches since 2005 as a strategy to reduce refinancing risk for its local currency (LCY)-denominated bonds. However, it will be the first time that Indonesia conducts a debt switch for US$ global bonds. In the second half of the year, the government plans to issue US$ bonds onshore to target domestic investors.
Republic of Korea
National Assembly Committee Approves Revision of FSCMA
On 4 March, the Legislation and Judiciary Committee of the National Assembly approved revision of the Financial Investment Services and Capital Markets Act (FSCMA), according to the Financial Services Commission. The key contents of the revision include establishing a

Asia Bond Monitor
22
central counterparty clearinghouse for over-the-counter (OTC) derivatives transactions and related amendments to the Commercial Act.
MOSF Introduces 2013 Supplementary Budget
The Ministry of Strategy and Finance (MOSF) reported in April that a supplementary budget of KRW17.3 trillion will be utilized to help stimulate the domestic economy throughout the remainder of the year. Of the amount, KRW12.0 trillion will be used to finance government revenue shortfalls and the remaining KRW5.3 trillion will be spent to supplement the government’s budget expenditure. Under the 2013 supplementary budget, the government’s total expenditure will amount to KRW349.0 trillion, an increase of KRW7.0 trillion over the original 2013 budget. Government revenue in the 2013 supplementary budget is projected to reach KRW360.8 trillion, which is KRW11.8 trillion less than the original budget.
MOSF Introduces KTB Market Stabilization Measures
MOSF introduced Korea Treasury Bond (KTB) market stabilization measures in April in light of the 2013 supplementary budget, which called for a net increase in KTB issuance of KRW15.8 trillion. MOSF will reduce the issue amount for buy-backs since the net increase in KTB issuance will likely trigger upward pressure on interest rates, thereby imposing a burden on the market. Against this backdrop, total issuance of KTBs is projected to reach KRW88.5 trillion (instead of KRW95.5 trillion), which is KRW8.8 trillion higher than the previous estimate of KRW79.7 trillion. In addition, MOSF reported that it will (i) continue with the monthly issuance of KTBs at a steady level each month; (ii) continue to optimize the mix of KTBs by maturity (3, 5, 10, 20, and 30 years), with plans to increase the issuance of on-the-run KTBs; (iii) conduct flexible application of partial knock-down rates; and (iv) ensure that primary dealers’ obligations are strengthened.
The Bank of Korea Lowers Policy Rate in May
The Bank of Korea’s Monetary Policy Committee decided on 9 May to lower the base rate by 25 basis points (bps) to 2.50%, marking the first policy rate cut of the year. In its monetary policy decision, the committee noted (i) the Republic of Korea’s weak economic growth, (ii) a forecast showing a negative output gap in the domestic economy amid a slow recovery in the global economy, (iii) the impact of the weakening Japanese yen, (iv) the country’s geopolitical risks, and (v) the expectation that inflationary pressures will remain low.
Malaysia
BNM and the Central Bank of Myanmar sign MoU on Regional Economic and Financial Development
In April, BNM and the Central Bank of Myanmar signed a Memorandum of Understanding (MoU) to promote greater regional economic and financial integration. The MoU establishes a framework of cooperation for capacity building and human capital development with the support of the Malaysian Technical Cooperation Programme.
BNM Holds Policy Rates Steady at 3.0%
On 9 May, Bank Negara Malaysia (BNM) decided in its Monetary Policy Committee meeting to leave the overnight policy rate unchanged at 3.0%. BNM has kept its benchmark interest rate at the same level since May 2011 and considers its current monetary policy to be appropriate, given the outlook for inflation and growth. Inflation in 1Q13 was subdued at 1.5% and is expected to remain modest. The economy is expected to sustain steady growth, driven by strong investment in domestic-oriented sectors and infrastructure, as well as robust private consumption.

Emerging East Asian Local Currency Bond Markets: A Regional Update
23
Philippines
BSP Approves New Foreign Exchange Rules
On 18 April, the Monetary Board of Bangko Sentral ng Pilipinas (BSP) released new rules to further liberalize existing foreign exchange regulations, the sixth in a series of reforms initiated by BSP since 2007. The new rules further simplify the foreign exchange transactions of residents and non-residents with banks and increase residents’ OTC foreign currency purchase limit per transaction to US$120,000 from US$60,000. Tourists and Filipino migrant workers will be allowed to purchase as much as US$10,000—up from the previous US$5,000 limit—when they leave the country. BSP retained the US$60 million limit on what residents can purchase per year for investments abroad, but it expanded the list of allowed investment outlets. Non-residents will also be allowed to create onshore peso deposit accounts for purposes other than those previously permitted.
BSP Keeps Its Key Policy Rates Unchanged
On 25 April, the Monetary Board of the BSP decided to keep its key policy rates—the overnight borrowing and lending rates—steady at 3.5% and 5.5%, respectively. The reserve requirement ratios were also held steady. The decision to hold the policy rates at their current levels reflected the Monetary Board’s assessment that the inflation environment was likely to remain manageable, with inflation in 2013 expected to be within BSP’s target rate of 3.0%–5.0%. Downside risks to the outlook include uncertainty over the strength of the global economy and the peso, power rate adjustments, and a continued increase in liquidity due to capital inflows. However, the Monetary Board also cited the benign inflation environment and strong domestic growth prospects as balancing out these risks. The Monetary Board lowered interest rates on the Special Deposit Account (SDA) facility by an additional 50 bps to 2.0% across all tenors.
PSE and PDS Group Renew Talks on Merger
In April, the Philippine Stock Exchange (PSE) and Philippine Dealing System Holdings Corp. (PDS Group) agreed to renew discussions on a possible merger. Both parties aim to create a workable framework and sign an MoU within 90 days. PSE has mandated JP Morgan as its financial adviser on the proposed transaction, while PDS Group engaged Maybank ATR Kim Eng Financial Corporation to provide valuation and advisory services. The transaction could lead to a merger between the two exchanges or the acquisition by PSE of the Philippine Dealing and Exchange Corp. (PDEX), which is the fixed-income trading platform of PDS Group. The relevant regulators—the Department of Finance, Securities and Exchange Commission, and BSP—will monitor progress of the merger talks.
Singapore
MAS and the PBOC Sign MoU
On 2 April, MAS and the People’s Bank of China (PBOC) signed an MoU pledging close cooperation in reviewing the conduct of RMB business and clearing arrangements in Singapore. MAS and the PBOC agreed to establish a regular dialogue to review RMB liquidity conditions and discuss issues concerning the stability of the RMB market in Singapore.
MAS Joins Implementation of ASEAN Disclosure Standards
Effective 2 April, MAS joined securities regulators in Malaysia and Thailand in the implementation of the ASEAN Disclosure Standards Scheme covering multi-jurisdiction offerings of equity and plain debt securities. The scheme aims to facilitate fundraising activities and enhance investment opportunities in ASEAN capital markets. Issuers offering equity and plain debt securities in multiple jurisdictions within ASEAN will only need to comply with one set of disclosure standards for prospectuses, thereby delivering time and cost savings to issuers.

Asia Bond Monitor
24
Thailand
BOT Lowers Policy Interest Rate in May
The Bank of Thailand’s (BOT) Monetary Policy Committee decided to lower the policy interest rate―the 1-day repurchase rate―by 25 basis points to 2.50% during its meetings held on 28–29 May. The Committee reported that Thailand’s GDP growth in 1Q13 was less-than-expected and that inflationary pressures have eased further. During this year’s previous monetary policy meetings—on 9 January, 20 February, and 3 April—the central bank kept the policy interest rate unchanged.
Government Plans THB2 Trillion Investment in Infrastructure
The government of Thailand has announced plans to carry out an infrastructure investment program worth THB2 trillion that will be financed by bank loans. The program aims to reduce transportation costs by 2%, raise gross domestic product (GDP)
growth by 1 percentage point annually, and generate 500,000 jobs. The program also seeks to enhance the country’s competitiveness, improve connectivity with fellow ASEAN members, and link domestic tourist attractions.
Viet Nam
SBV Cuts Key Rates an Additional 100 bps
On 13 May, the State Bank of Viet Nam (SBV) cut its key interest rates for the second time this year, following six cuts in 2012, in a continuation of efforts to help firms expand production. The refinance rate, discount rate, and overnight inter-bank lending rate were reduced 100 bps each to 7.0%, 5.0%, and 8.0%, respectively. The cap on the VND short-term lending rate of credit institutions was also set at 10.0% for borrowers and 11.0% for people’s credit funds and micro-financial institutions.

Market Summaries
25
People’s Republic of China
Market Summaries
Local currency (LCY) bonds outstanding in the People’s Republic of China (PRC) reached CNY24.4 trillion (US$3.9 trillion) in 1Q13, expanding 3.0% quarter-on-quarter (q-o-q) and 12.6% year-on-year (y-o-y). Corporate bond market growth outpaced that of the government sector on a q-o-q and y-o-y basis to reach CNY6.9 trillion at the end of 1Q13.
Table 1: Size and Composition of the LCY Bond Market in the People’s Republic of China
Outstanding Amount (billion) Growth Rates (%)1Q12 4Q12 1Q13 1Q12 1Q13
CNY US$ CNY US$ CNY US$ q-o-q y-o-y q-o-q y-o-yTotal 21,719 3,448 23,747 3,811 24,448 3,937 1.7 8.2 3.0 12.6 Government 16,218 2,575 17,270 2,772 17,555 2,827 1.4 4.5 1.7 8.2 Treasury Bonds 7,420 1,178 8,074 1,296 8,071 1,300 0.5 11.3 (0.03) 8.8 Central Bank Bonds 1,928 306 1,338 215 1,338 215 (9.4) (39.3) 0.0 (30.6) Policy Bank Bonds 6,869 1,091 7,858 1,261 8,146 1,312 6.0 21.1 3.7 18.6 Corporate 5,502 874 6,477 1,040 6,893 1,110 2.6 20.6 6.4 25.3 Policy Bank BondsChina Development Bank 4,676 742 5,270 846 5,422 873 5.2 14.8 2.9 15.9 Export–Import Bank of China 902 143 1,112 178 1,183 191 8.2 48.5 6.4 31.2 Agricultural Devt. Bank of China 1,291 205 1,476 237 1,541 248 7.5 30.4 4.4 19.3
( ) = negative, LCY = local currency, q-o-q = quarter-on-quarter, y-o-y = year-on-year.Notes: 1. Calculated using data from national sources.2. Treasury bonds include savings bonds and local government bonds.3. Bloomberg LP end-of-period LCY–US$ rate is used.4. Growth rates are calculated from an LCY base and do not include currency effects.5. The balance of outstanding commercial paper at the end of 1Q13 was zero based on ChinaBond data, but amounted to CNY1.4 trillion according to Wind data.Source: ChinaBond and Bloomberg LP.
Table 2: Notable LCY Corporate Issuance in 1Q13
Corporate Issuers Coupon Rate (%)
Issued Amount (CNY billion)
Jiangsu Broadcasting 3-year bond 4.60 20China Pingmei Shenma Energy & Chemical 5-year bond 5.55 20Bank of Beijing 5-year bond 4.30 20China National Petroleum 5-year bond 4.47 20Shenhua Group 10-year bond 4.99 10State Grid 5-year bond 4.65 10
LCY = local currency.Source: ChinaBond.
Corporate bond issuance fell 18.5% q-o-q but grew 29.1% y-o-y in 1Q13. The q-o-q decline was largely due to a drop in commercial bank bond issuance.

Asia Bond Monitor
26
LCY bonds outstanding of the top 30 corporate bond issuers in the PRC reached CNY4 trillion at the end of 1Q13, representing 58% of total corporate bonds outstanding.
Table 3: Top 30 Issuers of LCY Corporate Bonds in the People’s Republic of China
IssuersOutstanding Amount
State-Owned
Listed Company Type of IndustryLCY Bonds
(CNY billion) LCY Bonds(US$ billion)
1. China Railway 747.00 120.29 Yes No Transportation
2. China National Petroleum 380.00 61.19 Yes No Energy
3. State Grid Corporation of China 349.50 56.28 Yes No Public Utilities
4. Industrial and Commercial Bank of China 230.00 37.04 Yes Yes Banking
5. Bank of China 219.93 35.41 Yes Yes Banking
6. China Construction Bank 200.00 32.21 Yes Yes Banking
7. Agricultural Bank of China 150.00 24.15 Yes Yes Banking
8. China Petroleum & Chemical 144.70 23.30 Yes Yes Energy
9. Central Huijin Investment 109.00 17.55 Yes No Diversified Financial
10. Petrochina 107.50 17.31 Yes Yes Energy
11. Shenhua Group 105.00 16.91 Yes No Energy
12. China Guodian 103.20 16.62 Yes No Public Utilities
13. China Minsheng Bank 102.31 16.47 No Yes Banking
14. Shanghai Pudong Development Bank 79.20 12.75 No Yes Banking
15. Bank of Communications 76.00 12.24 No Yes Banking
16. China Three Gorges Project 75.50 12.16 Yes No Public Utilities
17. Industrial Bank 72.08 11.61 No Yes Banking
18. China Life 68.00 10.95 Yes Yes Insurance
19. China Power Investment 67.30 10.84 Yes No Public Utilities
20. China Merchants Bank 61.70 9.94 No Yes Banking
21. China Southern Power Grid 60.50 9.74 Yes No Public Utilities
22. State-Owned Capital Operation and Management Center of Beijing 58.50 9.42 Yes No Diversified Financial
23. Huaneng Power International 54.20 8.73 Yes Yes Public Utilities
24. Citic Group 53.50 8.61 Yes No Diversified Financial
25. Bank of Beijing 53.50 8.61 No Yes Banking
26. China Huaneng Group 53.00 8.53 Yes No Public Utilities
27. China Everbright Bank 52.70 8.49 No Yes Banking
28. China United Network Communications 50.00 8.05 Yes Yes Telecommunications
29. China Citic Bank 42.50 6.84 No Yes Banking
30. China Datang 42.20 6.80 Yes No Public Utilities
Total Top 30 LCY Corporate Issuers 3,968.52 639.03
Total LCY Corporate Bonds 6,892.54 1,109.87
Top 30 as % of Total LCY Corporate Bonds 57.6% 57.6%
LCY = local currency.Notes:1. Data as of end-April 2013.2. State-owned firms are defined as those in which the government has more than a 50% ownership stake.Source: AsianBondsOnline calculations based on Wind data.

Market Summaries
27
Table 4: Notional Values of the PRC’s Interest Rate Swap Market
Interest Rate Swap Benchmarks
Notional Amount
(CNY billion)
% of Total Notional Amount
Number of Transactions Growth Rate (%)
1Q13 q-o-q y-o-y
7-Day Repo Rate 410.3 55.6 3,864 42.6 60.3
Overnight SHIBOR 228.7 31.0 408 (56.8) 99.7
3-Month SHIBOR 89.2 12.1 1,017 0.5 15.5
1-Year Term Deposit Rate 0.9 0.1 16 (87.3) (97.7)
6-Month Lending Rate 0.01 0.0 1 (73.7) (33.3)
1-Year Lending Rate 7.3 1.0 211 (25.7) 237.6
3-Year Lending Rate 0.7 0.1 6 (81.9) 690.7
5-Year Lending Rate 0.3 0.0 6 3.0 3.0
Above 5-Year Lending Rate 0.1 0.0 4 (76.8) –
Total 737.6 100.0 5,533 (20.5) 50.3
– = not applicable, ( ) = negative, PRC = People’s Republic of China, q-o-q = quarter-on-quarter, Repo = repurchase, SHIBOR = Shanghai Interbank Offered Rate, y-o-y = year on year.Note: Data as of end-March 2013.Source: AsianBondsOnline and ChinaMoney.

Asia Bond Monitor
28
Hong Kong, China
Local currency (LCY) bonds outstanding in Hong Kong, China reached HKD1.4 trillion (US$184 billion) in 1Q13, expanding 3.6% quarter-on-quarter (q-o-q) and 7.2% year-on-year (y-o-y). Government bond market growth outpaced that of the corporate sector on a q-o-q and y-o-y basis. Government bonds outstanding totaled HKD779 billion at the end of 1Q13, compared with HKD646 billion for corporate bonds.
Table 1: Size and Composition of the LCY Bond Market in Hong Kong, China
Outstanding Amount (billion) Growth Rate (%)
1Q12 4Q12 1Q13 1Q12 1Q13
HKD US$ HKD US$ HKD US$ q-o-q y-o-y q-o-q y-o-y
Total 1,330 171 1,376 177 1,426 184 1.6 3.0 3.6 7.2
Government 705 91 724 93 779 100 0.3 3.5 7.6 10.5
Exchange Fund Bills 587 76 589 76 640 82 0.1 0.5 8.7 9.1
Exchange Fund Notes 69 9 69 9 69 9 0.0 (0.9) 0.0 (0.9)
HKSAR Bonds 50 6 67 9 71 9 3.1 80.0 5.2 42.4
Corporate 625 80 651 84 646 83 3.2 2.3 (0.7) 3.5
( ) = negative, HKSAR = Hong Kong Special Administrative Region, LCY = local currency, q-o-q = quarter-on-quarter, y-o-y = year-on-year.Notes:1. Calculated using data from national sources.2. Bloomberg LP end-of-period LCY–US$ rates are used.3. Growth rates are calculated from an LCY base and do not include currency effects.Source: Hong Kong Monetary Authority and Bloomberg LP.
In 1Q13, HKD61.0 billion of corporate bonds were issued, a 22.0% increase from 4Q12. The largest corporate issuers were mostly infrastructure or property development companies. The largest came from R-Reit International, a subsidiary of the Regal Real Estate Investment Trust managed by Regal Portfolio Management.
Table 2: Notable LCY Corporate Issuance in 1Q13
Corporate Issuers Coupon Rate (%)
Issued Amount (HKD billion)
R-Reit International Finance Ltd., BVI
5-year bond 4.13 0.78
Hongkong Electric Finance Ltd.
15-year bond 3.10 0.50
The Link Finance (Cayman) 2009 Ltd.
15-year bond 3.10 0.50
MTR Corporation (C.I.) Ltd.
30-year bond 3.25 0.50
Urban Renewal Authority
7-year bond 1.65 0.50
Wing Tai Properties (Finance) Ltd., BVI
10-year bond 3.95 0.48
LCY = local currency.Source: Central Moneymarkets Unit (CMU) HKMA.

Market Summaries
29
LCY bonds outstanding among the top 30 corporate bond issuers in Hong Kong, China reached HKD108 billion at the end of 1Q13, representing 16.7% of total corporate bonds outstanding.
Table 2: Top 30 Non-Bank Corporate Issuers in Hong Kong, China
IssuersOutstanding Amount
State-Owned
Listed Company Type of IndustryLCY Bonds
(HKD billion)LCY Bonds(US$ billion)
1. The Hong Kong Mortgage Corporate Ltd. 15.74 2.03 Yes No Finance
2. CLP Power Hong Kong Financing Ltd. 11.43 1.47 No No Electric
3. Sun Hung Kai Properties (Capital Market) Ltd. 10.41 1.34 No No Real Estate
4. MTR Corporation (C.I.) Ltd. 7.60 0.98 Yes Yes Transportation
5. Kowloon-Canton Railway Corporation 6.30 0.81 Yes No Transportation
6. The Link Finance (Cayman) 2009 Ltd. 5.79 0.75 No No Finance
7. HKCG (Finance) Limited 5.60 0.72 No No Gas
8. Hongkong Electric Finance Ltd. 5.31 0.68 No No Electric
9. Swire Pacific MTN Financing Ltd. 4.58 0.59 No Yes Diversified
10. Wharf Finance Ltd. 4.18 0.54 No No Diversified
11. Wheelock Finance Ltd. 3.74 0.48 No No Diversified
12. Urban Renewal Authority 3.30 0.43 Yes No Property Development
13. Yue Xiu Enterprises (Holdings) Ltd. 3.00 0.39 No No Diversified
14. Airport Authority Hong Kong 2.85 0.37 Yes No Trannsportation
15. Cheung Kong Bond Finance Ltd. 2.45 0.32 No Yes Finance
16. Hysan (MTN) Ltd. 2.43 0.31 No No Finance
17. Cheung Kong Finance (MTN) Ltd. 2.21 0.28 No No Finance
18. Henderson Land MTN Ltd. 1.83 0.24 No Yes Finance
19. Cathay Pacific MTN Financing Ltd. 1.70 0.22 No Yes Airlines
20. Wharf Finance (No.1) Ltd. 1.44 0.19 No No Diversified
21. Nan Fung Treasury Ltd. 1.31 0.17 No No Real Estate
22. Cheung Kong Bond Securities (02) Ltd. 1.00 0.13 No No Finance
23. Dragon Drays Ltd. 1.00 0.13 No No Diversified
24. Swire Properties MTN Finanicing Ltd. 0.80 0.10 No Yes Diversified
25. R-Reit International Finance Ltd., BVI 0.78 0.10 No No Real Estate
26. Wing Tai Properties (Finance) Ltd., BVI 0.48 0.06 No No Real Estate
27. Wharf Finance Ltd., BVI 0.45 0.06 No No Diversified
28. HLP Finance Ltd. 0.41 0.05 No Yes Real Estate
29. Cheung Kong Infrastructure Finance Ltd., BVI 0.26 0.03 No Yes Finance
30. The Hongkong Land Notes Company Ltd. 0.20 0.03 No No Finance
Total Top 30 Non-Bank LCY Corporate Issuers 108.09 13.92
Total LCY Corporate Bonds 646.46 83.27
Top 30 as % of Total LCY Corporate Bonds 16.7% 16.7%
LCY = local currency.Notes:1. Data as of end-March 2013.2. State-owned firms are defined as those in which the government has more than a 50% ownership stake.Source: AsianBondsOnline calculations based on Hong Kong Monetary Authority data.

Asia Bond Monitor
30
Indonesia
Total local currency (LCY) bonds outstanding in Indonesia reached IDR1,154.8 trillion (US$119 billion) in 1Q13, expanding 5.9% quarter-on-quarter (q-o-q) and 13.9% year-on-year (y-o-y). Growth in the government bond market outpaced growth in the corporate bond sector on a q-o-q basis, as the government typically frontloads its issuance for the year.
Table 1: Size and Composition of the LCY Bond Market in Indonesia
Outstanding Amount (billion) Growth Rate (%)1Q12 4Q12 1Q13 1Q12 1Q13
IDR US$ IDR US$ IDR US$ q-o-q y-o-y q-o-q y-o-yTotal 1,013,454 111 1,090,055 111 1,154,804 119 2.0 (1.6) 5.9 13.9 Government 858,644 94 902,594 92 958,369 98 1.4 (5.5) 6.2 11.6 Central Govt. Bonds 760,580 83 820,266 84 861,515 88 5.1 12.7 5.0 13.3 Central Bank Bills 98,064 11 82,328 8 96,854 10 (20.4) (58.0) 17.6 (1.2) Corporate 154,810 17 187,461 19 196,435 20 5.3 27.8 4.8 26.9
( ) = negative, LCY = local currency, q-o-q = quarter-on-quarter, y-o-y = year-on-year.Notes:1. Calculated using data from national sources.2. Bloomberg LP end-of-period LCY–US$ rates are used.3. Growth rates are calculated from an LCY base and do not include currency effects.4. The total stock of non-tradable bonds as of end-March 2013 stood at IDR274.7 trillion.Source: Bank Indonesia, Indonesia Debt Management Office, Indonesia Stock Exchange, and Bloomberg LP.
Corporate bond issuance fell 31.5% q-o-q, but rose 38.1% y-o-y, in 1Q13. New corporate bond issues in 1Q13 were once again dominated by banking and financial institutions.
Table 2: Notable LCY Corporate Issuance in 1Q13
Corporate Issuers Coupon Rate (%)
Issued Amount (IDR billion)
Bank OCBC NISP 370-day bond 6.40 973 2-year bond 6.90 529 3-year subordinated bond 7.40 1,498Adira Dinamika Multifinance 370-day bond 6.85 439 2-year bond 7.30 157 3-year bond 7.85 553 5-year bond 8.90 851 370-day Sukuk Mudharabah 6.85 66 2-year Sukuk Mudharabah 7.30 27 3-year Sukuk Mudharabah 7.85 286Bank Tabungan Negara 10-year bond 7.90 2,000Medco Energi International 5-year bond 8.85 1,500Astra Sedaya Finance 370-day bond 6.75 350 3-year bond 7.75 1,120Sarana Multigriya Finansial 370-day bond 6.80 160 3-year bond 7.30 123 5-year bond 7.60 736 7-year bond 7.80 100
LCY = local currency.Note: Sukuk Mudharabah are Islamic bonds backed by a profit-sharing scheme from a business venture or partnership.Source: Indonesia Stock Exchange.

Market Summaries
31
LCY bonds outstanding among the top 34 corporate bond issuers in Indonesia reached IDR161.6 trillion, representing 82.2% of total corporate bonds outstanding in 1Q13. The top three LCY corporate bond issuers remained the same as in 4Q12.
Table 3: Top 34 Issuers of LCY Corporate Bonds in Indonesia
IssuersOutstanding Amount
State-Owned
Listed Company Type of IndustryLCY Bonds
(IDR billion)LCY Bonds(US$ billion)
1. PLN 14,208.10 1.46 Yes No Energy
2. Adira Dinamika Multifinance 11,800.00 1.21 No Yes Finance
3. Indosat 9,150.00 0.94 No Yes Telecommunications
4. Bank Tabungan Negara 9,150.00 0.94 Yes Yes Banking
5. Indonesia Eximbank 9,134.00 0.94 Yes No Banking
6. Astra Sedaya Finance 9,009.50 0.93 No No Finance
7. Bank Pan Indonesia 8,500.00 0.87 No Yes Banking
8. Federal International Finance 7,378.50 0.76 No No Finance
9. Bank Internasional Indonesia 7,000.00 0.72 No Yes Banking
10. Bank CIMB Niaga 6,480.00 0.67 No Yes Banking
11. Bank Tabungan Pensiunan Nasional 5,300.00 0.54 No Yes Banking
12. Jasa Marga 5,000.00 0.51 Yes Yes Toll Roads, Airports, and Harbors
13. Perum Pegadaian 4,513.50 0.46 Yes No Finance
14. Medco-Energi International 4,486.50 0.46 No Yes Petroleum and Natural Gas
15. Bank Permata 4,250.00 0.44 No Yes Banking
16. Sarana Multigriya Finansial 4,021.00 0.41 Yes No Finance
17. Bank OCBC NISP 3,880.00 0.40 No Yes Banking
18. Indofood Sukses Makmur 3,610.00 0.37 No Yes Food and Beverages
19. Bank Mandiri 3,500.00 0.36 Yes Yes Banking
20. Telekomunikasi Indonesia 3,000.00 0.31 Yes Yes Telecommunications
21. Antam 3,000.00 0.31 Yes Yes Petroleum and Natural Gas
22. Bank Danamon Indonesia 2,800.00 0.29 No No Banking
23. BCA Finance 2,430.00 0.25 No No Finance
24. Bank Jabar Banten 2,400.00 0.25 No Yes Banking
25. Agung Podomoro Land 2,400.00 0.25 No Yes Property, Real Estate, and Building Construction
26. Indomobil Finance Indonesia 2,225.00 0.23 No No Finance
27. Bank Rakyat Indonesia 2,000.00 0.21 Yes Yes Banking
28. Toyota Astra Financial Services 1,905.00 0.20 No No Finance
29. BFI Finance Indonesia 1,530.00 0.16 No Yes Finance
30. Surya Semesta Internusa 1,500.00 0.15 No Yes Property, Real Estate, and Building Construction
31. Japfa 1,500.00 0.15 No Yes Animal Feed
32. Bank Bukopin 1,500.00 0.15 No Yes Banking
33. AKR Corporindo 1,500.00 0.15 No Yes Chemicals
34. Adhi Karya 1,500.00 0.15 Yes Yes Property, Real Estate, and Building Construction
Total Top 34 LCY Corporate Issuers 161,561.10 16.60
Total LCY Corporate Bonds 196,434.60 20.18
Top 34 as % of Total LCY Corporate Bonds 82.2% 82.2%
LCY = local currency.Notes:1. Data as of end-March 2013.2. State-owned firms are defined as those in which the government has more than a 50% ownership stake.Source: AsianBondsOnline calculations based on Indonesia Stock Exchange data.

Asia Bond Monitor
32
Republic of KoreaTotal local currency (LCY) bonds outstanding in the Republic of Korea at the end of 1Q13 grew 3.1% quarter-on-quarter (q-o-q) and 10.5% year-on-year (y-o-y) to reach KRW1,614.6 trillion (US$1.5 trillion). Growth in the LCY corporate bond market outpaced that in the government bond market on both a q-o-q and y-o-y basis.
Table 1: Size and Composition of the LCY Bond Market in the Republic of Korea
Outstanding Amount (billion) Growth Rate (%)
1Q12 4Q12 1Q13 1Q12 1Q13
KRW US$ KRW US$ KRW US$ q-o-q y-o-y q-o-q y-o-y
Total 1,461,197 1,290 1,565,704 1,471 1,614,631 1,453 3.2 10.0 3.1 10.5
Government 601,437 531 609,035 572 622,659 560 2.4 4.6 2.2 3.5
Central Bank Bonds 167,970 148 163,070 153 167,830 151 1.9 (0.3) 2.9 (0.1)
Central Government Bonds 403,751 356 416,113 391 426,699 384 2.8 6.7 2.5 5.7
Industrial Finance Debentures 29,716 26 29,852 28 28,130 25 (0.6) 5.9 (5.8) (5.3)
Corporate 859,760 759 956,669 899 991,972 893 3.7 14.1 3.7 15.4
( ) = negative, LCY = local currency, q-o-q = quarter-on-quarter, y-o-y = year-on-year.Notes: 1. Calculated using data from national sources.2. Central government bonds include Korea Treasury Bonds, National Housing Bonds, and bonds issued by Seoul Metro (formerly Seoul Metropolitan Subway Corp.).3. Bloomberg LP end-of-period LCY–US$ rates are used.4. Growth rates are calculated from an LCY base and do not include currency effects.Source: EDAILY BondWeb and The Bank of Korea.
Corporate bond issuance fell 0.9% q-o-q and 12.7% y-o-y in 1Q13. The most notable LCY corporate bond issues in 1Q13 came from banks.
Table 2: Notable LCY Corporate Issuance in 1Q13
Corporate Issuers Coupon Rate (%)
Issued Amount (KRW billion)
Woori Bank
1-year zero-coupon bond 2.68 450.0
1-year zero-coupon bond 2.74 300.0
1.5-year bond 2.88 310.0
Korea Eximbank
1-year zero-coupon bond 2.71 300.0
1-year floating-rate note 2.78 300.0
GS Engineering and Construction
3-year bond 3.54 320.0
Industrial Bank of Korea
1-year zero-coupon bond 2.71 320.0
LCY = local currency.Note: For zero-coupon bonds, indicative yields based on issue price are provided.Source: Bloomberg LP.

Market Summaries
33
Table 3: Top 30 Issuers of LCY Corporate Bonds in the Republic of Korea
IssuersOutstanding Amount
State-Owned
Listed onType of IndustryLCY Bonds
(KRW billion)LCY Bonds (US$ billion) KOSPI KOSDAQ
1. Korea Land & Housing Corp. 58,184.7 52.4 Yes No No Real Estate
2. Korea Housing Finance Corp. 52,923.5 47.6 Yes No No Financial
3. Korea Deposit Insurance Corp. 46,620.0 41.9 Yes No No Insurance
4. Korea Finance Corp. 42,440.0 38.2 Yes No No Financial
5. Industrial Bank of Korea 31,750.7 28.6 Yes Yes No Bank
6. KDB Daewoo Securities 31,041.1 27.9 Yes Yes No Securities
7. Korea Electric Power Corp. 29,140.0 26.2 Yes Yes No Utillity
8. Woori Investment and Securities 26,687.9 24.0 Yes Yes No Securities
9. Korea Investment and Securities 25,740.0 23.2 No No No Securities
10. Mirae Asset Securities 22,372.5 20.1 No Yes No Securities
11. Korea Expressway Corp. 19,870.0 17.9 Yes No No Infrastructure
12. Tong Yang Securities 18,758.8 16.9 No Yes No Securities
13. Kookmin Bank 18,363.8 16.5 No No No Bank
14. Shinhan Bank 18,048.2 16.2 No No No Bank
15. Small & Medium Business Corp. 14,865.0 13.4 Yes No No Financial
16. Hyundai Securities 14,615.0 13.2 No Yes No Securities
17. Korea Rail Network Authority 14,590.0 13.1 Yes No No Infrastructure
18. Woori Bank 13,322.5 12.0 Yes No No Bank
19. Korea Gas Corp. 13,105.0 11.8 Yes Yes No Utility
20. Hana Daetoo Securities 13,027.2 11.7 No No No Securities
21. Hana Bank 12,265.0 11.0 No No No Bank
22. Korea Water Resources 9,760.4 8.8 Yes Yes No Utility
23. Samsung Securities 9,694.5 8.7 No Yes No Securities
24. Shinhan Investment Corp. 9,645.8 8.7 No No No Securities
25. Korea Eximbank 9,100.0 8.2 Yes No No Bank
26. Shinhan Card 8,900.3 8.0 No No No Financial
27. Standard Chartered First Bank Korea 8,210.0 7.4 No No No Bank
28. Hyundai Capital Services 8,202.0 7.4 No No No Securities
29. Korea Railroad Corp. 8,080.0 7.3 Yes No No Infrastructure
30. Korea Student Aid Foundation 8,050.0 7.2 Yes No No Financial
Total Top 30 LCY Corporate Issuers 617,373.8 555.5
Total LCY Corporate Bonds 991,972.0 892.6
Top 30 as % of Total LCY Corporate Bonds 62.2% 62.2%
KOSDAQ = Korean Securities Dealers Automated Quotations, KOSPI = Korea Composite Stock Price Index, LCY = local currency.Notes:1. Data as of end-March 2013.2. State-owned firms are defined as those in which the government has more than a 50% ownership stake.Source: AsianBondsOnline calculations based on Bloomberg and EDAILY BondWeb data.
Total bonds outstanding among the top 30 corporate issuers reached KRW617.4 trillion at the end of 1Q13, representing 62.2% of total corporate bonds outstanding.

Asia Bond Monitor
34
MalaysiaThe local currency (LCY) bond market in Malaysia stood at MYR996 trillion (US$322 billion) at end-March, expanding 9.0% year-on-year (y-o-y). On a quarter-on-quarter (q-o-q) basis, however, the bond market contracted 0.4% due to a decline in issuance by Bank Negara Malaysia.
Table 1: Size and Composition of the LCY Bond Market in Malaysia
Outstanding Amount (billion) Growth Rate (%)1Q12 4Q12 1Q13 1Q12 1Q13
MYR US$ MYR US$ MYR US$ q-o-q y-o-y q-o-q y-o-yTotal 913 298 1,000 327 996 322 9.5 16.6 (0.4) 9.0 Government 550 179 599 196 589 190 10.2 16.7 (1.7) 7.1 Central Government Bills and Bonds 408 133 440 144 446 144 4.0 9.8 1.4 9.5 Central Bank Bills 142 46 154 50 136 44 33.5 43.0 (11.6) (4.3) Sukuk Perumahan Kerajaan 0 0 5 1 6 2 ─ ─ 37.8 ─ Corporate 363 119 401 131 407 132 8.6 16.5 1.6 12.1
– = not applicable, ( ) = negative, q-o-q = quarter-on-quarter, y-o-y = year-on-year.Notes:1. Calculated using data from national sources. 2. Bloomberg LP end-of-period LCY–US$ rate is used.3. Growth rates are calculated from an LCY base and do not include currency effects. Source: Bank Negara Malaysia Fully Automated System for Issuing/Tendering (FAST) and Bloomberg LP.
The size of Malaysia’s LCY corporate bond market reached MYR407.3 billion at end-March, rising 1.6% q-o-q and 12.1% y-o-y. New issuance amounted to MYR29.2 billion in 1Q13, with utilities and industrial companies as the largest issuers.
Table 2: Notable LCY Corporate Issuance in 1Q13
Corporate Issuers Coupon Rate (%)
Issued Amount (MYR million)
Malakoff Power 102-day Islamic bond 5.78 700 1-year Islamic bond 5.88 700 2-year Islamic bond 5.98 700 3-year Islamic bond 6.08 700 4-year Islamic bond 6.18 700 6-year Islamic bond 6.38 700 9-year Islamic bond 6.68 700 12-year Islamic bond 6.98 700Turus Pesawat Sdn. Bhd. 10-year Islamic bond 3.77 500 10-year Islamic bond 3.83 125 12-year Islamic bond 3.97 325 15-year Islamic bond 4.16 370 15-year Islamic bond 4.22 240 18-year Islamic bond 4.37 350Danainfra Nasional Bhd. 10-year Islamic bond 4.00 400 12-year Islamic bond 3.96 300 15-year Islamic bond 4.17 400 20-year Islamic bond 4.38 400
LCY = local currency.Source: Bank Negara Malaysia.

Market Summaries
35
As of end-1Q13, LCY bonds outstanding among the top 30 corporate bond issuers in Malaysia stood at MYR230.6 billion, accounting for 56.6% of total corporate bonds outstanding. Finance-related companies comprised 14 of the top 30 LCY corporate bond issuers.Table 3: Top 30 Issuers of LCY Corporate Bonds in Malaysia
IssuersOutstanding Amount
State-Owned
Listed Company Type of IndustryLCY Bonds
(MYR billion)LCY Bonds(US$ billion)
1. Project Lebuhraya Usahasama Bhd. 30.60 9.89 No Yes Transport, Storage, and Communications
2. Cagamas 26.63 8.61 Yes No Finance
3. Khazanah 18.70 6.04 Yes No Quasi-Government
4. Pengurusan Air Bhd. 11.28 3.65 Yes No Energy, Gas, and Water
5. Maybank 11.20 3.62 No Yes Finance
6. Prasarana 9.91 3.20 Yes No Finance
7. Binariang GSM 9.89 3.20 No No Transport, Storage, and Communications
8. CIMB Bank 7.00 2.26 No No Finance
9. Public Bank 6.07 1.96 No Yes Finance
10. Malakoff Corp 5.80 1.87 No No Finance
11. Senai Desaru Expressway Bhd. 5.57 1.80 No No Construction
12. Sarawak Energy 5.50 1.78 Yes Yes Energy, Gas, and Water
13. KL International Airport 5.36 1.73 Yes No Transport, Storage, and Communications
14. Turus Pesawat Sdn. Bhd. 5.31 1.72 Yes No Quasi-Government
15. Aman Sukuk Bhd. 5.03 1.63 Yes No Construction
16. 1Malaysia Development Bhd. 5.00 1.62 Yes No Finance
17. Celcom Transmission 5.00 1.62 No No Transport, Storage, and Communications
18. Putrajaya Holdings 4.94 1.60 No No Finance
19. Hong Leong Bank 4.86 1.57 No Yes Finance
20. Manjung Island Energy Bhd. 4.85 1.57 No No Energy, Gas, and Water
21. AM Bank 4.71 1.52 No Yes Finance
22. Perbadanan Tabung Pendidikan Tinggi Nasional 4.70 1.52 No No Quasi-Government
23. RHB Bank 4.60 1.49 No No Finance
24. YTL Power International 4.32 1.40 No Yes Energy, Gas, and Water
25. Tanjung Bin Power 4.20 1.36 No No Energy, Gas, and Water
26. Jimah Energy Ventures 4.19 1.35 No No Energy, Gas, and Water
27. Bank Pembangunan Malaysia 4.10 1.33 Yes No Finance
28. Danainfra Nasional Bhd. 3.90 1.26 Yes No Finance
29. Rantau Abang Capital Bhd. 3.80 1.23 No No Quasi-Government
30. Danga Capital 3.60 1.16 No No Finance
Total Top 30 LCY Corporate Issuers 230.61 74.54
Total LCY Corporate Bonds 407.27 131.64
Top 30 as % of Total LCY Corporate Bonds 56.6% 56.6%
LCY = local currency.Notes:1. Data as of end-March 2013.2. State-owned firms are defined as those in which the government has more than a 50% ownership stake.Source: AsianBondsOnline calculations based on Bank Negara Malaysia Fully Automated System for Issuing/Tendering (FAST) data.

Asia Bond Monitor
36
PhilippinesTotal local currency (LCY) bonds outstanding in the Philippines reached PHP4.1 trillion (US$99 billion) in 1Q13, declining 0.3% quarter-on-quarter (q-o-q), but increasing 13.7% year-on-year (y-o-y). The corporate bond market expanded 1.1% q-o-q and 19.8% y-o-y in 1Q13.
Table 1: Size and Composition of the LCY Bond Market in the Philippines
Outstanding Amount (billion) Growth Rate (%)
1Q12 4Q12 1Q13 1Q12 1Q13
PHP US$ PHP US$ PHP US$ q-o-q y-o-y q-o-q y-o-y
Total 3,562 83 4,064 99 4,051 99 5.1 12.8 (0.3) 13.7
Government 3,118 73 3,538 86 3,519 86 5.6 13.2 (0.6) 12.8
Treasury Bills 268 6 275 7 286 7 (9.3) (33.0) 4.1 6.9
Treasury Bonds 2,724 63 3,150 77 3,119 76 6.9 21.8 (1.0) 14.5
Others 127 3 113 3 113 3 14.6 6.0 0.0 (10.7)
Corporate 444 10 526 13 532 13 1.9 10.4 1.1 19.8 ( ) = negative, LCY = local currency, q-o-q = quarter-on-quarter, y-o-y = year-on-year.Notes:1. Calculated using data from national sources. 2. Bloomberg end-of-period LCY–US$ rates are used.3. Growth rates are calculated from an LCY base and do not include currency effects.4. Data for Government as of end-February 2013.5. Others comprises bonds issued by government agencies, entities, and corporations for which repayment is guaranteed by the Government of the Philippines. This
includes bonds issued by Power Sector Assets and Liabilities Management (PSALM) and the National Food Authority, among others.6. Peso Global Bonds (PHP-denominated bonds payable in US$) and multi-currency Retail Treasury Bonds (RTBs) are not included. As of end-March 2013, the
Government of the Philippines and Petron Corporation had PHP129.7 billion and PHP20.0 billion of outstanding Peso Global Bonds, respectively. There was a total of PHP20.4 billion of outstanding multi-currency Treasury Bonds as of end-March 2013.
Source: Bureau of the Treasury and Bloomberg LP.
Corporate bond issuance in 1Q13 grew 21.9% q-o-q and remained unchanged on a y-o-y basis. Financial institutions, including banks and investment companies, were the lead issuers of debt in 1Q13.
Table 2: Notable LCY Corporate Issuance in 1Q13
Corporate Issuers Coupon Rate (%)
Issued Amount (PHP billion)
BDO Unibank Inc. 5-year certificate of deposit 3.80 5Eagle Cement Corporation 7-year bond 5.75 5GT Capital Holdings Inc. 7-year bond 4.84 5 10-year bond 5.09 5
Source: Bloomberg LP.

Market Summaries
37
LCY bonds outstanding among the top 31 corporate bond issuers in the Philippines reached PHP489.7 billion at the end of 1Q13, representing 92.1% of total corporate bonds outstanding.
Table 3: Top 31 Issuers of LCY Corporate Bonds in the Philippines
IssuersOutstanding Amount
State- Owned
Listed Company Type of IndustryLCY Bonds
(PHP billion)LCY Bonds(US$ billion)
1. San Miguel Brewery Inc. 45.2 1.1 No Yes Brewery
2. Ayala Corporation 40.0 1.0 No Yes Diversified Operations
3. BDO Unibank Inc. 38.0 0.9 No Yes Banking
4. SM Investments Corporation 36.1 0.9 No Yes Diversified Operations
5. Ayala Land Inc. 31.2 0.8 No Yes Real Estate
6. Philippine National Bank 21.9 0.5 No Yes Banking
7. Manila Electric Company 19.4 0.5 No Yes Electricity Distribution
8. Philippine Long Distance Telephone Co. 17.3 0.4 No Yes Telecommunications
9. Maynilad Water Services 16.6 0.4 No Yes Water
10. SM Development Corporation 16.3 0.4 No Yes Real Estate
11. Filinvest Land Inc. 14.5 0.4 No Yes Real Estate
12. Rizal Commercial Banking Corporation 14.0 0.3 No Yes Banking
13. Petron Corporation 13.6 0.3 No Yes Oil Refining and Marketing
14. JG Summit Holdings Inc. 13.3 0.3 No Yes Diversified Operations
15. Security Bank Corporation 13.0 0.3 No Yes Banking
16. First Metro Investment Corporation 12.0 0.3 No No Investment Banking
17. Robinsons Land Corporation 12.0 0.3 No Yes Real Estate
18. Energy Development Corporation 12.0 0.3 No Yes Electricity Generation
19. MTD Manila Expressway Corporation 11.5 0.3 No No Transport Services
20. South Luzon Tollway Corporation 11.0 0.3 No No Transport Services
21. Globe Telecom Inc. 10.9 0.3 No Yes Telecommunications
22. Metropolitan Bank & Trust Co. 10.0 0.2 No Yes Banking
23. GT Capital Holdings Inc. 10.0 0.2 No Yes Investment Companies
24. United Coconut Planters Bank 9.5 0.2 No No Banking
25. Allied Banking Corporation 8.0 0.2 No Yes Banking
26. Megaworld Corporation 6.4 0.2 No Yes Real Estate
27. Manila North Tollways Corporation 6.1 0.1 No No Public Thoroughfares
28. Tanduay Distilleries Inc. 5.0 0.1 No Yes Alcoholic Beverages
29. SM Prime Holdings, Inc. 5.0 0.1 No Yes Real Estate
30. Bank of the Philippine Islands 5.0 0.1 No Yes Banking
31. China Banking Corporation 5.0 0.1 No Yes Banking
Total Top 31 LCY Corporate Issuers 489.7 12.0
Total LCY Corporate Bonds 532.0 13.0
Top 31 as % of Total LCY Corporate Bonds 92.1% 92.1%
LCY = local currency.Notes:1. Data as of end-March 2013.2. Petron Corporation has PHP20 billion of Global Peso Bonds outstanding that are not included in this table.3. State-owned firms are defined as those in which the government has more than a 50% ownership stake.Source: AsianBondsOnline calculations based on Bloomberg data.

Asia Bond Monitor
38
Singapore
Singapore’s local currency (LCY) bonds outstanding stood at SGD312 billion (US$252 billion) at end-March, expanding 5.1% quarter-on-quarter (q-o-q) and 17.3% year-on-year (y-o-y), driven mainly by rapid growth in Monetary Authority of Singapore (MAS) bills. Corporate bond market growth outpaced that of the government sector on a y-o-y basis in 1Q13.
Table 1. Size and Composition of the LCY Bond Market in Singapore
Outstanding Amount (billion) Growth Rate (%)
1Q12 4Q12 1Q13 1Q12 1Q13
SGD US$ SGD US$ SGD US$ q-o-q y-o-y q-o-q y-o-y
Total 266 212 297 243 312 252 7.7 19.7 5.1 17.3
Government 162 129 173 142 184 148 5.4 21.4 6.4 13.7
Central Govt. Bills and Bonds 144 114 143 117 147 118 3.8 7.9 2.9 2.0
MAS Bills 18 14 30 25 37 30 20.0 – 22.8 106.7
Corporate 104 83 124 102 128 104 11.5 17.3 3.4 22.9
( ) = negative, LCY = local currency, MAS = Monetary Authority of Singapore, q-o-q = quarter-on-quarter, y-o-y = year-on-year.Notes:1. Government bonds are calculated using data from national sources. Corporate bonds are based on AsianBondsOnline estimates. 2. Government bills and bonds do not include the special issue of Singapore Government Securities held by the Singapore Central Provident Fund (CPF). 3. Bloomberg LP end-of-period LCY–US$ rate is used.4. Growth rates are calculated from an LCY base and do not include currency effects.Source: Monetary Authority of Singapore, Singapore Government Securities, and Bloomberg LP.
In 1Q13, corporate bond issuance rose 71.2% q-o-q to reach SGD4.1 billion, driven by SGD2.2 billion worth of new issues from the Housing and Development Board of Singapore. On a y-o-y basis, however, new issuance declined 25.5%.
Table 2: Notable LCY Corporate Issuance in 1Q13
Corporate Issuers Coupon Rate (%)
Issued Amount (SGD million)
Housing and Development Board
3-year bond 0.94 1,000
5-year bond 1.23 1,200
Biosensors Investments
4-year bond 4.88 300
Suntec Real Estate Investments
5-year convertible/put bond 1.40 280
National University of Singapore
5-year bond 1.04 250
Hong Fok Corporation Ltd.
5-year bond 4.75 100
6-year bond 4.75 120
Guthrie GTS Ltd.
5-year bond 3.70 125
LCY = local currency.Source: Bloomberg LP.

Market Summaries
39
Table 3: Top 30 Issuers of LCY Corporate Bonds in Singapore
IssuersOutstanding Amount
State-Owned
Listed Company Type of IndustryLCY Bonds
(SGD billion)LCY Bonds(US$ billion)
1. Housing and Development Board 14.4 11.6 Yes No Financial
2. DBS Bank Ltd. 5.0 4.0 No Yes Financial
3. CapitaLand Ltd. 4.9 3.9 No Yes Financial
4. United Overseas Bank Ltd. 4.5 3.6 No Yes Financial
5. Temasek Financial I 3.6 2.9 No No Financial
6. Oversea-Chinese Banking Corp. 2.7 2.2 No Yes Financial
7. SP PowerAssets Ltd. 2.4 1.9 No No Utilities
8. Public Utilities Board 2.1 1.7 Yes No Utilities
9. Land Transport Authority 2.1 1.7 Yes No Industrial
10. Olam International Ltd. 1.6 1.3 No Yes Consumer
11. Keppel Corp Ltd. 1.5 1.2 No Yes Industrial
12. GLL IHT Pte Ltd. 1.4 1.2 No No Real Estate
13. Keppel Land Ltd. 1.4 1.1 No Yes Real Estate
14. Mapletree Treasury Services 1.3 1.1 No No Financial
15. Overseas Union Enterprise Ltd. 1.3 1.0 No Yes Consumer
16. Temasek Financial III 1.3 1.0 No No Financial
17. Neptune Orient Lines Ltd. 1.3 1.0 No Yes Industrial
18. CapitaMalls Asia Treasury 1.1 0.9 No No Financial
19. City Developments Ltd. 1.1 0.9 No Yes Consumer
20. PSA Corporation Ltd. 1.0 0.8 No No Consumer
21. F&N Treasury Pte Ltd. 1.0 0.8 No No Financial
22. Hyflux Ltd. 1.0 0.8 No Yes Industrial
23. Singapore Post Limited 0.9 0.7 Yes No Industrial
24. Singtel Group Treasury 0.9 0.7 No No Telecommunications
25. Singapore Airlines 0.8 0.6 No No Transportation
26. Global Logistic Properties 0.8 0.6 No Yes Industrial
27. CapitaLand Treasury Ltd. 0.7 0.6 No No Financial
28. Joynote Limited 0.7 0.6 No No Financial
29. Sembcorp Financial Services 0.7 0.6 No No Industrial
30. CapitaMall Trust 0.7 0.5 No Yes Financial
Total Top 30 LCY Corporate Issuers 64.0 51.6
Total LCY Corporate Bonds 128.4 103.5
Top 30 as % of Total LCY Corporate Bonds 49.9% 49.9%
LCY = local currency.Notes: 1. Data as of end-March 2013.2. State-owned firms are defined as those in which the government has more than a 50% ownership stake.Source: AsianBondsOnline calculations based on Bloomberg data.
Total LCY bonds outstanding among Singapore’s top 30 corporate bond issuers stood at SGD64 billion at the end of 1Q13, representing one-half of the total corporate bond market in Singapore. The largest issuers remained financial institutions.

Asia Bond Monitor
40
ThailandTotal local currency (LCY) bonds outstanding in Thailand increased 1.1% quarter-on-quarter (q-o-q) and 11.8% year-on-year (y-o-y) to reach THB8.6 trillion (US$294 billion) at the end of 1Q13. Growth in the Thai LCY corporate bond market outpaced government bond market growth on both a q-o-q and y-o-y basis.
Table 1: Size and Composition of the LCY Bond Market in Thailand
Outstanding Amount (billion) Growth Rate (%)
1Q12 4Q12 1Q13 1Q12 1Q13
THB US$ THB US$ THB US$ q-o-q y-o-y q-o-q y-o-y
Total 7,709 250 8,520 279 8,616 294 8.4 13.1 1.1 11.8
Government 6,151 200 6,760 221 6,779 232 7.1 12.3 0.3 10.2
Government Bonds and Treasury Bills 2,777 90 3,024 99 3,098 106 5.7 9.1 2.5 11.5
Central Bank Bonds 2,913 94 3,120 102 3,026 103 10.3 19.0 (3.0) 3.9
State-Owned Enterprise and Other Bonds 461 15 616 20 654 22 (2.9) (4.5) 6.3 42.0
Corporate 1,558 51 1,760 58 1,837 63 14.0 16.5 4.4 17.9
( ) = negative, LCY = local currency, q-o-q = quarter-on-quarter, y-o-y = year-on-year.Notes:1. Calculated using data from national sources. 2. 1Q13 data based on AsianBondsOnline estimates.3. Bloomberg end-of-period LCY–US$ rates are used.4. Growth rates are calculated from an LCY base and do not include currency effects. Source: Bank of Thailand (BOT) and Bloomberg LP.
Corporate bond issuance rose 10.2% q-o-q, but fell 9.3% y-o-y, in 1Q13. The most notable LCY corporate bond issues in 1Q13 were from real estate developers.
Table 2: Notable LCY Corporate Issuance in 1Q13
Corporate Issuers Coupon Rate (%)
Issued Amount (THB billion)
Double A (1991)
3-year bond 5.50 1.00
5-year bond 6.00 3.34
5-year bond 6.00 1.16
Toyota Leasing (Thailand)
3-year bond 3.34 4.00
Sansiri PCL
5-year bond 4.99 3.00
Hemaraj Land & Development
10-year bond 5.50 2.50
Asian Property
5-year bond 4.24 1.25
LCY = local currency.Source: Bloomberg LP.

Market Summaries
41
Table 3: Top 30 Issuers of LCY Corporate Bonds in Thailand
Issuers Outstanding Amount
State-Owned
Listed Company Type of Industry LCY Bonds
(THB billion) LCY Bonds(US$ billion)
1. PTT 186.0 6.4 Yes Yes Energy
2. Siam Cement 126.5 4.3 Yes Yes Diversified
3. Krung Thai Bank 75.7 2.6 Yes Yes Financial
4. Siam Commercial Bank 60.0 2.1 No Yes Financial
5. Charoen Pokphand Foods 58.5 2.0 No Yes Consumer
6. Bank of Ayudhya 52.7 1.8 No Yes Financial
7. Kasikorn Bank 47.1 1.6 No Yes Financial
8. Thanachart Bank 40.5 1.4 No No Financial
9. Thai Airways International 34.7 1.2 Yes Yes Consumer
10. PTT Global Chemical 33.3 1.1 Yes Yes Basic Materials
11. PTT Exploration and Production Company 29.2 1.0 Yes Yes Energy
12. Thai Oil 27.8 0.9 Yes Yes Energy
13. TMB Bank 27.7 0.9 No Yes Financial
14. Banpu 25.3 0.9 No Yes Energy
15. Ayudhya Capital Auto Lease 25.1 0.9 No No Financial
16. Toyota Leasing Thailand 24.9 0.9 No No Financial
17. Mitr Phol Sugar 24.7 0.8 No No Consumer
18. Krung Thai Card 23.5 0.8 Yes Yes Financial
19. DAD SPV 22.5 0.8 Yes No Financial
20. Indorama Ventures 21.7 0.7 No Yes Basic Materials
21. Bangkok Expressway 21.2 0.7 No Yes Consumer
22. Bangkok Bank 20.0 0.7 No Yes Financial
23. IRPC 19.6 0.7 Yes Yes Energy
24. Glow Energy 19.1 0.7 No Yes Utilities
25. True Corporation 17.2 0.6 No Yes Communications
26. Quality Houses 17.0 0.6 No Yes Property
27. Land & Houses 16.5 0.6 No Yes Property
28. Minor International 16.4 0.6 No Yes Consumer
29. Doubla A (1991) 16.0 0.5 No No Consumer
30. Pruksa Real Estate 12.5 0.4 No No Property
Total Top 30 LCY Corporate Issuers 1,142.6 39.1
Total LCY Corporate Bonds 1,837.4 62.8
Top 30 as % of Total LCY Corporate Bonds 62.2% 62.2%
LCY = local currency.Notes:1. Data as of end-March 2013.2. State-owned firms are defined as those in which the government has more than a 50% ownership stake.Source: AsiaBondsOnline calculations based on Bloomberg data.
LCY bonds outstanding among the top 30 LCY corporate issuers amounted to THB1.1 trillion at the end of 1Q13, representing 62.2% of total corporate bonds outstanding.

Asia Bond Monitor
42
Viet Nam
Local currency (LCY) bonds outstanding in Viet Nam stood at VND632.3 trillion (US$30.2 billion) at end-March, an increase of 20.8% quarter-on-quarter (q-o-q) and 53.3% year-on-year (y-o-y) driven mainly by rapid growth in the government sector.
Table 1: Size and Composition of the LCY Bond Market in Viet Nam
Outstanding Amount (billion) Growth Rate (%)1Q12 4Q12 1Q13 1Q12 1Q13
VND US$ VND US$ VND US$ q-o-q y-o-y q-o-q y-o-y
Total 412,464 20 523,423 25 632,319 30 12.8 20.1 20.8 53.3
Government 370,797 18 501,060 24 610,310 29 14.8 23.7 21.8 64.6
Treasury Bonds 165,974 8 255,011 12 310,537 15 11.6 36.1 21.8 87.1
Central Bank Bonds 30,478 1 58,560 3 112,857 5 – – 92.7 270.3
State-Owned Enterprise Bonds 174,345 8 187,489 9 186,916 9 (0.04) (2.0) (0.3) 7.2
Corporate 41,667 2 22,362 1 22,009 1 (2.3) (4.1) (1.6) (47.2)
– = not applicable, ( ) = negative, LCY = local currency, q-o-q = quarter-on-quarter, y-o-y = year-on-year.Notes:1. Bloomberg LP end-of-period LCY–US$ rates are used. 2. Growth rates are calculated from an LCY base and do not include currency effects.Source: Bloomberg LP.
At the end of 1Q13, LCY bonds outstanding among the 15 largest corporate issuers comprised 96.0% of the total LCY corporate market. Of the top 15 LCY corporate issuers, six were real estate developers, accounting for 38.0% of total bonds outstanding.
Table 2: Top 15 Issuers of LCY Corporate Bonds in Viet Nam
IssuersOutstanding Amount
State-Owned
Listed Company Type of IndustryLCY Bonds
(VND billion)LCY Bonds (US$ billion)
1. HAGL 4,110.00 0.20 No Yes Real Estate 2. Techcom Bank 3,000.00 0.14 No No Finance 3. Asia Commercial Joint Stock Bank 3,000.00 0.14 No Yes Finance 4. Vincom 3,000.00 0.14 No Yes Real Estate 5. Vinpearl 2,500.00 0.12 No Yes Resorts and Theme Parks 6. Agribank Securities 2,000.00 0.10 No Yes Finance 7. Minh Phu Seafood 700.00 0.03 No Yes Fisheries 8. Hoa Phat Group 600.00 0.03 No Yes Miscellaneous Manufacturing 9. Kinh Bac City Development 500.00 0.02 No Yes Real Estate
10. Development Investment 350.00 0.02 No No Building and Construction 11. Phu Hoang Anh 350.00 0.02 No No Real Estate 12. Binh Chanh Construction 300.00 0.01 No Yes Building and Construction 13. Saigon Telecommunication 300.00 0.01 No Yes Technology 14. Thu Duc Housing Development 208.87 0.01 No Yes Real Estate 15. Long Hau 200.00 0.01 No Yes Real Estate
Total Top 15 LCY Corporate Issuers 21,118.87 1.01
Total LCY Corporate Bonds 22,008.87 1.05 Top 15 as % of Total LCY Corporate Bonds 96.0% 96.0%
LCY = local currency.Notes:1. Data as of end-March 2013.2. State-owned firms are defined as those in which the government has more than a 50% ownership stake.Source: AsianBondsOnline calculations based on Bloomberg data.

Printed in the Philippines Printed on recycled paper.
Asian Development Bank6 ADB Avenue, Mandaluyong City1550 Metro Manila, Philippineswww.adb.org
Asia Bond Monitor June 2013
This publication reviews recent developments in East Asian local currency bond markets along with the outlook, risks, and policy options. It covers the 10 members of the Association of Southeast Asian Nations plus the People’s Republic of China; Hong Kong, China; and the Republic of Korea.
It was prepared by the Asian Development Bank’s Office of Regional Economic Integration (OREI), headed by Iwan J. Azis, and supervised by OREI Senior Director Ramesh Subramaniam. The production of the Asia Bond Monitor was led by Thiam Hee Ng and John Stuermer with support from the AsianBondsOnline team.
About the Asian Development Bank
ADB’s vision is an Asia and Pacific region free of poverty. Its mission is to help its developing member countries reduce poverty and improve the quality of life of their people. Despite the region’s many successes, it remains home to two-thirds of the world’s poor: 1.7 billion people who live on less than $2 a day, with 828 million struggling on less than $1.25 a day. ADB is committed to reducing poverty through inclusive economic growth, environmentally sustainable growth, and regional integration.
Based in Manila, ADB is owned by 67 members, including 48 from the region. Its main instruments for helping its developing member countries are policy dialogue, loans, equity investments, guarantees, grants, and technical assistance.