Asia and Pacific Economic Outlook - International … and Pacific Economic Outlook Medium-Term...
19
Asia and Pacific Economic Outlook Medium-Term Challenges in the Region: Implications of the “New Mediocre” OAP Economic Issues Seminar Ranil Salgado Assistant Director, Regional Studies Division Asia & Pacific Department, IMF December 5, 2016 Key messages and roadmap 2 •Asia remains the main engine of global growth. •In the medium-term, Asia needs to prepare for the risk of a “new mediocre” in advanced economies. •The global trade slowdown and anti-trade sentiment can hit Asia hard—Asia needs more balanced and inclusive growth. •May need to re-assess projections given developments since October projections.
Transcript of Asia and Pacific Economic Outlook - International … and Pacific Economic Outlook Medium-Term...

Asia and Pacific Economic OutlookMedium-Term Challenges in the Region:
Implications of the “New Mediocre”
OAP Economic Issues Seminar
Ranil SalgadoAssistant Director, Regional Studies Division
Asia & Pacific Department, IMFDecember 5, 2016
Key messages and roadmap
2
•Asia remains the main engine of global growth.
•In the medium-term, Asia needs to prepare for the risk of a “new mediocre” in advanced economies.
•The global trade slowdown and anti-trade sentiment can hit Asia hard—Asia needs more balanced and inclusive growth.
•May need to re-assess projections given developments since October projections.
3
Growth Outlook
in Asia
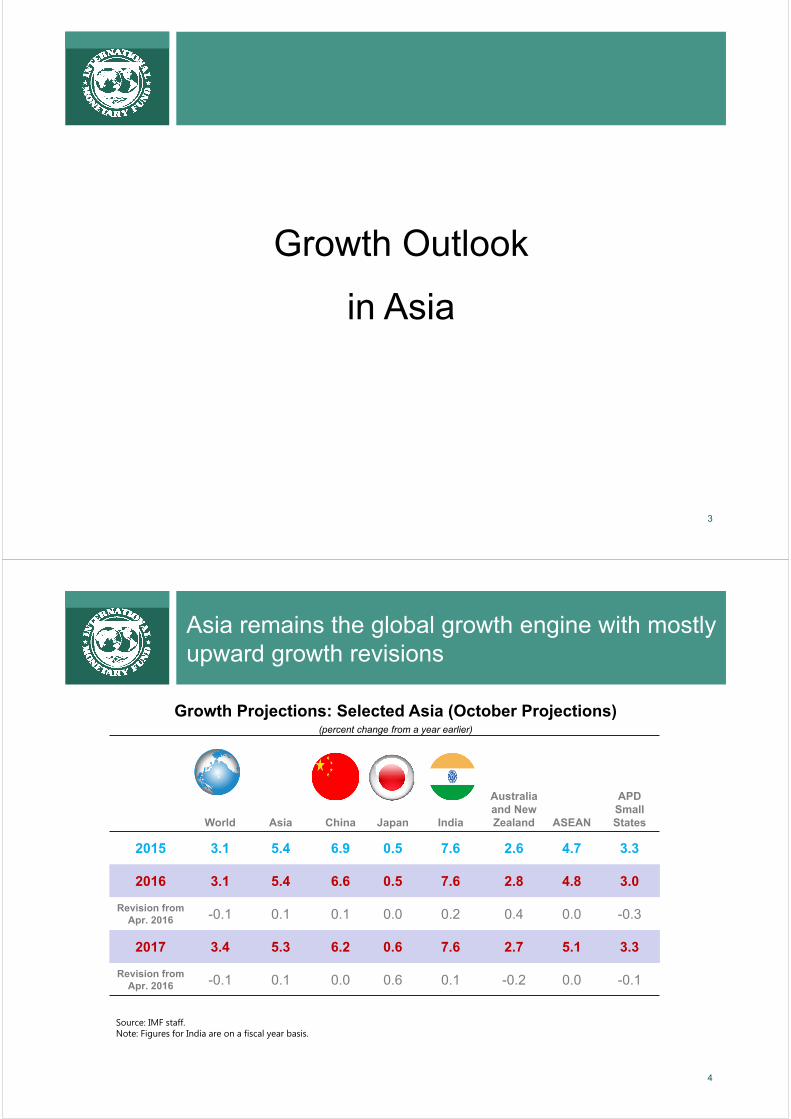
Asia remains the global growth engine with mostly upward growth revisions
4
Growth Projections: Selected Asia (October Projections)(percent change from a year earlier)
World Asia China Japan India
Australiaand New Zealand ASEAN
APD Small States
2015 3.1 5.4 6.9 0.5 7.6 2.6 4.7 3.3
2016 3.1 5.4 6.6 0.5 7.6 2.8 4.8 3.0
Revision fromApr. 2016 -0.1 0.1 0.1 0.0 0.2 0.4 0.0 -0.3
2017 3.4 5.3 6.2 0.6 7.6 2.7 5.1 3.3
Revision from Apr. 2016 -0.1 0.1 0.0 0.6 0.1 -0.2 0.0 -0.1
Source: IMF staff.Note: Figures for India are on a fiscal year basis.

Asia: Risks to the outlook
5
Near-term:
•Weak global recovery and global trade slowdown
•Sudden tightening of global financial conditions (asynchronous monetary policies in AEs, de-risking)
•China rebalancing, if bumpy
•Natural disasters and geopolitical tensions
Medium-term:
•“New mediocre” in advanced economies
Developments since October Projections: e.g. Upside surprises in Q3 growth, U.S. elections, and India “demonetization”
Asia’s growth has moderated in recent years…
6
2
3
4
5
6
7
8
9
2010
2011
2012
2013
2014
2015
2016
2017
2018
2019
2020
Outturn 2010 20112012 2013 20142015
Asia: GDP Growth Outturns vs. WEO Projections 1/ (Year-over-year percent change)
Sources: IMF, WEO database; and IMF staff calculations.1/ 5-yr forward projections from October WEO in each year.
2
3
4
5
6
7
8
9
2010
2011
2012
2013
2014
2015
2016
2017
2018
2019
2020
Outturn 2010 20112012 2013 20142015
World: GDP Growth Outturns vs. WEO Projections 1/ (Year-over-year percent change)
Sources: IMF, WEO database; and IMF staff calculations.1/ 5-yr forward projections from October WEO in each year.

… which may be due to growth convergence, but other factors as well
7
Japan
KoreaIndonesia Malaysia
PhilippinesThailand
ChinaIndia
0
2
4
6
8
10
12
0 10000 20000 30000 40000 50000GDP per capita, PPP
Real GDP per Capita Growth: 2010-2015 (percent)
Sources: IMF, World Economic Outlook database; and IMF staff calculations.Note: Red dots represent major Asian countries, and yellow lines indicate top 10 percentile GDP growth rate within each income group.
Top 10 percentile thresholds
Recent Developments
8
• Upside surprises in Q3 growth• Primarily in U.S. and Japan, but also in parts of
emerging Asia
• U.S. elections• Tighter financial conditions • But too early to assess overall impact
• India “demonetization”
• Other: e.g., Japan and Korea

Market reaction to U.S. presidential elections
-10 -5 0 5 10 15
PhilippinesIndonesiaIndiaMalaysiaSri LankaVietnamKoreaHong Kong SARThailandTaiwan POCNew ZealandMongoliaChinaSingaporeAustraliaJapanMexicoBrazilTurkeyColombiaChileSouth AfricaCzech RepublicHungaryPolandBulgariaRussia
Nov 9 Nov 10 - Dec 1 sum
Selected Asia: Stock Market Index(Percent change; in local currency)
Sources: Bloomberg L.P.; Haver Analytics; and IMF staff calculations.
-12 -9 -6 -3 0 3
JapanMalaysiaAustraliaNew ZealandIndonesiaSingaporeKoreaIndiaThailandPhilippinesMongoliaVietnamChinaTaiwan POCSri LankaHong Kong SAR
MexicoTurkeyPolandHungarySouth AfricaCzech RepublicBulgariaRussiaChile
Nov 9 Nov 10 - Dec 1 sum
Selected Asia: Bilateral FX Rate against USD(Percent change; positive=local currency appreciation)
10
What Does the “New Mediocre”
Mean For Asia?
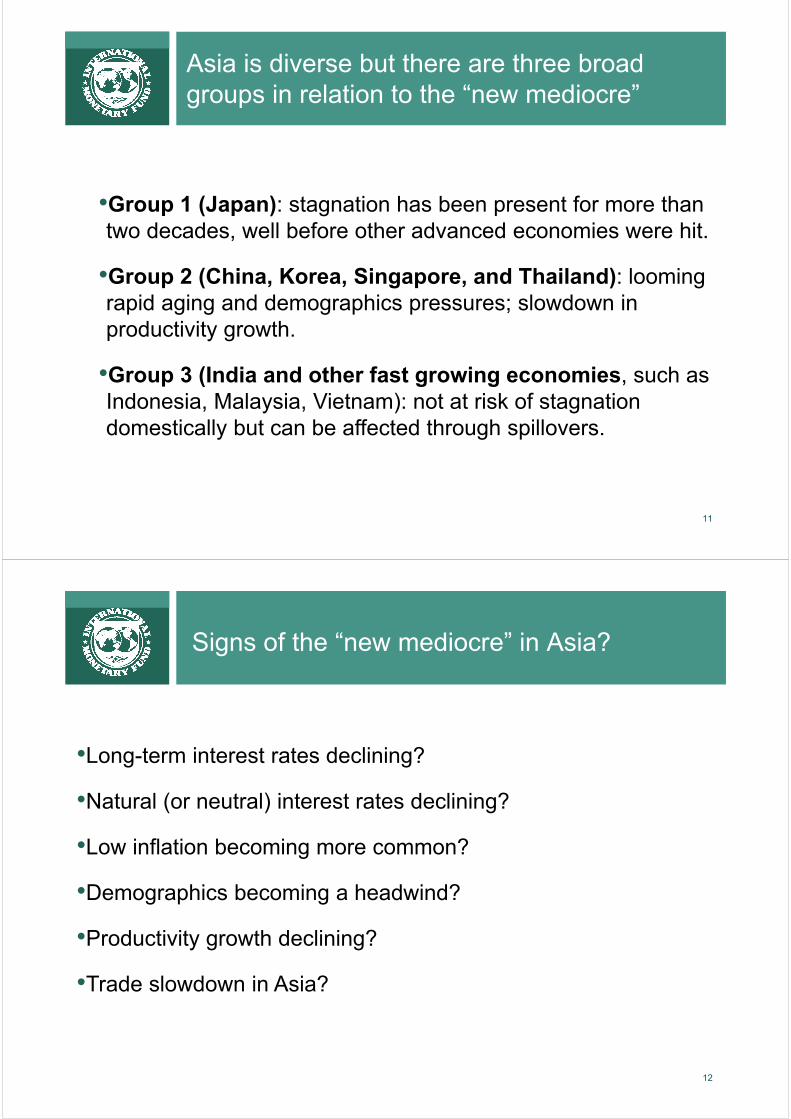
Asia is diverse but there are three broad groups in relation to the “new mediocre”
11
•Group 1 (Japan): stagnation has been present for more than two decades, well before other advanced economies were hit.
•Group 2 (China, Korea, Singapore, and Thailand): looming rapid aging and demographics pressures; slowdown in productivity growth.
•Group 3 (India and other fast growing economies, such as Indonesia, Malaysia, Vietnam): not at risk of stagnation domestically but can be affected through spillovers.
Signs of the “new mediocre” in Asia?
12
•Long-term interest rates declining?
•Natural (or neutral) interest rates declining?
•Low inflation becoming more common?
•Demographics becoming a headwind?
•Productivity growth declining?
•Trade slowdown in Asia?

Long-term rates have fallen significantly in some cases, but not everywhere
13
-5.0
-4.5
-4.0
-3.5
-3.0
-2.5
-2.0
-1.5
-1.0
-0.5
0.0
Selected Asia: Change in 10-year Government Bond Yields (Percentage points; Sep 2016 compared to 2000-07 average)
-5.0
-4.5
-4.0
-3.5
-3.0
-2.5
-2.0
-1.5
-1.0
-0.5
0.0
Selected Asia: Change in Central Bank Policy Rates (Percentage points; Sep 2016 compared to 2000-07 average)
Sources: Bloomberg; and IMF staff calculations.
Natural interest rates have declined in some cases, but not everywhere
14
Source: Staff estimates based on a TVP-VAR for three variables – real GDP growth, inflation and a measure of real rate. Note: The conditional long horizon forecast (over 5 years) of the observed real rate is used as a measure of neutral rate.
-0.5
0
0.5
1
1.5
2
2.5
3
3.5
4
US UK Japan Korea Australia Indonesia China Malaysia
Selected Asia: Estimated Natural Real Interest Rates(Percent)
1990-99 2000-07 2016 Q2

Low inflation becoming more common across the region
15
0
20
40
60
80
100
2000
M1
2002
M1
2004
M1
2006
M1
2008
M1
2010
M1
2012
M1
2014
M1
2016
M1
Inflation rate below 2%Inflation rate below 1%Inflation rate below 0%
Asia: Number of Countries by Headline Inflation Rates (Percent of 22 Asian countries)
2016
M6
Sources: CEIC Data Company Ltd.; Haver Analytics; and IMF staff calculations.
0
20
40
60
80
100
2000
M1
2002
M1
2004
M1
2006
M1
2008
M1
2010
M1
2012
M1
2014
M1
2016
M1
Inflation rate below 2%Inflation rate below 1%Inflation rate below 0%
Advanced Economies: Number of Countries by Headline Inflation Rates (Percent of 33 countries)
2016
M6
Sources: IMF, Global Data Source; and IMF staff calculations.
Demographics: A headwind for some, a dividend for others
16
Asia: Potential Growth Impact of Demographics Trends(Percentage point impact on real GDP growth; average over 2020-50)
Asia: Old-Age Dependency Ratios(Percent)
Source: Staff estimates based on UN Population Prospects: 2015 Revision (medium-fertility variant) and IMF (2016). Note: Migration projections follow historical trends. The growth impact estimates are based on the assumptions of unchanged labor force participation by cohort, constant capital-to-labor ratio, and TFP growth unchanged from historical average.
Source: UN Population Prospects: 2015 Revision. Based on the medium-fertility variant scenario (with migration).
-2.0
-1.5
-1.0
-0.5
0.0
0.5
1.0
1.5
2.0
Phili
ppin
es
Indi
a
Indo
nesi
a
Mal
aysi
a
Viet
nam
New
Zea
land
Aust
ralia
Thai
land
Sing
apor
e
Kore
a
Chin
a
Japa
n
Hon
g Ko
ng, S
AR
Without migration
With migration
0
10
20
30
40
50
60
70
80
90
Phili
ppin
esIn
dia
Indo
nesi
aM
alay
sia
WO
RLD
Viet
nam
Aust
ralia
New
Zea
land
Hig
h-in
com
e co
untr
ies
Chin
aTh
aila
ndSi
ngap
ore
Hon
g Ko
ng S
ARKo
rea
Japa
n
2005 2020 2050
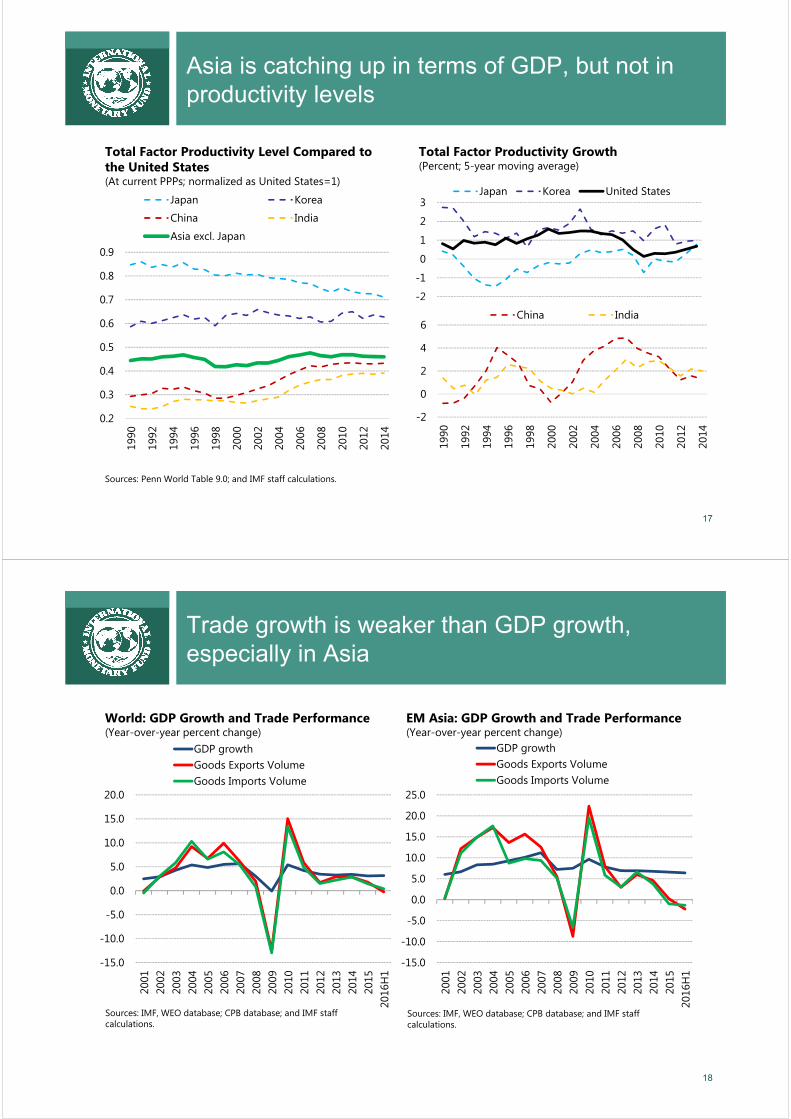
Asia is catching up in terms of GDP, but not in productivity levels
17
0.2
0.3
0.4
0.5
0.6
0.7
0.8
0.9
1990
1992
1994
1996
1998
2000
2002
2004
2006
2008
2010
2012
2014
Japan Korea
China India
Asia excl. Japan
Total Factor Productivity Level Compared to the United States(At current PPPs; normalized as United States=1)
Sources: Penn World Table 9.0; and IMF staff calculations.
-2
-1
0
1
2
3
1990
1992
1994
1996
1998
2000
2002
2004
2006
2008
2010
2012
2014
Japan Korea United States
Total Factor Productivity Growth(Percent; 5-year moving average)
-2
0
2
4
6
1990
1992
1994
1996
1998
2000
2002
2004
2006
2008
2010
2012
2014
China India
Trade growth is weaker than GDP growth, especially in Asia
18
-15.0
-10.0
-5.0
0.0
5.0
10.0
15.0
20.0
2001
2002
2003
2004
2005
2006
2007
2008
2009
2010
2011
2012
2013
2014
2015
2016
H1
GDP growthGoods Exports VolumeGoods Imports Volume
World: GDP Growth and Trade Performance(Year-over-year percent change)
Sources: IMF, WEO database; CPB database; and IMF staff calculations.
-15.0
-10.0
-5.0
0.0
5.0
10.0
15.0
20.0
25.0
2001
2002
2003
2004
2005
2006
2007
2008
2009
2010
2011
2012
2013
2014
2015
2016
H1
GDP growthGoods Exports VolumeGoods Imports Volume
EM Asia: GDP Growth and Trade Performance(Year-over-year percent change)
Sources: IMF, WEO database; CPB database; and IMF staff calculations.
Signs of the “new mediocre” in Asia?
19
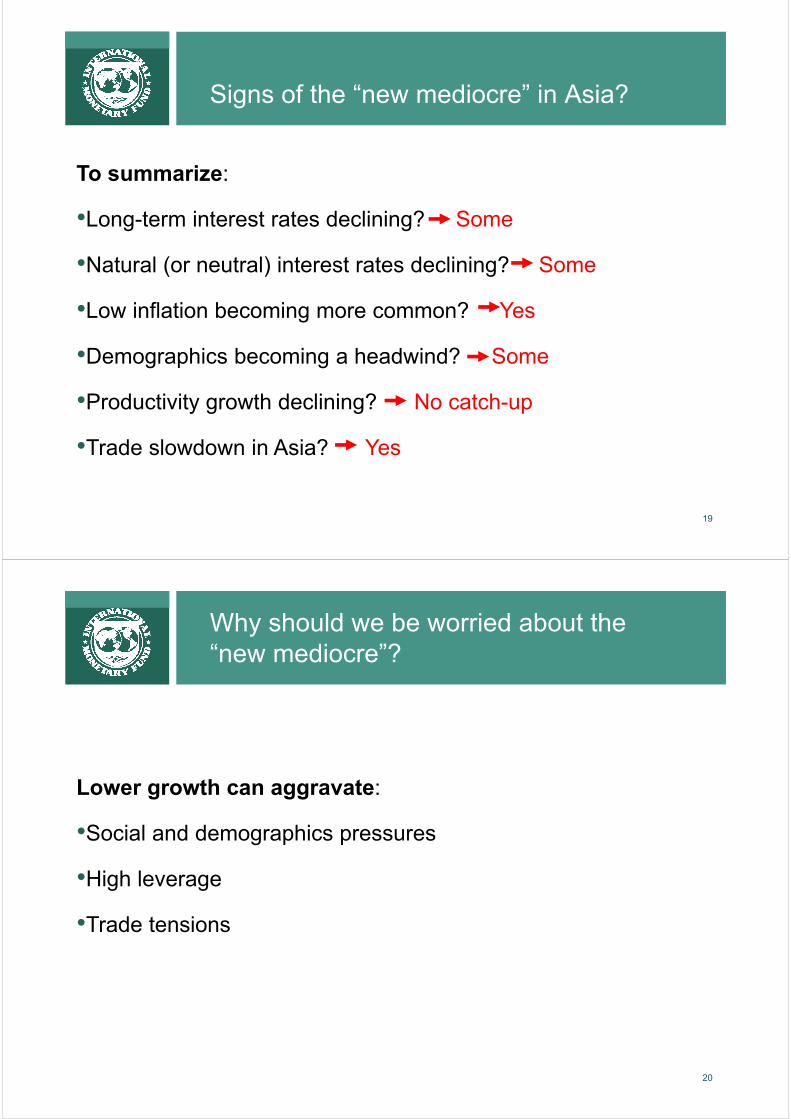
To summarize:
•Long-term interest rates declining? Some
•Natural (or neutral) interest rates declining? Some
•Low inflation becoming more common? Yes
•Demographics becoming a headwind? Some
•Productivity growth declining? No catch-up
•Trade slowdown in Asia? Yes
Why should we be worried about the “new mediocre”?
20
Lower growth can aggravate:
•Social and demographics pressures
•High leverage
•Trade tensions

Income inequality in Asia has already risen and social spending in Asia is relatively low
21
-5 0 5 10 15 20
China
India
Emerging and Developing Europe
Industrial Asia
NIEs
LICs Asia
OECD
ASEAN-5
Middle East and North Africa
Latin America and the Caribbean
Sub-Saharan Africa
Change in Income Inequality(Net Gini Index; change from 1990 to 2013; simple average across regions)
Sources: SWIID Version 5.0; IMF, WEO database; and IMF staff calculations.
0
5
10
15
20
25
30
Adva
nced
Eco
nom
ies
Emer
ging
Eur
ope
Latin
Am
eric
a
Mid
dle
East
and
Nor
th A
fric
a
Asia
Sub-
Saha
ran
Afric
a
Social Protection
Health
Education
Composition of Social Spending(Percent of GDP; year of 2010 or latest)
Sources: Organization for Economic Cooperation and Development; Eurostat; Asian Development Bank; IMF, World Economic Outlook; United Nations; World Health Organization; World Bank; and IMF staff calculations.
22
Corporate debt is relatively high in emerging Asia and household debt has risen rapidly in several cases
0
5
10
15
20
25
30
35
China Asia excludingChina
Latin America Europe,Middle East,and Africa
2010 2011 2013 2014 2015E
Emerging Market Firms: Debt-Potentially-at-Risk(Percent; share of total debt if ICR<2)
Source: April 2016 GFSR.Note: Asia excluding China= India, Indonesia, Malaysia, the Philippines, and Thailand.
-20 -10 0 10 20 30
USSpain
PortugalGermany
UKAustria
IndiaJapan
New ZealandNetherlands
ItalyIndonesia
FranceSingapore
BelgiumHong Kong SAR
KoreaAustralia
SwitzerlandCanadaSweden
ChinaNorway
MalaysiaThailand
Change in Household Debt to GDP Ratio (Percentage points; from end-2007 to end-2015)
Sources: BIS and IMF staff estimates.

The global trade slowdown and anti-trade sentiment could hit Asia hard
23
0
1
2
3
4
5
6
Asia
Indu
stria
l Asi
a
NIE
s
ASEA
N-4
Chin
a
Indi
a
1990-99 2000-15 2016-20 (proj.)
Selected Asia: Contribution of Exports to Real GDP Growth (Year-over-year; percentage points)
Sources: IMF, World Economic Outlook database; and IMF staff calculations.Note: ASEAN-4 includes Indonesia, Malaysia, the Philippines, and Thailand. Industrial Asia includes Australia, Japan, and New Zealand. NIEs include: Hong Kong SAR, Korea, Singapore, and Taiwan Province of China.
24
Implications for Monetary,
Fiscal, and Structural Policies
Monetary Policy in Anticipation of the “New Mediocre”: Some Issues to Consider?
25
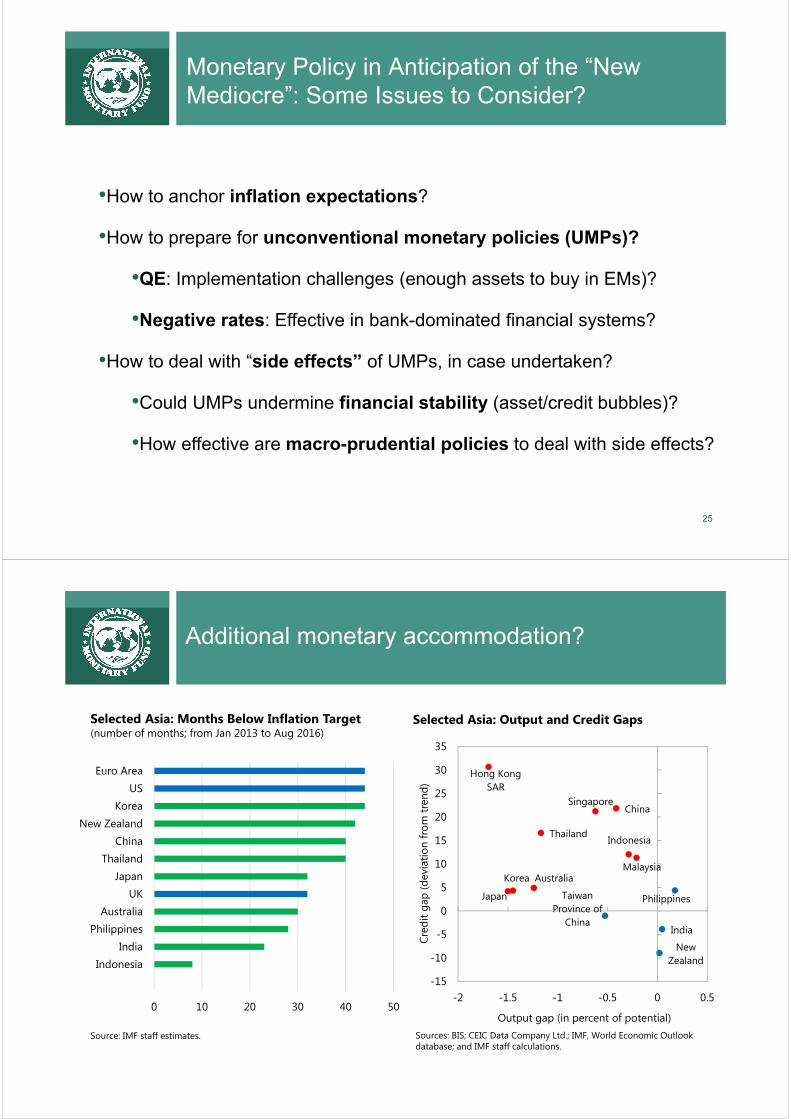
•How to anchor inflation expectations?
•How to prepare for unconventional monetary policies (UMPs)?
•QE: Implementation challenges (enough assets to buy in EMs)?
•Negative rates: Effective in bank-dominated financial systems?
•How to deal with “side effects” of UMPs, in case undertaken?
•Could UMPs undermine financial stability (asset/credit bubbles)?
•How effective are macro-prudential policies to deal with side effects?
Additional monetary accommodation?
Selected Asia: Months Below Inflation Target(number of months; from Jan 2013 to Aug 2016)
Source: IMF staff estimates.
0 10 20 30 40 50
IndonesiaIndia
PhilippinesAustralia
UKJapan
ThailandChina
New ZealandKorea
USEuro Area
Japan
Australia
New Zealand
Hong Kong SAR
Korea
Singapore
Taiwan Province of
China
Indonesia
Malaysia
Philippines
Thailand
China
India
-15
-10
-5
0
5
10
15
20
25
30
35
-2 -1.5 -1 -0.5 0 0.5
Cred
it ga
p (d
evia
tion
from
tren
d)
Output gap (in percent of potential)Sources: BIS; CEIC Data Company Ltd.; IMF, World Economic Outlook database; and IMF staff calculations.
Selected Asia: Output and Credit Gaps

Fiscal policy for demand support?
27
Japan
Australia New Zealand
Hong Kong SAR
Korea
Singapore
Taiwan POC
Indonesia
Malaysia
Philippines
Thailand
Vietnam
China
India
-5
0
5
10
15
20
25
-2.0 -1.0 0.0 1.0
Curr
ent
Acc
ount
Bal
ance
(p
erce
nt o
f G
DP;
201
6)
Output Gap (percent of GDP; 2016)
Selected Asia: Need for Demand Support
Sources: IMF WEO database; and IMF staff calculations.
AustraliaNew
Zealand
Hong Kong SAR Korea
Indonesia
Malaysia
Philippines
Thailand
Vietnam
China
India
0
50
100
150
200
250
300
0 20 40 60 805-
Year
CD
S Sp
read
s(b
asis
poi
nts;
201
6M1-
M3
aver
age)
General Government Gross Debt (percent of GDP; 2016)
Selected Asia: Fiscal Space
Sources: IMF WEO database; and IMF staff calculations.Note: Japan is not shown due to scale.
Structural reforms to boost productivity growth?
28
•Advanced Asia: Infrastructure investment (Australia); product market reforms (Australia, Japan, and Korea); labor market reforms (Japan, and Korea).
•Emerging Asia: Raising public investment efficiency (India); labor market reforms (India, Indonesia); product market reforms (China, India); resolving corporate debt overhang (China);
0.0
0.1
0.2
0.3
0.4
0.5
0.6
Ger
man
yJa
pan
Uni
ted
Stat
esAu
stra
liaKo
rea
Fran
ceIta
lyN
ew Z
eala
ndSp
ain
Port
ugal
Colo
mbi
aIn
done
sia
Turk
eyRu
ssia
Sout
h Af
rica
Chin
aIn
dia
Advanced economies Emerging economies
Source: OECD. Note: The reform responsiveness indicator reflects the share of policy recommendations from the OECD's "Going for Growth" reports on which the country has taken significant action.
Reforms Responsiveness Indicator(2011-15 average)

29
Country Specific Issues
Main Policy Challenges
30
Policy recommendationsMain Challenge
ChinaTackle the corporate debt problem; reduce reliance on
credit/investment stimulus; guard against financial risksCredit growth
Japan A comprehensive and coordinated policy packageReflation and
fiscal sustainability
IndiaContinue to implement structural reform to boost potential
growth; enhance resilience of corporates/banks
Corporate and banking sector strains
AUS and NZL
Accommodative monetary and fiscal policies, structural
reforms
Adjust to lower commodity prices
ASEAN-5
Continue to build policy buffers and to implement structural
reforms, and use macro prudential policies, as needed
Tighter external environment
Asian FDEs
Strengthen macro policy frameworks furtherMacro vulnerabilities
SmallStates
Build resilience and enhance growth potential
Natural disasters/climate change and withdrawal
of CBRs
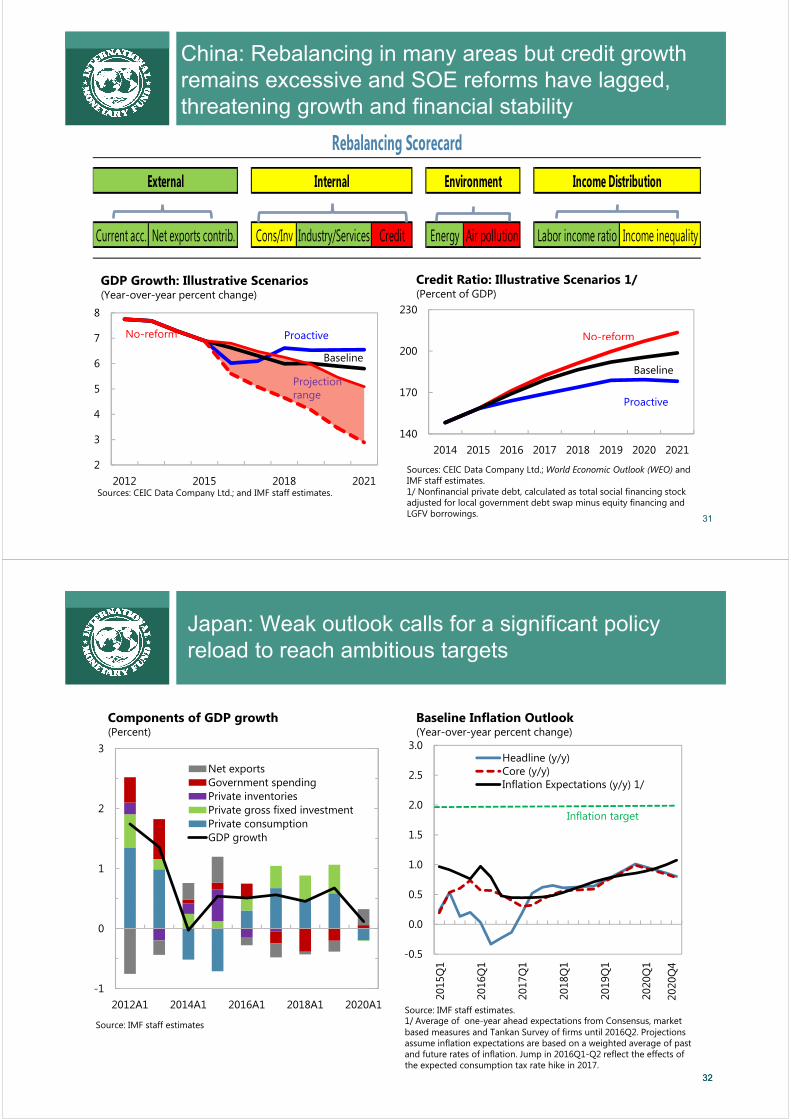
China: Rebalancing in many areas but credit growth remains excessive and SOE reforms have lagged, threatening growth and financial stability
31
Current acc. Net exports contrib. Cons/Inv Industry/Services Credit Energy Air pollution Labor income ratio Income inequality
Rebalancing Scorecard
External Internal Environment Income Distribution
2
3
4
5
6
7
8
2012 2015 2018 2021
GDP Growth: Illustrative Scenarios(Year-over-year percent change)
Sources: CEIC Data Company Ltd.; and IMF staff estimates.
Projection range
ProactiveNo-reform
Baseline
140
170
200
230
2014 2015 2016 2017 2018 2019 2020 2021
Credit Ratio: Illustrative Scenarios 1/(Percent of GDP)
Sources: CEIC Data Company Ltd.; World Economic Outlook (WEO) and IMF staff estimates.1/ Nonfinancial private debt, calculated as total social financing stock adjusted for local government debt swap minus equity financing and LGFV borrowings.
No-reform
Proactive
Baseline
Japan: Weak outlook calls for a significant policy reload to reach ambitious targets
3232
-1
0
1
2
3
2012A1 2014A1 2016A1 2018A1 2020A1
Net exportsGovernment spendingPrivate inventoriesPrivate gross fixed investmentPrivate consumptionGDP growth
Components of GDP growth(Percent)
Source: IMF staff estimates
-0.5
0.0
0.5
1.0
1.5
2.0
2.5
3.0
2015
Q1
2016
Q1
2017
Q1
2018
Q1
2019
Q1
2020
Q1
Headline (y/y)Core (y/y)Inflation Expectations (y/y) 1/
Baseline Inflation Outlook(Year-over-year percent change)
Source: IMF staff estimates. 1/ Average of one-year ahead expectations from Consensus, market based measures and Tankan Survey of firms until 2016Q2. Projections assume inflation expectations are based on a weighted average of past and future rates of inflation. Jump in 2016Q1-Q2 reflect the effects of the expected consumption tax rate hike in 2017.
2020
Q4
Inflation target
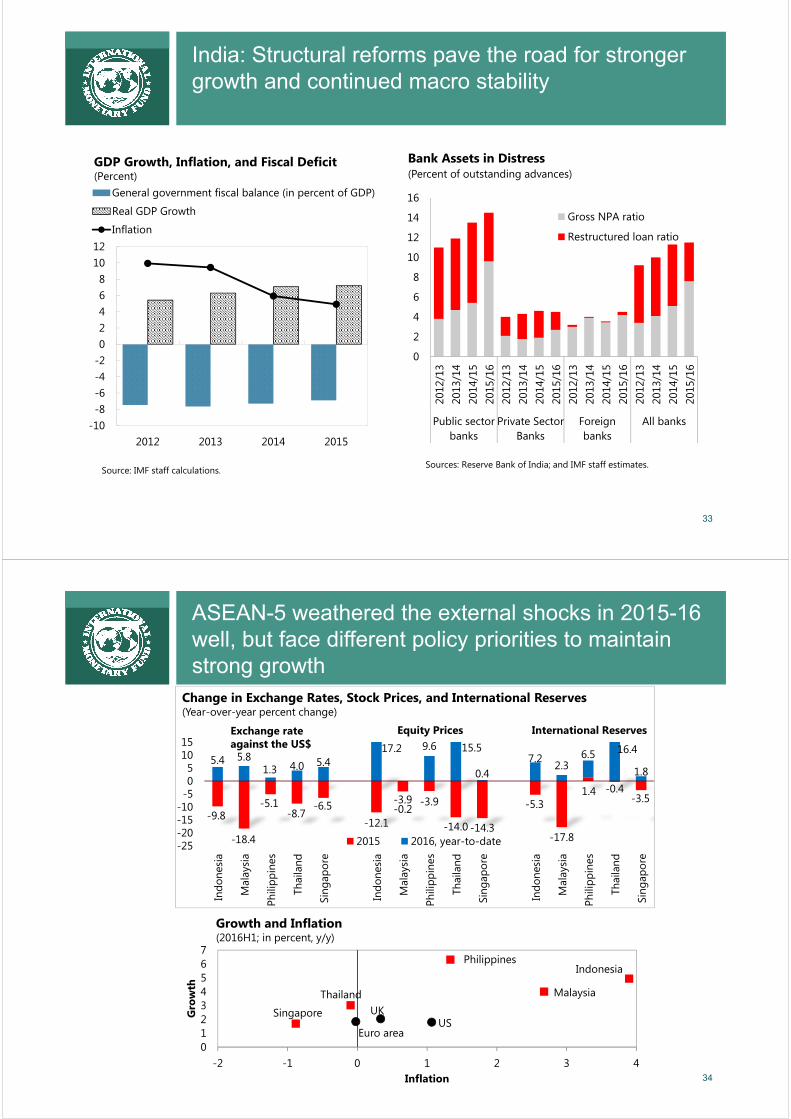
India: Structural reforms pave the road for stronger growth and continued macro stability
33
-10-8-6-4-202468
1012
2012 2013 2014 2015
General government fiscal balance (in percent of GDP)
Real GDP Growth
Inflation
GDP Growth, Inflation, and Fiscal Deficit(Percent)
Source: IMF staff calculations.
0
2
4
6
8
10
12
14
16
2012
/13
2013
/14
2014
/15
2015
/16
2012
/13
2013
/14
2014
/15
2015
/16
2012
/13
2013
/14
2014
/15
2015
/16
2012
/13
2013
/14
2014
/15
2015
/16
Public sectorbanks
Private SectorBanks
Foreignbanks
All banks
Bank Assets in Distress(Percent of outstanding advances)
Gross NPA ratio
Restructured loan ratio
Sources: Reserve Bank of India; and IMF staff estimates.
34
ASEAN-5 weathered the external shocks in 2015-16 well, but face different policy priorities to maintain strong growth
-9.8
-18.4
-5.1-8.7
-6.5-12.1
-3.9 -3.9
-14.0 -14.3
-5.3
-17.8
1.4 -0.4-3.5
5.4 5.81.3 4.0 5.4
17.2
-0.2
9.6 15.5
0.47.2 2.3
6.5 16.4
1.8
-25-20-15-10-505
1015
Indo
nesi
a
Mal
aysi
a
Phili
ppin
es
Thai
land
Sing
apor
e
Indo
nesi
a
Mal
aysi
a
Phili
ppin
es
Thai
land
Sing
apor
e
Indo
nesi
a
Mal
aysi
a
Phili
ppin
es
Thai
land
Sing
apor
e
2015 2016, year-to-date
Equity Prices International ReservesExchange rate against the US$
Change in Exchange Rates, Stock Prices, and International Reserves(Year-over-year percent change)
USUK
Euro area
Indonesia
Malaysia
Philippines
Singapore
Thailand
01234567
-2 -1 0 1 2 3 4
Gro
wth
Inflation
Growth and Inflation(2016H1; in percent, y/y)

35
Other Asian FDEs: Increasing vulnerabilities
Cambodia
Lao P.D.R.
Myanmar
Nepal
Vietnam
-14
-12
-10
-8
-6
-4
-2
0
2
4
6
-40 -20 0 20Fi
scal
Bal
ance
(% o
f G
DP)
Current Account Balance (% of GDP)
Sources: IMF World Economic Outlook database; and IMF staff calculations.Note: The size of the bubbles represents public debt in percent of GDP.
Fiscal and Current Account Balance, 2015
Bangladesh
-6
-4
-2
0
2
4
6
8
10
12
2015 2016 2015 2016 2015 2014 2015
GDP growth Inflation ReservesExport growth
Selected Indicators (Percent)
Sources: IMF World Economic Outlook database and IMF staff calculations.
(y/y)
Small States of the Pacific: Need to build resilience to natural disasters and climate change
0 20 40 60
Palau
Marshall Islands
Kiribati
Timor-Leste
Tuvalu
Micronesia
Caribbean small…
Samoa
Tonga
Solomon Islands
Vanuatu
Fiji
1/ During 1970-2014.Sources: Center for Research on Epidemiology for Disasters, International Disaster Database; IMF staff estimates.
Small Pacific island countries average
Probability of Occurrence of Natural Disasters1
(Percent)

Concluding remarks
37
•Asia remains the main engine of global growth.
•In the medium-term, Asia needs to prepare for the risk of a “new mediocre” in advanced economies.
•The global trade slowdown and anti-trade sentiment can hit Asia hard—Asia needs more balanced and inclusive growth.
•May need to re-assess projections given developments since October projections.