ASHRAE IT Equipment Thermal Management and Controls …tc0909.ashraetcs.org/documents/ASHRAE 2012 IT...
32
ASHRAE TC 9.9 IT Equipment Thermal Management and Controls Whitepaper prepared by ASHRAE Technical Committee (TC) 9.9 Mission Critical Facilities, Technology Spaces, and Electronic Equipment © 2012, American Society of Heating, Refrigerating and Air-Conditioning Engineers, Inc. All rights reserved. This publication may not be reproduced in whole or in part; may not be distributed in paper or digital form; and may not be posted in any form on the Internet without ASHRAE’s expressed written permission. Inquiries for use should be directed to [email protected]
Transcript of ASHRAE IT Equipment Thermal Management and Controls …tc0909.ashraetcs.org/documents/ASHRAE 2012 IT...

ASHRAE TC 9.9
IT Equipment Thermal Management and Controls
Whitepaper prepared by ASHRAE Technical Committee (TC) 9.9 Mission Critical
Facilities, Technology Spaces, and Electronic Equipment
© 2012, American Society of Heating, Refrigerating and Air-Conditioning Engineers, Inc. All rights
reserved. This publication may not be reproduced in whole or in part; may not be distributed in paper or
digital form; and may not be posted in any form on the Internet without ASHRAE’s expressed written
permission. Inquiries for use should be directed to [email protected]

ASHRAE TC 9.9 2
Acknowledgements:
ASHRAE TC 9.9 would like to thank Paul Artman from Dell, Jason Matteson from IBM, Ken Baker from HP
and Robin Steinbrecher from Intel for sharing their expertise in writing this whitepaper.
Disclaimer:
Thermal and power management features described in this whitepaper do not necessarily represent
implementations for any specific ITE or ITE manufacturer but rather general concepts and capabilities
available in general, volume servers. Custom servers, routers, switches or other enterprise hardware may
not necessarily conform to the described implementations.

ASHRAE TC 9.9 3
Definitions:
• ACPI – Advanced Configuration and Power Interface (an industry specification)
• ASIC – Application Specific Integrated Circuit
• BACnet – A data communication protocol for Building Automation and Control networks
• Chipset – the supporting silicon packaged in separate devices that provides IO capability or some
other service to the system
• CPU – Central Processing Unit (processor)
• Die – silicon device also called a chip
• DIMM – Dual Inline Memory Module
• DRAM – Dynamic Random Access Memory, silicon components mounted on a DIMM or RDIMM
• ETR – Extended Temperature Range capability available on most RDIMMs
• FET – Field Effect Transistor
• FR4 – a glass-reinforced epoxy laminate used with copper layers for power delivery and signal
routing
• FSC – Fan Speed Control
• GPGPU – General Purpose Graphical Processing Unit
• HDD – Hard Disk Drive
• IHS – Integral Heat Spreader also known as a case or lid
• IPMI – Intelligent Platform Management Interface
• ICT – Information and Communication Technology (term including both ITE and telecommunications
equipment)
• ITE – Information Technology Equipment
• LINPACK – a performance-driven software benchmark
• PCB – Printed Circuit Board
• PCIe – Peripheral Component Interconnect Express, IO interface used in servers
• PID – Proportional, Integral, Derivative control algorithm
• RAID – Redundant Array of Independent Disks
• RDIMM – Registered Dual Inline Memory Module
• SNMP – Simple Network Management Protocol
• SPECPower – a power-performance-driven server software benchmark
• Substrate – a small PCB onto which a die is mounted to enable greater interconnect area
• TCONTROL – a temperature threshold above which a processor’s reliability limit must be met
• THERMTRIP – a processor hardware output indicating absolute maximum temperature has been
exceeded
• TIM – Thermal Interface Material
• TM – Thermal Management
• Volume server – industry standard, general purpose server
• XML – eXtensible Markup Language

ASHRAE TC 9.9 4
Contents
1 Introduction ...................................... ................................................................................................. 5
2 ITE Thermal Design ................................ .......................................................................................... 7
3 Component Power and Thermal Management Features ... ............................................................ 13
3.1 Component Power Management Features ................................................................................. 13 3.2 Component Thermal Management Features .............................................................................. 14
4 Thermal Management ................................ ..................................................................................... 17
4.1 Thermal Control Inputs – Sensors ............................................................................................. 18 4.2 Fan Speed Control and Design .................................................................................................. 21 4.3 Configuration, Workload and Environment ................................................................................. 24 4.4 Management Controllers and Communication ........................................................................... 25 4.5 System Tuning and Configurability ............................................................................................ 25
5 ITE-Room Cooling Interaction ...................... .................................................................................. 27
6 Summary ........................................... .............................................................................................. 31
Figures
Figure 1 – System Thermal Management ................................................................................................ 7
Figure 2 – Example Component in a System and Rack ............................................................................ 8
Figure 3 – Processor Package ................................................................................................................. 8
Figure 4 – Processor Packaging and Reference Points ............................................................................ 9
Figure 5 – Example Heat Sink Performance ........................................................................................... 10
Figure 6 – Temperature Impact on Fan Power (Thermally Constrained Component) .............................. 10
Figure 7 – Example Board Layouts ........................................................................................................ 11
Figure 8 – System and Processor States ............................................................................................... 13
Figure 9 – Processor Thermal Management .......................................................................................... 15
Figure 10 – Memory Thermal Management............................................................................................ 16
Figure 11 – Boundaries for Thermal Management ................................................................................. 17
Figure 12 – Thermal Control Process ..................................................................................................... 18
Figure 13 – Example 1U Volume Server Thermal Sensors ..................................................................... 19
Figure 14 – Temperature Distribution on a CPU Die ............................................................................... 20
Figure 15 – Fan Zone Mapping .............................................................................................................. 22
Figure 16 – Example Sensor Mapping ................................................................................................... 23
Figure 17 – Fan Speed vs. System Inlet Temperature ............................................................................ 24

5 ASHRAE TC 9.9
1 Introduction
The ASHRAE Datacom Series along with the ASHRAE Handbook are great references for those seeking to understand
how data center cooling systems are designed and the methods used to optimize those cooling systems. However,
few publications provide useful information to the data center design and owner community describing the IT
equipment (ITE) thermal management systems and their interactions with the data center. This whitepaper serves to
bridge this gap by describing mainstream power/thermal management and cooling systems within ITE and potential
interactions between the IT equipment and the data center.
As computing requirements have changed, IT equipment has adapted to ensure computing efficiency. In the past,
customers demanded performance from their IT equipment with little consideration for energy consumption and the
overall cost in creating computing capability. This resulted in IT cooling systems that were extremely capable of
handling any workload with little consideration for ensuring that cooling was applied only as needed. Governmental
and marketplace forces are driving improved computing efficiency. This has resulted in a rapid transition to intensely
managed power and cooling within the IT equipment configured to customer requirements.
The technologies described in this whitepaper apply to typical, volume IT equipment. Thermal and power
optimization descriptions refer to data-center-class ITE implementations unless otherwise noted.
Note that the term ‘server’ is used throughout this paper when it could reasonably be attributed to mainstream,
volume IT equipment. Servers may use axial fans, blowers, motorized impellers or even piezoelectric fans.
Throughout this paper they are referred to as fans.
Common Misconceptions
Before beginning the discussion on ITE power and thermal management it is worthwhile to investigate some common
misperceptions with respect to servers:
1) ITE fans consume 10 to 20% of total ITE power
2) ITE is managed based upon chassis temperature rise
3) All mainstream IT equipment is designed and performs similarly
Let us address these misperceptions from a high level with more in-depth consideration later.
1) Air mover power consumption for well-designed, optimized servers can range as low as 1% of total load while
under idle conditions. Under more typical operation, air mover power consumption can range from 2 to 4% of
total load. Under extreme conditions of system inlet temperature when thermal capability has been stretched to
the limit, air mover power consumption can be pushed into the 8 to 15% range depending upon the server’s
thermal design. Non-optimized servers of the past (roughly pre-2005) with limited or no fan speed control
commonly consumed 10 to 20% of overall load and could consume even higher ratios under light loads due to the
lack of fan speed control.
2) Thermal management within servers is primarily driven to ensure compliance to component temperature
specifications which results in component temperatures often being very similar over a range of wide ambient
temperatures. Temperature rise in and of itself is not generally a consideration in the thermal management
scheme. Exhaust temperature may be a consideration for either safety concerns or to protect equipment in the
ASHRAE TC 9.9
6
hot aisle such as cables or switches in which case temperature rise of the air passing through the chassis must be
determined in some manner.
3) As described in item 1), fan power consumption has improved significantly over time. Some IT equipment is
poorly designed without precision thermal management which, when present, enables all components to be
cooled within their specifications while minimizing power consumption. Lower end volume servers in particular
do not monitor all sensors available and have simple fan speed control (FSC) algorithms. Today’s well designed
servers integrate a large numbers of thermal sensors along with activity and power sensors to drive fan speeds as
low as possible to reduce IT power.

ASHRAE TC 9.9
7
2 ITE Thermal Design
A basic understanding of ITE cooling and the thermal analysis process is valuable to comprehend how the thermal
design affects thermal management and vice versa. The example described here is applicable to most mainstream,
volume servers that are air-cooled, however, the principles apply to any type of cooling system.
Any cooling system must ensure that each and every component meets its specification. Most components have
damage, functional and reliability temperature specifications as seen in Figure 1. The thermal management of the
server must ensure compliance to the specifications by taking the appropriate actions to ensure that compliance.
Functional limits for silicon devices are generally in the 85 to 105°C range while damage limits are typically 15 to 25 °C
higher than this. While operating, the ITE cooling system must ensure compliance to the functional limits to ensure
data integrity. That functional limit is normally aligned with maximum utilization while the ITE is exposed to a worst
case corner of the allowable range of the ASHRAE class for which the ITE has been designed. Optimization for
differential air temperature (delta T) is generally not an optimization point due to the more urgent requirement of
ensuring that functional limits are maintained.
Figure 1 – System Thermal Management
Well-designed ITE will have thermal management to ensure compliance to those specifications either directly through
the cooling design implementation or in combination with the thermal management system. Figure 2 shows a
processor in a system which will be used as an example. Component temperature is driven by one of three factors in
an air-cooled system:
1. System ambient – inlet temperature to the system
• Defined in the ASHRAE Thermal Guidelines for Data Processing Environments (e.g. class A3)
• Includes any rack effects which can increase the air temperature delivered to the ITE
2. Air heating – increase in air temperature due to upstream heat sources,
• Affected by component placement, upstream component power dissipation, air movers, local air
delivery
3. Self heating – increase in component temperature above local ambient due to the heat dissipated on the
device of interest
• Driven by component packaging, power dissipation and thermal solution (e.g. heat sink)

ASHRAE TC 9.9
8
Figure 2 – Example Component in a System and Rack
A volume processor die is typically connected to a substrate made of FR4 (glass-reinforced epoxy laminate) or a
similar material enabling distribution of the interconnects to a larger area and simpler integration into a system using
a socket that enables removal of the processor. In some cases the substrate is directly connected to the main board
without a socket. To facilitate simple integration of a heat sink a case or integral heat spreader (IHS) is attached on
top of the package. Component heat is transferred by conduction to the IHS and removed by convection. Figure 3
shows an example processor. On the left of the figure the bottom of the substrate is shown with exposed contacts
for making an electrical connection in a socket. On the right of the figure the top with IHS is shown.
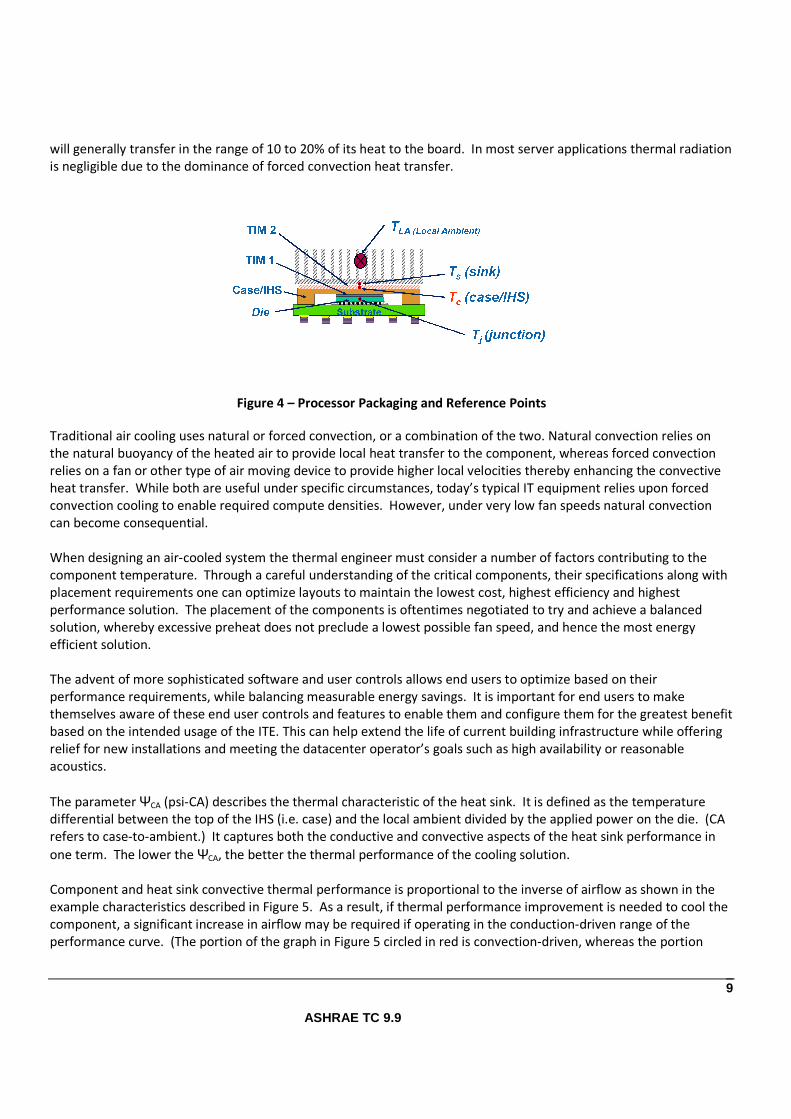
When a heat sink is used a thermal interface material (TIM) is normally required to fill the gaps between the
component and the heat sink. Without this TIM, high resistance to heat transfer can result due to the low
conductivity of air. Figure 4 shows the typical packaging of a processor with an IHS. The IHS serves to protect the die,
spread the heat and provide a mounting surface for a heat sink. Heat is primarily conducted through the first TIM
(TIM 1) to the IHS and out through the second TIM (TIM 2) to the heat sink. Conduction heat transfer through the
package to the board for a socketed processor is relatively small compared with that transferred from a processor
directly soldered to a board. A component directly mounted to a PCB (not socketed like a processor) with a heat sink
Figure 3 – Processor Package
ASHRAE TC 9.9
9
will generally transfer in the range of 10 to 20% of its heat to the board. In most server applications thermal radiation
is negligible due to the dominance of forced convection heat transfer.
Figure 4 – Processor Packaging and Reference Points
Traditional air cooling uses natural or forced convection, or a combination of the two. Natural convection relies on
the natural buoyancy of the heated air to provide local heat transfer to the component, whereas forced convection
relies on a fan or other type of air moving device to provide higher local velocities thereby enhancing the convective
heat transfer. While both are useful under specific circumstances, today’s typical IT equipment relies upon forced
convection cooling to enable required compute densities. However, under very low fan speeds natural convection
can become consequential.
When designing an air-cooled system the thermal engineer must consider a number of factors contributing to the
component temperature. Through a careful understanding of the critical components, their specifications along with
placement requirements one can optimize layouts to maintain the lowest cost, highest efficiency and highest
performance solution. The placement of the components is oftentimes negotiated to try and achieve a balanced
solution, whereby excessive preheat does not preclude a lowest possible fan speed, and hence the most energy
efficient solution.
The advent of more sophisticated software and user controls allows end users to optimize based on their
performance requirements, while balancing measurable energy savings. It is important for end users to make
themselves aware of these end user controls and features to enable them and configure them for the greatest benefit
based on the intended usage of the ITE. This can help extend the life of current building infrastructure while offering
relief for new installations and meeting the datacenter operator’s goals such as high availability or reasonable
acoustics.
The parameter ΨCA (psi-CA) describes the thermal characteristic of the heat sink. It is defined as the temperature
differential between the top of the IHS (i.e. case) and the local ambient divided by the applied power on the die. (CA
refers to case-to-ambient.) It captures both the conductive and convective aspects of the heat sink performance in
one term. The lower the ΨCA, the better the thermal performance of the cooling solution.
Component and heat sink convective thermal performance is proportional to the inverse of airflow as shown in the
example characteristics described in Figure 5. As a result, if thermal performance improvement is needed to cool the
component, a significant increase in airflow may be required if operating in the conduction-driven range of the
performance curve. (The portion of the graph in Figure 5 circled in red is convection-driven, whereas the portion
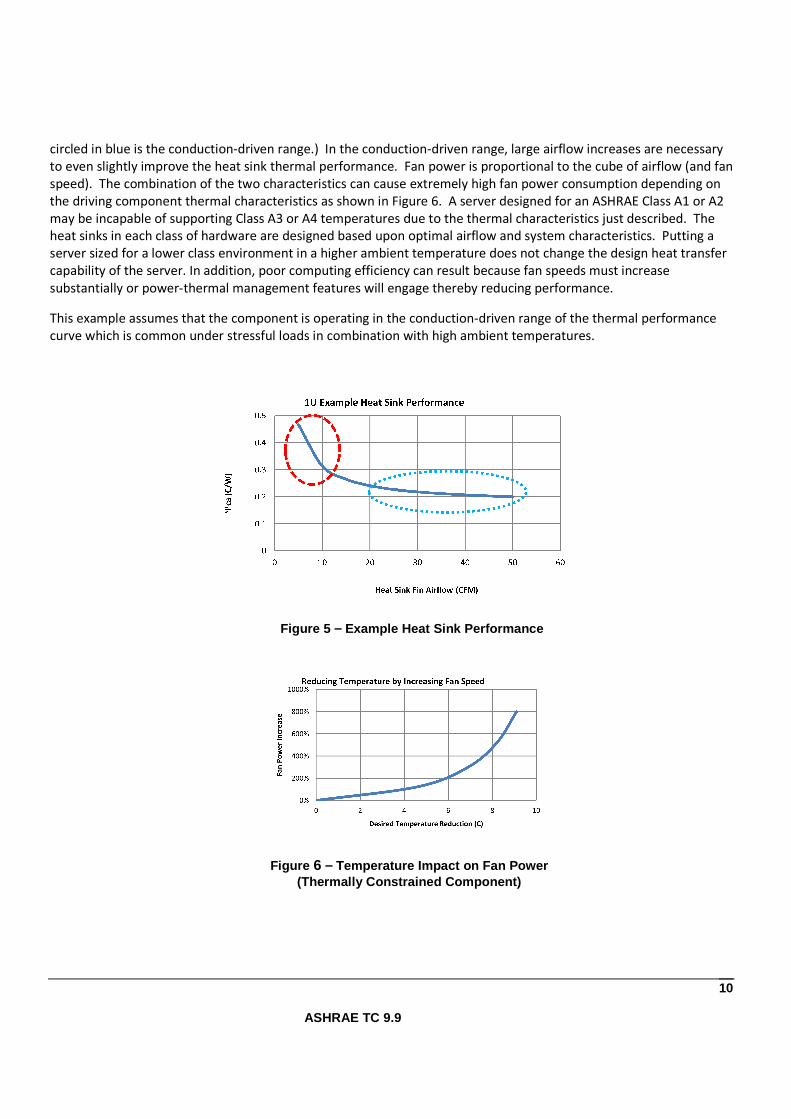
ASHRAE TC 9.9
10
circled in blue is the conduction-driven range.) In the conduction-driven range, large airflow increases are necessary
to even slightly improve the heat sink thermal performance. Fan power is proportional to the cube of airflow (and fan
speed). The combination of the two characteristics can cause extremely high fan power consumption depending on
the driving component thermal characteristics as shown in Figure 6. A server designed for an ASHRAE Class A1 or A2
may be incapable of supporting Class A3 or A4 temperatures due to the thermal characteristics just described. The
heat sinks in each class of hardware are designed based upon optimal airflow and system characteristics. Putting a
server sized for a lower class environment in a higher ambient temperature does not change the design heat transfer
capability of the server. In addition, poor computing efficiency can result because fan speeds must increase
substantially or power-thermal management features will engage thereby reducing performance.
This example assumes that the component is operating in the conduction-driven range of the thermal performance
curve which is common under stressful loads in combination with high ambient temperatures.
Figure 6 – Temperature Impact on Fan Power (Thermally Constrained Component)
Figure 5 – Example Heat Sink Performance
ASHRAE TC 9.9
11
System Considerations
The ITE design team must carefully consider the components, configurations, usage models, environmental
conditions, and the system-, rack- and room-level airflow protocols to achieve an optimal cooling solution. These
design considerations must be evaluated against the cost, performance, and energy objectives of the solution.
Component selection and placement detail will drive the design and consequently are the most critical elements to
consider during the design phase. One example is the selection of memory technology to be supported. An entry-
level server designed to support the highest capacity, highest frequency memory could burden the system design
with high performance, costly fans that are never needed by most customers. All components must be similarly
considered including the power range under which the components must function.
Component placement is primarily driven by electrical routing considerations. Lengths between key components
must be minimized to ensure signal integrity and meet timing requirements. Placement for thermal considerations
matters but is not the foremost driver during the board layout process. The thermal engineer must provide the
guidance to the board design team to enable solutions that have a reasonable chance for success while not
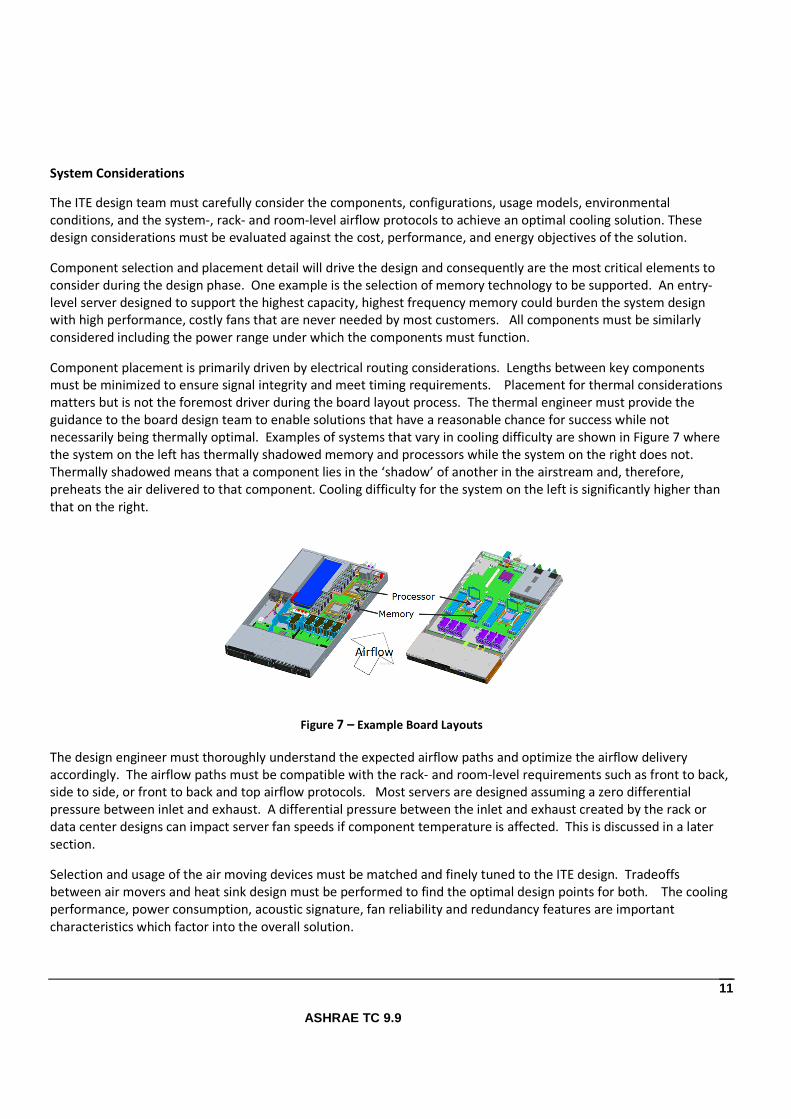
necessarily being thermally optimal. Examples of systems that vary in cooling difficulty are shown in Figure 7 where
the system on the left has thermally shadowed memory and processors while the system on the right does not.
Thermally shadowed means that a component lies in the ‘shadow’ of another in the airstream and, therefore,
preheats the air delivered to that component. Cooling difficulty for the system on the left is significantly higher than
that on the right.
Figure 7 – Example Board Layouts
The design engineer must thoroughly understand the expected airflow paths and optimize the airflow delivery
accordingly. The airflow paths must be compatible with the rack- and room-level requirements such as front to back,
side to side, or front to back and top airflow protocols. Most servers are designed assuming a zero differential
pressure between inlet and exhaust. A differential pressure between the inlet and exhaust created by the rack or
data center designs can impact server fan speeds if component temperature is affected. This is discussed in a later
section.
Selection and usage of the air moving devices must be matched and finely tuned to the ITE design. Tradeoffs
between air movers and heat sink design must be performed to find the optimal design points for both. The cooling
performance, power consumption, acoustic signature, fan reliability and redundancy features are important
characteristics which factor into the overall solution.

ASHRAE TC 9.9
12
Power Delivery
To understand how the server thermal management works, one must have a basic understanding of power delivery
and power management. In most cases, the power management features are used for thermal management
purposes. The next section describes this in more detail.
The majority of mainstream IT equipment is designed for connection to an AC (alternating current) source. The IT
equipment’s power supply converts the input AC to lower voltage DC levels for use by the subsystems in the
computer. Power supplies are typically designed to handle a wide range of input voltage levels enabling use around
the world with a single supply that can handle input frequencies in the 50 to 60 Hz range.
Many servers are designed with redundant power supplies whereby the AC-DC conversion subsystem can tolerate the
loss of a supply. In the past this may have resulted in lower overall efficiency but governmental and market
influences have driven the creation of new technologies that maximize efficiency throughout the load range, even
when operating in redundant mode.
DC-to-DC regulators create the tightly controlled, relatively low voltages used by the silicon devices on the board. A
board can easily have more than twenty-five regulators to create the various voltages required to power the devices
in the system.
ASHRAE TC 9.9
13
3 Component Power and Thermal Management Features
3.1 Component Power Management Features
The great emphasis on power and computing efficiency has created a demand for power management features that
can be cohesively integrated to meet customer goals. The power and performance management features described
below provide the capability for precision thermal management. Because processors and memory have been the
largest power consumers within a server, power manageability for both components is relatively sophisticated. Most
other server components respond with lower power consumption as a result of processor performance management
so they typically do not have their own sophisticated power management. By directly controlling the power of a
processor the power consumption of subassemblies are also affected; when traffic is halted on the processor
throughput on memory, chipset, hard drives, input-output (IO) devices, etc. generally decreases. General purpose
graphics processing units (GPGPU) or many-core processors are becoming thermal drivers under some load
conditions, so anticipate further innovation in power management features to address this. The GPU or many-core
processors handle high throughput computing needs while more mainstream processors address latency-sensitive
computing needs. Features described in this section pertain to general purpose, high volume components.
Processors
Competitive pressures have demanded that the processor be extremely energy efficient at all times. Processors with
power saving technologies such as multiple cores, dynamic frequency and voltage scaling can improve computing
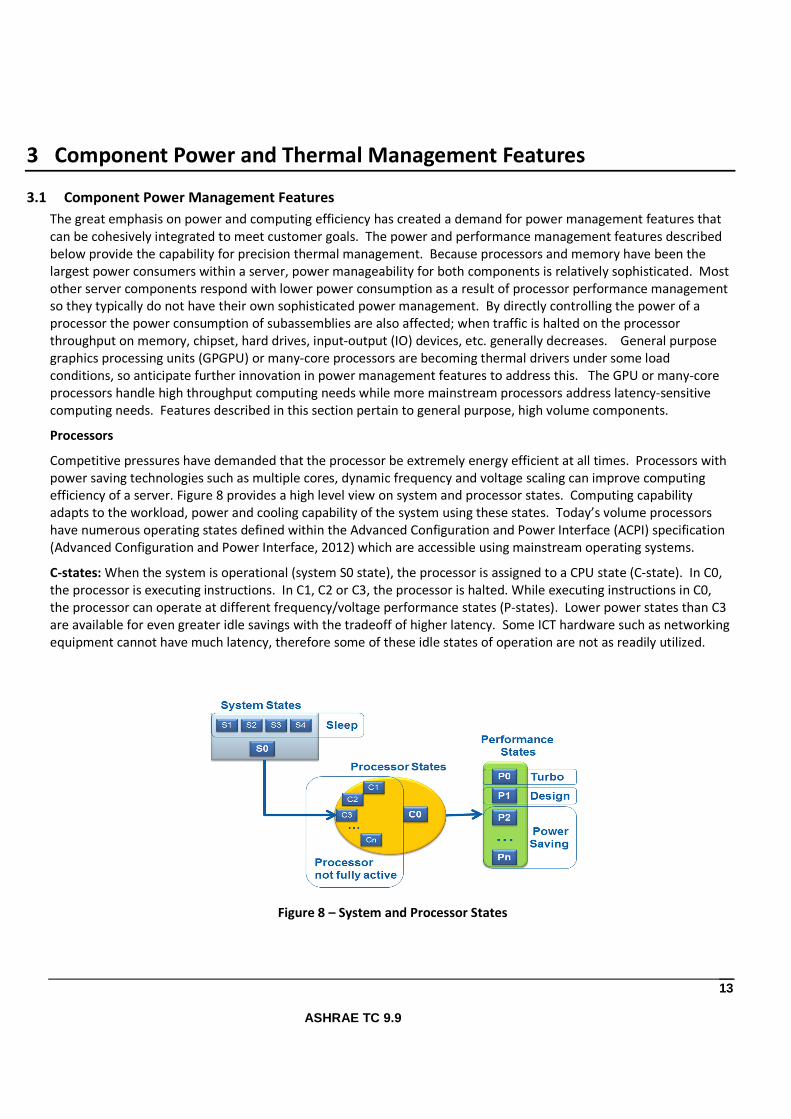
efficiency of a server. Figure 8 provides a high level view on system and processor states. Computing capability
adapts to the workload, power and cooling capability of the system using these states. Today’s volume processors
have numerous operating states defined within the Advanced Configuration and Power Interface (ACPI) specification
(Advanced Configuration and Power Interface, 2012) which are accessible using mainstream operating systems.
C-states: When the system is operational (system S0 state), the processor is assigned to a CPU state (C-state). In C0,
the processor is executing instructions. In C1, C2 or C3, the processor is halted. While executing instructions in C0,
the processor can operate at different frequency/voltage performance states (P-states). Lower power states than C3
are available for even greater idle savings with the tradeoff of higher latency. Some ICT hardware such as networking
equipment cannot have much latency, therefore some of these idle states of operation are not as readily utilized.
Figure 8 – System and Processor States
ASHRAE TC 9.9
14
P-States: Multicore processors feature dynamic frequency and voltage scaling. The power saving is achieved by
reducing the frequency multiplier and voltage of the processor. The combination of a specific processor frequency
and voltage is known as a performance state (P-state). At the highest P-state, P0 (also known as Turbo), the
processor will run at higher clock speeds and voltages, but during off-peak conditions it steps down to progressively
lower power P-states thereby adapting to load conditions. P0 is entered opportunistically based upon power and
thermal conditions and is generally not a design point for the thermal solution but may be for the voltage regulation.
P0 can be deactivated for those customers who do not need its performance capability. P0 performance comes at the
expense of increased processor power which may not be compatible with customer goals. P1 is the thermal design
point of a server providing guaranteed performance at a specific frequency. The minimum P-state, Pn, sets the
lowest frequency under which the processor will operate. P-states improve the dynamic power response of the
server resulting in idle power closer to zero. This reduces waste while allowing the system to deliver full performance
when needed for peak workloads.
T-States: When more drastic thermal management is required processor power can be further reduced by
modulating (starting and stopping) the internal processor clocks. Thermal states (T-states) are used as the last line of
defense for staying within functional limits when normal cooling has failed and should never activate when the server
is operating within specification. Performance can be significantly impacted when operating under T-states due to
the stopping of the clock for periods of time. This is very different from P-states where continuous operation at a
fixed clock speed occurs.
Memory
Power management of the memory subsystem is similar in functionality to that enabled for processors. Presently,
frequency and voltage cannot be dynamically changed so only data throughput is gated (i.e. duty cycled) to manage
power and performance. This limits the dynamic power range of memory that is not in an idle state but still provides
a workable power range for thermal purposes. Through the use of memory throttling component temperature can
be precisely managed within the capability of the system for cooling that memory. High capacity dual inline memory
modules (DIMMs) can consume more than 10 W each under load. A lower capacity RDIMM could consume under 5
W under the same load. Depending upon the customer requirements for that server it may be designed to support
the higher capacity DIMMs but not optimized for them. As a consequence high memory throughput may be thermal
or power throttled when operating under extreme environmental conditions or when pushing the limits of the power
system. The second edition of ASHRAE’s Power Trends and Cooling Applications describes this in more detail.
3.2 Component Thermal Management Features
Power management features are used to perform the actual power-performance limiting that enables a component
to stay within temperature limits. Sensors create the data necessary to trigger power management. Processors,
memory and some chipset components contain sophisticated thermal management capability and are discussed in
the following sections. The distinction is that it is not packaged within the processor.
Processors
Figure 9 shows an example scenario where the server delivers inadequate cooling for a workload. The example and
terminology used applies to processors following the ACPI specification used in server applications. TCONTROL is a
threshold above which the system’s server management must engage to continually monitor processor temperature
and meet a defined temperature limit based upon the power consumption of the processor. As the processor heats
up due to the application of a load it first passes the TCONTROL limit for the processor. If cooling is not adjusted the
processor would next approach and reach the maximum allowable functional limit of the processor called ‘PROCHOT’.
This temperature threshold defines the upper limit to which the processor has been

ASHRAE TC 9.9
15
tested and data integrity is ensured. Power management features engage to reduce power and ensure data integrity
by maintaining processor temperature below the threshold which causes PROCHOT to be asserted. P-states would
first engage. If processor temperature could not be maintained below the PROCHOT threshold T-states would then
engage. Performance drops substantially as a result. If processor temperature is not maintained below the PROCHOT
assertion threshold, temperature would continue to rise and the processor would be operating in an unsupported
temperature range. It is unsupported in that data integrity is not ensured. Eventually the processor would hit the
threshold activating THERMTRIP hardware pin on the processor and initiate shutdown to ensure no long term
damage to the processor would occur.
Memory
Similar to processors, power management features are used to manage potential excursions above unsupportable
temperature limits on DIMMs. Because the memory controller is now contained in the processor, the processor
determines the memory’s thermal state and activates power management features. Thermal sensors on the DIMMs
are accessed by the processor and memory traffic regulation can be activated as needed. The data retention time of
DRAM devices used on DIMMs is temperature dependent. Increasing the memory refresh rate allows operation at
higher temperature. Doubling of the refresh rate at the ‘Normal Limit’ temperature as shown in Figure 10, can be
initiated to enable hotter operation of the DIMM to reduce the cooling burden on the system. Operation at that
higher temperature is called ‘Extended Temperature Range’ (ETR) and is supported by most volume DRAM
manufacturers. This comes at the expense of slightly reduced performance, typically less than 3%, and a small
increase in DIMM power which is generally favorable in comparison with the potential fan power increase of
operating at lower temperatures.
Figure 9 – Processor Thermal Management

ASHRAE TC 9.9
16
Figure 10 – Memory Thermal Management
ASHRAE TC 9.9
17
4 Thermal Management
Thermal control enables optimization of system performance as a function of usage, configuration, cooling capability
and environment. Underlying this optimization is the use of fan speed control and power management in parallel to
meet the customer’s requirements.
Components and their specifications are the primary drivers in a server’s thermal design (e.g. heat sink , fan selection,
and airflow management). The ITE thermal designer can create a superior thermal design, but without a thermal
management system to provide real-time optimization, that design may be acoustically unacceptable or highly
inefficient. True superiority quite often lies in the thermal management scheme and its capability for delivering
precisely the performance needed while consuming the lowest power while meeting component specifications with
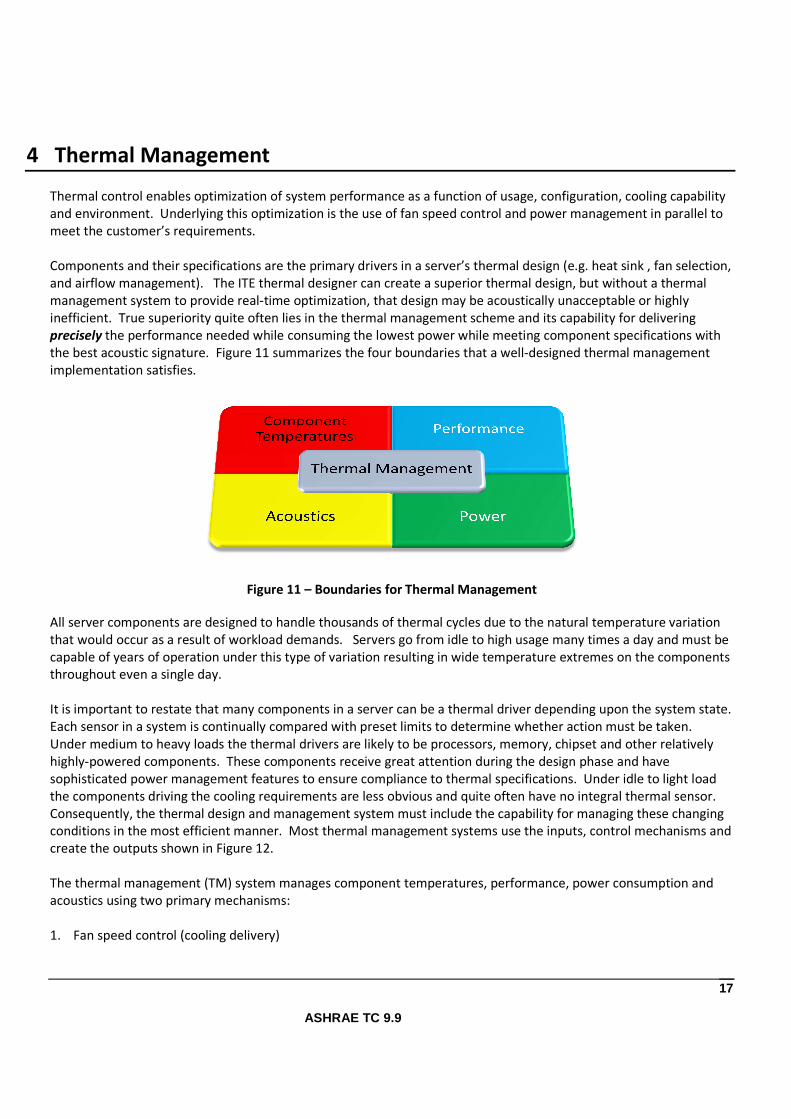
the best acoustic signature. Figure 11 summarizes the four boundaries that a well-designed thermal management
implementation satisfies.
Figure 11 – Boundaries for Thermal Management
All server components are designed to handle thousands of thermal cycles due to the natural temperature variation
that would occur as a result of workload demands. Servers go from idle to high usage many times a day and must be
capable of years of operation under this type of variation resulting in wide temperature extremes on the components
throughout even a single day.
It is important to restate that many components in a server can be a thermal driver depending upon the system state.
Each sensor in a system is continually compared with preset limits to determine whether action must be taken.
Under medium to heavy loads the thermal drivers are likely to be processors, memory, chipset and other relatively
highly-powered components. These components receive great attention during the design phase and have
sophisticated power management features to ensure compliance to thermal specifications. Under idle to light load
the components driving the cooling requirements are less obvious and quite often have no integral thermal sensor.
Consequently, the thermal design and management system must include the capability for managing these changing
conditions in the most efficient manner. Most thermal management systems use the inputs, control mechanisms and
create the outputs shown in Figure 12.
The thermal management (TM) system manages component temperatures, performance, power consumption and
acoustics using two primary mechanisms:
1. Fan speed control (cooling delivery)

ASHRAE TC 9.9
18
2. Component power limiting features (e.g. P-states and memory throttling)
With some servers the initial setup during boot time enables the end user to configure the system to preferentially
favor acoustics, power efficiency or performance.
In addition to the system level thermal control, there are often subassemblies within a server that have their own
thermal sensors with embedded thermal control algorithms. Examples include power supplies and GPGPUs with
active heat sinks (i.e. heat sink with an integral fan). In many cases some sensor information can be passed to the
system-level thermal management so that these subassemblies act cohesively with the overall system.
4.1 Thermal Control Inputs – Sensors
Sensors provide the inputs to the control scheme. Different types of sensors are used in the control algorithm:
1. Temperature
a. Direct sensor – on-component sensor(s) found on processors, memory, hard disk drives (HDDs), chipset,
GPGPU
b. Indirect sensor – off-component, discrete sensor used to either directly measure air temperature or local
temperature on a board correlated to components without sensors
2. Power and Activity
a. Indirect temperature assessment – measurement of power, current or activity generally used as a proxy
for a thermal sensor (e.g. voltage regulator current). In combination with fan speed the design engineer
can infer a component’s temperature knowing the power based upon the design of the server.
b. Power – for use in an algorithm to minimize overall system or subsystem power
3. Fan conditions
a. Speed – for ensuring a fan is operating within design parameters
b. Presence – for detecting whether a fan is populated (e.g. redundant configuration)
Figure 12 – Thermal Control Process

ASHRAE TC 9.9
19
Figure 13 shows an example of a two socket server with the locations of temperature sensors for use for thermal
management. Including the HDD sensors and multiple CPU sensors the total number of temperature inputs exceeds
thirty. This quantity is quite common with present volume servers. Some components such as processors have many
more sensors but expose only the hottest sensor for system-level thermal management.
Figure 13 – Example 1U Volume Server Thermal Sensors
Not all components have the same type of thermal sensor implementation. . Some components have protection
features that can be used in a TM implementation:
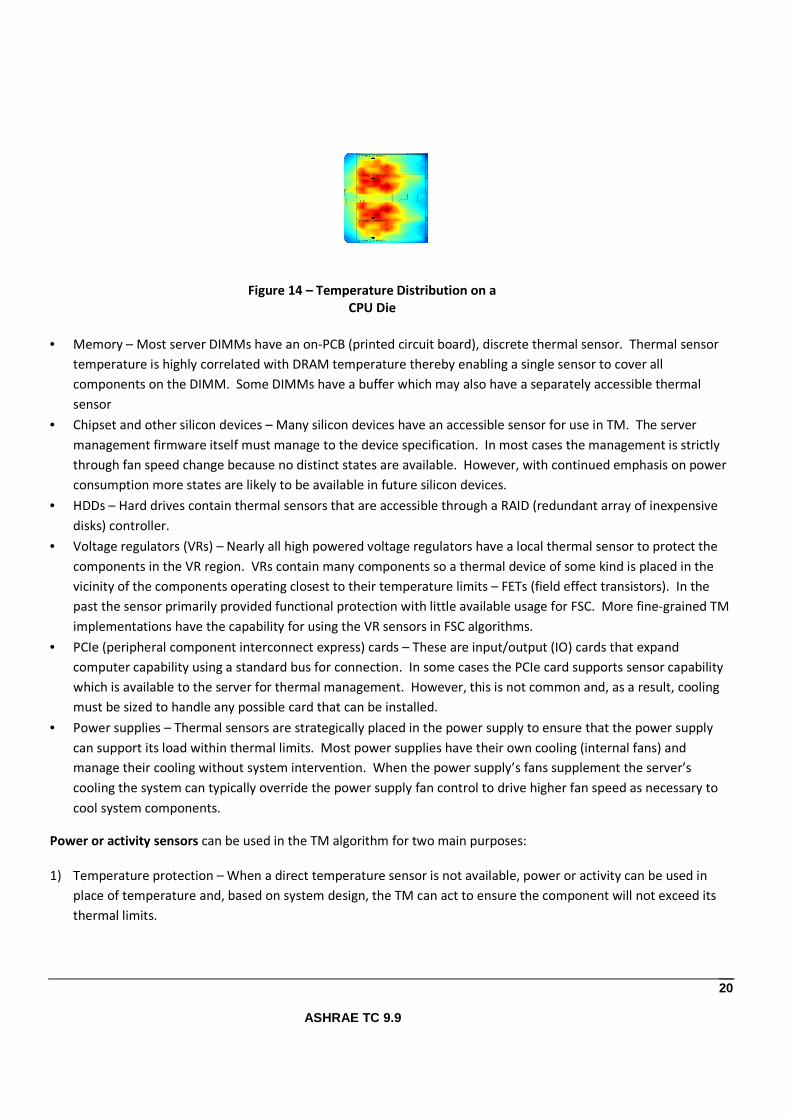
• Processor – A processor may have many thermal sensors while exposing only a single sensor (hottest sensor) to
the server for TM. The quantity of sensors required depends upon many factors including die size, power
distribution and packaging. Die power distribution can be highly non-uniform resulting in wide temperature
variation throughout the die as seen in Figure 14. Consequently, multiple sensors are strategically placed to
enable the processors own power management features to engage as necessary to ensure that silicon
temperature does not exceed the point to which the processor was qualified and tested, but also to eliminate
inaccuracy in determining actual die hot spot temperature. In the case of ‘turbo’ operation, the turbo state is
entered opportunistically based on the real-time temperature margin available (along with other parameters).
ASHRAE TC 9.9
20
• Memory – Most server DIMMs have an on-PCB (printed circuit board), discrete thermal sensor. Thermal sensor
temperature is highly correlated with DRAM temperature thereby enabling a single sensor to cover all
components on the DIMM. Some DIMMs have a buffer which may also have a separately accessible thermal
sensor
• Chipset and other silicon devices – Many silicon devices have an accessible sensor for use in TM. The server
management firmware itself must manage to the device specification. In most cases the management is strictly
through fan speed change because no distinct states are available. However, with continued emphasis on power
consumption more states are likely to be available in future silicon devices.
• HDDs – Hard drives contain thermal sensors that are accessible through a RAID (redundant array of inexpensive
disks) controller.
• Voltage regulators (VRs) – Nearly all high powered voltage regulators have a local thermal sensor to protect the
components in the VR region. VRs contain many components so a thermal device of some kind is placed in the
vicinity of the components operating closest to their temperature limits – FETs (field effect transistors). In the
past the sensor primarily provided functional protection with little available usage for FSC. More fine-grained TM
implementations have the capability for using the VR sensors in FSC algorithms.
• PCIe (peripheral component interconnect express) cards – These are input/output (IO) cards that expand
computer capability using a standard bus for connection. In some cases the PCIe card supports sensor capability
which is available to the server for thermal management. However, this is not common and, as a result, cooling
must be sized to handle any possible card that can be installed.
• Power supplies – Thermal sensors are strategically placed in the power supply to ensure that the power supply
can support its load within thermal limits. Most power supplies have their own cooling (internal fans) and
manage their cooling without system intervention. When the power supply’s fans supplement the server’s
cooling the system can typically override the power supply fan control to drive higher fan speed as necessary to
cool system components.
Power or activity sensors can be used in the TM algorithm for two main purposes:
1) Temperature protection – When a direct temperature sensor is not available, power or activity can be used in
place of temperature and, based on system design, the TM can act to ensure the component will not exceed its
thermal limits.
Figure 14 – Temperature Distribution on a
CPU Die

ASHRAE TC 9.9
21
2) Power optimization – Power can be used as an input to the TM algorithms to optimize fan speed settings to
minimize IT power. This must be done within the context of maintaining component temperatures within their
limits.
Fan condition must be known to ensure the capability for the cooling system to meet the load requirements. There
are two main fan sensors:
1) Fan speed – used to ensure each fan is operating within design limits to project pending failure.
2) Fan presence – used to configure fan speed settings based on which fans are populated.
Other Sensors
An altitude (absolute pressure) sensor is sometimes used to adjust base fan speed settings based depending upon
where the server is populated. With the inclusion of many individual temperature sensors the need for an altitude
sensor diminishes as the effect of altitude can be seen based on temperature. Chassis intrusion sensors are
sometimes used to increase fan speeds to elevated levels to compensate for the loss of directed airflow when
servicing a server.
4.2 Fan Speed Control and Design
To meet system cooling requirements with minimal acoustics, fan power, and airflow today’s server fan speed control
is highly advanced with control algorithms that are tuned based on the server’s usage model. Multiple algorithms can
be used simultaneously with the final fan speed determined by comparison of the results of these algorithms.
Multiple (e.g. tens) sensors are used in the algorithm with the required fan speeds set based on the components with
the least margin to their specifications. The algorithm must ensure that unacceptable fan oscillations do not occur
even at low fan speeds. These could be just as annoying to a customer as a continuous loud noise.
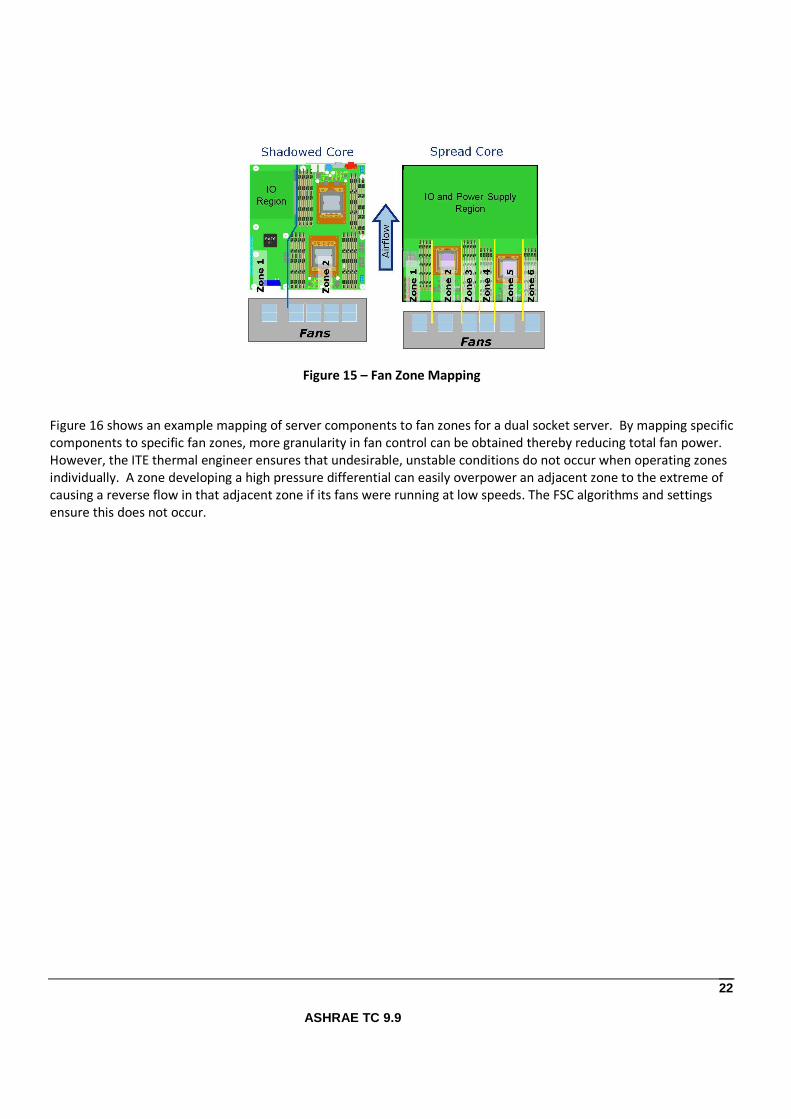
Fan or cooling zones are often used to precisely adjust specific fans to the needs of components most coupled with
those fans. Cooling zones can be proximity based, or physically separated. The extent of optimization vs. cost is
considered when designing cooling segmentation created through cooling zones. By using a fan zone approach total
fan power and acoustic output can be minimized. Fans in a non-stressed zone can run at lower speeds than those
needed in a more highly stressed zone. A ‘stressed zone’ implies that at least one component is approaching its
temperature limit. Figure 15 shows two examples of fan zones mapped to two different boards which go into a 1U
chassis.
ASHRAE TC 9.9
22
Figure 15 – Fan Zone Mapping
Figure 16 shows an example mapping of server components to fan zones for a dual socket server. By mapping specific
components to specific fan zones, more granularity in fan control can be obtained thereby reducing total fan power.
However, the ITE thermal engineer ensures that undesirable, unstable conditions do not occur when operating zones
individually. A zone developing a high pressure differential can easily overpower an adjacent zone to the extreme of
causing a reverse flow in that adjacent zone if its fans were running at low speeds. The FSC algorithms and settings
ensure this does not occur.

ASHRAE TC 9.9
23
Figure 16 – Example Sensor Mapping
One popular control algorithm in use is a PID (proportional, integral, derivative) controller. Simply stated the
proportional term represents the present error, the integral term represents the accumulated error and the
derivative term predicts future error. The ‘error’ is the difference between the actual value and the desired
temperature setpoint. The errors are tuned based upon the cooling system’s thermal response using gain coefficients
(i.e. responsiveness factors) and summed to determine the controller output (next fan speed setting) to be
programmed in the server management controller. The process variable used in the algorithm is component
temperature. What makes the implementation complex is the necessity to monitor all system thermal sensors
simultaneously. Equation 1 shows the PID algorithm in equation form:
Equation 1 – PID Controller
������ = � × ���� + � ×� ���� × ���
�+�� × �
�� ���� Where:
PWM(t) is the calculated fan speed setting
Kp, Ki, Kd are the proportional, integral and derivative gain coefficients for tuning the controller response
e is the error between the actual temperature and the setpoint temperature
t is time

ASHRAE TC 9.9
24
τ is the integration time step
For each thermal sensor, a separate PID algorithm is running. In some cases sensors can be aggregated (e.g. all
memory module sensors in the system grouped together) because their thermal response is the same and they have
the same temperature limits. At each time step a new fan speed setting is determined from the PID controller using
temperature value from each sensor. The management controller determines the actual fan speed setting based on
the maximum calculated fan speed setting from all the simultaneously operating PID algorithms.
Because some components do not have thermal sensors, absolute lower limits for fan speed are often specified. This
protects those components from over-heating if the PID-determined fan speed may be too slow to cool them. This is
shown in Figure 17 where the fan speed limits vary with system inlet temperature which is typically monitored on the
system front panel.
Figure 17 – Fan Speed vs. System Inlet Temperature
4.3 Configuration, Workload and Environment
The thermal control response of a server is a function of both hardware configuration and customer deployment.
Hardware configurations such as HDD count and type, and PCIe population can impact system airflow which may
cause increases in system fan speeds to ensure adequate airflow. Likewise, devices such as high power general
purpose graphics processor (GPGPU) cards, higher power processors, and high capacity memory will require
increased airflow with correspondingly higher system fan speeds. As a result, differences in fan speeds within
systems in a given product line with different configurations can be significant.
Customer variables such as utilization and environment can also drive thermal control response. The largest variable
for thermal control response is generally system utilization with large differences in fan speeds between idle to
stressed operation. System utilization results in increased component and system temperatures. Measuring system
power consumption as a function of workload using industry benchmarks tools (e.g. SPECPower, LINPACK) or
intended software loads can be a good indicator to compare systems and their capability for optimally meeting

ASHRAE TC 9.9
25
workload requirements. Operating system utilization tools (e.g. task manager) are generally not very indicative of
actual system power consumption and may give a false impression of the power consumption of a system.
In the past redundantly cooled systems were truly redundant: full cooling capability at full performance was ensured.
This is no longer common since the power management features previously described have been implemented.
Customers are willing to live with reduced performance during a fan failure as long as a reduced performance level is
guaranteed.
4.4 Management Controllers and Communication
Imbedded power management features in processors and other silicon engage automatically without server
intervention. They are configured at boot time and typically do not change significantly during operation.
Engagement thresholds align with specifications for the components themselves necessitating this automatic
engagement to ensure data integrity. The server management system must be aware of the state of the components
in order to take action to support the load demand. Typically, an application-specific integrated circuit (ASIC)
management controller is placed on the main board and acquires component temperatures and states through either
polling for them or by detection of a state activation. As previously described, processors activate hardware pins such
as PROCHOT and THERMTRIP that can be acted upon by the management controller. In the event of a PROCHOT, a
system designed to deliver maximum performance may drive fans to maximum speed. Activation of a THERMTRIP
could trigger a hard shutdown of the system for protection. During that shutdown some components remain active
long enough to capture the cause of the shutdown. The management controller contains the firmware for fan speed
control (e.g. PID algorithms) to thermally manage the system.
Communication to processors, memory, voltage regulators and power supplies is handled using the communication
bus that applies. These are defined, industry standard buses and interfaces such as IPMI (Intelligent Platform
Management Interface) that the components support so that a management controller can be designed based on a
known protocol.
4.5 System Tuning and Configurability
The thermal management and control used in modern servers benefits data center owners and operators in many
ways. Reduced power consumption, optimal system airflow, and reduced acoustic output all result from a well-
designed implementation. However, the performance demanded by the customer must be met within the
optimization of the thermal management.
A design tuned for a specific type of customer or customer usage can be created by preferentially using features
aggressively or non-agressively.
There are at least four types of thermal management design which at a high level can be described as:
o Performance – highest performance at all times leading to near instantaneous response to loads
o Power efficient – aggressive power optimization at the potential expense of lagging performance and
worse acoustics (fans may rapidly increase and decrease in speed leading to undesirable sound
quality)
o High availability – lowest component temperatures at the expense of some reduction in performance
and poor acoustics
ASHRAE TC 9.9
26
o Acoustic – optimal noise qualities at the expense of worse peak performance
These designs may overlap, but they all involve tradeoffs between fan speed response through the tuning of the FSC
algorithm, component temperatures, acoustic output, power consumption, and performance. The controls for tuning
to address these design preferences are fan speed, power states and throttling. In all cases thermal, power, or
activity sensors prompt the response to be taken. Some servers enable the customer to choose the design or ‘policy’
to be used by the server management hardware and firmware at boot time. In an extremely sophisticated design the
management controller or another entity could track and learn the usage of the equipment and change settings to
either better optimize the server or notify the owners that their server is not optimally configured. They can also
suggest changes to the settings, and ensure changes are approved before implementation.
When considering what policies to enable, the design engineer must understand the intended usage of the IT
equipment. For example, a rack system intended for container usage may have limited acoustic requirements where
an acoustic policy setting may be completely unnecessary.
When evaluating techniques to create a policy, one must consider the desired response and determine how best to
create that response. Thermal response is orders of magnitude longer than power response as a result of workload.
Tuning the fan speed control and power management settings can enable the IT equipment to operate as the
customer requires. Early increase of fan speeds can prevent power management features from activating by moving
the IT equipment to an improved cooling state that has the capability for handling the workload. Delaying fan speed
decreases can then enable quick response to anticipated workload demands. This method moves overall fan speeds
to higher levels and is, therefore, less power efficient.
Activation of lower power P-states happens automatically. They serve as the first method for thermal protection
when the cooling system can no longer meet the cooling needs. This would normally be the case where fan speed
control was not aggressive enough to prevent activation of lower P-states. They can serve to reduce fan power by
covering processor temperature excursions assuming that the fan speed control is set less aggressively.

ASHRAE TC 9.9
27
5 ITE-Room Cooling Interaction
Advanced ITE thermal control may have non-obvious impacts on temperatures that must be understood for optimal
datacenter operation. As previously described component temperature does not scale linearly with system inlet
temperature. As system inlet temperatures increase system fan speeds increase resulting in component
temperatures that remain nearly constant. However, dramatic fan power increases may occur as fan speeds increase
to meet component thermal requirements.
With increased thermal sensor input a better knowledge of component cooling requirements can be achieved
resulting in reduced fan speeds. However, the transition to lower fan speeds has caused a trend for even typical
system configurations to have exhaust temperatures in the range of 50°C or higher. Even though a datacenter
operator may find this undesirable it is a good indication that the server’s thermal management has adjusted to the
load by reducing fan speeds to minimize total power consumption. As previously described, fan speeds adjust based
on component temperatures. The thermal management generally works to eliminate thermal margin unless that
margin can somehow result in better performance or lower overall power consumption. The impact of increased
exhaust temperatures on adjacent IT equipment needs to be understood by the data center manager. This
equipment could include the cables attached to the back of the system which may only be rated to 60°C. To address
limits such as this some servers create a virtual sensor representing exhaust temperature which can then be used in
the FSC algorithm.
Traditional data center design has long been founded on the principle of designing to a power per unit area. This
allows the facility designer the freedom to provide critical power and cooling resources to their customers while
eliminating the need for the designers to know exactly what ITE will be deployed by their customers.
Most data centers are essentially just air-conditioned rooms. Complexities arise due to the behavior of these rooms
when rows of equipment cabinets with high-density power loads and airflow demands are installed.
Users will have one or more of the following types of air delivery architectures:
1) Upflow – air delivery through an access floor and perforated tiles (most common)
2) Downflow – air delivery through overhead vents
3) A combination of 1 and 2
4) Horizontal – air delivery on solid floors (typically used with in-row coolers or in telecommunications
applications)
5) Bulk delivery through air handlers located in a separate chase or hall.
Understanding how air moves in the room once it leaves the air handlers and is forced up through the perforations
(as in architecture 1) in the access flooring is critical to determining placement of ITE in the equipment racks. Cooling
air behaves differently coming out of an access floor than coming out of overhead vents, or coming out of a floor-
mounted horizontal blowing air handler.
Often users will discover the temperatures found at various levels of the equipment rack vary by a significant amount.
This can be construed to be a negative situation, but in reality, as long as the temperatures are within manufacturers’
specifications and the ASHRAE class limits for which the ITE was designed, there is no issue with respect to the ITE.
Variation can be reduced using best practices which may include aisle containment. Of greater importance is the
stability of the environment. Rapid and large changes in facility temperature and/or humidity can lead to system

ASHRAE TC 9.9
28
issues, and possibly premature failures. It is recommended that users look to tested, reliable methods and best
practices to address environmental stability.
Adherence to Best Practices
There are a number of sources for information on best practices one can draw upon to develop a best practices
philosophy for their data centers including those developed by ASHRAE Technical Committee 9.9. Consult TC9.9’s
publications for more information. Links to most publications and additional resources can be found at
tc99.ashraetcs.org.
Managing and Matching Air- Conditioning Performance to ITE Loads
In an effort to conserve energy, it may be possible to adjust the performance of an air handler to the needs of the ITE
loads more closely than is generally performed. Most cooling capacity deployed in a data center is brute force, sized
to the total design load of the facility, and not the current load at any one point in time. Therefore, by adjusting the
cooling capacity to the current load, it may be possible to reduce overall consumed energy.
To accomplish this, a number of parameters must be satisfied. By making these types of adjustments the facility is
modifying these three important parameters:
1) Flow
2) Temperature
3) Pressure
It is important to ensure adequate flow so the ITE does not scavenge air from undesirable sources, such as the hot
aisle in a datacenter.
The rack deployment of the server can also have an impact on thermal control. A perforated rack door can have a
small impact on system airflow with near negligible impacts on thermal control. Possible larger drivers of thermal
control response are rack level containment and rack population. Rack containment systems can negatively impact
system airflow thereby affecting thermal control response. The impact of rack containment is a function of total rack
system airflow and the rack containment design. If the rack containment is sized correctly to the airflow and pressure
of a given server design, the impact of the rack containment on thermal control will be minimal. However if a rack
containment design presents a significant impedance to ITE airflow, system thermal control will be impacted with
increased fan speeds and system power consumption and possibly reduced performance if ITE cooling capability has
been maximized.
At peak fan speeds dense 1U systems can operate at differential pressures in the range of 250 Pa (1” H2O). Most
containment systems or other impediments to bulk flow are two orders of magnitude less than this and will have less
than a few percent impact on server flow as a result. However, when the ITE is lightly loaded, fan speeds reduce
substantially (along with airflow) and flow could easily be impacted by 10% or more resulting in an ITE thermal control
response to ensure the components are adequately cooled in the ITE. As containment becomes more popular one
monitoring the differential pressure between hot and cold aisle may be more important. However, under the typical
differential pressures in most containment schemes, little impact on performance or power consumption on the ITE
should be experienced.
Rack population may also impact server thermal control. Well-designed datacenters use hot-aisle/cold-aisle
configurations with some degree of isolation. Within a rack itself isolation must also be maintained to ensure that the

ASHRAE TC 9.9
29
exhaust from one server is not mixed with the intake to the servers in the rack. That isolation is typically made at the
front surface of the rack. Sections of the rack that are not populated must be fitted with blanking panels to ensure
that hot exhaust air cannot be drawn back into any of the IT equipment at the front surface. In many cases ITE has
exhaust openings on the side and back to better distribute airflow within the system or to reduce overall airflow
impedance. Air exhausting from systems that have both side and back venting will generally not be problematic as
long as blanking panels are used so that the side-vented air eventually exhausts out the rear of the rack. Recirculated
hot air raises the temperature of all components within the system and will cause a boost in air mover speeds to
compensate. This increases both power consumption and reduces the capability of the ITE for supporting the overall
room environment. In some cases, top venting may be present in the server’s chassis. If the chassis surface is not
embossed to enable an air channel to that venting the improvement in server airflow is generally negligible because
the adjacent servers significantly reduce airflow. Generally, no special considerations are required for systems with
top venting as the improvement in server airflow is minor and already factored into the server cooling design. Poor
cable management can block server chassis venting and lead to reduced cooling capability.
When deploying ITE in a datacenter using traditional air cooling, important questions must be considered to ensure
that the ITE and datacenter will support the intended workloads. For example, potential savings in datacenter
operating costs by operating at higher ambient temperature must be counterbalanced with the potential increase in
ITE operating costs due to increased ITE fan speeds and silicon leakage.
Datacenter and ITE communications: It is possible and quite often very practical to establish a symbiotic relationship
between the facility cooling equipment and the compute, storage, and networking equipment in a facility. This
requires capabilities in the ITE such as temperature measurement, power measurement, and possibly airflow
measurement. Not all ITE provides these capabilities, however, to benefit from this data does not necessarily require
access to power and thermal data from every system.
The primary purpose of this relationship is to establish a control plane that can be leveraged to manage energy
consumption in the facility cooling equipment.
Most server manufacturers today make temperature and power data externally available. The temperature data
being measured varies by manufacturer, as does the method of gathering that data. The specific manufacturer of
interest should be consulted for the methodology of extracting the data. However, what is fundamentally required,
and is generally available, are inlet ambient temperature values as documented in the Energy Star for server
requirements. Datacenter management software leverages this data to enable management of performance, power
and cooling optimization. Suppliers of these capabilities each have their own implementation that serves their
customers’ needs.
Traditional methods of cooling data centers have depended upon brute force. A data center’s capability for being
managed is largely based upon either a thermostat setting or a fan speed setting. The majority of data centers tend to
set thermostats to a low temperature, regardless of the needs of the ITE and that setting was based on return
temperature rather than ITE inlet temperature. Today, most new or upgraded data centers use the HVAC supply air
temperature as the control point together with variable speed fans to control pressure in the raised floor plenum.
The ITE temperature data is critical to optimize these settings.
By coupling the temperature data with the fan speed or thermostat settings, users can make adjustments, either
manually, or through the use of customized datacenter management tools, to reduce energy consumption of those
cooling devices. The ITE’s fan speed control results in varying volume of air through the ITE. The data center air

ASHRAE TC 9.9
30
conditioning system must be able to respond to this variation in order to capture the significant opportunity in overall
energy consumption in the facility.
The data from the ITE can be collected in a number of ways. In some cases, it may be available as SNMP (simple
network management protocol) packets, as an XML (extensible markup language) document, or perhaps through
customized means specific to a particular manufacturer. Consult the manufacturer of the specific ITE for details.
Once collected from the device, the transport mechanism for the data will depend upon the specific architecture of
the facility information network. It may be as simple as SNMP throughout, or as sophisticated as BACNet (ASHRAE,
2010). Keep in mind that regardless of the original protocols, there is always a mechanism to convert and transport
the data into other forms.
While the industry currently lacks standards in this space, it is important to remember this effort covers a great deal
of different hardware brands and types. This has created a wide array of solutions from different manufacturers now
which will likely become more standardized in the future as industry groups force alignment.
Most manufacturers of both facility and ITE hardware have developed and distribute software applications that can
collect the ITE, rack and data center data and present it in a number of ways. At issue is the combining of these
systems into a cohesive, useful data collection and reporting system that can portray the collected data in a
meaningful way. In many enterprises, the data collected from facility equipment and ITE is delivered to different
organizations. This division of data most often means there is a lack of sharing, and therefore a lack of benefits
gained. In a progressive organizational environment, it is important to combine the pools of data to reap the energy
efficiency goals.

ASHRAE TC 9.9
31
6 Summary
Sophisticated thermal management in today’s servers has become the norm in order to ensure competitiveness in
the market. Cooling systems that routinely consumed 15% or more of a server’s power at full load have evolved to
include fully integrated thermal management that now enables a server to scale fan speeds to the workload and
environmental conditions while driving typical IT fan power overhead to less than 5%. Fan speed control works in
concert with power management features to bring superior performance while matching power/performance and
noise levels to address specific customer needs and data center environmental conditions thereby contributing to the
capability for server power to better scale to workload.
Before purchasing any IT equipment one should first select the ITE based on its ASHRAE class capability alignment
with the data center capability as measured at the inlet to the ITE. One can then ask how and whether the cooling
and thermal management systems meet workload demands in the most efficient manner. Operation beyond the
limits of the allowable range of the ASHRAE environmental class can cause thermal protection mechanisms to engage
to maintain data integrity thereby compromising performance and potentially causing ITE shutdown.

ASHRAE TC 9.9
32
Reference Documents
ASHRAE. (2012). Datacom Equipment Power Trends and Cooling Applications. Atlanta, GA, USA: ASHRAE.
(2012). Retrieved from Advanced Configuration and Power Interface: http://www.acpi.info/ ASHRAE. (2010). A Data Communication Protocol for Building Automation and Control Networks. ASHRAE
Standard 135-2010. ASHRAE. ASHRAE. (2012). Datacom Equipment Power Trends and Cooling Applications. Atlanta, GA, USA:
ASHRAE. ASHRAE. (2012). Thermal Guidelines for Data Processing Environments. Atlanta.