
ase Examples of Blasting a age and Its Influence on … · a age and Its Influence on lope...
23
{). Si>ttnND G ...,,..,..,. t DS 1981:9 ase Examples of Blasting a age and Its Influence on lope Stability Roger Holmberg Kenneth Miiki
Transcript of ase Examples of Blasting a age and Its Influence on … · a age and Its Influence on lope...
{). Si>ttnND G ...,,..,..,. t DS 1981:9
ase Examples of Blasting
a age and Its Influence
on lope Stability
Roger Holmberg Kenneth Miiki
CASE EXAMPLES OF BLASTING DAMAGE AND ITS INFLUENCE ON SLOPE STABILITY
Roger Holmberg
OS 1981 :9
Kenneth Mak i
1981-06-15
Paper presented at the Third International Conference on Stability in Surface Mining arranged by the Society of Mining Engineers of AIME, June l-3, 1981, Vancouver, BC, Canada.
CASE E~~PLES OF BLASTlNG DA~~GE AND lTS INFLUENCE ON SLOPE STAB1LlTY
by Roger Holmberg* and Venneth M~ki**
* Deputy Head
**
Swedish Detonic Research Foundation (SveDeFo) Stockholm, Sweden
Research Engineer Swedish Detonic Research Foundation (SveDeFo) Stockholm, Sweden
ABSTRP.CT
This paper describes open pit studies where blasting damage introduced in the remaining rock has been investigated. Results from two open pit mines are described and discussed. Parallel performed laboratory experiments, where simulated blasting damage has been introduced into samples before shear strength testing took place, are also reviewed. These studies are tied together in order to throw some light upon how the blasting damage influences the slope stability.
A mathematical model is also described which will make it possible to optimize the blast design for a specified damage zone in the rock mass.
IJ:\TRODUCTION
A slope stability analysis based on a detailed line survey, investigations of joint set characteristics, rock mechanics investigations, ground water flow measurements, interpretations of data and statistical analysis will express a certain probability for slope failure connected to the slope an6le.
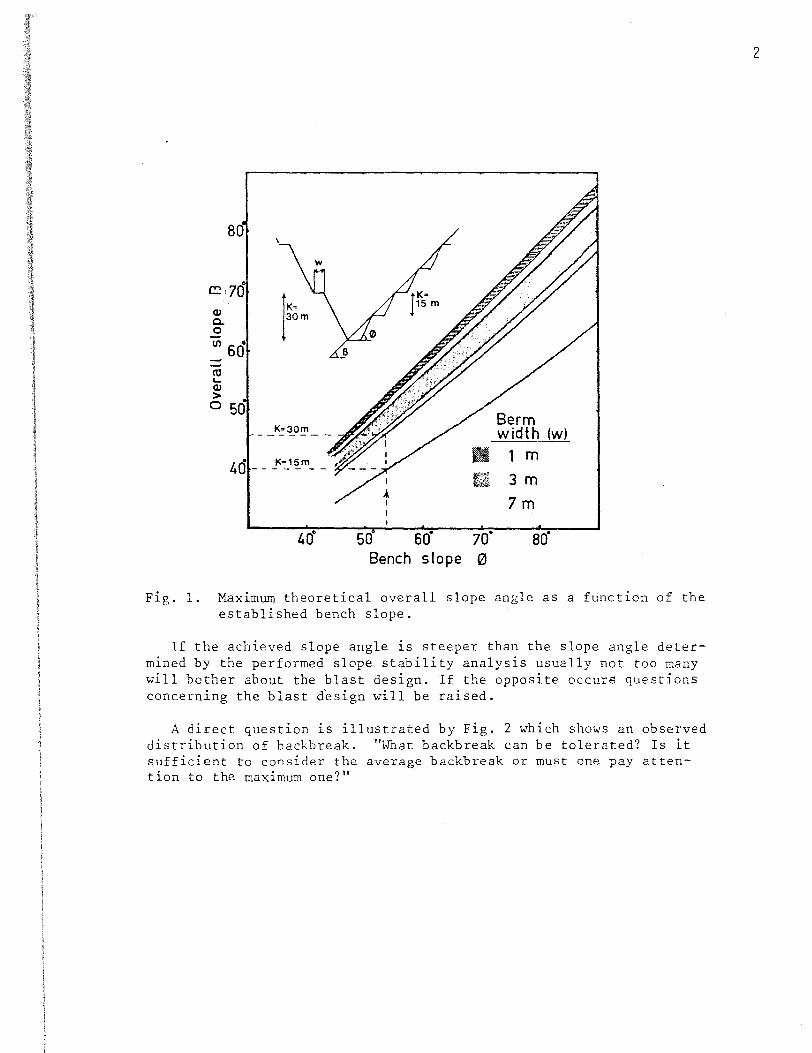
The most significant visually observ::::cl damage caused by a stock blast is the resulting backbreak. By practising simple arithiT,etics anyone easily can translate the average noticed backbreak to a theoretical maximum slope angle assuming a certain working width of berms for access. Fig. 1 expresses the theoretical maximum slope angle as a function of established bench slope angles and berm widths for two bench hights adjacent to the pit slope.
Q) c. 0
80
Ul 60 ca L.. Q) > 0 50
30m !K-
B
K~30m -------
40" so so· Bench slope
Berm width (w)
II 1 m
3 m
7m
70" ao· 0
Fig. 1. Maximum theoretical overall slope angle as a function of the established bench slope.
If the achieved slope angle is steeper than the slope angle determined by the performed slope stability analysis usually not too many will bother about the blast design. If the opposite occurs questions concerning the blast design will be raised.
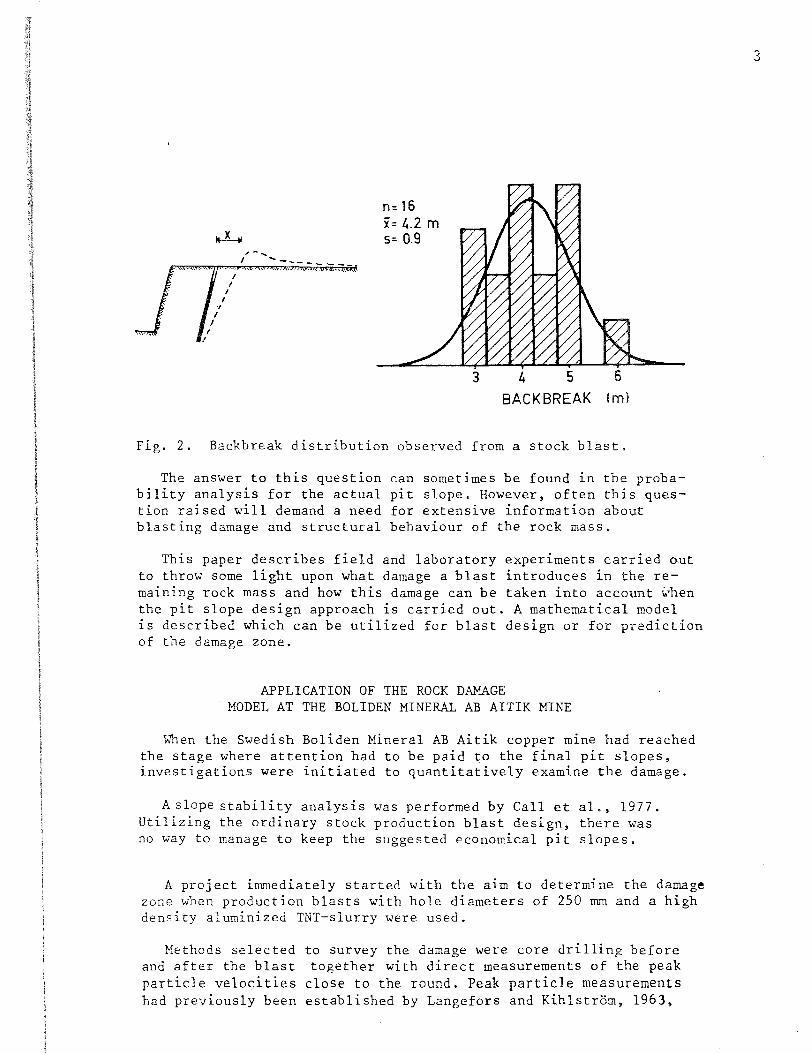
A direct question is illustrated by Fig. 2 which shows an observed distribution of backbreak. "What backbreak can be tolerated? Is it sufficient to consider the average backbreak or must one pay attention to the maximum one?"
2
,-._. I '-- -
n=16 x= 4.2 m 5= 0.9
3 4 5 6
BACKBREAK (m)
Fig. 2. Backbreak distribution observed from a stock blast.
The answer to this question can sometimes be found in the probability analysis for the actual pit slope. However, often this question raised will demand a need for extensive information about blasting damage and structural behaviour of the rock mass.
This paper describes field and laboratory experiments carried out to throw some light upon what damage a blast introduces in the remaining rock mass and how this damage can be taken into account when the pit slope design approach is carried out. A mathematical model 1s described which can be utilized for blast design or for prediction of the damage zone.
APPLICATION OF THE ROCK DAMAGE MODEL AT THE BOLIDEN MINERAL AB AITIK MINE
When the Swedish Boliden Mineral AB Aitik copper mine had reached the stage where attention had to be paid to the final pit slopes, investigations were initiated to quantitatively examine the damage.
A slope stability analysis was performed by Call et al., 1977. Utilizing the ordinary stock production blast design, there was no way to manage to keep the suggested economical pit slopes.
A project immediately started with the aim to determine the damage zone when production blasts with hole diameters of 250 mm and a high density aluminized TNT-slurry were used.
Methods selected to survey the damage were core drilling before and after the blast ·together with direct measurements of the peak particle velocities close to the round. Peak particle measurements had previously been established by Langefors and Kihlstrom, 1963,
3
for predicting damage of buildings close to blasting operations. As damage is caused by the strain ln the material and as the particle velocity is affecting the strain, it was considered interesting to examine the particle velocities.
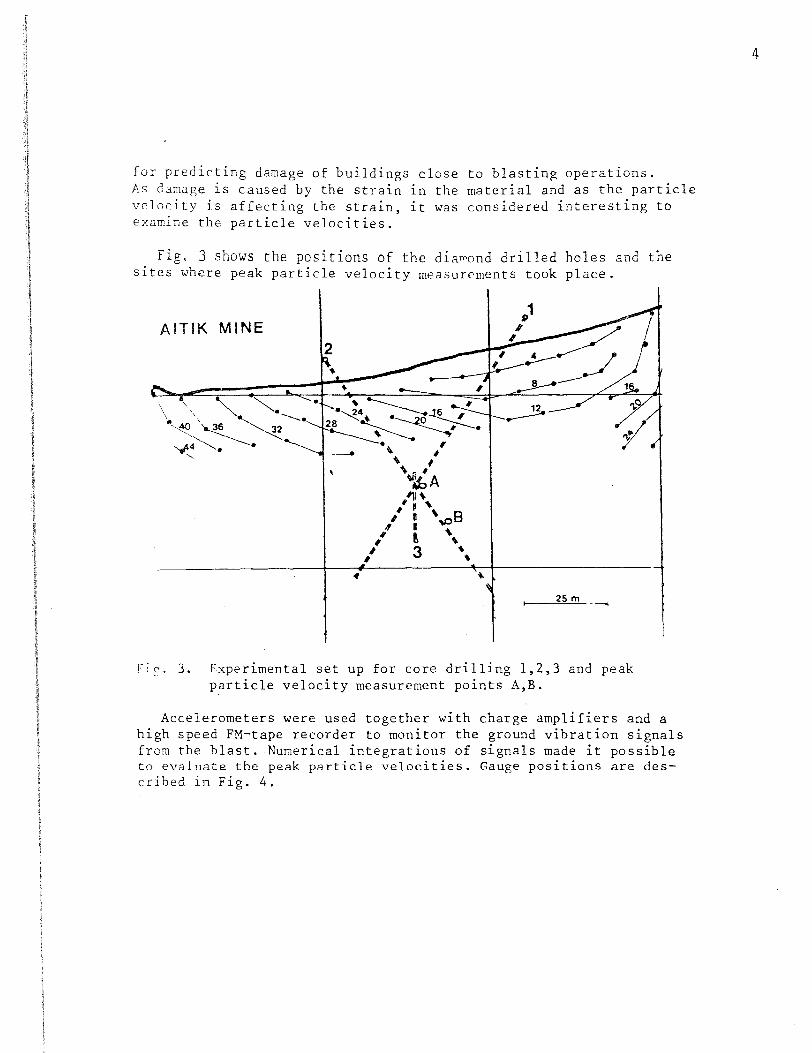
Fig. 3 shows the positions of the dia~ond drilled holes and the sites where peak particle velocity measurements took place.
AITIK MINE
25m
Flg. 3. Experimental set up for core drilling 1,2,3 and peak particle velocity measurement points A,B.
Accelerometers were used together with charge amplifiers and a high speed FM-tape recorder to monitor the ground vibration signals from the blast. Numerical integrations of signals made it possible to evaluate the peak particle velocities. Gauge positions are described in Fig. 4.
4
13.2m 13.8m
27.52 26.55 2Z30
A B
5.35 3.5
6.20
2.0
8.5
2.0
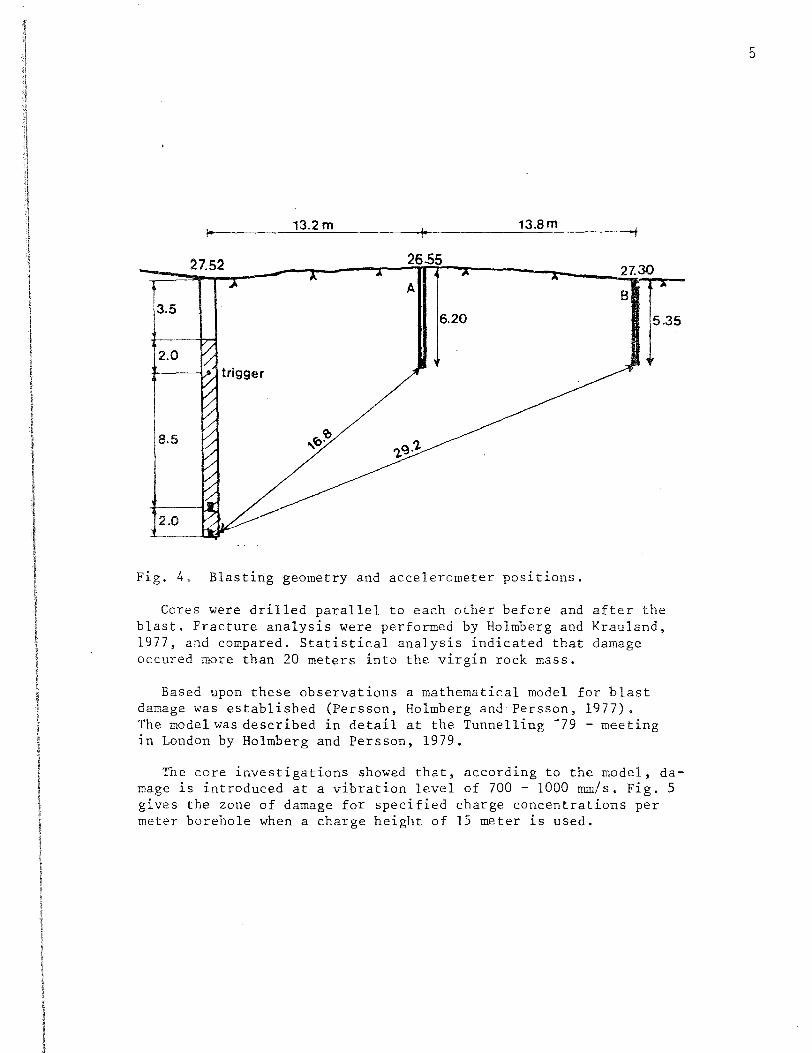
Fig. 4. Blasting geometry and accelerometer positions.
Cores were drilled parallel to each other before and after the blast. Fracture analysis were performed by Holmberg and Krauland, 1977, and compared. Statistical analysis indicated that damage occured more than 20 meters into the virgin rock mass.
Based upon these observations a mathematical model for blast damage was established (Persson, Holmberg and Persson, 1977). The model was described in detail at the Tunnelling -79 - meeting 1n London by Holmberg and Persson, 1979.
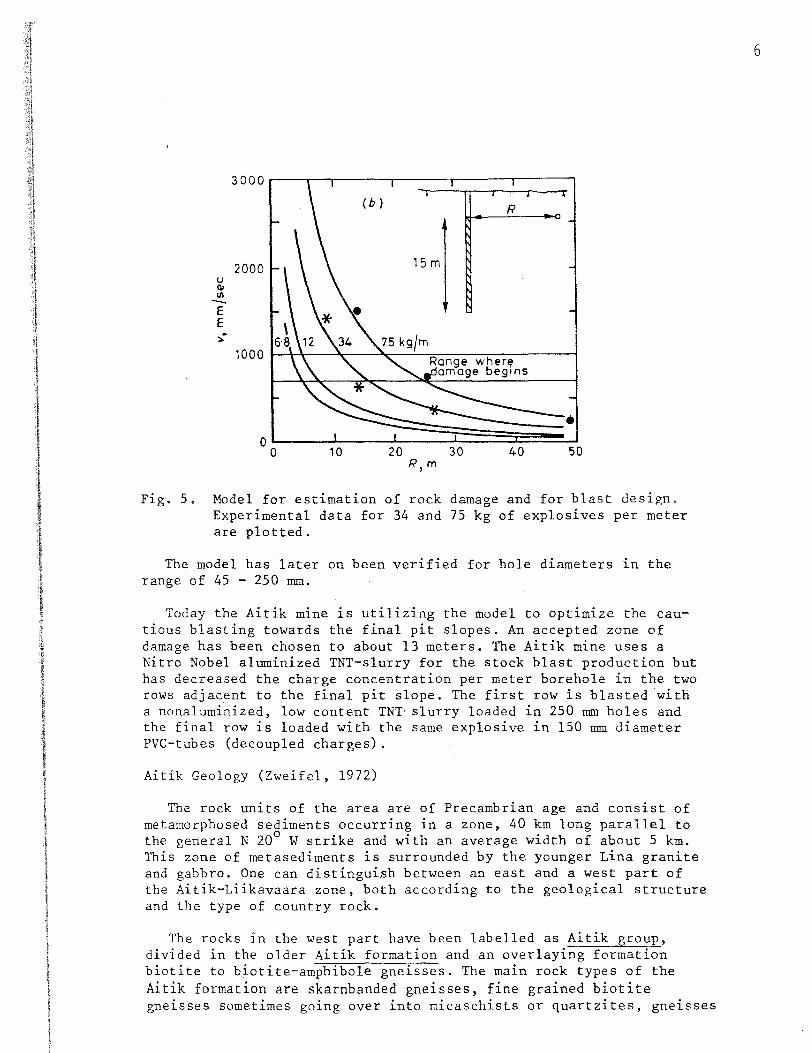
The core investigations showed that, according to the model, damage is introduced at a vibration level of 700- 1000 mm/s. Fig. 5 gives the zone of damage for specified charge concentrations per meter borehole when a charge height of 15 meter is used.
5
2000 u Cll Ill -E E .;
1000
R,m
Fig. 5. Model for estimation of rock damage and for blast design. Experimental data for 34 and 75 kg of explosives per meter are plotted.
The model has later on been verified for hole diameters ln the range of 45 - 250 mm.
Today the Aitik mine is utilizing the model to optimize the cautious blasting towards the final pit slopes. An accepted zone of damage has been chosen to about 13 meters. The Aitik mine uses a Nitro Nobel aluminized TNT-slurry for the stock blast production but has decreased the charge concentration per meter borehole in the two rows adjacent to the final pit slope. The first row is blasted with a nonaluminized, low content TNT· slurry loaded in 250 mm holes and the final row is loaded with the same explosive in 150 mm diameter PVC-tubes (decoupled charges) .
Aitik Geology (Zweifel, 1972)
The rock units of the area are of Precambrian age and consist of metamorphosed sediments occurring in a zone, 40 km long parallel to the general N 20° W strike and with an average width of about 5 km. This zone of metasediments is surrounded by the younger Lina granite and gabbro. One can distinguish between an east and a west part of the Aitik-Liikavaara zone, both according to the geological structure and the type of country rock.
The rocks in the west part have been labelled as Aitik group, divided in the older Aitik formation and an overlaying formation biotite to biotite-amphibole gneisses. The main rock types of the Aitik formation are skarnbanded gneisses, fine grained biotite gneisses sometimes going over into micaschists or quartzites, gneisses
6
with sharnschlieren, amphibolites and coarse grained biotite gnelsses.
LKAB LEVEANIEMI IRON ORE OPEN PIT MINE
Pincock, Allen and Holt, 1979, perfor~d a pit slope stability analysis for the LKAB Leveaniemi iron ore mine. A joint venture was initiated ~here LKAB, Pincock, Allen and Holt and SveDeFo contributed to a project where extensive examination of blast damage in the mine was performed.
SveDeFo together with Leveaniemi started a program to investigate in detail by field and laboratory studies, how the blasting disturbes the geology and the stability in sector 4 B in the mine (see Fig. 6).
The laboratory experiments were carried out to investigate how the joint shear strength is affected by blast damage. The field measurements were performed to characterize the disturbance of the rock mass continuity when stock production rounds were blasted.
Geology of the Leveaniemi Open Pit Mine
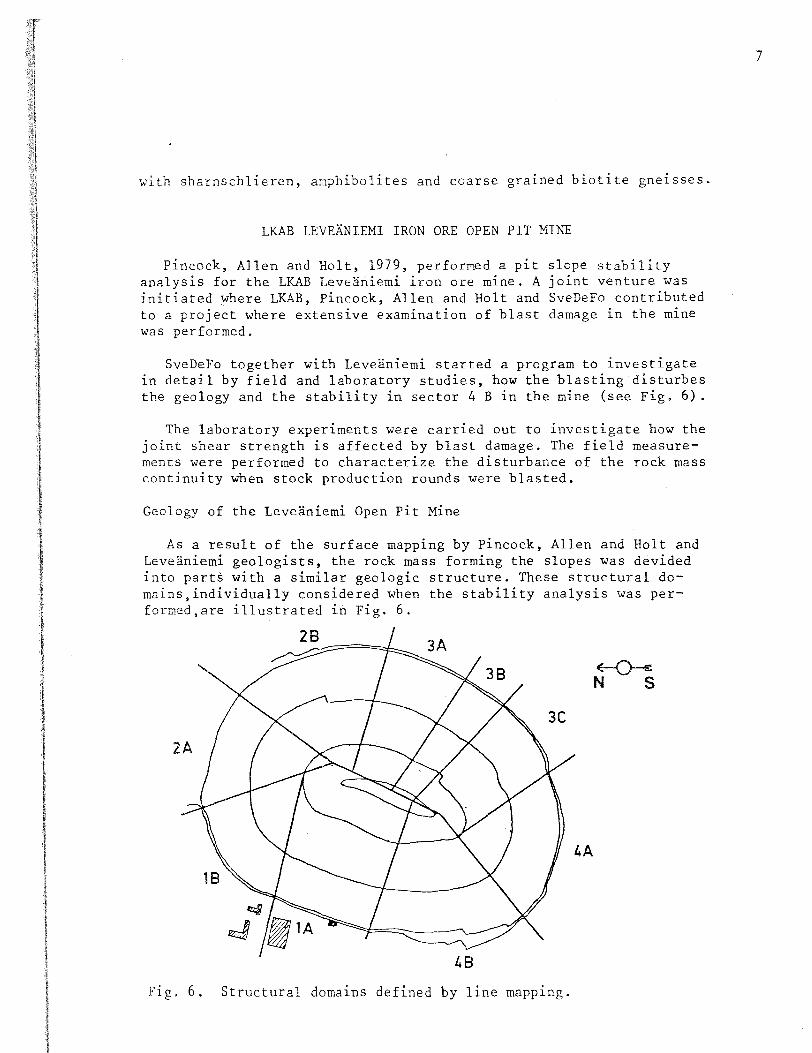
As a result of the surface mapping by Pincock, Allen and Holt and Leveaniemi geologists, the rock mass forming the slopes was devided into parts with a similar geologic structure. These structural domains,individually considered when the stability analysis was performed,are illustrated in Fig. 6.
48
Fig. 6. Structural domains defined by line mapplng.
~ N S
7
The bedrock of the area described by Frietsch, 1966, consists of volcanics and sediments with the following stratigraphy. Red leptite (oldest), conglomerate (leptite as ball material), scapolite, mica schist (mostly biotite schist). The ore brecciated the schist and has thus been deposited intrusively no doubt in conjunction with the tectonics which have given the area its synclinal form. The fold axis of the syncline dips on the surface at an angle of 50 degrees to the NNE. The dip becomes less steep with increasing depth. "The shackles" are pressed together which gives the ore body the shape of a sail boat hull.
In sector 4B the foliation of a biotite schist dips about 55° towards the pit center with a strike direction parallel to the pit 1 imi t.
SveDeFo~s studies were restricted to the sectors lA and 4B.
Blasting Geometry
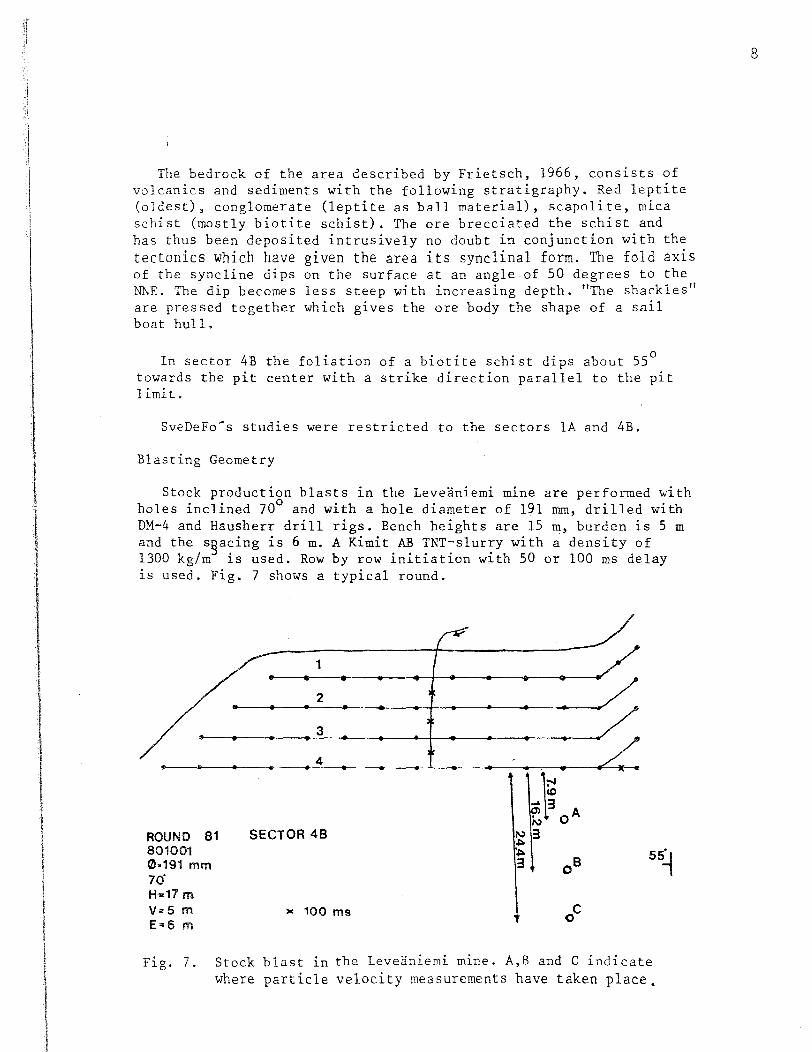
Stock production blasts in the Leveaniemi mine are performed with holes inclined 70° and with a hole diameter of 191 mm, drilled with DM-4 and Hausherr drill rigs. Bench heights are 15 m, burden is 5 m and the s~acing is 6 m. A Kimit AB TNT-slurry with a density of 1300 kg/m is used. Row by row initiation with 50 or 100 ms delay is used. Fig. 7 shows a typical round.
ROUND 81 801001 0·191 mm 70' H>~17m
V=5 m E"'6 m
1
2
3
4
SECTOR 48
>< 100 ms
55~
Fig. 7. Stock blast in the Leveaniemi mine. A,B and C indicate where particle velocity measurements have taken place.
8

Field Studies
Some of the results from field measurements of round 81 (see Fig. 7) are reviewed. These are from the extensometer measurements, the seismic measurements and the core logging. Results are in detail given by Holmberg, 1981 •
• LAST ROW m~--------------~~--------~~--------~--------
4 0 0 S1 S2
8 E1 ¥J ••• 0 0 53 S4
12 E2 0 ••• 0
S5 S6
16 E3 V2 ••• 0 0 0 57 sa
20 ~P3 ~0 0 P4 59 510
24 V3 0
------~--~--+-------------m 6 4 2 2 4 6
Fig. 8. Experimental set up for round 81. E denotes extensometers, S denotes holes for seismic cross hole measurements, P denotes core drilled holes and V represents holes for peak particle velocity measurements.
9
Extensometer Measurements
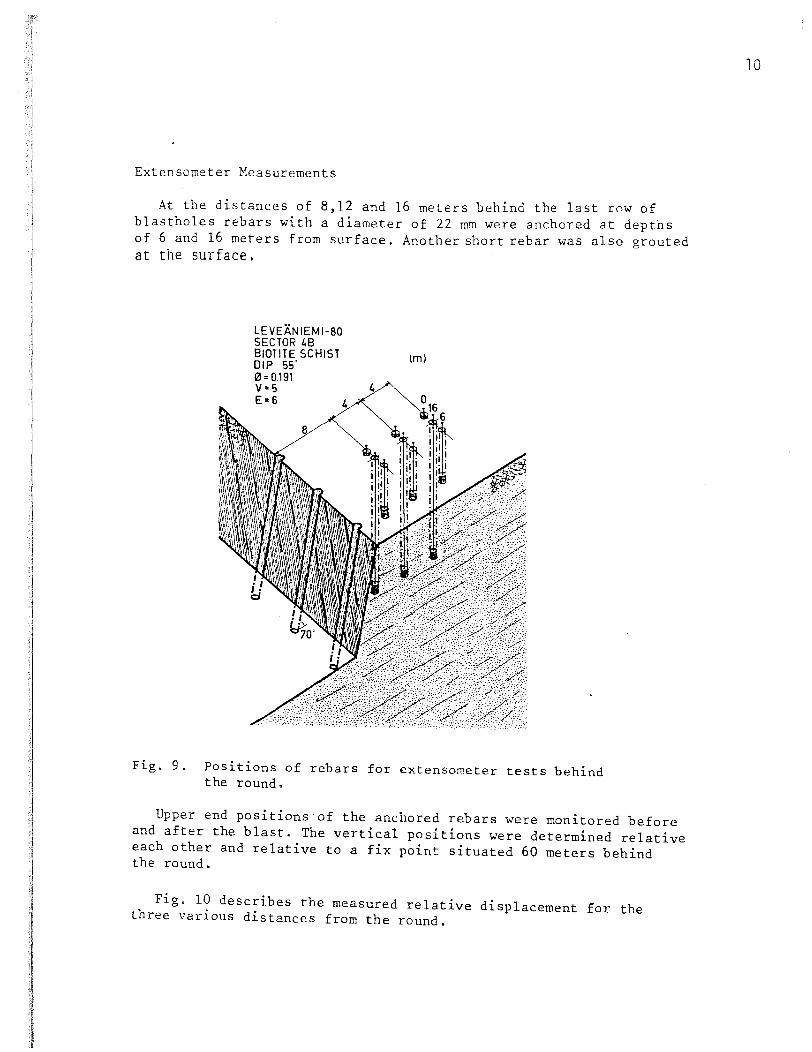
At the distances of 8,12 and 16 meters behind the last row of blastholes rebars with a diameter of 22 mm were anchored at depths of 6 and 16 meters from surface. Another short rebar was also grouted at the surface.
LEVEAN IEM 1-80 SECTOR 48 BIOTITE SCHIST DIP 55" 0 = 0191 V=5 E=6
(m)
Fig. 9. Positions of rebars for extenso~eter tests behind the round.
Upper end pos1t1ons of the anchored rebars were monitored before and after the blast. The vertical positions were determined relative each other and relative to a fix point situated 60 meters behind the round.
Fig. 10 describes the measured relative displacement for the three various distances from the round.
10
RELATIVE DISPLACEMENT km)
0-16
20
0-6
10
4 8 12 16
6m
16m
DISTANCE FROM BLAST lm)
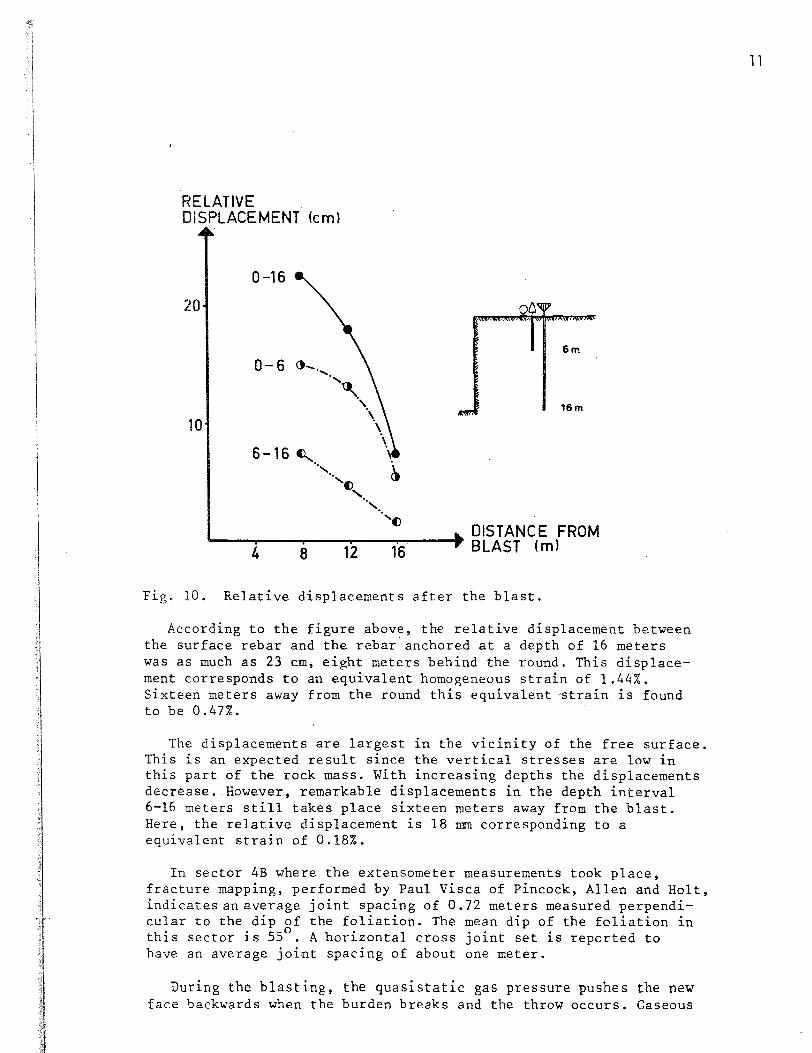
Fig. 10. Relative displacements after the blast.
According to the figure above, the relative displacement between the surface rebar and the rebar anchored at a depth of 16 meters was as much as 23 em, eight meters behind the round. This displacement corresponds to an equivalent homogeneous strain of 1.44%. Sixteen meters away from the round this equivalent "Strain is found to be 0.47%.
The displacements are largest in the vicinity of the free surface. This is an expected result since the vertical stresses are low in this part of the rock mass. With increasing depths the displacements decrease. However, remarkable displacements in the depth interval 6-16 meters still takes place sixteen meters away from the blast. Here, the relative displacement is 18 mm corresponding to a equivalent strain of 0.18%.
In sector 4B where the extensometer measurements took place, fracture mapping, performed by Paul Visca of Pincock, Allen and Holt, indicates an average joint spacing of 0. 72 meters measured perpendicular to the dip of the foliation. The mean dip of the foliation 1n this sector is 55°. A horizontal cross joint set is reported to have an average joint spacing of about one meter.
During the blasting, the quasistatic gas pressure pushes the new face backwards when the burden breaks and the throw occurs. Gaseous
ll
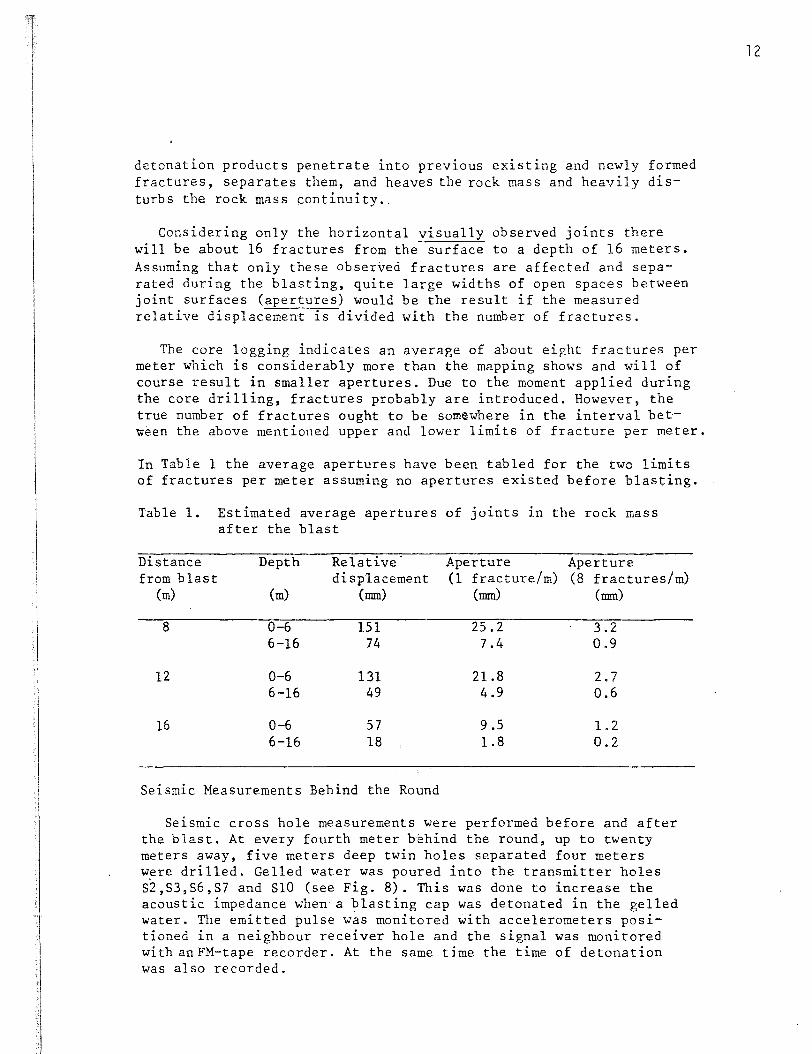
detonation products penetrate into previous existing and newly formed fractures, separates them, and heaves the rock mass and heavily disturbs the rock mass continuity.
Considering only the horizontal visually observed joints there will be about 16 fractures from the surface to a depth of 16 meters. Assuming that only these observed fractures are affected and separated during the blasting, quite large widths of open spaces between joint surfaces (apertures) would be the result if the measured relative displacement is divided with the number of fractures.
The core logging indicates an average of about eight fractures per meter which is considerably more than the mapping shows and will of course result in smaller apertures. Due to the moment applied during the core drilling, fractures probably are introduced. However, the true number of fractures ought to be somewhere in the interval between the above mentioned upper and lower limits of fracture per meter.
In Table 1 the average apertures have been tabled for the two limits of fractures per meter assuming no apertures existed before blasting.
Table 1. Estimated average apertures of joints in the rock mass after the blast
Distance Depth Relative Aperture Aperture from blast displacement (1 fracture/m) (8 fractures/m)
(m) (m) (mm) (mm) (mm)
8 0-6 151 25.2 3.2 6-16 74 7.4 0.9
12 0-6 131 21.8 2.7 6-16 49 4.9 0.6
16 0-6 57 9.5 1.2 6-16 18 1.8 0.2
Seismic Measurements Behind the Round
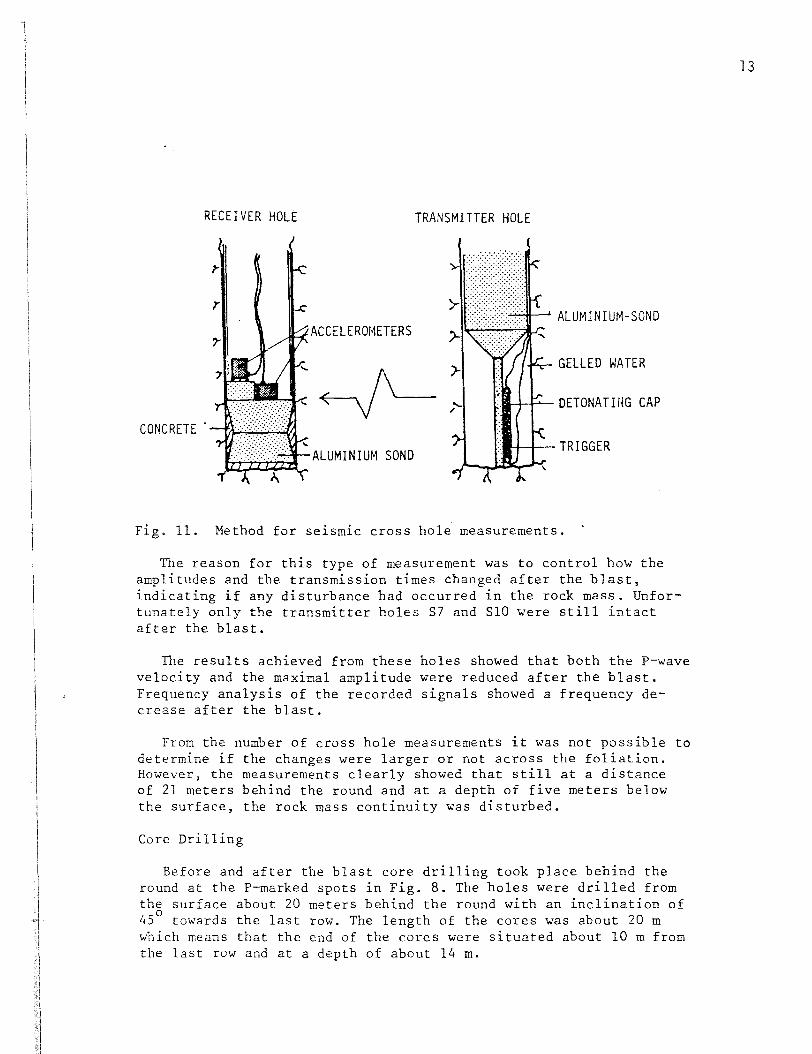
Seismic cross hole measurements were performed before and after the blast. At every fourth meter b~hind the round, up to twenty meters away, five meters deep twin holes separated four meters were drilled. Gelled water was poured into the transmitter holes s2,S3,S6,S7 and SlO (see Fig. 8). This was done to increase the acoustic impedance when a blasting cap was detonated in the gelled water. The emitted pulse was monitored with accelerometers positioned in a neighbour receiver hole and the signal was monitored with anFM-tape recorder. At the same time the time of detonation was also recorded.
12
RECEIVER HOLE TRANSMITTER HOLE
ACCELEROHETERS
GELLED WATER
Fig. 11. Method for se1sm1c cross hole. measurements.
The reason for this type of measurement was to control how the amplitudes and the transmission times changed after the blast, indicating if any disturbance had occurred in the rock mass. Unfortunately only the transmitter holes S7 and SlO were still intact after the blast.
The results achieved from these holes showed that both the P-wave velocity and the maximal amplitude were reduced after the blast. Frequency analysis of the recorded signals showed a frequency decrease after the blast.
From the number of cross hole measurements it was not possible to determine if the changes were larger or not across the foliation. However, the measurements clearly showed that still at a distance of 21 meters behind the round and at a depth of five meters below the surface, the rock mass continuity was disturbed.
Core Drilling
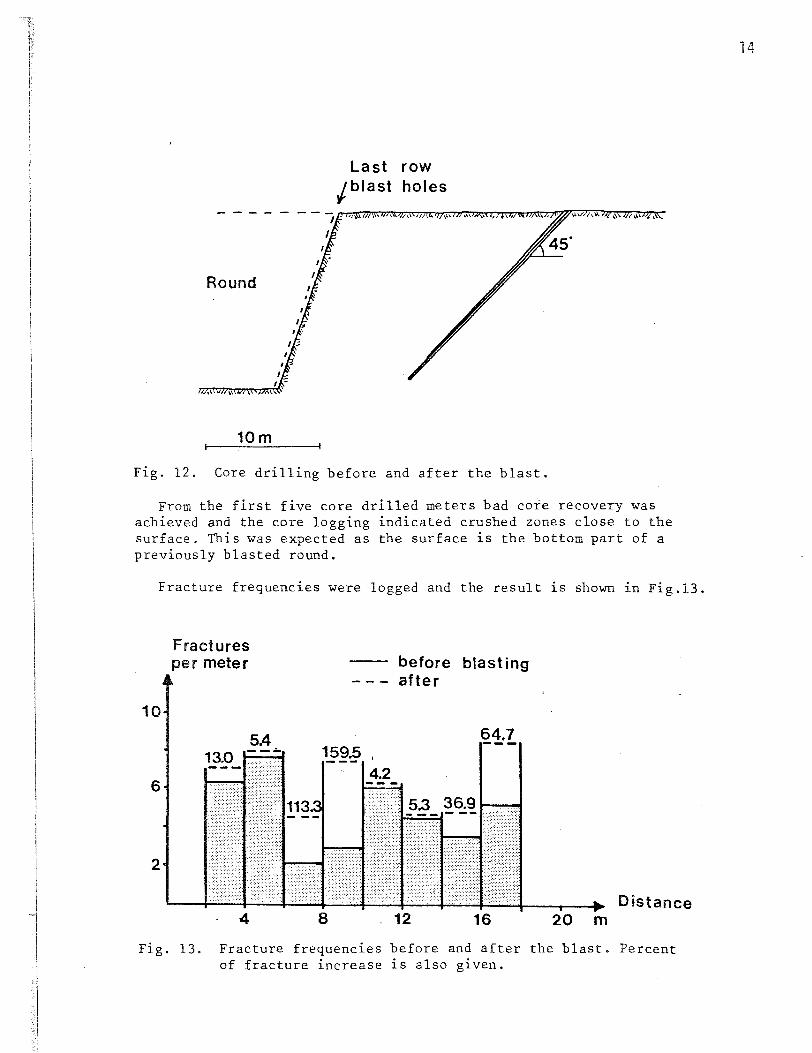
Before and after the blast core drilling took place behind the round at the P-marked spots in Fig. 8. The holes were drilled from the surface about 20 meters behind the round with an inclination of 45° towards the last row. The length of the cores was about 20 m which means that the end of the cores were situated about 10 m from the last row and at a depth of about 14 m.
13
Round
10m
Last row /blast holes
Fig. 12. Core drilling before and after the blast.
From the first five core drilled meters bad core recovery was achieved and the core logging indicated crushed zones close to the surface. This was expected as the surface is the bottom part of a previously blasted round.
Fracture frequencies were logged and the result 1s shown 1n Fig.l3.
10
6
2
Fractures per meter
4 8
before blasting after
64.7
12 16 Distance
20 m
Fig. 13. Fracture frequencies before and after the blast. Percent of fracture increase is also given.
14
After the blasting the fracture frequencies are larger than before the blasting for the total core length, although the differance is small in the interval 10-14 m. Two intervals have a very high increase of the fracture frequencies (65-160%) . These are the intervals 6-10 m and 16-18 m. The interval 6-10 m is close to the surface (depth 4.7- 7.1 m) where large residual displacements have been noticed. The interval 16-10 m is located at a depth of 11.3 - 12.7 m quite close to the blasthole bottom.
Point Load Strength Index Test
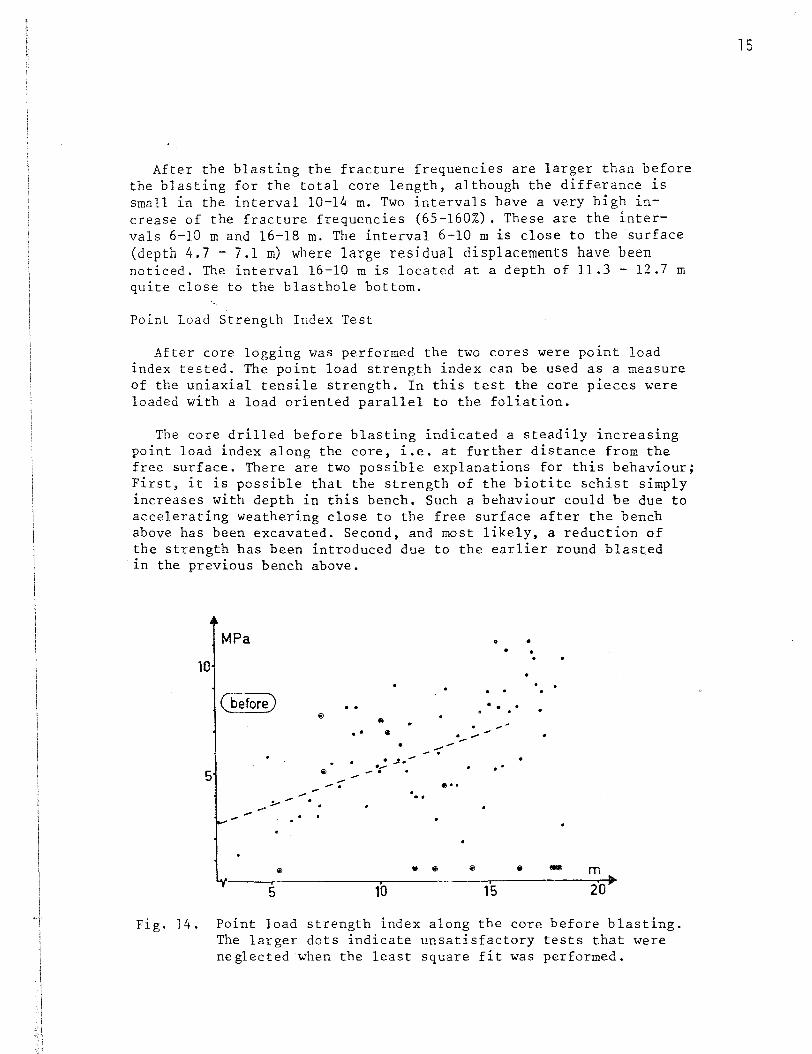
After core logging was performed the two cores were point load index tested. The point load strength index can be used as a measure of the uniaxial tensile strength. In this test the core pleces were loaded with a load oriented parallel to the foliation.
The core drilled before blasting indicated a steadily increasing point load index along the core, i.e. at further distance from the free surface. There are two possible explanations for this behaviour; First, it is possible that the strength of the biotite schist simply increases with depth in this bench. Such a behaviour could be due to accelerating weathering close to the free surface after the bench above has been excavated. Second, and most likely, a reduction of the strength has been introduced due to the earlier round blasted in the previous bench above.
MPa • . • 10
. . (before) ..
@) 8 .. ~ ·-----: . _,. -·-5 (i) -. --· e • • . . .
.:- -
• - m
5 10 15 20
Fig. 14. Point load strength index along the core before blasting. The larger dots indicate unsatisfactory tests that were neglected when the least square fit was performed.
15
10 MPa
(after)
•• tl _...< 5 /
/ /
5
.;...-. .... .... . . / ..
/ . . . . /. ..
/ ..
• 10
·_.., @ ,
... . .......
15
.· .. .
e> m 20
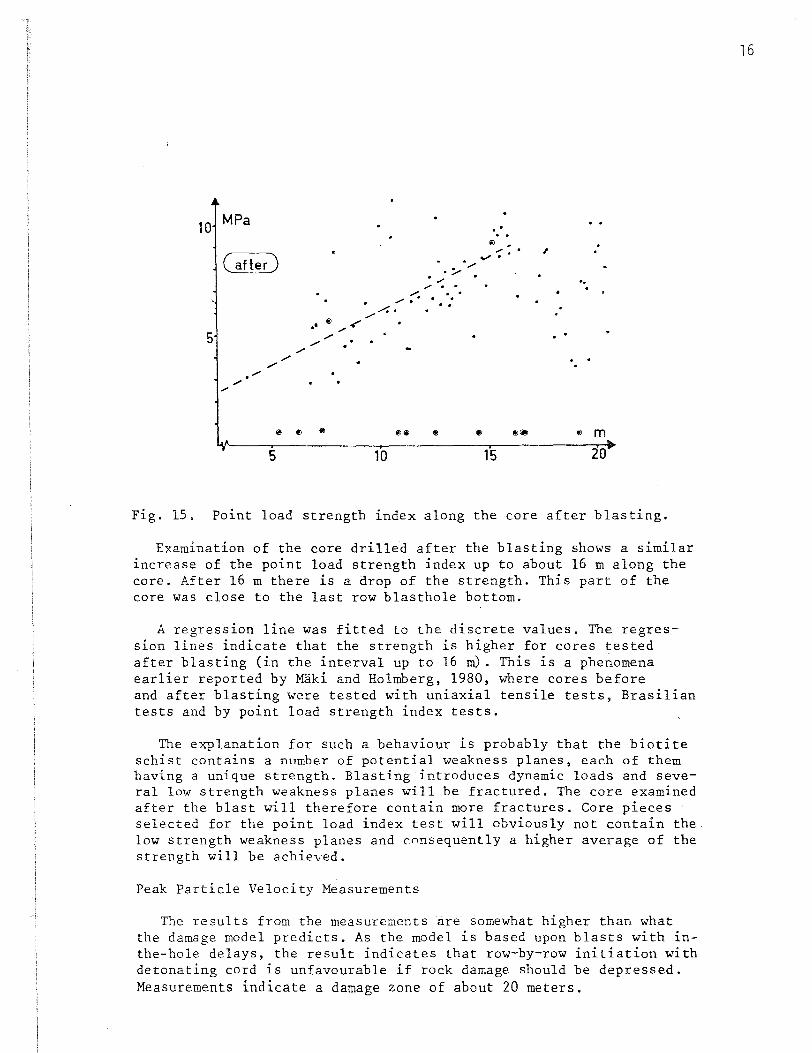
Fig. 15. Point load strength index along the core after blasting.
Examination of the core drilled after the blasting shows a similar increase of the point load strength index up to about 16 m along the core. After 16 m there is a drop of the strength. This part of the core was close to the last row blasthole bottom.
A regression line was fitted to the discrete values. The regression lines indicate that the strength is higher for cores tested after blasting (in the interval up to 16 m). This is a phenomena earlier reported by Kaki and Holmberg, 1980, where cores before and after blasting were tested with uniaxial tensile tests, Brasilian tests and by point load strength index tests.
The explanation for such a behaviour is probably that the biotite schist contains a number of potential weakness planes, each of them having a unique strength. Blasting introduces dynamic loads and several low strength weakness planes will be fractured. The core examined after the blast will therefore contain more fractures. Core pieces , selected for the point load index test will obviously not contain the low strength weakness planes and cnnsequently a higher average of the strength will be achieved.
Peak Particle Velocity Measurements
The results from the measurements are somewhat higher than what the damage model predicts. As the model is based upon blasts with inthe-hole delays, the result indicates that row-by-row initiation with detonating cord is unfavourable if rock damage should be depressed. Measurements indicate a damage zone of about 20 meters.
16
Laboratory Experiments
In order to investigate the shear strength of joints after movements in the joints have occurred, direct shear tests in laboratory scale were performed. This was made with a specially designed shear apparatus which basically consists of two steel plates positioned parallel to each other and at an initial distance of 1 em from each other.
The plates have throughgoing holes where three rock core samples with a diameter of 30 mm can be mounted. Intact rock samples containing geologic structures such as schistocity can be mounted into the apparatus in such a way that the structures will have an orientation parallel to the plates and to the shearing direction. Small movements of the plates created by wedging cause single planes of weakness to be fractured in the samples. Further movements increase the aperture along the fractured weakness planes. After a specific desired temporary aperture has been reached the surfaces are repositioned into contact without creation of further damage and the apparatus is ready for shearing.
It is also possible to study the effect of movements in preexisting joints. Samples containing such joints are kept together and mounted into the apparatus as in the previous case. The apparatus has facilities for increasing the initial distance between the plates which may be used to give the JOlnts in the samples a remaining aperture at the start of shearing.
Results of experiments carried out on rock material from the Leveaniemimineare reported by Maki, Nord and Persson, 1979 and Maki, 1981.
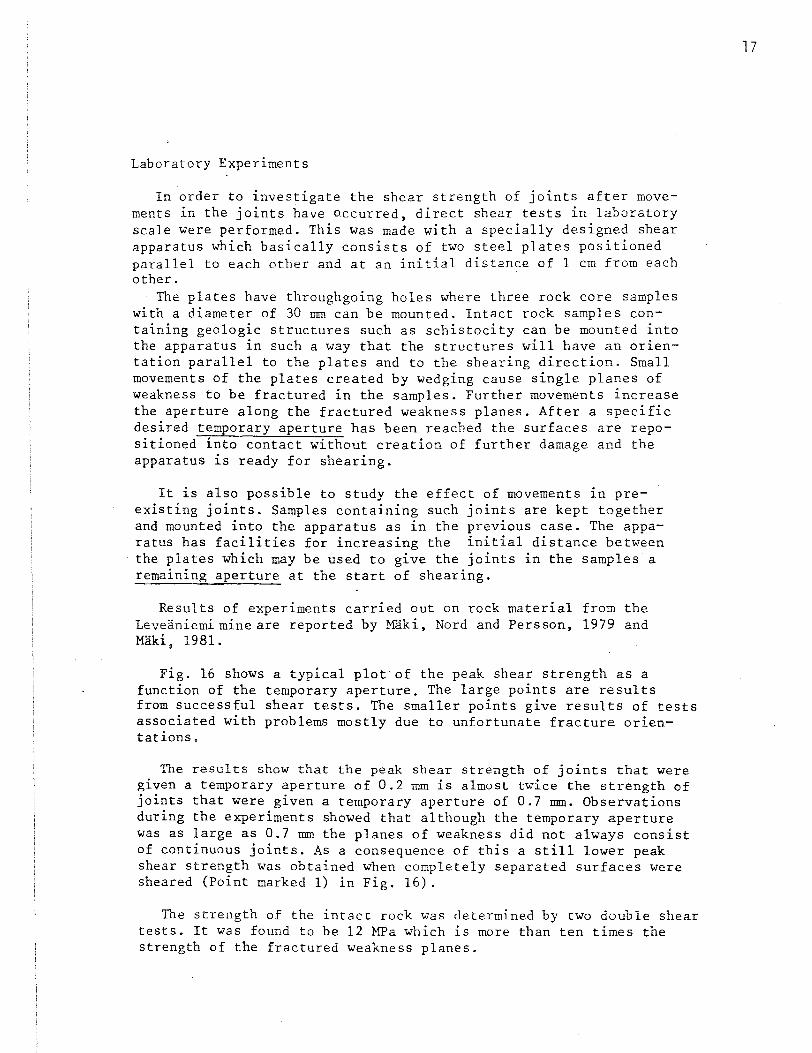
Fig. 16 shows a typical plot'of the peak shear strength as a function of the temporary aperture. The large points are results from successful shear tests. The smaller points give results of tests associated with problems mostly due to unfortunate fracture orientations.
The results show that the peak shear strength of joints that were given a temporary aperture of 0.2 mm is almost twice the strength of joints that were given a temporary aperture of 0.7 mm. Observations during the experiments showed that although the temporary aperture was as large as 0.7 mm the planes of weakness did not always consist of continuous joints. As a consequence of this a still lower peak shear strength was obtained when completely separated surfaces were sheared (Point marked 1) in Fig. 16).
The strength of the intact rock was determined by two double shear tests. It was found to be 12 MPa which is more than ten times the strength of the fractured weakness planes.
17
T peak(MPa)
1.5
1.0
0.5
·' '•
On= 0.32 MPa
·'· . . ...... ---:----•---·
1)
• TEMPORARY
~~~-0~.-2--~--0~.4--~---0~.6---r~covm-op-le•eAPERTURE(mm) separation
Fig. 16. The peak shear strength as a function of temporary aperture 1) Mean value from three experiments after complete
separation. Corresponding peak angle of friction
~ Tpeak = 39
o ~ = -arctan peak a
n
The results in Fig. 16 were used as a basis for calculations. Equations for the strength of weakness planes containing intact rock bridges are given by Lajtai, 1969. The use of these equations indicate that weakness planes that had been given a temporary aperture of 0.3 mm still had intact rock bridges covering 7% of the area of the weakness pl'ane. For increasing temporary aperture this area was calculated to decrease.
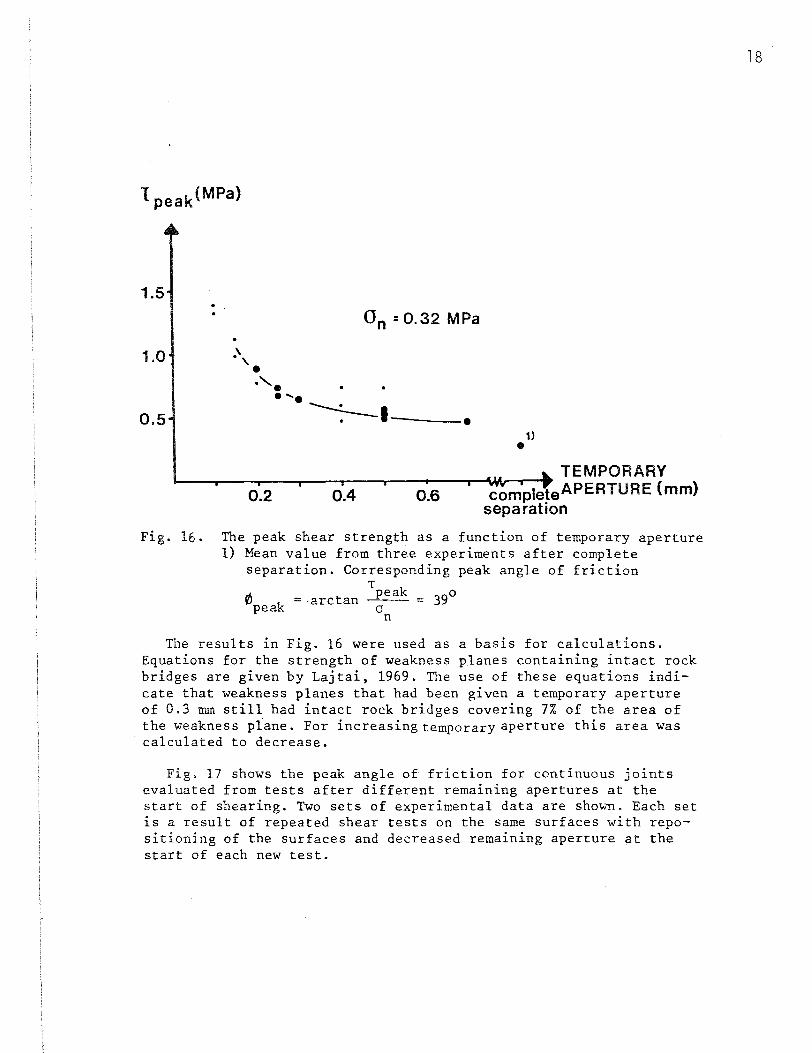
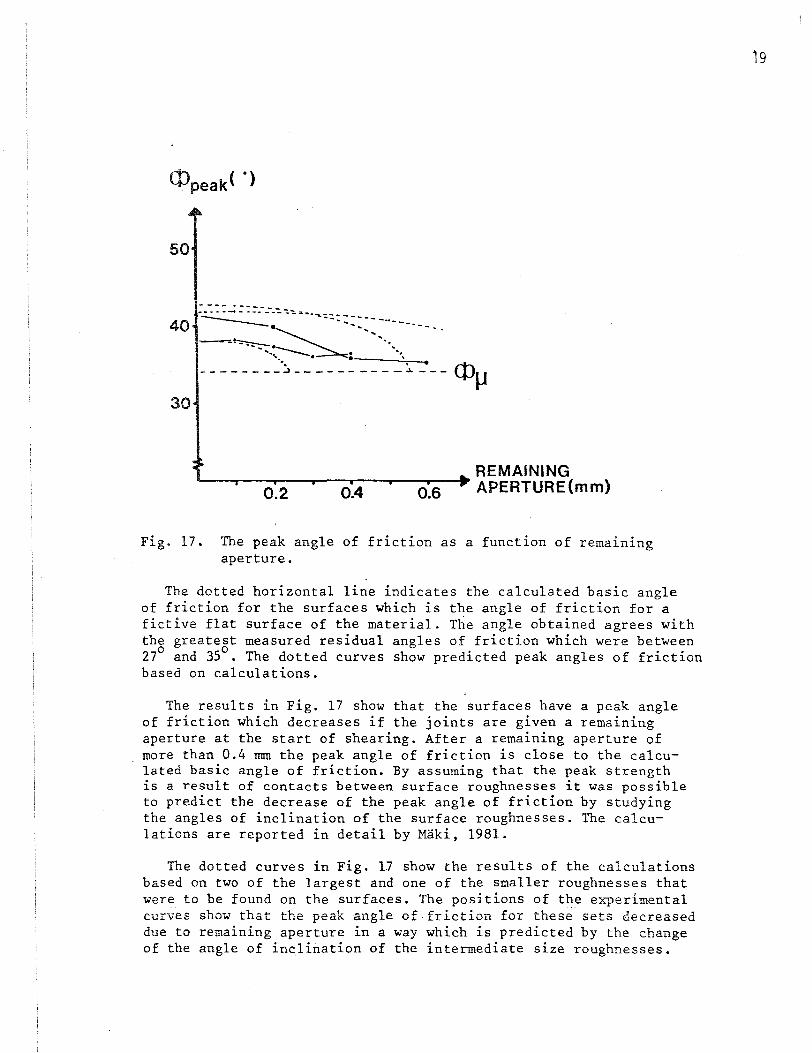
Fig. 17 shows the peak angle of friction for continuous J01nts evaluated from tests after different remaining apertures at the start of shearing. Two sets of experimental data are shown. Each set is a result of repeated shear tests on the same surfaces with repositioning of the surfaces and decreased remaining aperture at the start of each new test.
18
50
~ . .'::: _;.: :,:_----':..':~a- ...... ~-:::--------40 ---. '•,, ----- . . ~.
30
-·~ ·. ·-, .. :-- . · .. .... . . " . . --------J----------~---
REMAINING '---~---.--,...-----.-4-,...----..-_.. A PERT UR E (m m)
0.2 0. 0.6
Fig. 17. The peak angle of friction as a function of remaining aperture.
The dotted horizontal line indicates the calculated basic angle of friction for the surfaces which is the angle of friction for a fictive flat surface of the material. The angle obtained agrees with the greatest measured residual angles of friction which were between 27° and 35°. The dotted curves show predicted peak angles of friction based on calculations.
The results in Fig. 17 show that the surfaces have a peak angle of friction which decreases if the J01nts are given a rema1n1ng aperture at the start of shearing. After a remaining aperture of more than 0.4 mm the peak angle of friction is close to the calculated basic angle of friction. By assuming that the peak strength is a result of contacts between surface roughnesses it was possible to predict the decrease of the peak angle of friction by studying the angles of inclination of the surface roughnesses. The calculations are reported in detail by Maki, 1981.
The dotted curves in Fig. 17 show the results of the calculations based on two of the largest and one of the smaller roughnesses that were to be found on the surfaces. The positions of the experimental curves show that the peak angle of friction for these sets decreased due to rema1n1ng aperture in a way which is predicted by the change of the angle of inclination of the intermediate size roughnesses.
19
CONCLUSIONS
In Table 1 estimated ~verage apertures are given for various distances behind the blasted round. For a fracture frequency of eight fractures per meter, the remaining apertures about 20 m from the round are estimated to less than 0.4 mm. The laboratory experiments indicate that for remaining apertures less than 0.4 mm the peak angle of friction could be used for stability calculations. The results presented here form a basis for such calculations. The rock damage model will be to great help for determination of the zone where peak shear strength values could be utilized. Laboratory experiments and field measurements will give the data necessary for evaluation of the pe~k strength of critical weakness planes.
ACKNOWLEDGEMENTS
The authors wish to express their appreciation to the Swedish Board for Technical Development (STU) , to the Swedish Council for Building Research (BFR) and to the Swedish Industry who made this research project possible. The authors also greatfully acknowledge assistance giv~n by the Boliden mine Aitik and the LKAB mine Leveaniemi where the field experiments were carried out and Paul Visca, University of Arizona and Per-Anders Persson, Nitro Nobel AB for valuable discussions.
REFERENCES
Call, R.D., et al., 1977, "Probalistic Approach to Slope Design for the Aitik Mine, Sweden", Rock Mechanics Day arranged by BeFo (Swedish Rock Mechanics Research Foundation), Stockholm, Sweden.
Frietsch, R., 1966, "Geology and Ores of the Svappavaara Area, Northern Sweden", Sveriges Geologiska Undersokning, Serie C Nr 604, Stockholm, Sweden.
Holmberg, R., 1981, "Field Studies of Rock Damage in the Leveaniemi Open Pit Mine", (In Swedish), SveDeFo, Report DS 1981:6, Stockholm, Sweden.
Holmberg, R. and Krauland, N., 1977, "Examination of Crack Frequencies Before and After a Blast with 250 mm Hole Diameter in Aitik", (In Swedish), SveDeFo, Report 1977:2, Stockholm, Sweden.
~ Holmberg, R. and Persson, P-A., 1979, "Design of Tunnel Perimeter Blasthole Patterns to Prevent Rock Damage'', Proceedings, Tunnelling'79, Editor Jones, M.J., Institution of Mining and Metallurgy, London, U.K., March 12-16, 1979.
20
Lajtai, E.Z., 1969, "Strength of Discontinuous Rocks ~n Direct Shear", Geotechnique 19, No 2, pp 218-233.
Langefors, U. and Kihlstrom, B., 1963, "The Modern Technique of Rock Blasting", John Wiley, New York, USA, Almqvist and Wiksell, Stockholm, Sweden.
Maki, K., 1981, "The Shear Strength of Planes of Weakness in Biotite Schist with Simulated Blast Damages", SveDeFo, Report DS 1981:4, Stockholm, Sweden.
Maki, K. and Holmberg, R., 1980, "Rock Damage from Crater Blasting of a Raise", (In Swedish), SveDeFo, Report DS 1980:8, Stockholm, Sweden.
Maki, K., Nord, G. and Persson, P-A., 1979, "The Influence of Blast Damages on the Shear Strength of Biotite Schist", (In Swedish), SveDeFo, Report DS 1979:11, Stockholm, Sweden.
0 Persson, P-A., Holmberg, R. and Persson, G., 1977, "Cautious Blasting Towards Pit Slopes in Open Pit Mines", (In Swedish), SveDeFo, Report DS 1977:4, Stockholm, Sweden.
Pincock, Allen & Holt, INC, 1979, "Slope Design Study for the Leveaniemi Open Pit", authors Visca, P.J., Jones, S.M. and Call, R.D., Tucson, USA.
Zweifel, H., 1972, "The Aitik Copper Mine Geology and Mineralization", Boliden Mineral AB, information sheet of the Aitik Mine, Boliden Mineral AB, Sweden.
21