ASAE-994204-Thoughts on Diaphragm Action
34
Paper No. 994204 An ASAE Meeting Presentation Thoughts on Metal-Clad Wood-Frame Diaphragm Action and a Full-Scale Building Test by D. R. Bohnhoff Associate Professor University of Wisconsin-Madison Madison, Wisconsin, USA P. A. Boor Product Manager Lester Building Systems Lester Prairie, Minnesota, USA G. A. Anderson Associate Professor South Dakota State University Brookings, South Dakota, USA Written for Presentation at the 1999 ASAE/CSAE-SCGR Annual International Meeting Sheraton Toronto Center Toronto, Ontario, Canada July 18-22, 1999 Summary: Current diaphragm design procedures for metal-clad wood-frame buildings are reviewed and details of a proposed full-scale building test are presented. Keywords: Diaphragm, Structural analysis, Post-frame buildings, Metal-clad diaphragms, Load distribution The author(s) is solely responsi ble for the content of this technical presentati on. The technical presentation does not necessarily reflect the official position of ASAE, and its printing and distribution does not constitute an endorsement of views which may be expressed. Technical presentations are not subject to formal peer review process by ASAE editorial committees; therefore, they are not to be presented as refereed publications. Quotation from this work should state that it is from a presentation made by (name of author) at the (listed) ASAE meeti ng. EXAMPLE-- From Authors Las t Name, Initi als. “Title of P resentation”. Presented at the Dat e and Title of meeting. Paper No. X . ASAE, 2950 Niles Rd.., St Joseph, MI 49085-9659 USA. For information about securing permission to reprint or reproduce a technical presentation, please address inquiries to ASAE. ASAE, 2950 N iles Rd., St . Joseph, MI 49085-9659 USA Voice: 616.429.0300 FAX: 616.429.3852 E-Mail: [email protected]
-
Upload
david-combs -
Category
Documents
-
view
216 -
download
0
Transcript of ASAE-994204-Thoughts on Diaphragm Action
8/9/2019 ASAE-994204-Thoughts on Diaphragm Action
http://slidepdf.com/reader/full/asae-994204-thoughts-on-diaphragm-action 1/34
Paper No. 994204An ASAE Meeting Presentation
Thoughts on Metal-Clad Wood-Frame Diaphragm Actionand a Full-Scale Building Test
by
D. R. Bohnhoff Associate Professor
University of Wisconsin-MadisonMadison, Wisconsin, USA
P. A. BoorProduct Manager
Lester Building SystemsLester Prairie, Minnesota, USA
G. A. Anderson Associate Professor
South Dakota State UniversityBrookings, South Dakota, USA
Written for Presentation at the1999 ASAE/CSAE-SCGR Annual International Meeting
Sheraton Toronto CenterToronto, Ontario, Canada
July 18-22, 1999
Summary: Current diaphragm design procedures for metal-clad wood-frame buildings are reviewed anddetails of a proposed full-scale building test are presented.
Keywords: Diaphragm, Structural analysis, Post-frame buildings, Metal-clad diaphragms, Load distribution
The author(s) is solely responsible for the content of this technical presentation. The technical presentationdoes not necessarily reflect the official position of ASAE, and its printing and distribution does not constitute anendorsement of views which may be expressed.
Technical presentations are not subject to formal peer review process by ASAE editorial committees;therefore, they are not to be presented as refereed publications.
Quotation from this work should state that it is from a presentation made by (name of author) at the (listed)
ASAE meeting.
EXAMPLE-- From Authors Last Name, Initials. “Title of Presentation”. Presented at the Date and Title ofmeeting. Paper No. X. ASAE, 2950 Niles Rd.., St Joseph, MI 49085-9659 USA.
For information about securing permission to reprint or reproduce a technical presentation, please addressinquiries to ASAE.
ASAE, 2950 Niles Rd., St. Joseph, MI 49085-9659 USAVoice: 616.429.0300 FAX: 616.429.3852 E-Mail:[email protected]
8/9/2019 ASAE-994204-Thoughts on Diaphragm Action
http://slidepdf.com/reader/full/asae-994204-thoughts-on-diaphragm-action 2/34
1
Thoughts on Metal-Clad Wood-Frame Diaphragm Actionand a Full-Scale Building Test
byD. R. Bohnhoff, P.A. Boor, and G. A. Anderson
Abstract
Current diaphragm design procedures for metal-clad wood-frame buildings are reviewed withspecific discussion on: determination of diaphragm stiffness, structural load distribution, and
chord force calculations. A major load distribution assumption that is implicit in the current
design procedure is explored, and an alternative structural analog is presented. Simple modelsare used to investigate the distribution of chord forces in diaphragms, as well as the sensitivity of
chord forces to changes in boundary conditions. Details of a proposed full-scale building test are
also presented.
Introduction
A metal-clad wood-frame diaphragm is defined as any structural assembly of metal cladding
including the timber framing, metal cladding, fasteners and fastening patterns, capable oftransferring in-plane shear forces through the cladding and framing members (ASAE, 1999a).
The actual transfer of in-plane shear forces by a diaphragm is referred to as diaphragm action.
When diaphragm action is incorporated into structural design, the design is commonly referred toas diaphragm design.
Like most structural design procedures, diaphragm design for metal-clad wood-frame buildings
continues to evolve. This evolution is the direct result of ongoing laboratory and field research.In the following paper, three components of current diaphragm design procedures/methods will
be reviewed and critiqued, and plans for a full-scale building test will be outlined. In many
respects, this paper is a supplement/extension to an earlier work by Anderson (1990).
Determination of Diaphragm Stiffness
The current industry accepted metal-clad wood-frame diaphragm design procedure is outlined inASAE EP 484.2 Diaphragm Design of Metal-Clad Wood-Frame Rectangular Buildings (ASAE,
1999a). One of the first steps in this design procedure involves dividing individual roof and
ceiling diaphragms into sections for analysis (in the remainder of this discussion, these sectionswill be referred to as diaphragm sections). Sectioning is a straight forward process with ridge
and eave lines, abrupt changes in roof slope, main building frames, and shearwalls generally
servings as lines of demarcation between diaphragm sections. The ultimate goal of sectioning is
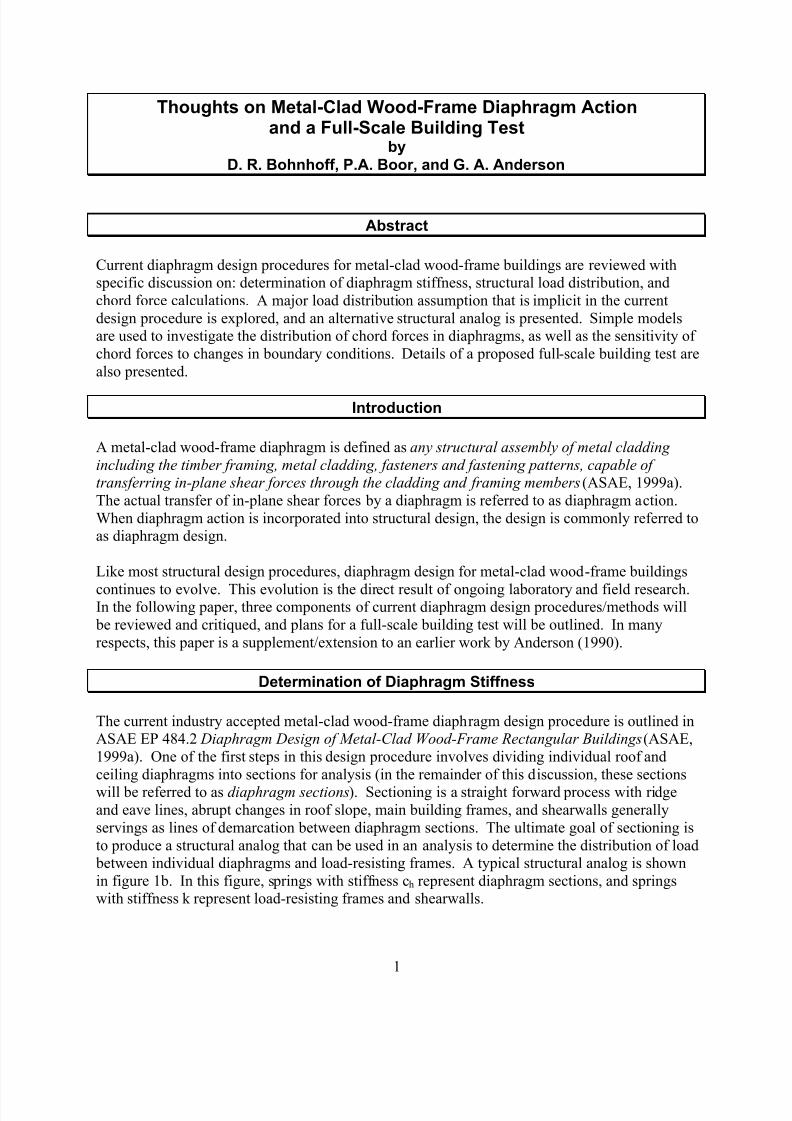
to produce a structural analog that can be used in an analysis to determine the distribution of load between individual diaphragms and load-resisting frames. A typical structural analog is shown
in figure 1b. In this figure, springs with stiffness ch represent diaphragm sections, and springswith stiffness k represent load-resisting frames and shearwalls.

8/9/2019 ASAE-994204-Thoughts on Diaphragm Action
http://slidepdf.com/reader/full/asae-994204-thoughts-on-diaphragm-action 3/34
2
(a) (b)
Figure 1 – (a) typical 4-bay metal-clad post-frame building with applied eave loads, and (b)typical structural analog currently used to determine distribution of load to individual
diaphragm sections, load resisting frames and shearwalls.
Once sectioning is completed, an effective shear stiffness value must be assigned to each
diaphragm section. Methods for determining effective shear stiffness values can be categorizedas those that are exclusively dependent on laboratory testing, and those that are dependent (to
some extent) on finite element analysis.
Methods Exclusively Dependent on Laboratory Testing
Currently, the most common method for determining effective shear stiffness values for
diaphragm sections is to linearly adjust data obtained from laboratory testing of diaphragm test
assemblies. Construction specifications and testing procedures for such test assemblies are givenin ASAE EP558 Load Test for Metal-Clad Wood-Frame Diaphragms (ASAE, 1999b). With the
exception of overall length and width, a diaphragm test assembly is required to be identical to thediaphragm in the building being designed. Specifically, frame members must be of identical
size, spacing, species and grade; metal cladding must be identical in composition, profile and
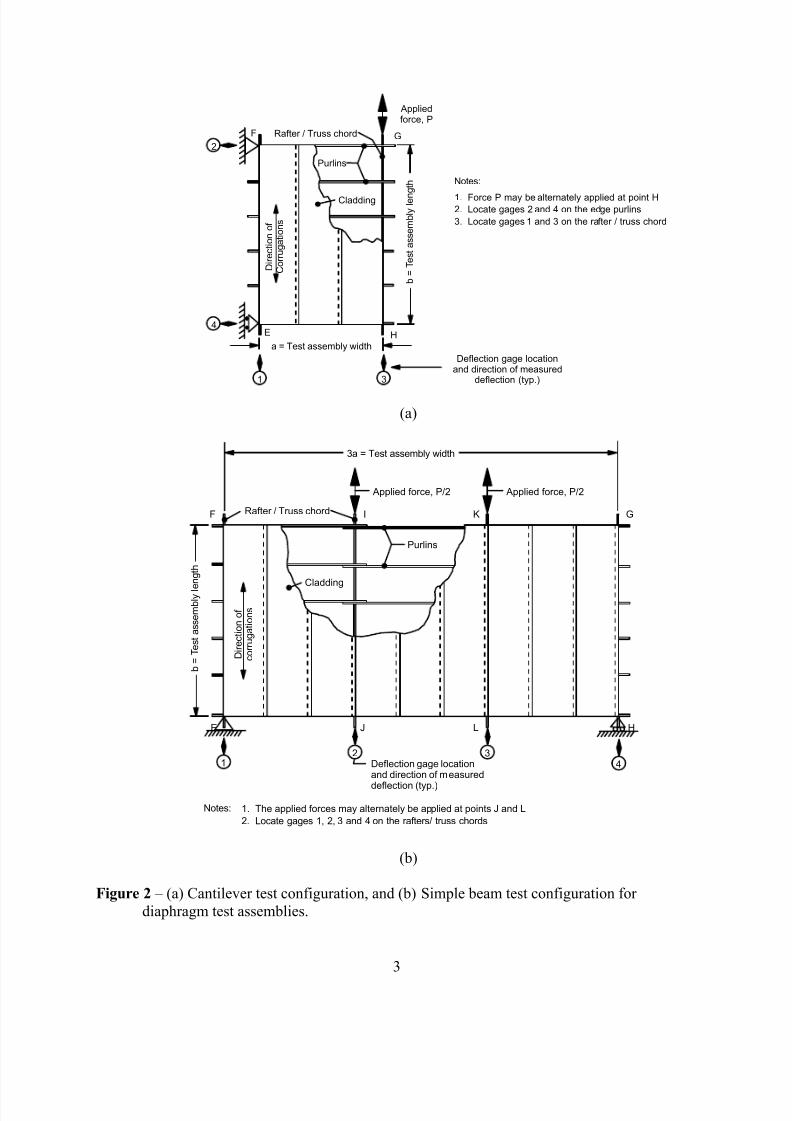
thickness; and fastener type and location must be the same. EP558 allows for two differenttesting configurations: a cantilever test and a simple beam test (figures 2a and 2b, respectively).
In both figures 2a and 2b, variable “a” represents the spacing between rafters/trusses (a.k.a. the
frame spacing). This spacing should be equal to, or a multiple of, the frame spacing of the
diaphragm in the building being designed.
The procedure for determining test assembly shear stiffness begins with calculation of theadjusted load-point deflection, DT. This value takes into account rigid body rotation/translationduring assembly test, and is obtained from the deflection measurements D1, D2, D3, and D4
(figure 2) as follows:
Cantilever test: DT = D3 – D1 – (a/b)•(D2 + D4) (1)
Simple beam test: DT = (D2 + D3 – D1 –D4)/2 (2)
k1 k2 k3 k4 k5
ch1 ch2 ch3 ch4
r 1 r 2 r 3 r 4 r 5
8/9/2019 ASAE-994204-Thoughts on Diaphragm Action
http://slidepdf.com/reader/full/asae-994204-thoughts-on-diaphragm-action 4/34
3
(a)
(b)
Figure 2 – (a) Cantilever test configuration, and (b) Simple beam test configuration for
diaphragm test assemblies.
b = T e s t a s s e m b l y l e n g t h
D i r e c t i o n o f
c o r r u g a t i o n s
Cladding
3a = Test assembly width
1. The applied forces may alternately be applied at points J and L
2. Locate gages 1, 2, 3 and 4 on the rafters/ truss chords
E
G
H
Applied force, P/2
Purlins
Rafter / Truss chord
Deflection gage locationand direction of measured
deflection (typ.)
Notes:
F I K
J L
Applied force, P/2
12 3
4
D i r e c t i o n o f
C o r r u g a t i o n s
Cladding
a = Test assembly width
1. Force P may be alternately applied at point H2. Locate gages 2 and 4 on the edge purlins
3. Locate gages 1 and 3 on the rafter / truss chord
E
F G
H
Appliedforce, P
Purlins
Rafter / Truss chord
Deflection gage locationand direction of measured
deflection (typ.)
Notes:
b = T e s t a s s e m b l y l e n
g t h
1 3
4
2

8/9/2019 ASAE-994204-Thoughts on Diaphragm Action
http://slidepdf.com/reader/full/asae-994204-thoughts-on-diaphragm-action 5/34
4
The effective in-plane shear stiffness, c, for a diaphragm test assembly is defined as the ratio of
the applied load to the adjusted load point deflection at 40% of ultimate load. In equation form:
Cantilever test: c = 0.4•Pu/DT,d (3)
Simple beam test: c = 0.2•Pu/DT,d (4)
where DT,d is the adjusted load-point deflection, DT, at 0.4•Pu. The in-plane shear stiffness forthe diaphragm test assembly, c, is converted to an effective shear modulus for the test assembly,
G, as:
G = c•a/b (5)
The effective shear modulus for the diaphragm test assembly, G, is used to calculate thehorizontal stiffness, ch, of each diaphragm section (of similar construction) in the building being
designed. The relationship between these two variables is given as:
ch = G•(cos θ)•(bh/s) (6)
where: θ is the slope of the diaphragm section; bh is the horizontal span length of the diaphragm
section, and s is the width of the diaphragm section.
Some controversy surrounds the procedure outlined in EP558. This is because the exact location
of the deflection gages used to measure displacements can significantly affect the adjusted load-
point deflection, and hence the effective shear modulus. EP558 recommends that the gages belocated on the edge purlins and on the rafters/truss chords (figure 2). If, for example, all gages
were located on the purlins, the calculated shear deflection would not account for slip between
the purlins and primary framing members (i.e., the rafters/trusss). Calculated values for DT would decrease, resulting in an increase in effective shear modulus. As will be shown in the
section on structural load distribution, ignoring slip between purlins and primary framing may
produce more accurate estimates of load distribution and building eave deflections. Because ofquestions surrounding gage location, enough deflection gages should be used during laboratory
tests to isolate all major components of overall deflection.
Methods Dependent on Finite Element Analysis
Determining the in-plane stiffness of a diaphragm via finite element analysis (FEA) requires that
a structural analog (or model) of the diaphragm first be developed. This involves segmenting the
assembly into small elements that are interconnected at nodes (similar to what was done with theentire building in figure 1). Next, material properties are assigned to each element in the model.
Appropriate boundary conditions are then imposed, and the model is loaded. The displaced
geometry of the model is then used to calculate the effective in-plane stiffness of the diaphragm.
The main advantage of using FEA is that the response of a structure to changes in support and
loading conditions, material properties, and/or overall structural geometry can be quickly
determined once a model has been created. To investigate just one of these changes via
8/9/2019 ASAE-994204-Thoughts on Diaphragm Action
http://slidepdf.com/reader/full/asae-994204-thoughts-on-diaphragm-action 6/34
5
laboratory testing requires the construction and testing of another test specimen. In addition, a
FEA model can be subjected to any boundary condition, many of which would be very difficult,if not impossible, to emulate in a laboratory test.
Another major advantage of using FEA is that stresses in individual components and slips
between individual components are easily obtained. To obtain such information duringlaboratory testing requires additional instrumentation, which can be expensive and time
consuming to install and calibrate.
Along with the advantages of FEA come certain drawbacks. First, the quality of the output
obtained from an FEA analysis is dependent on numerous modeling choices, such as: selection
of element type, mesh density, and element input properties. The number and significance ofthese modeling decisions generally increase as a structure becomes more complex, which occurs,
for example, when: (1) the number and variety of components and connections increase, (2)
geometric nonlinearities (e.g., localized buckling) and material nonlinearities cannot be ignored,and (3) modeling moves from two to three dimensions. It follows, that the more complex a
structure, the less confidence there is in the accuracy of the FEA output, and the more importantit is to validate the analysis with laboratory testing. A second drawback of FEA is that a
complex analysis requires sophisticated software, and perhaps more important, an individualwith a good understanding of the behavior and proper use of different element types.
With respect to FEA, metal-clad wood-frame diaphragms are complex structures to model because of: (1) the complex behavior of corrugated metal panels under in-plane loads, (2) the
non-linear load-slip behavior of mechanical fasteners, and (3) the torsion of wood framing
members under in-plane loading and the influence of this torsion on connector behavior.
The most detailed FEA of a metal-clad wood-frame diaphragm was performed by Wright (1992),who modeled one-half of a diaphragm test assembly measuring 8- by 12-feet. This “half-model”
contained 11,644 nodes, 11,515 elements, and involved 69,864 degrees of freedom. The size of
the model was directly attributable to the number of elements used to model the corrugated steel panels. This in turn was due to element aspect ratio (length-to-width) limitations which limited
the four-node shell elements (used to model steel) to a maximum length of about 1 inch. Figure
3 lists the type and shows the relative arrangement of elements in Wright’s model. Overall,
Wright found good agreement between predicted deflections and those measured duringlaboratory test of three diaphragm test assemblies.
At the time that Wright conducted his FEA analysis, desk top computers were not nearly as powerful as they are today. To solve his problem, Wright was forced to rely on a super-
computer. Because of the time and cost associated with an individual super-computer run,
Wright was not able to conduct valuable sensitivity analysis. Fortunately, problems as complexas Wright’s can be easily handled with today’s desk top computers and the newer FEA software.
In addition, the pre- and post-processors associated with newer FEA software make model
construction, data input and analysis of program output much faster and easier than when Wrightconducted his research.

8/9/2019 ASAE-994204-Thoughts on Diaphragm Action
http://slidepdf.com/reader/full/asae-994204-thoughts-on-diaphragm-action 7/34
6
Figure 3 – Elements types used by Wright (1992) to model a diaphragm test assembly
Often, a major goal of more complex FEA, is to simplify FEA procedures for future analyses.
This is done by using complex models to carefully analyze simplifying assumptions and
modeling methods. Williams (1999) worked to develop an element for modeling “largesections” of corrugated metal paneling. As a first step in this research, Williams investigated
corrugated steel panel behavior by modeling the same panel profile with several differentelement types (i.e., linear shell, elastic-plastic models, and linear and nonlinear updated and total
lagrangian formulations). Williams found predicted behavior to be highly dependent on element
type and order of integration, which further demonstrated the complex behavior of light-gage,corrugated steel. In the end, Williams used a four node, 8 dof, isoparametric plane-stress
element with orthotropic properties to model larger sections of corrugated panels. This element
was embedded in a FEA program specifically written by Williams for modeling metal-cladwood-frame diaphragms. Modeling properties for the element were obtained by laboratory
testing sections of corrugated metal paneling.
A simplified FEA model developed for steel-framed diaphragms by Davies (1977) was used by
Anderson (1987) to model a series of metal-clad wood-frame diaphragms that he had tested. An
analog for one of the Anderson’s analyses is shown in figure 4. For this simplified model:
1. Purlins were lumped together and modeled as a single member with a cross-sectional area
and minor axis bending moment equal to the sum of the individual purlins.2. Corrugated panels were sectioned into areas such that each area had a length equal to the full
length of the panel and a width equal to the on-center spacing of major ribs. In the structuralanalog each one of these areas was surrounded by a rectangular frame of four truss elements
(a truss element is an element that can only transmit axial load, and is therefore pin-
connected at both ends). In-plane shear stiffness of each area was represented through theuse of a truss element that connected opposite corners of the surrounding frame (figure 5).

8/9/2019 ASAE-994204-Thoughts on Diaphragm Action
http://slidepdf.com/reader/full/asae-994204-thoughts-on-diaphragm-action 8/34
7
Figure 4 – Example of an analog used by Anderson (1987) to model diaphragm test panels.
Figure 5 – Use of truss elements to represent cladding behavior.
3. Each row of fasteners located along the length of a panel was represented with a truss
element that connected the rectangular frame to the adjacent “purlin” element. Properties
were assigned to this element so that its axial stiffness was equal to the sum of the shearstiffness values of the individual fasteners within the row. It should be noted that Anderson
modeled each row of seam (a.k.a. stitch) fasteners as two truss elements. These trusselements were connected to the same node on the purlin, but to different panel elements.
4. Displacement perpendicular to the corrugations was prevented.
Rigid truss elements establish length and widthof cladding
Pinned joints
Properties of diagonal truss elementestablishes shear characteristics of cladding

8/9/2019 ASAE-994204-Thoughts on Diaphragm Action
http://slidepdf.com/reader/full/asae-994204-thoughts-on-diaphragm-action 9/34
8
The simplified model used by Anderson assumes that panel-to-purlin connections within the
same row have the same interlayer slip, and that all purlins have identical displacement.Anderson assumed linear relationships for all material stiffness properties, and only used the
analog to predict test assembly behavior up to 40% of ultimate load. For the 15 test diaphragms
modeled, the ratio of actual to predicted stiffness ranged between 0.71 and 1.33 with a mean of
0.93 (Anderson and Bundy, 1990).
Keener (1995) used Davies’ simplified model to predict the behavior of Wright’s (1992)
diaphragm test assemblies. Unlike Anderson’s model, Keener’s model included elements formodeling the behavior of rafters, rafter-to-purlin connectors, and direct load transfer between
panels by seam fasteners (see figure 6). Keener also accounted for the non-linear load-slip
behavior of all connections. Properties for the truss elements (used to model the cladding) wereobtained from laboratory testing sections of corrugated metal paneling. Keener was able to
accurately predict assembly behavior for loads less than 50% of ultimate. However, at higher
loads, the simplified model was too stiff. This was primarily attributed to the inability of thesimplified model to account for purlin twisting. Purlin twisting is the direct result of load being
applied in a plane that does not coincide with the plane of shear resistance.
(a) (b)
Figure 6 – (a) Schematic and (b) Keener’s model of Wright’s test assembly (Keener and
Manbeck, 1996a)
8/9/2019 ASAE-994204-Thoughts on Diaphragm Action
http://slidepdf.com/reader/full/asae-994204-thoughts-on-diaphragm-action 10/34
9
The research by Anderson (1987) and Keener (1995) is important in that it demonstrates that it is possible to predict, with a rather simple model, the in-plane stiffness of diaphragm assemblies
under design loads. It is important to note that this does not mean that laboratory testing can be
eliminated. Even Davies’ simplified model requires connector load-slip properties, and accurate
estimates of the effective shear stiffness of corrugated panels. At the present time, laboratorytesting is the only reliable means of obtaining these properties. However, as more and more tests
are completed and compared, fewer new tests will be needed.
General Concern with Current Methods
Laboratory testing and finite element modeling of diaphragm test assemblies both demonstratethat outcome (shear stiffness values) are highly dependent on how the assembly is supported and
loaded. Much of the measured load-point deflection in a test assembly results from loads being
applied in a plane (i.e., the plane of the rafters) that does not coincide with the plane of shearresistance (i.e., a plane much nearer the interface between purlins and cladding). This becomes a
problem when the deformations due to this eccentric loading are included in deformations usedto define the shear stiffness of a diaphragm section with loads, that as a whole, are less
eccentrically applied. Loads, on a whole, are less eccentrically applied when they are induced byadjacent diaphragm sections and not load resisting frames or shearwalls.
Structural Load Distribution
To determine the distribution of load between major structural subsystems (i.e., diaphragms,
load-resisting frames and shearwalls) in metal-clad wood-frame buildings, most engineers use ananalog like the one illustrated in figure 1b. As previously noted, springs with stiffness ch
represent diaphragm sections and springs with stiffness k represent individual load-resistingframes and shearwalls. Each node in this analog represents a point on a rafter/truss at the eaveline of the building. The analog is loaded by applying concentrated loads to these nodes.
Because of the location of the nodes, the applied loads are referred to as eave loads. This model
is popular because: (1) it is simple, and (2) solutions have been tabulated for situations in whichall diaphragms in a building have the same ch, and all frames the same k. For discussion
purposes, analogs like the one in figure 1b will be referred to as Level I analogs.
Level I analogs treat diaphragm sections as individual entities that are connected only at rafters(or trusses) as shown in figures7a and 7b. This implies that all shear transferred between adjacent
diaphragm sections goes through the rafter. In reality, the only time that all load is transferred
through a rafter is when all four of the following characteristics are simultaneously present: (1)all purlins end at the rafter, (2) special hardware is not used to bridge the ends of purlins at the
rafter, (3) individual metal panels are not connected to purlins on both sides of the same rafter,
and (4) individual panels are not connected with seam fasteners. Anytime that (1) purlins withinthe same row are directly connected or connected to the same metal panel, or (2) seam fasteners
are used, or (3) some the purlins are continuous at the rafter, there will be shear transfer “around”
rafters due to panel/purlin continuity.
8/9/2019 ASAE-994204-Thoughts on Diaphragm Action
http://slidepdf.com/reader/full/asae-994204-thoughts-on-diaphragm-action 11/34
10
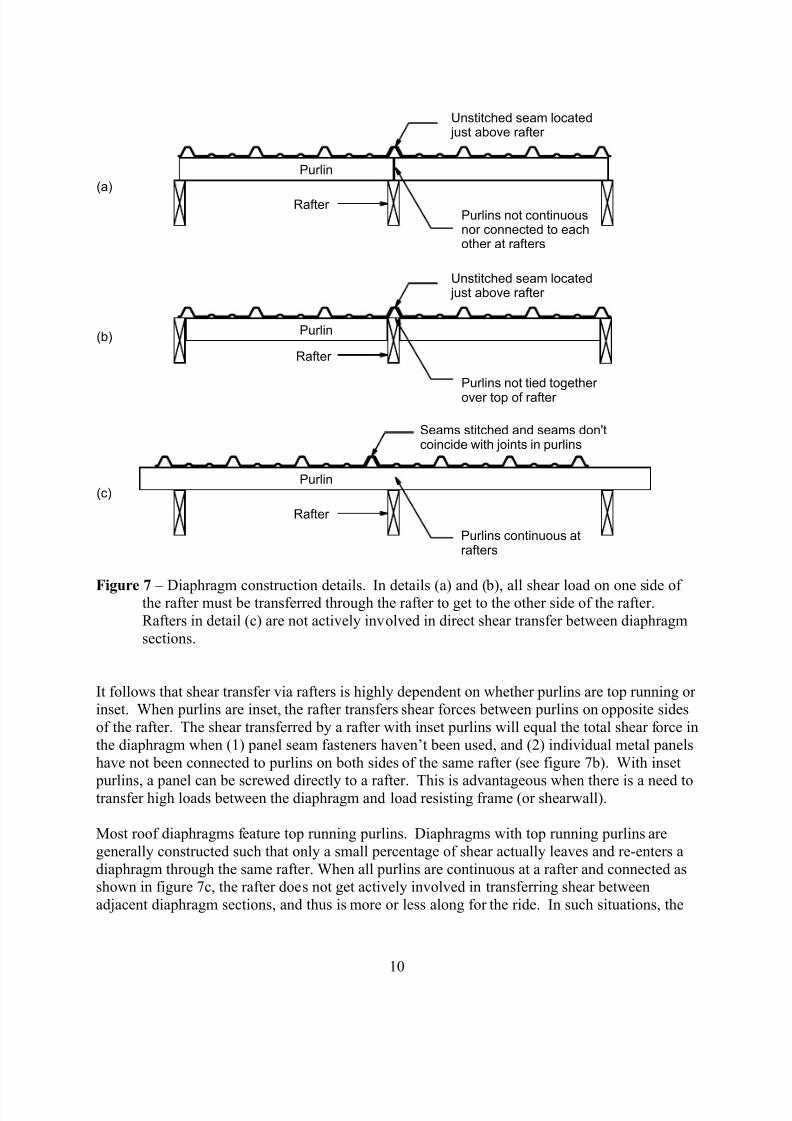
Figure 7 – Diaphragm construction details. In details (a) and (b), all shear load on one side ofthe rafter must be transferred through the rafter to get to the other side of the rafter.
Rafters in detail (c) are not actively involved in direct shear transfer between diaphragm
sections.
It follows that shear transfer via rafters is highly dependent on whether purlins are top running orinset. When purlins are inset, the rafter transfers shear forces between purlins on opposite sides
of the rafter. The shear transferred by a rafter with inset purlins will equal the total shear force in
the diaphragm when (1) panel seam fasteners haven’t been used, and (2) individual metal panels
have not been connected to purlins on both sides of the same rafter (see figure 7b). With inset
purlins, a panel can be screwed directly to a rafter. This is advantageous when there is a need totransfer high loads between the diaphragm and load resisting frame (or shearwall).
Most roof diaphragms feature top running purlins. Diaphragms with top running purlins are
generally constructed such that only a small percentage of shear actually leaves and re-enters a
diaphragm through the same rafter. When all purlins are continuous at a rafter and connected asshown in figure 7c, the rafter does not get actively involved in transferring shear between
adjacent diaphragm sections, and thus is more or less along for the ride. In such situations, the
Purlins not continuousnor connected to eachother at rafters
Unstitched seam located just above rafter
Rafter
Purlin
Purlins not tied togetherover top of rafter
Unstitched seam located just above rafter
Rafter
Purlin
Purlins continuous atrafters
Seams stitched and seams don'tcoincide with joints in purlins
Rafter
Purlin
(a)
(b)
(c)

8/9/2019 ASAE-994204-Thoughts on Diaphragm Action
http://slidepdf.com/reader/full/asae-994204-thoughts-on-diaphragm-action 12/34
11
only significant function of the purlin-to-rafter fasteners is to transfer shear load from the load
resisting frame (or shearwall) into or out of the diaphragm. Statics dictates that the total sheartransferred by the purlin-to-rafter fasteners equal the difference in the shear forces carried by the
two adjacent diaphragm sections. Note that this total fastener shear force is generally
considerable less than the actual total shear force being transferred by either of the diaphragm
sections.
From the previous discussion it can be concluded that the applicability of the Level I analog is
highly dependent on the role of rafters in the transfer of shear from diaphragm section todiaphragm section. When diaphragms are constructed as shown in figures 7a and 7b, thereby
forcing rafters to transfer 100% of the shear load between adjacent diaphragm sections, then the
Level I analog is a fitting model. When diaphragms are constructed such that rafters playvirtually no part in the transfer of load between adjacent diaphragms sections, then analogs like
the one in figure 8 may be more appropriate. This analog, herein referred to as a Level II analog,
contains “cladding” nodes and special connector elements. Cladding nodes represent points onthe metal cladding at locations just above the rafter nodes. Each pair of cladding and rafter
nodes is connected with a connector element. This element accounts for the deformation thatoccurs between a rafter and adjacent cladding when load is transferred between the diaphragm
and the frame/shearwall. It’s also important to note that elements used to model diaphragmsections are connected to cladding nodes and not rafter nodes. This enables direct transfer of
load between diaphragm sections without involvement of frames/shearwalls. For additional
discussion on the Level II Analog, see Anderson (1990).
Figure 8 – Strucutural analog that isolates deformation due to load transfer between frames and
diaphragms.
Once an analog has been selected, a stiffness value must be assigned to each element (i.e.,
spring) in the model. As previously noted, the stiffness value for elements that representdiaphragm sections are generally based on laboratory tests conducted in accordance with ASAE
EP558. During these tests, assemblies are loaded through their rafters and supported by their
rafters, and displacement gages are located to monitor rafter movement (see figure 2). This
k1 k2 k3 k4 k5
ch1 ch2 ch3 ch4
r 1 r 2 r 3 r 4 r 5
kC1 kC2 kC3 kC4 kC5
rafter node
cladding node
8/9/2019 ASAE-994204-Thoughts on Diaphragm Action
http://slidepdf.com/reader/full/asae-994204-thoughts-on-diaphragm-action 13/34
12
means that (1) each rafter handles the same total shear load that is transferred through the
diaphragm, and (2) the adjusted load-point displacement includes the deformation associatedwith the transfer of shear between rafters and the plane of shear resistance in the diaphragm.
Basing the stiffness value for the diaphragm element on such an adjusted load point deflection, is
really only appropriate when a diaphragm is constructed as shown in figures 7a and 7b, in which
case a Level I analog can used for analysis.
When a Level II analog is used, the stiffness assigned to the diaphragm element should not
account for deformations associated with the transfer of shear between a rafter and the plane ofshear resistance in the diaphragm. This deformation is accounted for with the special connector
element.
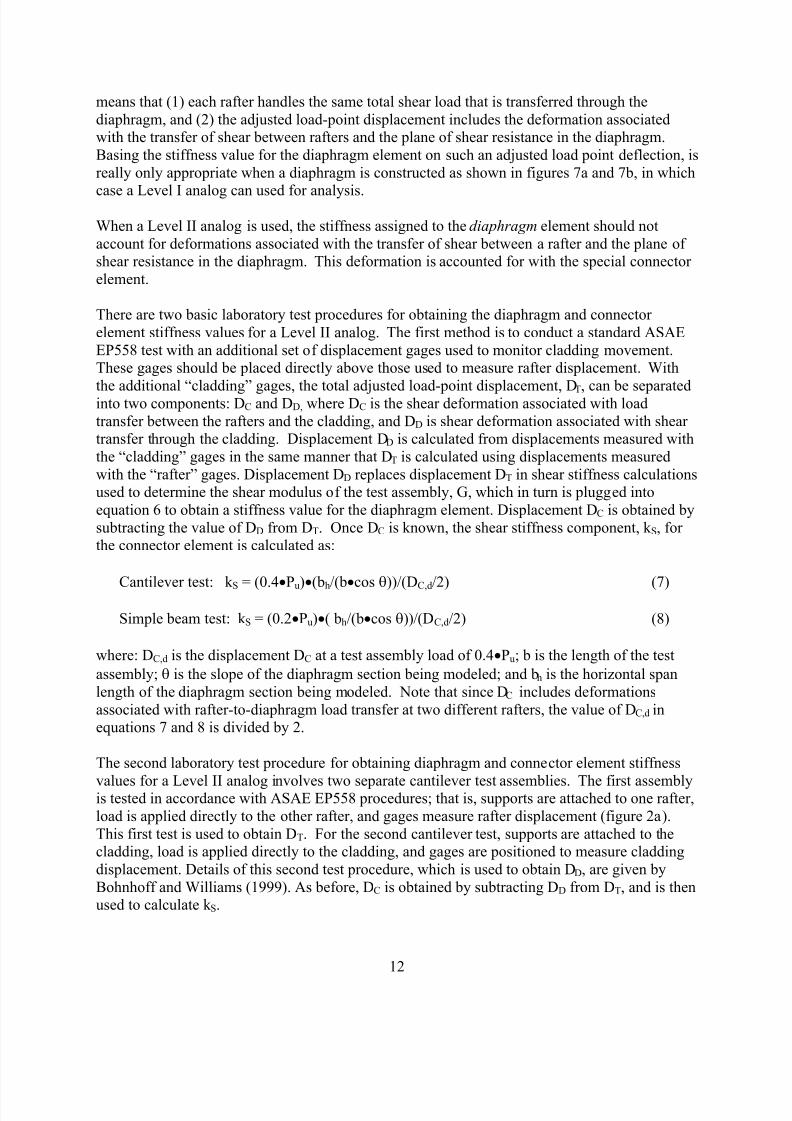
There are two basic laboratory test procedures for obtaining the diaphragm and connector
element stiffness values for a Level II analog. The first method is to conduct a standard ASAE
EP558 test with an additional set of displacement gages used to monitor cladding movement.These gages should be placed directly above those used to measure rafter displacement. With
the additional “cladding” gages, the total adjusted load-point displacement, DT, can be separatedinto two components: DC and DD, where DC is the shear deformation associated with load
transfer between the rafters and the cladding, and DD is shear deformation associated with sheartransfer through the cladding. Displacement DD is calculated from displacements measured with
the “cladding” gages in the same manner that DT is calculated using displacements measured
with the “rafter” gages. Displacement DD replaces displacement DT in shear stiffness calculationsused to determine the shear modulus of the test assembly, G, which in turn is plugged into
equation 6 to obtain a stiffness value for the diaphragm element. Displacement DC is obtained by
subtracting the value of DD from DT. Once DC is known, the shear stiffness component, k S, forthe connector element is calculated as:
Cantilever test: k S = (0.4•Pu)
•(bh/(b
•cos
θ))/(DC,d/2) (7)
Simple beam test: k S = (0.2•Pu)•( bh/(b•cos θ))/(DC,d/2) (8)
where: DC,d is the displacement DC at a test assembly load of 0.4•Pu; b is the length of the test
assembly; θ is the slope of the diaphragm section being modeled; and bh is the horizontal span
length of the diaphragm section being modeled. Note that since DC includes deformations
associated with rafter-to-diaphragm load transfer at two different rafters, the value of DC,d inequations 7 and 8 is divided by 2.
The second laboratory test procedure for obtaining diaphragm and connector element stiffness
values for a Level II analog involves two separate cantilever test assemblies. The first assemblyis tested in accordance with ASAE EP558 procedures; that is, supports are attached to one rafter,
load is applied directly to the other rafter, and gages measure rafter displacement (figure 2a).
This first test is used to obtain DT. For the second cantilever test, supports are attached to thecladding, load is applied directly to the cladding, and gages are positioned to measure cladding
displacement. Details of this second test procedure, which is used to obtain DD, are given by
Bohnhoff and Williams (1999). As before, DC is obtained by subtracting DD from DT, and is thenused to calculate k S.

8/9/2019 ASAE-994204-Thoughts on Diaphragm Action
http://slidepdf.com/reader/full/asae-994204-thoughts-on-diaphragm-action 14/34
13
Figure 9 – Representation of rafter-to-diaphragm connections.
As shown in figure 9, the components involved in the transfer of load between a rafter and a
diaphragm can be represented by two series of springs placed perpendicular to each other. Thefirst series of springs is orientated parallel to the rafter and diaphragm, and enables the transfer of
shear force between the two components. The total stiffness of these springs is equal to the
previously defined stiffness, k S (see equations 7 and 8). The second series of springs is oriented
normal to the rafter and diaphragm. These springs enable the transfer of normal force betweenthe components. The sum of the stiffness of these springs will be represented with the variable
k A (i.e., stiffness k A is the ratio of the total load acting normal to a diaphragm to the change in
spacing between the cladding and rafter). When using a Level II analog, the horizontal stiffness,k C, of the connector element is equal to k S when the diaphragm is horizontal, and equal to k A
when the diaphragm is vertical. For a diaphragm at a slope θ, k C is calculated as:
k C = k A•k S/(k A•cos2θ + k S•sin
2θ) (9)
The derivation of this equation is given in Appendix A. If k A is set equal to k S, then k A = k S = k C
for all values of θ. For most construction, especially that involving top running purlins, k A can
be expected to be considerably larger than k S. In such buildings it is probably easiest to assume
that k A is infinite in which case equation 9 reduces to:
k C = k S/cos2θ (10)
To demonstrate the difference between Level I and II analogs, both were used to determine the
load distribution in the same 6-bay post-frame building. For both analyses, frame stiffness was
set equal to 400 lbs/inch, endwall stiffness was fixed at 4000 lbs/inch, an eave load of 500 lbs
Wall
Rafter
θ
Diaphragm
Total stiffness of springsnormal to rafter = k A
Total stiffness of springsparallel to rafter = kS

8/9/2019 ASAE-994204-Thoughts on Diaphragm Action
http://slidepdf.com/reader/full/asae-994204-thoughts-on-diaphragm-action 15/34
14
was applied to each endwall, and a 1000 lbs eave load was applied to each of the five interior
load resisting frames. For the Level I analog, horizontal stiffness, ch1, of each diaphragm sectionwas set equal to 4630 lbs/in. For the Level II analog, horizontal stiffness, ch2, of each diaphragm
section was set equal to 11000 lbs/in, and the stiffness, k C, of each connector element was fixed
at 16,000 lbs/in. Horizontal stiffness values ch1 and ch2 were based on modeling and laboratory
tests conducted on 9- by 20-ft diaphragms by Williams (1999). The value for k C was obtained bysetting it equal to k S, which in turn, was obtained using the following relationship:
k S = 2/(1/ch1 – 1/ch2) (11)
Table 1 contains a comparison of horizontal displacements and frame forces from the two
analyses. Figure 10 contains a plot of the displacements. When comparing these predictions, itis important to keep in mind that they represent different assumptions regarding load transfer at
rafters, which in turn affects how diaphragm test assembly data is interpreted and applied. Given
that the values predicted using the two different analogs differ by more than 15% for the middleframe (i.e., frame 3), it could be concluded that the assumption regarding load transfer at rafters
is indeed significant. Of some concern is the fact that implicit in the current design procedure(i.e., ASAE EP484) is an assumption of diaphragm section isolation (see figures 7a and 7b) that
does not exist in most designs. This fact combined with the significant affect of this assumptionsuggests that some adjustment should be made to the current procedure. In lieu of switching to
the slightly more complex Level II analog (which gets confusing when ceiling diaphragms are
added), the Level I analog could still be used along with more realistic diaphragm stiffnessvalues (i.e., values that do not account for the flexibility of two rafter-to-diaphragm connections).
Table 1 – Comparison of Level I and Level II Analog Output
Horizontal Displacements, inchesLoad Resisted by
Frame/Endwall, lbsLocation Rafters inAnalog I
Rafters inAnalog II
Cladding inAnalog II
Analog I Analog II
Endwalls 0.509 0.531 0.632 2035 2120
Frames 1 and 5 0.840 0.821 0.779 336 329
Frames 2 and 4 1.028 0.906 0.866 441 362
Frame 3 1.089 0.934 0.895 436 373

8/9/2019 ASAE-994204-Thoughts on Diaphragm Action
http://slidepdf.com/reader/full/asae-994204-thoughts-on-diaphragm-action 16/34
15
Figure 10 – Eave displacements of a 6 bay post-frame building as predicted using Level I and II
analogs.
With a Level II analog, there is a choice as to where to apply eave loads, that is, loads can be
applied to cladding or rafter nodes. There is little doubt that loads that act on walls should beapplied to rafter nodes. Less obvious is where to apply roof loads. Simply stated, when loads
act normal to a roof (e.g. wind loads), their horizontal component should be applied to the rafter
nodes. This is because statics dictates that loads acting normal to individual diaphragm sectionsare transferred directly into rafters. It is in the rafters that the unbalance of horizontal forces
between individual walls and diaphragm sections is resolved into a single horizontal component
that dictates rafter movement. If the movement of the rafter is resisted by individual diaphragms,then shear forces will be induced in rafter-to-diaphragm connections. It follows that if
diaphragms have no in-plane shear stiffness, then there will be no shear transfer (or shear slip)
between the diaphragms and the rafter. Note that the only way that this zero connector shearforce is reflected with the Level II analog is when the roof load is applied to the rafter nodes. If
the diaphragms have in-plane stiffness but the frame that comprises the rafter has no lateral
stiffness, then the entire net horizontal force in the rafter will be transferred into the adjacent
diaphragms. Again, the only way that this can be reflected with the Level II analog is when theroof load is applied to the rafter nodes. For additional discussion on this subject, see Anderson
(1990).
0
0.2
0.4
0.6
0.8
1
1.2
0 1 2 3 4 5 6
Frame Number
H o r i z o n t a l D i s p l a c m
e n t , i n c h e s
Rafters - Level I Analog
Rafters - Level II Analog
Cladding - Level II Analog
8/9/2019 ASAE-994204-Thoughts on Diaphragm Action
http://slidepdf.com/reader/full/asae-994204-thoughts-on-diaphragm-action 17/34
16
Chord Force Calculations
The term chord force is used to refer to the axial force in purlins and girts. The chord forces of
interest in any structure are those associated with edge members in diaphragms and shearwalls.
The magnitude of chord forces in these members is dependent on many different factors. Threeof these factors: metal cladding characteristics, chord force distribution, and boundary
conditions, are discussed in the following sections.
Cladding Characteristics
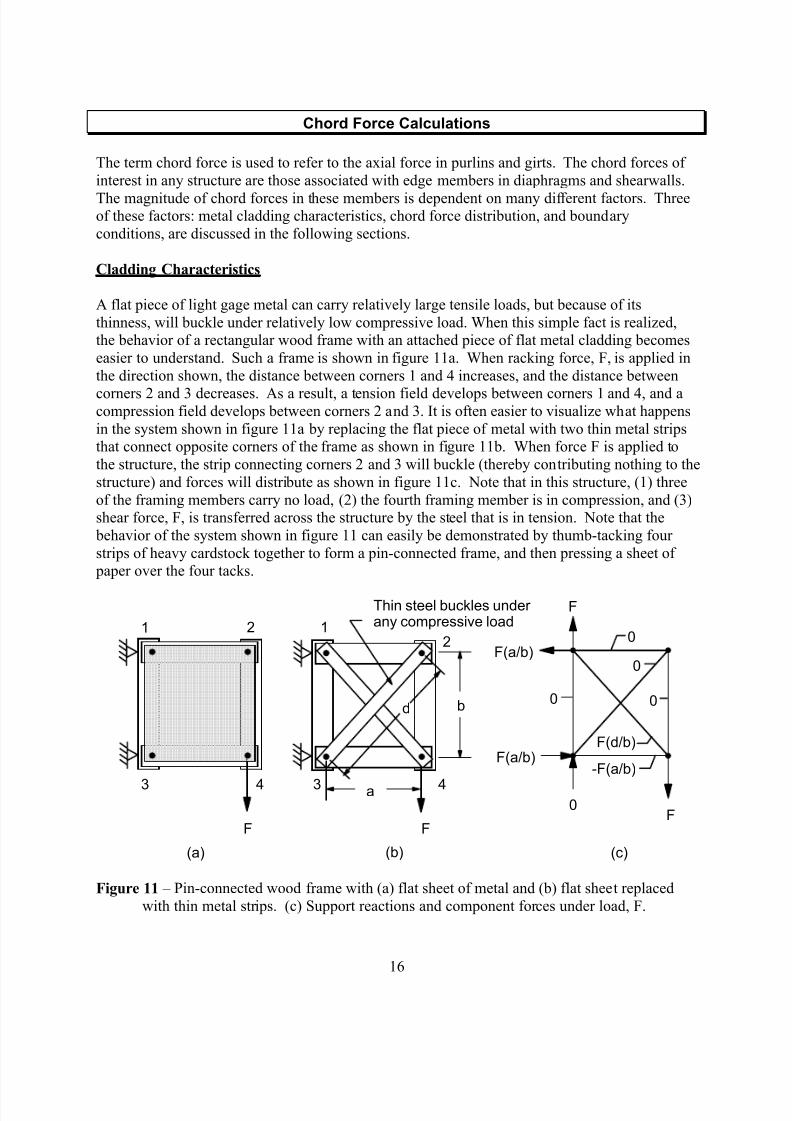
A flat piece of light gage metal can carry relatively large tensile loads, but because of its
thinness, will buckle under relatively low compressive load. When this simple fact is realized,the behavior of a rectangular wood frame with an attached piece of flat metal cladding becomes
easier to understand. Such a frame is shown in figure 11a. When racking force, F, is applied in
the direction shown, the distance between corners 1 and 4 increases, and the distance between
corners 2 and 3 decreases. As a result, a tension field develops between corners 1 and 4, and acompression field develops between corners 2 and 3. It is often easier to visualize what happens
in the system shown in figure 11a by replacing the flat piece of metal with two thin metal stripsthat connect opposite corners of the frame as shown in figure 11b. When force F is applied to
the structure, the strip connecting corners 2 and 3 will buckle (thereby contributing nothing to the
structure) and forces will distribute as shown in figure 11c. Note that in this structure, (1) three
of the framing members carry no load, (2) the fourth framing member is in compression, and (3)shear force, F, is transferred across the structure by the steel that is in tension. Note that the
behavior of the system shown in figure 11 can easily be demonstrated by thumb-tacking four
strips of heavy cardstock together to form a pin-connected frame, and then pressing a sheet of paper over the four tacks.
F
b
a
F
0
0
F
0
0
Thin steel buckles underany compressive load
d
-F(a/b)F(a/b)
F(a/b)
0
F(d/b)
1
F
2
3 4
(a) (b) (c)
12
3 4
Figure 11 – Pin-connected wood frame with (a) flat sheet of metal and (b) flat sheet replaced
with thin metal strips. (c) Support reactions and component forces under load, F.
8/9/2019 ASAE-994204-Thoughts on Diaphragm Action
http://slidepdf.com/reader/full/asae-994204-thoughts-on-diaphragm-action 18/34
17
The behavior of the system shown in figure 11 becomes more complex when the flat sheet of
light-gage metal is replaced with a sheet of light-gage, corrugated metal. To begin with,corrugated metal behaves like an orthotropic material. An orthotropic material is a material in
which strength and stiffness not only vary with the angle of loading, but the principal axes (i.e.,
the axes associated with extreme values of strength and stiffness) are also mutually
perpendicular. In the case of corrugated metal, stiffness properties are highly dependent on loaddirection with respect to the corrugations. When comparing a corrugated metal sheet with the
flat metal sheet from which it was fabricated, the following can be stated:
1. The stiffness in tension parallel-to-the-corrugations is the same as the stiffness in tension ofthe flat sheet,
2. The stiffness in tension perpendicular-to-the corrugations is considerably less than the
stiffness in tension of the flat sheet,3. The stiffness in compression parallel-to-the-corrugations is considerably greater than the
stiffness in compression of a flat sheet (this is because the corrugations reduce buckling), and
4. The stiffness in compression perpendicular-to-the corrugations is even less than the alreadylow value associated with the compression stiffness of the flat sheet.
When modeling a corrugated piece of metal with diagonal truss elements (as was done with the
flat sheet in figure 11c), the tensile stiffness of the diagonal truss elements will be considerablyless than that used to model a flat sheet, and the compressive stiffness of the diagonal truss
elements will be greater than that used to model a flat sheet. Because of the substantial decrease
in tensile stiffness of the truss element, there will be a significant increase in the sheardisplacement of a metal-clad wood-frame assembly when a flat sheet is replaced with a
corrugated sheet.
As previously discussed and shown in figure 5, a single diagonal element is generally used to
model corrugated paneling within a single rectangular frame. Stiffness values for the diagonalelement are generally determined from panel shear tests. This procedure is described by Davies
and Bryan (1982) and was used by Keener and Manbeck (1996b) and Williams (1999). In the
simplified model shown in figure 5, the frame members are assumed to be rigid links (i.e., theyare assumed to possess an infinite axial rigidity). Because the stiffness assigned to the diagonal
truss element is generally considerably less than the axial stiffness of framing members, this
assumption does not significantly affect predicted displacements and load distribution.
Chord Force Distribution
The distribution of axial force in diaphragm chords is dependent on many factors, and dependingon the assumptions made by a designer, chord force calculations can produce highly variant
results. To demonstrate this, several basis models were studied and compared.
For the first model, nine of the metal-clad rectangular frames shown in figure 11 were combined
to form a diaphragm assembly three times the length and width of an individual frame. The
model of this assembly is shown in figure 12 along with the boundary conditions (i.e., supportand loading conditions) and resulting forces. In this analysis, (1) all diagonal elements were
assigned the same axial rigidity (A•E), (2) horizontal and vertical elements were assigned axial
rigidity values several orders of magnitude larger than that assigned to the diagonal elements,

8/9/2019 ASAE-994204-Thoughts on Diaphragm Action
http://slidepdf.com/reader/full/asae-994204-thoughts-on-diaphragm-action 19/34
18
Figure 12 - Support reactions and component forces under load F, in an assembly comprised of
nine cladding elements. All elements pin-connected. Vertical and horizontal elementsassumed to have infinite axial stiffness.
and (3) the assembly was loaded so diagonal elements would only be subjected to tensile forces.
With respect to the axial forces in figure 12, it should be noted that negative and positive signsdenote compression and tension forces, respectively.
Based on the forces in figure 12, the following statements can be made:
1. All diagonal elements have the same axial force. This is due to the fact that (1) the total
shear is constant across the assembly, and (2) the rigid elements force all diagonal elementsto have the same displacement.
2. All interior chords are subjected to the same compressive force, which is just a function of
the total shear and aspect ratio of the frame. The interior chord forces are not a function in- plane bending moment.
3. Only edge chords are actively involved in resisting in-plane bending moment. Consequently,
only edge chord forces are affected by a change in in-plane bending moment.4. Supports attached to interior chords are not subjected to horizontal forces.
Figure 13 contains results of a similar, but larger, modeling exercise. The grids in this figure
represent one-half of a roof in a symmetrical building with endwalls, no sidewalls, and a lengthto width ratio of 4 to 1. In this particular case, a 1000 unit force was applied to the center of roof
(200 units to each of the 5 center nodes), resulting in a total shear force of 500 units in each half
of the roof. Two different analyses are represent in figure 13: Analysis A and Analysis B. For
F
F
F ( d / b
)
-F(a/b)-F(a/b) -F(a/b)
-F(a/b)-F(a/b) -F(a/b)
02F(a/b) F(a/b)
-F(a/b)-3F(a/b) -2F(a/b)
F
F
F ( d / b
)
F ( d / b
)
F ( d / b
)
F ( d / b
)
F ( d / b
)
F ( d / b
)
F ( d / b
)
F ( d / b
)
F
F
F
F
F
0
0
0
0
0
0
3F(a/b)
0
0
3F(a/b)
0
F
F
F

8/9/2019 ASAE-994204-Thoughts on Diaphragm Action
http://slidepdf.com/reader/full/asae-994204-thoughts-on-diaphragm-action 20/34
19
Analysis A, a single diagonal element was used to represent the cladding within each frame, and
the roof was loaded so that these diagonal elements were placed in tension. The axial rigidity ofthese diagonal elements was set equal to 0.01 times that assigned to the rafter and purlin
elements (i.e., vertical and horizontal elements, respectively). For Analysis B, two diagonal
elements were used to represent the cladding within each frame. These diagonal elements were
all assigned the same axial rigidity, a value equal to 0.005 times that assigned to the rafter and purlin elements. Although Analysis B contained twice as many diagonals as Analysis A, its
diagonal elements had half the axial rigidity, which resulted in both models having virtually
identical overall displacements.
The numbers in figures 13a and 13b reinforce the previous observation that in-plane bending
moments are resisted almost entirely by axial forces in the two edge purlins. In figure 13a, theinterior purlins carry the compressive forces predicted by the crude model in figure 12.
However, when diagonal elements were added to the model (Analysis B), the compressive forces
carried by the purlins was transferred instead by the diagonal elements.
The principal reason for edge purlins resisting virtually all of the in-plane bending moment in the previous models is due to the high ratio of rafter/purlin-to-diagonal element stiffness. To
demonstrate this fact, two additional analyses were conducted: Analysis C and Analysis D.Analysis C is identical to Analysis A with the exception that the axial rigidity of the diagonal
elements was increased 100 times. Likewise, Analysis D is identical to Analysis B with the axial
rigidity of the diagonal elements increased 100 times.
Results from Analyses C and D are given in figure 14. It is evident that as the stiffness of the
diagonal elements is increased (i.e., the shear stiffness of the cladding is increased) interior purlins get more involved in resisting in-plane bending moments. With respect to the number in
figure 14, it can be argued that the distribution of purlin forces from edge purlin to edge purlin isalmost linear.
Whether or not (1) edge members resist virtually all of the in-plane bending moment in adiaphragm, or (2) a linear distribution of axial forces exists in chords between edge members
(thereby ensuring that a good portion of in-plane bending moment is handled by interior chords),
is a question that has been a matter of considerable recent discussion in the design community.
In reality, the distribution of chord forces lies somewhere in between these two extremes, exactlywhere being dependent on specifics of the design and on the magnitude of the applied load
(Note: at higher load levels, load distributions change due to geometric and material
nonlinearities). Presently, there is very little research data to support one specific design procedure/assumption. The most extensive investigation of chord forces was by Niu and
Gebremedhin (1997) who strain gaged purlins in a full-scale building and in a diaphragm test
assembly. The data collected in this study does not strongly support any particular hypothesesregarding chord force distribution. The only other research of significance to chord force
distribution was the comprehensive finite element analyses of diaphragm assemblies by Wright
(1992) and Williams (1999). Both of these researchers found that in-plane bending moment intheir models was resisted almost entirely by the edge purlins.

8/9/2019 ASAE-994204-Thoughts on Diaphragm Action
http://slidepdf.com/reader/full/asae-994204-thoughts-on-diaphragm-action 21/34
20
Figure 13 – Purlin chord forces from (a) Analysis A, and (b) Analysis B of a building with a 4:1length-to-width ratio. Diagrams show only one-half the roof.
0 117 236 355 475 597 720 844
-121 -242 -363 -483 -604 -725 -847 -969
-130 -130 -129 -129 -128 -127 -126 -125
-117 -106 -94 -85 -76 -70 -66 -66
-131 -140 -150 -159 -167 -174 -180 -183
1000 units of force applied on total structure
(200 units per node)
Analysis A:
1. Axial Rigidity of Diagonal Elements = (Axial Rigidity of Other Elements)/100
2. Diagonal Elements Can Only Resist Tension Loads
1 unit
typ.
1 unittyp.
60 179 298 418 539 660 783 906
-60 -179 -298 -418 -539 -660 -783 -906
0 0 0 0 0 0 0 0
6 17 27 37 45 52 57 60
-6 -17 -27 -37 -45 -52 -57 -60
1000 units of force applied on total structure
(200 units per node)
Analysis B:
1. Axial Rigidity of Diagonal Elements = (Axial Rigidity of Other Elements)/200
2. Diagonal Elements Handle Both Compression and Tension
1 unittyp.
1 unit
typ.
(a)
(b)

8/9/2019 ASAE-994204-Thoughts on Diaphragm Action
http://slidepdf.com/reader/full/asae-994204-thoughts-on-diaphragm-action 22/34
21
Figure 14 – Purlin chord forces from (a) Analysis C, and (b) Analysis D of a building with a 4:1length-to-width ratio. Diagrams show only one-half the roof.
0 43 121 216 320 435 568 736
-171 -283 -382 -472 -551 -614 -657 -697
-116 -89 -74 -76 -90 -118 -163 -193
-43 -5 43 91 133 163 166 107
-170 -166 -208 -259 -312 -366 -413 -453
1000 units of force applied on total structure
(200 units per node)
Analysis C:
1. Axial Rigidity of Diagonal Elements = Axial Rigidity of Other Elements
2. Diagonal Elements Can Only Resist Tension Loads
1 unittyp.
1 unittyp.
49 133 221 310 398 488 580 678
-44 -133 -221 -310 -398 -488 -580 -678
0 0 0 0 0 0 0 0
22 66 110 154 198 240 278 283
-22 -66 -110 -154 -198 -240 -278 -283
1000 units of force applied on total structure
(200 units per node)
Analysis D:
1. Axial Rigidity of Diagonal Elements = (Axial Rigidity of Other Elements)/2
2. Diagonal Elements Handle Both Compression and Tension
1 unittyp.
1 unittyp.
(a)
(b)

8/9/2019 ASAE-994204-Thoughts on Diaphragm Action
http://slidepdf.com/reader/full/asae-994204-thoughts-on-diaphragm-action 23/34
22
The current ASAE diaphragm design procedure (ASAE EP484) assumes that edge members actalone in resisting in-plane bending moments. Under this assumption, the axial force, P, in an
edge member is obtained as:
P = M/b (12)
where: M is the total in-plane bending moment; and b is the distance between the edge members.
More recently, a growing number of practicing engineers have begun designing under the
assumption of a linear distribution of chord forces between edge members. This is largely due to
an article published by Pollock, Bender and Gebremedhin (1996). The assumption of a lineardistribution of chord forces has existed for some time, and was applied by some post-frame
building engineers prior to 1990. Engineers designing metal-clad metal -framed diaphragms have
traditionally assumed a linear distribution of chord forces between edge members (Bryan and El-Dakhakhni, 1968; Bryan and Davies, 1982). Unfortunately, it would appear that these engineers
have never investigated the validity of the assumption.
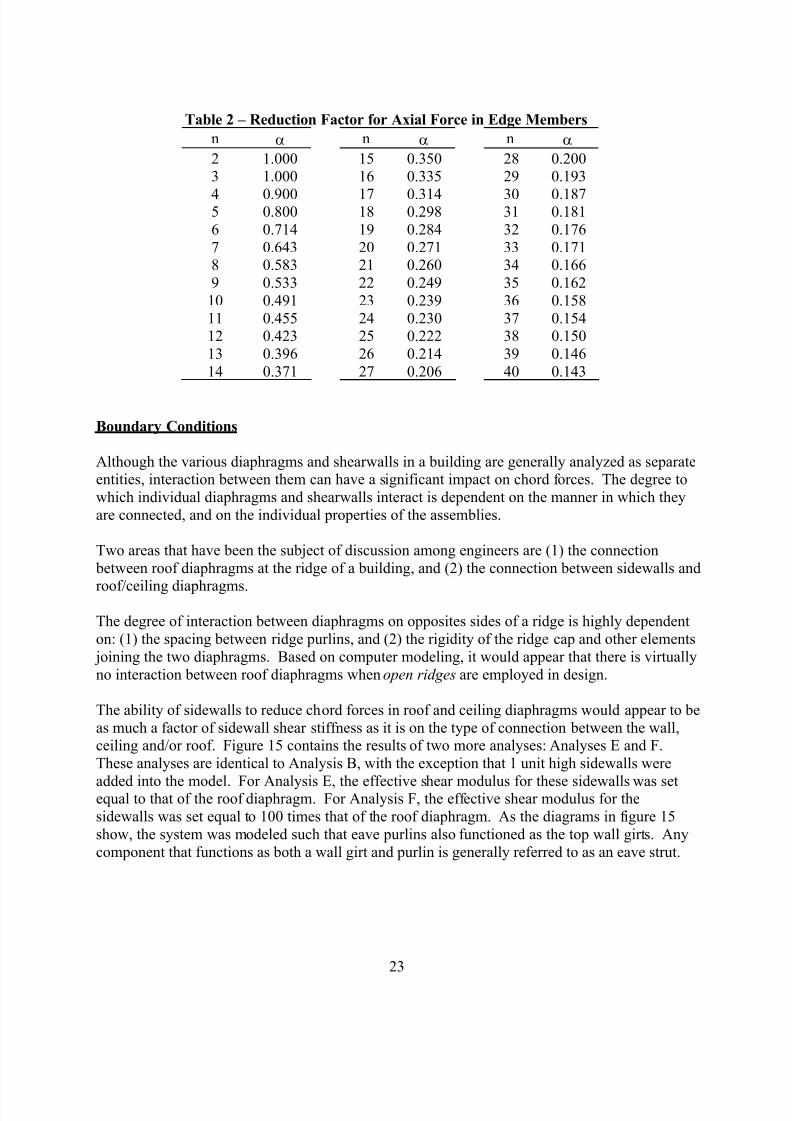
When a linear distribution of chord forces is assumed to exist between edge members, themaximum axial force in an edge member, P, is calculated as:
P = M•α/b (13)
where: M is the total in-plane bending moment; b is the distance between the edge members, and
α is a reduction factor that accounts for the total number of chord rows. The value of α is
calculated using the following formulas:
(n – 1 )
2
α = n/2
Σ (n - 2•i + 1)2
i=1
when n is even (14)
(n – 1 )
2
α = (n-1)/2
Σ (n - 2•i + 1)2
i=1
when n is odd (15)
where: n is the number of chord rows, including the two rows of edge members. Values for α
for different values of n are given in Table 2. This table is an expanded form of those published by Bryan and El-Dakhakhni (1968) and Bryan and Davies (1982).
8/9/2019 ASAE-994204-Thoughts on Diaphragm Action
http://slidepdf.com/reader/full/asae-994204-thoughts-on-diaphragm-action 24/34
23
Table 2 – Reduction Factor for Axial Force in Edge Members
n α n α n α
2 1.000 15 0.350 28 0.2003 1.000 16 0.335 29 0.193
4 0.900 17 0.314 30 0.1875 0.800 18 0.298 31 0.181
6 0.714 19 0.284 32 0.176
7 0.643 20 0.271 33 0.1718 0.583 21 0.260 34 0.166
9 0.533 22 0.249 35 0.162
10 0.491 23 0.239 36 0.158
11 0.455 24 0.230 37 0.15412 0.423 25 0.222 38 0.150
13 0.396 26 0.214 39 0.146
14 0.371 27 0.206 40 0.143
Boundary Conditions
Although the various diaphragms and shearwalls in a building are generally analyzed as separateentities, interaction between them can have a significant impact on chord forces. The degree to
which individual diaphragms and shearwalls interact is dependent on the manner in which they
are connected, and on the individual properties of the assemblies.
Two areas that have been the subject of discussion among engineers are (1) the connection
between roof diaphragms at the ridge of a building, and (2) the connection between sidewalls and
roof/ceiling diaphragms.
The degree of interaction between diaphragms on opposites sides of a ridge is highly dependent
on: (1) the spacing between ridge purlins, and (2) the rigidity of the ridge cap and other elements
joining the two diaphragms. Based on computer modeling, it would appear that there is virtually
no interaction between roof diaphragms when open ridges are employed in design.
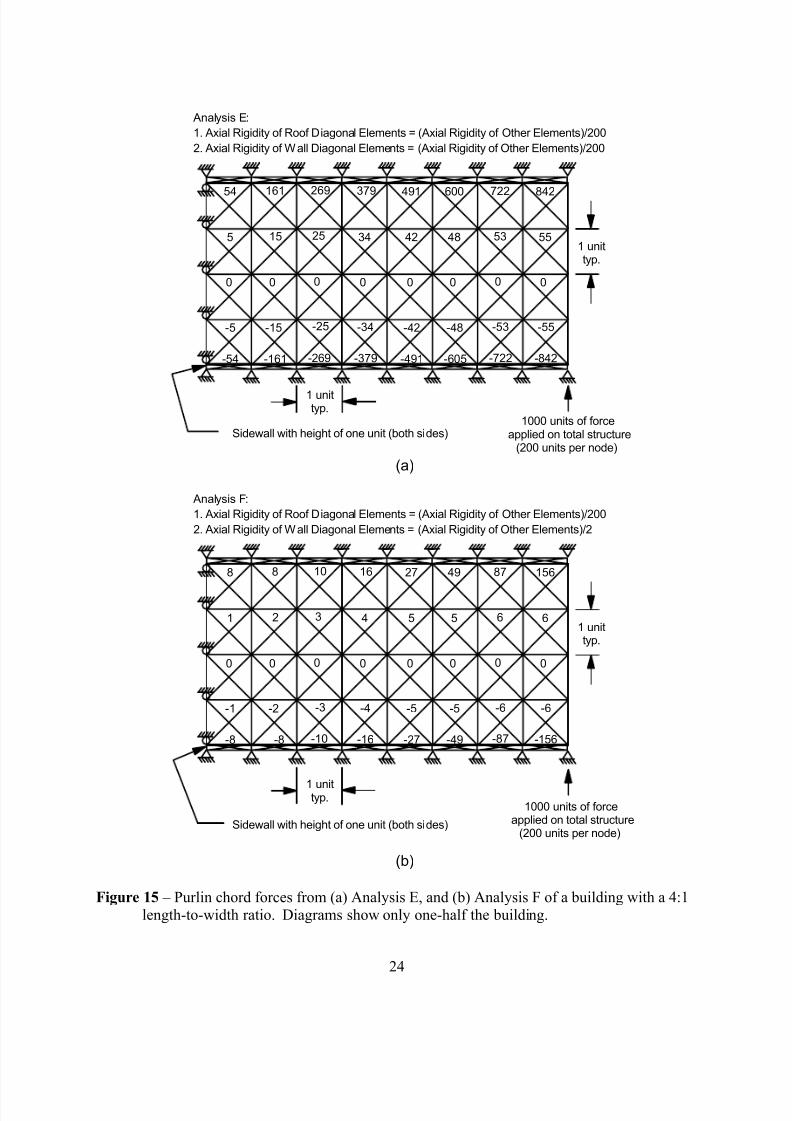
The ability of sidewalls to reduce chord forces in roof and ceiling diaphragms would appear to be
as much a factor of sidewall shear stiffness as it is on the type of connection between the wall,ceiling and/or roof. Figure 15 contains the results of two more analyses: Analyses E and F.
These analyses are identical to Analysis B, with the exception that 1 unit high sidewalls were
added into the model. For Analysis E, the effective shear modulus for these sidewalls was setequal to that of the roof diaphragm. For Analysis F, the effective shear modulus for the
sidewalls was set equal to 100 times that of the roof diaphragm. As the diagrams in figure 15
show, the system was modeled such that eave purlins also functioned as the top wall girts. Any
component that functions as both a wall girt and purlin is generally referred to as an eave strut.
8/9/2019 ASAE-994204-Thoughts on Diaphragm Action
http://slidepdf.com/reader/full/asae-994204-thoughts-on-diaphragm-action 25/34
24
Figure 15 – Purlin chord forces from (a) Analysis E, and (b) Analysis F of a building with a 4:1length-to-width ratio. Diagrams show only one-half the building.
54 161 269 379 491 600 722 842
-54 -161 -269 -379 -491 -605 -722 -842
0 0 0 0 0 0 0 0
5 15 25 34 42 48 53 55
-5 -15 -25 -34 -42 -48 -53 -55
1000 units of force applied on total structure
(200 units per node)
1 unittyp.
1 unittyp.
8 8 10 16 27 49 87 156
-8 -8 -10 -16 -27 -49 -87 -156
0 0 0 0 0 0 0 0
1 2 3 4 5 5 6 6
-1 -2 -3 -4 -5 -5 -6 -6
1000 units of force applied on total structure
(200 units per node)
Analysis F:
1. Axial Rigidity of Roof Diagonal Elements = (Axial Rigidity of Other Elements)/200
2. Axial Rigidity of Wall Diagonal Elements = (Axial Rigidity of Other Elements)/2
1 unittyp.
1 unittyp.
Analysis E:
1. Axial Rigidity of Roof Diagonal Elements = (Axial Rigidity of Other Elements)/200
2. Axial Rigidity of Wall Diagonal Elements = (Axial Rigidity of Other Elements)/200
Sidewall with height of one unit (both sides)
Sidewall with height of one unit (both sides)
(a)
(b)

8/9/2019 ASAE-994204-Thoughts on Diaphragm Action
http://slidepdf.com/reader/full/asae-994204-thoughts-on-diaphragm-action 26/34
25
A comparison of the chord forces in figures 13b and 15 shows that eave purlin chord forces were
reduced about 8% with the addition of sidewalls with an effective shear modulus equal to that ofthe roof diaphragm. When sidewall stiffness was increased 100 times, eave purlin chord forces
were reduced by more than 80 %. Based on these percentages, one is led to conclude that when
properly designed, sidewalls can be used to effectively reduce chord forces. As the last analysis
suggests (i.e., Analysis G in figure 16), stiffening only a small section of a sidewall couldsignificantly impact eave purlin chord forces. For Analysis G, all sidewall panels were removed
except those adjacent to the endwall, which were assigned a very high stiffness.
Figure 16 – Purlin chord forces from Analysis G, of a building with a 4:1 length-to-width ratio.
Diagrams show only one-half the building.
Summary
When considered collectively, Analyses A through G begin to demonstrate the complexities
surrounding chord force calculations. The word “begin” is emphasized in the previous sentence
because the models used were very simplistic; they did not account for the deformation ofconnectors between elements, nor the non-linear behavior of various elements. In reality, high
component loads often result in considerable deformation of connections, and this deformation
results in significant load redistribution. It is also important to note that to obtain a lineardistribution of chord forces between edge members, diagonal elements were assigned what could
be considered unrealistically high axial stiffness values. For this reason, equation 13, along with
the values in Table 2, should be applied with extreme caution.
-114 -185 -62 61 183 306 430 554
114 185 62 -61 -183 -306 -430 -554
0 0 0 0 0 0 0 0
2 6 10 14 19 22 25 27
-2 -6 -10 -14 -19 -22 -25 -27
1000 units of force
applied on total structure(200 units per node)
1 unittyp.
1 unittyp.
Analysis G:
1. Axial Rigidity of Roof Diagonal Elements = (Axial Rigidity of Other Elements)/200
2. Axial Rigidity of Wall Diagonal Elements = (Axial Rigidity of Other Elements)/2
Sidewall with height of one unit (both sides)
8/9/2019 ASAE-994204-Thoughts on Diaphragm Action
http://slidepdf.com/reader/full/asae-994204-thoughts-on-diaphragm-action 27/34
26
Full-Scale Building Test
As is evident from discussion in the previous sections, numerous unanswered questions remain
regarding diaphragm action in metal-clad wood-frame buildings. In an effort to answer some of
these questions, the authors of this paper have submitted proposals for a full-scale building testwith some unique characteristics. Some details of the proposed test follow.
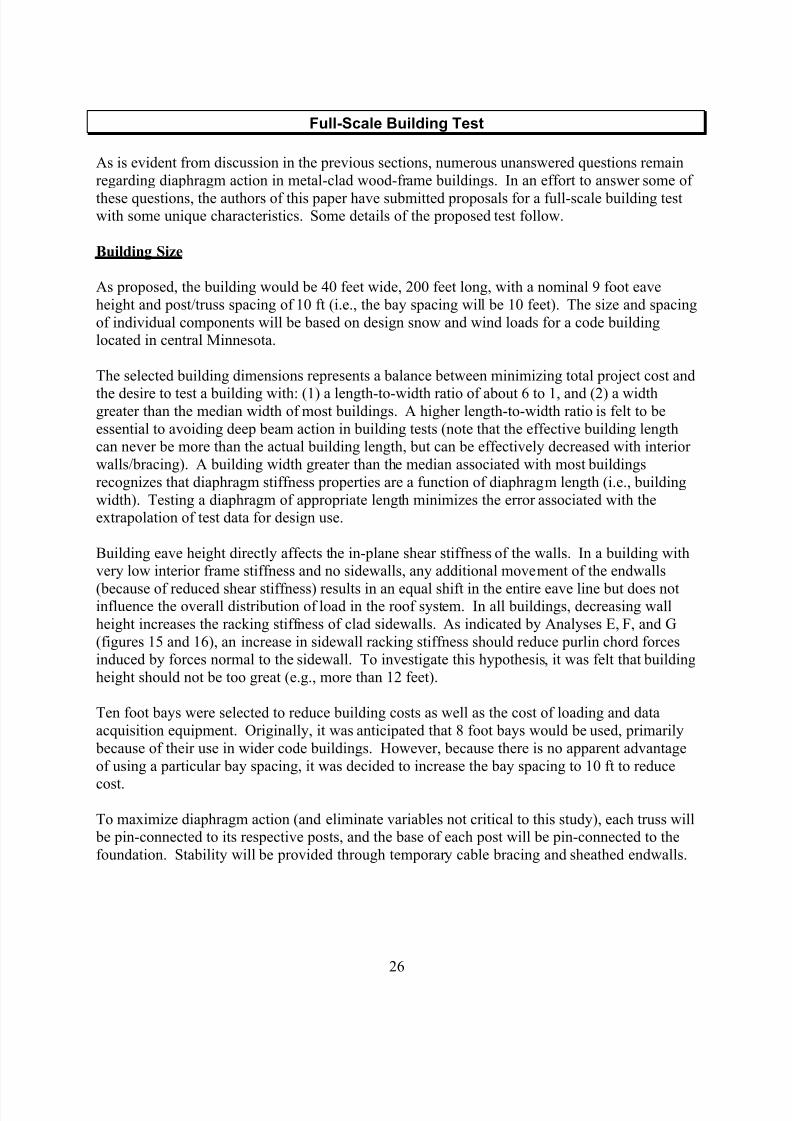
Building Size
As proposed, the building would be 40 feet wide, 200 feet long, with a nominal 9 foot eave
height and post/truss spacing of 10 ft (i.e., the bay spacing will be 10 feet). The size and spacing
of individual components will be based on design snow and wind loads for a code buildinglocated in central Minnesota.
The selected building dimensions represents a balance between minimizing total project cost and
the desire to test a building with: (1) a length-to-width ratio of about 6 to 1, and (2) a widthgreater than the median width of most buildings. A higher length-to-width ratio is felt to be
essential to avoiding deep beam action in building tests (note that the effective building lengthcan never be more than the actual building length, but can be effectively decreased with interior
walls/bracing). A building width greater than the median associated with most buildings
recognizes that diaphragm stiffness properties are a function of diaphragm length (i.e., building
width). Testing a diaphragm of appropriate length minimizes the error associated with theextrapolation of test data for design use.
Building eave height directly affects the in-plane shear stiffness of the walls. In a building withvery low interior frame stiffness and no sidewalls, any additional movement of the endwalls
(because of reduced shear stiffness) results in an equal shift in the entire eave line but does notinfluence the overall distribution of load in the roof system. In all buildings, decreasing wall
height increases the racking stiffness of clad sidewalls. As indicated by Analyses E, F, and G
(figures 15 and 16), an increase in sidewall racking stiffness should reduce purlin chord forcesinduced by forces normal to the sidewall. To investigate this hypothesis, it was felt that building
height should not be too great (e.g., more than 12 feet).
Ten foot bays were selected to reduce building costs as well as the cost of loading and data
acquisition equipment. Originally, it was anticipated that 8 foot bays would be used, primarily
because of their use in wider code buildings. However, because there is no apparent advantage
of using a particular bay spacing, it was decided to increase the bay spacing to 10 ft to reduce
cost.
To maximize diaphragm action (and eliminate variables not critical to this study), each truss will be pin-connected to its respective posts, and the base of each post will be pin-connected to the
foundation. Stability will be provided through temporary cable bracing and sheathed endwalls.

8/9/2019 ASAE-994204-Thoughts on Diaphragm Action
http://slidepdf.com/reader/full/asae-994204-thoughts-on-diaphragm-action 28/34
27
Loading System and Load Application
The building will be loaded using hydraulic cylinders attached to the floor at a location midway
between sidewall posts (i.e., anchor points will be directly below the ridge). With such a system,
the direction of loading on an individual bay (or the entire building) can be quickly reversed.
This is significant and is something that has not been done in any full-scale post-frame buildingtests to date. With the capability of loading in opposite directions: (1) the hysteresis effects
associated with reverse loadings, permanent deformation, and creep can be explored, (2) the
effects of reverse loading on an asymmetric building (e.g., a building with one open and oneclosed sidewall) can be investigated, (3) variability in chord forces due to construction and strain
gage accuracy can be isolated (this can be done by comparing forces in chords on opposite sides
of the building under opposing loads), and (4) long buildings can be loaded so that they behaveas a series of short buildings. The latter is accomplished as shown in figure 17. There are other
ways of loading a long building to assess the behavior of shorter buildings, but these methods
require that each truss be able to transmit the full design load of the roof diaphragm into thediaphragm. To enable this, additional screws would have to be used to attach the cladding at
each truss (such screws could be lumped at the location of each truss-to-purlin connection tolessen their impact on total roof diaphragm behavior).
XX
XX
XX
XX
XX
XX
0 1 2 3 4 5 6 7 8 9 10 11 12 13 14 15 16 17 18 19 20
Figure 17 – Plan view of a 200-foot long building loaded to behave as five individual 40-footlong buildings. This is accomplished by locking frames 0, 4, 8, 12, 16 and 20 (marked
with “X”) from sidesway with cable X-bracing; pulling in one direction on frames 1, 2, 3,
9,10, 11, 17, 18 and 19; and pulling in the opposite direction on frames 5, 6, 7, 13, 14 and15.
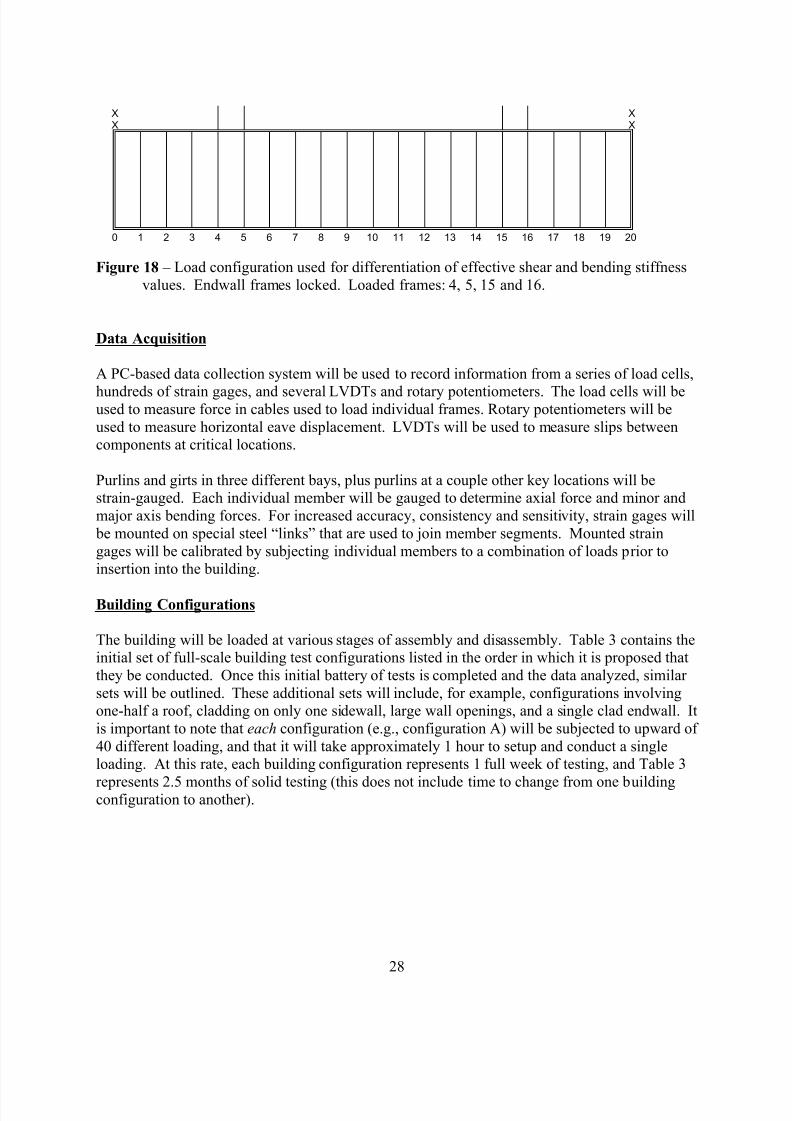
In addition to several load configurations like that shown in figure 17, load configurationssimilar to the one shown in figure 18 will also be used. In figure 18, the endwalls are locked
from movement and two sets of interior frames are loaded. The spacing between these two sets
of loads will be varied (in figure 18 they are 100 feet apart). With this type of loading, the gross
horizontal in-plane bending moment between the two sets of load points is constant and the shearis near zero. The deformation in this region is of interest because it is this deformation that is not
accounted for by current diaphragm design procedures.
8/9/2019 ASAE-994204-Thoughts on Diaphragm Action
http://slidepdf.com/reader/full/asae-994204-thoughts-on-diaphragm-action 29/34
28
XX
XX
0 1 2 3 4 5 6 7 8 9 10 11 12 13 14 15 16 17 18 19 20
Figure 18 – Load configuration used for differentiation of effective shear and bending stiffness
values. Endwall frames locked. Loaded frames: 4, 5, 15 and 16.
Data Acquisition
A PC-based data collection system will be used to record information from a series of load cells,
hundreds of strain gages, and several LVDTs and rotary potentiometers. The load cells will beused to measure force in cables used to load individual frames. Rotary potentiometers will be
used to measure horizontal eave displacement. LVDTs will be used to measure slips betweencomponents at critical locations.
Purlins and girts in three different bays, plus purlins at a couple other key locations will bestrain-gauged. Each individual member will be gauged to determine axial force and minor and
major axis bending forces. For increased accuracy, consistency and sensitivity, strain gages will
be mounted on special steel “links” that are used to join member segments. Mounted strain
gages will be calibrated by subjecting individual members to a combination of loads prior toinsertion into the building.
Building Configurations
The building will be loaded at various stages of assembly and disassembly. Table 3 contains theinitial set of full-scale building test configurations listed in the order in which it is proposed that
they be conducted. Once this initial battery of tests is completed and the data analyzed, similar
sets will be outlined. These additional sets will include, for example, configurations involvingone-half a roof, cladding on only one sidewall, large wall openings, and a single clad endwall. It
is important to note that each configuration (e.g., configuration A) will be subjected to upward of
40 different loading, and that it will take approximately 1 hour to setup and conduct a singleloading. At this rate, each building configuration represents 1 full week of testing, and Table 3
represents 2.5 months of solid testing (this does not include time to change from one buildingconfiguration to another).

8/9/2019 ASAE-994204-Thoughts on Diaphragm Action
http://slidepdf.com/reader/full/asae-994204-thoughts-on-diaphragm-action 30/34
29
Table 3 – Initial Set Of Building Configurations (Listed In Order of Test)Ridge Roof Cladding South Sidewall North Sidewall
BuildingConfig.
IDRegular
w/ Cap
Regular
w/o Cap
RoofHalves
Rigidly
Joined
Extra-Wide
Ridge
Opening
ChordReinforc
ement North
Side
South
SideClad
Over-
hang*Clad
Over-
hang*
Numberof Clad
Endwalls
A - - Yes - Yes Yes Yes No - No - 2
B - - Yes - No Yes Yes No - No - 2
C - Yes - No Yes Yes Yes Yes Yes Yes 2
D - Yes - Yes Yes Yes Yes Yes Yes Yes 2
E - - Yes - Yes Yes Yes Yes No Yes No 2
F - - Yes - No Yes Yes Yes No Yes No 2
G - Yes - - No Yes Yes Yes No Yes No 2
H - Yes - - Yes Yes Yes Yes No Yes No 2
I Yes - - - Yes Yes Yes Yes No Yes No 2
J Yes - - - No Yes Yes Yes No Yes No 2
* Overhang condition is simulated by not screwing sidewall steel into the top girt.
Miscellaneous
There are numerous other details that because of space, will not be covered in this paper. Thisincludes specifics of the load system (load levels, overload protection, cylinder sizing, switchingcylinders on- and off-line, pump sizing), connection details (post connections, truss heel details,
cylinder anchorage, cable connections, purlin/girt attachment, chord reinforcement), size and
spacing of individual building components (purlins, girts, misc. truss bracing), other constructiondetails (truss design, ridge design, endwall design, overhang design), foundation design
(reinforcement for anchorage of posts and load cylinders), and data processing equipment
(power, digital-to-analog conversion, signal conditioning, noise reduction).
Summary
Current diaphragm design procedures for metal-clad wood-frame buildings were reviewed with
an emphasis on: determination of diaphragm stiffness, structural load distribution, and chord
force calculations. The following major points were made:
1. It is possible to predict, with a rather simple model, the in-plane stiffness of diaphragm
assemblies under design loads. Laboratory tests must still be relied on to provide connector
load-slip properties and accurate estimates of the effective shear stiffness of corrugated panels.
2. The current ASAE procedure for calculating the effective shear modulus of diaphragm test
assemblies implies that all shear transferred between adjacent diaphragm sections goesthrough the rafter.
3. Total shear deformations measured during diaphragm assembly tests need to be separated
into (1) deformations due to load transfer into and out of a diaphragm, and (2)deformations
due to shear transfer across the diaphragm. This enables more accurate representation of
diaphragms and rafter-to-diaphragm connections when determining load distribution in the building.
8/9/2019 ASAE-994204-Thoughts on Diaphragm Action
http://slidepdf.com/reader/full/asae-994204-thoughts-on-diaphragm-action 31/34
30
4. Distribution of chord forces is highly dependent on the shear stiffness of the cladding. Thelower the shear stiffness, the greater the percentage of load carried by the edge members, and
the less carried by interior members.
5. The relatively low shear stiffness of corrugated cladding currently used in construction wouldsuggest that it is inappropriate to assume that interior chords significantly reduce edge
member forces in most buildings.
6. The ability of sidewalls to reduce axial forces in eave struts is highly dependent on the
relative shear stiffness of the wall.
A proposed full-scale building test was described. As currently planned, it would feature a
length-to-width ratio of 5 (no full-scale test has exceeded a length-to-width ratio of 2.5). It
would utilize specially strain-gauged links to accurately monitor purlin and girt forces. Theloading system would enable reverse loading and independent frame loading. Sensitivity of
diaphragm action to a variety of ridge, overhang, siding and endwall conditions would beexplored.
References
Anderson, G.A. 1987. Evaluation of light-gauge metal diaphragm behavior and the diaphragminteraction with post frames. Ph.D. diss., Iowa State University, Ames, Iowa.
Anderson, G. A. 1990. What affects the strength and stiffness of diaphragms? ASAE Paper No.904028. ASAE, St. Joseph, Michigan.
Anderson, G.A. and D.S. Bundy. 1990. Stiffness of screw-fastened, metal-clad, timber-framed
roof diaphragms with openings in the sheeting. Transactions of the ASAE 33(1):266-273.
ASAE. 1999a. EP484.2 Diaphragm design of metal-clad wood-frame rectangular buildings.
ASAE Standards, 46 th
Ed ., ASAE, St. Joseph, Michigan
ASAE. 1999b. EP558.1 Load tests for metal-clad wood-frame diaphragms. ASAE Standards,
46 th
Ed ., ASAE, St. Joseph, Michigan
Bohnhoff, D.R. and G.D. Williams. 1999. Evaluation of metal-clad wood-frame diaphragm
assembly tests. ASAE Paper No. 994205. ASAE, St. Joseph, Michigan.
Davies, J.M. 1977. Simplified diaphragm analysis. ASCE Journal of the Structural Division 103(ST11):2093-2109.
Davies, J.M. and E.R. Bryan. 1982. Manual of Stresses Skin Diaphragm Design. John Wiley &Sons, Inc., New York, New York.
8/9/2019 ASAE-994204-Thoughts on Diaphragm Action
http://slidepdf.com/reader/full/asae-994204-thoughts-on-diaphragm-action 32/34
31
Bryan, E.R. and W.M. El-Dakhakhni. 1968. Shear flexibility and strength of corrugated decks.
ASCE Journal of the Structural Division. 14(ST11):2549-2580.
Keener, J.D. 1995. A simplified model for predicting the behavior of metal-clad, wood-framed
diaphragms. M.S. thesis, The Pennsylvania State University, University Park,
Pennsylvania.
Keener, J.D. and H.B. Manbeck. 1996a. A simplified model for predicting the behavior of metal-
clad, wood-framed diaphragms. Transactions of the ASAE 39(3):1113-1122.
Keener, J.D. and H.B. Manbeck. 1996b. Effective shear modulus trends for cold-formed steel
panels. Transactions of the ASAE 39(5):1817-1824.
Niu, K.T. and K.G. Gebremedhin. 1997. Evaluation of interaction of wood framing and metal-
cladding in roof diaphragms. Transactions of the ASAE 40(2):465-476.
Pollock, D.G., D.A. Bender and K.G.Gebremedhin 1996. Designing for chord forces in post-frame roof diaphragms. Frame Building News 8(5):40-44.
Williams, G.D. 1999. Modeling metal-clad wood-framed diaphragm assemblies. Ph.D. diss.,
University of Wisconsin-Madison, Madison, Wisconsin.
Wright, B.W. 1992. Modeling timber-framed, metal-clad diaphragm performance. Ph.D. diss.
The Pennsylvania State University, University Park, Pennsylvania.

8/9/2019 ASAE-994204-Thoughts on Diaphragm Action
http://slidepdf.com/reader/full/asae-994204-thoughts-on-diaphragm-action 33/34
32
Appendix A - Derivation of Rafter-to-Diaphragm Connector Stiffness, kC
Figure A.1 – (a) Force diagram. (b) Displacement definitions (c) Spring analog
Definitions
P = Total horizontal force transferred between rafter and diaphragmPS = Total shear force induced in rafter-to-diaphragm connectors
PA = Total axial force induced in rafter-to-diaphragm connectors
θ = Roof slope
d = Total displacement of diaphragm relative to rafter due to application of load P
h = Horizontal component of displacement dv = Vertical component of displacement d
s = Shear deformation of the connections
= Component of displacement d in a direction parallel to the diaphragm
a = Axial deformation of the connections= Component of displacement d in a direction perpendicular to the diaphragm
k S = Total shear stiffness of rafter-to-diaphragm connectors
= PS/sk A = Total axial stiffness of rafter-to-diaphragm connectors
= PA/a
k C = Horizontal stiffness of rafter-to-diaphragm connectors
= P/h
θP
PS
P A
θ
h
v
a s
d
Pθ
Spring with stiffness = k A
Spring with stiffness = kS
P A
PS
(a) (b)
(c)

8/9/2019 ASAE-994204-Thoughts on Diaphragm Action
http://slidepdf.com/reader/full/asae-994204-thoughts-on-diaphragm-action 34/34
Basic Relationships
From summation of forces in a horizontal direction:
P = PS•cos(θ) + PA•sin(θ) (A.1)
orP = k S•s•cos(θ) + k A•a •sin(θ) (A.2)
From summation of forces in a vertical direction:
PA•cos(θ) = PS•sin(θ) (A.3)
or
k A•a•cos(θ) = k S•s•sin(θ) (A.4)
or
a/s = (k S/k A)•(sin(θ)/cos(θ)) (A.5)
From figure A.1(b):
h = s•cos(θ) + a•sin(θ) (A.6)
Derivation of k C
Dividing equation A.2 by A.6 yields
k S•s•cos(θ) + k A•a •sin(θ) k S•cos(θ) + k A•(a/s)•sin(θ)k C =
s•cos(θ) + a•sin(θ)=
cos(θ) + (a/s)•sin(θ)(A.7)
Substituting equation A.5 into A.7 yields
k S•cos(θ) + k S•sin2(θ)/cos(θ)
k C =cos(θ) + (k S/k A)•sin
2(θ)/cos(θ)
(A.8)
or
k S•(cos2(θ) + sin
2(θ))
k C =cos
2(θ) + (k S/k A)•sin
2(θ)
(A.9)
or
k S•k A k C =
k A•cos2(θ) + k S•sin
2(θ)
(A.10)