AS PRFoods Consolidated Audited Annual Report 2019/2020 ...
91
AS PRFoods Consolidated Audited Annual Report 2019/2020 (translation from the Estonian original)
Transcript of AS PRFoods Consolidated Audited Annual Report 2019/2020 ...

Consolidated Audited Annual Report of 2019/2020 Financial Year 1
AS PRFoods
Consolidated Audited Annual Report 2019/2020 (translation from the Estonian original)

Consolidated Audited Annual Report of 2019/2020 Financial Year 2
Business name AS PRFoods
Commercial register number 1150713
Address Pärnu mnt 141, Tallinn, Estonia
Phone +372 452 1470
Website prfoods.ee
Main activities Production and sale of fish products Fish farming
Reporting period 1 July 2019 – 30 June 2020
Auditor KPMG Baltics OÜ

Consolidated Audited Annual Report of 2019/2020 Financial Year 3
TABLE OF CONTENTS CORPORATE PROFILE .......................................................................................................................................................................... 4 MANAGEMENT REPORT ........................................................................................................................................................................ 8
OVERVIEW OF ECONOMIC ACTIVITIES ........................................................................................................................................... 8 MANAGEMENT AND SUPERVISORY BOARDS ............................................................................................................................... 22 SHARE AND SHAREHOLDERS ........................................................................................................................................................ 24 BOND AND BONDHOLDERS ............................................................................................................................................................ 27 SOCIAL RESPONSIBILITY ................................................................................................................................................................ 29 ENVIRONMENTAL RESPONSIBILITY .............................................................................................................................................. 29 REPORT ON CORPORATE GOVERNANCE .................................................................................................................................... 31
CONSOLIDATED FINANCIAL STATEMENTS ....................................................................................................................................... 37 CONSOLIDATED STATEMENT OF FINANCIAL POSITION .............................................................................................................. 37 CONSOLIDATED STATEMENT OF COMPREHENSIVE INCOME .................................................................................................... 38 CONSOLIDATED STATEMENTS OF CASH FLOWS ........................................................................................................................ 39 CONSOLIDATED STATEMENT OF CHANGES IN EQUITY .............................................................................................................. 40 NOTES TO THE CONSOLIDATED FINANCIAL STATEMENTS ........................................................................................................ 41
GENERAL INFORMATION ..................................................................................................................................................... 41 BASES FOR PREPARATION OF THE CONSOLIDATED FINANCIAL STATEMENTS .......................................................................... 41 FINANCIAL RISKS ............................................................................................................................................................... 55 MANAGEMENT JUDGEMENTS AND ESTIMATES ...................................................................................................................... 60 CASH AND CASH EQUIVALENTS0 ......................................................................................................................................... 61 RECEIVABLES AND PREPAYMENTS ...................................................................................................................................... 62 INVENTORIES ..................................................................................................................................................................... 62 BIOLOGICAL ASSETS .......................................................................................................................................................... 62 SUBSIDIARIES .................................................................................................................................................................... 64
DEFERRED INCOME TAX ................................................................................................................................................... 65 TANGIBLE ASSETS ........................................................................................................................................................... 66 INTANGIBLE ASSETS ......................................................................................................................................................... 67 LEASES .......................................................................................................................................................................... 68 INTEREST-BEARING LIABILITIES ......................................................................................................................................... 70 PAYABLES AND PREPAYMENTS ......................................................................................................................................... 72 GOVERNMENT GRANTS .................................................................................................................................................... 72 EQUITY ........................................................................................................................................................................... 73 SEGMENT REPORTING ...................................................................................................................................................... 74 COST OF GOODS SOLD .................................................................................................................................................... 75 SALES AND MARKETING EXPENSES ................................................................................................................................... 76 GENERAL AND ADMINISTRATIVE EXPENSES ........................................................................................................................ 76 STAFF COSTS .................................................................................................................................................................. 76 OTHER OPERATING INCOME AND EXPENSES ...................................................................................................................... 77 FINANCIAL INCOME AND EXPENSE ..................................................................................................................................... 77 INCOME TAX EXPENSES ................................................................................................................................................... 77 TRANSACTIONS WITH RELATED PARTIES ............................................................................................................................ 77 ASSOCIATES .................................................................................................................................................................... 78 CONTINGENT LIABILITIES AND ASSETS ............................................................................................................................... 79 EVENTS AFTER BALANCE SHEET DATE .............................................................................................................................. 79 THE PARENT COMPANY PRIMARY’S FINANCIAL STATEMENTS .............................................................................................. 80
MANAGEMENT BOARD’S CONFIRMATION TO THE ANNUAL REPORT ............................................................................................ 84 INDEPENDENT AUDITOR’S REPORT .................................................................................................................................................. 85 PROPOSAL FOR COVERING LOSS ..................................................................................................................................................... 91

Consolidated Audited Annual Report of 2019/2020 Financial Year 4
CORPORATE PROFILE
AS PRFoods (“Parent Company”) and its subsidiaries (together "Group") is a company engaged in fish farming, processing and sales. The Group’s shares are listed on the main list of NASDAQ Tallinn Stock Exchange since 5 May 2010 and its bonds are listed on the NASDAQ Tallinn bond list since 6 April 2020.
AS PRFoods’ key market is Finland, where we are amongst the three largest fish production companies. Since the acquisition of John Ross Jr. and Coln Valley Smokery in the summer of 2017, the Group has sales experience to 37 countries in Europe, North and South America, and Asia.
Main activities of the Group are fish farming and manufacturing of fish products. The main products are salmon and rainbow trout products. Approximately 2/3 of the raw fish used in the Group’s rainbow trout production comes from the Group’s fish farms in Swedish lakes, Turku Archipelago area in Finland and from coastal waters of Saaremaa in Estonia, assuring the highest quality and reliable deliveries. The rest of raw fish is purchased mainly from Norway and Denmark. Fish products are manufactured in four modern factories in Renko and Kokkola (Finland), in Saaremaa (Estonia), and in Aberdeen (Great Britain).
Products of the Group are sold as leading brands in their respective operating market and the primary focus is on higher value-added premium products, increasing thereby the profitability of the company.
Heimon Kala is a brand with a long history, originated in Finland and being one of the most beloved fish producers there. In Estonia, Heimon Kala products have been sold since the end of 2018. We process mostly rainbow trout and salmon in our factories, in smaller quantities also whitefish, perch, pikeperch, vendace, Atlantic and Baltic herrings. We always keep the fish in a place of honour – both when farming and processing it – that is why we raise most of our red fish ourselves and smoke it with alder chips in the traditional way. As our product range is quite wide, a favourite product can be found for the whole family – lightly salted trout slices that have won the title of the Best Fish Product in Estonia, children's favourite trout cutlets or trout roe for a more festive occasion.
The Group is actively involved in developing new products for expanding also to new export markets. As introducing the Group’s own brands is in its early stage in Scandinavia and elsewhere in the world, the management expects the Group’s growth period is yet ahead.
THE GEOGRAPHY OF PRODUCTION AND SALES
Fish farming Finland Sweden Estonia
Purchase of raw fish Finland Sweden Norway Denmark
Production Estonia Finland Great Britain
Sales Finland Great Britain Estonia
Consolidated Audited Annual Report of 2019/2020 Financial Year 5
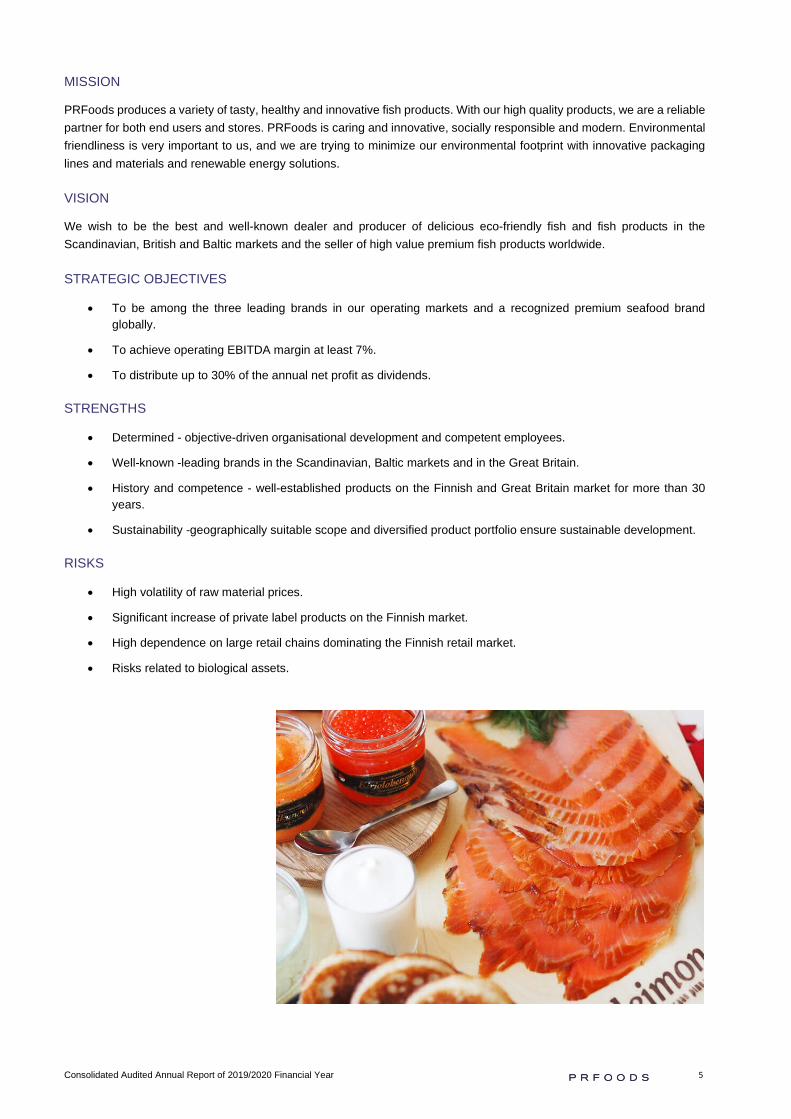
MISSION
PRFoods produces a variety of tasty, healthy and innovative fish products. With our high quality products, we are a reliable partner for both end users and stores. PRFoods is caring and innovative, socially responsible and modern. Environmental friendliness is very important to us, and we are trying to minimize our environmental footprint with innovative packaging lines and materials and renewable energy solutions.
VISION
We wish to be the best and well-known dealer and producer of delicious eco-friendly fish and fish products in the Scandinavian, British and Baltic markets and the seller of high value premium fish products worldwide.
STRATEGIC OBJECTIVES
• To be among the three leading brands in our operating markets and a recognized premium seafood brand globally.
• To achieve operating EBITDA margin at least 7%.
• To distribute up to 30% of the annual net profit as dividends.
STRENGTHS
• Determined - objective-driven organisational development and competent employees.
• Well-known -leading brands in the Scandinavian, Baltic markets and in the Great Britain.
• History and competence - well-established products on the Finnish and Great Britain market for more than 30 years.
• Sustainability -geographically suitable scope and diversified product portfolio ensure sustainable development.
RISKS
• High volatility of raw material prices.
• Significant increase of private label products on the Finnish market.
• High dependence on large retail chains dominating the Finnish retail market.
• Risks related to biological assets.
Consolidated Audited Annual Report of 2019/2020 Financial Year 6
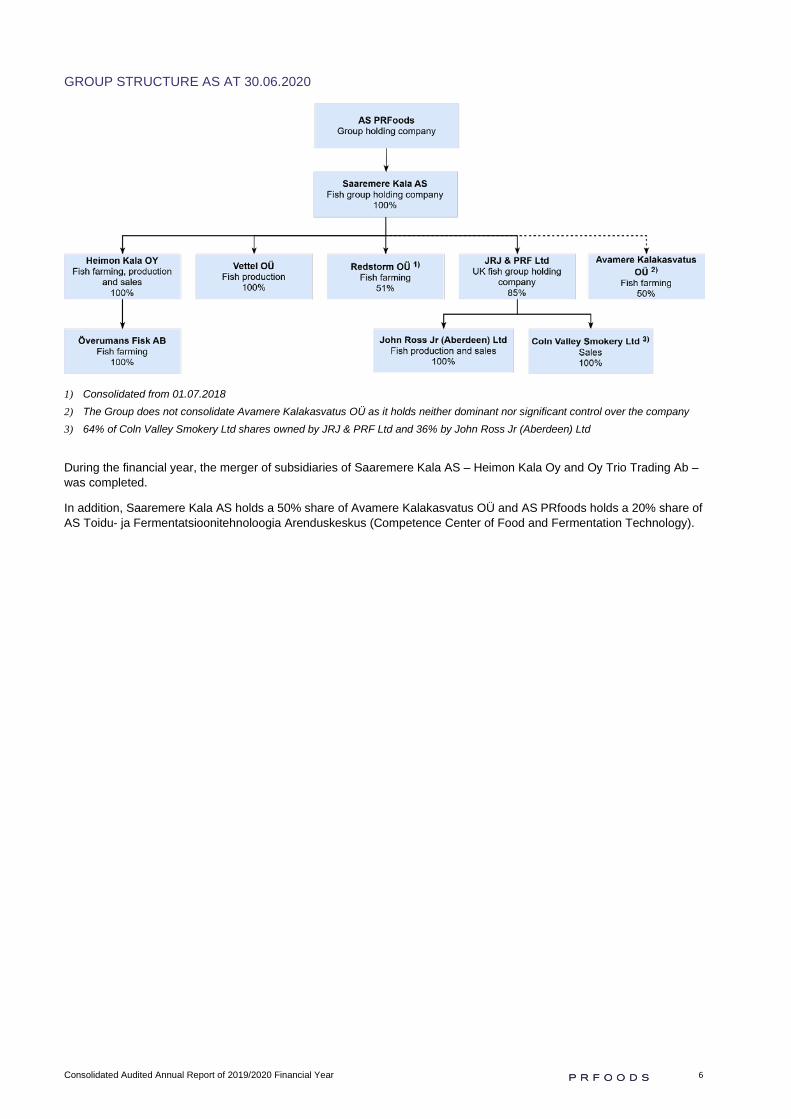
GROUP STRUCTURE AS AT 30.06.2020
1) Consolidated from 01.07.2018 2) The Group does not consolidate Avamere Kalakasvatus OÜ as it holds neither dominant nor significant control over the company 3) 64% of Coln Valley Smokery Ltd shares owned by JRJ & PRF Ltd and 36% by John Ross Jr (Aberdeen) Ltd
During the financial year, the merger of subsidiaries of Saaremere Kala AS – Heimon Kala Oy and Oy Trio Trading Ab – was completed.
In addition, Saaremere Kala AS holds a 50% share of Avamere Kalakasvatus OÜ and AS PRfoods holds a 20% share of AS Toidu- ja Fermentatsioonitehnoloogia Arenduskeskus (Competence Center of Food and Fermentation Technology).

Consolidated Audited Annual Report of 2019/2020 Financial Year 7
MANAGEMENT REPORT

Consolidated Audited Annual Report of 2019/2020 Financial Year 8
MANAGEMENT REPORT
OVERVIEW OF ECONOMIC ACTIVITIES
MANAGEMENT COMMENTARY
The financial results of AS PRFoods for the last quarter of the financial year have been strongly affected by the states of emergencies declared due to the Covid-19 pandemic in all countries where the Group companies operate (Estonia, Finland, Great Britain and Sweden). In the year as a whole, the sales decrease was 8.7% (19/20: 78.3 million euros; 18/19: 85.7 million euros) and the EBITDA for the financial year was 1.9 million euros (18/19: 1.7 million euros). Considering the situation in the market and comparing the results of our competitors, we can be satisfied with the year. Based on the results of the first half of the financial year, we expected a much stronger result. Given that the impact of the outspread of coronavirus on global demand and fish prices rising from China already in January, was negative, we were able to respond satisfactorily during the second half of the financial year, but it was extremely difficult to achieve a positive result with the entire market in descent.
Hotels-Restaurants-Cafees sector’s (HoReCa) restrictions and the drastic decrease in air transport affected the company's turnover since mid-March, and unfortunately the recovery of the hotel, restaurant and other catering segments has been difficult in PRFoods' main markets in Finland and the United Kingdom. Due to the decline in salmon and trout prices, finished products have also become cheaper, especially in the Finnish market, affecting profitability. PRFoods withstood the Covid-19 pandemic with a strengthened balance sheet, having refinanced short-term loans with five-year bonds at the beginning of the year, and also, we have improved cash flows by keeping the level of raw material inventory at an optimal level.
Group sales revenue
The total decrease in turnover compared to the same period last year was 8.7% mostly affected by the decline of 29.5% in the financial year’s last quarter. Also, during 2019/2020 there was a change in the product portfolio; the share of raw fish and fillets product group increased by 4 pp and the share of smoked products decreased accordingly. The share of fresh fish and fillets in the product portfolio is 45.6% (41.7% last year) and the share of smoked products is 38.4% (43.0% last year).
The sales price of fresh fish and fillets is directly affected by the export prices of salmon and trout, which have been on a downward trend since the beginning of the calendar year. During the reporting period, the market price of fish fluctuated significantly, for example in March 2020 the market price of salmon had decreased by 31.1% and the price of rainbow trout by 32.0% compared to a year ago. Compared to the prices two years ago, the price of salmon had fallen by 43.2% and trout by 31.7%. Foremost, it had a negative impact on wholesale prices and turnover of fresh fish.
Result for the 12 months of the financial year
The Group's consolidated EBITDA was 1.9 million euros (18/19: 1.7 million euros), a decrease of 8.0% compared to the previous year. EBITDA from operations (i.e. before one-offs and revaluation of bioassets) was 2.8 million euros (18/19: 4.0 million euros). EBITDA from operations was negatively impacted by a decrease in the share of smoked products in sales, which was mainly due to lower sales volumes in Finland in the private label segment, by the negative impact of Covid-19 on sales in the HoReCa sector and the fall in market prices for fish. In the year as a whole, the gross margin decreased by 1.7 pp compared to the previous financial year (19/20: 12.2% vs 18/19: 13.9%).
The net loss for the reporting year was 1.9 million euros (18/19: 1.5 million euros), incl. an increase in financial expenses by 0.3 million euros due to the increase in interest expenses (investment loan interest rate 3.25% vs. bond interest rate 6.25%).
Financial position
The company's net debt was 20.7 million euros as at 30.06.2020 (30.06.2019: 20.5 million euros). The Group's working capital as at 30.06.2020 was minus 3,967 thousand euros as current liabilities include liabilities to related parties in the amount of 4,046 thousand euros, which are long-term in nature, but due to accounting principles must be categorised as short-term liabilities (incl. short-term loan of 1,500 thousand euros from Amber Trust II S.C.A (note 26)). By eliminating

Consolidated Audited Annual Report of 2019/2020 Financial Year 9
short-term liabilities to related parties, with whom the Group has the opportunity to agree on payment terms longer than 12 months, the Group's working capital is positive.
PRFoods successfully completed a private placement of bonds in January 2020, as a result of which short-term liabilities in the amount of 9 million euros became long-term ones, releasing cash flows of about 2 million euros per year. The change in the debt structure also has an impact on the company's financial results, the impact of financial expenses on PRFoods' net profit is negative by 0.35 million euros per year.
Impact of the coronavirus (Covid-19) pandemic
Due to the imposition of special situation restrictions because of the Covid-19 pandemic, the company's turnover has significantly decreased in the HoReCa segment which accounts for approximately 20% of the Group's turnover since mid-March. The decrease in sales in HoReCa segment in the last quarter of the financial year was about 70%, which was unfortunately not covered by the 7% growth in retail segment, but rather the share of raw fish and fish fillets with significantly lower profit margins increased instead of hot and cold smoked products. Taking into account the average gross margin for the first 9 months of the year (13.9%), we estimate the direct negative impact of Covid-19 on EBITDA of 0.6 million euros. The Group's results were negatively affected primarily by the Finnish unit, while the British unit's result remained at the same level as last year, despite the situation caused by the coronavirus.
In line with the decline in production, the Group's companies have reduced the working hours and salaries of both production and office employees by 10-30%. The Group's companies in Estonia and the United Kingdom have used the salary compensation subsidies offered by the states.
The Group is focused on cost and cash flow management to ensure the sustainability of its operations in the future. Certainly, larger industries such as PRFoods are better able to cope with such crises, and the company's activities are spread across several markets. In some markets, we expect our positions to strengthen due to reduced competition.
In March 2020, PRFoods conducted a public offering of bond issues amidst the period of crisis which could not have been foreseen when planning the issue, resulting in the subscription of bonds significantly below expectations – 0.9 million or 47% of the 1.9 million was subscribed, including 0.5 million bonds subscribed by PRFoods to sell them after the end of the crisis.
Events and future plans for the financial year
This financial year will continue to be affected by Covid-19, and we will certainly see the effects of the ongoing economic crisis materialize in the next financial year. We assume the recovery of the HoReCa sector will not be seen until 2021. Considering that the share of total global HoReCa in salmon and trout is about 30%, there is an oversupply of both raw fish and fish products in the market due to the corona epidemic. The trend of declining consumption can also be seen in other foods, such as meat and milk, as both travel and domestic restrictions apply. However, in countries where the coronavirus has been successfully combated so far, including Estonia, rapid recovery of HoReCa can be seen. As the situation changes quickly, it is difficult to make long-term predictions.
According to analysts and Fishpool’s salmon futures prices, price growth and demand growth of up to 9% can be expected only in 2021. The average futures price of salmon for 2021 at the date of the report is 5.55 euros/kg compared to 4.40 euros/kg in August 2020.
For PRFoods, the market price of fish has the biggest impact. This is due to two main reasons: a) the impact on fish farming, b) the change in Finnish retail prices, where the prices of final products also react immediately to the fall in raw material prices due to the large share of the private label in the market. Due to the decrease in demand for HoReCa, we see low fish prices for 2020 as a whole. This is definitely good news for consumers. Despite the increased production volumes and demand for some products, lower prices do not allow such a large profit to be made in absolute terms. At the same time, lower prices allow to significantly increase export volumes.
Considering the situation, we are more optimistic about the future than at the end of the financial year, for the following reasons:
• John Ross Jr. and Coln Valley have been able to maintain their profitability in absolute terms despite a nearly 30% drop in turnover thanks to higher profitability of branded products;
• In the Estonian market, we have been able to sell our products significantly better and we see that during the financial year of 2020/2021 we will significantly increase our product portfolio of retail products for the Estonian market;
• We have completed the centralization of the management of the Finnish and Estonian production units, which started in 2019, including the change of management. The merger of Trio Trading and Heimon Kala in Finland has been
Consolidated Audited Annual Report of 2019/2020 Financial Year 10
completed. In addition, we built up a new sales team, which had a temporary negative impact on sales revenue due to turnover of personnel;
• We will increase the level of automation in the Estonian and Finnish production units, as a result of which we will be able to organize production much more efficiently and with fewer people in the future;
• A larger investment program has taken place in production. We will continue with the investment program in fish farming;
• Positive news from Estonia and Sweden regarding the increase in fish farming volumes will enable us to grow fish more efficiently and profitably and become one of the largest and most environmentally friendly fish farmers in Estonia and Finland;
• We assume that the direct damage caused by the coronavirus has passed. At the same time, the long-term effects of the accompanying economic crisis on consumer behaviour as well as on competition are unpredictable.
We have implemented a cost-saving program since the 4th quarter, resulting in costs decreasing by approximately 0.4 million euros per year. The one-million-euro savings program launched in 2019 has thus been completed. The main focus of the financial year of 2020/2021 is maintaining profitability and growth in the conditions of a strong market oversupply. Considering the regional position of the Group's companies, we believe that we will be able to cope better with the situation than our competitors.
Covid-19 created a new situation, but despite it, PRFoods never had to stop its production. We continue to develop PRFoods as an environmentally friendly and high-quality fish farming and processing company.
Sincerely,
Indrek Kasela
Consolidated Audited Annual Report of 2019/2020 Financial Year 11
KEY RATIOS OF THE GROUP
KEY RATIOS*
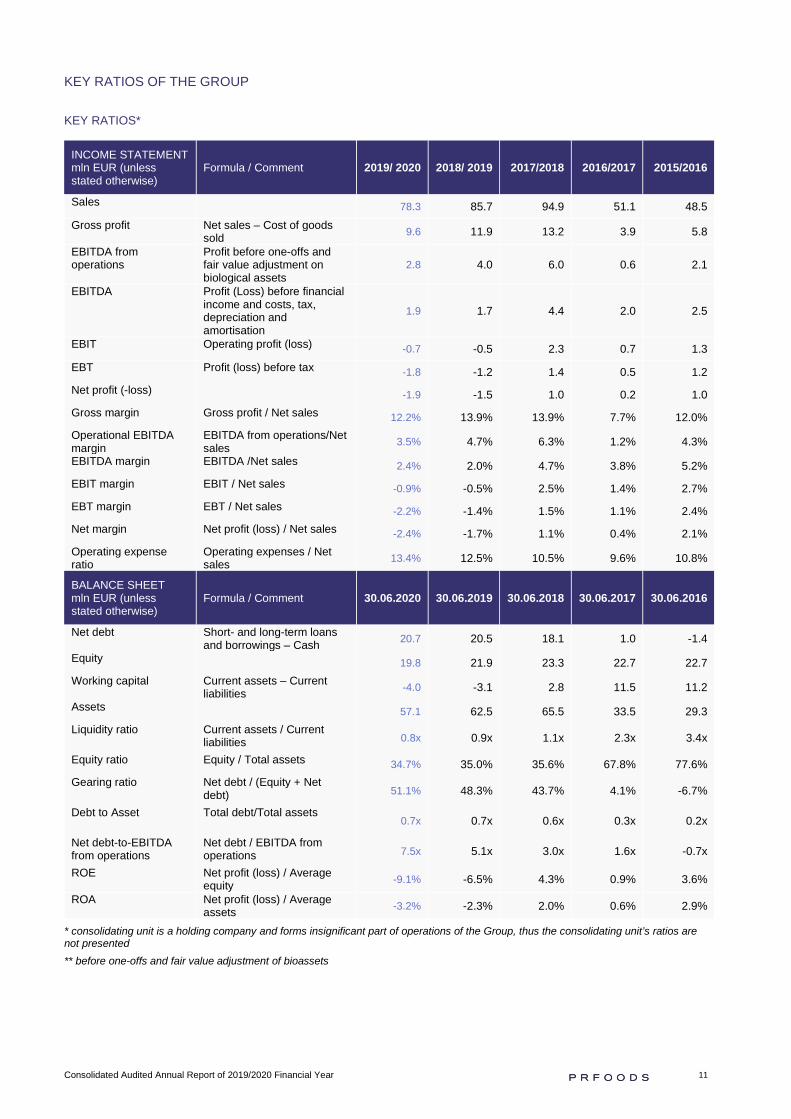
INCOME STATEMENT mln EUR (unless stated otherwise)
Formula / Comment 2019/ 2020 2018/ 2019 2017/2018 2016/2017 2015/2016
Sales 78.3 85.7 94.9 51.1 48.5 Gross profit Net sales – Cost of goods
sold 9.6 11.9 13.2 3.9 5.8
EBITDA from operations
Profit before one-offs and fair value adjustment on biological assets
2.8 4.0 6.0 0.6 2.1
EBITDA Profit (Loss) before financial income and costs, tax, depreciation and amortisation
1.9 1.7 4.4 2.0 2.5
EBIT Operating profit (loss) -0.7 -0.5 2.3 0.7 1.3 EBT Profit (loss) before tax -1.8 -1.2 1.4 0.5 1.2 Net profit (-loss) -1.9 -1.5 1.0 0.2 1.0 Gross margin Gross profit / Net sales 12.2% 13.9% 13.9% 7.7% 12.0% Operational EBITDA margin
EBITDA from operations/Net sales 3.5% 4.7% 6.3% 1.2% 4.3%
EBITDA margin EBITDA /Net sales 2.4% 2.0% 4.7% 3.8% 5.2% EBIT margin EBIT / Net sales -0.9% -0.5% 2.5% 1.4% 2.7% EBT margin EBT / Net sales -2.2% -1.4% 1.5% 1.1% 2.4% Net margin Net profit (loss) / Net sales -2.4% -1.7% 1.1% 0.4% 2.1% Operating expense ratio
Operating expenses / Net sales 13.4% 12.5% 10.5% 9.6% 10.8%
BALANCE SHEET mln EUR (unless stated otherwise)
Formula / Comment 30.06.2020 30.06.2019 30.06.2018 30.06.2017 30.06.2016
Net debt Short- and long-term loans and borrowings – Cash 20.7 20.5 18.1 1.0 -1.4
Equity 19.8 21.9 23.3 22.7 22.7 Working capital Current assets – Current
liabilities -4.0 -3.1 2.8 11.5 11.2
Assets 57.1 62.5 65.5 33.5 29.3 Liquidity ratio Current assets / Current
liabilities 0.8x 0.9x 1.1x 2.3x 3.4x
Equity ratio Equity / Total assets 34.7% 35.0% 35.6% 67.8% 77.6% Gearing ratio Net debt / (Equity + Net
debt) 51.1% 48.3% 43.7% 4.1% -6.7%
Debt to Asset Total debt/Total assets 0.7x 0.7x 0.6x 0.3x 0.2x
Net debt-to-EBITDA from operations
Net debt / EBITDA from operations 7.5x 5.1x 3.0x 1.6x -0.7x
ROE Net profit (loss) / Average equity -9.1% -6.5% 4.3% 0.9% 3.6%
ROA Net profit (loss) / Average assets -3.2% -2.3% 2.0% 0.6% 2.9%
* consolidating unit is a holding company and forms insignificant part of operations of the Group, thus the consolidating unit’s ratios are not presented ** before one-offs and fair value adjustment of bioassets

Consolidated Audited Annual Report of 2019/2020 Financial Year 12
REVENUE
The Group’s revenue in the financial year 2019/2020 totalled 78.3 million euros, down by 7.4 million euros, i.e. 8.7% compared to the previous financial year.
The largest market of the Group has throughout years been Finland sales of which accounted for 65% of the total last financial year’s revenue of the Group. Since the acquisition of fish companies in Great Britain, it has been the second largest market of the Group with ca 13-14% of total sales. Sales in Estonia, the third largest market have increased to account for 9% of the Group’s total sales.
GEOGRAPHIC SEGMENTS
Finland’s revenue in the last financial year was 50.9 million euros, down by 15.1% compared to 59.9 million euros in the previous financial year. The market formed 65.0% of total revenue (2018/2019: 69.9% of total revenue), down by 4.9 percentage points.
Great Britain’s revenue in the financial year was 10.2 million euros, down by 15.4% compared to 12.1 million euros in the previous financial year. The market formed 13.1% of total revenue (2018/2019: 14.1% of total revenue), down by 1.0 percentage points.
Estonia’s revenue in the last financial year was 7.0 million euros, up by 23.0% compared to 5.7 million euros in the previous financial year. The market formed 9.0% of total revenue (2018/2019: 6.7% of total revenue), up by 2.3 percentage points.
Sales to other countries amounted to 10.2 million euros in the financial year accounting for 12.9% of total revenue (2018/2019: 8.0 million euros, share 9.4% of total revenue).
mln EUR 2019/2020 Share, % 2018/2019 Share, % Change, mln EUR
Change, % Imp.
Finland 50.9 65.0% 59.9 69.9% -9.0 -15.1% ▼
United Kingdom 10.2 13.1% 12.1 14.1% -1.9 -15.4% ▼
Estonia 7.0 9.0% 5.7 6.7% 1.3 23.0% ▲ Other 10.2 12.9% 8.0 9.4% 2.1 26.5% ▲
Total 78.3 100.0% 85.7 100.0% -7.4 -8.7% ▼
65.0%
13.1% 9.0%
GREAT BRITAIN
Consolidated Audited Annual Report of 2019/2020 Financial Year 13
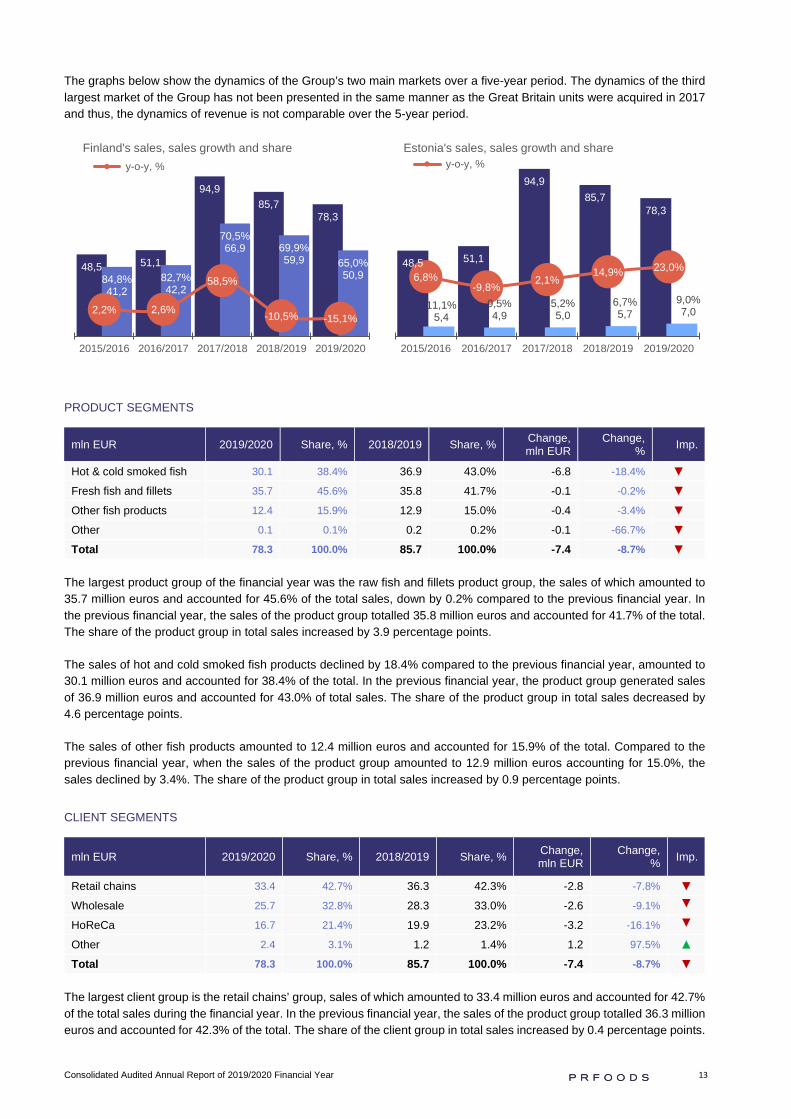
The graphs below show the dynamics of the Group’s two main markets over a five-year period. The dynamics of the third largest market of the Group has not been presented in the same manner as the Great Britain units were acquired in 2017 and thus, the dynamics of revenue is not comparable over the 5-year period.
PRODUCT SEGMENTS
mln EUR 2019/2020 Share, % 2018/2019 Share, % Change, mln EUR
Change, % Imp.
Hot & cold smoked fish 30.1 38.4% 36.9 43.0% -6.8 -18.4% ▼
Fresh fish and fillets 35.7 45.6% 35.8 41.7% -0.1 -0.2% ▼
Other fish products 12.4 15.9% 12.9 15.0% -0.4 -3.4% ▼ Other 0.1 0.1% 0.2 0.2% -0.1 -66.7% ▼
Total 78.3 100.0% 85.7 100.0% -7.4 -8.7% ▼
The largest product group of the financial year was the raw fish and fillets product group, the sales of which amounted to 35.7 million euros and accounted for 45.6% of the total sales, down by 0.2% compared to the previous financial year. In the previous financial year, the sales of the product group totalled 35.8 million euros and accounted for 41.7% of the total. The share of the product group in total sales increased by 3.9 percentage points.
The sales of hot and cold smoked fish products declined by 18.4% compared to the previous financial year, amounted to 30.1 million euros and accounted for 38.4% of the total. In the previous financial year, the product group generated sales of 36.9 million euros and accounted for 43.0% of total sales. The share of the product group in total sales decreased by 4.6 percentage points.
The sales of other fish products amounted to 12.4 million euros and accounted for 15.9% of the total. Compared to the previous financial year, when the sales of the product group amounted to 12.9 million euros accounting for 15.0%, the sales declined by 3.4%. The share of the product group in total sales increased by 0.9 percentage points.
CLIENT SEGMENTS
mln EUR 2019/2020 Share, % 2018/2019 Share, % Change, mln EUR
Change, % Imp.
Retail chains 33.4 42.7% 36.3 42.3% -2.8 -7.8% ▼
Wholesale 25.7 32.8% 28.3 33.0% -2.6 -9.1% ▼
HoReCa 16.7 21.4% 19.9 23.2% -3.2 -16.1% ▼
Other 2.4 3.1% 1.2 1.4% 1.2 97.5% ▲
Total 78.3 100.0% 85.7 100.0% -7.4 -8.7% ▼
The largest client group is the retail chains’ group, sales of which amounted to 33.4 million euros and accounted for 42.7% of the total sales during the financial year. In the previous financial year, the sales of the product group totalled 36.3 million euros and accounted for 42.3% of the total. The share of the client group in total sales increased by 0.4 percentage points.
48,5 51,1
94,985,7
78,3
84,8%41,2
82,7%42,2
70,5%66,9 69,9%
59,9 65,0%50,9
2,2% 2,6%
58,5%
-10,5% -15,1%
2015/2016 2016/2017 2017/2018 2018/2019 2019/2020
Finland's sales, sales growth and share y-o-y, %
48,5 51,1
94,985,7
78,3
11,1%5,4
9,5%4,9
5,2%5,0
6,7%5,7
9,0%7,0
6,8%-9,8% 2,1%
14,9% 23,0%
2015/2016 2016/2017 2017/2018 2018/2019 2019/2020
Estonia's sales, sales growth and share y-o-y, %
Consolidated Audited Annual Report of 2019/2020 Financial Year 14
Slightly less than a third of sales i.e. 25.7 million euros was generated by wholesale sector. In the previous financial year, the sales of the client group amounted to 28.3 million euros and accounted for 33.0% of the total. The share of the client group in total sales decreased by 0.2 percentage points.
HoReCa sales amounted 16.7 million euros and accounted for 21.4% of the total. In the previous financial year, the sales of the client group amounted to 19.9 million euros and accounted for 23.2% of the total. The share of the client group in total sales decreased by 1.8 percentage points.
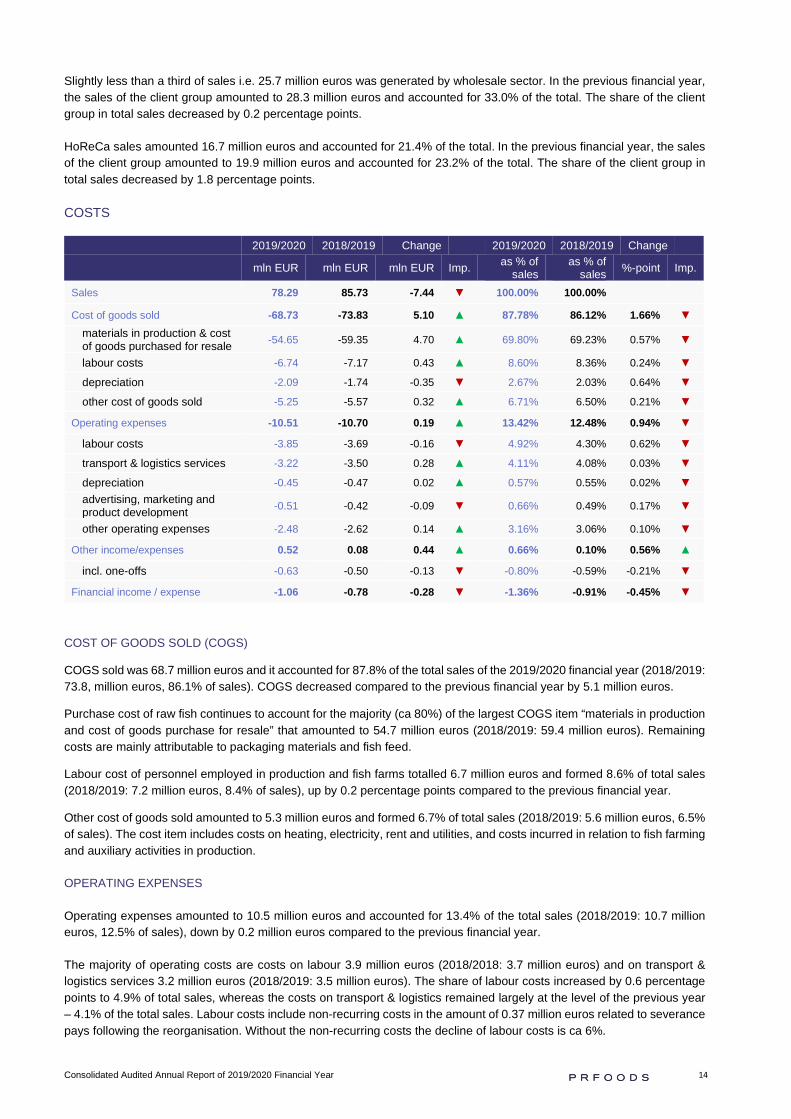
COSTS
COST OF GOODS SOLD (COGS)
COGS sold was 68.7 million euros and it accounted for 87.8% of the total sales of the 2019/2020 financial year (2018/2019: 73.8, million euros, 86.1% of sales). COGS decreased compared to the previous financial year by 5.1 million euros.
Purchase cost of raw fish continues to account for the majority (ca 80%) of the largest COGS item “materials in production and cost of goods purchase for resale” that amounted to 54.7 million euros (2018/2019: 59.4 million euros). Remaining costs are mainly attributable to packaging materials and fish feed.
Labour cost of personnel employed in production and fish farms totalled 6.7 million euros and formed 8.6% of total sales (2018/2019: 7.2 million euros, 8.4% of sales), up by 0.2 percentage points compared to the previous financial year.
Other cost of goods sold amounted to 5.3 million euros and formed 6.7% of total sales (2018/2019: 5.6 million euros, 6.5% of sales). The cost item includes costs on heating, electricity, rent and utilities, and costs incurred in relation to fish farming and auxiliary activities in production.
OPERATING EXPENSES
Operating expenses amounted to 10.5 million euros and accounted for 13.4% of the total sales (2018/2019: 10.7 million euros, 12.5% of sales), down by 0.2 million euros compared to the previous financial year.
The majority of operating costs are costs on labour 3.9 million euros (2018/2018: 3.7 million euros) and on transport & logistics services 3.2 million euros (2018/2019: 3.5 million euros). The share of labour costs increased by 0.6 percentage points to 4.9% of total sales, whereas the costs on transport & logistics remained largely at the level of the previous year – 4.1% of the total sales. Labour costs include non-recurring costs in the amount of 0.37 million euros related to severance pays following the reorganisation. Without the non-recurring costs the decline of labour costs is ca 6%.
2019/2020 2018/2019 Change 2019/2020 2018/2019 Change
mln EUR mln EUR mln EUR Imp. as % of sales
as % of sales %-point Imp.
Sales 78.29 85.73 -7.44 ▼ 100.00% 100.00%
Cost of goods sold -68.73 -73.83 5.10 ▲ 87.78% 86.12% 1.66% ▼ materials in production & cost of goods purchased for resale -54.65 -59.35 4.70 ▲ 69.80% 69.23% 0.57% ▼
labour costs -6.74 -7.17 0.43 ▲ 8.60% 8.36% 0.24% ▼
depreciation -2.09 -1.74 -0.35 ▼ 2.67% 2.03% 0.64% ▼
other cost of goods sold -5.25 -5.57 0.32 ▲ 6.71% 6.50% 0.21% ▼
Operating expenses -10.51 -10.70 0.19 ▲ 13.42% 12.48% 0.94% ▼
labour costs -3.85 -3.69 -0.16 ▼ 4.92% 4.30% 0.62% ▼
transport & logistics services -3.22 -3.50 0.28 ▲ 4.11% 4.08% 0.03% ▼
depreciation -0.45 -0.47 0.02 ▲ 0.57% 0.55% 0.02% ▼ advertising, marketing and product development -0.51 -0.42 -0.09 ▼ 0.66% 0.49% 0.17% ▼
other operating expenses -2.48 -2.62 0.14 ▲ 3.16% 3.06% 0.10% ▼
Other income/expenses 0.52 0.08 0.44 ▲ 0.66% 0.10% 0.56% ▲
incl. one-offs -0.63 -0.50 -0.13 ▼ -0.80% -0.59% -0.21% ▼
Financial income / expense -1.06 -0.78 -0.28 ▼ -1.36% -0.91% -0.45% ▼
Consolidated Audited Annual Report of 2019/2020 Financial Year 15
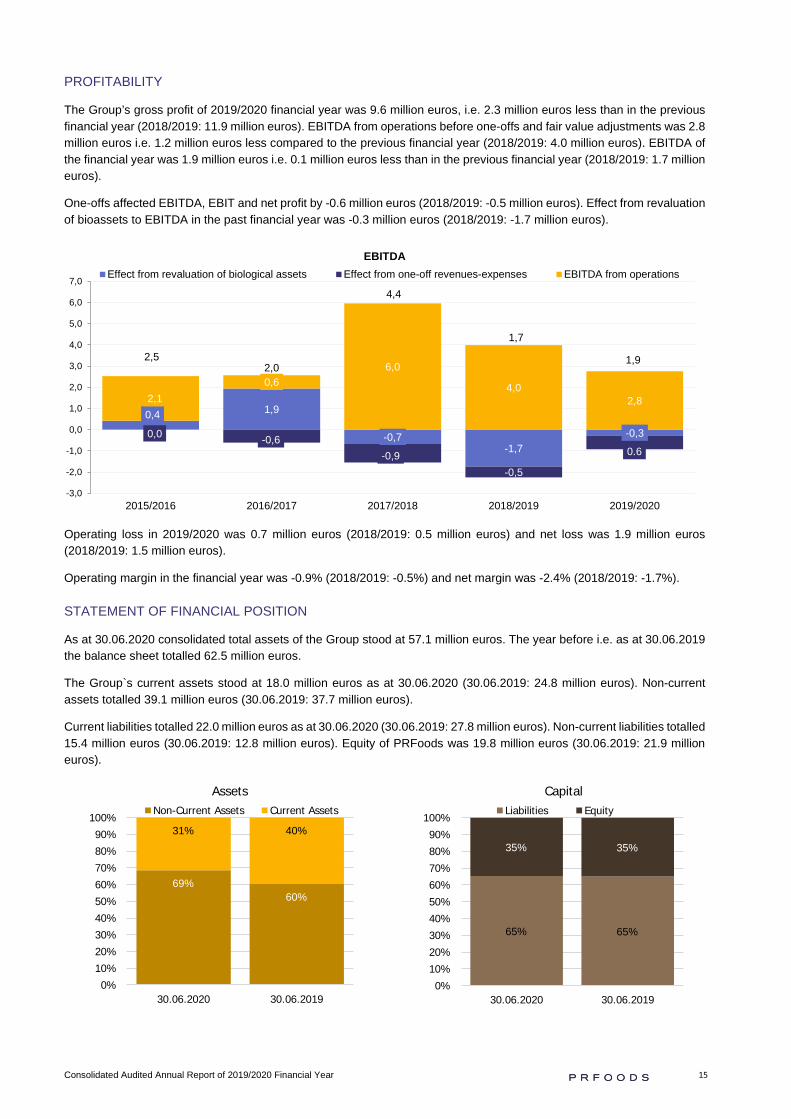
PROFITABILITY
The Group’s gross profit of 2019/2020 financial year was 9.6 million euros, i.e. 2.3 million euros less than in the previous financial year (2018/2019: 11.9 million euros). EBITDA from operations before one-offs and fair value adjustments was 2.8 million euros i.e. 1.2 million euros less compared to the previous financial year (2018/2019: 4.0 million euros). EBITDA of the financial year was 1.9 million euros i.e. 0.1 million euros less than in the previous financial year (2018/2019: 1.7 million euros).
One-offs affected EBITDA, EBIT and net profit by -0.6 million euros (2018/2019: -0.5 million euros). Effect from revaluation of bioassets to EBITDA in the past financial year was -0.3 million euros (2018/2019: -1.7 million euros).
Operating loss in 2019/2020 was 0.7 million euros (2018/2019: 0.5 million euros) and net loss was 1.9 million euros (2018/2019: 1.5 million euros).
Operating margin in the financial year was -0.9% (2018/2019: -0.5%) and net margin was -2.4% (2018/2019: -1.7%).
STATEMENT OF FINANCIAL POSITION
As at 30.06.2020 consolidated total assets of the Group stood at 57.1 million euros. The year before i.e. as at 30.06.2019 the balance sheet totalled 62.5 million euros.
The Group`s current assets stood at 18.0 million euros as at 30.06.2020 (30.06.2019: 24.8 million euros). Non-current assets totalled 39.1 million euros (30.06.2019: 37.7 million euros).
Current liabilities totalled 22.0 million euros as at 30.06.2020 (30.06.2019: 27.8 million euros). Non-current liabilities totalled 15.4 million euros (30.06.2019: 12.8 million euros). Equity of PRFoods was 19.8 million euros (30.06.2019: 21.9 million euros).
0,4 1,9
-0,7-1,7
-0,30,0 -0,6-0,9
-0,5
0.6
2,10,6
6,0
4,02,8
2,52,0
4,4
1,7
1,9
-3,0
-2,0
-1,0
0,0
1,0
2,0
3,0
4,0
5,0
6,0
7,0
2015/2016 2016/2017 2017/2018 2018/2019 2019/2020
EBITDAEffect from revaluation of biological assets Effect from one-off revenues-expenses EBITDA from operations
60%69%
40%31%
0%10%20%30%40%50%60%70%80%90%
100%
30.06.201930.06.2020
AssetsNon-Current Assets Current Assets
65%65%
35%35%
0%10%20%30%40%50%60%70%80%90%
100%
30.06.201930.06.2020
CapitalLiabilities Equity

Consolidated Audited Annual Report of 2019/2020 Financial Year 16
As at the end of the financial year, the Group’s cash and cash equivalents amounted to 2.3 million euros, i.e. 4.0% of the balance sheet total (30.06.2019: 2.6 million euros, 4.1% of the balance sheet total).
Receivables and prepayments amounted to 3.6 million euros as at 30.06.2020, down by 1.7 million euros compared to 30.06.2019, when receivables and prepayments amounted to 5.3 million euros.
As at the end of the financial year, inventories amounted to 7.9 million euros, down by 4.1 million euros compared to the end of the previous financial year i.e. from 12.0 million euros.
Biological assets stood at 4.2 million euros as at 30.06.2020 (30.06.2019: 4.9 million euros), down by 0.7 million euros compared to the end of the previous financial year. Biomass volume as at 30.06.2020 was 945 tonnes (30.06.2019: 987 tonnes), down by 42 tonnes compared to the end of the previous financial year.
Tangible assets of the Group were as at the end of the financial year 16.2 million euros (30.06.2019: 14.5 million euros) and intangible assets were 22.7 million euros (30.06.2019: 23.0 million euros), up by 1.6 million euros and down by 0.3 million euros, respectively, compared to the end of the previous financial year.
Current loans and borrowings of the Group were as at 30.06.2020 10.6 million euros (30.06.2019: 13.5 million euros), down by 2.9 million euros over a year.
Payables amounted to 11.1 million euros as at 30.06.2020 (30.06.2019: 14.1 million euros), down by 3.0 million euros compared to the end of the previous financial year. Trade payables decreased by 2.3 million euros, tax payables decreased by 0.6 million euros, liabilities from business combinations decreased by 0.3 million euros.
Non-current interest-bearing liabilities stood at 12.4 million euros as at the end of the financial year (30.06.2019: 9.5 million euros).
Deferred tax liabilities decreased over the financial year by 0.1 million euros to 1.9 million euros from 2.0 million euros as at the end of the previous financial year.
The registered share capital of the Group was 7.7 million euros as at 30.06.2020 (30.06.2019: 7.7 million euros).
CASH FLOWS
PRFoods’ cash and cash equivalents totalled 2.6 million euros at the beginning of the financial year of 2019/2020 and 2.3 million euros at the end of the financial year, the period’s cash flow amounted to -0.3 million euros.
Cash flow from operations was +4.5 million euros for the 2019/2020 financial year and +4.3 million euros in the previous financial year. Cash flow from investment activities was in the financial year -2.1 million euros and -4.4 million euros the previous financial year. Cash flow from financing activities totalled -2.8 million euros during the financial year compared to -3.3 million euros in the previous financial year.
CHANGE IN CASH FLOWS 2019/2020 VS 2018/2019
2,6
4,5
-2,1-2,8
2,3
6,04,3
-4,4-3,3
2,6
-6,0
-4,0
-2,0
0,0
2,0
4,0
6,0
8,0
Opening balance30.06
Cash flow fromoperations
Cash flow frominvestments
Cash flow fromfinancing
Closing balance 30.06
2019/2020 2018/2019

Consolidated Audited Annual Report of 2019/2020 Financial Year 17
INVESTMENTS
PRFoods’ investments into tangible and intangible assets during the 2019/2020 amounted to 2.6 million euros (2018/2019: 2.6 million euros).
The largest investments of the financial year were investments to machinery and equipment, which accounted for nearly a half of the total. During the financial year rebranding and the launch of the UK’s new package design was capitalized to intangible assets.
During the financial year, the Group continues to invest into production equipment and software to improve the efficiency of the production process. In addition, there are some investments planned to upgrade the current equipment. In fish farming, the largest investments are related to already acquired fish farms and to planned-to-be fish farms in Estonia. Also, the Group continues to develop its trademark “Heimon Kala”.
2,0
1,1
1,6
2,6 2,6
42,9%
-45,0%
45,5% 61,6%
0,1%
12m 15 12m 16 18m 17/18 12m 18/19 12m 19/20
Investments, mln EUR
12 y-o-y, %
Machinery and
Equipment46%
Buildings18%
Other assets
1%
Transportation equiment
7%
Intangibles28%
Investments 2019/2020

Consolidated Audited Annual Report of 2019/2020 Financial Year 18
PERSONNEL
There were on average 318 employees in the Group during the financial year compared to the average number of employees of 361 in the previous financial year. The Group’s labour costs decreased from 10.9 million euros in the 2018/2019 financial year to 10.6 million euros in 2019/2020. Manufacturing labour costs amounted to 6.7 million euros (2018/2019: 7.2 million euros), a decrease by 0.5 million euros compared to the previous financial year. The labour costs of support staff totalled 3.9 million euros during the reporting period, an increase by 0.1 million euros compared to the previous financial year (2018/2019: 3.7 million euros).
2019/2020 2018/2019 2017/2018 2016/2017 2015/2016
Average number of employees 318 361 368 196 211
Finland 81 92 92 39 41
Estonia 106 127 134 135 148
Great Britain 113 121 117 0 0
Sweden 18 21 25 22 22
Payroll expense, th EUR 10,571 10,857 10,415 4,738 5,030
Monthly average payroll expense per employee, th EUR 2.77 2.50 2.36 2.02 1.98
31
31
36
32
30
147
130
266
261
226
10
10
15
15
15
8
9
16
19
17
15
16
35
34
30
0 50 100 150 200 250 300 350
2015/2016
2016/2017
2017/2018
2018/2019
2019/2020
Employees per area of activity
Fishfarming Production Logistics Sales Admin
148
135
134
127
106
41
39
92
92
81
22
22
25
21
18
0
0
117
121
113
0 50 100 150 200 250 300 350
2015/2016
2016/2017
2017/2018
2018/2019
2019/2020
Employees per country
Estonia Finland Sweden Great Britain

Consolidated Audited Annual Report of 2019/2020 Financial Year 19
FISH FARMING
The competitive advantage of the Group is its vertical integration – fish farming, production and sales. About two thirds of the raw trout used in the Group’s production is harvested from the Group’s own fish farms in the lakes in Sweden, in the archipelago in Turku area in Finland and in coastal area of Saaremaa, Estonia, ensuring that customers receive fast and high-quality deliveries.
Vertical integration enables the Group to reduce costs in certain phases of fish farming and to also enhance control foremost over fish processing and marketing. In the fish business, as fish are livestock, the quality assurance in the technological process has keenly to be maintained throughout the entire product lifecycle. In addition to improved cost control, the vertical integration enables to reduce risks in fish farming, for instance due to poor quality of feed or base materials, and to secure the volume required for processing as well as price stability of raw material.
MARKET PRICE OF FISH
The fish production industry is extremely dependent on availability and the price of raw fish. Large producers make their production plans for three years in advance as it is difficult and expensive in shorter perspective to adapt a fish farm’s production cycle to market needs. Therefore, the world market fish supply is relatively rigid in the short-term, while demand is somewhat shifting depending on the season. This imbalance in fish supply and demand results in constantly fluctuating price of raw fish. Moreover, the far-reaching change in supply chains during the past month in connection with the spread of the virus has increased the amplitude and unpredictability of prices. The Group counters the impact of external environment and volatility of fish price through the changes of the Group’s production and sales strategy.
MARKET PRICE OF FISH AT THE END OF PERIOD
The Group monitors market prices for salmon and rainbow trout: salmon prices from the Nasdaq trading environment and rainbow trout prices from Akvafakta (Norwegian fish industry association) summaries.
EUR/kg 30.06.2020 30.06.2019 30.06.20 vs 30.06.19 30.06.2018 30.06.20 vs
30.06.18 30.06.2017 30.06.20 vs 30.06.17
Salmon 5.31 5.74 -7.5% 5.82 -8.8% 7.30 -27.3%
Rainbow trout 4.36 5.76 -24.4% 6.47 -32.6% 8.11 -46.2%
As at the end of the reporting period the price of salmon has decreased by 7.5% and the price of rainbow trout by 24.4% compared to the prices a year ago. Over the two-year period, the price of salmon has decreased by 8.8% and the trout by 32.6%. The price of salmon has decreased by 27.3% and of rainbow trout by 46.2% compared to the prices three years ago.
Överumans Fisk AB fish farm in Sweden

Consolidated Audited Annual Report of 2019/2020 Financial Year 20
The graphs below illustrate weekly average prices of salmon and rainbow trout.
EXPORT PRICE OF NORWGIAN SALMON
EXPORT PRICE OF NORWGIAN RAINBOW TROUT
AVERAGE MARKET PRICE OF FISH OF THE PERIOD
EUR/kg 2019/2020 2018/2019 19/20 vs 18/19 2017/2018 19/20 vs 17/18 2016/2017 19/20 vs 16/17
Salmon 5.57 6.03 -7.6% 6.05 -7.9% 7.04 -20.8%
Rainbow trout 5.14 5.92 -13.1% 6.32 -18.6% 7.00 -26.6%
The average market price of salmon during the reporting period has decreased by 7.6% and the price of rainbow trout by 13.1% compared to the average prices a year ago. Compared to the average prices of a comparable period two years ago the average prices of salmon and trout have decreased by 14.4% and 15.5%, respectively. The average fish prices have decreased compared to the prices three years ago: salmon by 20.8% and rainbow trout by 26.6%.
3,5
4,5
5,5
6,5
7,5
8,5
3,5
4,5
5,5
6,5
7,5
8,5
27 29 31 33 35 37 39 41 43 45 47 49 51 1 3 5 7 9 11 13 15 17 19 21 23 25
EUR/kg
WEEK
2016/2017 2017/2018 2018/2019 2019/2020
Source: Nasdaq Salmon price
3,5
4,5
5,5
6,5
7,5
8,5
3,5
4,5
5,5
6,5
7,5
8,5
27 29 31 33 35 37 39 41 43 45 47 49 51 1 3 5 7 9 11 13 15 17 19 21 23 25
EUR/kg
WEEK
2016/2017 2017/2018 2018/2019 2019/2020
Source: akvafakta.no

Consolidated Audited Annual Report of 2019/2020 Financial Year 21
BIOLOGICAL ASSETS
Biological assets in PRFoods’ fish farms is rainbow trout (Oncorhynchus mykiss) fish stock accounted in live weight.
The Group uses the Norwegian export statistics (source: akvafakta.no) to assess the value of rainbow trout’s stock. For assessing the value of whitefish stock, the monthly market price survey of the Finnish Fish Farmers’ Association is used. When the price of raw fish increases or decreases, so does the value of fish harvested in fish farms of PRFoods, having either a positive or a negative impact on the Group’s financial results.
CHANGE IN BIOLOGICAL ASSETS, TONNES
2019/2020 2018/2019 Change, tonnes
2019/2020 vs 2018/2019
Change, % 2019/2020 vs
2018/2019
Biomass* at the beginning of the period 987 1,184 -197 -16.6%
Biomass at the end of the period 945 987 -42 -4.2%
Harvested fish (in live weight) 1,933 1,900 33 1.7%
* Biomass – the amount / mass of living substance that characterizes the volume of the living substance Biological assets totalled 945 tonnes as at 30.06.2020, a decrease by 42 tonnes, i.e. 4.2% compared to the same period last year. A total of 1,933 tonnes fish was harvested during the 12 months of the financial year, i.e. 33 tonnes or 1.7% more compared to the same period a year ago.
BIOMASS VOLUME AND AVERAGE PRICE, EUR/KG
2019/2020 2018/2019 Change, mln EUR
2019/2020 vs 2018/2019
Change, % 2019/2020 vs
2018/2019
Biological assets, mln EUR 4.25 4.92 -0.67 -13.7%
Biomass volume, tonnes 945 987 -42 -4.2%
Average price, EUR/kg 4.50 4.99 -0.49 -9.9%
Fair value adjustment of biological assets, mln EUR -0.29 -1.74 1.45 -83.3%
The fair value of biological assets was 4.2 million euros compared to 4.9 million euros a year ago. Average price of biomass was 4.50 euros per kg compared to 4.99 euros per kg during the comparable period a year ago.
Fish farmed within the Group is processed in production buildings of Heimon Kala Oy, Finland and Vettel OÜ, Estonia.
1 226
1 414
1 184
987 9457,4%
15,3%
-16,3% -16,6%
-4,2%
2015/2016 2016/2017 2017/2018 2018/2019 2019/2020
Biomass volume, tonnes
y-o-y, %
2 1071 975
2 337
1 900 1 933
23,0%
-6,3%
18,3%
-18,7%
1,7%
2015/2016 2016/2017 2017/2018 2018/2019 2019/2020
Harvested volume, tonnes
y-o-y, %
Consolidated Audited Annual Report of 2019/2020 Financial Year 22
MANAGEMENT AND SUPERVISORY BOARDS
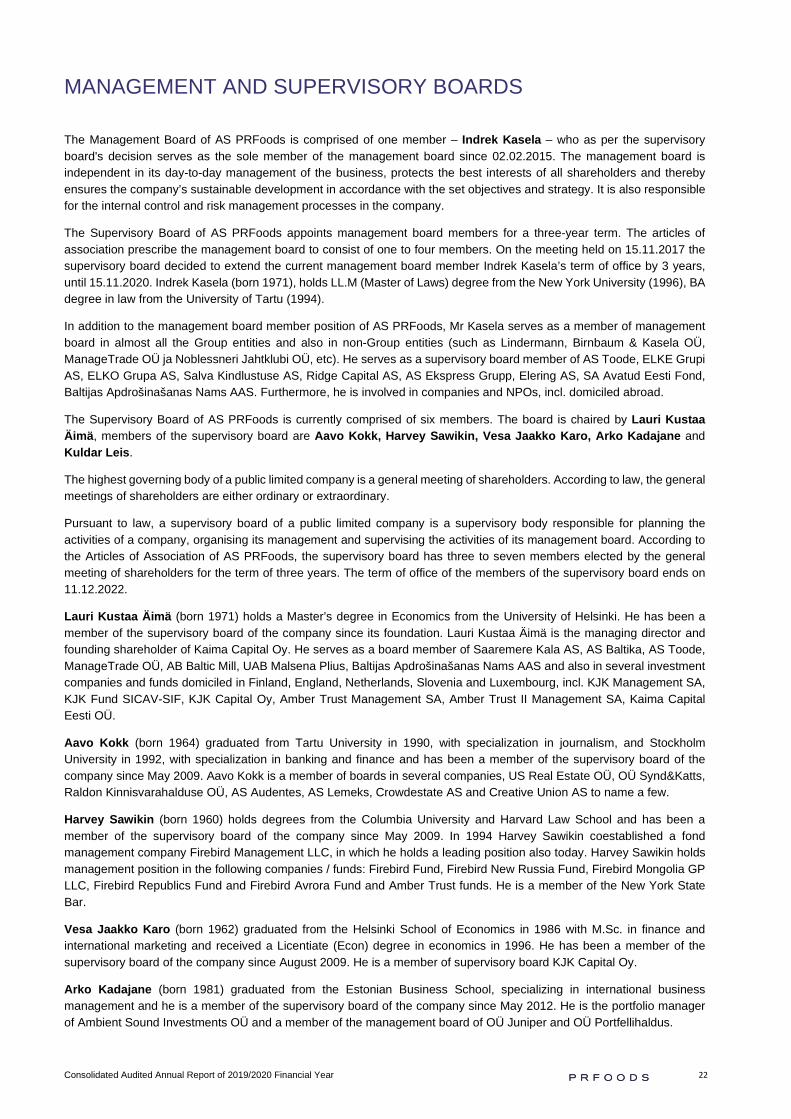
The Management Board of AS PRFoods is comprised of one member – Indrek Kasela – who as per the supervisory board's decision serves as the sole member of the management board since 02.02.2015. The management board is independent in its day-to-day management of the business, protects the best interests of all shareholders and thereby ensures the company’s sustainable development in accordance with the set objectives and strategy. It is also responsible for the internal control and risk management processes in the company.
The Supervisory Board of AS PRFoods appoints management board members for a three-year term. The articles of association prescribe the management board to consist of one to four members. On the meeting held on 15.11.2017 the supervisory board decided to extend the current management board member Indrek Kasela’s term of office by 3 years, until 15.11.2020. Indrek Kasela (born 1971), holds LL.M (Master of Laws) degree from the New York University (1996), BA degree in law from the University of Tartu (1994).
In addition to the management board member position of AS PRFoods, Mr Kasela serves as a member of management board in almost all the Group entities and also in non-Group entities (such as Lindermann, Birnbaum & Kasela OÜ, ManageTrade OÜ ja Noblessneri Jahtklubi OÜ, etc). He serves as a supervisory board member of AS Toode, ELKE Grupi AS, ELKO Grupa AS, Salva Kindlustuse AS, Ridge Capital AS, AS Ekspress Grupp, Elering AS, SA Avatud Eesti Fond, Baltijas Apdrošinašanas Nams AAS. Furthermore, he is involved in companies and NPOs, incl. domiciled abroad.
The Supervisory Board of AS PRFoods is currently comprised of six members. The board is chaired by Lauri Kustaa Äimä, members of the supervisory board are Aavo Kokk, Harvey Sawikin, Vesa Jaakko Karo, Arko Kadajane and Kuldar Leis.
The highest governing body of a public limited company is a general meeting of shareholders. According to law, the general meetings of shareholders are either ordinary or extraordinary.
Pursuant to law, a supervisory board of a public limited company is a supervisory body responsible for planning the activities of a company, organising its management and supervising the activities of its management board. According to the Articles of Association of AS PRFoods, the supervisory board has three to seven members elected by the general meeting of shareholders for the term of three years. The term of office of the members of the supervisory board ends on 11.12.2022.
Lauri Kustaa Äimä (born 1971) holds a Master’s degree in Economics from the University of Helsinki. He has been a member of the supervisory board of the company since its foundation. Lauri Kustaa Äimä is the managing director and founding shareholder of Kaima Capital Oy. He serves as a board member of Saaremere Kala AS, AS Baltika, AS Toode, ManageTrade OÜ, AB Baltic Mill, UAB Malsena Plius, Baltijas Apdrošinašanas Nams AAS and also in several investment companies and funds domiciled in Finland, England, Netherlands, Slovenia and Luxembourg, incl. KJK Management SA, KJK Fund SICAV-SIF, KJK Capital Oy, Amber Trust Management SA, Amber Trust II Management SA, Kaima Capital Eesti OÜ.
Aavo Kokk (born 1964) graduated from Tartu University in 1990, with specialization in journalism, and Stockholm University in 1992, with specialization in banking and finance and has been a member of the supervisory board of the company since May 2009. Aavo Kokk is a member of boards in several companies, US Real Estate OÜ, OÜ Synd&Katts, Raldon Kinnisvarahalduse OÜ, AS Audentes, AS Lemeks, Crowdestate AS and Creative Union AS to name a few.
Harvey Sawikin (born 1960) holds degrees from the Columbia University and Harvard Law School and has been a member of the supervisory board of the company since May 2009. In 1994 Harvey Sawikin coestablished a fond management company Firebird Management LLC, in which he holds a leading position also today. Harvey Sawikin holds management position in the following companies / funds: Firebird Fund, Firebird New Russia Fund, Firebird Mongolia GP LLC, Firebird Republics Fund and Firebird Avrora Fund and Amber Trust funds. He is a member of the New York State Bar.
Vesa Jaakko Karo (born 1962) graduated from the Helsinki School of Economics in 1986 with M.Sc. in finance and international marketing and received a Licentiate (Econ) degree in economics in 1996. He has been a member of the supervisory board of the company since August 2009. He is a member of supervisory board KJK Capital Oy.
Arko Kadajane (born 1981) graduated from the Estonian Business School, specializing in international business management and he is a member of the supervisory board of the company since May 2012. He is the portfolio manager of Ambient Sound Investments OÜ and a member of the management board of OÜ Juniper and OÜ Portfellihaldus.

Consolidated Audited Annual Report of 2019/2020 Financial Year 23
Kuldar Leis (born 1968) graduated from the University of Tartu in 1993, specializing in credit and finance. He also holds a diploma in dairy technology. Kuldar Leis was the chairman of the management board of the company since its foundation until 15 May 2013. Since 29 May 2013, he is a member of the supervisory board of PRFoods. He is a member of supervisory boards of Saaremere Kala AS, AS Linda Nektar, AS Bercman Technologies and Competence Center of Food and Fermentation Technology. He is also a member of management boards of Rododendron OÜ, Solarhouse OÜ, MTÜ Põlva Tenniseklubi and MTÜ Põlva Käsipalliklubi.
Information on the education and careers of the members of the supervisory board as well as their management positions in other companies is available on AS PRFoods’ website www.prfoods.ee.
PRFOODS’ SHARES HELD BY THE MEMBERS OF THE MANAGEMENT AND SUPERVISORY BOARDS AND THE PERSONS/COMPANIES RELATED TO THEM AS AT 30.06.2020:
Shareholder number of shares ownership interest
Member of the management board – Indrek Kasela 1,613,617 4.17%
Member of the supervisory board – Kuldar Leis 1,223,050 3.16%
Member of the supervisory board – Lauri Kustaa Äimä 125,000 0.32%
Member of the supervisory board – Vesa Jaakko Karo 90,000 0.23%
Member of the supervisory board – Arko Kadajane 8,928 0.02%
Member of the supervisory board – Harvey Sawikin 0 -
Member of the supervisory board – Aavo Kokk 0 -
Total number of shares owned by the members of the supervisory and management boards 3,060,595 7.91%

Consolidated Audited Annual Report of 2019/2020 Financial Year 24
SHARE AND SHAREHOLDERS
The registered share capital of AS PRFoods is 7,736,572 euros which is divided to 38,682,860 ordinary shares without nominal value. All shares are freely transferable and of the same kind, i.e. have equal voting and dividend rights.
ISIN EE3100101031 Issued shares 38,682,860
Ticker PRF1T Listed shares 38,682,860
Market BALTIC MAIN LIST Listing date 5.05.2010
Nominal 0 EUR Minimum quantity of tradable securities 1 share
AS PRFoods shares are listed on the main list of Nasdaq Tallinn Stock Exchange since 05.05.2010. There is no official market maker for the shares. AS PRFoods share is a component in OMX Tallinn General Index and in OMX Baltic General Index.
AS PRFoods has twice reduced the nominal value of shares with making payments to shareholders: in 2012 by 10 euro cents per share and in 2015 by 30 euro cents per share. The general meeting of shareholders from 26.05.2016 resolved to adopt shares without nominal value and on 30.06.2016 the commercial registry registered the shares without nominal value. The accountable nominal value of a share is 0.20 euro (nominal value of a share was 10.0 Estonian kroons until 13.04.2011, 0.60 euro till 03.09.2012, and 0.50 euro till 02.10.2015).
SHARE PRICE, INDICES AND TRADING ACTIVITY
The Baltic Benchmark index decreased 1.22% over one year, and the Tallinn Stock Exchange All-Share index decreased by 2.76%, and PRFoods share price decreased by 21.72%.
Index / Share Ticker 30.06.2020 30.06.2019 Change
● PRF1T, EUR PRF1T 0.418 0.534 -21.72%
● OMX Baltic Benchmark GI OMXBBGI 947.82 959.52 -1.22%
● OMX Tallinn GI OMXTGI 1,219.97 1,254.55 -2.76%
0
20
40
60
80
100
120
140
0,35
0,40
0,45
0,50
0,55
0,60
0,65
Jun 2019 Jul 2019 Aug 2019 Sep 2019 Oct 2019 Nov 2019 Dec 2019 Jan 2020 Feb 2020 Mar 2020 Apr 2020 May 2020
PRFoods share price, indices and no of traded shares per week
No of shares traded, th shares PRF1T OMXTGI, 30.06.2020 = 0.534 OMXBBGI, 30.06.2020 = 0.534
Source: Nasdaq Tallinn, PRFoods

Consolidated Audited Annual Report of 2019/2020 Financial Year 25
TRADING STATITICS
Trading Statistics, EUR (unless stated otherwise) 12m 2019/2020 12m 2018/2019 12m 2017/2018 12m 2016/2017 12m 2015/2016
Open 0.502 0.740 0.390 0.380 0.692
High 0.534 0.780 0.855 0.412 0.731
Low 0.361 0.490 0.366 0.354 0.349
Last 0.418 0.534 0.740 0.390 0.379
Traded volume, mln pc 1.34 2.20 3.92 2.61 2.53
No of trades 2,313 1,762 2,574 1,120 1,267
Average trade volume, shares 579 1,248 1,522 2,335 1,998
Turnover, mln 0.60 1.43 2.30 0.99 1.06
Market capitalisation, mln 16.17 20.66 28.63 15.09 14.66
A total of 2.313 trades were conducted with AS PRFoods’ shares during the financial year of 2019/2020 (12 months 2018/2019: 1,762 trades). During the period a total of 1.3 million shares changed hands (12 months 2018/2019: 2.2 million shares) forming 3.5% of the company’s shares. The average trade volume was 579 shares (12 months 2018/2019: months 2017/2018: 1,248 shares).
Turnover of share trading amounted to 0.60 million euros in the financial year of 2019/2020 compared to 1.43 million euros in the previous 12-months period. The highest share price during the financial year of 2018/2019 was 0.534 euros and the lowest was 0.361 euros; a year ago in the comparable period, the highest and the lowest price were 0.780 euros and 0.490 euros, respectively.
The closing price of the share was 0.418 euro as at 30.06.2020 and the company’s market capitalisation was 16.17 million euros. As at 30.06.2019 the closing price of the share was 0.534 euro and the company’s market capitalisation was 20.66 million euros.
THE DYNAMICS OF THE SHARE PRICE AND INDICES SINCE THE LISTING I.E. 5 MAY 2010 TO 30 OF JUNE 2020:
The decrease of AS PRFoods’ share price since its listing in 2010, adjusted with the capital reduction payments, is 9.2%. The Baltic Benchmark index has increased by 115.5% during this period, Tallinn Stock Exchange index by 103.9% and AS PRFoods’ share price (unadjusted with the reductions of the share’s nominal value in August 2012 and 2015 by 40 euro cents in total) has decreased by 53.0%. AS PRFoods has since the listing of its shares on the stock exchange paid to shareholders a total of 17.3 million euros in the form of dividends and in connection with share capital reductions.
-100%
-50%
0%
50%
100%
150%
200%
May 10 May 11 May 12 May 13 May 14 May 15 May 16 May 17 May 18 May 19 May 20
Cha
nge
of s
hare
pric
e an
d in
dice
s, %
PRFoods adjusted share price PRFoods share price OMXTGI OMXBBGI
Consolidated Audited Annual Report of 2019/2020 Financial Year 26
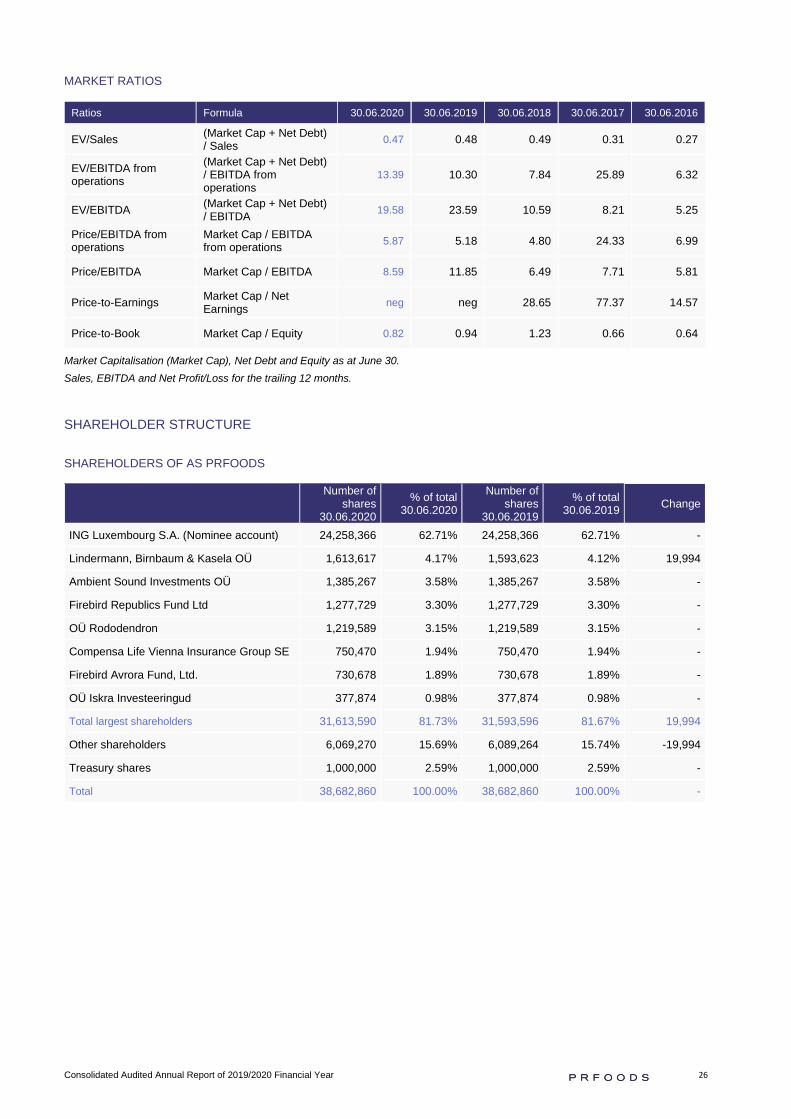
MARKET RATIOS
Ratios Formula 30.06.2020 30.06.2019 30.06.2018 30.06.2017 30.06.2016
EV/Sales (Market Cap + Net Debt) / Sales 0.47 0.48 0.49 0.31 0.27
EV/EBITDA from operations
(Market Cap + Net Debt) / EBITDA from operations
13.39 10.30 7.84 25.89 6.32
EV/EBITDA (Market Cap + Net Debt) / EBITDA 19.58 23.59 10.59 8.21 5.25
Price/EBITDA from operations
Market Cap / EBITDA from operations 5.87 5.18 4.80 24.33 6.99
Price/EBITDA Market Cap / EBITDA 8.59 11.85 6.49 7.71 5.81
Price-to-Earnings Market Cap / Net Earnings neg neg 28.65 77.37 14.57
Price-to-Book Market Cap / Equity 0.82 0.94 1.23 0.66 0.64
Market Capitalisation (Market Cap), Net Debt and Equity as at June 30. Sales, EBITDA and Net Profit/Loss for the trailing 12 months.
SHAREHOLDER STRUCTURE
SHAREHOLDERS OF AS PRFOODS
Number of
shares 30.06.2020
% of total 30.06.2020
Number of shares
30.06.2019
% of total 30.06.2019 Change
ING Luxembourg S.A. (Nominee account) 24,258,366 62.71% 24,258,366 62.71% -
Lindermann, Birnbaum & Kasela OÜ 1,613,617 4.17% 1,593,623 4.12% 19,994
Ambient Sound Investments OÜ 1,385,267 3.58% 1,385,267 3.58% -
Firebird Republics Fund Ltd 1,277,729 3.30% 1,277,729 3.30% -
OÜ Rododendron 1,219,589 3.15% 1,219,589 3.15% -
Compensa Life Vienna Insurance Group SE 750,470 1.94% 750,470 1.94% -
Firebird Avrora Fund, Ltd. 730,678 1.89% 730,678 1.89% -
OÜ Iskra Investeeringud 377,874 0.98% 377,874 0.98% -
Total largest shareholders 31,613,590 81.73% 31,593,596 81.67% 19,994
Other shareholders 6,069,270 15.69% 6,089,264 15.74% -19,994
Treasury shares 1,000,000 2.59% 1,000,000 2.59% -
Total 38,682,860 100.00% 38,682,860 100.00% -
Consolidated Audited Annual Report of 2019/2020 Financial Year 27
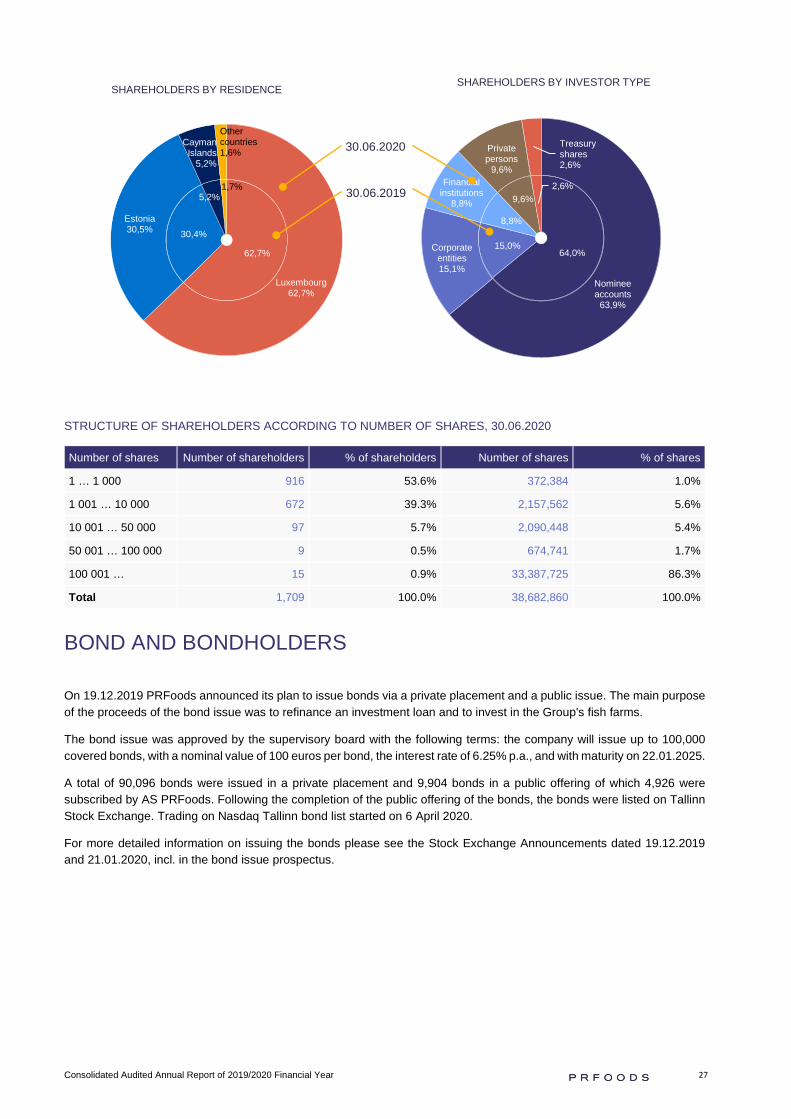
STRUCTURE OF SHAREHOLDERS ACCORDING TO NUMBER OF SHARES, 30.06.2020
Number of shares Number of shareholders % of shareholders Number of shares % of shares
1 … 1 000 916 53.6% 372,384 1.0%
1 001 … 10 000 672 39.3% 2,157,562 5.6%
10 001 … 50 000 97 5.7% 2,090,448 5.4%
50 001 … 100 000 9 0.5% 674,741 1.7%
100 001 … 15 0.9% 33,387,725 86.3%
Total 1,709 100.0% 38,682,860 100.0%
BOND AND BONDHOLDERS
On 19.12.2019 PRFoods announced its plan to issue bonds via a private placement and a public issue. The main purpose of the proceeds of the bond issue was to refinance an investment loan and to invest in the Group's fish farms.
The bond issue was approved by the supervisory board with the following terms: the company will issue up to 100,000 covered bonds, with a nominal value of 100 euros per bond, the interest rate of 6.25% p.a., and with maturity on 22.01.2025.
A total of 90,096 bonds were issued in a private placement and 9,904 bonds in a public offering of which 4,926 were subscribed by AS PRFoods. Following the completion of the public offering of the bonds, the bonds were listed on Tallinn Stock Exchange. Trading on Nasdaq Tallinn bond list started on 6 April 2020.
For more detailed information on issuing the bonds please see the Stock Exchange Announcements dated 19.12.2019 and 21.01.2020, incl. in the bond issue prospectus.
62,7%
30,4%
5,2%1,7%
Luxembourg62,7%
Estonia30,5%
Cayman Islands
5,2%
Other countries1,6%
SHAREHOLDERS BY RESIDENCE
64,0%15,0%
8,8%
9,6%2,6%
Nominee accounts
63,9%
Corporate entities15,1%
Financial institutions
8,8%
Private persons
9,6%
Treasury shares2,6%
SHAREHOLDERS BY INVESTOR TYPE
30.06.2020
30.06.2019

Consolidated Audited Annual Report of 2019/2020 Financial Year 28
BONDHOLDER STRUCTURE
THE LARGEST BONDHOLDERS OF AS PRFOODS
Value of bonds 30.06.2020
% of total 30.06.2020
Swedbank Pensionfund K60 3,940,000 39.4%
Swedbank Pensionfund K30 800,000 8.0%
Rietumu Banka JSC 750,000 7.5%
Spring Capital Growth Fund 1 505,300 5.1%
AS SEB Bankas 469,200 4.7%
Total largest bondholders 6,464,500 64.6%
Other bondholders 3,042,900 30.4%
Treasury bonds 492,600 4.9%
Total 10,000,000 100.00%
BONDHOLDERS BY VALUE OF BONDS, 30.06.2020
Value of bonds Number of bondholders % of bondholders Value of bonds % of bond value
1 … 1 000 69 33.0% 44,400 0.4%
1 001 … 10 000 76 36.4% 328,100 3.3%
10 001 … 50 000 48 23.0% 1,137,000 11.4%
50 001 … 100 000 4 1.9% 314,500 3.1%
100 001 … 12 5.7% 8,176,000 81.8%
Total 209 100.0% 10,000,000 100.0%
0,0%0,0%0,0% 0,0%
Estonia84,6%
Germany7,5%
Latvia3,1%
Lithuania4,7% Other
countries0,1%
BONDHOLDERS BY RESIDENCE
Financial institutions
62,6%
Nominee accounts
15,2%
Corporate entities9,8%
Private persons
7,5%
Treasury bonds4,9%
BONDHOLDERS BY INVESTOR TYPE
30.06.2020

Consolidated Audited Annual Report of 2019/2020 Financial Year 29
SOCIAL RESPONSIBILITY
We believe that a responsible company does not focus on financial indicators only. Therefore, the environmental and social impact, i.e. the footprint that a company leaves with its existence, is also important to us. Being a part of the environment, we care about our employees, the community, our partners, society and nature.
We will make effort to develop Estonia as a sailing and maritime country and to restore maritime traditions. We are long-term supporters of the Muhu Väina (Moonsund) regatta, and we also supported the Ice Sailing World Championship in 2019. We have also participated in the Muhu Väina regatta with our team on Reval Cafe Elisa Sailing yacht in the amateur league. Ice hockey is undoubtedly the number one sport for Finns, and supporting local clubs is an honour for local entrepreneurs. PRFoods' Finnish subsidiary Heimon Kala Oy has long-term cooperation with the Hämeenlinna ice hockey team and contributed to the development of the Hämeenlinna ice rink.
We also consider the development of the local economic environment and cultural space important - in Estonia, Finland and Scotland, i.e. in all PRFoods' operating countries and home markets. Since 2018, we have helped the NPO Visit Saaremaa, also contributed to the NPO Estonian Culture Chamber, supported the Hanaholmen Business Forum in Finland, the Glasgow Culture Week in Scotland and the opening of the Arvo Pärt Center.
Our future is children and young athletes. We have supported the activities of these target groups in Estonia through the long-term support of Simple Session, in addition we helped to organize the Sumo European Championships in Tallinn. In cooperation with Postimees Group, we have supported the project initiated by them in 2018 and 2019: Successful people help deprived children (MTÜ Koos Laste Heaks). Through the Good Deed Impact Fund, we have also brought six very important initiatives to life in 2017-2020, which will solve acute problems in Estonian society – from education, social inequality, public health to the environment.
PRFoods' greatest asset is our people, we will continue to support the culture and economic life of our employees in our neighbourhood, to sponsor sports events and help deprived children.
ENVIRONMENTAL RESPONSIBILITY
As fish farmers and processors, we follow the principles of sustainable operations throughout the production chain. That is why it is very important for us to have an environmentally friendly feed so that it has a minimal impact on the environment. We also grow shellfish in our Saaremaa farm, which purify and filter water, reducing the environmental impact of fish farming. Our goal is to use environmentally friendly materials in Heimon Kala product packaging - the film and plastic have either been replaced with cardboard and wood pulp in some products or a partially recyclable film has been used. Investing in modern packaging machines and the use of solar energy will help us achieve all this.
The Group owns fish farms in Sweden, Finland and Estonia, as well as fish production facilities in Estonia, Finland and Great Britain. These facilities have an impact on the environment. As a company operating sustainably, we are aware of our global responsibility for preservation of natural resources and unharmed environment, which is why we attempt to keep the environmental impact of our activities at a minimum level and further reduce our ecological footprint by employing as cost-efficient resources as possible.
According to the Environmental Impact Assessment and Environmental Management System Act, fishing industry is an activity with a significant environmental impact. A possible impact of fish farms on nature is related to the emission of wastewater generated in farms and pollutants contained therein (mainly nitrogen and phosphorus) into seawater and lake water and, as a result, deterioration of water quality. Deterioration of water quality in turn may damage habitats or the living environment of birds and animals. Concentration and distribution of pollutants depends on the production technology used, on the quantity of fish feed and on sea currents, wind directions and other environmental factors.
Fish farming requires a water abstraction permit as an operating permit that is issued for a period of 7 to 10 years. We actively mitigate our environmental impact under the strict supervision of environmental authorities. We ensure adherence to all necessary measures for maximum reduction of the negative environmental impact in all main stages of fish production
Moonsund Regatta

Consolidated Audited Annual Report of 2019/2020 Financial Year 30
and processing in our sites. In addition, we contribute by deploying ecological technologies in our fish farms and production facilities. In our investments, we observe the principles of the corresponding BAT (Best Available Technique) method.
The Group has developed a new fish feed recipe that results in a 13.5% reduction in nitrogen emissions and a 30.3% reduction in phosphorus in the water. The work continues in this area with the next year’s aim to reduce the phosphorus release to 47.7% compared to standard feeds as phosphorus is limiting the formation of cyanobacteria. The new fish feed was tested in Saaremaa and Sweden in the summer of 2019 and the results are positive.
We have installed shellfish farming lines in Saaremaa at a cost of about 40 thousand euros and are currently gaining experience in industrial shellfish farming in Estonian coastal waters. According to calculations, shellfish farming should compensate 20% of the nitrogen and phosphorus emissions of fish farming.
In Finland, we have developed a completely new wastewater treatment solution to treat wastewater from fish gutting, and testing will begin in October 2019. The aim is to significantly improve the efficiency of nutrient purification from wastewater. After the tests, similar systems are planned to be introduced in Sweden and Estonia.
In Finland, we participated in a CWPharma study conducted in 2017-2018 analysing seabed sediments and investigating the impact of human activities and fish farming on seabed sediments, the results of which will be published in 2019.
In Sweden, we invested 691 thousand Swedish kronas to purchase a fully professional oil harvesting equipment to prevent oil in fish feed from leaking to beaches in the immediate vicinity.
All of our farms are equipped with state-of-the-art water quality monitoring sensors and the results of the water monitoring of all breeding sites are continuously visible through the cloud service.
We are actively involved in various innovation and environmental projects such as UKIPOLIS in Finland (design of sediment separation cushion in the Baltic Sea), Sustainable cage farming in Denmark and in the Joint Baltic Sea Fisheries Working Group.
In Sweden, we have conducted a number of large-scale environmental surveys in the past financial year with independent parties (continuous monitoring of terrestrial farm outlet water, bottom sediment survey in and near cage breeding) to effectively demonstrate the low environmental impact of modern fish farming. So far, the results of the analysis have proven that the environmental impact is minimal, and our previously presented estimates have tended to be conservative.
For several years we have been an innovation partner of the Finnish Natural Resources Center (LUKE) in carrying out various research on fish farming, and for the second year we are participating in a joint study by the Finnish Center for Natural Resources and Finnish Environment Institute (SYKE), which aims to measure the effects of the aquaculture environment with the help of Copernicus satellite.
As a packager of fishery products, the Group has been active in ensuring that the Group's packaging materials are friendly to the environment. Among other things, the Group is committed to improving sustainability and reducing food waste in combination with better product packaging on retail shelves.
During the last financial year, an innovative packaging solution was introduced, which, in addition to reducing the footprint by 70% when following the principles of recycling, further reduces the CO2 footprint by approximately 25% and the share of plastic in packaging by about 20%.
The use of plastic has been reduced in the group both in final product and in the production:
• The film packaging of the final product has been replaced by thinner ones.
• Production processes have been reorganized so that intermediate packaging of semi-finished products is not required, so the total volume of film packaging used has decreased.
The plastics are still used by the Group in packaging primarily due to a combination of its positive properties such as versatility, strength, lightness, stability, impermeability and maintaining products sterile. The light weight of plastic simplifies handling products throughout the production chain until it reaches an end client resulting in less transport emissions.
The Group 's choice of packaging manufacturers is also based on matching values, thus being guided by environmental aspects and sustainability.
As an international fish producer, the Group continues to focus its activities on moving towards environment friendly solutions throughout its production processes also in the coming years.

Consolidated Audited Annual Report of 2019/2020 Financial Year 31
REPORT ON CORPORATE GOVERNANCE
AS PRFoods organises its business activities on the basis of its articles of association and national legal norms, and as a public enterprise on the requirements of the Tallinn Stock Exchange, Corporate Governance Recommendations (CGR) compiled jointly by Tallinn Stock Exchange and the Estonian Financial Supervision Authority in 2005 and the principles of equal treatment of shareholders and investors. The companies listed on the NASDAQ Tallinn Stock Exchange are obligated to publish a corporate governance report as a part of their annual report describing if and how CGR principles are followed and if not, then point out what specifically accompanied by an explanation for such a deviation.
The Group’s report on Good Corporate Governance is available on the Group’s homepage www.prfoods.ee in the Governance subsection (http://prfoods.ee/about/governance/corporate-governance-reports).
EXERCISE OF SHAREHOLDERS RIGHTS
Every shareholder shall be ensured the right to participate in the general meeting, to speak in the general meeting on themes presented in the agenda, and to present reasoned questions and make proposals. The general meeting shall be conducted at the location of the issuer and at a reasonable time and place, ensuring that a majority of shareholders have the possibility to participate in the general meeting. In the notice calling the general meeting the issuer shall include the address to which the shareholders can send agenda questions related to the agenda. The circumstances on which the issuer withholds information and how a shareholder can file a dispute it shall also be brought out in the notice. In conformity with the principle of treating all shareholders equally a controlling stakeholder shall refrain from harming the rights of other shareholders.
On the general meeting held on 19.12.2019 two questions were asked by shareholders which were answered by the member of AS PRFoods management board Indrek Kasela. The questions and answers can be found in the minutes of the meeting and in the recording of the full general meeting the link of which is published on the homepage of the company.
EQUAL RIGHTS OF SHAREHOLDERS IN THE ARTICLES OF ASSOCIATION
The articles of association of the issuer do not grant different types of shares with rights resulting in unequal treatment of shareholders in voting.
AGREEMENTS BETWEEN SHAREHOLDERS
In case the issuer has information on agreements between shareholders on concerted exercise of shareholders rights, the information shall be available on the issuer’s homepage. The issuer has no information on such agreements being concluded.
PARTICIPATION IN A GENERAL MEETING IN PERSON OR BY PROXY
Issuers shall facilitate the personal participation of shareholders at the general meeting but shall not make it difficult for representatives to participate in and vote at the general meeting. The issuer shall notify shareholders as precisely as possible regarding the date, time and address of the general meeting. If an issuer itself or by his employees/representatives organizes the representation of a shareholder at a general meeting, it shall do so in such a manner that the orders given by the shareholder with regard to voting are executed. The representative of the issuer shall participate in the general meeting and shall be accessible to the shareholders during the holding of the general meeting.
CALLING OF A GENERAL MEETING AND INFORMATION TO BE PUBLISHED
Notice calling the general meeting is available on the issuer’s homepage including the essential information to be published for passing a resolution regarding a topic on the agenda at the general meeting to shareholders, including a proposition on profit distribution, draft articles of association with remarks on the proposed amendments; essential conditions and agreements or draft contracts for issuance of securities or other transactions connected with the company (e.g., merger, sale of property etc.), information regarding candidates for supervisory board members or auditors etc., and supervisory board’s propositions on topics on the agenda. On supervisory board member candidates, the information on the candidate’s positions in boards or other management bodies of other companies shall be provided.
The notice calling the general meeting and the documents pertaining it are published on the homepage of the company both in Estonian and English languages. The minutes and recording of the general meeting are published on the homepage of the company in the language the meeting was conducted.
If shareholders make substantive proposals or proposals diverging from those of the supervisory board it will be recorded in the minutes.

Consolidated Audited Annual Report of 2019/2020 Financial Year 32
PARTICIPATION IN A GENERAL MEETING, INCL. VIA MEANS OF COMMUNICATION EQUIPMENT
The meeting on 19.12.2019 was held in Estonian. The meeting was chaired neither by the chairman of the supervisory board of AS PRFoods nor by a member of the management board. A member of the management board participated on the meeting.
Issuers shall make participation in the general meeting possible via means of communication equipment (the Internet) provided the technical equipment is available and it is not too costly for the issuer. AS PRFoods lacks the adequate technical equipment and acquiring it would be too costly. In accordance with the policy of transparency, the company used the Webinar service of Nasdaq Baltic in conducting the general meeting. AS PRFoods made live broadcast of shareholder’s general meeting and answered to the additional questions. Indrek Kasela presented the results of the period. For technical reasons, participants of the webinar were unable to exercise their shareholders’ rights (voting). The meeting was recorded, and the recording is accessible via the link on the Group’s website www.prfoods.ee.
Covering of net loss was a separate agenda item on the general meeting and a separate resolution was passed.
RESPONSIBILITY AREAS OF MANAGEMENT BOARD MEMBERS
The responsibility areas of the management board members are approved by the management or supervisory board. The chairman of the supervisory board has concluded a contract of service with a member of the management board. The company’s management board has one member who performs the duties of the managing director and is responsible for the functioning of the company’s strategic areas, including integration of internal control and management processes with the company’s accounting procedures, both daily and periodical. The member of the management board shall not be at the same time a member of more than two management boards of an issuer and shall not be the chairman of the supervisory board of another issuer (unless the issuer is a group company). The AS PRFoods’, a holding structure void of everyday operational business activities, management consists of one member most efficiently corresponding to the needs of managing the company. Management bodies of subsidiaries active in fish farming, processing and sales have up to four members matching the business specifics and needs of the subsidiaries.
REMUNERATION PRINCIPLES OF MANAGEMENT BOARD MEMBERS
Basic wages, performance pay, severance packages, other payable benefits and bonus schemes of a management board member as well as the essential features of these shall be published in clear and unambiguous form on the homepage of the issuer and in the CGR report. Information published shall be deemed clear and unambiguous if it directly expresses the amount of expense to the issuer or the amount of foreseeable expense as of the day of disclosure. The chairman of the management board receives remuneration in accordance with the contract of the management board member. The remuneration and its principles are revisited once a year. The amount of the remuneration of the chairman of the management board is established with the contract of the management board member and is not to be disclosed as agreed by the parties. There are no bonus systems, i.e. no options, no retirement programmes, etc. in place for remuneration of the member of the management board. The management board member is entitled to receive a severance fee of up to 6 months remuneration.
SIGNIFICANT TRANSACTION OF A MANAGEMENT BOARD MEMBER WITH THE ISSUER
The supervisory board shall approve the transactions, which are significant to the issuer and concluded between the issuer and a member of its management board or another person connected/close to them and shall determine the terms of such transactions. The transactions approved by the supervisory board concluded between the issuer and a member of the management board or another person connected/close to them are published in the CGR report. No such transactions have taken place during the past financial year.
CONTROL EXECUTED BY THE SUPERVISORY BOARD OVER THE MANAGEMENT AND THE ISSUER
The supervisory board shall regularly assess the activities of the management board and its implementation of the issuer’s strategy, financial condition, risk management system, the lawfulness of the management board activities and whether essential information concerning the issuer has been communicated to the supervisory board and the public as required. Upon the establishment of committees by the supervisory board, the issuer shall publish on its website their existence, duties, membership and position in the organization. Upon change of the committee structures, the issuer shall publish the content of such changes and the period during which the procedures are in effect.
DISCLOSURE OF REMUNERATION TO MEMBERS OF SUPERVISORY BOARD
The amount of remuneration of a member of the supervisory board shall be published in the CGR report, indicating separately basic and additional payment (incl. compensation for termination of contract and other payable benefits). The general meeting of shareholders of AS PRFoods is competent to elect and approve the composition of the supervisory board and their term of office. According to the articles of association of AS PRFoods, the supervisory board consist of

Consolidated Audited Annual Report of 2019/2020 Financial Year 33
three to seven members who are elected by the general meeting for a term of three years. The general meeting has confirmed the remuneration fees of members of the supervisory board as follows: fee for the chairman 1,000 euros a month, fee for the vice chairman 750 euros a month and the fee of the member 500 euros a month. No severance fee is to be paid to the member of the supervisory board.
ATTENDANCE AT SUPERVISORY BOARD MEETINGS BY THE MEMBERS OF SUPERVISORY BOARD
If a member of the supervisory board has attended less than half of the meetings of the supervisory board, this shall be indicated separately in the CGR report. In 2019/2020, all members of the supervisory board attended all supervisory board meetings (six meetings in total).
CONFLICT OF INTERESTS SITUATIONS
Members of the supervisory board shall promptly inform the chairman of the supervisory board and management board regarding any business offer related to the business activity of the issuer made to him, a person close to him or a person connected with him. All conflicts of interests that have arisen in preceding year shall be indicated in the CGR report along with their resolutions. Members of the supervisory board refrain from conflicts of interests and adhere to the prohibition of competition. The supervisory board and the management board cooperate closely in accordance with the articles of association and in the interests of the business undertakings and its shareholders. There were no such conflicts of interest in 2019/2020.
INFORMATION ON THE ISSUER’S HOMEPAGE
On the issuer’s homepage, among others the general strategy directions of the issuer as approved by the supervisory board are disclosed. General directions and significant issues are provided in the Management Report.
THE ISSUER’S MEETINGS WITH JOURNALISTS AND ANALYSTS
The issuer shall disclose the dates and places of meetings with analysts and presentations and press conferences organized for analysts, investors or institutional investors on its website. The issuer enables shareholders to participate at such events and makes presentations available on its website. The issuer shall not arrange meetings with analysts and presentations organized for investors directly before dates of publishing a financial report. The issuer shall treat all shareholders equally. Compulsory, significant and price-sensitive information is first disclosed via the information system of the Tallinn Stock Exchange and then on the websites of the Estonian Financial Supervision Authority and the Group. In addition, every shareholder is entitled to request additional information from the Group and set up meetings. The Group’s management board does not consider it important to keep a logbook on timetable and agenda of meetings with various shareholders as these meetings are limited to information that is already disclosed. This rule applies on all meetings, including the ones held shortly before disclosing financial reports.
AUDITOR OF THE ISSUER
The supervisory board shall make available to shareholders information on a candidate for auditor, including information on their business connections and regarding its independence specifying also why the agreement with the current auditor is to be terminated or a judgment on the auditor’s work in case the auditor auditing the company shall be reappointed. Indrek Kasela commented on auditor’s work at the general meeting, details of which can be read in the minutes of the meeting and the recording of which is published on the homepage. The general meeting of shareholders of AS PRFoods held on 19.12.2019 appointed KPMG Baltics OÜ as the Group’s auditor for the financial year of 2019/2020.
Pursuant to the contract with the auditor, the auditing company’s service entails auditing procedures of consolidated annual report (incl. annual reports of subsidiaries).
The remuneration of the auditor is determined by the agreement. Pursuant to the Auditing Act, the sworn auditor representing the external audit company is to be changed at least once in every seven years.
GOVERNANCE PRINCIPLES AND ADDITIONAL INFORMATION
AS PRFoods is a public limited company and its governing bodies are the shareholders’ general meeting, the supervisory and the management board.
GENERAL MEETING
The general meeting of shareholders is the Group’s highest governing body competent to amend and approve new articles of association, change the amount of share capital, recall members of the supervisory board and resolve on dissolution of the company, decide on division, merger or restructuring of the company, provided least 2/3 of the votes represented by shareholders at the general meeting are in favour. General meetings are ordinary (OGM) and extraordinary (EGM)

Consolidated Audited Annual Report of 2019/2020 Financial Year 34
meetings. An OGM shall be convened by the management board once a year not later than within six months after the end of the financial year. The management board shall convene an EGM if the Group’s net assets fall below the limit allowed by law or if the meeting is requested by the supervisory board, auditor or shareholders whose shares represent at least 1/10 of the share capital. A general meeting has quorum when more than half of the votes determined by shares are present. The list of persons entitled to participate at the general meeting is determined 7 days before the meeting.
The AGM of shareholders of AS PRFoods was held on 19.12.2019 in Tallinn. 14 shareholders or their authorised representatives collectively representing 27,379,671 votes or 72.66% of the total votes attended the AGM. Thus, the meeting was authorized to adopt resolutions on issues on the agenda. The member of the AS PRFoods management board on the meeting. The agenda of the meeting included the approval of the annual report for the 2018/2019 financial year, deciding on covering of the loss, and appointing the auditor including determining the auditor’s fee. The chairman of the management board of AS PRFoods held a presentation. The meeting adopted the resolutions on all issues on the agenda of the AGM according to the proposals made by the supervisory board. Information on the adoption of resolutions and contents were published after the end of the meeting via the information system of NASDAQ Tallinn and on the homepage of the Group at www.prfoods.ee.
SUPERVISORY BOARD
Pursuant to law, a supervisory board of a public limited company is a supervisory body responsible for planning the activities of a company, organizing its management and supervising the activities of the management board. According to the articles of association of AS PRFoods, the supervisory board has three to seven members elected by the general meeting of shareholders for the term of three years. Members of the supervisory board elect a chairman from among themselves. Chairman of the supervisory board is responsible for organizing the work of supervisory board and has a casting vote in case of tied vote.
As of the date of the report, the supervisory board of AS PRFoods is comprised of the following members: Lauri Kustaa Äimä (since incorporation), Kuldar Leis (elected on 29 May 2013), Aavo Kokk (elected on 5 May 2009), Harvey Sawikin (elected on 5 May 2009), Vesa Jaakko Karo (elected on 17 August 2009) and Arko Kadajane (elected on 29 May 2012). The terms of office of all the current members of the supervisory board will end on 10 December 2022. The supervisory board of AS PRFoods includes four independent members — Aavo Kokk, Vesa Jaakko Karo; Kuldar Leis and Arko Kadajane. The chairman of the supervisory board is Lauri Kustaa Äimä and the vice-chairman of the supervisory board is Kuldar Leis.
The meetings of the supervisory board are held when necessary but no less frequently than once per quarter. During the financial year there were six supervisory board meetings. The meeting of the supervisory board has a quorum when more than half of the members participate.
In addition to the meetings, the supervisory board adopted resolutions without convening a meeting if it was necessary. The management board informed the supervisory board on a regular basis of the operations and financial status of AS PRFoods and the supervisory board provided the management board with necessary directions and support in conducting the everyday business activities of the company. In case a contract of service with a member of the supervisory board expires or is terminated prematurely, the Group will not incur a higher liability to pay a benefit than prescribed by the law. As at the end of the financial year, the Group’s supervisory board members owned directly and indirectly 3.74% of the Group’s shares (30.06.2019: 3.74%).
MANAGEMENT BOARD
The management board is the management body of the company that represents and manages the company according to the law and provisions of the articles of association. The management board is required to act in the most financially appropriate manner. According to the articles of association, the management board of AS PRFoods consists of one to four members. The members of the management board shall be elected by the supervisory board for three years. The competence of the supervisory board includes the election of the chairman of the management board, on the latter’s proposal, appointment and recalling of members of the management board. A member of the management board may represent the company in all legal transactions. The Management Board of AS PRFoods consists of one member. According to the supervisory board, from 2 February 2015 the only member of the management board is Indrek Kasela. In its day-to-day management, the company’s management board is independent and acts in the best interests of all shareholders, ensuring thereby the company’s sustainable development in line with the set objectives and strategy. Moreover, the company’s management board is responsible for ensuring functioning internal control and risk management procedures in the company.
The competence and powers of the management board are regulated by the Commercial Code and by the company’s articles of association with no deviating exceptions or agreements made or entered into. The chairman of the management board receives remuneration according to the contract of service and is additionally entitled to receive severance benefit for up to 6 months’ remuneration. Nor a member neither the chairman of the management board has any pension-related rights. The chairman is responsible for organising business operations on the Group level and also fulfils the tasks of a managing director. In subsidiaries, the local management ensures adherence to business practices. As at the end of the

Consolidated Audited Annual Report of 2019/2020 Financial Year 35
financial year, the Group’s management board member owned via direct and indirect holdings a total of 4.17% of the Group’s shares (30.06.2019: 4.12%). More detailed information about the education, career, membership in management bodies of business undertakings and shareholdings in AS PRFoods of members of the supervisory board and management board are provided on the Group’s homepage.
SUPERVISORY AND MANAGEMENT BOARDS OF SUBSIDIARIES
Below is a list of supervisory boards and management boards of subsidiaries that are 100% owned by AS PRFoods as at 30 June 2020.
Company Management Board Supervisory Board
Saaremere Kala AS Indrek Kasela, Christopher Charles Leigh Kuldar Leis, Lauri Kustaa Äimä, Emil Metsson
Vettel OÜ Indrek Kasela, Jarkko Tapani Alho, Dagni Viskus, Raivo Polding
Heimon Kala Oy Indrek Kasela, Margus Rebane, Jarkko Tapani Alho
Överumans Fisk AB Margus Rebane
JRJ & PRF Ltd Indrek Kasela, Vesa Jaakko Karo, Christopher Charles Leigh, Louise Victoria Leigh-Pearson, Anna Crona
John Ross Jr. (Aberdeen) Ltd
Indrek Kasela, Christopher Charles Leigh, Victoria Louise Leigh-Pearson
Coln Valley Smokery Ltd Indrek Kasela, Christopher Charles Leigh, Victoria Louise Leigh-Pearson
OÜ Redstorm Margus Rebane, Riho Kilumets
ADDITIONAL MANAGEMENT BODIES AND SPECIAL COMMITTEES
The Group has regulated necessary procedures with guidelines and there has been no practical need to set up additional management/governing bodies. In 2010, the Group’s supervisory board set up an auditing committee to monitor and analyse processing the financial information, efficiency of risk management and internal controls, the process of auditing of consolidated annual financial statements, the independence of the auditor representing the auditing company under the law, and to submit to the supervisory board proposals and recommendations in issues prescribed by the law. Since November 2017, the committee is chaired by Aleksander Zaporožtsev, the members of committee are since 2010 Aavo Kokk and Mairi Paiste. During the financial year, the audit committee had four meetings.
IMPLEMENTING DIVERCITY POLICY
The management of AS PRFoods considers a well-functioning working environment on all levels of the Group important. To achieve and maintain it the Group employs people of different gender, national background and experiences.
INFORMATION MANAGEMENT
As a listed company, AS PRFoods adheres to the principles of openness and equal treatment of investors. The information required within the stock exchange rules and regulations is published regularly in accordance to the set terms, whereas the Group employs the principle of not publishing forward-looking statements. It publishes and comments factual information only. For timely notification of investors and the public, the Group operates a website that contains all stock exchange announcements and financial reports.

Consolidated Audited Annual Report of 2019/2020 Financial Year 36
CONSOLIDATED FINANCIAL STATEMENTS

Consolidated Audited Annual Report of 2019/2020 Financial Year 37
CONSOLIDATED FINANCIAL STATEMENTS
CONSOLIDATED STATEMENT OF FINANCIAL POSITION
EUR '000 Note 30.06.2020 30.06.2019
ASSETS
Cash and cash equivalents 5 2,276 2,583
Receivables and prepayments 6 3,578 5,300
Inventories 7 7,884 11,980
Biological assets 8 4,249 4,924
Total current assets 17,987 24,787
Deferred tax assets 10 54 41
Long-term financial investments 232 202
Tangible assets 11 16,179 14,535
Intangible assets 12 22,672 22,969
Total non-current assets 39,137 37,747 TOTAL ASSETS 57,124 62,534
EQUITY AND LIABILITIES
Interest-bearing liabilities 14 10,611 13,502
Payables and prepayments 15 11,132 14,105
Government grants 16 211 234
Total current liabilities 21,954 27,841
Interest-bearing liabilities 14 12,368 9,540
Payables and prepayments 15 190 190
Deferred tax liabilities 10 1,920 2,010
Government grants 16 873 1,087
Total non-current liabilities 15,351 12,827 TOTAL LIABILITIES 37,305 40,668
Share capital 17 7,737 7,737
Share premium 14,007 14,007
Treasury shares -390 -390
Statutory capital reserve 51 51
Currency translation differences -366 -214
Retained profit (loss) -1,654 66
Equity attributable to parent 19,385 21,257
Non-controlling interest 434 609 TOTAL EQUITY 19,819 21,866 TOTAL EQUITY AND LIABILITIES 57,124 62,534
Notes on pages 41-83 are an integral part of the consolidated financial statements.
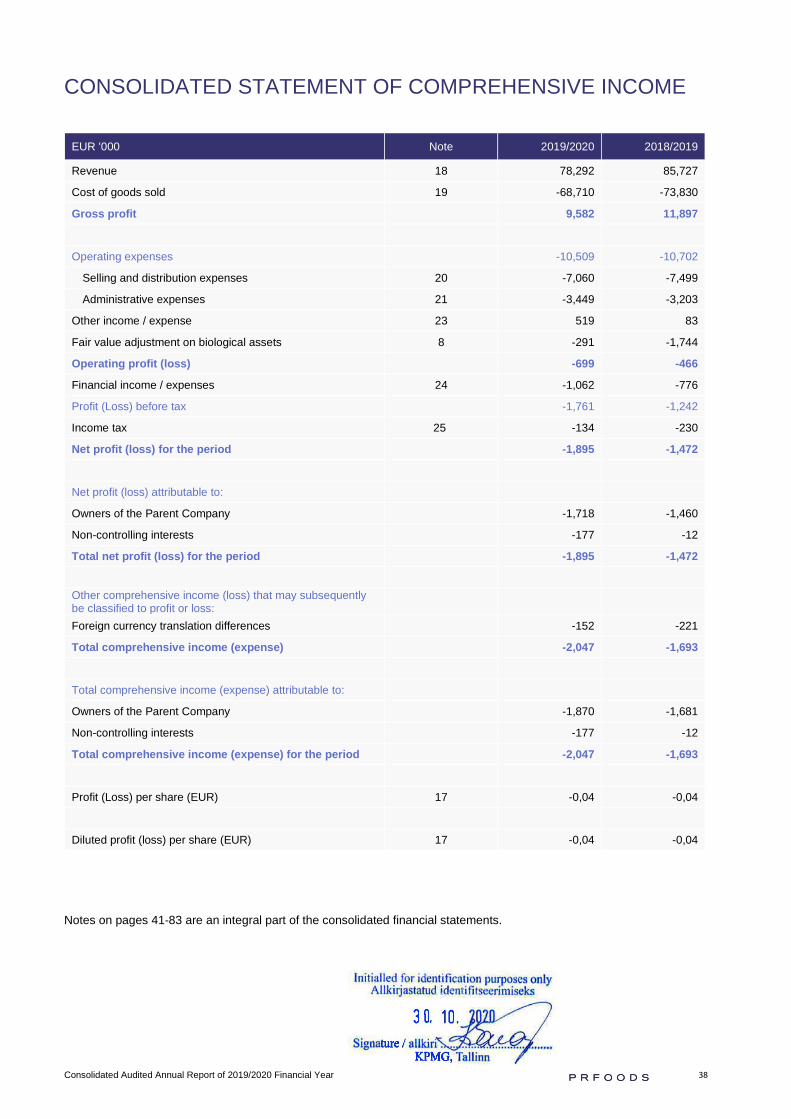
Consolidated Audited Annual Report of 2019/2020 Financial Year 38
CONSOLIDATED STATEMENT OF COMPREHENSIVE INCOME
EUR '000 Note 2019/2020 2018/2019
Revenue 18 78,292 85,727
Cost of goods sold 19 -68,710 -73,830
Gross profit 9,582 11,897
Operating expenses -10,509 -10,702
Selling and distribution expenses 20 -7,060 -7,499
Administrative expenses 21 -3,449 -3,203
Other income / expense 23 519 83
Fair value adjustment on biological assets 8 -291 -1,744
Operating profit (loss) -699 -466
Financial income / expenses 24 -1,062 -776
Profit (Loss) before tax -1,761 -1,242
Income tax 25 -134 -230
Net profit (loss) for the period -1,895 -1,472
Net profit (loss) attributable to:
Owners of the Parent Company -1,718 -1,460
Non-controlling interests -177 -12
Total net profit (loss) for the period -1,895 -1,472
Other comprehensive income (loss) that may subsequently be classified to profit or loss: Foreign currency translation differences -152 -221
Total comprehensive income (expense) -2,047 -1,693
Total comprehensive income (expense) attributable to:
Owners of the Parent Company -1,870 -1,681
Non-controlling interests -177 -12
Total comprehensive income (expense) for the period -2,047 -1,693
Profit (Loss) per share (EUR) 17 -0,04 -0,04
Diluted profit (loss) per share (EUR) 17 -0,04 -0,04
Notes on pages 41-83 are an integral part of the consolidated financial statements.

Consolidated Audited Annual Report of 2019/2020 Financial Year 39
CONSOLIDATED STATEMENTS OF CASH FLOWS
EUR '000 Note 2019/2020 2018/2019
Cash flow from operating activities
Net profit (loss) -1,895 -1,472
Adjustments:
Depreciation 11, 12 2,532 2,209
Profit from sale and write-offs of fixed assets 44 -18
Other non-cash items 325 540
Changes in receivables and prepayments 6 1,709 -594
Changes in inventories 7 4,096 698
Changes in biological assets 8 675 1,574
Changes in payables and prepayments 15 -2,734 2,062
Corporate income tax paid 10 -240 -657
Net cash inflow (outflow) from operating activities 4,512 4,342
Cash flow from investing activities
Sale of tangible and intangible fixed assets 11, 12 45 133
Purchase of tangible and intangible fixed assets 11, 12 -1,942 -1,907
Government grants for acquisition of assets 16 0 7
Purchases and sales of other financial investments -20 -1
Acquisition of subsidiaries, net cash received 9 -131 -2,631
Interests received -5 16
Net cash inflow (outflow) from investing activities -2,053 -4,383
Cash flow from financing activities
Change in overdraft 14 -843 709
Repayments of loans received 14 -10,324 -3,239
Proceeds from borrowings 14 161 907
Change in factored receivables 14 0 9
Repayments of lease liabilities 13 -593 -554
Proceeds from issuing bonds 14 9,416 0
Dividends paid 17 0 -377
Interests paid -583 -791
Net cash inflow (outflow) from financing activities -2,766 -3,336
Net increase (decrease) in cash and cash equivalents -307 -3,377
Cash and cash equivalents at beginning of the period 5 2,583 5,960
Change in cash and cash equivalents -307 -3,377
Cash and cash equivalents at the end of the period 5 2,276 2,583
Notes on pages 41-83 are an integral part of the consolidated financial statements.

Consolidated Audited Annual Report of 2019/2020 Financial Year 40
CONSOLIDATED STATEMENT OF CHANGES IN EQUITY
EUR '000 Share capital
Share premium
Treasury shares
Statutory capital reserve
Unrea-lised
currency differ.
Retained earnings (-loss)
Total Non-contr.
interests
Total equity
Balance at 30.06.2018 7,737 14,007 -390 48 7 1,904 23,313 -2 23,311
Statutory reserve capital 0 0 0 3 0 -3 0 0 0
Dividends 0 0 0 0 0 -377 -377 0 -377
Transactions with equity holders of the company
0 0 0 3 0 -380 -377 0 -377
Net profit (loss) for the year 0 0 0 0 0 -1,460 -1,460 -12 -1,472
Other comprehensive income (expense) 0 0 0 0 -221 0 -221 0 -221
Total comprehensive income (expense) for the period
0 0 0 0 -221 -1,460 -1,681 -12 -1,693
Non-controlling interests on acquisition of subsidiary
0 0 0 0 0 0 0 625 625
Balance at 30.06.2019 7,737 14,007 -390 51 -214 64 21,255 611 21,866
Net profit (loss) for the year 0 0 0 0 0 -1,718 -1,718 -177 -1,895
Other comprehensive income (expense) 0 0 0 0 -152 0 -152 0 -152
Total comprehensive income (expense) for the period
0 0 0 0 -152 -1,718 -1,870 -177 -2,047
Balance at 30.06.2020 7,737 14,007 -390 51 -366 -1,654 19,385 434 19,819
Additional information in Note 17.
Notes on pages 41-83 are an integral part of the consolidated financial statements.

Consolidated Audited Annual Report of 2019/2020 Financial Year 41
NOTES TO THE CONSOLIDATED FINANCIAL STATEMENTS
GENERAL INFORMATION
AS PRFoods (“Parent company”) and its subsidiaries (together “Group”) are companies operating in farming, production and sales of fish and fish products. AS PRFoods was incorporated in the Estonian Republic on 23 December 2008. The shares and bonds of AS PRFoods are listed on NASDAQ Tallinn Stock Exchange. The largest shareholder of AS PRFoods is Amber Trust II S.C.A (see note 18). This consolidated report is signed by the management to be published on 30 October 2020. Pursuant to Commercial Code of the Republic of Estonia the annual report is to be approved by the supervisory board and the general meeting of shareholders.
BASES FOR PREPARATION OF THE CONSOLIDATED FINANCIAL STATEMENTS
The consolidated financial statements of AS PRFoods for the 2019/2020 have been prepared in accordance with International Financial Reporting Standards, as adopted by the European Union (IFRS).
The consolidated financial statements have been prepared under the historical cost convention, except for biological assets and held-for-sale financial assets which are reflected at fair value.
The functional currency of AS PRFoods and presentation currency of the consolidated financial statements is euro (EUR). All amounts presented in the financial statements have been rounded to the nearest thousand, unless stated otherwise.
The consolidated financial statements have been prepared using the accounting policies below which have consistently been applied to all periods presented in the financial statements, unless stated otherwise.
The preparation of financial statements in compliance with IFRS requires the use of certain critical accounting estimates. It also requires management to exercise its judgement in the process of applying the Group’s accounting policies. The areas involving a higher degree of judgement or complexity, or areas where assumptions and estimates are significant to the consolidated financial statements are disclosed in note 4.
CHANGES IN ACCOUNTING POLICIES AND PRESENTATION AND CORRECTION OF ERRORS
In 2018, a new income tax system came into force in Latvia, which is similar to that in Estonia. However, upon its implementation, deferred income tax was recognized in the consolidated IFRS financial statements in a manner different from the approach used so far in Estonia. According to the Latvian approach, deferred income tax on investments in subsidiaries, associates, joint ventures and branches is also recognized when the investments are located in countries where corporate income tax is payable on profit distribution (for example, Estonia and Latvia), unless the company can control the timing of the reversal of taxable temporary differences and their reversal is unlikely in the foreseeable future. According to the approach used so far in Estonia, the deferred income tax liability was not recognized in this case.
In December 2019, the Accounting Standards Board referred the matter to IFRIC for a standpoint. In June 2020, the IFRIC adopted a decision that the recognition of deferred income tax liability is necessary in accordance with the rules of IAS 12, i.e. the approach used in Estonia so far in recognizing deferred income tax liability was incorrect.
The Group's Management Board has decided to change the deferred tax accounting policy and apply the principle to deferred income tax liability for investments in subsidiaries, associates, joint ventures and branches, even if the investment is located in the country where corporate income tax is payable (e.g. Estonia and Latvia), unless the Group is able to control the timing of the reversal of taxable temporary differences and it is unlikely that they will reverse in the foreseeable future. In measuring such liabilities, the Group uses the tax rates that are expected to apply to taxable temporary differences based on the tax rates that have been enacted or substantively enacted by the reporting date. See the accounting policies for deferred tax below.
The retrospective adjustment of the accounting policy for deferred tax did not have an impact on the Group's consolidated financial statements. The parent controlled the timing of the reversal of temporary taxable differences arising in the Estonian subsidiaries during the comparison period and it was probable that the temporary difference would not reverse in the foreseeable future, therefore no deferred income tax liability arose. No deferred income tax liability arose in associates located in Estonia, as there was no distributable profit for associates in the comparable period. Therefore, the retrospective restatement of the prior period comparable data did not have an effect on the Group's consolidated financial statements.
Consolidated Audited Annual Report of 2019/2020 Financial Year 42
IFRS 16 “Leases” (effective for annual periods beginning on or after 1 January 2019).
As of 1 July 2019, the Group has applied the accounting principles of IFRS 16.
The Group applied IFRS 16 using a modified retrospective method - for the first time on 1 July 2019. Consequently, no adjustment is made to the comparative period – that is, comparative information is presented, as in previous periods, in accordance with IAS 17 and related interpretations. Details of the changes in accounting policies are disclosed below. In addition, the disclosure requirements of IFRS 16 have not been applied to comparative information.
The concept of lease
Previously, the Group determined whether or not the agreement includes a lease in accordance with IFRIC 4 “Determining whether an arrangement contains a lease”. Now, the Group assesses whether the contract contains a lease based on the definition of a lease, as explained in the accounting policies under “Lease accounting”.
Upon adopting the IFRS 16, the Group decided to take practical approach to continue to apply the definition of a lease in IAS 17 and IFRIC 4 to contracts at the date of transition and to apply the new definition of a lease only to new contracts or amendments to contracts. This means that contracts that were not classified as leases in accordance with IAS 17 and IFRIC 4 were not revalued according to whether they were leases in accordance with IFRS 16. Therefore, IFRS 16 applied the definition of a lease only to contracts entered into or amended on or after 1 July 2019.
The Group as a lessee
As a lessee, the Group leases a number of assets, including machinery and equipment, land and water areas, as well as buildings. Previously, the Group classified the lease as either an operating lease or a finance lease, based on an assessment of whether the lease transferred to the Group all the risks and rewards of ownership of the underlying asset. In accordance with IFRS 16, the Group recognizes most of the lease agreements as an asset and a lease liability, i.e. these leases are recognized in the Group's balance sheet.
Upon concluding or amending an agreement containing a lease component, the Group distributes the lease fee included in the agreement to each lease component on the basis of its relative separate price.
Leases classified as operating leases in accordance with IAS 17
Previously, the Group classified leases of machinery and equipment, land and water areas, as well as buildings, as operating leases in accordance with IAS 17. During the transition period, liabilities related to lease agreements were measured at the present value of the remaining lease payments, using the Group's alternative borrowing rate as of 1 July 2019 as a discount rate. The right-of-use asset is measured at an amount equal to the lease obligation, adjusted for prepaid amounts or lease payments.
The Group has tested for impairment of its right-of-use assets at the date of transition and has concluded that there are no indications of impairment of the right of use.
In applying IFRS 16 to leases that were previously classified as operating leases in accordance with IAS 17, the Group used a number of simplification measures. In particular:
• the right of use assets and the lease obligation were not recognized for lease agreements that expire within 12months from the date of transfer;
• the right of use assets and the lease obligation were not recognized for lease agreements with a low value of theunderlying assets;
• primary direct costs were not taken into account when measuring the right-of-use assets;
• applying retrospective judgment in determining the lease term.
Leases classified as finance leases in accordance with IAS 17
The Group has acquired machinery and equipment under finance leases. These leases were classified as finance leases in accordance with IAS 17. For these leases, the carrying amount of the right-of-use asset and the lease liability was determined at the carrying amount of the asset leased on 1 July 2019 and the carrying amount of the liability as at 30 June 2019 in accordance with IAS 17.

Consolidated Audited Annual Report of 2019/2020 Financial Year 43
Impact of IFRS 16 on the statement of financial position
Impact of the changeover on the statement of financial position*
Upon transition to IFRS 16, the Group recognized additional rights-of-use assets and lease obligations. The effects of the transition are summarized in the table below.
EUR '000 01.07.2019
Right-of-use assets 1,579
Lease liability** 1,588
* For the effect of IFRS 16 on the income statement for the period, see Note 13. The accounting policies of IFRS 16 and IAS 17 can befound in the section “Lease accounting” of accounting policies.** The difference between the initial recognition of the lease obligation and the right of use property is 9 thousand euros. The difference is due to the fact that the Group has subleased the right to use the property under the finance lease terms of the lease.
When measuring the lease obligation of lease agreements classified as operating leases, the Group discounted the lease payments using the alternative loan interest rate as of 1 July 2019. The lessee's alternative weighted average interest rate is 2%.
EUR '000
Minimum lease payments under an operating lease in accordance with IAS 17 as at 30.06.2019 992
Discounted using the alternative loan interest rate as of 01.07.2019 881
Finance lease liabilities as of 30.06.2019 1 192
– Leases with a residual period of less than 12 months -70
– Extensions of leases that are implemented with sufficient certainty 778
Lease obligations as of 01.07.2019 2 780
ADOPTION OF NEW OR REVISED STANDARDS AND INTERPRETATIONS
The following new or amended standards and interpretations that have been issued and become mandatory for annual periods beginning on or after 1 July 2020 and have not been applied by the Group.
Amendments to IAS 1 “Presentation of Financial Statements” and IAS 8 “Accounting Policies, Changes in Accounting Estimates and Errors” (effective for annual periods beginning on or after 1 January 2020).
The amendments clarify and harmonize the definition of "material" and provide guidance to help improve the consistency of its application in IFRSs.
The Group assesses amendments having a non-material impact on its financial statements upon the initial application.
Amendments to IFRS 9 “Financial Instruments”, IAS 39 “Financial Instruments: Recognition and Measurement” and IFRS 7 “Financial Instruments: Disclosures” (effective for annual periods beginning on or after 1 January 2020).
The amendments are mandatory and apply to all hedging relationships that are directly affected by the uncertainties arising from the interbank lending rate (IBOR) reform. The amendments provide a temporary relief from certain hedge accounting requirements. The aim is to prevent hedge accounting from being phased out as a result of the IBOR reform. The main reliefs provided by the amendments relate to the following:
• “Highly probable“ requirement;• Risk components;• Prospective assessments;• Retrospective effectiveness test (IAS 39);• Reclassification of the cash flow hedge reserve.
The amendments also require companies to provide additional information to investors about their hedging relationships that are directly affected by the uncertainties surrounding the reform.
The Group does not expect the amendments to have a material impact on the Group's financial statements upon initial application.

Consolidated Audited Annual Report of 2019/2020 Financial Year 44
Amendments to IFRS 10 and IAS 28 “Sales or Contributions between an Investor and its Associate or Joint Venture” (the European Commission has decided to postpone the approval of the amendments indefinitely).
The amendments clarify that, in a transaction involving an associate or joint venture, the extent to which the gain or loss is recognized depends on whether the assets sold or transferred constitute a business, so that:
• the gain or loss is recognized in full when the transaction between an investor and its associate or joint ventureinvolves the transfer of assets or assets that constitute a business (whether or not it is located in a subsidiary);and
• a gain or loss is recognized in part when a transaction between an investor and its associate or joint ventureinvolves assets that do not constitute a business (even if those assets are located in a subsidiary).
The Group does not expect the amendments to have a material impact on the Group's financial statements upon initial application.
Amendments to IFRS 3 Business Combinations (effective for annual periods beginning on or after 1 January 2020).
These changes have not yet been approved by the European Union.
The amendments restrict and clarify the concept of business. These amendments also provide a simplified assessment of whether the activities and assets acquired in a business combination are, by their nature, a group of assets or a business.
The Group does not expect the amendments to have a material impact on the Group's financial statements upon initial application.
Other changes
Other new or amended standards or interpretations that are not yet effective are not expected to have a material impact on the Group's current or future reporting periods or forecast future transaction
FOREIGN CURRENCY TRANSLATION
Functional and presentation currency
The financial statements of the Group’s each entity have been prepared using the currency of the primary economic environment in which the entity operates (functional currency), i.e. the local currency. The functional currency of the Parent Company and its subsidiaries registered in Estonia is euro. The consolidated financial statements have been prepared in euros.
Accounting for foreign currency transactions
All currencies other than the functional currency (the functional currency of the Parent Company as well as its Estonian and Finnish subsidiaries is the euro) are considered as foreign currencies. Foreign currency transactions are translated into the functional currency using the exchange rates of the European Central Bank or a central bank of the respective country as at the transaction dates. Monetary assets and liabilities denominated in a foreign currency (receivables and loans payable in cash) are translated into the functional currency based on the foreign currency exchange rate of the central bank as at the balance sheet date. Foreign exchange gains and losses resulting from translation are recorded in the income statement of the reporting period. Non-monetary assets and liabilities denominated in a foreign currency that are measured at fair value (at fair value are measured biological assets; short- and long-term financial investments in shares and other equity instruments whose fair value can be determined reliably) are translated into the functional currency using the official exchange rates of the central bank as at the date of determining the fair value. Non-monetary assets and liabilities denominated in a foreign currency that are not measured at fair value (e.g. prepayments, inventories accounted for using the cost method; property, plant and equipment as well as intangible assets) are not translated at the balance sheet date but continue to be reported using the official exchange rate of the central bank as at the transaction date.
Financial statements of foreign business units
The following principles apply to the translation into the presentation currency of the financial statements of foreign subsidiaries:
• The assets and liabilities of all foreign subsidiaries are translated at the exchange rate of the European CentralBank at the balance sheet date;
• Subsidiaries' income and expenses are translated at the weighted average exchange rates for the year (unlessthis average cannot be considered a reasonable approximation of the cumulative effects of the interest ratesprevailing at the dates of the transactions, in which case they are translated at the dates of the transaction).
Consolidated Audited Annual Report of 2019/2020 Financial Year 45
• Conversion differences arising on translation are included in other comprehensive income and accumulated inequity under “Unrealized exchange differences”.
Goodwill and changes in fair value arising on the acquisition of a foreign entity are treated as assets and liabilities of the foreign entity and translated at the balance sheet date.
If a foreign subsidiary is disposed of, in whole or in part, as a result of a disposal, liquidation, repayment or abandonment of its equity, unrealized exchange differences recognized in equity are recognized in the income statement.
PRINCIPLES OF CONSOLIDATION
(a) Subsidiaries
Subsidiaries are all entities over which the Group has control. The Group controls an entity when the Group is exposed to, or has rights to, variable returns from its involvement with the entity and has the ability to affect those returns through its power over the entity. Subsidiaries are fully consolidated from the date on which control is transferred to the Group and are de-consolidated from the date that control ceases. The Group applies the acquisition method to account for business combinations. The consideration transferred for the acquisition of a subsidiary comprises the fair values of the assets transferred, the liabilities incurred to the former owners of the acquiree and the equity interests issued by the Group. The consideration transferred includes the fair value of any asset or liability resulting from a contingent consideration arrangement. Identifiable assets acquired and liabilities and contingent liabilities assumed in a business combination are measured initially at their fair values at the acquisition date. The Group recognises any non-controlling interest in the acquiree on an acquisition-by acquisition basis, either at fair value or at the non-controlling interest’s proportionate share of the recognised amounts of acquiree’s identifiable net assets.
Acquisition-related costs are expensed as incurred.
If the business combination is achieved in stages, the acquisition date carrying value of the acquirer’s previously held equity interest in the acquiree is remeasured to fair value at the acquisition date; any gains or losses arising from such re-measurement are recognised in profit or loss.
Any contingent consideration to be transferred by the Group is recognised at fair value at the acquisition date. Subsequent changes to the fair value of the contingent consideration that is deemed to be an asset or liability is recognised in accordance with IAS 39 either in profit or loss or as a change to other comprehensive income. Contingent consideration that is classified as equity is not remeasured, and its subsequent settlement is accounted for within equity. Goodwill is initially measured as the excess of the aggregate of the consideration transferred and the fair value of non-controlling interest over the net identifiable assets acquired and liabilities assumed. If the consideration is lower than the fair value of the net assets of the subsidiary acquired, the difference is recognized in profit or loss.
In preparation of consolidated financial statements, the financial statements of the Parent Company and its subsidiaries are consolidated on a line-by-line basis. In preparation of consolidated financial statements, inter-company transactions, balances and unrealised gains on transactions between the Group companies are eliminated. Unrealised losses are also eliminated. When necessary, amounts reported by subsidiaries have been adjusted to conform to the Group’s accounting policies.
In the Parent Company’s separate financial statements the investments in subsidiaries are accounted for at cost less impairment. Cost is adjusted to reflect changes in consideration arising from contingent consideration amendments.
(b) Changes in ownership interests in subsidiaries without cease of control
Transactions with non-controlling interests that do not result in loss of control are accounted for as equity transactions – that is, as transactions with the owners in their capacity as owners. The difference between fair value of any consideration paid and the relevant share acquired of the carrying value of net assets of the subsidiary is recorded in equity. Gains and losses on disposals to non-controlling interests are also recorded in equity.
(c) Disposal of subsidiaries
When the Group ceases to have control any retained interest in the entity is remeasured to its fair value at the date when the control is lost, with the change in carrying amount recognised in profit or loss. The fair value is the initial carrying amount for the purposes of subsequently accounting for the retained interest as an associate, joint venture or financial asset. In addition, any amounts previously recognised in other comprehensive income in respect of that entity are accounted for as if the Group had directly disposed of the related assets and liabilities. This may mean that amounts previously recognised in other comprehensive income are reclassified to profit or loss.

Consolidated Audited Annual Report of 2019/2020 Financial Year 46
(d) Associates
Associates are all entities over which the Group has significant influence but not control, generally accompanying a shareholding of between 20% and 50% of the voting rights. Investments in associates are accounted for using the equity method of accounting and are initially recognised at cost, and the carrying amount is increased or decreased to recognise the investor’s share of the profit or loss of the investee after the date of acquisition. The Group’s investment in associates includes goodwill identified on acquisition.
If the ownership interest in an associate is reduced but significant influence is retained, only a proportionate share of the amounts previously recognised in other comprehensive income is reclassified to profit or loss as appropriate.
The Group’s share of its associates’ post-acquisition profits or losses is recognised in the income statement and its share of post-acquisition movements in the associates’ other comprehensive income is recognised directly in other comprehensive income with a corresponding adjustment to the carrying amount of the investment. When the Group’s share of losses in an associate equals or exceeds its interest in the associate, including any other unsecured receivables, the Group does not recognise any further losses, unless it has incurred legal or constructive obligations or made payments on behalf of the associate.
The Group determines at each reporting date whether there is any objective evidence that the investment in the associate is impaired. If this is the case, the Group calculates the amount of impairment as the difference between the recoverable amount of the associate and its carrying value and recognises the amount adjacent to “Share of other profit/loss of the associates” in the income statement.
Profits and losses resulting from upstream and downstream transactions between the Group and its associate are recognised in the Group’s financial statements only to the extent of unrelated investor’s interests in the associates. Unrealised losses are eliminated unless the transaction provides evidence of an impairment of the asset transferred. Accounting policies of associates have been changed where necessary to ensure consistency with the policies adopted by the Group.
INFORMATION ABOUT PARENT COMPANY’S SEPARATE PRIMARY FINANCIAL STATEMENTS
According to the Accounting Act of Estonia, the notes to the consolidated financial statements shall include disclosures on the separate primary financial statements of the consolidating entity (Parent Company). The primary financial statements of the Parent Company, which are disclosed in note 30, have been prepared using the same accounting policies and measurement bases as used in preparing the consolidated financial statements. Investments in subsidiaries and associates are carried at cost in the separate primary financial statements. Under the cost method, the investment is initially recognised at cost, i.e. at the fair value of the consideration paid at acquisition and it is subsequently adjusted to account for impairment losses.
CASH AND CASH EQUIVALENTS
For the purposes of the statement of financial position and the cash flow statement, cash and cash equivalents include cash on hand, bank account balances (other than overdraft) and term deposits with maturities of 3 months or less. Overdraft is included within short-term interest-bearing liabilities in the statement of financial position.
FINANCIAL ASSETS
Classification
The Group classifies financial assets into the following measurement categories: • those at fair value (either through other comprehensive income or through profit or loss);• those carried at amortised cost.
The classification depends on the Group's business model for managing its financial assets and the contractual terms of the cash flows.
Registration and derecognition
Purchases and sales of financial assets under normal market conditions are recognized on the trade date, the date on which the Group commits to purchase or sell the asset. Financial assets are derecognised when the rights to receive cash flows from the asset have expired or have been transferred and the Group has transferred substantially all risks and rewards of ownership.
Consolidated Audited Annual Report of 2019/2020 Financial Year 47
Measurement
Financial assets (unless they are receivables from a buyer that does not have a significant financing component and are initially measured at transaction price) are initially measured at fair value and in the case of assets not measures at fair value through profit or loss, related acquisition costs of assets are added to the initial value..
Debt instruments
Subsequent recognition of debt instruments depends on the Group's business model for managing its financial assets and the contractual cash flows of the financial assets. Assets held for the purpose of collecting contractual cash flows that have only cash flows and interest payable are recognised at amortised cost using the effective interest rate method. Impairment losses are deducted from the adjusted acquisition cost. Interest income, foreign exchange gains and losses and impairment losses are recognised in the income statement. Gains or losses on derecognition are recognised in the income statement under “Other operating income / expense”. As of 1July 2019 and 30 June 2020 and during 2019/2020, financial assets of the Group were classified either as at amortised cost or at fair value through profit and loss.
Impairment of financial assets
The impairment loss model is applied to financial assets at amortized cost. Financial assets carried at amortized cost consist of trade receivables, cash and cash equivalents.
Expected credit losses are probability-weighted estimated credit losses. Credit loss is the difference between the contractual cash flows of the Group and the expected cash flows of the Group, discounted at the original effective interest rate.
Measurement of expected credit loss takes into account: (i) an unbiased and probabilistic amount that estimates a number of different outcomes, (ii) the time value of money and (iii) reasonable and reasonable information available at the end of the reporting period conditions and forecasts of future economic conditions.
The Group measures impairment as follows: • trade receivables amounting to expected credit losses over their lifetime;• cash and cash equivalents at low credit risk (senior management considers a low credit risk assessment of at
least one of the major credit rating agencies) to be equivalent to expected credit losses within 12 months;• for all other financial assets, the amount of credit losses expected to be incurred over a 12-month period, unless
the credit risk (i.e. the expected life of the financial asset in default) has increased significantly after initialrecognition; if the risk is significantly increased, the credit loss is measured at an amount equal to the expectedcredit loss over a lifetime.
Loans and receivables
Loans and receivables are non-derivative financial assets with fixed or determinable payments that are not quoted in an active market. Loans and receivables are initially recognised at their fair value plus transaction costs. After initial recognition, loans and receivables are carried at amortised cost using the effective interest rate method. This method is used to calculate interest income on the receivable in subsequent periods. Financial assets are adjusted for impairment losses.
Impairment is based on expected credit loss. The principle of expected credit loss is to show the overall trend in the deterioration or improvement in the credit quality of a financial asset. Impairment losses on financial assets classified at amortised cost are recognised as a provision for impairment.
Expected credit losses are probability-weighted estimated credit losses that, at the reporting date, consider all relevant information, including information about past events, current conditions, reasonable and reasonable future events, and forecasts of economic conditions. At the end of each reporting period, the Group conducts an expert review to determine whether there has been a material increase in risk compared to the last estimate. Indicators of increased credit risk include, but are not limited to, overdue payments over 30 days, significant financial difficulties of the debtor, possible bankruptcy or restructuring of the debtor. Impairment charges are recognised in the income statement under “Other operating expenses”. If receivables are uncollectible, they are written off together with a provision for impairment.
Receivables are generally recognised as current assets when they are due to be settled within 12 months after the balance sheet date. Receivables that are due later than 12 months after the balance sheet date are recognised as non-current assets. Financial assets that do not include SPPI cash flows are recognised at fair value through profit or loss.

Consolidated Audited Annual Report of 2019/2020 Financial Year 48
FACTORING
Factoring is the transfer (sale) of receivables, whereby depending on the type of the factoring contract the buyer has the right to sell the transferred receivable back to the seller within a certain time period (recourse factoring) or there is no right of resale back to the seller and all the risks and benefits associated with the receivable are transferred from seller to purchaser (non-recourse factoring). Factoring with regress are recognized at amortized cost.
If the seller of the receivable retains the repurchase obligation, the transaction is recognised as a financing transaction (i.e. as a loan with the receivable as a collateral) and not as a sale. The receivable is not considered as sold as a result of factoring, but it remains in the balance sheet until the receivable is collected or the recourse right has expired. The related liability is recorded similarly to other interest-bearing liabilities.
If there is no repurchase obligation and the control over the receivable and the related risks and rewards of the ownership are transferred to the buyer, the transaction is recognised as a sale of the receivable. In the statement of financial position, these receivables are recognized at fair value through profit and loss. The related expense is recognised as a finance cost (similarly to interest expense) or as an impairment loss of receivables, depending on whether the purpose of the transaction was to manage the cash flows or to manage credit risk.
INVENTORIES
Inventories are initially recognised at their cost, which consists of the purchase costs, direct and indirect production costs, transportation and other costs incurred in bringing the inventories to their present location and condition.
Purchase costs include in addition to the purchase price also the customs duties and other non-refundable taxes and direct transportation costs related to the purchase, less discounts and subsidies. The production costs of inventories include costs directly related to the production (such as direct materials and packing material costs, unavoidable storage costs related to work in progress, direct labour), and also a systematic allocation of fixed and variable production overheads (such as depreciation and maintenance of production buildings and equipment, overhaul costs, and production units’ management remunerations).
The weighted average method is used to account for the cost of inventories. Inventories are measured in the statement of financial position at the lower of acquisition/production cost or net realisable value. The net realisable value is the estimated selling price of inventories in the ordinary course of business less applicable variable selling expenses.
TANGIBLE ASSETS
Tangible assets are assets used by the Group in its economic activities with a useful life of over one year. An item of property, plant and equipment is initially recognized at its acquisition cost, consisting of the purchase price (including duties and other non-refundable taxes) and directly attributable acquisition costs necessary to bring the asset to its operating condition and location.
Tangible assets are carried in the statement of financial position at its cost less any accumulated depreciation and any accumulated impairment losses. Tangible assets acquired under lease are accounted for in the same way as purchased tangible assets. Subsequent expenditures on an item of tangible assets are recognized as non-current assets when it is probable that future economic benefits associated with the item will flow to the Group and the cost of the item can be measured reliably. Other maintenance and repair costs are expensed as incurred.
Amortization is calculated using the straight-line method. The depreciation rate is determined for each item of tangible assets depending on its useful life. For assets with a significant residual value, only the depreciable amount between the cost and the residual value is depreciated over the useful life.
If an item of tangible assets consists of identifiable components with different useful lives, these components are accounted for as separate assets and are subject to separate depreciation rates based on their useful lives.

Consolidated Audited Annual Report of 2019/2020 Financial Year 49
The following useful lives are assigned to items of tangible assets: • Buildings 5-50 years• Machinery and equipment 2-20 years• Motor vehicles 4-13 years• Fixtures, fittings and tools
- Fittings and tools 2-12 years- IT equipment and software 3-5 years- Other fixtures 5 years
• Items with unlimited useful lives (land) are not depreciated.
Depreciation of an asset begins when the asset is available for use for the purpose intended by management and is ceased when the residual value exceeds the carrying amount, when the asset is permanently withdrawn from use or is reclassified as held for sale. At each balance sheet date, the validity of applied depreciation rates, the depreciation method and the residual values applicable to assets are assessed.
Where an asset's recoverable amount (higher of an asset's fair value less costs to sell and value in use) is less than its carrying amount, it is written down immediately to its recoverable amount. The impairment loss is recognized in the income statement under “Other operating expenses”. Impairment losses recognized in prior periods are reversed if there has been a change in the estimates used to determine recoverable amount.
Borrowing costs (interest) attributable to the construction of property, plant and equipment are added to the cost of the assets during the period that is required to complete and prepare the asset for its intended use.
Items of property, plant and equipment that are expected to be sold within the next 12 months are reclassified as non-current assets held for sale. Gains and losses on the disposal of non-current assets that are measured as the difference between the proceeds from the sale and the carrying amount of the asset are recognized in the income statement within “Other operating income and expenses”.
INTANGIBLE ASSETS
Intangible assets (trademarks, connection fees, patents, licences, software) are recognised in the statement of financial accounting when the asset is controlled by the Group, future economic benefits attributable to the asset will be collected by the Group and the cost of the asset can be measured reliably. An acquired intangible asset is initially recognised at cost, comprising its purchase price and any expenditure directly attributable to the acquisition. Intangible assets are subsequently measured at cost less any accumulated amortisation and any accumulated impairment losses. Goodwill is carried at its acquisition cost less any impairment losses.
Intangible assets are divided into assets with finite useful lives and assets with indefinite useful lives
Intangible assets with finite useful lives are amortised using the straight-line method, over the asset’s estimated useful life. The appropriateness of the amortisation periods and method is assessed at each balance sheet date.
The following useful lives have been assigned for intangible assets:
• Trademarks 20 - 50 years
• Licenses and connection fees 3 - 50 years
• Software licenses 5 years The useful lives of brands are determined based on management's estimate of the expected length of the cash-generating period of these assets. Licenses (fish farming and killing permits) and connection fees and the useful lives of software licenses are based on the duration of the right to use the assets.
For assets with a finite useful life, an asset is assessed for impairment whenever there is an indication that the asset may be impaired.
Intangible assets with indefinite useful lives (goodwill) are not amortized, but are tested for impairment annually (or more frequently if any event or change in circumstances indicates that the goodwill may be impaired) and tested for impairment and their carrying amount is less than their carrying amount. , the asset is written down to its recoverable amount. For the purpose of calculating recoverable amount, goodwill is allocated to the cash-generating units.
Consolidated Audited Annual Report of 2019/2020 Financial Year 50
IMPAIRMENT OF FIXED ASSETS
Intangible assets with indefinite useful lives (goodwill) are tested for impairment annually by comparing the carrying amount of the asset with its recoverable amount.
In the case of property, plant and equipment with indefinite useful lives (land) and depreciable assets, there is an indication that the asset may be impaired. In such circumstances, the recoverable amount of the asset is estimated and compared with its carrying amount.
For the purposes of assessing impairment, the recoverable amount is estimated for each individual asset or smallest group of assets for which a cash-generating unit is available. The goodwill test is always performed with the cash-generating unit to which the goodwill belongs. The recoverable amount of an asset is the higher of its fair value less costs to sell and its value in use. An impairment loss is recognized for the amount by which the asset's carrying amount exceeds its recoverable amount. Impairment losses on assets are recognized as an expense in the period.
For assets that are written down at each subsequent balance sheet date, it is assessed whether it is probable that the recoverable amount of the asset may have increased in the interim. If, as a result of a value test, it is found that the recoverable amount of an asset or group of assets (cash-generating unit) has increased above its carrying amount, the earlier write-down is reversed and the carrying amount of the asset is increased to the amount that would have occurred. A reversal of a write-down is recognized in the income statement for the financial year as a reduction of the write-down of a fixed asset. Goodwill impairment is not reversed.
BIOLOGICAL ASSETS
Biological assets are recognised in the statement of financial position when the asset is controlled by the Group, it is expected that future economic benefits associated with the asset will be collected by the Group and the fair value of the asset or its cost can be determined reliably.
Biological assets i.e. fish stock of rainbow trout (Oncorhynchus mykiss) is on the separate line “Biological assets” in the statement of financial position.
Biological assets are classified based on their stage of completion, which are relevant for formation of market prices. Accounting policies for each class of biological assets have been determined as follows:
• Fries (fertilised roe and fries up to 250 g)
Fries are carried at fair value. Fair value is determined on the basis of the biomass volume of fry and its weightedaverage market price at the balance sheet date.
• Juveniles (250 g fries up to fish suitable for harvesting)
The fair value of juveniles cannot be determined reliably due to the absence of an active market, and they are carriedin the statement of financial position at cost. The direct expenditures incurred in breeding the juveniles to fish suitablefor harvesting is capitalised as part of the cost.
At each balance sheet date, the cost is compared with the net realisable value of the juveniles. The net realisablevalue is the estimated fair value of fish suitable for harvesting at the time the juveniles are expected to become suitable for harvesting, less estimated costs on breeding the juveniles to make them suitable for harvesting, and on subsequent sale. When it is probable that the cash flows from future sales cover both the cost as well as the additional expenditurerelated to breeding and sale, juveniles are recognised at cost. Otherwise, juveniles are written down to their netrealisable value. Impairment losses are recognised in profit or loss.
• Fish suitable for harvesting (reclassification from juveniles to fish suitable for harvesting based on the weight)
On initial recognition (at acquisition or reclassification from juveniles) and at each balance sheet date, the fish suitablefor harvesting are measured at their fair value less estimated costs to sell. The basis for determination of fair value isthe estimated biomass of fish suitable for harvesting, less the weight loss occurring at disposal, and the weightedaverage market price at the balance sheet date, i.e. the latest market price for similar assets sold by independentparties, adjusted for the effect of existing differences, assuming no major changes have occurred in the economicenvironment between the transaction date and the balance sheet date. In the areas where external market prices areunavailable, the estimate is based on internal market prices. The quality class (higher or regular) is also taken intoaccount in the determination of prices.

Consolidated Audited Annual Report of 2019/2020 Financial Year 51
Costs to sell include fees to intermediaries, levies and non-refundable taxes. Costs to sell do not include transportation and other costs necessary to get an asset to a market, however, such expenditures are taken into account when determining fair value.
Expenditures directly related to bringing the immature biological assets up to the point they are suitable for harvesting are capitalised as part of the cost of biological assets. The cost is adjusted periodically by the re-measurement of the biological assets at fair value.
Gains and losses arising from fair value adjustments of biological assets are recognised in the separate line “Fair value adjustment on biological assets” in the statement of comprehensive income. Agricultural produce is recognised at fair value less estimated costs to sell.
LEASES
The Group has applied IFRS 16 using a modified retrospective approach and therefore the comparative information has not been restated and the comparative information continues to reflect the requirements of IAS 17 and IFRIC 4. The accounting policies in IAS 17 and IFRIC 4 are disclosed in detail separately from the accounting policies in IFRS 16.
Accounting policies from 1 July 2019
Upon concluding the agreement, the Group assesses whether the agreement is a lease agreement or whether the agreement includes a lease. A contract is a lease (or includes a lease) if it gives the right to inspect and use the specified property for a specified period of time for a consideration. The Group uses the definition of a lease in IFRS 16 to assess whether an arrangement gives it the right to control and use an asset.
These accounting policies apply to contracts entered into on or after 1 July 2019.
The group as a tenant
The Group recognizes the right to use the asset and the lease obligation at the inception of the lease. The right-of-use asset is initially measured at cost, which comprises the original amount of the lease obligation. The initial amount of the lease liability is adjusted by the prepayments made, the direct costs incurred and the restoration costs (arising from the dismantling and restoration of the asset). The rental benefits received have been deducted from the amount received.
The right-of-use assets are depreciated on a straight-line basis from the inception of the lease until the end of the lease term, unless the lease transfers ownership of the underlying asset to the Group at the end of the lease term or the residual value of the right indicates that the Group intends to exercise the option. In this case, the right to use the asset is depreciated over the useful life of the underlying asset, which is determined on the same basis as for the respective property, plant and equipment held by the Group. In addition, the right of use is reduced in the event of impairment losses. The right of use and the lease obligation are also adjusted for certain revaluations.
The lease liability is initially measured at the present value of the lease payments outstanding at the inception of the lease, using the effective interest rate method of the lease or, if that rate cannot be determined, the alternative borrowing rate. The Group generally uses an alternative borrowing rate as the discount rate.
The Group finds an alternative loan interest rate using various sources of financing. The inputs received are adjusted to take account of the terms of the lease and the type of leased asset in order to arrive at an alternative borrowing rate appropriate for the leased asset.
The lease payments included in the lease obligation include the following components:
• fixed lease payments;
• variable lease payments, if they change according to some basic index (for example, inflation, EURIBOR);
• payments associated with the exercise of options to repurchase, extend or terminate the lease (if managementhas assessed the exercise of the option sufficiently and the exercise of these options has been taken into accountin calculating the lease term);
• guaranteed residual value (expected value of the amount to be paid).
The lease liability is measured at amortized cost. The lease liability is recalculated when there is a change in future lease payments due to an index or rate, a change in the estimate of the guaranteed residual value or a change in the Group's assessment of whether to repurchase, extend or terminate the lease. The lease liability is also remeasured when the fixed payments change.

Consolidated Audited Annual Report of 2019/2020 Financial Year 52
If the lease liability is revalued for the reasons listed above, an adjustment is made to the carrying amount of the right-of-use asset. The effect of the change in the lease liability is recognized in the income statement when the carrying amount of the right to use the asset is reduced to zero.
The Group has decided not to recognize usufruct assets and lease obligations for low value leases and short-term leases. The Group recognizes lease payments related to these leases as an expense on a straight-line basis over the lease term.
Accounting policies before 30 June 2019
For contracts entered into before 30 June 2019, the Group assessed whether the agreement was a lease or included a lease based on whether all significant risks and rewards of ownership of the asset were transferred. The Group treated the remaining leases as operating leases.
The group as a tenant
Assets acquired under finance leases are recognized in the statement of financial position at the lower of the fair value of the asset and the present value of the minimum lease payments. Lease payments are apportioned between the finance charge (interest expense) and the reduction of the carrying amount of the liability. The finance charge is allocated to the lease term so as to achieve a constant periodic rate of interest on the remaining balance of the liability. Assets leased under finance leases are depreciated in the same way as other non-current assets, with the shorter of the expected useful life of the asset or the lease term (if the transfer of ownership is not sufficiently certain), whichever is shorter.
Operating lease payments are recognized as an expense in the statement of comprehensive income on a straight-line basis over the lease term.
Fees paid to the lessor upon conclusion of lease agreements are treated as part of the lease transaction and these fees are recognized as a prepayment of the lease in the statement of financial position and as a lease expense on a straight-line basis over the lease term.
FINANCIAL LIABILITIES
All financial liabilities (trade payables, other short and long-term liabilities, borrowings, listed bonds, forward, put and call options) are initially recognised at their fair value, less any transaction costs. They are subsequently recognised at amortised cost, using the effective interest rate method.
The amortised cost of the current financial liabilities generally equals their nominal value; therefore current financial liabilities are stated in the statement of financial position at redemption value. To calculate the amortised cost of non-current financial liabilities, they are initially recognised at fair value of the proceeds received (net of transaction costs incurred) and an interest expense is calculated on the liability in subsequent periods using the effective interest rate method.
A financial liability is classified as current when it is due to be settled within 12 months after the balance sheet date or the Group does not have an unconditional right to defer settlement of the liability for at least 12 months after the balance sheet date. Interest-bearing liabilities that are due within 12 months after the balance sheet date, but which are refinanced after the balance sheet date as long-term, are recognised as short-term interest-bearing liabilities. Also, borrowings are classified as short-term if the lender had at the balance sheet date the contractual right to demand immediate payment of the borrowing due to the breach of conditions set forth in the agreement.
Borrowing costs (interest) to finance the construction of assets are capitalised during the period that is required to complete and prepare the asset for its intended use. Other borrowing costs are expensed at the time they are incurred.
PROVISIONS AND CONTINGENT LIABILITIES
Provisions are recognized in the statement of financial position when the Group has a present obligation (legal or contractual) arising from an event that occurred before the balance sheet date; it is probable that an outflow of resources embodying economic benefits will be required to settle the obligation; but the exact amount of the liability or the due date is not known.
Provisions are recognized in the statement of financial position based on management's estimate of the amount that is expected to be required to settle the provision and the time at which the provision is realized. A provision is recognized in the statement of financial position at the amount the management estimates it will have at the balance sheet date to settle the obligation or transfer it to a third party. Provisions are recognized at the discounted value (amount of the present value of the payments related to the provision) unless the effect of discounting is immaterial. The cost of the provision is

Consolidated Audited Annual Report of 2019/2020 Financial Year 53
recognized in the statement of comprehensive income for the period. Future operating losses are not recognized as a provision.
Other liabilities, the realization of which is unlikely or the amount of which cannot be estimated with sufficient reliability, but which in certain circumstances may become liabilities in the future, are disclosed as contingent liabilities in the notes to the financial statements (note 28).
INCOME TAX AND DEFERRED INCOME TAX
Deferred income tax
Deferred income tax is recognised in respect of temporary differences between the carrying amounts of assets and liabilities for financial reporting purposes and the amounts used for taxation purposes.
According to the laws of the Republic of Estonia, the company's profit for the financial year is not taxed in Estonia. The corporate income tax liability arises on the distribution of profit and is recognized as an expense (profit or loss for the period) when dividends are declared. Due to the nature of the taxation system, a company registered in Estonia does not incur deferred income tax assets or liabilities, except for a possible deferred income tax liability from the company's investments in subsidiaries, associates and joint ventures and branches.
The Group's deferred income tax liability arises for companies located in countries where the profit for the financial year is taxed.
The Group's deferred income tax liability also arises from investments in Estonian subsidiaries, associates and joint ventures and branches, unless the Group can control the timing of the reversal of taxable temporary differences and their reversal is unlikely in the foreseeable future. Examples of reversals of taxable temporary differences are the payment of dividends, the sale or liquidation of an investment and other transactions.
By controlling the subsidiary's dividend policy, i.e the Group can block profit distribution decisions, the Group controls the timing of the reversal of temporary differences associated with that investment. If the parent has decided not to distribute the profit of the subsidiary in the foreseeable future, it does not recognize a deferred income tax liability. If the parent estimates that the dividend will be paid in the foreseeable future, the deferred income tax liability is measured to the extent of the planned dividend payment, provided that there are sufficient funds and equity to pay the dividend at the reporting date.
As the Group does not control the associate's dividend policy, it does not control the timing of the reversal of taxable temporary differences.
Estonian entities of the Group
According to the applicable laws of the Republic of Estonia, the Estonian entities do not pay income tax on their profits. Corporate income tax is paid on dividends, fringe benefits, gifts, donations, costs of entertaining guests, non-business related disbursements and on adjustments of the transfer price. The effective tax rate is 20/80 (2019: 20/80) of the amount paid out as net dividends. From 2019, tax rate of 14/86 can be applied to dividend payments. The more beneficial tax rate can be used for dividend payments in the amount of up to the average dividend payment during the three preceding years that were taxed with the tax rate of 20/80. When calculating the average dividend payment of three preceding years, 2018 will be the first year to be taken into account. As it is the dividends and not the profit that is subject to income tax, no temporary differences between the taxable values and the carrying amounts of assets and liabilities arise, which could give rise to deferred income tax assets and liabilities.
Income tax payable on dividends is recognised as an income tax expense in the statement of comprehensive income and as a liability in the statement of financial position at the time dividends are declared, regardless of the actual payment date or the period for which dividends are paid.
Foreign entities of the Group
In Sweden, Finland and Great Britain corporate profits are taxable with income tax. For identification of the taxable income, the pre-tax profit is adjusted for temporary or permanent income and expense additions as required by local income tax laws.
For foreign subsidiaries, deferred income tax assets or liabilities are determined for all temporary differences between the tax bases of assets and liabilities and their carrying amounts at the balance sheet date. Deferred income tax is determined using tax rates (and laws) that have been enacted by the balance sheet date and are expected to apply when the related deferred income tax asset is realized or the deferred income tax liability is settled. Deferred tax assets are recognised in

Consolidated Audited Annual Report of 2019/2020 Financial Year 54
the statement of financial position only when it is probable that future taxable profit will be available against which the deductions can be made.
Income tax rate in Sweden is 21.4% (2019: 21.4%), in the Great Britain 19% (2019: 19%) and in Finland 20% (2019: 20%).
REVENUE RECOGNITION
Revenue is the income generated by the ordinary activities of the Group. Revenue is recognized at the transaction price. The transaction price is the total consideration the Company is entitled to receive for the delivery of the promised goods or services to the customer, less any amounts collected on behalf of third parties. The Group recognizes revenue when control of a good or service is transferred to a customer
Wholesale
Sales are recognized when control over the products has been transferred, meaning that the products have been delivered to a reseller, the reseller can decide on the marketing and pricing of the products, and there are no outstanding obligations that could affect the reseller's acceptance of the products. Products are delivered to an agreed location, risks of product damage and loss have passed to the reseller, and the reseller has accepted the products in accordance with the sales agreement, the acceptance requirement has expired, or the Group has objective evidence that all acceptance requirements are met. The Group's wholesale business includes the sale of fish and fishery products. As with food, the shelf life is short and there is no obligation to repurchase the goods, nor is the product long-term guaranteed. This is largely a flat fee sale. In the case of a variable component, such as a volume-related bonus, the sales price adjustment is recognized in the same period as the sales revenue.
The Group recognizes a receivable when the goods are delivered, because at that point in time an unconditional right to payment arises, the payment of which is dependent only on the passage of time.
Financing component
The Group has no agreements where the period between delivery of the promised goods or services to the customer and receipt of payment from the customer is longer than one year. Consequently, the Group does not adjust the transaction price for the time value of money.
Interest income and dividend income
Interest income is recognized when it is probable that the economic benefits associated with the transaction will flow to the enterprise and the amount of the revenue can be measured reliably. Interest income is recognized using the effective interest rate of the asset. Dividend income is recognized when the right to receive payment is established.
SEGMENT REPORTING
Reportable business segments are identified based on regular reporting to internal senior decision-makers. The chief operating decision maker in the Group, who is responsible for allocating resources and evaluating the performance of the business segments, is the Board of the parent company, which makes strategic decisions.
Segment result includes revenue and expenses that are directly attributable to the segment and a significant portion of the revenue / expense that can be attributed to a particular segment, either externally or internally. Segment assets and liabilities include operating assets and liabilities that are directly attributable to a segment or that can be allocated to a particular segment. See also note 18.
SHARE CAPITAL
Ordinary shares are included within equity. The expenditures related to the issue of ordinary shares are recognised as a reduction of equity. Treasury shares repurchased by the parent company are recognised as a reduction of equity (in the line item “Treasury shares”). Disbursements and contributions related to treasury shares are recognised in equity.
STATUTORY RESERVE CAPITAL
Reserve capital is formed to comply with the requirements of the Commercial Code of the Republic of Estonia. During each financial year, at least 5% of the net profit shall be transferred to reserve capital until reserve capital reaches one-tenth of share capital. Reserve capital may be used to cover a loss or to increase share capital. Payments shall not be made to shareholders from reserve capital.
EARNINGS PER SHARE
Basic earnings per share are determined by dividing the net profit for the financial year by the period’s weighted average number of shares issued. Treasury shares are not included in the weighted average number of shares. Diluted earnings

Consolidated Audited Annual Report of 2019/2020 Financial Year 55
per share are calculated by adjusting the net profit and the weighted average number of shares outstanding for the effects of dilutive potential ordinary shares.
PAYABLES TO EMPLOYEES
Payables to employees include the performance pay payable to employees on the basis of employment contracts which are calculated by reference to the Group's financial results and fulfilment of the employees’ individual performance objectives. Performance pay is recognised as an expense and a payable to employees if the disbursement takes place during the next reporting period. In addition to performance pay, this accrual also includes expenses on social security tax and unemployment insurance tax calculated on the performance pay. Payables to employees include the accrued vacation pay calculated according to employment contracts and employment laws effective in Estonia.
The Group makes contributions to several mandatory funded pension funds, which are recognised as expenses in the statement of comprehensive income (this expense is included within the social security tax for the parent company and the subsidiaries located in Estonia). The Group has neither a legal nor a factual obligation to make other pension or similar payments in addition to those mentioned above.
GOVERNMENT GRANTS
Government grants are recognised at their fair value when there is a reasonable assurance that the grant will be received and the Group will comply with all attached conditions. Government grants are recognised as income over the periods necessary to match them with the related costs which they are intended to compensate. Government grants for non-current assets are included within non-current liabilities and are credited to income in the income statement over the useful life of the acquired asset.
FINANCIAL RISKS
The Group’s risk management policy is based on the requirements established by regulatory bodies, generally accepted practices and the Group’s internal rules. The Group is guided by the principle to manage risks in a manner that ensures an optimal risk to reward ratio. As part of the Group's risk management, all potential risks, their measurement and control are defined, and an action plan is prepared to reduce risks while ensuring the attainment of the company’s financial and other strategic objectives.
The management board of the Parent Company has the main role in managing risks. The supervisory board of the Parent Company exercises supervision over the measures taken by the management board in managing risks. The Group assesses and limits risks through systematic risk management. For managing financial risks, the Group has involved its financial unit that finances the Parent Company as well as its subsidiaries and, directly as a result of that, also manages liquidity risk and interest rate risk.
Financial instruments by category
FINANCIAL ASSETS AT 30.06.2020
EUR '000 Note At adjusted acquisition cost
Fair value through profit or loss Total
Cash and bank 5 2,276 0 2,276
Trade receivables 6 2,721 0 2,721
Other receivables 6 93 0 93
Total 5,090 0 5,090
FINANCIAL LIABILITIES AT 30.06.2020
EUR '000 Note At adjusted acquisition cost
At fair value through profit or loss
Total
Interest-bearing liabilities 14 19,871 0 19,871
Lease liabilities 13 3,108 0 3,108
Trade payables 15 5,903 0 5,903
Other liabilities 9, 15 190 2,546 2,736
Liabilities to related parties 15 139 0 139
Other liabilities 15 510 0 510
Total 29,721 2,546 32,267

Consolidated Audited Annual Report of 2019/2020 Financial Year 56
FINANCIAL ASSETS AT 30.06.2019
EUR '000 Note At adjusted acquisition cost
Fair value through profit or loss Total
Cash and bank 5 2,583 0 2,583
Trade receivables 6 2,790 1,659 4,449
Other receivables 6 11 0 11
Total 5,384 1,659 7,043
FINANCIAL LIABILITIES AT 30.06.2019
EUR '000 Note At adjusted acquisition cost
Fair value through profit or loss Total
Interest-bearing liabilities 14 23,042 0 23,042
Trade payables 15 8,198 0 8,198
Other liabilities 9, 15 449 2,591 3,040
Total 31,689 2,591 34,280
As at 30.06.2020 and 30.06.2019, the Group had no financial liability at fair value through other comprehensive income.
Financial risk management is an important and integral part of the management of the Group's business processes. Management's ability to identify, measure and control various risks has a significant impact on the Group's profitability. Risk is defined by the Group's management as a possible negative deviation from expected financial performance.
The Group's activities involve a number of financial risks, the most important of which are the credit risk, liquidity risk and market risk, incl. exchange rate risk, interest rate risk, fair value risk and fair value interest rate risk.
CREDIT RISK
Credit risk expresses the potential loss that customers incur if their contractual obligations are not met. Customers' payment discipline is constantly monitored to reduce credit risk.
In order to minimize credit risk, the solvency of a potential future contract partner is assessed based on information available from the Krediidiinfo, Commercial Register, the Tax Board or other public sources. Purchase and sales contracts are made with all contractual partners and payment terms are only granted to trusted partners.
In determining whether the credit risk of a financial asset has increased significantly from the date of initial recognition till measuring its credit losses, the Group considers reasonable and supportive information that is relevant and available without excessive expense or effort. It includes both quantitative and qualitative information and analysis based on the Group's historical experience and credit assessment information, and includes forward-looking information (including growth forecast, market interest rate forecast). The Group views the credit risk of financial assets increasing notably if more than 90 days have passed the due date and there is no activity confirming the receipt by the customer.
The maximum credit risk arising from the Group's trade receivables is set out below:
TRADE RECEIVABLES
EUR '000 Not yet due Not impaired,
past due up to 90 days
Not impaired, past due over 90
days
Unlikely receivables Total
30.06.2020 2,484 112 125 35 2,756
30.06.2019 3,867 479 103 9 4,458
The customer base of the Group is stable and long-term and the payment behaviour to date has not given a cause to write down overdue receivables of up to 90 days. At the time of compiling the report, most of the receivables have been collected.
TRADE RECEIVABLES (NOT DUE) BY COUNTRY

Consolidated Audited Annual Report of 2019/2020 Financial Year 57
EUR '000 30.06.2019 30.06.2018
Finland 540 2,278
United Kingdom 899 1,257
Estonia 1 045 332
Total trade receivables 2 484 3,867
The Group accepts banks and financial institutions with a credit rating of at least "A" as long-term partners in the Baltic States, United Kingdom and Scandinavia.
As at 30.06.2020, free funds were held in the following credit institutions: AS SEB Bank (SEB), OP Corporate Bank, Bank of Scotland Plc, Danske Bank A/S (Swedish branch) and Swedbank AB group banks (Swedbank). According to Moody's Investor Service, these credit institutions or their parent companies were rated at least "A" at the time of writing.
As at 30.06.2019, free funds were held in the following credit institutions: AS SEB Bank (SEB), OP Corporate Bank, Bank of Scotland Plc, Danske Bank A/S (Swedish branch) and Swedbank AB group banks (Swedbank). According to Moody's Investor Service, these credit institutions or their parent companies were rated at least "A" as at the 30.06.2019.
LIQUIDITY RISK
Liquidity risk is the risk that the Group is unable to fulfil its financial obligations due to insufficient cash funds or inflows. This risk realizes when the Group does not have enough funds to serve its loans, to fulfil its working capital needs, to invest and/or to make declared dividend payments.
The objective of the Group is to keep the Group's financing needs and financing opportunities in balance. Cash flow planning is used as a liquidity risk management tool. To manage the Group's cash flows as efficiently as possible, the parent company and the Estonian subsidiaries' bank accounts form a single group account, which enables group account members to use the Group's cash within the limits set by the parent company.
To manage the liquidity risk, the Group uses various sources of financing, such as bank loans, overdrafts, issuing bonds, customer debts factoring and continuous monitoring of trade receivables and delivery contracts.
An overdraft is used to finance working capital. Long-term bank loans or lease agreements are used to invest in fixed assets. Management considers it important to monitor the liquidity risk, if needed the additional capital requirement can be arranged by overdraft or refinancing the loan portfolio. At the balance sheet date, overdraft in use was in amount of 8,783 thousand euros (30.06.2019: 8,783 thousand euros) (note 14).
Group´s working capital was negative as at 30.06.2020: current liabilities exceed the current assets by 3,967 thousand euros (30.06.2019: 3,054 thousand euros). The current liabilities as at 30.06.2020 include liabilities to related parties in amount of 4,046 thousand euros (including short term loan from Amber Trust II S.C.A. in amount of 1,500 thousand euros (notes 14, 26) and fair value of the liability to acquire the non- controlling interests in JRJ & PRF Ltd in amount of 2,546 thousand euros (note 9)). If necessary, Group has an opportunity to negotiate the longer than 12 months payment terms with related parties. By eliminating short-term liabilities to related parties, with whom the Group has the opportunity to agree on payment terms longer than 12 months, the Group's working capital is positive.
Analysis of non-discounted financial liabilities by maturity
FINANCIAL LIABILITIES AT 30.06.2020
EUR '000 less than 3 months
3 to 12 months 1 to 5 years Over 5 years Total
Interest-bearing liabilities 129 13,577 9,486 182 23,374
Lease liabilities 128 723 1,800 591 3,242
Trade and other payables 6,115 2,983 190 0 9,288
Total liabilities 6,372 17,283 11,476 773 35,904

Consolidated Audited Annual Report of 2019/2020 Financial Year 58
FINANCIAL LIABILITIES AT 30.06.2019
EUR '000 less than 3 months
3 to 12 months 1 to 5 years Over 5 years Total
Interest-bearing liabilities 966 13,006 9,957 0 23,929
Trade and other payables 6,827 1,439 3,286 0 11,552
Total liabilities 7,793 14,445 13,243 0 35,481
The calculation of interest cash flows is based on the interest rates prevailing at the balance sheet date.
CURRENCY RISK
Foreign exchange risk arises when business transactions and assets and liabilities are denominated in a currency that is not the entity's functional currency. The Group operates in Estonia (currency EUR), Finland (EUR), United Kingdom (GBP) and Sweden (SEK). All significant foreign contracts of the Group are denominated in euros to hedge currency risks. The Group does not have any significant foreign currency denominated long-term receivables and payables. All existing long-term leases are denominated in euro and are therefore treated as foreign currency risk-free liabilities.
Breakdown of financial instruments as at 30.06.2020 by underlying currency
EUR '000 Note EUR SEK GBP Total
Cash and bank 5 1,510 9 757 2,276
Trade receivables 6 1,755 0 966 2,721
Other receivables 6 73 0 20 93
Total financial assets 3,338 9 1,743 5,090
Interest-bearing liabilities 14 -18 983 0 -888 -19 871
Lease liabilities 13 -2 373 -185 -550 -3 108
Trade payables 15 -4 610 -358 -935 -5 903
Other liabilities 9, 15 0 0 -2 546 -2 546
Total financial liabilities -25 966 -543 -4 919 -31 428
Net currency position -22 628 -534 -3 176 -26 338
Breakdown of financial instruments as at 30.06.2019 by underlying currency
EUR '000 Note EUR SEK GBP Total
Cash and bank 5 1,675 62 846 2,583
Trade receivables 6 3,299 0 1,150 4,449
Other receivables 6 11 0 0 11
Total financial assets 4,985 62 1,996 7,043
Interest-bearing liabilities 14 -22,156 0 -886 -23,042
Trade payables 15 -5,949 -703 -1,546 -8,198
Other liabilities 9, 15 -449 0 -2,591 -3,040
Total financial liabilities -28,554 -703 -5,023 -34,280
Net currency position -23,569 -641 -3,027 -27,237
The Group monitors the amount of net currency positions on an ongoing basis to assess the extent of changes in foreign exchange rates. Considering the relative stability of the Group 's main currency – the euro – and other currencies, the

Consolidated Audited Annual Report of 2019/2020 Financial Year 59
share of non-euro currencies as well as the Group' s net operations in Sweden and the United Kingdom, the corresponding net currency positions are insignificant.
The possible developments in Great Britain are due to the Brexit unknown and the Group is open to risk. The Group uses financial instruments to mitigate the exchange rate risk arising from the pound, where appropriate. For other currencies, the management is of the opinion that the Group is not exposed to a significant amount of Swedish krona and Norwegian krone foreign exchange risks and has therefore not used financial instruments to hedge its currency risks arising from future transactions and assets.
Foreign exchange gains and losses are disclosed in notes 23 and 24.
INTEREST RISK
The Group uses interest rates based on the EURIBOR base rate for long- and short-term loans. In managing interest rate risks, potential losses from changes in interest rates are regularly compared to the cost of hedging them.
If on 30.06.2020 the interest rate of the interest-bearing liabilities with floating interest rate would be 0.1 percentage points lower or higher, the interest expense would be 120 thousand euros (30.06.2019: 209 thousand euros) lower or higher. Floating rate loans are, depending on the instrument, linked to 6- to 12-month EURIBOR or the UK central bank base rate.
Below is a summary of the Group's exposure to interest rate risk as at 30.06.2020 and 30.06.2019
AS AT 30.06.2020
EUR '000 Note less than 1 year from 1 to 5 years Over 5 years Total
Fixed interest rate
Interest bearing liabilities 1,500 9,486 0 10,986
Floating interest rate
Interest bearing liabilities 9,111 2,700 182 11,993
Total position 14 10,611 12,186 182 22,979
AS AT 30.06.2019
EUR '000 Note less than 1 year from 1 to 5 years Over 5 years Total
Fixed interest rate
Interest bearing liabilities 1,570 517 0 2,087
Floating interest rate
Interest bearing liabilities 19,331 1,624 0 20,955
Total position 14 20,901 2,141 0 23,042
CAPITAL MANAGEMENT
The Group counts loan capital and total equity as capital. As at 30.06.2020, the shareholders' equity totalled 19,819 thousand euros (30.06.2019: 21,866 thousand euros). The Group's policy is to maintain a strong equity base with the aim of maintaining credibility in the eyes of shareholders, creditors and the market and ensuring the Group's sustainable development. In the long term, the Group aims to increase shareholder income and ensure its ability to pay dividends.
To maintain or improve its capital structure, the Group may regulate the amount of dividends paid to shareholders, return capital to shareholders, issue new shares or sell assets to reduce debt.
The Group considers it important to ensure an optimal equity structure. Therefore, it is monitored that the Group's equity to assets ratio is at least 35% (30.06.2020: 34.7%, 30.06.2019: 35.0%) and the ratio of interest-bearing liabilities to assets does not exceed 25% (30.06.2019: 40.2%, 30.06.2019: 36.8%). The ratio of interest-bearing liabilities to assets has been temporarily exceeded due to loans for the acquisition of subsidiaries.

Consolidated Audited Annual Report of 2019/2020 Financial Year 60
The overdraft and investment loan agreement with AS SEB Pank sets out the conditions that the financial results of the Group must meet. During the reporting period, the terms of the overdraft limit in use, minimum EBITDA and debt coverage ratio (DSCR) were in breach of the agreement. The bank has confirmed that despite of the breach with the covenant set in agreement, the overdraft loan agreement will be prolonged till the end of the next financial year (2020/2021). As of 30.06.2020, this liability in the amount of 7,940 thousand euros has been recognized as current.
The investment loan agreement signed with AS SEB Pank was refinanced with bonds (listed since April 2020) during the current financial year. The terms of listing the bonds set out the conditions (net debt to EBITDA ratio and solvency of loans (DSCR)) that the Group's financial results must meet until the bonds are redeemed. Due to the declaration of a special situation of the COVID-19 pandemic declared in the last quarter of the reporting period and the consequent deterioration of the economic environment, PRFoods proposed to the bondholders to waive the financial approvals provided in the bond terms for the 2019/2020 financial year. The bondholders confirmed their consent to the temporary amendment of the terms and conditions at the bondholders' meeting held on 30.06.2020.
In line with industry practice, the Group uses a debt-to-equity ratio to monitor its capital. This ratio is calculated by dividing the net debt by total capital. Net debt is calculated by deducting cash and cash equivalents from gross debt (the sum of current and non-current loans recognized in the consolidated statement of financial position).
EUR '000 Note 30.06.2020 30.06.2019
Interest-bearing liabilities 14 22,979 23,042
Less: Cash and cash equivalents 5 2,276 2,583
Net debt 20,703 20,459
Total equity 19,819 21,866
Total capital (net debt + equity) 40,522 42,325
Net debt to total capital ratio 51% 48%
FAIR VALUE OF FINANCIAL INSTRUMENTS (NOTES 5,6, 9, 15)
The Group’s management estimates that the carrying amounts of financial assets and liabilities carried at amortised cost are not significantly different from their fair values at 30.06.2020 and 30.06.2019. Cash and bank balances, trade receivables, other receivables, trade payables and other payables are expected to be settled within 12 months or are recognised immediately before the balance sheet date and therefore their fair value is not significantly different from their carrying amount. Non-controlling interests are revalued annually. As at 30.06.2020 the Group has not recognised a significant difference in the value and the non-controlling interests’ buyout value is reflected as per date of signing the contract. The Group's long-term interest-bearing liabilities (mainly listed bonds) have fixed interest rate, and thus, the fair value of non-current financial liabilities is equal to their carrying amount.
MANAGEMENT JUDGEMENTS AND ESTIMATES The preparation of financial statements in compliance with IFRSs requires the use of accounting estimates. It also requires management to make judgements in the process of application of the accounting policies. Estimates and judgments are reviewed on an ongoing basis and they are based on historical experience and other factors, including projections of future events which are believed to be reasonable under the circumstances. The management makes certain judgements (in addition to judgments related to estimates) in the process of application of the accounting policies. The estimates that have a significant impact on the information presented in these financial statements and assumptions which may cause material adjustments to the carrying amounts of assets and liabilities within the next reporting period include: assessment of quantities and fair value of biological assets (note 8), assessment of net realisable value of assets (note 7), assessment of impairment of goodwill and useful lives of intangible assets note 12) and useful life of tangible assets (note 11).
ASSESSMENT OF QUANTITIES AND FAIR VALUE OF BIOLOGICAL ASSETS (NOTE 8)
Assessment of the fair value of biological assets always involves consideration of certain estimates, although the Group has internal experts to assess these factors. The quantity of the biomass is an estimated figure that is based on juvenile fish let to a lake or sea, their expected growth and death rates, based on the death rate coefficient identified during the period. The quantity is adjusted by descaling losses. The Group tests the biomass by conducting the actual test weighing of fish inventories at least once a year. The group performed the weighing of fish inventory during April and May in Finland and during May and June in Sweden. As before, it is not possible to weigh biomass as at balance sheet date due to too high water temperatures in the end of June and as weighing would result increase in death rate. In order to estimate the
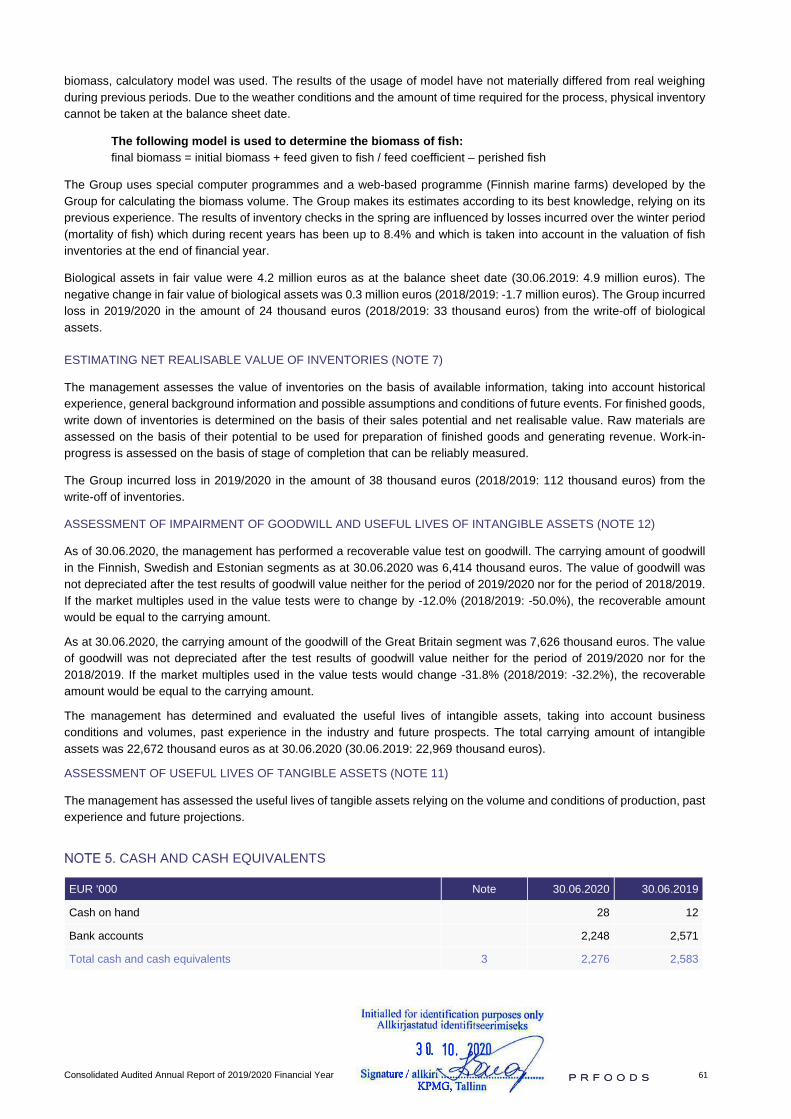
Consolidated Audited Annual Report of 2019/2020 Financial Year 61
biomass, calculatory model was used. The results of the usage of model have not materially differed from real weighing during previous periods. Due to the weather conditions and the amount of time required for the process, physical inventory cannot be taken at the balance sheet date.
The following model is used to determine the biomass of fish: final biomass = initial biomass + feed given to fish / feed coefficient – perished fish
The Group uses special computer programmes and a web-based programme (Finnish marine farms) developed by the Group for calculating the biomass volume. The Group makes its estimates according to its best knowledge, relying on its previous experience. The results of inventory checks in the spring are influenced by losses incurred over the winter period (mortality of fish) which during recent years has been up to 8.4% and which is taken into account in the valuation of fish inventories at the end of financial year.
Biological assets in fair value were 4.2 million euros as at the balance sheet date (30.06.2019: 4.9 million euros). The negative change in fair value of biological assets was 0.3 million euros (2018/2019: -1.7 million euros). The Group incurred loss in 2019/2020 in the amount of 24 thousand euros (2018/2019: 33 thousand euros) from the write-off of biological assets.
ESTIMATING NET REALISABLE VALUE OF INVENTORIES (NOTE 7)
The management assesses the value of inventories on the basis of available information, taking into account historical experience, general background information and possible assumptions and conditions of future events. For finished goods, write down of inventories is determined on the basis of their sales potential and net realisable value. Raw materials are assessed on the basis of their potential to be used for preparation of finished goods and generating revenue. Work-in-progress is assessed on the basis of stage of completion that can be reliably measured.
The Group incurred loss in 2019/2020 in the amount of 38 thousand euros (2018/2019: 112 thousand euros) from the write-off of inventories.
ASSESSMENT OF IMPAIRMENT OF GOODWILL AND USEFUL LIVES OF INTANGIBLE ASSETS (NOTE 12)
As of 30.06.2020, the management has performed a recoverable value test on goodwill. The carrying amount of goodwill in the Finnish, Swedish and Estonian segments as at 30.06.2020 was 6,414 thousand euros. The value of goodwill was not depreciated after the test results of goodwill value neither for the period of 2019/2020 nor for the period of 2018/2019. If the market multiples used in the value tests were to change by -12.0% (2018/2019: -50.0%), the recoverable amount would be equal to the carrying amount.
As at 30.06.2020, the carrying amount of the goodwill of the Great Britain segment was 7,626 thousand euros. The value of goodwill was not depreciated after the test results of goodwill value neither for the period of 2019/2020 nor for the 2018/2019. If the market multiples used in the value tests would change -31.8% (2018/2019: -32.2%), the recoverable amount would be equal to the carrying amount.
The management has determined and evaluated the useful lives of intangible assets, taking into account business conditions and volumes, past experience in the industry and future prospects. The total carrying amount of intangible assets was 22,672 thousand euros as at 30.06.2020 (30.06.2019: 22,969 thousand euros).
ASSESSMENT OF USEFUL LIVES OF TANGIBLE ASSETS (NOTE 11)
The management has assessed the useful lives of tangible assets relying on the volume and conditions of production, past experience and future projections.
CASH AND CASH EQUIVALENTS0
EUR '000 Note 30.06.2020 30.06.2019
Cash on hand 28 12
Bank accounts 2,248 2,571
Total cash and cash equivalents 3 2,276 2,583
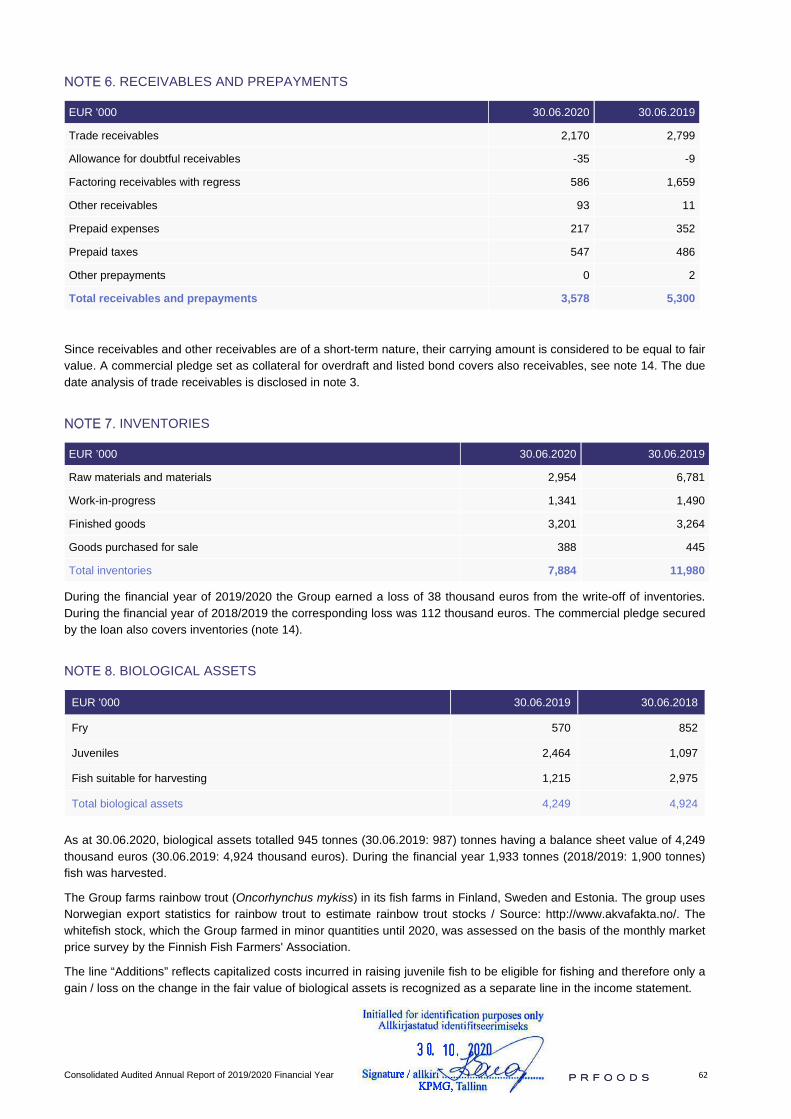
Consolidated Audited Annual Report of 2019/2020 Financial Year 62
RECEIVABLES AND PREPAYMENTS
EUR '000 30.06.2020 30.06.2019
Trade receivables 2,170 2,799
Allowance for doubtful receivables -35 -9
Factoring receivables with regress 586 1,659
Other receivables 93 11
Prepaid expenses 217 352
Prepaid taxes 547 486
Other prepayments 0 2
Total receivables and prepayments 3,578 5,300
Since receivables and other receivables are of a short-term nature, their carrying amount is considered to be equal to fair value. A commercial pledge set as collateral for overdraft and listed bond covers also receivables, see note 14. The due date analysis of trade receivables is disclosed in note 3.
INVENTORIES
EUR ’000 30.06.2020 30.06.2019
Raw materials and materials 2,954 6,781
Work-in-progress 1,341 1,490
Finished goods 3,201 3,264
Goods purchased for sale 388 445
Total inventories 7,884 11,980
During the financial year of 2019/2020 the Group earned a loss of 38 thousand euros from the write-off of inventories. During the financial year of 2018/2019 the corresponding loss was 112 thousand euros. The commercial pledge secured by the loan also covers inventories (note 14).
BIOLOGICAL ASSETS
EUR '000 30.06.2019 30.06.2018
Fry 570 852
Juveniles 2,464 1,097
Fish suitable for harvesting 1,215 2,975
Total biological assets 4,249 4,924
As at 30.06.2020, biological assets totalled 945 tonnes (30.06.2019: 987) tonnes having a balance sheet value of 4,249 thousand euros (30.06.2019: 4,924 thousand euros). During the financial year 1,933 tonnes (2018/2019: 1,900 tonnes) fish was harvested.
The Group farms rainbow trout (Oncorhynchus mykiss) in its fish farms in Finland, Sweden and Estonia. The group uses Norwegian export statistics for rainbow trout to estimate rainbow trout stocks / Source: http://www.akvafakta.no/. The whitefish stock, which the Group farmed in minor quantities until 2020, was assessed on the basis of the monthly market price survey by the Finnish Fish Farmers' Association.
The line “Additions” reflects capitalized costs incurred in raising juvenile fish to be eligible for fishing and therefore only a gain / loss on the change in the fair value of biological assets is recognized as a separate line in the income statement.

Consolidated Audited Annual Report of 2019/2020 Financial Year 63
CHANGE IN BIOLOGICAL ASSETS
EUR ’000 2019/2020 2018/2019
Biological assets at beginning of the period 4,924 6,498
Purchased 573 1,037
Additions 5,299 5,056
Fair value adjustments -291 -1,744
Harvested -6,212 -5,849
Written off -24 -33
Fry and live fish sold -27 -14
Exchange rate differences 7 -27
Biological assets at end of the period 4,249 4,924
The Group measures biological assets at fair value or cost if fair value cannot be measured reliably.
The fair value of fish fry has been estimated using purchase bid prices and biomass volume, which as of 30.06.2020 was 75 tons (30.06.2019: 97 tons). If the biomass volume were 1% lower then the fair value of fish fry at the balance sheet date would be 9 thousand euros lower, if the biomass volume would be 1% higher then the fair value of fish fry at the balance sheet date would be 9 thousand euros higher respectively.
The fair value of juvenile fish cannot be reliably estimated due to the absence of an active market. Therefore, juveniles are recognized at cost. At each balance sheet date, the cost is compared with the net realizable value of juvenile fish. As of 30.06.2020, management estimates that the net realizable value of juvenile fish is not significantly lower than its acquisition cost. Therefore, as at 30.06.2020 and 30.06.2019, juvenile fish were recorded at cost.
Fish suitable for harvesting is valued at fair value, taking into account the price of similar assets quoted on the market, adjusted for the effects of differences that exist.
In addition to the market value, management used the following inputs to determine fair value:
• Gutting loss 8% (30.06.2019: 6%)
• Loss in harvesting 15% (30.06.2019: 15%)
• Fair value of biomass volume suitable for harvesting 337 tonnes (30.06.2019: 620 tonnes)
THE POSSIBLE EFFECT TO THE FAIR VALUE OF FISH SUITABLE FOR HARVESTING IN CASE OF CHANGE IN INPUTS:
EUR ’000 Market price Harvesting loss Gutting expenses Volume of biomass
+1% -1% -1pp +1pp -1pp +1pp +1% -1%
30.06.2020 +19 -19 +13 -13 +3 +27 +18 -42
30.06.2019 +41 -35 +33 -33 +33 -27 +38 -49

Consolidated Audited Annual Report of 2019/2020 Financial Year 64
SUBSIDIARIES
During the financial year there were no business combinations.
Subsidiary Domicile
Ownership interest
30.06.3019
Ownership interest
30.06.2018 Area of activity Owner
Saaremere Kala AS Estonia 100% 100% Fish group holding company AS PRFoods
Vettel OÜ Estonia 100% 100% Production of fish products Saaremere Kala AS
Heimon Kala Oy 1 Finland 100% 100% Fish farming, processing and sale of fish and fish products Saaremere Kala AS
Överumans Fisk AB Sweden 100% 100% Fish farming Heimon Kala Oy
Oy Trio Trading Ab 1 Finland 100% 100% Production and sale of fish products Saaremere Kala AS
JRJ & PRF Limited 2 Scotland 85% 85% Fish group holding company Saaremere Kala AS
John Ross Jr. (Aberdeen) Limited Scotland 100% 100% Production and sale of fish
products JRJ & PRF Limited
Coln Valley Smokery Limited Great Britain 100% 100% Production and sale of fish
products
64% JRJ & PRF Limited 36% John Ross Jr. (Aberdeen) Limited
Redstorm OÜ 3 Estonia 51% 0% Fish farming Saaremere Kala AS 1 01.10.2018 decision to merge Heimon Kala Oy and Oy Trio Trading Ab, the merger completed on 31.01.2020, the transaction did not affect the consolidated profit, assets or liabilities of the Group 2 The Group has forward agreements to acquire 100% of the company 3 The participation has been paid in installements. In the financial year 2019/2020, the last installment of 131 thousand euros was paid
The ownership percentage of subsidiaries’ equity equals the voting rights. The shares of subsidiaries are not listed.
John Ross Jr (Aberdeen) Limited, Coln Valley Smokery Limited
On 19.07.2017 the extraordinary general meeting of AS PRFoods shareholders approved acquisition of majority shareholding of John Ross Jr (Aberdeen) Limited (JRJ) and Coln Valley Smokery Limited (CVS). Additional information about the transaction can be found on PRFoods homepage www.prfoods.ee. The acquisition date was 21.07.2017.
JRJ is a leading Scottish processed salmon company and producer of premium traditional smoked salmon. JRJ is the holder of the Royal Warrant and is selling its products in the United Kingdom as well as in 36 countries globally. CVS has premium salmon brand based in England and is a supplier to many of the leading restaurants, hotels, premium retailers and sporting events. Saaremere Kala AS’s subsidiary JRJ & PRF Ltd acquired 100% of shares and control in John Ross Jr. (Aberdeen) Ltd and 64% of shares and 100% of control in Coln Valley Smokery Ltd. JRJ & PRF Ltd was established for business combination, 85% of the shares belong to Saaremere Kala AS and 15% of the to the sellers C. Leigh and V. Leigh-Pearson.
The transaction value to acquire 85% of control was 14,690 thousand euros, from which 11,746 thousand euros was paid upon completion of the transaction. Deferred payment in the amount of 840 thousand euros to Andrew Leigh was scheduled to 6 months after the transaction date. A symmetrical put and call option agreement was signed with Jennifer Leigh for transferring a 33% shareholding of John Ross Jr (Aberdeen) Ltd 12 months after the transaction date. The exercise price of option was fixed at 2,103 thousand euros as of the exchange rate of the transaction date. Jennifer Leigh signed a waver for all rights of any dividend declared by John Ross Jr (Aberdeen) Ltd. As control of the acquired company and risks were transferred to the Group, non-controlling interests of Jennifer Leigh is not reflected in the financial reports.
Non-controlling interests in JRJ & PRF Ltd
In 2017, Saaremere Kala AS entered into an agreement to acquire the 15% non-controlling interest in JRJ & PRF Ltd including a call and a put option, and the terms of which according to the management make it in essence a forward contract to acquire non-controlling interests. Therefore, at the time of the business combination, non-controlling interests was not recognized, and the management estimated that 100% control of the acquired companies was achieved. The exercise price of the forward contract is not fixed but depends on the financial performance of the acquired companies.

Consolidated Audited Annual Report of 2019/2020 Financial Year 65
The fair value of the liability as at 30.06.2020 is 2,546 thousand euros (30.06.2019: 2,591 thousand euros), the change in the fair value of the liability is recognized in the income statement. The liability is denominated in GBP and the change from the previous balance sheet date is due to exchange rate fluctuations. The fair value of the liability is determined using a similar methodology, inputs and management assessments as used in the goodwill test to determine the market value of the United Kingdom segment. JRJ & PRF Ltd also issued loan notes to Victoria Leigh-Pearson and Christopher Leigh at the time of transaction in total amount 441 thousand euros at the exchange rate of the transaction date. The loan notes are denominated in GBP and bear interest at 4% per annum. Loan notes realisation is tied to forward agreement realisation.
According to management’s assessment the signed agreement is a forward agreement as:
• Symmetrical call and put options can be executed in financial years ending 2020-2022 after the audited annualreports have been approved and signed or after event of exit.
• Victoria Leigh-Pearson and/or Christopher Leigh have the right to receive 80-100% of the fair value of the sharesand loan notes depending on the conditions of terminating employment.
The Group has paid dividends to non-controlling interests in the amount of 239 thousand euros in 2019/2020 in connection to internal dividend distribution from John Ross Jr (Aberdeen) Ltd. (2018/2019: 170 thousand euros was paid to non-controlling interest holders). Dividend expense was recognized under other operating expenses (in the note 23 among other operating income / expense).
DEFERRED TAX
DEFERRED TAX ASSETS
EUR ‘000 Tax losses Other Total
Deferred tax assets as at 31.12.2018 115 38 153
Impact on income statement -112 0 -112
Deferred tax assets as at 30.06.2019 3 38 41
Impact on income statement 13 0 13
Deferred tax assets as at 30.06.2020 16 38 54
DEFERRED TAX LIABILITY
EUR ‘000 Accelerated income tax
amortisation
Fair value adjustment Other Total
Deferred tax liability as at 31.12.2018 32 901 1,508 2,441
Impact on income statement -19 -397 -34 -450
Impact on other comprehensive income 0 0 19 19
Deferred tax liability as at 30.06.2019 13 504 1,493 2,010
Impact on income statement -13 -86 -34 -133
Impact on other comprehensive income 0 -2 45 43
Deferred tax liability as at 30.06.2020 0 416 1504 1,920

Consolidated Audited Annual Report of 2019/2020 Financial Year 66
TANGIBLE ASSETS
EUR ‘000 Land and buildings
Machinery and equipment
Other tangible assets
Construction in progress,
prepayments Total
Cost at 30.06.2018 12 253 16 394 1 136 26 29 809 Acquired during the period 262 1 742 29 173 2 206
Acquired through business combinations 1 394 692 0 0 2 086
Reclassification 0 70 -70 0 0
Assets sold and written off -289 -593 -71 0 -953
Unrealised currency effect -34 -67 -3 0 -104
Cost at 30.06.2019 13 586 18 238 1 021 199 33 044 Applying IFRS 16 for the first time 1 423 156 0 0 1 579 Adjusted beginning balance of 01.07.2019 15 009 18 394 1 021 199 34 623
Acquired during the period 281 504 5 1 536 2 326
Reclassification* 80 532 21 -633 0
Assets sold and written off -489 -1 706 -233 0 -2428
Unrealised currency effect -41 21 4 0 -16
Cost at 30.06.2020 14 840 17 745 818 1 102 34 505
Accumulated depreciation at 30.06.2018 -5 493 -10 794 -758 0 -17 045
Depreciation of the period -615 -1 239 -73 0 -1 927
Acquired through business combinations -143 -293 0 0 -436
Assets sold and written off 232 540 66 0 838
Unrealised currency effect 9 50 2 0 61 Accumulated depreciation at 30.06.2019 -6 010 -11 736 -763 0 -18 509
Depreciation of the period -767 -1 255 -212 0 -2 234
Assets sold and written off 523 1 525 398 0 2 446
Unrealised currency effect 1 -26 -4 0 -29Accumulated depreciation at 30.06.2020 -6 253 -11 492 -581 0 -18 326
Carrying amount at 30.06.2018 6 760 5 600 378 26 12 764
Carrying amount at 30.06.2019 7 576 6 502 258 199 14 535 Carrying amount at 30.06.2020 8 587 6 253 237 1 102 16 179
The distribution of rental assets by types of fixed assets is presented in note 13. In the reporting year, assets in the amount of 2,326 thousand euros (2018/2019: 2,033 thousand euros) were recorded as non-current assets including lease assets in the amount of 359 thousand (2018/2019: 680 thousand euros). For the purposes of IFRS 16, leases that were previously classified as "operating leases" in accordance with IAS 17 (note 13) were recognized as property, plant and equipment. As at 30.06.2020 and 30.06.2019, the companies of the PRFoods group did not have binding obligations for the acquisition of tangible fixed assets.

Consolidated Audited Annual Report of 2019/2020 Financial Year 67
INTANGIBLE ASSETS
EUR ‘000 Goodwill Trademarks and patents
Immaterial rights
Software licences
Pre-payments Total
Cost at 30.06.2018 13,817 8,784 973 546 348 24,468
Acquired during the period 0 0 6 125 250 381
Acquired through business combinations 448 0 0 0 0 448
Re-classification 0 0 54 0 -54 0
Assets sold and written off 0 0 0 -60 0 -60
Unrealised currency effect -92 -89 -1 0 -2 -184
Cost at 30.06.2019 14,173 8,695 1,032 611 542 25,053
Acquired during the period 0 0 1 41 211 253
Re-classification 0 0 306 0 -306 0
Assets sold and written off 0 -230 -9 -167 0 -406
Unrealised currency effect -136 -128 0 0 3 -261
Cost at 30.06.2020 14,037 8,337 1,330 485 450 24,639
Accumulated depreciation at 30.06.2018 0 -998 -378 -488 0 -1,864
Depreciation of the period 0 -197 -37 -48 0 -282Depreciation of assets sold and written off 0 0 0 60 0 60
Unrealised currency effect 0 0 2 0 0 2 Accumulated depreciation at 30.06.2019 0 -1,195 -413 -476 0 -2,084
Depreciation of the period 0 -199 -45 -54 0 -298Depreciation of assets sold and written off 0 230 7 170 0 407
Unrealised currency effect 0 7 1 0 0 8 Accumulated depreciation at 30.06.2020 0 -1,157 -450 -360 0 -1,967
Carrying amount at 30.06.2018 13,817 7,786 595 58 348 22,604
Carrying amount at 30.06.2019 14,173 7,500 619 135 542 22,969
Carrying amount at 30.06.2020 14,037 7,180 880 125 450 22,672
The Parent Company has carried out an impairment test for goodwill in the two segments as at 30.06.2020 using market-based comparable valuation multiples. Under the market-based method, an entity is compared with a similar entity in the same sector whose shares are traded on a market or which has recently been sold, and for which there is sufficient information available about the transaction price. In this case, the European manufacturers of food products, fish farms and fish product manufacturers are treated as the sector, and the price levels and various ratios of these companies have been compared.
To determine the fair value, average valuation multiples of the industry have been applied to the actual financial indicators of subsidiaries. The multiples used to assess the Finland-Sweden-Estonia segment were EV/Sales1 1.9 (2018/2019: 2.2) and EV/EBITDA2 12.3 (2018/2019: 14.6). As free cash flow is more important in creating the enterprise value, the EV/EBITDA multiplier was assigned a 75% share and the EV/Sales multiplier a 25% share. The segment’s multiple based market value was 36.0 million euros (2018/2019: 45.7 million euros). The balance sheet value of the segment is 31.6 million euros (2018/2019: 22.9 million euros) which was calculated as: Tangible assets + Goodwill + Current assets – Short-term liabilities – Cash.

Consolidated Audited Annual Report of 2019/2020 Financial Year 68
The recoverable amount determined as a result of the test conducted on 30.06.2020 and 30.06.2019 was higher than the balance sheet value. If the multiples used were 12,0% (2018/2019: 50.0%) lower, i.e. EV/Sales 1.6 (2018/2019: 1.1) and EV/EBITDA 10.8 (2017/2018: 7.3), then the recoverable amount would equal the carrying amount in the balance sheet.
The multiples used to assess the Finland-Sweden-Estonia segment were EV/Sales1 1.9 (2018/2019: 2.2) and EV/EBITDA2 12.3 (2018/2019: 14.6). As free cash flow is more important in creating the enterprise value, the EV/EBITDA multiplier was assigned a 75% share and the EV/Sales multiplier a 25% share. The segment’s multiple based market value was 24.8 million euros (2018/2019: 26.2 million euros). The balance sheet value of the segment was 16.9 million euros (2018/2019: 17.8 million euros), which was calculated with the following formula: Tangible assets + Goodwill + Current assets – Short-term liabilities – Cash.
The test conducted on 30.06.2020 and 30.06.2019 indicated that the recoverable value is higher than the balance sheet value. In case the multiples were 31.8% lower (2018/2019: 32.2%), i.e. EV/Sales 1.3 (2018/2019: 1.5) and EV/EBITDA 8.4 (2018/2019: 9.9), the recoverable value would equal the value in the balance sheet.
1 Enterprise Value / Sales 2 Enterprise Value / EBITDA
LEASES
As a lessee, the Group leases a number of assets, including machinery and equipment, land and water, as well as buildings. See note 11.
The Group leases, among other things, assets that are considered to be of low value (assets with a new value of less than EUR 5,000). The Group has decided not to recognize the use rights and lease obligations for these leases. The Group has also not recognized the right of use assets and lease obligations in the case of short-term lease agreements (less than 12 months).
Below is information on the lease agreements for which the Group is the lessee.
RIGHT-OF-USE ASSETS
EUR ‘000 Land and buildings Machinery and equipment Total
Balance as at 30.06.2019 0 0 0
IFRS 16 adoption 1,423 156 1,579
Reclassified finance leases 0 2,176 2,176
Balance as at 01.07.2019 1,423 2,332 3,755
Depreciation of the right-of-use asset during the period -201 -813 -1,014
Additions of the right-of-use assets 0 359 359
Derecognition of the right-of-use assets 0 0 0
Balance as at 30.06.2020 1,222 1,878 3,100
AMOUNTS RECOGNIZED IN THE INCOME STATEMENT
EUR ‘000 Total
2019/2020 - all leases according to IFRS 16 accounting principles
Interest on lease obligations 53
Total expenditure for 2019/2020 53
2018/2019 - operating leases in accordance with IAS 17 accounting principles
Operating lease payment expense 865
Total expenditure for 2018/2019 865

Consolidated Audited Annual Report of 2019/2020 Financial Year 69
AMOUNTS RECOGNIZED IN THE CASH FLOW STATEMENT
EUR ‘000 2019/2020
Total cash outflows from leases 653
Possibilities for renewal of lease agreements
Many leases of machinery and equipment and water areas include renewal options that the Group can use before the end of the lease term. For most contracts, the Group must give notice of the exercise of the renewal option at least one year before the end of the contract period. For certain contracts, the lease term is automatically extended before the end of the contract period. Extension options can only be used by the Group, the lessor does not have the right to do so. The Group assesses at the inception of the lease whether it is probable that the Group will exercise the option to extend it.
Finance leases (IAS 17)
The interest expense calculated in 2018/2019 was 20 thousand euros. Interest expense on finance leases is recognized in financial expenses In 2018, fixed assets in the amount of 680 thousand euros were acquired under finance leases. In 2018, the principal payments were 554 thousand euros. The residual value of the leased property as of 30.06.2019 was 1,573 thousand euros.
EUR ‘000 30.06.2019
Finance lease payments, incl. 1,192
Up to 1 year 324
1-5 years 868
Minimum lease payments for finance leases
Up to 1 year 343
1-5 years 889
Total 1,232
Future interest expense on finance leases -40
Present value of finance lease liabilities 1,232
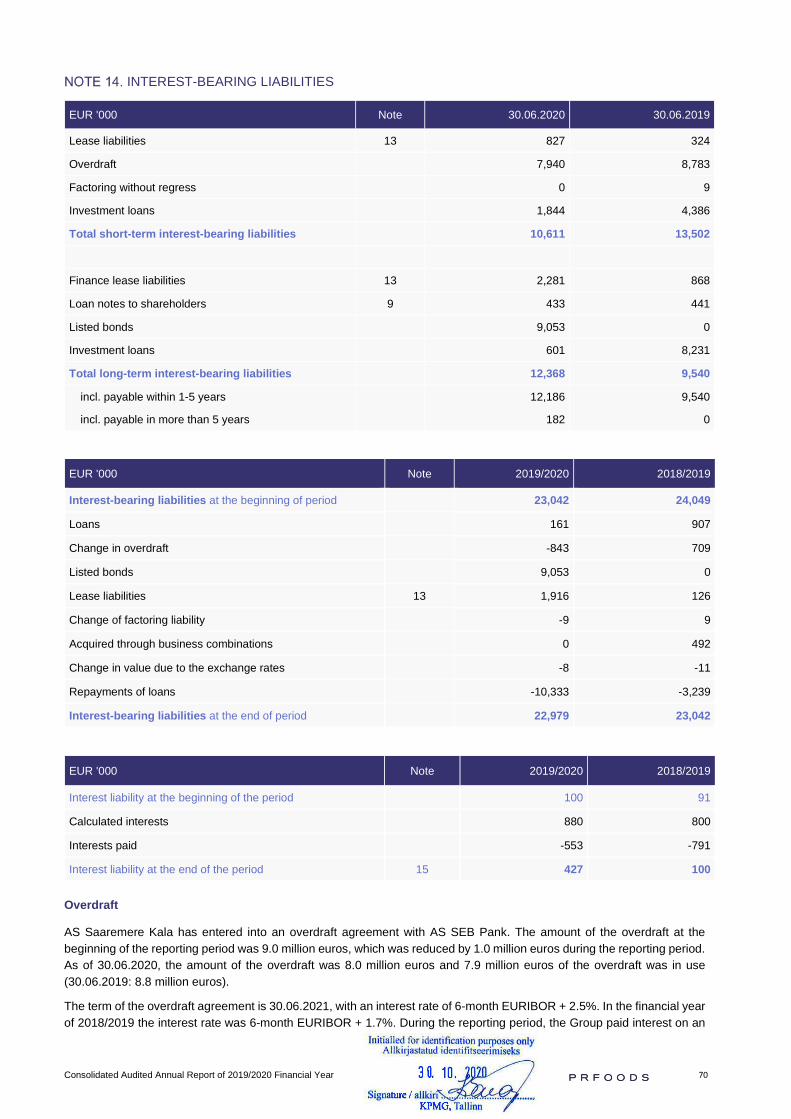
Consolidated Audited Annual Report of 2019/2020 Financial Year 70
INTEREST-BEARING LIABILITIES
EUR '000 Note 30.06.2020 30.06.2019
Lease liabilities 13 827 324
Overdraft 7,940 8,783
Factoring without regress 0 9
Investment loans 1,844 4,386
Total short-term interest-bearing liabilities 10,611 13,502
Finance lease liabilities 13 2,281 868
Loan notes to shareholders 9 433 441
Listed bonds 9,053 0
Investment loans 601 8,231
Total long-term interest-bearing liabilities 12,368 9,540
incl. payable within 1-5 years 12,186 9,540
incl. payable in more than 5 years 182 0
EUR '000 Note 2019/2020 2018/2019
Interest-bearing liabilities at the beginning of period 23,042 24,049
Loans 161 907
Change in overdraft -843 709
Listed bonds 9,053 0
Lease liabilities 13 1,916 126
Change of factoring liability -9 9
Acquired through business combinations 0 492
Change in value due to the exchange rates -8 -11
Repayments of loans -10,333 -3,239
Interest-bearing liabilities at the end of period 22,979 23,042
EUR '000 Note 2019/2020 2018/2019
Interest liability at the beginning of the period 100 91
Calculated interests 880 800
Interests paid -553 -791
Interest liability at the end of the period 15 427 100
Overdraft
AS Saaremere Kala has entered into an overdraft agreement with AS SEB Pank. The amount of the overdraft at the beginning of the reporting period was 9.0 million euros, which was reduced by 1.0 million euros during the reporting period. As of 30.06.2020, the amount of the overdraft was 8.0 million euros and 7.9 million euros of the overdraft was in use (30.06.2019: 8.8 million euros).
The term of the overdraft agreement is 30.06.2021, with an interest rate of 6-month EURIBOR + 2.5%. In the financial year of 2018/2019 the interest rate was 6-month EURIBOR + 1.7%. During the reporting period, the Group paid interest on an

Consolidated Audited Annual Report of 2019/2020 Financial Year 71
overdraft in the amount of 0.2 million euros (0.17 million euros in 2018/2019). From 01.12.2020 the overdraft amount is 7.0 million euros, the interest rate is 6-months EURIBOR + 3.0%, and with the term 30.06.2021.
The overdraft is used jointly and severally by Saaremere Kala AS together with its subsidiaries Vettel OÜ and Redstorm OÜ to finance working capital. The loan is secured by mortgages in the amount of 13.7 million euros, a commercial pledge in the amount of 4.8 million euros, a guarantee by AS PRFoods in the amount of 20.5 million euros and a 100% share pledge of Saaremere Kala AS, Heimon Kala Oy and Överumans Fisk AB.
Investment loans
The investment loan taken in 2017 from AS SEB Pank for the acquisition of the British subsidiaries (John Ross Jr. (Aberdeen) Ltd and Coln Valley Smokery Ltd), OY Trio Trading Ab and OÜ Redstorm was repaid prematurely on 27.01.2020. The repayment of the loan was financed by the issuance of secured bonds (see below). The balance of the investment loan at the time of early repayment was 8.7 million euros. During the reporting period, the Group paid interest on the above loan in the amount of 0.18 million euros (2018/2019: 0.36 million euros). The interest rate of the investment loan in the reporting period was 6-month EURIBOR + 2.75%.
On 14 July 2017 Amber Trust II S.C.A. granted an investment loan to PRFoods in the amount of 1.5 million euros to finance the purchase of subsidiaries. The loan repayment term has been extended by agreement of the parties and is 31.03.2021 at the time of submitting the report. The interest rate of the loan is 5% and the accrued interest is paid at the same time as the loan is repaid. As at 30.06.2020, the amount of the interest liability was 0.14 million euros (30.06.2019: 0.06 million euros).
The balance of the principal of the investment loan taken by Oy Trio Trading Ab (merged with Heimon Kala Oy as of 31.01.2020) from OP Corporate Bank (OP Yrityspankki Oy) in 2015 (initial loan amount 1.6 million euros) as of 30.06.2020 was 0.5 million euros (30.06 .2019: EUR 0.75 million). The interest rate of the loan is 12-month EURIBOR + 2.00% and the loan term is 31.08.2022. The loan is secured by a mortgage on a property in Kokkola (Finland).
John Ross Jr. (Aberdeen) Ltd has 4 long-term investment loans from the Bank of Scotland Plc, the outstanding balance of which was 0.46 million euros as of 30.06.2020 (30.06.2019: 0.37 million euros). During the reporting period, a new investment loan of EUR 0.15 million was taken for the expansion and automation of the plant in Aberdeen. The maturity of the loans ranges from 4 months to 13 years, with interest rates of 1.5%, 2.85%, 3.5 % and 4.2% + UK Bank Base rate. The UK Bank Base rate was 0.50% until 01.08.2018 and 0.75% as of 02.08.2018 according to the decision of the Bank of England.
Bonds
On 19.12.2019 PRFoods announced its plan to issue bonds via a private placement and a public issue. The main purpose of the proceeds of the bond issue was to refinance an investment loan and to invest in the Group's fish farms.
The bond issue was approved by the supervisory board with the following terms: the company will issue up to 100,000 secured bonds, with a nominal value of 100 euros per bond, the interest rate of 6.25% p.a., and with maturity on 22.01.2025. Bond interest is paid semi-annually (July and January). The interest liability as of 30.06.2020 was 0.3 million euros, which was paid to the bondholders on 22.07.2020.
A total of 90,096 bonds were issued in a private placement and 9,904 bonds in a public offering of which 4,926 were subscribed by AS PRFoods. Following the completion of the public offering of the bonds, the bonds were listed on Tallinn Stock Exchange. Trading on Nasdaq Tallinn bond list started on 6 April 2020.
For more detailed information on the terms of issuing the bonds please see the Stock Exchange Announcements dated 19.12.2019 and 21.01.2020, incl. in the bond issue prospectus.

Consolidated Audited Annual Report of 2019/2020 Financial Year 72
PAYABLES AND PREPAYMENTS
EUR '000 Note 30.06.2020 30.06.2019
Trade payables 3 5,903 8,198
Payables to employees 865 997
Other short-term liabilities 9 2,546 2,850
Interest payables 14 427 100
Prepayments from clients 0 1
Other payables 222 214
Tax liabilities, incl.: 1,169 1,745
Social security tax 122 161
VAT 740 1,063
Personal income tax 136 119
Corporate income tax 102 330
Other taxes 69 72
Total short-term payables and prepayments 11,132 14,105
Other long-term liabilities 190 190
Total long-term payables and prepayments 190 190
Other short-term liabilities as at 30.06.2020 include a non-controlling interest redemption amount of 2,546 thousand euros (30.06.2019: 2,591 thousand euros).
GOVERNMENT GRANTS
EUR '000 Note 2019/2020 2018/2019
Deferred income from government grants at the beginning of period 1,321 1,442
Government grants received and repaid during the period, net 221 137
Acquired through business combination 0 144
Change in value due to the exchange rates -5 -4
Recognized as income for labour force compensation during the period 23 -221 0
Recognized as income for investments during the period 23 -232 -398
Deferred income from government grants at the end of period 1,084 1,321
incl. income within 1 year 211 234
incl. income within 2-17 years 873 1,087
The government grants have been granted for investments in the Group’s fish farming and fish processing in Sweden and Finland, as well as for fish production facilities in Finland, Great Britain and Estonia.
Due to the special situation caused by Covid-19, the Group used government grants to partially reimburse labour costs in the amount of 221 thousand euros.

Consolidated Audited Annual Report of 2019/2020 Financial Year 73
EQUITY
As at 30.06.2020 the Group had 38 682 860 shares (30.06.2019: 38 682 860), including 1 000 000 treasury shares (30.06.2019: 1 000 000 treasury shares).
Treasury shares
As of 01.07.2014, the Group initiated a buy-back programme of its own shares in accordance with the resolution of the general meeting of shareholders held on 29.05.2014, according to which up to 500,000 own shares were to be bought back until 31.05.2017. The initial buy-back programme was completed on 18.05.2016. The ordinary general meeting of shareholders held on 26.05.2016 adopted a resolution to expand the existing buy-back programme, according to which up to additional 500,000 own shares were to be bought back until 29.05.2019. On 14 June 2016, the Management Board of AS PRFoods entered into a service agreement with AS SEB Pank to continue the implementation of the buy-back programme of own shares. As at 30.06.2019 AS SEB Pank had acquired 1,000,000 shares of AS PRFoods in the name and on the account of the Group with average price of 0.4915 euros per share.
The buy-back programme was implemented in compliance with the resolutions of the general meetings of shareholders held on 29.05.2014 and 26.05.2016, and the Commission Regulation (EU) No. 2016/1052 of 8 March 2016 supplementing Regulation (EU) No 596/2014 of the European Parliament and of the Council with regard to regulatory technical standards for the conditions applicable to buy-back programmes and stabilisation measures.
Reduction of share capital
Based on the decisions of the general meeting of shareholders held on 26.05.2016 the introduction of shares without par value instead of nominal value shares of AS PRFoods was entered in the Commercial Register on 30.06.2016. The registered share capital of the company is 7,736,572 euros divided into 38,682,860 ordinary shares without a nominal value of 0.20 euros each. In addition, a new version of the Articles of Association of the company came into force, according to which the minimum share capital is 7,000,000 euros and the maximum share capital is 28,000,000 euros. The Articles of Association are available on the homepage of AS PRFoods www.prfoods.ee.
List of shareholders with more than 5% holding at the balance sheet date
ING LUXEMBOURG S.A., CUSTODIAN FOR THE FOLLOWING SHAREHOLDERS
EUR ‘000 Number of
shares 30.06.2020
Ownership interest
30.06.2020
Number of shares
30.06.2019
Ownership interest
30.06.2019
Amber Trust II S.C.A 14,813,540 38.3% 14,813,540 38.3%
Amber Trust S.C.A 5,381,370 13.9% 5,381,370 13.9%
KJK Fund SICAV-SIF 4,063,456 10.5% 4,063,456 10.5%
Total 24,258,366 62.7% 24,258,366 62.7%
Earnings per share
Earnings per share are calculated as the ratio of the net profit attributable to equity holders of the parent to the weighted average number of shares outstanding during the period.
2019/2020 2018/2019
Net profit (loss) attributable to equity holders of the company, EUR ‘000 -1,718 -1,458Average number of shares, thousand 38,683 38,683 Earnings (Loss) per share, EUR -0.04 -0.04
Basic earnings (loss) per share, EUR -0.04 -0.04
Diluted earnings (loss) per share, EUR -0.04 -0.04
Capital reserve
The Estonian Commercial Code requires companies to create a capital reserve. Each year at least 1/20 of profit for the year has to be transferred to the capital reserve until the reserve amounts to 1/10 of share capital. The capital reserve may be used for covering losses and increasing the share capital but not for making distributions to shareholders. At the annual

Consolidated Audited Annual Report of 2019/2020 Financial Year 74
general meeting held on 19.12.2019 shareholders decided to cover the net loss of 1,472 thousand euros for the 2018/2019 financial year from the retained earnings. The annual general meeting held on 30.11 2018 decided to transfer 2,850 euros to reserves from net profit of the 2017/2018 financial year.
Dividends
The shareholders of AS PRFoods decided on the annual general meeting of shareholders held on 30.11.2018 to pay dividends in the amount of 386,829 euros, i.e. 0.01 euros per share. The dividend payment was made on 05.04.2019 in amount of 377 thousand euros.
Non-controlling interest
As non-controlling interest OÜ Fodiator’s 49% holding in OÜ Redstorm is recognized. See also note 9.
SEGMENT REPORTING
The Group’s segments are determined based on the reports monitored and analysed by the management board of the Parent Company. The management board of the Parent Company monitors financial performance by business areas and geographical areas. Reports by geographical areas include information of more significant importance for the management of the Group for monitoring financial performance and allocating resources. Therefore, this division is used to define business segments.
Two business segments – the fish segment and other segments - are presented together since the proportion of other segments in business operations is marginal. The proportion of other segments was 0.1% in the accounting period and 0.2% in the 2018/2019 financial year.
Starting from the financial year of 2017/2018 the Group monitors two geographical segments: i) the Finland, Sweden and Estonia segment and ii) the United Kingdom segment.
2019/2020 2018/2019
EUR '000 Finland,
Sweden, Estonia
Great Britain Total Finland,
Sweden, Estonia
Great Britain Total
External revenue 62,793 15,507 78,300 68,315 17,424 85,739
Inter-segment revenue 0 -8 -8 0 -12 -12
Total revenue 62,793 15,499 78,292 68,315 17,412 85,727 Fair value adjustment of biological assets -291 0 -291 -1,744 0 -1,744
EBITDA* 164 1,669 1,833 377 1,366 1,743
EBITDA from business operations** 846 1,908 2,754 2,198 1,792 3,990
Depreciation and amortisation -2,044 -488 -2,532 -1,774 -435 -2,209
Operating profit / loss -1,880 1,181 -699 -1,397 931 -466
Financial income and expenses -893 -169 -1,062 -626 -150 -776
Income tax 112 -246 -134 -22 -208 -230
Net profit (-loss) -2,661 766 -1,895 -2,045 573 -1,472
Segment assets 37,834 19,290 57,124 42,352 20,182 62,534
incl. current assets 15,428 2,559 17,987 21,202 3,585 24,787
incl. biological assets 4,249 0 4,249 , , ,
incl. non-current assets 22,406 16,731 39,137 21,150 16,597 37,747
Segment liabilities 32,697 4,607 37,304 36,063 4,605 40,668 Segment investments in tangible and intangible assets 2,069 510 2,579 2,452 135 2,587
Assets acquired through business combination*** 0 0 0 1,650 0 1,650
* EBITDA – operating profit adjusted with depreciation and impairement cost** before fair value adjustment of bioassets and one-offs*** financial instruments, deferred taxes not included

Consolidated Audited Annual Report of 2019/2020 Financial Year 75
SALES BY GEOGRAPHICAL REGIONS
EUR ‘000 2019/2020 2018/2019
Finland 50,871 59,885
United Kingdom 10,245 12,104
Estonia 7,023 5,710
Other 10,153 8,028
Total 78,292 85,727
NON-CURRENT ASSETS BY LOCATION
EUR ‘000 2019/2020 2018/2019
Great Britain 17,165 17,038
Finland 10,762 9,902
Estonia 8,543 8,426
Sweden 2,381 2,138
Total 38,851 37,504
The table shows non-current assets excl. financial assets and investments in associates.
REVENUE FROM CLIENTS WITH SALES OF MORE THAN 10% OF CONSOLIDATED REVENUE
EUR ‘000 2019/2020 2018/2019
Client 1 14,189 15,543
Client 2 12,867 14,009
Total 27,056 29,552
COST OF GOODS SOLD
EUR '000 Note 2019/2020 2018/2019
Materials in production & cost of goods purchased for resale -54,650 -59,353
Staff costs 22 -6,737 -7,171
Depreciation and amortisation -2,087 -1,741
Other costs of goods sold* -5,236 -5,565
Total cost of goods sold -68,710 -73,830
* Other costs of goods sold includes expenses related to production and fish farming assets (rent, maintenance, insurance, utilities,etc.), staff-related costs and other expenses and subcontracted services.

Consolidated Audited Annual Report of 2019/2020 Financial Year 76
SALES AND MARKETING EXPENSES
EUR '000 Note 2019/2020 2018/2019
Advertising, marketing and product development -534 -449
Transportation and logistics services -3,150 -3,416
Staff costs 22 -1,549 -1,657
Warehouse service -130 -131
Depreciation and amortisation -341 -356
Utilities -179 -205
Short-term lease expenses -200 -222
Other sales and marketing expenses* -977 -1,063
Total sales and marketing expenses -7,060 -7,499
* Other sales and marketing expenses include costs related to real estate (lease, maintenance, insurance, utilities etc.), staff relatedcosts and other services.
GENERAL AND ADMINISTRATIVE EXPENSES
EUR '000 Note 2019/2020 2018/2019
Staff costs 22 -2,303 -2,029
Depreciation and amortisation -104 -112
Consulting and advisory services* -197 -182
Information and communication services -78 -89
Legal services -26 -37
Transportation expenses -69 -81
Business trips and costs of entertaining guests -96 -105
Other general and administrative expenses** -576 -568
Total general and administrative expenses -3,449 -3,203
* In the financial year of 2019/2020 the Group has paid auditing fees in the amount of 140 thousand euros (2018/2019: 72 thousandeuros) and 57 thousand euros (110 thousand euros) for other limited assurance engagements as well as other advisory services.** Other general and administrative expenses include subcontracted services, bank fees, office related expenses, insurance costs, staff-related costs and other expenses.
STAFF COSTS
EUR '000 Note 2019/2020 2018/2019
Wages and salaries -8,804 -8,981
Social security tax and other labour taxes -1,785 -1,876
Total staff costs 19, 20, 21 -10,589 -10,857
Number of employees at end of the period 274 345
Average number of employees during the year 318 361
Staff costs are included in the lines of the statement of comprehensive income “Cost of goods sold”, “General and administrative expenses” and “Sales and marketing expenses”.

Consolidated Audited Annual Report of 2019/2020 Financial Year 77
EUR '000 Note 2019/2020 2018/2019
Staff costs of employees working under employment contract -9,508 -9,678
Staff costs of members of management or control board 26 -1,081 -1,179
Total staff costs -10,589 -10,857
Average number of employees working under employment contract 274 345
Average number of members of management or control board 16 16
Average number of employees during the year 318 361
OTHER OPERATING INCOME AND EXPENSES
EUR '000 Note 2019/2020 2018/2019
Gain on disposal and write-off of non-current assets 11, 12 51 18
Income from government grants 16 453 398
Foreign exchange income/expense 164 177
Other operating income/expense -149 -510
Total other operating expenses 519 83
FINANCIAL INCOME AND EXPENSE
EUR '000 2019/2020 2018/2019
Interest income 9 20
Other financial income 27 68
Foreign exchange income/expense -62 2
Interest expense -995 -800
Other financial expenses -41 -66
Total -1,062 -776
INCOME TAX EXPENSES
EUR '000 Note 2019/2020 2018/2019
Profit (Loss) before tax (consolidated) -1,761 -1,242Income tax expense /-income 254 549 Deferred income tax expense / income 10 -120 -319Effect on income statement 134 230
TRANSACTIONS WITH RELATED PARTIES
The Group considers parties to be related when one party has control over the other party or has significant influence over the business decision of the other party.
Related parties include:
• shareholders with significant influence (the largest shareholder of PRFoods is the international investment fundAmber Trust II S.C.A.);
• members of the supervisory board and members of all supervisory and management boards of group entities;
• close family members of the persons mentioned above and the companies related to them.
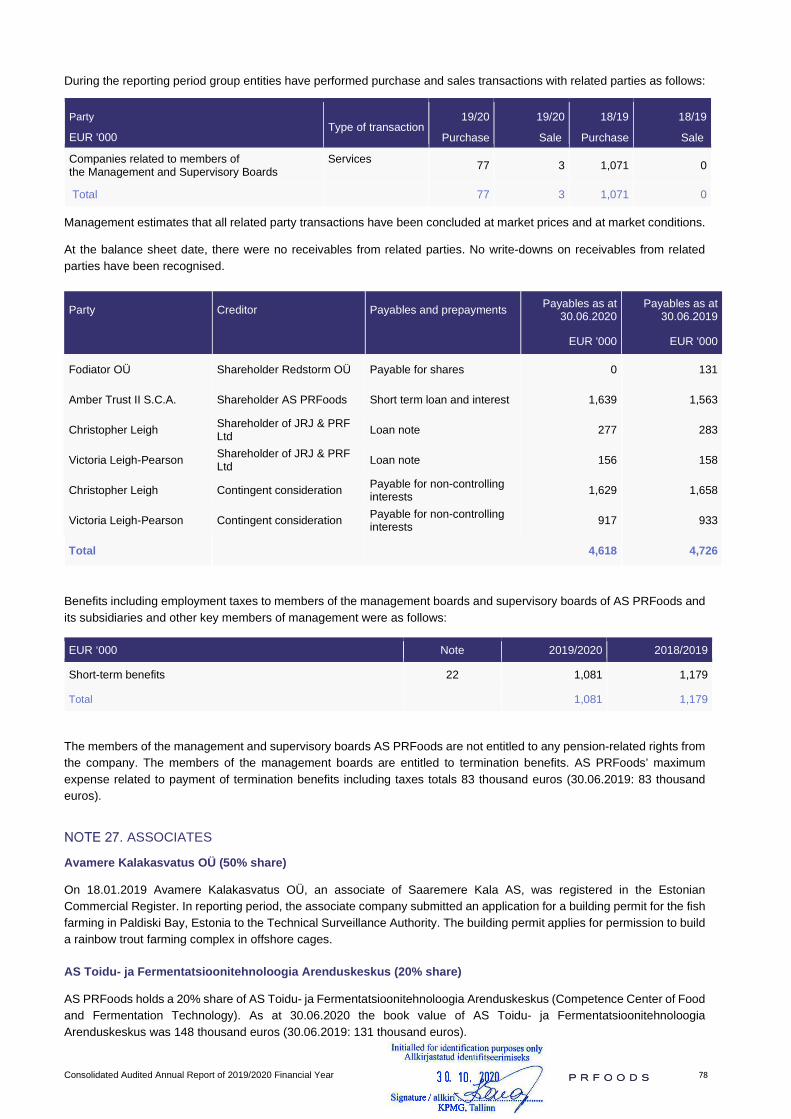
Consolidated Audited Annual Report of 2019/2020 Financial Year 78
During the reporting period group entities have performed purchase and sales transactions with related parties as follows:
Party
EUR '000 Type of transaction
19/20
Purchase
19/20
Sale
18/19
Purchase
18/19
Sale
Companies related to members of the Management and Supervisory Boards
Services 77 3 1,071 0
Total 77 3 1,071 0
Management estimates that all related party transactions have been concluded at market prices and at market conditions.
At the balance sheet date, there were no receivables from related parties. No write-downs on receivables from related parties have been recognised.
Party Creditor Payables and prepayments Payables as at 30.06.2020
Payables as at 30.06.2019
EUR '000 EUR '000
Fodiator OÜ Shareholder Redstorm OÜ Payable for shares 0 131
Amber Trust II S.C.A. Shareholder AS PRFoods Short term loan and interest 1,639 1,563
Christopher Leigh Shareholder of JRJ & PRF Ltd Loan note 277 283
Victoria Leigh-Pearson Shareholder of JRJ & PRF Ltd Loan note 156 158
Christopher Leigh Contingent consideration Payable for non-controlling interests 1,629 1,658
Victoria Leigh-Pearson Contingent consideration Payable for non-controlling interests 917 933
Total 4,618 4,726
Benefits including employment taxes to members of the management boards and supervisory boards of AS PRFoods and its subsidiaries and other key members of management were as follows:
EUR ‘000 Note 2019/2020 2018/2019
Short-term benefits 22 1,081 1,179
Total 1,081 1,179
The members of the management and supervisory boards AS PRFoods are not entitled to any pension-related rights from the company. The members of the management boards are entitled to termination benefits. AS PRFoods’ maximum expense related to payment of termination benefits including taxes totals 83 thousand euros (30.06.2019: 83 thousand euros).
ASSOCIATES
Avamere Kalakasvatus OÜ (50% share)
On 18.01.2019 Avamere Kalakasvatus OÜ, an associate of Saaremere Kala AS, was registered in the Estonian Commercial Register. In reporting period, the associate company submitted an application for a building permit for the fish farming in Paldiski Bay, Estonia to the Technical Surveillance Authority. The building permit applies for permission to build a rainbow trout farming complex in offshore cages.
AS Toidu- ja Fermentatsioonitehnoloogia Arenduskeskus (20% share)
AS PRFoods holds a 20% share of AS Toidu- ja Fermentatsioonitehnoloogia Arenduskeskus (Competence Center of Food and Fermentation Technology). As at 30.06.2020 the book value of AS Toidu- ja Fermentatsioonitehnoloogia Arenduskeskus was 148 thousand euros (30.06.2019: 131 thousand euros).
Consolidated Audited Annual Report of 2019/2020 Financial Year 79
CONTINGENT LIABILITIES AND ASSETS
Contingent liabilities in connection with setting a mortgage for the benefit of the Customs Board of Finland
A mortgage was set for the benefit of the Finnish Customs Board in the amount of 84 thousand euros. The purpose of the transaction was a more streamlined organisation of the day-to-day operations by reducing persistent prepayments to the Customs Board.
The management estimated that it is improbable that the Finnish Customs Board will liquate the pledged asset.
Contingent liabilities relating to tax boards
The tax authorities may at any time inspect the books and records of the Group within 5 years subsequent to the reported tax year in Estonia and Finland, within 6 years in United Kingdom and within 7 years in Sweden, and may as a result of their inspection impose additional tax assessments, interests and penalties. In the financial years of 2019/2020 and 2018/2019 the tax authorities did not conduct any tax audits. The management of the Group is not aware of any circumstances which may give rise to a potential material liability in this respect
EVENTS AFTER BALANCE SHEET DATE
OÜ Redstorm
In August 2020, the shareholders of OÜ Redstorm Saaremere Kala AS and OÜ Fodiator decided to increase the share capital of the private limited company by 20 euros to 4,020 euros, as a result of which the nominal value of Saaremere Kala AS share is 2,050 euros and the nominal value of OÜ Fodiator share is 1,970 euros.
Saaremere Kala AS paid 387,597 euros in kind for the increase of the nominal value of the share, of which 387,587 euros is a share premium. Saaremere Kala AS paid for the increase in the nominal value with the claim acquired by Saaremere Kala AS from OÜ Serenest against OÜ Redstorm in the amount of 387,597 euros.
OÜ Vettel
On 22 October 2020, OÜ Vettel entered into a loan agreement with Maaelu Arendamise Sihtasutus (the Rural Development Foundation) within the framework of “COVID-19 loan for bio- and rural economy entrepreneurs”. The amount of the investment loan is one million euros with a term of 6 years, the maturity of the loan is September 2026. The interest rate of the loan is 2.5% for the first two years and 4.5% thereafter. The repayment period of the loan principal starts in June 2021. The loan is used to automate the plant of OÜ Vettel in Saaremaa. The loan is secured by a mortgage and a commercial pledge on the assets of OÜ Vettel ranking after the existing creditors and a 100% guarantee by AS PRFoods.

Consolidated Audited Annual Report of 2019/2020 Financial Year 80
THE PARENT COMPANY PRIMARY’S FINANCIAL STATEMENTS
Pursuant to the Accounting Act of the Republic of Estonia, the separate (primary) financial statements of the consolidating entity (Parent Company) have to be disclosed in the notes to the consolidated financial statements. In preparing the separate primary financial statements of the Parent Company, the same accounting policies have been applied as in preparing the consolidated financial statements. The accounting policy for reporting subsidiaries has been amended in the separate primary financial statements disclosed as supplementary information in the Annual Report in conjunction with lAS 27 “Consolidated and Separate financial Statements”.
In the Parent Company’s financial statements, which are disclosed in the notes to these financial statements (supplementary information about the Parent Company of the Group), investments in the shares of subsidiaries are measured at cost, less any impairment losses.
STATEMENT OF FINANCIAL POSITION
EUR '000 30.06.2020 30.06.2019
ASSETS
Cash 609 1,142
Short-term financial investments 0 2,400
Receivables and prepayments 988 549
Total current assets 1,597 4,091
Investments in subsidiaries 10,378 10,378
Long-term financial investments 14,348 2,931
Tangible fixed assets 5 22
Intangible assets 347 314
Total non-current assets 25,078 13,645
TOTAL ASSETS 26,675 17,736
EQUITY AND LIABILITIES
Loans and borrowings 1,500 1,522
Payables and prepayments 453 204
Total current liabilities 1,953 1,726
Loans and borrowings 9,053 0
Total non-current liabilities 9053 0
Total liabilities 11,006 1,726
Share capital 7,737 7,737
Share premium 14,007 14,007
Statutory capital reserve 51 51
Treasury shares -390 -390
Retained loss -5,736 -5,395
Total equity 15,669 16,010
TOTAL EQUITY AND LIABILITIES 26,675 17,736

Consolidated Audited Annual Report of 2019/2020 Financial Year 81
STATEMENT OF COMPREHENSIVE INCOME
EUR '000 2019/2020 2018/2019
Revenue 146 146
Gross profit 146 146
Operating expenses
Sales and marketing expenses -26 -104
Administrative and general expenses -619 -566
Other income/expenses 1 -2
Operating loss -498 -526
Financial gain (loss) from investments in subsidiaries and associates 17 183
Financial income/costs 140 192
Profit (Loss) before tax -341 -151
Income tax 0 -65
Net profit (loss) -341 -216
Total comprehensive income (loss) -341 -216

Consolidated Audited Annual Report of 2019/2020 Financial Year 82
CASH FLOW STATEMENT
EUR '000 2019/2020 2018/2019
Cash flow from operating activities
Net profit (loss) -341 -216
Adjustments:
Depreciation 21 27
Income/loss from asset sale -4 0
Income/loss from associates -17 -183
Income tax of dividends paid 0 65
Other non-cash items -140 -192
Changes in receivables and prepayments 6 129
Changes in payables and prepayments -523 -83
Net cash inflow (outflow) from operating activities -998 -453
Cash flow from investing activities
Sale of tangible and intangible fixed assets 5 2
Purchase of tangible and intangible fixed assets -44 -212
Loans granted -9,360 -2,260
Repayments of loans granted 360 3,424
Dividends received 0 116
Interests received 110 271
Net cash inflow (outflow) from investing activities -8,929 1,341
Cash flow from financing activities
Repayments of lease liabilities -22 -16
Proceeds from issuing bonds 9,416 0
Dividends paid 0 -377
Income tax of dividends paid 0 -65
Interest paid 0 -87
Net cash inflow (outflow) from financing activities 9,394 -545
Net increase (decrease) in cash and cash equivalents -533 343
Cash and cash equivalents at beginning of year 1,142 799
Change in cash and cash equivalents -533 343
Cash and cash equivalents at the end of the period 609 1,142

Consolidated Audited Annual Report of 2019/2020 Financial Year 83
STATEMENT OF CHANGES IN EQUITY
EUR '000 Share capital
Share premium
Treasury shares
Statutory capital
reserve
Retained earnings
(loss)
Total equity
Balance at 30.06.2018 7,737 14,007 -390 48 -4,799 16,603
Carrying amount of interests under control and significant influence -10,378
Value of interests under control and significant influence under the equity method 16,925
Adjusted unconsolidated equity at 30.06.2018 23,150
Increase of statutory reserve capital 0 0 0 3 -3 0
Dividends paid 0 0 0 0 -377 -377
Comprehensive expense for reporting period 0 0 0 0 -216 -216
Total change 0 0 0 3 -596 -593
Balance at 30.06.2019 7,737 14,007 -390 51 -5,395 16,010
Carrying amount of interests under control and significant influence -10,378
Value of interests under control and significant influence accounted for using the equity method 15,625
Adjusted unconsolidated equity at 30.06.2019 21,257
Comprehensive expense for reporting period 0 0 0 0 -341 -341
Total change 0 0 0 0 -341 -341
Balance at 30.06.2020 7,737 14,007 -390 51 -5,736 15,669
Carrying amount of interests under control and significant influence -10,378
Value of interests under control and significant influence accounted for using the equity method 14,094
Adjusted unconsolidated equity at 30.06.2020 19,385
Adjusted unconsolidated equity is used as the basis for determining distributable equity in accordance with the Accounting Act of Estonia.
Consolidated Audited Annual Report of 2019/2020 Financial Year 84
MANAGEMENT BOARD’S CONFIRMATION TO THE ANNUAL REPORT
The Management Board confirms the correctness and completeness of AS PRFoods and its subsidiaries (together “the Group”) consolidated financial statements for the 2019/2020 financial year on pages 8-84 and confirms to the best of its knowledge that:
• The management report of the consolidated report gives a true and fair view of the development and results of theGroup's operations and financial position and includes a description of the principal risks and uncertainties.
• The principles applied in preparing the consolidated financial statements are in line with International FinancialReporting Standard (IFRS) as adopted by the European Union.
• The consolidated financial statements give a true and fair view of the Group's assets, liabilities, financial position,financial performance and cash flows.
• AS PRFoods and its subsidiaries are going concerns.
Indrek Kasela
Member of the Management Board
30 October 2020

1/6
Independent Auditors’ Report (Translation of the Estonian original)
To the Shareholders of AS PRFoods
Report on the Audit of the Consolidated Financial Statements
Opinion In our opinion, the accompanying consolidated financial statements present fairly, in all material respects, the consolidated financial position of AS PRFoods and its subsidiaries (collectively, the Group) as at 30 June 2020, and its consolidated financial performance and its consolidated cash flows for the year then ended (1 July 2020 to 30 June 2020) in accordance with International Financial Reporting Standards as adopted by the European Union.
What we have audited We have audited the consolidated financial statements of the Group, which are set out on pages 37 to 83 of the consolidated financial statements, which comprise:
the consolidated statement of financial position as at 30 June 2020, the consolidated statement of comprehensive income for the year then ended, the consolidated statement of cash flows for the year then ended, the consolidated statement of changes in equity for the year then ended, and the notes to the consolidated financial statements, comprising significant accounting policies and
other explanatory information.
Basis for Opinion We conducted our audit in accordance with International Standards on Auditing (Estonia). Our responsibilities under those standards are further described in the Auditors’ Responsibilities for the Audit of the Consolidated Financial Statements section of our report. We believe that the audit evidence we have obtained is sufficient and appropriate to provide a basis for our opinion.
Independence We are independent of the Group in accordance with the ethical requirements of the Auditor’s Activities Act of the Republic of Estonia and with the ethical requirements of the ethics standards for professional accountants as set out in the same act, and we have fulfilled our other ethical responsibilities in accordance with these requirements.

2/6
Audit Scope Because we are solely responsible for our audit opinion, we are also responsible for the direction, supervision and performance of the group audit. In this respect, we have determined the type of work to be performed for Group entities based on their financial significance and/or the other risk characteristics.
We, as Group auditors, determined 7 of the Group’s 10 entities to be significant Group components and we subjected those components to a full scope audit. These components include AS PRFoods, Saaremere Kala AS, Vettel OÜ, Heimon Kala OY, JRJ & PRF Ltd, John Ross Jr. (Aberdeen) Ltd ja Coln Valley Smokery Ltd.
For the components Redstorm OÜ and Överumans FISK AB we conducted an audit of selected account balances at Group level.
For the remaining non-significant components, we performed analytical procedures at Group level to re-examine our assessment that there were no significant risks of material misstatement within them.
We also performed procedures over the consolidation process at Group level.
Coverage of the Group's consolidated revenue and consolidated total assets with procedures performed:
The audit work on the financial information of the significant Group components AS PRFoods, Saaremere Kala AS and Vettel OÜ and the audit of selected account balances for Redstorm OÜ and Överumans FISK AB was performed by the Group audit team in Estonia. The audit work on the financial information of the significant Group component Heimon Kala OY was performed by KPMG Finland. The audit work on the financial information of the significant Group components JRJ & PRF Ltd, John Ross Jr. (Aberdeen) Ltd ja Coln Valley Smokery Ltd was performed by a non-KPMG auditor. The Group audit team instructed the component auditors as to the areas to be covered and determined the information required to be reported to the Group audit team. We had regular communications with the component auditors and executed audit file reviews, where necessary.
By performing the procedures mentioned above over the Group entities, together with additional procedures at the Group level, we have been able to obtain sufficient and appropriate audit evidence to form an opinion on the consolidated financial statements as a whole.
Key Audit Matters Key audit matters are those matters that, in our professional judgment, were of most significance in our audit of the consolidated financial statements of the current period. These matters were addressed in the

3/6
context of our audit of the consolidated financial statements as a whole, and in forming our opinion thereon, and we do not provide a separate opinion on these matters.
Measurement of biological assets
Refer to notes 4 and 8 of the consolidated financial statements.
The key audit matter How the matter was addressed in our audit
The Group’s consolidated statement of financial position as at 30 June 2020 includes biological assets in the amount of EUR 4,249 thousand, further discussed in note 8.
The biological assets consist mainly of fish grown in the Group’s fish farms in Finland and Sweden.
The fair value of fry is measured based on their biomass and weighted average market price. Market price is determined by reference to bid prices. The fair value of fish suitable for harvesting is measured based on their estimated biomass less the weight loss arising on realisation and the weighted average market price, i.e. the market price of the similar assets of independent parties, adjusted for the effect of existing differences. Due to the lack of an active market, juvenile fish are measured at cost. Cost is compared to the net realisable value of juvenile fish, which is the estimated fair value of fish suitable for harvesting at the date the juvenile fish become suitable for harvesting less the estimated costs to grow juvenile fish to the point of being suitable for harvesting and to make the sale.
Due to the magnitude and related estimation uncertainty, the measurement of biological assets is a key audit matter and required our particular attention during the audit. Even small changes in the inputs used may have a significant impact on the assessment of fair value and, thus, also on the Group’s financial results.
In this area, we conducted, among others, the following audit procedures:
• We assessed whether the Group’s accounting policies for biological assets are in compliance with IFRS.
• We analysed the measurement of biological assets, including the correctness of the inputs, assumptions and methodologies applied and the reasonableness and appropriateness of conclusions drawn.
• In particular, using available market information, we assessed the reasonableness of the following management’s estimates: - biomass; - market prices; - selling costs; - harvesting loss and the costs incurred in
growing juvenile fish to the state of being suitable for harvesting,
to determine possible impairment.
• We also recalculated the fair value calculations prepared by management.
• Furthermore, we assessed the adequacy of the disclosures related to biological assets.

4/6
Other Information Management is responsible for the other information contained in the Group’s consolidated annual report in addition to the consolidated financial statements and our auditors’ report thereon.
Our opinion on the consolidated financial statements does not cover the other information and we do not express any form of assurance conclusion thereon.
In connection with our audit of the consolidated financial statements, our responsibility is to read the other information and, in doing so, consider whether the other information is materially inconsistent with the consolidated financial statements or our knowledge obtained in the audit, or otherwise appears to be materially misstated. If, based on the work we have performed, we conclude that there is a material misstatement of this other information, we are required to report that fact. We have nothing to report in this regard.
Responsibilities of Management and Those Charged with Governance for the
Consolidated Financial Statements
Management is responsible for the preparation and fair presentation of the consolidated financial statements in accordance with International Financial Reporting Standards as adopted by the European Union, and for such internal control as management determines is necessary to enable the preparation of consolidated financial statements that are free from material misstatement, whether due to fraud or error.
In preparing the consolidated financial statements, management is responsible for assessing the Group’s ability to continue as a going concern, disclosing, as applicable, matters related to going concern and using the going concern basis of accounting unless management either intends to liquidate the Group or to cease operations, or has no realistic alternative but to do so.
Those charged with governance are responsible for overseeing the Group’s financial reporting process.
Auditors’ Responsibilities for the Audit of the Consolidated Financial Statements Our objectives are to obtain reasonable assurance about whether the consolidated financial statements as a whole are free from material misstatement, whether due to fraud or error, and to issue an auditors’ report that includes our opinion. Reasonable assurance is a high level of assurance, but is not a guarantee that an audit conducted in accordance with International Standards on Auditing (Estonia) will always detect a material misstatement when it exists. Misstatements can arise from fraud or error and are considered material if, individually or in the aggregate, they could reasonably be expected to influence the economic decisions of users taken on the basis of these consolidated financial statements.
As part of an audit in accordance with International Standards on Auditing (Estonia), we exercise professional judgment and maintain professional scepticism throughout the audit. We also:
5/6
• Identify and assess the risks of material misstatement of the consolidated financial statements, whether due to fraud or error, design and perform audit procedures responsive to those risks, and obtain audit evidence that is sufficient and appropriate to provide a basis for our opinion. The risk of not detecting a material misstatement resulting from fraud is higher than for one resulting from error, as fraud may involve collusion, forgery, intentional omissions, misrepresentations, or the override of internal control.
• Obtain an understanding of internal control relevant to the audit in order to design audit procedures that are appropriate in the circumstances, but not for the purpose of expressing an opinion on the effectiveness of the Group’s internal control.
• Evaluate the appropriateness of accounting policies used and the reasonableness of accounting estimates and related disclosures made by management.
• Conclude on the appropriateness of management’s use of the going concern basis of accounting and, based on the audit evidence obtained, whether a material uncertainty exists related to events or conditions that may cast significant doubt on the Group’s ability to continue as a going concern. If we conclude that a material uncertainty exists, we are required to draw attention in our auditors’ report to the related disclosures in the consolidated financial statements or, if such disclosures are inadequate, to modify our opinion. Our conclusions are based on the audit evidence obtained up to the date of our auditors’ report. However, future events or conditions may cause the Group to cease to continue as a going concern.
• Evaluate the overall presentation, structure and content of the consolidated financial statements, including the disclosures, and whether the consolidated financial statements represent the underlying transactions and events in a manner that achieves fair presentation.
• Obtain sufficient appropriate audit evidence regarding the financial information of the entities or business activities within the Group to express an opinion on the consolidated financial statements. We are responsible for the direction, supervision and performance of the group audit. We remain solely responsible for our audit opinion.
We communicate with those charged with governance regarding, among other matters, the planned scope and timing of the audit and significant audit findings, including any significant deficiencies in internal control that we identify during our audit.
We also provide those charged with governance with a statement that we have complied with relevant ethical requirements regarding independence, and communicate with them all relationships and other matters that may reasonably be thought to bear on our independence, and where applicable, related safeguards.
From the matters communicated with those charged with governance, we determine those matters that were of most significance in the audit of the consolidated financial statements of the current period and are therefore the key audit matters. We describe these matters in our auditors´ report unless law or regulation precludes public disclosure about the matter or when, in extremely rare circumstances, we determine that matter should not be communicated in our report because the adverse consequences of doing so would reasonably be expected to outweigh the public interest benefits of such communication.

6/6
Report on Other Legal and Regulatory Requirements We were first appointed by those charged with governance on 19 December 2019 to audit the consolidated financial statements of AS PRFoods for the periods ended 30 June 2020 to 30 June 2022. Our total uninterrupted period of engagement has lasted for one year, covering the period ended 30 June 2020.
We confirm that our audit opinion is consistent with the additional report presented to the Audit Committee of the Group and we have not provided to the Group the prohibited non-audit services (NASs) referred to in Article 5(1) of EU Regulation (EU) No 537/2014. We also remained independent of the audited entity in conducting the audit.
Tallinn, 30 October 2020
Indrek Alliksaar Certified Public Accountant, Licence No 446
Lembi Uett Certified Public Accountant, Licence No 566
KPMG Baltics OÜ Licence No 17
KPMG Baltics OÜ Narva mnt 5 Tallinn 10117 Estonia Tel +372 626 8700 www.kpmg.ee
KPMG Baltics OÜ, an Estonian limited liability Group and a member firm of the KPMG network of independent member firms affiliated with KPMG International Cooperative (“KPMG International”), a Swiss entity. Reg no 10096082.

Consolidated Audited Annual Report of 2019/2020 Financial Year 91
PROPOSAL FOR COVERING LOSS
The Management Board of AS PRFoods proposes to the General Meeting of Shareholders to cover the loss in amount of 1,718 thousand euros for the financial year ended 30 June 2020 in the following manner:
a) 66 thousand euros from retained earnings;
b) 51 thousand euros from the statutory reserve capital;
c) 1,601 thousand euros from the share premium.
Indrek Kasela
Member of the Management Board
30 October 2020