As of Monday, Nov. 12 • Football Contact: Kevin Best, … · 2018-11-12 · ACC Games Overall...
46
1 ACC Games Overall ATLANTIC DIVISION W L For Opp Pct W L For Opp Pct Home Away Neut Streak Clemson 7 0 343 87 1.000 10 0 457 127 1.000 5-0 5-0 0-0 Won 10 Syracuse 5 2 276 203 .714 8 2 444 276 .800 6-0 2-2 0-0 Won 4 Boston College 4 2 167 144 .667 7 3 342 244 .700 5-1 2-2 0-0 Lost 1 NC State 3 3 181 191 .500 6 3 283 231 .667 5-1 1-2 0-0 Lost 1 Wake Forest 2 4 161 241 .333 5 5 318 358 .500 2-4 3-1 0-0 Won 1 Florida State 2 5 141 229 .286 4 6 227 316 .400 3-2 1-4 0-0 Lost 3 Louisville 0 7 152 346 .000 2 8 217 421 .200 2-3 0-4 0-1 Lost 7 ACC Games Overall COASTAL DIVISION W L For Opp Pct W L For Opp Pct Home Away Neut Streak Pitt 5 1 232 174 .833 6 4 299 296 .600 5-1 1-3 0-0 Won 3 Virginia 4 2 136 109 .667 7 3 284 197 .700 5-1 1-2 1-0 Won 1 Georgia Tech 4 3 234 209 .571 6 4 376 275 .600 3-2 3-2 0-0 Won 3 Duke 3 3 163 174 .500 7 3 313 235 .700 3-2 4-1 0-0 Won 2 Virginia Tech 3 3 148 168 .500 4 5 268 279 .444 1-3 3-2 0-0 Lost 3 Miami 2 4 135 127 .333 5 5 309 201 .500 4-1 1-3 0-1 Lost 4 North Carolina 1 6 188 255 .143 1 8 224 320 .111 1-2 0-6 0-0 Lost 6 As of Monday, Nov. 12 • Football Contact: Kevin Best, [email protected] 2018 STANDINGS 1 Saturday, Nov. 17 Time, TV Sirius XM Internet Pitt (6-4, 5-1) at Wake Forest (5-5, 2-4) Noon, RSN 134 194 956 Series: First meeting RSN: Evan Lepler, Takeo Spikes, Stormy Buonantony NC State (6-3, 3-3) at Louisville (2-8, 0-7) 12:20 p.m., Raycom 111 193 955 Series: Louisville leads series, 6-2; Last meeting: NC State, 39-25 (2017) Raycom: Tom Werme, Dave Archer, Lericia Harris Syracuse (8-2, 5-2) vs. Notre Dame (10-0) 2:30 p.m., NBC 129 129 129 (Yankee Stadium, The Bronx, N.Y.) Series: Notre Dame leads series, 5-3; Last meeting: Notre Dame, 50-33 (2016) NBC: Mike Tirico, Doug Flutie, Kathryn Tappen Virginia (7-3, 4-2) at Georgia Tech (6-4, 4-3) 3:30 p.m., RSN 81 81 81 Series: Georgia Tech leads series, 20-19-1; Last meeting: Miami, 25-24 (2017) RSN: Wes Durham, James Bates, Rebecca Kaple Western Carolina (3-7) at North Carolina (1-8, 1-6) 3 p.m., ACCNE 137 210 968 Series: North Carolins leads series, 1-0; North Carolina, 65-10 (2017) ACCNE: Brock Bowling, Renaldo Wynn Miami (5-5, 3-4) at Virginia Tech (4-5, 3-3) 3:30 p.m., ESPN 134 194 956 Series: Miami leads series, 21-14; Last meeting: Miami, 28-10 (2017) ESPN: Mark Jones, Dusty Dvoracek, Molly McGrath Boston College (7-3, 4-2) at Florida State (4-6, 2-5) 3:30 p.m., ESPN2 111 193 955 Series: Florida State leads series, 11-5; Last meeting: Boston College, 35-3 (2017) ESPN2: Beth Mowins, Anthony Becht, Rocky Boiman Duke (7-3, 3-3) at Clemson (10-0, 7-0) 7 p.m., ESPN 134 194 956 Series: Clemson leads series, 36-16; Last meeting: Clemson, 56-20 (2012) ESPN: Steve Levy, Brian Griese, Todd McShay COASTAL CLARITY Pitt is 5-1 in the ACC Coastal Division and can clinch a berth in the 2018 Dr Pepper ACC Football Championship Game with a win at Wake Forest on Sat- urday (noon, RSN) or with a Virginia loss at Georgia Tech on Saturday (3:30 p.m., RSN). Pitt, which joined the ACC in 2013, would be making its first appearance in the league's title game. Virginia sits behind Pitt with two losses and has remaining games with the Yellow Jackets and at Virginia Tech. Pitt owns the head-to- head tiebreaker with the Cavaliers. Scenarios • Pitt can clinch the Coastal this weekend with a win at Wake Forest or a Virginia loss at Georgia Tech. • Virginia can clinch the Coastal with wins over Geor- gia Tech (Nov. 17) and Virginia Tech (Nov. 23), and losses by Pitt at Wake Forest (Nov. 17) and at Miami (Nov. 24). • Duke, Georgia Tech and Virginia Tech are all mathematically alive to claim a share of the Coastal Division, but each team has been eliminated from playing in the ACC Football Championship Game based on the tiebreakers. Two-team ties are possible for Pitt with each of Virginia, Georgia Tech, Virginia Tech and Duke. Pitt beat them all head to head. Three-or-more team ties are possible for Pitt along with a variety of combinations of Virginia, Georgia Tech, Virginia Tech and Duke. Pitt defeated all of those teams, and would win the collective tiebreaker. CLEMSON CLINCHES Clemson defeated Boston College, 27-7, last Saturday to clinch a berth in the 2018 Dr Pepper ACC Football Championship Game on Saturday, Dec. 1, in Charlotte, North Carolina. The Tigers won the ACC Atlantic Division for the fourth consecutive season to become the first team since the formation of the conference's divisions to win four straight division titles. Clemson will appear in the ACC Championship Game for the sixth time, the most of any ACC Atlantic program. The Tigers tie Virginia Tech for the most ACC Championship Game appearances in either division. BOWL ELIGIBILITY Eight ACC teams are bowl eligible and two others are one win shy of qualifying. Clemson (10-0), Syra- cuse (8-2), Boston College (7-3), Duke (7-3), Virginia (7-3), NC State (6-3), Georgia Tech (6-4) and Pitt (6-4) have already qualified. Miami (5-5) and Wake Forest (5-5) are one win away from postseason eligibility. The ACC leads all conferences with 21 bowl bids over the last two years. With a win in either of its final two games against Pitt and Duke, Wake Forest would be bowl eligible for the third consecutive season, matching the longest streak in school history. Duke is bowl eligible for the sixth time in the last seven years. Virginia is bowl eligible in back-to-back years for the first time in 14 seasons, when the Cavaliers went to bowl games in 2002, 2003, 2004 and 2005. 2018 WEEK 12 SCHEDULE QUICK HITS
Transcript of As of Monday, Nov. 12 • Football Contact: Kevin Best, … · 2018-11-12 · ACC Games Overall...

1
ACC Games OverallATLANTIC DIVISION W L For Opp Pct W L For Opp Pct Home Away Neut StreakClemson 7 0 343 87 1.000 10 0 457 127 1.000 5-0 5-0 0-0 Won 10Syracuse 5 2 276 203 .714 8 2 444 276 .800 6-0 2-2 0-0 Won 4Boston College 4 2 167 144 .667 7 3 342 244 .700 5-1 2-2 0-0 Lost 1NC State 3 3 181 191 .500 6 3 283 231 .667 5-1 1-2 0-0 Lost 1Wake Forest 2 4 161 241 .333 5 5 318 358 .500 2-4 3-1 0-0 Won 1Florida State 2 5 141 229 .286 4 6 227 316 .400 3-2 1-4 0-0 Lost 3Louisville 0 7 152 346 .000 2 8 217 421 .200 2-3 0-4 0-1 Lost 7
ACC Games OverallCOASTAL DIVISION W L For Opp Pct W L For Opp Pct Home Away Neut StreakPitt 5 1 232 174 .833 6 4 299 296 .600 5-1 1-3 0-0 Won 3Virginia 4 2 136 109 .667 7 3 284 197 .700 5-1 1-2 1-0 Won 1Georgia Tech 4 3 234 209 .571 6 4 376 275 .600 3-2 3-2 0-0 Won 3Duke 3 3 163 174 .500 7 3 313 235 .700 3-2 4-1 0-0 Won 2Virginia Tech 3 3 148 168 .500 4 5 268 279 .444 1-3 3-2 0-0 Lost 3Miami 2 4 135 127 .333 5 5 309 201 .500 4-1 1-3 0-1 Lost 4North Carolina 1 6 188 255 .143 1 8 224 320 .111 1-2 0-6 0-0 Lost 6
As of Monday, Nov. 12 • Football Contact: Kevin Best, [email protected]
2018 STANDINGS
1
Saturday, Nov. 17 Time, TV Sirius XM InternetPitt (6-4, 5-1) at Wake Forest (5-5, 2-4) Noon, RSN 134 194 956Series: First meetingRSN: Evan Lepler, Takeo Spikes, Stormy Buonantony
NC State (6-3, 3-3) at Louisville (2-8, 0-7) 12:20 p.m., Raycom 111 193 955Series: Louisville leads series, 6-2; Last meeting: NC State, 39-25 (2017)Raycom: Tom Werme, Dave Archer, Lericia Harris
Syracuse (8-2, 5-2) vs. Notre Dame (10-0) 2:30 p.m., NBC 129 129 129(Yankee Stadium, The Bronx, N.Y.)Series: Notre Dame leads series, 5-3; Last meeting: Notre Dame, 50-33 (2016)NBC: Mike Tirico, Doug Flutie, Kathryn Tappen
Virginia (7-3, 4-2) at Georgia Tech (6-4, 4-3) 3:30 p.m., RSN 81 81 81Series: Georgia Tech leads series, 20-19-1; Last meeting: Miami, 25-24 (2017)RSN: Wes Durham, James Bates, Rebecca Kaple
Western Carolina (3-7) at North Carolina (1-8, 1-6) 3 p.m., ACCNE 137 210 968Series: North Carolins leads series, 1-0; North Carolina, 65-10 (2017)ACCNE: Brock Bowling, Renaldo Wynn
Miami (5-5, 3-4) at Virginia Tech (4-5, 3-3) 3:30 p.m., ESPN 134 194 956Series: Miami leads series, 21-14; Last meeting: Miami, 28-10 (2017)ESPN: Mark Jones, Dusty Dvoracek, Molly McGrath
Boston College (7-3, 4-2) at Florida State (4-6, 2-5) 3:30 p.m., ESPN2 111 193 955Series: Florida State leads series, 11-5; Last meeting: Boston College, 35-3 (2017)ESPN2: Beth Mowins, Anthony Becht, Rocky Boiman
Duke (7-3, 3-3) at Clemson (10-0, 7-0) 7 p.m., ESPN 134 194 956Series: Clemson leads series, 36-16; Last meeting: Clemson, 56-20 (2012)ESPN: Steve Levy, Brian Griese, Todd McShay
COASTAL CLARITYPitt is 5-1 in the ACC Coastal Division and can clinch a berth in the 2018 Dr Pepper ACC Football Championship Game with a win at Wake Forest on Sat-urday (noon, RSN) or with a Virginia loss at Georgia Tech on Saturday (3:30 p.m., RSN). Pitt, which joined the ACC in 2013, would be making its fi rst appearance in the league's title game. Virginia sits behind Pitt with two losses and has remaining games with the Yellow Jackets and at Virginia Tech. Pitt owns the head-to-head tiebreaker with the Cavaliers.
Scenarios• Pitt can clinch the Coastal this weekend with a win at Wake Forest or a Virginia loss at Georgia Tech.
• Virginia can clinch the Coastal with wins over Geor-gia Tech (Nov. 17) and Virginia Tech (Nov. 23), and losses by Pitt at Wake Forest (Nov. 17) and at Miami (Nov. 24).
• Duke, Georgia Tech and Virginia Tech are all mathematically alive to claim a share of the Coastal Division, but each team has been eliminated from playing in the ACC Football Championship Game based on the tiebreakers. Two-team ties are possible for Pitt with each of Virginia, Georgia Tech, Virginia Tech and Duke. Pitt beat them all head to head. Three-or-more team ties are possible for Pitt along with a variety of combinations of Virginia, Georgia Tech, Virginia Tech and Duke. Pitt defeated all of those teams, and would win the collective tiebreaker.
CLEMSON CLINCHES Clemson defeated Boston College, 27-7, last Saturday to clinch a berth in the 2018 Dr Pepper ACC Football Championship Game on Saturday, Dec. 1, in Charlotte, North Carolina. The Tigers won the ACC Atlantic Division for the fourth consecutive season to become the fi rst team since the formation of the conference's divisions to win four straight division titles. Clemson will appear in the ACC Championship Game for the sixth time, the most of any ACC Atlantic program. The Tigers tie Virginia Tech for the most ACC Championship Game appearances in either division.
BOWL ELIGIBILITYEight ACC teams are bowl eligible and two others are one win shy of qualifying. Clemson (10-0), Syra-cuse (8-2), Boston College (7-3), Duke (7-3), Virginia (7-3), NC State (6-3), Georgia Tech (6-4) and Pitt (6-4) have already qualifi ed. Miami (5-5) and Wake Forest (5-5) are one win away from postseason eligibility. The ACC leads all conferences with 21 bowl bids over the last two years.
With a win in either of its fi nal two games against Pitt and Duke, Wake Forest would be bowl eligible for the third consecutive season, matching the longest streak in school history.
Duke is bowl eligible for the sixth time in the last seven years.
Virginia is bowl eligible in back-to-back years for the fi rst time in 14 seasons, when the Cavaliers went to bowl games in 2002, 2003, 2004 and 2005.
2018 WEEK 12 SCHEDULE
QUICK HITS

2
2 0 1 8 F O OT B A L L N OT E S
ACADEMICS• Ten of 14 ACC Football teams earned a graduation success rate (GSR) at or above the FBS average of 76. That ties for fi rst among Power 5 conferences, both in terms of percentage and in total number.
• The ACC remains the only Power 5 conference to have multiple teams score 90 or higher in GSR each year since 2005. Duke (96), Wake Forest (93) and Boston College (90) reached that plateau last year.
• In the 2018 U.S. News and World “Best Colleges” rankings, ACC member schools combine for an average rank of 54.7, marking the 12th straight year that the ACC has led all Power 5 conferences.
ATHLETICS• The ACC is the only conference to win national championships in football, men’s basketball, women’s basketball and baseball over the last four years.
• The ACC has won a combined four football and men’s basketball national titles over the last fi ve years, twice as many as any other conference.
• The ACC has had a team in either the College Football Playoff or the BCS National Championship Game in each of the past fi ve years.
• The ACC led all conferences with 10 bowl teams in 2017. Over the last two years, the ACC has had a nation’s best 21 teams in bowl games.
• The ACC has earned at least six bowl bids in 17 consecutive seasons. The league ranks second among all conferences with 116 total bowl appearances since 2005.
• Since 2013, the ACC is second among all con-ferences with 54 postseason appearances, has the second-best record of any conference in BCS, New Year’s Six and CFP games, and is tied for the most national championships (Florida State in 2013, Clemson in 2016).
• Over the last four years, the ACC is 13-3 in games against the SEC on rivalry week, which features Clemson-South Carolina, Florida State-Florida, Georgia Tech-Georgia and Louisville-Kentucky. The league was 3-1 in 2017, winning all three games on the road.
• Two of the last fi ve national champions have come from the ACC, and the league has had a team in the national championship game in three of the last fi ve years. Both are tied for the most from any conference.
• An ACC football player has won the Heisman Tro-phy or the Campbell Trophy – commonly referred to as the “Academic Heisman” – in four of the last fi ve years, something no other league can claim.
Syracuse's 51-41 win over NC State made the Orange bowl eligible for the fi rst time since 2013.
Clemson is bowl eligible for the 14th consecutive season.
AP TOP 25Three ACC teams are ranked in this week's Associated Press Top 25 football poll (Nov. 11), including No. 2 Clemson, No. 12 Syracuse, and No. 22 Boston College.
Clemson has been ranked in 64 consecutive AP polls, including 61 in the top 10.
Prior to this year, the Orange had not appeared in the top 25 since the fi nal poll of the 2001 season. That year, the Orange fi nished 10-3 and defeated Kansas State 26-3 in the Insight.com Bowl. This is the highest Syracuse has been ranked since 1998 when the Orange was No. 11 on Sept. 28.
MOST TEAMS RANKEDNine ACC teams have been ranked this year, including Boston College, Clemson, Duke, Florida State, Miami, NC State, Syracuse, Virginia and Virginia Tech. That ties the league record for most teams ranked in a season. In 2008, the ACC also had nine ranked teams.
The nine ranked teams is tied with the SEC for the most this year.
9 - ACC9 - SEC8 - Pac 127 - Big 126 - Big Ten
MOST WINS IN FOUR-YEAR PERIODClemson has tied its own mark for most wins in a four-year period by an ACC school. The Tigers posted their 50th win since 2015 Saturday against Boston College. In addtion, Clemson has now won 16 in the last four years against ranked team, which is the fourth-best mark in that span.
Most wins in a four-year period, ACC history:2015-18 Clemson 502014-17 Clemson 502013-16 Clemson 492012-15 Florida State 492011-14 Florida State 48
Most ranked wins in a four-year period, ACC history:1996-99 Florida State 201997-00 Florida State 181992-95 Florida State 172015-18 Clemson 161992-94 Florida State 16
HIGHEST SCORING SEASON IN ACC HISTORYThe 2018 season is the highest scoring year in league history. ACC teams are averaging 31.8 points per game this year, which ranks ahead of the 2016 season, when the league scoring average was 30.7.
Average points scored, all games:Year Points2018 31.82016 30.72013 29.82012 29.62015 29.5
Average points scored, conference games:Year Points2018 29.502012 29.412001 28.62016 28.32009 27.0
MORE SCORING NOTESClemson is averaging 49.0 points per game in confer-ence play this year, which would rank fourth all-time for a full season.
Average points scored in conference play1995 - Florida State 52.62013 - Florida State 50.72000 - Florida State 49.42018 - Clemson 49.01993 - Florida State 48.9
Clemson and Syracuse currently rank in the top 5 in points scored in all games.
Average points scored in all games2013 - Florida State 51.61995 - Florida State 46.92018 - Clemson 45.72018 - Syracuse 44.02016 - Louisville 42.5
HIGH-SCORING WEEKENDSThe ACC has registered two of its highest scoring weekends in league history this year. In week two (Sept. 8), the ACC's 14 schools scored 550 points, all coming against non-conference opponents. Last week (Oct. 25-27), ACC teams posted 521 points, all in conference games. That was the sixth-highest scoring weekend of all-time. Seven ACC teams scored 40 or more points last week.
Highest scoring weekends:Year - Week Points2015 - 2 5742018 - 2 5502015 - 1 5422017 - 12 5312013 - 4 5242018 - 9 521
Weekends with number of teams scoring 40 or more:Year - Week Teams > 40 points2015 - 1 82009 - 6 82015 - 2 72018 - 9 7
NOTING THE ACCThe ACC has played the most road or neutral Power 5 non-conference games of any other Power 5 conference.
The ACC's three road Power 5 non-conference wins are tied for the most of any conference.
The ACC’s seven non-conference road wins are the most of any Power 5 conference.
The ACC has the second-most non-conference wins of any Power 5 conference.
MILESTONESDuke's T.J. Rahming (231) and Virginia's Olamide Zac-cheaus (224) each crossed the 200-reception threshold this season to become the 22nd and 23rd players in ACC history to reach the 200-reception mark. Rahming now ranks 10th in ACC history, while Zaccheaus is 12th.

3
ACC COACHING EXPERIENCE• Eleven of the 14 ACC football coaches had head coach-ing experience prior to their current position, including four that previously held a head coaching job at a Power 5 school. In addition, seven of the coaches have been a head coach for 10 years or more.
FIVE ACC COACHES IN TOP 25 WIN PERCENTAGE• Among active coaches, four current ACC head coaches rank among the top 25 in the nation in career winning percentage.
Career Winning Percentage(Minimum Five Full Seasons in FBS)
Pl. Name, School ........................ Record ... Pct. 1. Urban Meyer, Ohio State............... 183-32-0 .... .851 2. Chris Petersen, Washington ......... 136-32-0 .... .810 3. Dabo Swinney, Clemson .......... 111-30-0 ....787 4. Nick Saban, Alabama .................... 228-62-1 .... .785 5. Jimbo Fisher, Texas A&M ............... 89-27-0 .... .767 6. David Shaw, Stanford ..................... 79-26-0 .... .752 7. Bryan Harsin, Boise State ............... 57-19-0 .... .750 8. Mark Richt, Miami ................. 169-63-0 ....728 9. Gary Patterson, TCU ................... 164-623-0 .... .722 10. Brian Kelly, Notre Dame ................ 229-90-2 .... .717 11. Jim Harbaugh, Michigan ................. 95-39-0 .... .709 12. Gus Malzahn, Auburn ..................... 60-29-0 .... .674 13. Mike Gundy, Oklahoma State ........ 119-58-0 .... .67214. Kyle Whittingham, Utah ................ 118-59-0 .... .66715. Paul Johnson, Georgia Tech ..... 188-97-0 ....658 16. Scott Satterfi eld, Appalachian St. ... 48-24-0 .... .66717. James Franklin, Penn State............. 67-35-0 .... .65718. Paul Chryst, Wisconsin ................... 59-31-0 .... .656 19. Mark Dantonio, Michigan State..... 124-66-0 .... .653 20. Rod Carey, Northern Illinois ........... 51-27-0 .... .65421. Kevin Sumlin, Arizona ..................... 91-49-0 .... .650 22 Bill Snyder, Kansas State ............ 214-116-1 .... .64823. Bronco Mendenhall, Virginia..... 114-63-0 ....64424. Lane Kiffi n, FAU ................................. 51-29 .... .638 25. Frank Solich, Ohio ........................ 161-94-0 .... .631
SIX ACC COACHES IN TOP 25 CAREER WINSThe ACC has six of the top 25 active coaches nationally in career victories – all of them with 100 or more – which is the most of any conference. The next closest league has fi ve coaches in the top 25.
Career Victories - Active Coaches(Minimum Five Full Seasons in FBS)
1. Brian Kelly, Notre Dame ...............................229 2. Nick Saban, Alabama ...................................228 3. Bill Snyder, Kansas State .............................214 4. Paul Johnson, Georgia Tech ................ 188 5. Urban Meyer, Ohio State ..............................183 6. Terry Bowden, Akron ...................................175 7. Mark Richt, Miami ............................ 169 8. Gary Patterson, TCU ....................................164 9. Kirk Ferentz, Iowa ........................................161 Frank Solich, Ohio ........................................161 11. Chris Peterson, Washington ........................136 Rocky Long, San Diego State .......................136 13. Skip Holtz, Louisiana Tech ...........................133 14. Mike Leach, Washington State .....................131 15. Mark Dantonio, Michigan State ....................124 16. Mike Gundy, Oklahoma State .......................11917. Kyle Whittingham, Utah ...............................118 18. Dave Clawson, Wake Forest ................ 116 19. Bronco Mendenhall, Virginia................ 11420. Dabo Swinney, Clemson ..................... 111 21. David Cutcliffe, Duke ......................... 110 22. Randy Edsall, Connecticut............................100 23. Jeff Tedford, Fresno State ............................10024. Jim Harbaugh, Michigan ................................9525. Pat Fitzgerald, Northwestern ..........................93
ACC Career Rushing Touchdowns by QBs 1. Lamar Jackson, Louisville, 2015-17 ..............50 2. Tevin Washington, Georgia Tech, 2009-12 ....38 3. Joshua Nesbitt, Georgia Tech, 2007-10 .........35 Marquise Williams, North Carolina, 2012-15 .35 5. Eric Dungey; Syracuse, 2015-18 ..............32 6. Brandon Connette, Duke, 2011-13 .................31 7. Larry Russell, Wake Forest, 1969-71 .............29 TaQuon Marshall; Georgia Tech, 2015-18 ..29 8. Woodrow Dantzler, Clemson, 1998-01 ................27
2 0 1 8 F O OT B A L L N OT E S
ACC HEAD COACHING RECORDS
Head Coach, School Career Years Pct. at ACC School Years Pct. ACC Years Pct. Home Road NeuSteve Addazio, Boston College 51-47 (8) .526 38-36 (6) .521 18-28-0 (6) .400 7-16 11-12 0-0Dabo Swinney, Clemson 111-30 (11) .786 111-30 (11) .786 72-17-0 (11) .807 37-4 31-12 4-1David Cutcliffe, Duke 110-99 (18) .524 66-70 (11) .482 31-55-0 (11) .353 14-28 17-26 0-1Willie Taggart, Florida State 51-56 (9) .481 4-6 (1) .444 2-5 (1) .286 1-3 0-4 0-0Paul Johnson, Georgia Tech 188-97 (22) .658 81-58 (11) .580 50-39-0 (11) .557 29-14 21-23 0-2Lorenzo Ward, Louisville - - - - - - - - - - - -Mark Richt, Miami 169-63 (18) .732 24-12 (3) .686 14-9-0 (3) .636 8-3 6-5 0-1Larry Fedora, North Carolina 78-61 (11) .565 44-42 (7) .518 28-28-0 (7) .509 14-13 14-14 0-1Dave Doeren, NC State 63-37 (8) .636 40-33 (6) .556 18-28-0 (6) .400 9-15 9-13 0-0Pat Narduzzi, Pitt 27-21 (4) .553 27-21 (4) .553 19-11-0 (4) .621 11-5 8-6 0-0Dino Babers, Syracuse 53-33 (7) .612 16-18 (3) .455 9-14-0 (3) .364 7-5 2-9 0-0Bronco Mendenhall, Virginia 114-63 (14) .642 15-20 (3) .412 8-14-0 (3) .364 5-7 3-7 0-0Justin Fuente, Virginia Tech 49-36 (7) .583 23-13 (3) .657 14-9-0 (3) .636 6-5 8-4 0-1Dave Clawson, Wake Forest 116-114 (19) .502 26-34 (5) .424 11-27-0 (5) .271 5-14 6-13 0-0All ACC records include ACC Championship Game results
Syracuse's Eric Dungey has rushed for 32 career touchdowns, which is fi fth all-time among ACC quarter-backs. Georgia Tech's TaQuon Marshall has 29 to rank seventh. Louisville's Lamar Jackson (2015-17) owns the conference career mark with 50 and Georgia Tech's Tevin Washington (2009-12) is second with 38.
Syracuse's Eric Dungey went over 10,000 total yards of offense in a career in the win over NC State (Oct. 27). He is just the eighth player in ACC history with 10,000 career total yards of offense. He currently has 10,594 yards, which ranks sixth in ACC history and is just 100 yards shy of Georgia Tech's Joe Hamilton (1996-99). NC State's Ryan Finley has 9,759 total yards of offense and is on pace to join Dungey in the 10,000-yard club. An ACC player has reached 10,000 career yards in each of the last three seasons - Louisville's Lamar Jackson in 2017, Clemson's DeShaun Watson in 2016 and North Carolina's Marquise Williams in 2015.
Boston College's Michael Walker has 2,429 career kickoff return yards, which ranks fourth all-time in the ACC. Duke's Jabari Marshall (2005-08) is third with 2,630 yards.
Duke running back Deon Jackson became just the third player in ACC history with 400 or more all-purpose yards in a single game in a 54-45 loss to Pitt. Jackson rushed for 162 yards, had 89 yards receiving, and posted 152 yards on kickoff returns.
IN THE NATIONAL STATSThree ACC teams are ranked in the top 20 nationally in scoring offense, led by Clemson, which is fi fth averaging 45.7 points per game. The Tigers are followed by No. 7 Syracuse (44.4), No. 17 Georgia Tech (37.6).
Clemson and Miami are ranked second and fourth, respectively, in the nation in total defense. The Tigers are allowing just 253.6 yards per game, while the Hurricanes are close behind at 268.6 yards allowed. Virginia is No. 23 at 328.8 yards allowed per game. Miami is also fi rst in tackles for loss, second in passing yards allowed and fourth in third-down conversion defense. Clemson leads the nation in scoring defense (12.7 ppg), is third in rush-ing defense (82.3), second in tackles for loss, and sixth in third-down defense.
Clemson and NC State are ranked in the top 30 in rushing defense, led by No. 3 Clemson (82.3). The Tigers are followed by No. 8 NC State (96.8), No. 17 Florida State (111.1), No. 23 Miami (123.6) and No. 29 Virginia (128.7).
A• info5h
F• rp
P1234567891111111111222222
SIThin whlea
1 2 3 4 5 6 7 8 8 9
11
13 14 15 15161718 1920 21 22 232425
AC 1 2 3
5 6 7
8. W

4
2 0 1 8 CO M P O S I T E F O OT B A L L S C H E D U L E
Thursday, Aug. 30Wake Forest 23 at Tulane 17 (ot) ...............8 p.m., CBSSN
Friday, Aug. 31Army West Point 14 at Duke 34 .................7 p.m., ESPNUSyracuse 55 at Western Michigan 42 ........ 6 p.m., CBSSN
Saturday, Sept. 1James Madison 13 at NC State 24 .............. Noon, ESPNUFurman 7 at Clemson 48 ................... 12:20 p.m., RaycomAlcorn State 0 at Georgia Tech 41 ...........12:30 p.m., RSNMassachusetts 21 at Boston College 55 ....1 p.m., ACCNEAlbany 7 at Pitt 33 .................................3:30 p.m., ACCNENorth Carolina 17 at California 24 ...................4 p.m., FOXRichmond 13 at Virginia 42 .......................6 p.m., ACCNELouisville 14 vs. Alabama 51 (Camping World Kickoff, Camping World Stadium, Orlando, Fla.) ......... 8 p.m., ABC
Sunday, Sept. 2Miami 17 vs. LSU 33 (AdvoCare Classic, AT&T Stadium, Arlington, Texas) ....................................... 7:30 p.m., ABC
Monday, Sept. 3Virginia Tech 24 at Florida State 3 ............... 8 p.m., ESPN
Saturday, Sept. 8Duke 21 at Northwestern 7 ......................... Noon, ESPNU Georgia Tech 38 at USF 49 .................. Noon, ABC/ESPN2 Towson 20 at Wake Forest 51 ......................Noon, ACCNEGeorgia State 7 at NC State 41 ................12:30 p.m., RSNHoly Cross 14 at Boston College 62 ...........1 p.m., ACCNEWilliam & Mary 17 at Virginia Tech 62 .......2 p.m., ACCNEWagner 10 at Syracuse 62 ....................3:30 p.m., ACCNENorth Carolina 19 at East Carolina 41 ...3:30 p.m., ESPNU Savannah State 0 at Miami 77 ....................6 p.m., ACCNEClemson 28 at Texas A&M 26 ...................... 7 p.m., ESPNIndiana State 7 at Louisville 31 ..................7 p.m., ACCNESamford 26 at Florida State 36 ........... 7:20 p.m., RaycomVirginia 16 at Indiana 20 ........................... 7:30 p.m., BTN Penn State 51 at Pitt 6 ................................... 8 p.m., ABC
Thursday, Sept. 13Boston College 41 at Wake Forest 34 ...... 5:30 p.m., ESPN
Saturday, Sept. 15Florida State 7 at Syracuse 30 ........................Noon, ESPNMiami 49 at Toledo 24 .................................Noon, ESPN2Georgia Southern 7 at Clemson 38 ............. Noon, ESPNUGeorgia Tech 19 at Pitt 24 .......................12:30 p.m., RSNDuke 40 at Baylor 27 .................................. 3:30 p.m., FS1Ohio 31 at Virginia 45 ........................... 4:30 p.m., ESPN2 Western Kentucky 17 at Louisville 20 .......7:30 p.m., RSNUCF at North Carolina ......................................... canceledEast Carolina at Virginia Tech .............................. canceledWest Virginia at NC State .................................... canceled
Saturday, Sept. 22Notre Dame 56 at Wake Forest 27 ................... Noon, ABCBoston College 13 at Purdue 30 ...................Noon, ESPN2Pitt 35 at North Carolina 38 ............... 12:20 p.m., RaycomLouisville 3 at Virginia 27 ........................12:30 p.m., RSNClemson 49 at Georgia Tech 21 ................ 3:30 p.m., ABCNorth Carolina Central 13 at Duke 55 ....3:30 p.m., ACCNEFIU 17 at Miami 31 ................................ 3:30 p.m., ESPN2Northern Illinois 19 at Florida State 37 ..3:30 p.m., ESPNUVirginia Tech 35 at Old Dominion 49 ....3:30 p.m., CBSSNUConn 21 at Syracuse 51 .......................4 p.m., ESPNewsNC State 37 at Marshall 20 ........................7 p.m., CBSSN
Thursday, Sept. 27North Carolina 10 at Miami 47 ..................... 8 p.m., ESPN
Saturday, Sept. 29Temple 35 at Boston College 45 ................. Noon, ESPNUSyracuse 23 at Clemson 27 ............................. Noon, ABCBowling Green 17 at Georgia Tech 63 ..............Noon, RSNVirginia 21 at NC State 35 ................. 12:20 p.m., RaycomFlorida State 28 at Louisville 24 ............ 3:30 p.m., ESPN2Pitt 14 at UCF 45 ...................................3:30 p.m., ESPNURice 24 at Wake Forest 56 ........................3:30 p.m., RSNVirginia Tech 31 at Duke 14 ....................... 7 p.m., ESPN2
Friday, Oct. 5Georgia Tech 66 at Louisville 31 .................. 7 p.m., ESPN
Saturday, Oct. 6Syracuse 37 at Pitt 44 (ot) ................ 12:20 p.m., RaycomBoston College 23 at NC State 28 ...........12:30 p.m., RSNClemson 63 at Wake Forest 3 ................. 3:30 p.m., ESPNFlorida State 27 at Miami 28 ..................... 3:30 p.m., ABCNotre Dame 45 at Virginia Tech 23 ................ 8 p.m., ABC
Saturday, Oct. 13Duke 28 at Georgia Tech 14 .............. 12:20 p.m., RaycomLouisville 20 at Boston College 38 ..........12:30 p.m., RSNPitt 14 at Notre Dame 19 ........................... 2:30 p.m., NBC Miami 13 at Virginia 16 .............................. 7 p.m., ESPN2Virginia Tech 22 at North Carolina 19 ........7 p.m., ESPNU
Saturday, Oct. 20North Carolina 37 at Syracuse 40 ot . 12:20 p.m., Raycom Virginia 28 at Duke 14 .............................12:30 p.m., RSNNC State 7 at Clemson 41 ....................... 3:30 p.m., ESPNWake Forest 17 at Florida State 38 ........ 3:30 p.m., ESPN2
Thursday, Oct. 25Georgia Tech 49 at Virginia Tech 28 ....... 7:30 p.m., ESPN
Friday, Oct. 26Miami 14 at Boston College 27 .................... 7 p.m., ESPN
Saturday, Oct. 27Clemson 59 at Florida State 10 ........................ Noon, ABCWake Forest 56 at Louisville 35 .......................Noon, RSNNorth Carolina 21 at Virginia 31 ......... 12:20 p.m, RaycomDuke 45 at Pitt 54 .....................................3:30 p.m., RSNNC State 41 at Syracuse 51 ........................ 7 p.m., ESPN2
Friday, Nov. 2Pitt 23 at Virginia 13 ............................. 7:30 p.m., ESPN2
Saturday, Nov. 3Louisville 16 at Clemson 77 ............................. Noon, ABCSyracuse 41 at Wake Forest 24 ........................Noon, RSN Georgia Tech 38 at North Carolina 28 . 12:15 p.m., Raycom Florida State 28 at NC State 47 ................. 3:30 p.m., ABCBoston College 31 at Virginia Tech 21 . 3:45 p.m, RaycomDuke 20 at Miami 12 .................................. 7 p.m., ESPN2
Thursday, Nov. 8Wake Forest 27 at NC State 23 ................ 7:30 p.m., ESPN
Friday, Nov. 9Louisville 23 at Syracuse 54 ...................... 7 p.m., ESPN2
Saturday, Nov. 10North Carolina 35 at Duke 42 ............ 12:20 p.m., RaycomLiberty 24 at Virginia 45 .................................3 p.m., RSNVirginia Tech 22 at Pitt 52 .....................3:30 p.m., ESPNU Miami 21 at Georgia Tech 27 ..................... 7 p.m., ESPN2Florida State 13 at Notre Dame 42 ............ 7:30 p.m., NBCClemson 27 at Boston College 7 .................. 8 p.m., ABC
Saturday, Nov. 17Pitt at Wake Forest ...........................................Noon, RSNNC State at Louisville ........................ 12:20 p.m., RaycomSyracuse vs. Notre Dame .......................... 2:30 p.m., NBC(Yankee Stadium, The Bronx, N.Y.)Western Carolina at North Carolina ............3 p.m., ACCNEVirginia at Georgia Tech ............................3:30 p.m., RSNMiami at Virginia Tech ............................ 3:30 p.m., ESPNBoston College at Florida State ............. 3:30 p.m., ESPN2Duke at Clemson .......................................... 7 p.m., ESPN
Friday, Nov. 23Virginia at Virginia Tech ............................ 3:30 p.m., ABC
Saturday, Nov. 24Georgia Tech at Georgia ..................... Noon, SEC NetworkSyracuse at Boston College ............................Noon, ESPNFlorida at Florida State ..................................... Noon, ABCNC State at North Carolina ................ 12:20 p.m., Raycom Wake Forest at Duke ...............................12:30 p.m., RSNPitt at Miami ............................3:30 p.m., ESPN or ESPN2 Kentucky at Louisville ................................ 7 p.m., ESPN2South Carolina at Clemson ........................... 7 p.m., ESPN
Saturday, Dec. 1Atlantic Division Champion vs. Coastal Division Champion (Bank of America Stadium, Charlotte, N.C.) ..... 8 p.m., ABC
WEEK 1
WEEK 2
WEEK 3
WEEK 4
WEEK 5
WEEK 6
WEEK 7
WEEK 8
WEEK 9
WEEK 10
WEEK 11
WEEK 12
WEEK 13
DR PEPPER ACC FOOTBALL CHAMPIONSHIP GAME

5
S C H O O L D I R EC TO RY F O OT B A L L CO N TAC TSATLANTIC DIVISION
BOSTON COLLEGEWeb: bceagles.comShipping & Mailing: 238 Conte Forum, 140 Commonwealth, Ave., Chestnut Hill, MA 02467Offi ce Phone: 617-552-3004Associate Athletics Director: Jason Baum, [email protected] Cell: 201-966-6338Associate Director/Secondary Football Contact: Brendan Flynn, fl [email protected]: 203-415-5381Twitter: @BCFootball; @BCEagles
CLEMSONWeb: ClemsonTigers.comMailing: PO Box 31, Clemson, SC 29633Shipping: 100 Perimeter Road/Jervey Athletic Center, Clemson, SC 29634Offi ce Phone: 864-656-2114Football Contact: Ross Taylor, [email protected]: 972-741-7778Sr. Assoc. Director of Communications: Brian Hennessy, [email protected]: 864-986-9046Twitter: @ClemsonTigers; @ClemsonFB
FLORIDA STATEWeb: seminoles.comMailing: PO Box 2195, Tallahassee, FL 32316Shipping: 403 Stadium Drive West, D0107, Tallahassee, FL 32306Offi ce Phone: 850-644-1403Sr. Assoc. Communications Director: Derek Satterfi eld, dsatterfi [email protected]: 850-228-7204Secondary Football Contact: Steven McCartney, [email protected]: 850-322-6711Twitter: @FSUFootball, @Seminoles
LOUISVILLEWeb: GoCards.comMailing & Shipping: 2100 S. Floyd Street, Louisville, KY 40208Offi ce Phone: 502-852-6581Sr. Associate AD/SID: Kenny Klein, [email protected] (credentials)Assistant SID/Football Contact: Rocco Gasparro, [email protected]: 502-262-2258Assistant SID/Secondary Football Contact: Ira Green, [email protected]: 561-386-3755Twitter: @UofLFootball; @GoCards
NC STATEWeb: GoPack.comMailing: Box 8507, Raleigh, NC 27607Shipping: Murphy Football Center, 4600 Trinity Road, Raleigh, NC 27607Offi ce Phone: 919-515-2102Assistant Athletics Director: Annabelle Myers, [email protected]: 919-819-8302Dir. of Athletics Digital Communications/Secondary Football: Brian Reinhardt, [email protected]: 919-819-8317Twitter: @PackFootball
SYRACUSEWeb: Cuse.comMailing & Shipping: Manley Fieldhouse, 1301 East Colvin Street, Syracuse, NY 13244Offi ce Phone: 315-443-2608 Executive Senior Associate AD/Chief Communications Offi cer: Sue Edson, [email protected] (credentials)Assistant Director/Football SID: Mike Morrison, [email protected]: 315-952-4809Secondary FB Contact: Tyler Cady, [email protected]: 315-941-6569Twitter: @CuseFootball, @Cuse
WAKE FORESTWeb: WakeForestSports.comMailing & Shipping: 519 Deacon Blvd., Winston-Salem, N.C. 27105Offi ce Phone: 336-758-5640Associate AD/Athletic Communications: Steve Shutt, [email protected]: 336-970-7512Assistant Director/Secondary Football Contact: Dan Wallace, [email protected], Cell: 630-450-2077Twitter: @WakeFB; @DemonDeacons
COASTAL DIVISION
DUKEWeb: GoDuke.comMailing: Box 90557, Durham, NC 27708-0557Shipping: Scott Family Athletics Performance Center, Room 364, 110 Whitford Drive, Durham, NC 27708Offi ce Phone: 919-684-2633Associate Director of Athletics/External Affairs: Art Chase, [email protected]: 919-599-9820Associate SID/Secondary Football Contact: Sarah Fetters, [email protected]: 984-209-9104Twitter: @DukeFootball; @DukeAthletics
GEORGIA TECHWeb: ramblinwreck.comMailing & Shipping: 150 Bobby Dodd Way NW, Atlanta, GA 30332Offi ce Phone: 404-894-5445Assistant AD for Communications/PR: Mike Flynn, mfl [email protected] Cell: 828-964-6406Assistant Director/Secondary Football Contact: Kevin Davis, [email protected]: 704-974-9095Twitter: @GeorgiaTechFB
MIAMIWeb: HurricaneSports.comMailing & Shipping: 5821 San Amaro Drive, Coral Gables, FL 33146Offi ce Phone: 305-284-3244; Fax: 305-284-2807Sr. Associate AD/Communications & Digital Strategy: Carter Toole, [email protected]: 615-598-8540Director/Football Contact: Camron Ghorbi, [email protected]: 786-877-7329Twitter: @CanesFootball; @MiamiHurricanes
NORTH CAROLINAWeb: GoHeels.comMailing: PO Box 2126, Chapel Hill, NC 27514Shipping: Smith Center/2nd fl oor, 300 Skipper Bowles Dr., Chapel Hill, NC 27514Offi ce Phone: 919-962-2123Associate Director/Football Contact: Bobby Hundley, [email protected]: 919-428-0893Assistant Director/Secondary Contact: Mark Kimmel, [email protected]: 919-619-3344Twitter: @TarHeelFootball; @GoHeels
PITTWeb: PittsburghPanthers.comMailing: P.O. Box 7436, Pittsburgh, Pa. 15213-0436Shipping: Petersen Events Center, 3719 Terrace Street, Pittsburgh, Pa. 15261Offi ce Phone: 412-648-8420Executive Associate AD/Media Relations: E.J. Borghetti, [email protected]: 412-491-5110Assistant Director/Secondary Football Contact: R.J. Sepich, [email protected]: 412-452-1992Twitter: @Pitt_FB; @Pitt_ATHLETICS
VIRGINIAWeb: VirginiaSports.comMailing: PO Box 400853, Charlottesville, VA 22904-4853Shipping: 295 Massie Road, Charlottesville, VA 22903Offi ce Phone: 434-982-5500Assistant AD: Jim Daves, [email protected]: 434-962-7668Assistant Director/Primary Football Contact: Vince Briedis, [email protected]: 434-326-3792Twitter: @UVAFootball; @VirginiaSports
VIRGINIA TECHWeb: HokieSports.comMailing & Shipping: 460 Jamerson Athletic Center Blacksburg, VA 24061Offi ce Phone: 540-231-6726Associate Athletics Director: Pete Moris, [email protected]: 816-213-5411Associate Director/Secondary Contact: Peter Long, [email protected]: 732-814-5436Twitter: @VT_Football; @HokieSports

6
M E D I A S E RV I C E S & I N F O R M AT I O NACC COMMUNICATIONS STAFF4512 Weybridge Lane • Greensboro, N.C. 27407
Kevin Best ....... Sr. Associate Commissioner/[email protected] .................................... 919-619-7020 (cell)
Brian Morrison ..................................Associate [email protected] ..................................... 336-369-1002
Steve Phillips .............................. Editorial & Content [email protected] ......................................... 336-369-1004
Amy Ufnowski .............................................................Directoraufnowski@theacc.org ...................................... 336-369-1003
Tyler Beck ....................................................Assistant [email protected] ............................................. 336-369-3744
ACC COACHES TELECONFERENCEThe 14 ACC football coaches will be featured on a weekly teleconference each Wednesday beginning Aug. 29, and concluding on Wednesday, Nov. 21. The teleconference will begin at 10:40 a.m. ET. Each coach will have 10 minutes to make an opening statement and answer questions. Teleconference quotes will be available on theACC.com.
ACC Teleconference Schedule10:40 a.m. ................................... Bronco Mendenhall, Virginia10:50 a.m. ......................................... Dabo Swinney, Clemson11 a.m. ..............................................Lorenzo Ward, Louisville11:10 a.m. ............................................Dino Babers, Syracuse11:20 a.m. ................................... Larry Fedora, North Carolina11:30 a.m. ................................... Paul Johnson, Georgia Tech 11:40 a.m. .................................... Willie Taggart, Florida State11:50 a.m. .................................... Justin Fuente, Virginia TechNoon ............................................ Dave Clawson, Wake Forest12:10 p.m. ....................................................Pat Narduzzi, Pitt12:20 p.m. ...............................Steve Addazio, Boston College12:30 p.m. ..............................................David Cutcliffe, Duke12:40 p.m. ...........................................Dave Doeren, NC State12:50 p.m. ..................................................Mark Richt, MiamiMedia phone number available by request
THEACC.COMThe Atlantic Coast Conference’s offi cial website – theACC.com – is the source for complete conference football information. The media section of the website (theACC.com/media) offers additional information for use by members of the media, including access to ACC PhotoShelter, the home for conference and school logos, head shots of players and coaches from select sports and images from ACC events and championships.
ACCESSING ACC VIDEO CLIP SERVICE (AVCS)ACC Advanced Media will provide athletic highlights and press conference excerpts to media outlets across the conference footprint via the ACC Video Clip Service (AVCS). The AVCS will enable the conference offi ce to offer video content to the media quickly, in an easy to download format, at no cost. Starting with the football season and continuing throughout the entire ACC athletic calendar the AVCS will provide video content. It is our hope that this service will allow the media to tell the stories of the ACC throughout the year. This video content will only be available for download in a digital fi le format that can be accessed exclusively on the AVCS.
To register for this free service contact Slim Vollinger, Director/ACC Advanced Media, at [email protected] or call 336.369.1207
COLLEGEPRESSBOX.COMCollegepressbox.com is the offi cial media website for college football. Users can access and download weekly game notes, quotes, statistics, media guides, head shots, logos and more for each conference and its member schools. Login information will be distributed to accredited media or you can apply for a password at collegepressbox.com/password.
Wednesday, August 29First 2018 ACC Coaches Teleconference (10:40 a.m. - 1 p.m.)
Tuesday, September 4• First ACC Player of the Week Awards announced at noon. Thereafter, weekly honors will be announced each Monday throughout the year.
Thursday, November 1• Dr Pepper ACC Football Championship Game credential application website opens.
Sunday, November 25• Jacobs Blocking Trophy announced, 1 p.m. • ACC Football Championship Game participating coaches teleconference, 4-5 p.m.• All-ACC Football Team voting ends at 5 p.m.
Monday, November 26• ACC Football Championship Game participating student-ath-letes teleconference, 11:30 a.m.-12:30 p.m. (times subject to change)• All-ACC Football Team announced, 3 p.m.• Deadline for media credential applications to Dr Pepper ACC Football Championship Game, 5 p.m.
Tuesday, November 27• ACC Coach, Offensive, Defensive and Overall Rookie of the Year announced, 1 p.m.
Wednesday, November 28• ACC Offensive, Defensive and Overall Player of the Year Announced, 1 p.m.
Thursday, November 29• Jim Tatum Award (Top Football Scholar-Athlete) and Brian Piccolo Award, (Most Courageous Football Student-Athlete) announced, 11 a.m.
Friday, November 30• Dr Pepper ACC Football Championship Game Press Conference (Both participating coaches), 1 p.m., Bank of America Stadium• ACC Night of Legends, 6 p.m.
Saturday, December 1• 2018 Dr Pepper ACC Football Championship Game, Bank of America Stadium, Charlotte, N.C., 8 p.m.
Sunday, December 2• Selection Sunday – College Football Playoff and ACC Bowl Teams announced
December 19, 2018 & February 6, 2019• National Football Signing Days
COLLEGE FOOTBALL PLAYOFF RANKINGSEach fall, the College Football Playoff Selection Committee meets in person to produce interim rankings before Selection Day. During each meeting, the selection committee ranks 25 teams.
The dates for the fall of 2018 are as follows:Tuesday, Oct. 30Tuesday, Nov. 6Tuesday, Nov. 13Tuesday, Nov. 20Tuesday, Nov. 27Sunday, Dec. 2 (selection day and national semifi nal teams announced)
2019 ACC KICKOFF - THE WESTIN CHARLOTTEWednesday, July 17 (Atlantic Division Coaches & Stu-dent-Athletes); Thursday, July 18 (Coastal Division Coaches & Student-Athletes)
In its eighth year in Charlotte, the Dr Pepper Atlantic Coast Conference Football Championship Game will be played at Bank of America Stadium on Saturday, December 1.
2018 DR PEPPER ACC CHAMPIONSHIP GAME WEEK SCHEDULE
Sunday, November 25Coaches Media Teleconference, 4 p.m.
Monday, November 26Players Media Teleconference, 11:30 a.m.
Friday, November 30Championship Game Press Conference, 1 p.m. (Bank of America Stadium)
Saturday, December 1Dr Pepper ACC Championship Game (Kickoff, 8 p.m. on ABC)
ACC FOOTBALL CHAMPIONSHIP HEADQUARTERS - CHARLOTTE MARRIOTT CITY CENTERThe Charlotte Marriott City Center will serve as both the ACC Championship Game headquarters and the media headquarters for the ACC’s 14th Annual Football Championship Game. A media workroom and hospitality room with complimentary internet wireless connections will be available on Friday and Saturday. The Charlotte Marriott City Center is located at 100 W Trade St, Charlotte, NC 28202, (704) 333-9000.
IMPORTANT DATES FOR COVERING ACC FOOTBALL

7
2 0 1 8 -19 B O W L A F F I L I AT I O N S
ACC AFFILIATED BOWL GAMES
Date Time Game Network Matchup LocationThurs., Dec. 20 8 p.m. Bad Boy Mowers Gasparilla Bowl ESPN American vs. C-USA or ACC Tampa, Fla.Sat., Dec. 22 Noon Birmingham Bowl ESPN SEC vs. American* Birmingham, Ala.Wed., Dec. 26 1:30 p.m. Zaxby’s Heart of Dallas Bowl ESPN Big Ten vs. C-USA or ACC Dallas, Texas 5:15 p.m. Quick Lane Bowl ESPN Big Ten vs. ACC Detroit, Mich.Thurs., Dec. 27 1:30 p.m. Walk-On’s Independence Bowl ESPN SEC vs. ACC Shreveport, La. 5:15 p.m. New Era Pinstripe Bowl ESPN Big Ten vs. ACC The Bronx, N.Y.Fri., Dec. 28 1:30 p.m. Franklin American Mortgage Music City Bowl ESPN SEC vs. ACC/Big Ten Nashville, Tenn. 5:15 p.m. Camping World Bowl ESPN Big 12 vs. ACC Orlando, Fla.Sat., Dec. 29 Noon Chick-fi l-A Peach Bowl ESPN At-Large vs. At-Large Atlanta, Ga. 12:30 p.m. Belk Bowl ABC SEC vs. ACC Charlotte, N.C. 4 or 8 p.m. CFP Semifi nal at Capital One Orange Bowl ESPN National Semifi nal Miami Gardens, Fla. 4 or 8 p.m. CFP Semifi nal at Goodyear Cotton Bowl ESPN National Semifi nal Arlington, TexasMon., Dec. 31 Noon Military Bowl Presented by Northrop Grumman ESPN ACC vs. American Annapolis, Md. 2 p.m. Hyundai Sun Bowl CBS Pac-12 vs. ACC El Paso, Texas 7:30 p.m. TaxSlayer Gator Bowl ESPN SEC vs. ACC/Big Ten Jacksonville, Fla.Tue., Jan. 1 1 p.m. PlayStation Fiesta Bowl ESPN At-Large vs. At-Large Glendale, Ariz.Mon., Jan. 7 8 p.m. CFP National Championship ESPN CFP Semifi nal Winners Santa Clara, Calif.*Possible bowl game if other conferences do not qualify for slot and additional ACC teams are available.
College Football Playoff (four teams)The Capital One Orange Bowl and the Goodyear Cotton Bowl are national semifi nal sites for the 2018 season. There is no limit on how many teams from one conference can appear in the CFP.
ACC Champion - Top Four CFP RankingIf the ACC Champion is in the top four of the fi nal CFP rankings, it will play in one of the national semifi nal games. Additional ACC teams could also be selected for the CFP, Chick-fi l-A Peach Bowl or PlayStation Fiesta Bowl as at-large representatives.
ACC Champion - Not In Top Four CFP RankingIf the ACC Champion is not in the top four of the fi nal CFP rankings, it will appear in either the Chick-fi l-A Peach Bowl or the PlayStation Fiesta Bowl. Additional ACC teams could also be selected for the Chick-fi l-A Peach Bowl or PlayStation Fiesta Bowl as at-large representatives.
Camping World Bowl The Camping World Bowl has the fi rst pick of an ACC team after the CFP and New Year’s Six Bowls are fi lled.
Tier One Bowls (all equal selection status)Belk BowlFranklin American Mortgage Music City Bowl or TaxSlayer Gator BowlNew Era Pinstripe Bowl Hyundai Sun Bowl
Additional BowlsMilitary Bowl Presented by Northrop Grumman Walk-On’s Independence BowlQuick Lane BowlBad Boy Mowers Gasparilla Bowl or Heart of Dallas Bowl
Secondary*Birmingham Bowl*If not fi lled by other conferences and additional ACC teams are available.
ACC BOWL SELECTION PROCESS

8
H O N O R S ACC P L AY E R S O F T H E W E E K2018 ACC PLAYERS OF THE WEEKQuarterbackSept. 4 ...........................................Eric Dungey, SyracuseSept. 10 .............................................. Daniel Jones, DukeSept. 17 .......................... Anthony Brown, Boston CollegeSept. 24 .........................................Eric Dungey, SyracuseOct. 1 ........................................Ryan Willis, Virginia TechOct. 8 ...............................TaQuon Marshall, Georgia TechOct. 15 ............................ Anthony Brown, Boston CollegeOct. 22 .............................Deondre Francois, Florida StateOct. 29 ...........................................Eric Dungey, SyracuseNov. 5 ............................... James Blackman, Florida StateNov. 12 ............................................... Daniel Jones, DukeNov. 19 .............................................................................Nov. 26 .............................................................................
Running BackSept. 4 ........................................Jordan Ellis, TB, VirginiaSept. 10 .............................. AJ Dillon, TB, Boston CollegeSept. 17 .............................. AJ Dillon, TB, Boston CollegeSept. 24 ...................................... Travis Etienne, ClemsonOct. 1 .......................................... Travis Etienne, ClemsonOct. 8 ..................................................Qadree Ollison, PittOct. 15 ...............................Michael Carter, North CarolinaOct. 22 ...........................Antonio Williams, North CarolinaOct. 29 .............................................. Deon Jackson, Duke.............................................Matt Colburn II, Wake ForestNov. 5 ....................................................... Darrin Hall, PittNov. 12 ...............................................Qadree Ollison, PittNov. 19 .............................................................................Nov. 26 .............................................................................
Offensive LineSept. 4 ......................... Tremayne Anchrum, OT, Clemson.................................Chris Lindstrom, OT, Boston CollegeSept. 10 ....................................Mitch Hyatt, OT, ClemsonSept. 17 .................................. Jack Wohlabaugh, C, DukeSept. 24 .......................William Sweet, OT, North CarolinaOct. 1 ........................................Mitch Hyatt, OT, ClemsonOct. 8 ..............................Parker Braun, OG, Georgia TechOct. 15 .....................Chris Lindstrom, OT, Boston CollegeOct. 22 ......................................Mitch Hyatt, OT, ClemsonOct. 29 ............................Parker Braun, OG, Georgia TechNov. 5 ...........................................Mike Herndon, OG, PittNov. 12 ...................................... Jimmy Morrissey, C, PittNov. 19 .............................................................................Nov. 26 .............................................................................
ReceiverSept. 4 ................................ Jakobi Meyers, WR, NC StateSept. 10 .................................. Tee Higgins, WR, ClemsonSept. 17 .........................Olamide Zaccheaus, HB, VirginiaSept. 24 ..............................Kelvin Harmon, WR, NC StateOct. 1 ................................Greg Dortch, WR, Wake ForestOct. 8 .........................Damon Hazelton, WR, Virgina Tech............................................Kelvin Harmon, WR, NC StateOct. 15 ....................................... T.J. Rahming, WR, DukeOct. 22 ..................................Jamal Custis, WR, SyracuseOct. 29 ................................Kelvin Harmon, WR, NC StateNov. 5 ........................ Tamorrion Terry, WR, Florida StateNov. 12 ...............................Kelvin Harmon, WR, NC StateNov. 19 .............................................................................Nov. 26 .............................................................................
Defensive LineSept. 4 ....................................Gerald Willis III, DT, MiamiSept. 10 ...................................Clelin Ferrell, DE, ClemsonSept. 17 ............................Wyatt Ray, DE, Boston CollegeSept. 24 .............................Alton Robinson, DE, SyracuseOct. 1 ...........................................Joe Jackson, DE, MiamiOct. 8 .................................Alton Robinson, DE, SyracuseOct. 15 ..............................Zach Allen, DE, Boston CollegeOct. 22 ................................Brian Burns, DE, Florida StateOct. 29 ......................Carlos Basham Jr., DE, Wake ForestNov. 5 ....................Anree Saint-Amour, DE, Georgia TechNov. 12 ............................ Christian Wilkins, DT, ClemsonNov. 19 .............................................................................Nov. 26 .............................................................................
LinebackerSept. 4 ..............................Rayshard Ashby, Virginia TechSept. 10 .........................................Ben Humphreys, DukeSept. 17 .....................................Kielan Whitner, SyracuseSept. 24 ...................................Charles Snowden, VirginiaOct. 1 .........................................Shaq Quarterman, Miami........................................... DeCalon Brooks, Florida StateOct. 8 .........................................Germaine Pratt, NC StateOct. 15 ........................................... Joe Giles-Harris, DukeOct. 22 ......................................... Ryan Guthrie, SyracuseOct. 29 .......................................Germaine Pratt, NC StateNov. 5 ................................ Cole Holcomb, North CarolinaNov. 12 ................................Jalen Johnson, Georgia TechNov. 19 .............................................................................Nov. 26 .............................................................................
Defensive BackSept. 4 .............................. Caleb Farley, CB, Virginia TechSept. 10 ................................. Juan Thornhill, SS, VirginiaSept. 17 ..................................... Dylan Singleton, S, DukeSept. 24 ............................Jarius Morehead, SS, NC StateOct. 1 ............................ Reggie Floyd, Rov., Virginia TechOct. 8 ............................................ Damar Hamlin, FS, PittOct. 15 ................................... Juan Thornhill, SS, VirginiaOct. 22 ..........................................Bryce Hall, CB, VirginiaOct. 29 .......................... Cameron Glenn, FS, Wake ForestNov. 5 ................. Brandon Sebastian, CB, Boston CollegeNov. 12 ......................... Cameron Glenn, FS, Wake ForestNov. 19 .............................................................................Nov. 26 .............................................................................
SpecialistSept. 4 .......................................Maurice Ffrench, KR, PittSept. 10 .......................Greg Dortch, WR/PR Wake ForestSept. 17 ................................. Andre Szmyt, PK, SyracuseSept. 24 ...............................Sean Riley, PR/KR, SyracuseOct. 1 ..................................... Andre Szmyt, PK, SyracuseOct. 8 ............................. D.J. Matthews, PR, Florida StateOct. 15 .......................................Maurice Ffrench, KR, PittOct. 22 .......................Dazz Newsome, PR, North CarolinaOct. 29 .......................................... Alex Kessman, PK, PittNov. 5 ............................. Christopher Dunn, PK, NC StateNov. 12 .......................................... Joe Reed, KR, VirginiaNov. 19 .............................................................................Nov. 26 .............................................................................
RookieSept. 4 ............................. Sage Surratt, WR, Wake ForestSept. 10 ............................ Thayer Thomas, WR, NC StateSept. 17 .............................. Tommy Devito, QB, SyracuseSept. 24 ........................... Trevor Lawrence, QB, ClemsonOct. 1 .............................. Sam Hartman, QB, Wake ForestOct. 8 .......................................Lyn-J Dixon, RB, ClemsonOct. 15 ......................................Chris Rumph II, DE, DukeOct. 22 ............................. Trevor Lawrence, QB, ClemsonOct. 29 ............................. Trevor Lawrence, QB, Clemson........................................ Tobias Oliver, QB, Georgia TechNov. 5 ............................. Tobias Oliver, QB, Georgia TechNov. 12 ............................ Trevor Lawrence, QB, ClemsonNov. 19 .............................................................................Nov. 26 .............................................................................
Outland Trophy Player of the Month (September)Gerald Willis III, DT, Miami (Sept.)Mitch Hyatt, OT, Clemson (Oct.)
Walter Camp Defensive Player of the WeekWyatt Ray, DE, Boston College (Sept. 16)Juan Thornhill, DB, Virginia (Oct. 14)
Walter Camp Offensive Player of the Week Darrin Hall, RB, Pitt (Nov. 4)
Manning Award Stars of the WeekEric Dungey, Syracuse (Sept. 4, Oct. 29)Daniel Jones, Duke (Sept. 10, Nov. 12)Anthony Brown, Boston College (Sept. 17)Malik Rosier, Miami (Sept. 17)Nathan Elliott, North Carolina (Sept. 24)Ryan Willlis, Virginia Tech (Oct. 1)Jamie Newman, Wake Forest (Nov. 12)
Davey O'Brien Award Great 8 Weekly AwardAnthony Brown (Sept. 17)Eric Dungey (Oct. 29)
Davey O'Brien Award Semifi nalistTrevor Lawrence, ClemsonRyan Finley, NC State
Lou Groza Stars of the WeekRicky Aguayo, Florida State (Sept. 24)Andre Szmyt, Syracuse (Oct. 1, Oct. 29)Alex Kessman, Pitt (Oct. 29)
Lou Groza Semifi nalistAndre Szmyt, Syracuse
Lott Impact Trophy Quarterfi nalistsZach Allen, DE, Boston CollegeBen Humphreys, LB, DukeChristian Wilkins, DT, Clemson
Johnny Unitas Award Final 10Eric Dungey, SyracuseRyan Finley, NC State
Senior CLASS AwardZach Allen, DE, Boston CollegeChristian Wilkins, DT, Clemson (fi nalist)Alec Oberle, OT, Florida StateEric Dungey, QB, Syracuse
Paul Hornung Award Weekly Honor RollDeon Jackson, RB, Duke (Oct. 29)
Bednarik Award Semifi nalists (top defensive player)Zach Allen, DE, Boston CollegeClelin Ferrell, DE, ClemsonChristian Wilkins, DT, ClemsonBrian Burns, DE, Florida State
Maxwell Award Semifi nalists (top offensive player)AJ Dillon, RB, Boston CollegeTravis Etienne, RB, Clemson
Butkus Award Semifi nalist (top linebacker)Tre Lamar, Clemson
Wuerffel Trophy Semifi nalistsA.J. Cole III, P, NC StateKielan Whitner, LB, Syracuse
Broyles Award (top assistant coach)Jeff Scott, Clemson (Co-OC, WRs)Matt Guerrieri, Duke (Co-DC)Manny Diaz, Miami (DC/LBs)Eli Drinkwitz, NC State (OC, QBs)Justin Lustig, Syracuse (STC, WRs)Kevin Higgins, Wake Forest (OC, QBs)
2018 HONORS & AWARDS

9
TO P 2 5 P O L L R E P O R TSAP/USA Today/CFP
BC Clem Duke FSU GT UL UM NC NCSU Pitt SU VA VT WFPreseason RV/-/- 2/2/- -/RV/- 19/19/- -/-/- -/RV/- 8/8/- -/-/- RV/RV/- -/-/- -/-/- -/-/- 20/17/- -/-/-Week 2 RV/RV/- 2/2/- -/RV/- RV/RV/- -/RV/- -/-/- 22/21/- -/-/- RV/RV/- -/-/- -/-/- -/-/- 12/14/- -/-/-Week 3 RV/RV/- 2/2/- RV/RV/- RV/RV/- -/-/- -/-/- 21/20/- -/-/- RV/RV/- -/-/- -/-/- -/-/- 13/11/- -/-/-Week 4 23/25/- 3/2/- RV/RV/- -/-/- -/-/- -/-/- 21/20/- -/-/- RV/RV/- -/-/- RV/RV/- -/-/- 13/10/- -/-/-Week 5 -/RV/- 3/2/- 22/23/- -/-/- -/-/- -/-/- 16/16/- -/-/- RV/RV/- -/-/- RV/RV/- -/RV/- RV/24/- -/-/-Week 6 RV/RV/- 4/4/- RV/RV/- -/-/- -/-/- -/-/- 17/17/- -/-/- 23/25/- -/-/- RV/RV/- -/-/- 24/23/- -/-/-Week 7 -/-/- 4/4/- -/RV/- -/-/- -/-/- -/-/- 16/15/- -/-/- 20/19/- -/-/- -/RV/- -/-/- -/RV/- -/-/-Week 8 -/RV/- 3/3/- RV/RV/- -/-/- -/-/- -/-/- RV/RV/- -/-/- 16/15/- -/-/- -/-/- RV/RV/- -/RV/- -/-/-Week 9 RV/-/- 2/2/- -/RV/- -/-/- -/-/- -/-/- RV/25/- -/-/- 22/22/- -/-/- -/RV/- RV/RV/- -/RV/- -/-/-Week 10 24/25/22 2/2/2 -/-/- -/-/- -/-/- -/-/- -/RV/- -/-/- RV/RV/21 -/RV/- 22/24/19 23/22/25 -/RV/- -/-/-Week 11 17/14/17 2/2/2 RV/RV/- -/-/- -/-/- -/-/- -/-/- -/-/- 22/22/14 -/RV/- 13/13/13 -/-/- -/-/- -/-/-Week 12 22/22/- 2/2/- RV/RV/- -/-/- -/-/- -/-/- -/-/- -/-/- RV/RV/- RV/RV/- 12/12/- -/RV/- -/-/- -/-/-Week 13ACC CG Bowls Final
*Refl ects rankings only while a member of the ACC ConsecutiveSchool Polls Top 10 No.1 Weeks RankedBoston College 3 35 1 41Clemson 64 151 9 421Duke - 57 - 173Florida State - 362 72 553Georgia Tech - 146 - 299Louisville - 8 - 26Miami - 299 68 484North Carolina - 76 1 246NC State - 11 - 155Pitt - - - 4Syracuse 3 - - 3Virginia - 24 3 167Virginia Tech - 94 - 295Wake Forest - - - 41
ACC ASSOCIATED PRESS RANKING HISTORY ASSOCIATED PRESS RANKINGSSchool P S4 S9 S16 S23 S30 O7 O14 O21 O28 N4 N11 N18 N25 D2 J8Alabama 1 1 1 1 1 1 1 1 1 1 1 1Clemson 2 2 2 3 3 4 4 3 2 2 2 2Notre Dame 12 8 8 8 8 6 5 4 3 3 3 3Michigan 14 21 19 19 14 15 12 6 5 5 4 4Georgia 3 3 3 2 2 2 2 8 7 6 5 5Oklahoma 7 6 5 5 6 7 11 9 8 7 6 6West Virginia 17 14 14 12 12 9 6 13 13 12 7 7Washington St. - - - - - - - 25 14 10 10 8Ohio State 5 4 4 4 4 3 3 2 11 8 8 9LSU 25 11 12 6 5 5 13 5 4 4 9 10UCF 21 19 18 16 13 12 10 10 10 9 11 11Syracuse - - - - - - - - - 22 13 12Texas 23 - - - 18 19 9 7 6 15 15 13Utah State - - - - - - - - - 18 14 14Florida - 25 - - - 22 14 11 9 13 19 15Penn State 10 13 11 10 9 11 8 18 17 14 21 16Washington 6 9 10 10 11 10 7 15 15 - 20 17Iowa State - - - - - - - - - - 23 18Cincinnati - - - - - - 25 20 - - 25 19Kentucky - - - - 17 13 18 14 12 11 12 20Utah - - - - - - - - 23 16 - 21Boston College - - - 23 - - - - - 24 17 22Boise State 22 20 17 - - - - - - - - 23Northwestern - - - - - - - - - - - 24 Mississippi St. 18 18 16 14 23 - 24 22 - 21 18 25Fresno State - - - - - - - - - 20 16 -NC State - - - - - 23 20 16 22 - 22 -Michigan State 11 15 25 24 21 20 - 24 - - 24 -Wisconsin 4 5 6 18 15 16 15 23 20 17 - -Iowa - - - - - - - 19 18 19 - -Virginia - - - - - - - - - 23 - -Texas A&M - - - 22 - - 22 17 16 25 - -Oregon 24 23 20 20 - 18 17 12 19 - - -USF - - - - - - 23 21 21 - - -Stanford 13 10 9 7 7 14 - - 24 - - -Appalachian State - - - - - - - 25 - - -Miami 8 22 21 21 16 17 16 - - - - -Colorado - - - - - 21 19 - - - - -Auburn 9 7 7 9 10 8 21 - - - - -Virginia Tech 20 12 13 13 - 24 - - - - - -Oklahoma State - - 24 15 - 25 - - - - - -BYU - - - 25 20 - - - - - - -Duke - - - - 22 - - - - - - -California - - - - 24 - - - - - - -Texas Tech - - - - 25 - - - - - - -TCU 16 16 15 17 - - - - - - - -USC 15 17 22 - - - - - - - - -Arizona State - - 23 - - - - - - - - -South Carolina - 24 - - - - - - - - - -Florida State 19 - - - - - - - - - - -
COLLEGE FOOTBALL PLAYOFF RANKINGSSchool O30 N6 N13 N20 N27 D2Alabama 1 1Clemson 2 2Notre Dame 4 3Michigan 5 4Georgia 6 5Oklahoma 7 6LSU 3 7Washington State 8 8West Virginia 13 9Ohio State 10 10Kentucky 9 11UCF 12 12Syracuse 19 13NC State 21 14Florida 11 15Mississippi State 18 16Boston College 22 17Michigan State - 18Texas 17 19Penn State 14 20Iowa 16 21Iowa State 24 22Fresno State 23 23Auburn - 24Washington - 25Utah 15 -Texas A&M 20 -Virginia 25 -

2018 ACC FOOTBALL GAME PREVIEWS2 0 1 8 G A M E P R E V I E W S
10
Saturday, November 17Pitt (6-4, 5-1 ACC)
at Wake Forest (5-5, 2-4 ACC)Noon; RSN
First meeting
Head Coaches:Wake Forest - Dave Clawson (26-34 in fi fth season at Wake Forest; 116-114 in 19th season overall)Pitt - Pat Narduzzi (27-21 in third season at Pitt and overall)
Notes: History will be made Saturday at BB&T Field as the Demon Deacons and Panthers meet for the fi rst time • The noon kickoff will end a draught of more than a century, with Wake Forest having taken to the gridiron for the fi rst time in 1888 and Pitt following suit two years later • Saturday’s game is the fi nal home contest of 2018 for the Deacs, who are slated to wrap up their regular season at Duke on Nov. 24 • The Panthers, whose magic number is one to seal the deal in the Coastal Division chase, are slated to play their fi nal regular-season contest at Miami • Pitt will be the fi rst Coastal opponent of the season for Wake Forest, which played its sixth and fi nal Atlantic opponent Nov. 8 at NC State • Both teams were part of Notre Dame’s fi ve-game ACC rotation this season, with the Fighting Irish winning at Wake on Sept. 22 and fending off Pitt for a 19-14 win at home on Oct. 13.
Saturday, November 17 NC State (6-3, 3-3 ACC)
at Louisville (2-8, 0-7 ACC)12:20 p.m.; Raycom Sports
UL leads series, 6-2Last meeting: NCSU, 39-25 (2017)
Head Coaches:NC State - Dave Doeren (40-33 in sixth season at NC State; 63-37 in eighth season overall)Louisville - Lorenzo Ward (0-0 in fi rst season as interim head coach and overall)
Notes: NC State’s 39-25 victory last year in Raleigh halted the Cardinals’ recent dominance of the series • Louisville had taken six of seven previous meetings between the teams, including all three matchups since joining the ACC • QB Ryan Finley threw for 367 yards and a 48-yard score to WR Kelvin Harmon in last year’s game, and the Wolfpack piled up 520 yards total offense • NC State’s lone series win prior to last season had come by a 31-24 score in the 2011 Belk Bowl • Now the Wolfpack will try to win for the fi rst time in Louisville, where the Cardinals have won on four previous occasions, including the series opener in 1951 • Louisville will be playing its fi rst game under interim head coach Lorenzo Ward, who took the reins last season following the dismissal of head coach Bobby Petrino • A 21-year coaching veteran at the FBS level, Ward has six years of experience as a defensive coordinator and is in his second year at Louisville.
Saturday, November 17#12 Syracuse (8-2, 5-2 ACC)
vs. #3 Notre Dame (10-0) 2:30 p.m.; NBC
ND leads series, 5-3Last meeting: ND, 50-33 (2016)
Head Coaches:Syracuse - Dino Babers (16-18 in third season at Syracuse; 53-34 in sixth season overall)Notre Dame- Brian Kelly (58-33 in ninth seasonat Notre Dame; 228-90-2 in 29th season overall)
Notes: Yankee Stadium will be the setting for the re-newal of a series that was fi rst played in 1914 but has seen the programs meet on just eight prior occasions • QB DeShone Kizer threw for a career-best 471 yards and three touchdowns to lead the Irish to a 50-33 win in the most recent meeting two seasons ago at MetLife Stadium in East Rutherford, N.J. • The Orange lost despite piling up 489 total yards • Neutral site games have been common in the series • The teams also played at MetLife Stadium in 2014, with Notre Dame posting a 31-15 win • The crowd of 76,802 was the largest ever to watch a college game at MetLife • Syracuse won 14-7 at Yankee Stadium on Thanksgiv-ing Day in 1963 • Notre Dame has played 26 previous games at Yankee Stadium (“old” and “new versions”), and the Orange have played seven • Syracuse’s only loss at Yankee Stadium came in 1960 vs. Army.
Saturday,November 17Western Carolina (3-7, 1-7 SoCon)
at North Carolina (1-8, 1-6 ACC)3 p.m.; ACC Network Extra
UNC leads series, 1-0UNC, 65-10 (2017)
Head Coaches:Western Carolina - Mark Speir (29-50 in seventh season at Western Carolina and overall)North Carolina - Larry Fedora (44-42 in seventh sea-son at North Carolina; 79-60 in 11th season overall)
Notes: Saturday’s game continues a fl urry of non-conference action for the Tar Heels versus in-state opponents that is scheduled to stretch into the next decade • Western Carolina returns to Kenan Stadium for the second consecutive season, and UNC visited East Carolina earlier this year • UNC has a home-and-home, designated non-conference two-game set versus Wake Forest, three games versus Appalachian State, and a home-and home series with Charlotte scheduled from 2019 through 2025 • Saturday’s game will be the second of three straight against in-state opposition to close out the 2018 season for the Tar Heels, who visited Duke last weekend and close ver-sus NC State on Nov. 24 • UNC and Western Carolina met for the fi rst time in 2017, with the Tar Heels posting a 65-10 win at Kenan Stadium • QB Nathan Elliott threw four fi rst-half touchdown passes and UNC scored 21 points in a span of 2 minutes, 46 seconds.
Saturday, November 17Duke (7-3, 3-3 ACC)
at #2 Clemson (10-0, 7-0 ACC)7 p.m.; ESPN
Clemson leads series, 36-16Last meeting: CU, 56-20 (2012)
Head Coaches:Duke - David Cutcliffe (66-70 in 11th season at Duke; 110-99 in 17th season overall) Clemson - Dabo Swinney (111-30 in 11th season atClemson and overall)
Notes: The Atlantic Division champion Tigers and Blue Devils will meet for the fi rst time since 2012 • Clemson has won the last four games between the schools, all by a margin of at least 24 points, including by 56-20 in the most recent meeting on Nov. 3, 2012 at Duke • QB Tajh Boyd threw for 344 yards and tied a school record with fi ve touchdown passes, and the Tigers amassed over 700 yards of total offense in the win • Duke swept the fi rst three games in the series – which were all played in Durham in 1934, 1935 and 1936 – but Clemson leads 36-13-1 in all-time ACC games and is 19-4-1 versus the Blue Devils at Death Valley • Saturday’s game wraps up ACC regular-sea-son play for the Tigers, who will remain at home for their rivalry meeting with South Carolina on Nov. 24 • Duke also closes its regular season at home against an in-state opponent as it welcomes Wake Forest.
Saturday, November 17Virginia (7-3, 4-2 ACC)
at Georgia Tech (6-4, 4-3 ACC)3:30 p.m.; RSN
GT leads series, 20-19-1Last meeting: UM, 25-24 (2017)
Head Coaches:Virginia - Bronco Mendenhall (15-20 in third seasonat Virginia; 114-63 in 14th season overall)Georgia Tech - Paul Johnson (81-58 in 11th seasonat Georgia Tech; 188-97 in 21st season overall)
Notes: Georgia Tech has captured four of the last six meetings between the schools and holds an 18-16-1 edge in ACC play, but Virginia’s win in Charlottesville last year tightened the series • QB Kurt Benkert’s 27-yard touchdown pass to Andre Levrone with 1:22 remaining secured last season’s win for the Cavaliers, who clinched bowl eligibility for the fi rst time since 2011 • The Yellow Jackets are 16-7 all-time versus Virginia in Atlanta and have not lost to the Cavaliers at home since 2008 • The fi rst six games of what is now an ACC Coastal Division series were played in Atlanta (between 1965 and 1983), and all were Georgia Tech wins • Virginia closed the gap by winning seven of nine from 1987 through 1995, and neither side has won more than three years in a row since • Regular-season ending rivalry games are on the agenda for both teams Thanksgiving weekend, with Virginia at Virginia Tech, and Georgia Tech at Georgia.

2018 ACC FOOTBALL GAME PREVIEWS2 0 1 8 G A M E P R E V I E W S
11
Saturday, November 17Miami (5-5, 2-4 ACC)
at Virginia Tech (4-5, 3-4 ACC)3:30 pm.; ESPN
UM leads series, 21-14Last meeting: UM, 28-10 (2017)
Head Coaches:Miami - Mark Richt (24-12 in third season at Miami; 169-63 in 18th season overall)Virginia Tech - Justin Fuente (23-13 in third season at Virginia Tech; 49-36 in eighth season overall)
Notes: The Hokies and Hurricanes meet for the 36th time and the 15th time as ACC members • Virginia Tech leads 8-6 in ACC games • The Hokies are also 8-6 all-time versus the Canes in Blacksburg • The teams’ history also includes a pair of Miami wins in bowl games (14-7 in the 1966 Liberty Bowl and 20-10 in the 1980 Peach Bowl) • The Canes won the fi rst 12 meetings in the series, which was fi rst played in 1953 • Virginia Tech broke into the win column at Blacks-burg in 1995 • That jump-started a fi ve-game Virginia Tech winning streak in the series, which will fi nd the teams meeting for the 27th consecutive year on Saturday • Last year’s 28-10 Hurricanes win at Miami Gardens was led by QB Malik Rosier, who threw two touchdown passes and ran for another score as then-No. 9 and unbeaten Miami took another giant step toward what would be its fi rst Coastal Division crown.
Saturday, November 17#22 Boston College (7-3, 4-2 ACC)at Florida State (4-6, 2-5 ACC)
3:30 p.m.; ESPN2FSU leads series, 11-5
Last meeting: BC, 35-3 (2017)
Head Coaches:Boston College - Steve Addazio (38-36 in sixth sea-son at BC; 51-47 in eighth season overall)Florida State - Willie Taggart (4-6 in fi rst year at FSU; 51-56 in ninth season overall)
Notes: Boston College seeks its second consecutive win over the Seminoles following last season’s 35-3 home victory that snapped a seven-game FSU series winning streak • The Seminoles own a 9-4 edge in ACC games in the series, which began in 1957 and also featured non-conference games in 1976 and 1980 before both schools became ACC members • Freshman RB AJ Dillon rushed for 149 yards and scored one touchdown, while senior LB Ty Schwab had 12 tackles with 2.5 tackles for loss in last year’s game, which marked the Eagles’ fi rst win over the Seminoles since 2009 and BC’s largest margin of vic-tory in the series • Florida State is 5-2 all-time against Boston College in Tallahassee and has not lost to the Eagles at home since 2008 • The Seminoles close out ACC play with Saturday’s game and face non-league rival Florida in their regular-season fi nale on Nov. 24 • Bowl-eligible BC will close the regular season at home against Atlantic Division rival Syracuse.

2018 ACC FOOTBALL GAME PREVIEWS
15
2 0 1 8 N AT I O N A L STAT I ST I CA L R A N K I N G S
TEAM LEADERSRUSHING OFFENSE (YPG)1. Georgia Tech .................................................................................... 362.410. Pi .........................................................................................................256.912. Clemson .................................................................................................251.7
PASSING OFFENSE (YPG)Na onal Leader: Washington St. ..................................................................392.36. NC State .................................................................................................328.6
TOTAL OFFENSE (YPG)Na onal Leader: Oklahoma ..........................................................................577.19. Clemson ..................................................................................................526.614. Syracuse ..................................................................................................482.2
SCORING OFFENSE (PPG)Na onal Leader: Utah State ...........................................................................51.35. Clemson ...................................................................................................45.77. Syracuse ...................................................................................................44.417. Georgia Tech ............................................................................................37.6
RUSHING DEFENSE (YPG)Na onal Leader: Michigan State ....................................................................76.53. Clemson ...................................................................................................82.38. NC State ...................................................................................................96.8
PASSING YARDS ALLOWED (PER GAME)Na onal Leader: Michigan ...........................................................................116.02. Miami ....................................................................................................134.39. Clemson .................................................................................................171.3
TOTAL DEFENSE (YPG)Na onal Leader: Michigan ...........................................................................219.82. Clemson .................................................................................................253.64. Miami ....................................................................................................268.6
SCORING DEFENSE (PPG)Na onal Leader: Alabama ..............................................................................12.71. Clemson ............................................................................................. 12.717. Virginia .....................................................................................................19.720. Miami ......................................................................................................20.1
TURNOVERS GAINEDNa onal Leader: Utah State ..............................................................................262. Syracuse ......................................................................................................256. Boston College ............................................................................................236. Georgia Tech ...............................................................................................2314. Miami .........................................................................................................20
PASSES INTERCEPTEDNa onal Leader: Maryland ................................................................................175. Boston College ............................................................................................156. Syracuse ......................................................................................................1413. Miami .........................................................................................................1313. Virginia ........................................................................................................1318. Georgia Tech ...............................................................................................12
DEFENSIVE TDsNa onal Leader: Two teams ed .........................................................................510. Georgia Tech .................................................................................................310. Miami ...........................................................................................................310. Wake Forest ..................................................................................................3
TEAM SACKS (PER GAME)Na onal Leader: Two teams ed ....................................................................3.803. Clemson ...................................................................................................3.6010. Syracuse ...................................................................................................3.3011. NC State ...................................................................................................3.2218. Boston College .........................................................................................2.90
TEAM TACKLES FOR LOSS (PER GAME)1. Miami ................................................................................................ 10.02. Clemson ......................................................................................................9.9
3RD DOWN CONVERSION PCT OFFENSENa onal Leader: Army West Point ..................................................................56.49. NC State ...................................................................................................48.012. Virginia ........................................................................................................47.719. Georgia Tech ...............................................................................................46.2
3RD DOWN CONVERSION PCT DEFENSENa onal Leader: UAB .....................................................................................24.24. Miami ......................................................................................................26.05. Syracuse ...................................................................................................26.26. Clemson ...................................................................................................27.0
INDIVIDUAL LEADERSRUSHING (YPG)Na onal Leader: Jonathan Taylor, Wisconsin ...................................................154.89. AJ Dillon, Boston College ...........................................................................117.017. Travis E enne, Clemson .............................................................................107.618. Qadree Ollison, Pi ...................................................................................105.4
RUSHING (TOTAL)Na onal Leader: Jonathan Taylor, Wisconsin ...................................................1,54813. Travis E enne, Clemson .............................................................................1.07614. Qadree Ollison, Pi ...................................................................................1,054
RUSHING TDsNa onal Leader: Devin Singletary, Fla. Atlan c .....................................................204. Travis E enne, Clemson ..................................................................................158. Tobias Oliver, Georgia Tech .............................................................................128. Eric Dungey, Syracuse .....................................................................................1220. Taquon Marshall, Georgia Tech ......................................................................11
PASSING (YPG)Na onal Leader: Gardner Minshew II, Washington State ................................385.26. Ryan Finly, NC State ...................................................................................318.2
PASSING EFFICIENCY (QB RATING)Na onal Leader: Kyler Murray, Oklahoma .......................................................212.911. Trevor Lawrence, Clemson ........................................................................158.6
RECEIVING (YPG)Na onal Leader: Antoine Wesley, Texas Tech ...................................................134.75. Kelvin Harmon, NC State ...........................................................................107.220. Greg Dortch, Wake Forest ...........................................................................92.1
RECEPTIONS (PER GAME)Na onal Leader: Rondale Moore, Purdue ............................................................8.25. Jakobi Meyers, NC State ................................................................................7.86. Greg Dortch, Wake Forest .............................................................................7.57. Kelvin Harmon, NC State ...............................................................................7.215. Olamide Zaccheaus, Virginia .........................................................................6.7
TOTAL OFFENSE (YPG)Na onal Leader: Gardner Minshew II, Washington St. ....................................393.811. Ryan Finley, NC State .................................................................................321.620. Eric Dungey, Syracuse ................................................................................288.3
TOTAL POINTS SCORED1. Andre Szmyt, Syracuse ............................................................................. 1327. Travis E enne, Clemson ..................................................................................96
SACKS (PER GAME)Na onal Leader: Jaylon Ferguson, Louisiana Tech .............................................1.257. Wya Ray, Boston College ...........................................................................0.907. Brian Burns, Florida State ............................................................................0.907. Alton Robinson, Syracuse ............................................................................0.9016. Clelin Ferrell, Clemson .................................................................................0.85
TACKLES FOR LOSS (PER GAME)Na onal Leader: Nate Harvey, East Carolina .......................................................2.35. Gerald Willis III, Miami ..................................................................................1.715. Alton Robinson, Syracuse ..............................................................................1.518. Jonathan Garvin, Miami ................................................................................1.5
TOTAL INTERCEPTIONSNa onal Leader: Juwan Foggie, Charlo e ...............................................................61. Hamp Cheevers, Boston College ..................................................................63. Andre Cisco, Syracuse .......................................................................................53. Juan Thornhill, Virginia .....................................................................................5
FUMBLES RECOVEREDNa onal Leader: Tyler Horton, Boise State ..............................................................42. Charlie Thomas, Georgia Tech ..........................................................................32. Rashad Weaver, Pi ..........................................................................................316. 15 players ed ..................................................................................................2
PUNT RETURN TDs1. Travis Levy, Boston College .........................................................................21. Greg Dortch, Wake Forest ...........................................................................23. 11 players ed ..................................................................................................1
KICKOFF RETURN TDsNa onal Leader: Four players ed ..........................................................................21. Maurice Ffrench, Pi ...................................................................................25. Hassan Hall, Louisville ......................................................................................15. Joe Reed, Virginia .............................................................................................1
FIELD GOALS (PER GAME)1. Andre Szmyt, Syracuse ........................................................................... 2.704. Christopher Dunn, NC State ........................................................................1.896. Freeman Jones, North Carolina ...................................................................1.78

2018 ACC FOOTBALL GAME PREVIEWS
13
2 0 1 8 T E A M - BY-T E A M STATSBOSTON COLLEGE (7-3, 4-2 ACC) First Downs Rushing Passing Total Offense Return Opponent Score Total Rush Pass Pen Number-Yards Comp-Att-Int Yards Plays-Yards Yards TurnoversHOLY CROSS 62-14 22/13 14/9 8/2 0/2 52-365/43-197 16-20-0/12-22-2 245/66 72-610/65-263 149/183 1/2Wake Forest 41-34 19/27 9/16 9/10 1/1 44-220/60-298 16-25-0/20-45-2 304/214 69-524/105-512 140/143 1/2Purdue 13-30 14/17 7/6 7/10 0/1 34-85/41-76 15-29-4/21-28-0 144/296 63-229/69-372 236/50 4/2TEMPLE 45-35 28/24 13/7 9/15 6/2 66-275/34-191 16-34-0/21-47-2 148/261 100-423/81-452 188/145 2/3NC State 23-28 12/34 6/14 6/17 0/3 25-120/53-225 14-25-0/25-34-2 198/308 50-318/87-533 129/33 1/4LOUISVILLE 38-20 20/15 14/4 6/10 0/1 61-251/32-47 16-22-0/17-35-1 179/195 83-430/67-242 150/94 2/1MIAMI 27-14 22/19 11/10 10/8 1/1 53-223/36-155 17-30-1/19-39-2 210/150 83-433/75-305 80/135 1/2Virginia Tech 31-21 19/23 10/8 8/14 1/1 49-219/36-111 15-26-0/25-43-1 177/281 75-396/79-392 56/80 1/2CLEMSON 7-27 8/19 2/5 6/13 0/1 33-9/30-129 14-24-0/29-41-1 104/295 57-113/71-424 144/100 0/2Totals 342-244 195/209 102/84 83/111 10/14 477-2039/399-1495 160-262-5/211-368-15 2035/2316 739-4074/767-3811 1425/1115 13/23
CLEMSON (10-0, 7-0 ACC) First Downs Rushing Passing Total Offense Return Opponent Score Total Rush Pass Pen Number-Yards Comp-Att-Int Yards Plays-Yards Yards TurnoversFURMAN 48-7 23/13 8/7 15/3 0/3 35-249/53-117 23-35-0/4-9-0 282/46 70-531/62-163 130/0 0/2Texas A&M 28-26 14/25 6/4 7/18 1/3 32-115/32-71 17-27-0/23-40-0 298/430 59-413/72-501 28/59 0/2GEORGIA SOUTHERN 38-7 27/7 13/3 14/3 0/1 46-309/43-80 21-31-2/3-9-0 286/60 77-595/52-140 13/10 3/1Georgia Tech 49-21 25/15 14/10 10/2 1/3 36-248/56-146 19-30-2/3-8-0 232/57 66-480/64-203 94/57 2/1SYRACUSE 27-23 28/12 19/4 8/8 1/0 53-293/26-61 17-29-1/26-41-1 176/250 82-469/67-311 70/3 3/1Wake Forest 63-3 22/11 12/7 8/4 2/0 40-471/51-175 25-30-0/7-27-1 227/74 70-698/78-249 17/44 1/1NC STATE 41-7 24/16 4/7 19/5 1/4 32-91/32-104 32-48-0/22-35-2 380/193 80-471/67-297 111/0 1/3Florida State 59-10 25/15 6/2 16/11 3/2 33-120/35--21 24-44-1/20-40-1 404/268 77-524/75-247 131/54 1/2LOUISVILLE 77-16 27/16 17/8 8/8 2/0 37-492/36-81 14-20-1/17-34-2 169/231 57-661/70-312 104/277 2/3Boston College 27-7 19/8 5/2 13/6 1/0 30-129/33-9 29-41-1/14-24-0 295/104 71-424/57-113 100/144 2/0Totals 457-127 234/138 104/54 118/68 12/16 374-2517/397-823 221-335-8/139-267-7 2749/1713 709-5266/664-2536 798/648 15/16
DUKE (7-3, 3-3 ACC) First Downs Rushing Passing Total Offense Return Opponent Score Total Rush Pass Pen Number-Yards Comp-Att-Int Yards Plays-Yards Yards TurnoversARMY WEST POINT 34-14 19/18 9/11 8/7 2/0 35-184/47-168 13-17-0/10-21-0 197/197 52-381/68-365 90/14 1/2Northwestern 21-7 15/24 6/5 8/16 1/3 39-97/32-99 18-24-0/31-56-2 204/282 63-301/88-381 36/45 0/2Baylor 40-27 20/21 12/9 7/12 1/0 44-225/32-130 12-30-0/24-42-1 174/270 74-399/74-400 112/143 0/2N.C. CENTRAL 55-13 32/8 19/3 11/1 2/4 59-372/34-136 20-39-0/7-21-0 256/51 98-628/55-187 54/74 1/0VIRGINIA TECH 14-31 18/17 6/4 12/13 0/0 36-71/41-81 25-39-1/17-28-0 256/332 75-327/69-413 20/65 1/0Georgia Tech 28-14 19/20 10/14 9/5 0/1 33-98/61-229 17-27-1/7-17-0 206/125 60-304/78-354 77/54 3/3VIRGINIA 14-28 19/21 5/8 13/12 1/1 27-58/44-178 23-42-2/21-34-0 262/198 69-320/78-376 23/146 2/0Pitt 45-54 28/29 8/22 19/6 1/1 34-223/52-484 27-43-0/8-19-0 396/150 77-619/71-634 163/82 1/0Miami 20-12 13/16 5/10 6/5 2/1 30-146/44-300 19-37-1/13-28-0 144/111 67-290/72-411 16/84 1/2NORTH CAROLINA 42-35 29/25 10/14 15/11 4/0 35-268/37-315 31-54-1/27-44-0 361/221 89-629/81-536 55/140 3/0Totals 313-235 212/199 90/100 108/88 14/11 372-1742/424-2120 205-352-6/165-310-3 2456/1937 724-4198/734-4057 646/847 13/11
FLORIDA STATE (4-6, 2-6 ACC) First Downs Rushing Passing Total Offense Return Opponent Score Total Rush Pass Pen Number-Yards Comp-Att-Int Yards Plays-Yards Yards TurnoversVIRGINIA TECH 3-24 12/15 3/7 8/8 1/0 28-94/40-112 22-35-3/16-26-0 233/207 63-327/66-319 25/32 5/0SAMFORD 36-26 25/23 6/2 16/18 3/3 35-134/19-50 31-46-0/39-60-4 320/475 81-454/79-525 244/30 1/5Syracuse 7-30 11/25 3/11 7/10 1/4 23-62/57-222 18-37-1/18-31-0 178/219 60-240/88-441 32/40 1/0NORTHERN ILLINOIS 37-19 23/13 10/3 13/9 0/1 57-121/20-6 23-32-1/20-41-0 352/215 89-473/61-221 65/48 4/0Louisville 28-24 16/24 5/11 10/11 1/2 31-76/38-115 16-27-0/24-45-2 294/306 58-370/83-421 56/60 1/3Miami 27-28 14/20 5/9 9/8 0/3 33-70/46-102 16-32-1/13-32-0 130/204 65-200/78-306 174/134 2/1WAKE FOREST 38-17 20/24 4/10 14/13 2/1 29-132/50-96 29-41-0/25-54-1 353/273 70-485/104-369 98/39 1/1CLEMSON 10-59 15/25 2/6 11/16 2/3 35--21/33-120 20-40-1/24-44-1 268/404 75-247/77-524 54/131 2/1NC State 28-47 17/25 3/10 13/10 1/5 20-24/49-177 29-48-1/21-28-0 421/240 68-445/77-417 136/71 2/0Notre Dame 13-42 20/24 6/15 11/8 3/1 30-106/50-365 23-48-1/12-25-2 216/130 78-322/75-495 77/55 2/2Totals 227-316 173/218 47/84 112/111 14/23 321-798/402-1365 227-386-9/212-386-10 2765/2673 707-3563/788-4038 961/640 21/13
GEORGIA TECH (6-4, 4-3 ACC) First Downs Rushing Passing Total Offense Return Opponent Score Total Rush Pass Pen Number-Yards Comp-Att-Int Yards Plays-Yards Yards TurnoversALCORN ST. 41-0 25/9 20/5 4/3 1/1 54-439/28-77 9-18-1/15-23-1 104/69 72-543/51-146 81/35 3/3USF 38-49 27/29 19/13 6/13 2/3 57-419/44-224 9-18-2/21-31-1 183/202 75-602/75-426 145/290 3/1Pitt 19-24 22/16 16/6 4/8 2/2 56-320/31-138 6-15-1/16-23-1 66/197 71-386/54-335 64/20 2/1CLEMSON 21-49 15/25 10/14 2/10 3/1 56-146/36-248 3-8-0/19-30-2 57/232 64-203/66-480 57/94 1/2BOWLING GREEN 63-17 23/25 16/7 5/17 2/1 49-372/38-63 5-7-0/29-49-2 160/330 56-532/87-393 103/103 0/3Louisville 66-31 28/23 27/7 1/14 0/2 65-542/23-113 1-2-0/27-44-1 12/370 67-554/67-483 141/191 0/3DUKE 14-28 20/19 14/10 5/9 1/0 61-229/33-98 7-17-0/17-27-1 125/206 78-354/60-304 54/77 3/3Virginia Tech 49-28 35/16 31/7 0/8 4/1 78-465/25-122 0-1-0/15-22-0 0/201 79-465/47-323 0/140 0/1North Carolina 38-28 27/19 24/9 2/10 1/0 74-461/36-166 2-2-0/18-31-3 104/208 76-565/67-374 58/138 3/3MIAMI 27-21 15/13 12/7 3/6 0/0 53-231/30-134 3-4-0/14-23-0 73/165 57-304/53-299 68/138 1/3Totals 376-275 237/194 189/85 32/98 16/11 603-3624/324-1383 45-92-4/191-303-12 884/2180 695-4508/627-3563 771/1226 16/23
LOUISVILLE (2-8, 0-7 ACC) First Downs Rushing Passing Total Offense Return Opponent Score Total Rush Pass Pen Number-Yards Comp-Att-Int Yards Plays-Yards Yards TurnoversALABAMA 14-51 19/21 1/8 13/12 5/1 26-16/42-222 20-39-2/17-26-0 252/297 65-268/68-519 110/227 2/1INDIANA ST 31-7 19/12 12/8 6/2 1/2 38-199/50-174 14-22-1/3-12-0 164/37 60-363/62-211 100/83 2/0W. KENTUCKY 20-17 17/26 11/11 4/14 2/1 38-204/43-168 10-21-1/25-38-1 88/260 59-292/81-428 80/111 1/1Virginia 3-27 14/20 3/9 11/10 0/1 29-66/39-204 16-28-2/17-26-1 148/197 57-214/65-401 77/87 3/1FLORIDA STATE 24-28 24/16 11/5 11/10 2/1 38-115/31-76 24-45-2/16-27-0 306/294 83-421/58-370 60/56 3/1GEORGIA TECH 31-66 23/28 7/27 14/1 2/0 23-113/65-542 27-44-1/1-2-0 370/12 67-483/67-554 191/141 3/0Boston College 20-38 15/20 4/14 10/6 1/0 32-47/61-251 17-35-1/16-22-0 195/179 67-242/83-430 94/150 1/2WAKE FOREST 35-56 31/28 11/18 19/10 1/0 36-174/48-368 30-54-0/16-24-0 358/223 90-532/72-591 143/92 1/0Clemson 16-77 16/27 8/17 8/8 0/2 36-81/37-492 17-34-2/14-20-1 231/169 70-312/57-661 277/104 3/2Syracuse 23-54 18/23 9/13 7/6 2/4 39-203/55-326 14-31-2/14-27-1 210/192 70-413/82-518 27/130 4/3Totals 217-421 196/221 77/130 103/79 16/12 335-1218/471-2823 189-353-14/139-224-4 2322/1860 688-3540/695-4683 1159/1181 23/11

2018 ACC FOOTBALL GAME PREVIEWS
14
2 0 1 8 T E A M - BY-T E A M STATS
MIAMI (5-5, 2-4 ACC) First Downs Rushing Passing Total Offense Return Opponent Score Total Rush Pass Pen Number-Yards Comp-Att-Int Yards Plays-Yards Yards TurnoversLSU 17-33 18/17 6/8 9/5 3/4 34-83/41-156 15-35-2/11-24-0 259/140 69-342/65-296 50/134 2/0SAVANNAH STATE 77-0 20/5 11/2 8/2 1/1 37-239/46-30 19-31-1/6-12-2 255/48 68-494/58-78 168/87 2/4TOLEDO 49-24 24/17 16/8 7/9 1/0 53-268/36-112 13-23-0/13-23-1 205/222 76-473/59-334 47/58 0/1FIU 31-17 27/7 15/1 11/5 1/1 49-248/24-17 20-29-1/13-28-1 240/170 78-488/52-187 76/26 2/1NORTH CAROLINA 47-10 14/24 10/14 4/8 0/2 34-229/40-215 8-12-1/20-35-3 125/114 46-354/75-329 175/135 2/6FLORIDA STATE 28-27 20/14 9/5 8/9 3/0 46-102/33-70 13-32-0/16-32-1 204/130 78-306/65-200 134/174 1/2Virginia 13-16 16/18 6/12 9/3 1/3 29-149/41-143 15-29-3/12-21-3 190/92 58-339/62-235 73/187 3/3Boston College 14-27 19/22 10/11 8/10 1/1 36-155/53-223 19-39-2/17-30-1 150/210 75-305/83-433 135/80 2/1DUKE 12-20 16/13 10/5 5/6 1/2 44-300/30-146 13-28-0/19-37-1 111/144 72-411/67-290 84/16 2/1Georgia Tech 21-27 13/15 7/12 6/3 0/0 30-134/53-231 14-23-0/3-4-0 165/73 53-299/57-304 138/68 3/1Totals 309-201 187/152 100/78 75/60 12/14 392-1907/397-1343 149-281-10/130-246-13 1904/1343 673-3811/643-2686 1080/965 19/20
NORTH CAROLINA (1-8, 1-6 ACC) First Downs Rushing Passing Total Offense Return Opponent Score Total Rush Pass Pen Number-Yards Comp-Att-Int Yards Plays-Yards Yards TurnoversCalifornia 17-24 16/19 10/9 5/6 1/4 38-164/49-160 15-35-4/16-32-0 137/119 73-301/81-279 76/76 4/0ECU 19-41 19/26 8/9 9/15 2/2 25-161/49-220 25-44-0/19-33-0 234/290 69-395/82-510 72/67 0/0PITT 38-35 23/20 9/12 13/8 1/0 40-173/36-228 22-31-0/19-33-0 313/174 71-486/69-402 -2/123 1/1Miami 10-47 24/14 14/10 8/4 2/0 40-215/34-229 20-35-3/8-12-1 114/125 75-329/46-354 135/175 6/2VIRGINIA TECH 19-22 21/20 6/8 12/12 3/0 38-235/41-154 22-35-0/20-36-2 287/221 73-522/77-375 68/58 2/2Syracuse 37-40 24/25 10/8 14/15 0/2 41-179/33-140 34-54-1/28-52-1 321/406 95-500/85-546 100/29 2/2Virginia 21-31 14/23 3/12 11/11 0/0 22-66/44-208 22-38-0/18-27-1 271/217 60-337/71-425 35/24 1/1GEORGIA TECH 28-38 19/27 9/24 10/2 0/1 36-166/74-461 18-31-3/2-2-0 208/104 67-374/76-565 138/58 3/3Duke 35-42 25/29 14/10 11/15 0/4 37-315/35-268 27-44-0/31-54-1 221/361 81-536/89-629 140/55 0/3Totals 224-320 185/203 83/102 93/88 9/13 317-1674/395-2068 205-347-11/161-281-6 2106/2017 664-3780/676-4085 762/665 19/14
NC STATE (6-3, 3-3 ACC) First Downs Rushing Passing Total Offense Return Opponent Score Total Rush Pass Pen Number-Yards Comp-Att-Int Yards Plays-Yards Yards TurnoversJAMES MADISON 24-13 25/23 6/9 18/12 1/2 29-83/38-163 29-43-0/24-30-0 309/202 72-392/68-365 113/37 1/1GEORGIA STATE 41-7 24/18 3/7 19/9 2/2 31-115/31-107 32-39-1/19-34-0 426/242 70-541/65-349 53/23 1/1MARSHALL 37-20 24/15 6/3 17/11 1/1 36-125/22-54 23-40-0/22-43-2 377/270 76-502/65-324 119/158 1/3VIRGINIA 35-21 25/20 10/7 12/10 3/3 39-176/29-93 22-32-0/20-35-2 257/258 71-433/64-351 1/146 0/2BOSTON COLLEGE 28-23 34/12 14/6 17/6 3/0 53-225/25-120 25-34-2/14-25-0 308/198 87-533/50-318 33/129 4/1Clemson 7-41 16/24 7/4 5/19 4/1 32-104/32-91 22-35-2/32-48-0 193/380 67-297/80-471 0/111 3/1Syracuse 41-51 21/30 6/5 13/19 2/6 29-68/37-81 26-44-1/30-42-0 473/480 73-541/79-561 12/51 1/0FLORIDA STATE 47-28 25/17 10/3 10/13 5/1 49-177/20-24 21-28-0/29-48-1 240/421 77-417/68-445 71/136 0/2WAKE FOREST 23-27 23/22 3/10 18/11 2/1 27-47/38-138 35-53-1/22-33-0 374/297 80-421/71-435 99/46 1/1Totals 283-231 217/181 65/54 129/110 23/17 325-1120/272-871 235-348-7/212-338-5 2957/2748 673-4077/610-3619 501/837 12/12
PITT (6-4, 5-1 ACC) First Downs Rushing Passing Total Offense Return Opponent Score Total Rush Pass Pen Number-Yards Comp-Att-Int Yards Plays-Yards Yards TurnoversALBANY 33-7 21/16 14/3 7/10 0/3 37-238/28-60 17-23-1/18-29-2 169/263 60-407/57-323 179/21 2/2PENN STATE 6-51 15/23 13/10 1/8 1/5 52-245/33-211 9-18-1/15-31-0 55/179 70-300/64-390 49/111 3/2GEORGIA TECH 24-19 16/22 6/16 8/4 2/2 31-138/56-320 16-23-1/6-15-1 197/66 54-335/71-386 20/64 1/2North Carolina 35-38 20/23 12/9 8/13 0/1 36-228/40-173 19-33-0/22-31-0 174/313 69-402/71-486 123/-2 1/1UCF 14-45 16/31 8/13 6/12 2/6 33-109/45-240 16-26-1/18-34-0 163/328 59-272/79-568 112/47 1/0SYRACUSE 44-37 18/20 13/10 4/9 1/1 47-265/42-177 11-20-1/18-38-2 137/195 67-402/80-372 29/32 3/3Notre Dame 14-19 14/23 6/8 6/12 2/3 30-116/38-80 19-30-0/26-32-2 126/264 60-242/70-344 144/12 0/2DUKE 54-45 29/28 22/8 6/19 1/1 52-484/34-223 8-19-0/27-43-0 150/396 71-634/77-619 82/163 0/1Virginia 23-13 16/13 12/6 1/6 3/1 42-254/26-44 7-14-0/17-24-0 61/205 56-315/50-249 40/92 0/1VIRGINIA TECH 52-22 17/28 13/15 4/10 0/3 36-492/48-192 7-11-0/23-38-0 162/240 47-654/86-432 49/149 1/0Totals 299-296 182/227 119/98 51/103 12/26 396-2569/390-1720 129-217-5/190-315-7 1394/2449 613-3963/705-4169 827/689 12/14
SYRACUSE (8-2, 5-2 ACC) First Downs Rushing Passing Total Offense Return Opponent Score Total Rush Pass Pen Number-Yards Comp-Att-Int Yards Plays-Yards Yards TurnoversWestern Michigan 55-42 26/24 17/7 7/14 2/3 62-334/28-242 11-26-0/19-36-2 226/379 88-560/64-621 163/55 1/2WAGNER 62-10 26/14 13/1 13/12 0/1 43-215/41-41 24-37-1/17-33-3 241/247 80-456/74-288 118/14 1/3FLORIDA STATE 30-7 25/11 11/3 10/7 4/1 57-222/23-62 18-31-0/18-37-1 219/178 88-441/60-240 40/32 0/1CONNECTICUT 51-21 26/16 15/7 11/7 0/2 46-341/39-178 22-32-0/19-29-1 295/217 78-636/68-395 160/28 1/3Clemson 23-27 12/28 4/19 8/8 0/1 26-61/53-293 26-41-1/17-29-1 250/176 67-311/82-469 3/70 1/3Pitt 37-44 20/18 10/13 9/4 1/1 42-177/47-265 18-38-2/11-20-1 195/137 80-372/67-402 32/29 3/3NORTH CAROLINA 40-37 25/24 8/10 15/14 2/0 33-140/41-179 28-52-1/34-54-1 406/321 85-546/95-500 29/100 2/2NC STATE 51-41 30/21 5/6 19/13 6/2 37-81/29-68 30-42-0/26-44-1 480/473 79-561/73-541 51/12 0/1Wake Forest 41-24 25/26 15/10 7/12 3/4 60-264/44-159 23-35-0/21-37-1 157/275 95-421/81-434 20/51 0/3LOUISVILLE 54-23 23/18 13/9 6/7 4/2 55-326/39-203 14-27-1/14-31-2 192/210 82-518/70-413 130/27 3/4Totals 444-276 238/200 111/85 105/98 22/17 461-2161/384-1690 214-361-6/196-350-14 2661/2613 822-4822/734-4303 746/418 12/25
VIRGINIA (7-3, 4-2 ACC) First Downs Rushing Passing Total Offense Return Opponent Score Total Rush Pass Pen Number-Yards Comp-Att-Int Yards Plays-Yards Yards TurnoversRICHMOND 42-13 25/9 17/1 8/8 0/0 48-301/19-34 14-26-1/12-29-2 191/191 74-492/48-225 33/96 1/2Indiana 16-20 15/21 7/12 6/7 2/2 39-188/44-237 12-25-0/16-22-1 106/150 64-294/66-387 70/34 1/1Ohio 45-31 23/13 8/4 14/9 1/0 31-173/30-118 25-30-0/16-31-0 379/246 61-552/61-364 62/147 3/2LOUISVILLE 27-3 20/14 9/3 10/11 1/0 39-204/29-66 17-26-1/16-28-2 197/148 65-401/57-214 87/77 1/3NC State 21-35 20/25 7/10 10/12 3/3 29-93/39-176 20-35-2/22-32-0 258/257 64-351/71-433 146/1 2/0MIAMI 16-13 18/16 12/6 3/9 3/1 41-143/29-149 12-21-3/15-29-3 92/190 62-235/58-339 187/73 3/3Duke 28-14 21/19 8/5 12/13 1/1 44-178/27-58 21-34-0/23-42-2 198/262 78-376/69-320 146/23 0/2NORTH CAROLINA 31-21 23/14 12/3 11/11 0/0 44-208/22-66 18-27-1/22-38-0 217/271 71-425/60-337 24/35 1/1PITT 13-23 13/16 6/12 6/1 1/3 26-44/42-254 17-24-0/7-14-0 205/61 50-249/56-315 92/40 1/0LIBERTY 45-24 24/20 15/10 8/10 1/0 39-221/44-205 14-22-1/15-27-3 168/149 61-389/71-354 208/123 1/3Totals 284-197 202/167 101/66 88/91 13/10 380-1753/325-1363 170-270-9/164-292-13 2011/1925 650-3764/617-3288 1055/649 14/17

2018 ACC FOOTBALL GAME PREVIEWS
15
2 0 1 8 T E A M - BY-T E A M STATS
VIRGINIA TECH (4-5, 3-3 ACC) First Downs Rushing Passing Total Offense Return Opponent Score Total Rush Pass Pen Number-Yards Comp-Att-Int Yards Plays-Yards Yards TurnoversFlorida State 24-3 15/12 7/3 8/8 0/1 40-112/28-94 16-26-0/22-35-3 207/233 66-319/63-327 32/25 0/5WILLIAM & MARY 62-17 32/12 16/1 14/10 2/1 46-305/29-34 16-23-0/18-30-0 281/232 69-586/59-266 125/0 1/2Old Dominion 35-49 26/30 15/7 11/19 0/4 49-318/34-137 17-34-1/30-50-0 282/495 83-600/84-632 58/-1 1/0Duke 31-14 17/18 4/6 13/12 0/0 41-81/36-71 17-28-0/25-39-1 332/256 69-413/75-327 65/20 0/1NOTRE DAME 23-45 25/19 6/6 18/12 1/1 33-132/32-167 31-52-1/25-35-1 309/271 85-441/67-438 131/46 2/1North Carolina 22-19 20/21 8/6 12/12 0/3 41-154/38-235 20-36-2/22-35-0 221/287 77-375/73-522 58/68 2/2GEORGIA TECH 28-49 16/35 7/31 8/0 1/4 25-122/78-465 15-22-0/0-1-0 201/0 47-323/79-465 140/0 1/0BOSTON COLLEGE 21-31 23/19 8/10 14/8 1/1 36-111/49-219 25-43-1/15-26-0 281/177 79-392/75-396 80/56 2/1Pitt 22-52 28/17 15/13 10/4 3/0 48-192/36-492 23-38-0/7-11-0 240/162 86-432/47-654 149/49 0/1Totals 268-279 202/183 86/83 108/85 8/15 359-1527/360-1914 180-302-5/164-262-5 2354/2113 661-3881/622-4027 838/263 9/13
WAKE FOREST (5-5, 2-4 ACC) First Downs Rushing Passing Total Offense Return Opponent Score Total Rush Pass Pen Number-Yards Comp-Att-Int Yards Plays-Yards Yards TurnoversTulane 23-17 32/20 10/9 20/8 2/3 43-154/42-155 31-51-2/18-37-0 378/281 94-532/79-436 47/43 3/1TOWSON 51-20 32/25 16/6 13/19 3/0 54-340/30-65 17-27-1/35-51-1 242/345 81-582/81-410 241/170 2/1BOSTON COLLEGE 34-41 27/19 16/9 10/9 1/1 60-298/44-220 20-45-2/16-25-0 214/304 105-512/69-524 143/140 2/1NOTRE DAME 27-56 27/28 15/15 9/11 3/2 61-259/40-241 16-31-1/25-36-0 139/325 92-398/76-566 84/78 1/1RICE 56-24 20/19 9/9 8/9 3/1 41-171/44-267 17-20-1/17-32-2 243/103 61-414/76-370 189/123 2/3CLEMSON 3-63 11/22 7/12 4/8 0/2 51-175/40-471 7-27-1/25-30-0 74/227 78-249/70-698 44/17 1/1Florida State 17-38 24/20 10/4 13/14 1/2 50-96/29-132 25-54-1/29-41-0 273/353 104-369/70-485 39/98 1/1Louisville 56-35 28/31 18/11 10/19 0/1 48-368/36-174 16-24-0/30-54-0 223/358 72-591/90-532 92/143 0/1SYRACUSE 24-41 26/25 10/15 12/7 4/3 44-159/60-264 21-37-1/23-35-0 275/157 81-434/95-421 51/20 3/0NC State 27-23 22/23 10/3 11/18 1/2 38-138/27-47 22-33-0/35-53-1 297/374 71-435/80-421 46/99 1/1Totals 318-358 249/232 121/93 110/122 18/17 490-2158/392-2036 192-349-10/253-394-4 2358/2827 839-4516/786-4863 976/931 16/11
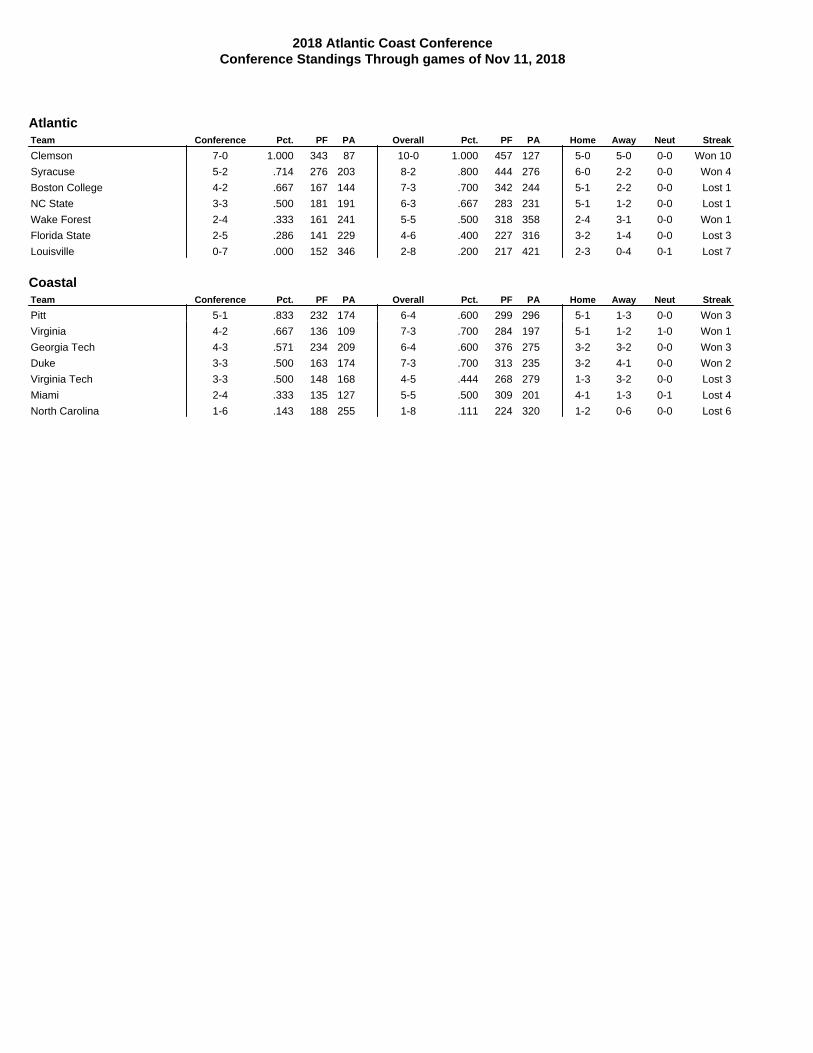
2018 Atlantic Coast ConferenceConference Standings Through games of Nov 11, 2018
AtlanticTeam Conference Pct. PF PA Overall Pct. PF PA Home Away Neut Streak
Clemson 7-0 1.000 343 87 10-0 1.000 457 127 5-0 5-0 0-0 Won 10
Syracuse 5-2 .714 276 203 8-2 .800 444 276 6-0 2-2 0-0 Won 4
Boston College 4-2 .667 167 144 7-3 .700 342 244 5-1 2-2 0-0 Lost 1
NC State 3-3 .500 181 191 6-3 .667 283 231 5-1 1-2 0-0 Lost 1
Wake Forest 2-4 .333 161 241 5-5 .500 318 358 2-4 3-1 0-0 Won 1
Florida State 2-5 .286 141 229 4-6 .400 227 316 3-2 1-4 0-0 Lost 3
Louisville 0-7 .000 152 346 2-8 .200 217 421 2-3 0-4 0-1 Lost 7
CoastalTeam Conference Pct. PF PA Overall Pct. PF PA Home Away Neut Streak
Pitt 5-1 .833 232 174 6-4 .600 299 296 5-1 1-3 0-0 Won 3
Virginia 4-2 .667 136 109 7-3 .700 284 197 5-1 1-2 1-0 Won 1
Georgia Tech 4-3 .571 234 209 6-4 .600 376 275 3-2 3-2 0-0 Won 3
Duke 3-3 .500 163 174 7-3 .700 313 235 3-2 4-1 0-0 Won 2
Virginia Tech 3-3 .500 148 168 4-5 .444 268 279 1-3 3-2 0-0 Lost 3
Miami 2-4 .333 135 127 5-5 .500 309 201 4-1 1-3 0-1 Lost 4
North Carolina 1-6 .143 188 255 1-8 .111 224 320 1-2 0-6 0-0 Lost 6

2018 Atlantic Coast ConferenceTeam Statistics Through games of Nov 11, 2018
SCORING OFFENSE G TD FG XPT 2XP DXP Saf Pts Avg/G
1. Clemson 10 61 10 61 0 0 0 457 45.72. Syracuse 10 52 27 51 0 0 0 444 44.43. Georgia Tech 10 52 5 49 0 0 0 376 37.64. Boston College 10 47 6 40 1 0 0 342 34.25. Wake Forest 10 40 13 39 0 0 0 318 31.86. NC State 9 33 17 32 1 0 0 283 31.47. Duke 10 42 7 40 0 0 0 313 31.38. Miami 10 42 6 39 0 0 0 309 30.99. Pitt 10 39 9 34 1 0 1 299 29.9
10. Virginia Tech 9 35 7 33 2 0 0 268 29.811. Virginia 10 35 12 34 1 1 0 284 28.412. North Carolina 9 25 16 24 1 0 0 224 24.913. Florida State 10 29 8 27 1 0 0 227 22.714. Louisville 10 28 8 25 0 0 0 217 21.7
SCORING DEFENSE G TD FG XPT 2XP DXP Saf Pts Avg/G
1. Clemson 10 15 8 13 0 0 0 127 12.72. Virginia 10 24 10 21 1 0 0 197 19.73. Miami 10 21 18 21 0 0 0 201 20.14. Duke 10 31 6 25 2 0 1 235 23.55. Boston College 10 33 5 31 0 0 0 244 24.46. NC State 9 28 12 27 0 0 0 231 25.77. Georgia Tech 10 37 5 36 1 0 0 275 27.58. Syracuse 10 34 13 33 0 0 0 276 27.69. Pitt 10 38 10 34 1 0 1 296 29.6
10. Virginia Tech 9 36 9 36 0 0 0 279 31.011. Florida State 10 39 15 35 0 1 0 316 31.612. North Carolina 9 42 9 39 1 0 0 320 35.613. Wake Forest 10 48 8 46 0 0 0 358 35.814. Louisville 10 56 10 55 0 0 0 421 42.1
TOTAL OFFENSE G Rush Pass Plays Yards Avg/P TD Avg/G
1. Clemson 10 2517 2749 709 5266 7.4 58 526.62. Syracuse 10 2161 2661 822 4822 5.9 50 482.23. NC State 9 1120 2957 673 4077 6.1 32 453.04. Wake Forest 10 2158 2358 839 4516 5.4 34 451.65. Georgia Tech 10 3624 884 695 4508 6.5 49 450.86. Virginia Tech 9 1527 2354 661 3881 5.9 34 431.27. North Carolina 9 1674 2106 664 3780 5.7 23 420.08. Duke 10 1742 2456 724 4198 5.8 41 419.89. Boston College 10 2039 2035 739 4074 5.5 42 407.4
10. Pitt 10 2569 1394 613 3963 6.5 35 396.311. Miami 10 1907 1904 673 3811 5.7 38 381.112. Virginia 10 1753 2011 650 3764 5.8 34 376.413. Florida State 10 798 2765 707 3563 5.0 27 356.314. Louisville 10 1218 2322 688 3540 5.1 26 354.0
TOTAL DEFENSE G Rush Pass Plays Yards Avg/P TD Avg/G
1. Clemson 10 823 1713 664 2536 3.8 13 253.62. Miami 10 1343 1343 643 2686 4.2 19 268.63. Virginia 10 1363 1925 617 3288 5.3 23 328.84. Georgia Tech 10 1383 2180 627 3563 5.7 33 356.35. Boston College 10 1495 2316 767 3811 5.0 28 381.16. NC State 9 871 2748 610 3619 5.9 26 402.17. Florida State 10 1365 2673 788 4038 5.1 38 403.88. Duke 10 2120 1937 734 4057 5.5 29 405.79. Pitt 10 1720 2449 705 4169 5.9 37 416.9
10. Syracuse 10 1690 2613 734 4303 5.9 32 430.311. Virginia Tech 9 1914 2113 622 4027 6.5 35 447.412. North Carolina 9 2068 2017 676 4085 6.0 38 453.913. Louisville 10 2823 1860 695 4683 6.7 50 468.314. Wake Forest 10 2036 2827 786 4863 6.2 48 486.3
RUSHING OFFENSE G Att. Yards Avg/A Long TD Avg/G
1. Georgia Tech 10 603 3624 6.0 65 43 362.42. Pitt 10 396 2569 6.5 97 26 256.93. Clemson 10 374 2517 6.7 70 32 251.74. Syracuse 10 461 2161 4.7 68 32 216.15. Wake Forest 10 490 2158 4.4 74 15 215.86. Boston College 10 477 2039 4.3 74 21 203.97. Miami 10 392 1907 4.9 83 21 190.78. North Carolina 9 317 1674 5.3 84 13 186.09. Virginia 10 380 1753 4.6 75 16 175.3
10. Duke 10 372 1742 4.7 75 16 174.211. Virginia Tech 9 359 1527 4.3 87 13 169.712. NC State 9 325 1120 3.4 39 15 124.413. Louisville 10 335 1218 3.6 61 16 121.814. Florida State 10 321 798 2.5 85 9 79.8
RUSHING DEFENSE G Att. Yards Avg/A Long TD Avg/G
1. Clemson 10 397 823 2.1 53 7 82.32. NC State 9 272 871 3.2 28 10 96.83. Miami 10 397 1343 3.4 75 10 134.34. Virginia 10 325 1363 4.2 75 12 136.35. Florida State 10 402 1365 3.4 58 12 136.56. Georgia Tech 10 324 1383 4.3 46 17 138.37. Boston College 10 399 1495 3.7 75 15 149.58. Syracuse 10 384 1690 4.4 75 17 169.09. Pitt 10 390 1720 4.4 60 16 172.0
10. Wake Forest 10 392 2036 5.2 70 27 203.611. Duke 10 424 2120 5.0 84 19 212.012. Virginia Tech 9 360 1914 5.3 97 24 212.713. North Carolina 9 395 2068 5.2 68 21 229.814. Louisville 10 471 2823 6.0 74 32 282.3
PASS OFFENSE G Comp-Att-Int Pct. Yds Avg/A TD Avg/G
1. NC State 9 235-348-7 67.5 2957 8.5 17 328.62. Florida State 10 227-386-9 58.8 2765 7.2 18 276.53. Clemson 10 221-335-8 66.0 2749 8.2 26 274.94. Syracuse 10 214-361-6 59.3 2661 7.4 18 266.15. Virginia Tech 9 180-302-5 59.6 2354 7.8 21 261.66. Duke 10 205-352-6 58.2 2456 7.0 25 245.67. Wake Forest 10 192-349-10 55.0 2358 6.8 19 235.88. North Carolina 9 205-347-11 59.1 2106 6.1 10 234.09. Louisville 10 189-353-14 53.5 2322 6.6 10 232.2
10. Boston College 10 160-262-5 61.1 2035 7.8 21 203.511. Virginia 10 170-270-9 63.0 2011 7.4 18 201.112. Miami 10 149-281-10 53.0 1904 6.8 17 190.413. Pitt 10 129-217-5 59.4 1394 6.4 9 139.414. Georgia Tech 10 45-92-4 48.9 884 9.6 6 88.4
PASS DEFENSE G Comp-Att-Int Pct. Yds Avg/A TD Avg/G
1. Miami 10 130-246-13 52.8 1343 5.5 9 134.32. Clemson 10 139-267-7 52.1 1713 6.4 6 171.33. Louisville 10 139-224-4 62.1 1860 8.3 18 186.04. Virginia 10 164-292-13 56.2 1925 6.6 11 192.55. Duke 10 165-310-3 53.2 1937 6.2 10 193.76. Georgia Tech 10 191-303-12 63.0 2180 7.2 16 218.07. North Carolina 9 161-281-6 57.3 2017 7.2 17 224.18. Boston College 10 211-368-15 57.3 2316 6.3 13 231.69. Virginia Tech 9 164-262-5 62.6 2113 8.1 11 234.8
10. Pitt 10 190-315-7 60.3 2449 7.8 21 244.911. Syracuse 10 196-350-14 56.0 2613 7.5 15 261.312. Florida State 10 212-386-10 54.9 2673 6.9 26 267.313. Wake Forest 10 253-394-4 64.2 2827 7.2 21 282.714. NC State 9 212-338-5 62.7 2748 8.1 16 305.3

2018 Atlantic Coast ConferenceTeam Statistics Through games of Nov 11, 2018
PASS EFFICIENCY G Comp-Att-Int Pct. Yds Avg/G TD Effic.
1. Clemson 10 221-335-8 66.0 2749 274.9 26 155.72. NC State 9 235-348-7 67.5 2957 328.6 17 151.03. Boston College 10 160-262-5 61.1 2035 203.5 21 148.94. Virginia Tech 9 180-302-5 59.6 2354 261.6 21 144.75. Georgia Tech 10 45-92-4 48.9 884 88.4 6 142.56. Virginia 10 170-270-9 63.0 2011 201.1 18 140.97. Duke 10 205-352-6 58.2 2456 245.6 25 136.98. Syracuse 10 214-361-6 59.3 2661 266.1 18 134.39. Florida State 10 227-386-9 58.8 2765 276.5 18 129.7
10. Wake Forest 10 192-349-10 55.0 2358 235.8 19 124.011. Miami 10 149-281-10 53.0 1904 190.4 17 122.812. Pitt 10 129-217-5 59.4 1394 139.4 9 122.513. North Carolina 9 205-347-11 59.1 2106 234.0 10 113.214. Louisville 10 189-353-14 53.5 2322 232.2 10 110.2
PASS DEFENSE EFFIC. G Comp-Att-Int Pct. Yds Avg/G TD Effic.
1. Miami 10 130-246-13 52.8 1343 134.3 9 100.22. Clemson 10 139-267-7 52.1 1713 171.3 6 108.13. Boston College 10 211-368-15 57.3 2316 231.6 13 113.74. Duke 10 165-310-3 53.2 1937 193.7 10 114.45. Virginia 10 164-292-13 56.2 1925 192.5 11 115.16. Syracuse 10 196-350-14 56.0 2613 261.3 15 124.97. Florida State 10 212-386-10 54.9 2673 267.3 26 130.18. Georgia Tech 10 191-303-12 63.0 2180 218.0 16 133.09. North Carolina 9 161-281-6 57.3 2017 224.1 17 133.3
10. Wake Forest 10 253-394-4 64.2 2827 282.7 21 140.011. Virginia Tech 9 164-262-5 62.6 2113 234.8 11 140.412. Pitt 10 190-315-7 60.3 2449 244.9 21 143.213. NC State 9 212-338-5 62.7 2748 305.3 16 143.714. Louisville 10 139-224-4 62.1 1860 186.0 18 154.8
KICKOFF RETURNS G No. Yards TD Long Avg.
1. Pitt 10 20 525 2 99 26.22. Virginia 10 26 664 1 90 25.53. Clemson 10 13 327 0 43 25.24. Miami 10 26 619 0 53 23.85. Louisville 10 38 873 1 93 23.06. Boston College 10 39 884 0 60 22.77. Virginia Tech 9 32 716 0 51 22.48. North Carolina 9 24 507 0 34 21.19. NC State 9 15 316 0 47 21.1
10. Duke 10 23 463 0 46 20.111. Wake Forest 10 22 441 0 38 20.012. Florida State 10 30 583 0 35 19.413. Georgia Tech 10 21 397 0 38 18.914. Syracuse 10 19 356 0 26 18.7
PUNT RETURN AVG G No. Yards TD Long Avg.
1. Miami 10 14 252 1 49 18.02. Louisville 10 12 197 1 55 16.43. Syracuse 10 20 310 2 69 15.54. Boston College 10 20 300 3 74 15.05. Florida State 10 19 242 1 74 12.76. North Carolina 9 15 191 1 75 12.77. Wake Forest 10 28 333 3 70 11.98. NC State 9 8 77 0 40 9.69. Pitt 10 13 119 1 86 9.2
10. Clemson 10 31 273 1 62 8.811. Georgia Tech 10 12 91 0 25 7.612. Virginia 10 28 207 0 43 7.413. Virginia Tech 9 22 123 1 20 5.614. Duke 10 21 115 0 32 5.5
INTERCEPTIONS G No. Yards TD Long Avg.
1. Boston College 10 15 241 2 81 16.12. Syracuse 10 14 73 0 39 5.23. Miami 10 13 200 2 83 15.44. Virginia 10 13 165 0 62 12.75. Georgia Tech 10 12 231 2 95 19.26. Florida State 10 10 122 1 63 12.27. Clemson 10 7 180 1 46 25.78. Pitt 10 7 123 0 79 17.69. North Carolina 9 6 38 0 19 6.3
10. Virginia Tech 9 5 9 0 5 1.811. NC State 9 5 58 1 57 11.612. Louisville 10 4 59 0 34 14.813. Wake Forest 10 4 111 1 60 27.814. Duke 10 3 68 1 53 22.7
PUNTING G No. Yards Avg/P Ret. Avg/R TB Net/P
1. Georgia Tech 10 24 1086 45.2 32 1.3 2 42.22. Syracuse 10 50 2202 44.0 116 2.3 3 40.53. Virginia Tech 9 47 2010 42.8 100 2.1 3 39.44. North Carolina 9 43 1737 40.4 56 1.3 0 39.15. Virginia 10 39 1618 41.5 22 0.6 5 38.46. Wake Forest 10 61 2502 41.0 197 3.2 3 36.87. NC State 9 31 1265 40.8 76 2.5 3 36.48. Florida State 10 68 2861 42.1 333 4.9 4 36.09. Pitt 10 42 1672 39.8 130 3.1 2 35.8
10. Clemson 10 41 1614 39.4 109 2.7 2 35.711. Duke 10 49 1959 40.0 195 4.0 2 35.212. Louisville 10 59 2362 40.0 251 4.3 2 35.113. Boston College 10 62 2371 38.2 257 4.1 2 33.514. Miami 10 45 1694 37.6 213 4.7 1 32.5
KICKOFF COVERAGE G No. Yards Avg. Ret. TB NetAvg
1. Boston College 10 60 3689 61.5 836 11 43.02. Syracuse 10 85 5109 60.1 245 53 41.63. North Carolina 9 44 2780 63.2 387 23 41.34. Virginia 10 55 3508 63.8 460 33 40.45. Clemson 10 81 5094 62.9 462 55 40.26. Duke 10 58 3313 57.1 567 17 40.07. Virginia Tech 9 50 3242 64.8 100 46 39.88. Pitt 10 58 3591 61.9 492 32 39.69. Louisville 10 45 2623 58.3 567 11 39.6
10. NC State 9 55 3218 58.5 629 17 39.311. Miami 10 57 3504 61.5 492 32 38.812. Florida State 10 44 2685 61.0 219 31 38.413. Wake Forest 10 62 3776 60.9 712 28 38.114. Georgia Tech 10 66 3948 59.8 1123 16 36.7
FIELD GOALS G Made Att Pct.
1. Syracuse 10 27 29 . 9 3 12. Louisville 10 8 9 . 8 8 93. Boston College 10 6 7 . 8 5 74. NC State 9 17 20 . 8 5 05. Wake Forest 10 13 16 . 8 1 26. Pitt 10 9 12 . 7 5 07. Clemson 10 10 14 . 7 1 48. Virginia 10 12 17 . 7 0 69. Duke 10 7 10 . 7 0 0
10. North Carolina 9 16 23 . 6 9 611. Miami 10 6 9 . 6 6 712. Virginia Tech 9 7 11 . 6 3 613. Georgia Tech 10 5 8 . 6 2 514. Florida State 10 8 13 . 6 1 5

2018 Atlantic Coast ConferenceTeam Statistics Through games of Nov 11, 2018
PAT KICKING G Made Att Pct.
1. Clemson 10 61 61 1.000Syracuse 10 51 51 1.000Wake Forest 10 39 39 1.000Virginia 10 34 34 1.000Virginia Tech 9 33 33 1.000NC State 9 32 32 1.000North Carolina 9 24 24 1.000
8. Florida State 10 27 28 . 9 6 49. Georgia Tech 10 49 51 . 9 6 1
10. Duke 10 40 42 . 9 5 211. Miami 10 39 41 . 9 5 112. Pitt 10 34 36 . 9 4 413. Louisville 10 25 28 . 8 9 314. Boston College 10 40 45 . 8 8 9
SACKS BY G No. Yards Avg/G
1. Clemson 10 36 216 3.602. Syracuse 10 33 219 3.303. NC State 9 29 166 3.22
Boston College 10 29 181 2.905. Miami 10 27 158 2.706. North Carolina 9 26 168 2.897. Pitt 10 25 181 2.50
Florida State 10 25 185 2.509. Virginia 10 21 130 2.10
10. Virginia Tech 9 20 126 2.2211. Duke 10 19 113 1.9012. Wake Forest 10 18 102 1.8013. Georgia Tech 10 13 87 1.3014. Louisville 10 9 62 0.90
SACKS AGAINST G No. Yards Avg/G
1. NC State 9 5 31 0.562. North Carolina 9 9 62 1.003. Georgia Tech 10 11 66 1.104. Clemson 10 13 90 1.305. Boston College 10 18 110 1.806. Virginia Tech 9 19 123 2.117. Pitt 10 20 148 2.008. Duke 10 21 138 2.109. Miami 10 22 152 2.20
10. Syracuse 10 24 156 2.4011. Virginia 10 26 177 2.6012. Wake Forest 10 28 162 2.8013. Florida State 10 29 204 2.9014. Louisville 10 38 221 3.80
FIRST DOWNS G Rush Pass Pen Total Avg/G
1. Wake Forest 10 121 110 18 249 24.92. Syracuse 10 111 105 22 238 23.83. Georgia Tech 10 189 32 16 237 23.74. Clemson 10 104 118 12 234 23.45. NC State 9 65 129 23 217 24.16. Duke 10 90 108 14 212 21.27. Virginia 10 101 88 13 202 20.2
Virginia Tech 9 86 108 8 202 22.49. Louisville 10 77 103 16 196 19.6
10. Boston College 10 102 83 10 195 19.511. Miami 10 100 75 12 187 18.712. North Carolina 9 83 93 9 185 20.613. Pitt 10 119 51 12 182 18.214. Florida State 10 47 112 14 173 17.3
OPPONENT 1ST DOWNS G Rush Pass Pen Total Avg/G
1. Clemson 10 54 68 16 138 13.82. Miami 10 78 60 14 152 15.23. Virginia 10 66 91 10 167 16.74. NC State 9 54 110 17 181 20.15. Virginia Tech 9 83 85 15 183 20.36. Georgia Tech 10 85 98 11 194 19.47. Duke 10 100 88 11 199 19.98. Syracuse 10 85 98 17 200 20.09. North Carolina 9 102 88 13 203 22.6
10. Boston College 10 84 111 14 209 20.911. Florida State 10 84 111 23 218 21.812. Louisville 10 130 79 12 221 22.113. Pitt 10 98 103 26 227 22.714. Wake Forest 10 93 122 17 232 23.2
3RD-DOWN CONVERSIONS G Conv. Att. Pct.
1. NC State 9 60 125 48.02. Virginia 10 63 132 47.73. Georgia Tech 10 55 119 46.24. Clemson 10 58 130 44.65. Miami 10 60 139 43.26. Duke 10 65 152 42.87. Wake Forest 10 74 180 41.18. Pitt 10 47 116 40.59. Syracuse 10 63 158 39.9
10. Virginia Tech 9 54 136 39.711. Louisville 10 54 143 37.812. North Carolina 9 49 141 34.813. Boston College 10 51 153 33.314. Florida State 10 49 158 31.0
OPP 3RD-DN CONVERT G Conv. Att. Pct.
1. Miami 10 38 146 26.02. Syracuse 10 39 149 26.23. Clemson 10 43 159 27.04. Florida State 10 61 166 36.75. Boston College 10 59 160 36.96. NC State 9 46 124 37.17. Duke 10 56 149 37.68. Virginia Tech 9 47 124 37.99. Virginia 10 54 132 40.9
10. Wake Forest 10 69 167 41.311. North Carolina 9 60 133 45.112. Pitt 10 65 144 45.113. Georgia Tech 10 60 121 49.614. Louisville 10 70 140 50.0
4TH-DOWN CONVERSIONS G Conv. Att. Pct.
1. Virginia 10 7 12 58.3NC State 9 7 12 58.3
3. Virginia Tech 9 12 21 57.14. Syracuse 10 9 16 56.25. Wake Forest 10 12 22 54.56. Georgia Tech 10 11 21 52.47. Boston College 10 11 22 50.0
North Carolina 9 9 18 50.0Pitt 10 6 12 50.0
10. Florida State 10 10 21 47.611. Clemson 10 6 13 46.212. Miami 10 9 21 42.913. Louisville 10 8 20 40.014. Duke 10 9 24 37.5

2018 Atlantic Coast ConferenceTeam Statistics Through games of Nov 11, 2018
OPP 4TH-DN CONVERT G Conv. Att. Pct.
1. Clemson 10 4 15 26.72. Florida State 10 8 20 40.03. Virginia Tech 9 7 15 46.74. Virginia 10 8 17 47.15. Duke 10 10 21 47.66. Miami 10 5 10 50.0
Boston College 10 13 26 50.0Wake Forest 10 11 22 50.0NC State 9 10 20 50.0Syracuse 10 9 18 50.0
11. Pitt 10 11 21 52.412. Georgia Tech 10 7 13 53.813. North Carolina 9 9 16 56.214. Louisville 10 7 12 58.3
PENALTIES G No. Yards Avg/G
1. Duke 10 41 345 34.52. Virginia 10 45 401 40.13. Georgia Tech 10 42 402 40.24. Clemson 10 45 423 42.35. Wake Forest 10 43 453 45.36. Miami 10 58 496 49.67. Boston College 10 64 500 50.08. NC State 9 48 461 51.29. Virginia Tech 9 51 476 52.9
10. North Carolina 9 56 487 54.111. Syracuse 10 70 543 54.312. Louisville 10 77 659 65.913. Pitt 10 67 671 67.114. Florida State 10 93 735 73.5
OPPONENT PENALTIES G No. Yards Avg/G
1. Syracuse 10 80 629 62.92. Duke 10 56 568 56.83. NC State 9 64 495 55.04. Louisville 10 58 534 53.45. Wake Forest 10 59 524 52.46. Florida State 10 57 518 51.87. Clemson 10 64 515 51.58. Virginia 10 56 508 50.89. Miami 10 48 461 46.1
10. Pitt 10 55 445 44.511. North Carolina 9 45 362 40.212. Georgia Tech 10 46 384 38.413. Boston College 10 47 354 35.414. Virginia Tech 9 43 291 32.3
TIME OF POSSESSION G Total possession Avg/G
1. Georgia Tech 10 345:02 34:302. NC State 9 295:46 32:513. Virginia 10 323:39 32:214. Pitt 10 312:33 31:155. Virginia Tech 9 271:40 30:116. Miami 10 301:44 30:107. Louisville 10 301:12 30:078. Syracuse 10 300:34 30:039. Clemson 10 282:19 28:13
10. Wake Forest 10 279:46 27:58Boston College 10 279:40 27:58
12. Florida State 10 279:11 27:5513. North Carolina 9 250:54 27:5214. Duke 10 272:39 27:15
TURNOVER MARGINGained Lost
Fum Int Tot Fum Int Tot Margin Per/G
1. Syracuse 10 11 14 25 6 6 12 +13 1.302. Boston College 10 8 15 23 8 5 13 +10 1.003. Georgia Tech 10 11 12 23 12 4 16 +7 0.704. Virginia Tech 9 8 5 13 4 5 9 +4 0.445. Virginia 10 4 13 17 5 9 14 +3 0.306. Pitt 10 7 7 14 7 5 12 +2 0.207. Miami 10 7 13 20 9 10 19 +1 0.10
Clemson 10 9 7 16 7 8 15 +1 0.109. NC State 9 7 5 12 5 7 12 +0 0.00
10. Duke 10 8 3 11 7 6 13 -2 -0.2011. Wake Forest 10 7 4 11 6 10 16 -5 -0.5012. North Carolina 9 8 6 14 8 11 19 -5 -0.5613. Florida State 10 3 10 13 12 9 21 -8 -0.8014. Louisville 10 7 4 11 9 14 23 -12 -1.20
RED ZONE OFFENSE G Scores Pct. TDs (R-P) FGs TurnO
1. Virginia Tech 9 25-27 92.6 20 10-10 5-5 02. Clemson 10 45-49 91.8 37 21-16 8-10 13. Syracuse 10 56-63 88.9 37 28-9 19-19 24. Boston College 10 30-34 88.2 25 16-9 5-5 25. North Carolina 9 29-33 87.9 18 10-8 11-14 16. Louisville 10 26-30 86.7 21 15-6 5-5 27. NC State 9 41-48 85.4 26 14-12 15-17 28. Miami 10 34-40 85.0 28 16-12 6-7 09. Duke 10 31-38 81.6 24 12-12 7-8 3
10. Wake Forest 10 37-46 80.4 26 12-14 11-14 311. Georgia Tech 10 41-51 80.4 37 36-1 4-4 312. Pitt 10 22-29 75.9 19 16-3 3-5 213. Virginia 10 30-40 75.0 21 11-10 9-13 114. Florida State 10 19-26 73.1 16 8-8 3-4 1
RED ZONE DEFENSE G Scores Pct. TDs (R-P) FGs TurnO
1. Clemson 10 17-23 73.9 11 7-4 6-7 12. Duke 10 20-27 74.1 16 13-3 4-7 03. Boston College 10 28-37 75.7 23 14-9 5-8 34. NC State 9 25-33 75.8 16 9-7 9-11 45. Syracuse 10 29-36 80.6 21 13-8 8-9 46. Virginia Tech 9 30-37 81.1 22 17-5 8-11 37. Pitt 10 31-38 81.6 23 12-11 8-9 28. North Carolina 9 32-39 82.1 25 16-9 7-8 29. Georgia Tech 10 25-30 83.3 21 14-7 4-4 4
10. Florida State 10 42-49 85.7 29 10-19 13-15 111. Miami 10 25-29 86.2 13 7-6 12-14 012. Virginia 10 21-24 87.5 14 9-5 7-8 1
Louisville 10 42-48 87.5 35 26-9 7-10 114. Wake Forest 10 30-32 93.8 25 16-9 5-6 0
ON-SIDE KICKS BY G Recovered Attempts Success%
1. Duke 10 1 1 100.0Virginia 10 1 1 100.0
3. North Carolina 9 0 3 0.0Boston College 10 0 2 0.0Florida State 10 0 1 0.0Georgia Tech 10 0 1 0.0NC State 9 0 1 0.0Virginia Tech 9 0 1 0.0Wake Forest 10 0 0 0.0Louisville 10 0 0 0.0Miami 10 0 0 0.0Pitt 10 0 0 0.0Syracuse 10 0 0 0.0Clemson 10 0 0 0.0

2018 Atlantic Coast ConferenceTeam Statistics Through games of Nov 11, 2018
ON-SIDE KICKS AGAINST G Recovered Attempts Success%
1. Duke 10 0 2 0.0Clemson 10 0 2 0.0Pitt 10 0 1 0.0Syracuse 10 0 1 0.0Florida State 10 0 0 0.0Georgia Tech 10 0 0 0.0Virginia Tech 9 0 0 0.0Wake Forest 10 0 0 0.0Louisville 10 0 0 0.0Boston College 10 0 0 0.0North Carolina 9 0 0 0.0
12. Virginia 10 1 2 50.0Miami 10 1 2 50.0NC State 9 1 2 50.0
ATTENDANCE Home Away Neutral TotalBoston College 6-38504 4-48825 0-0 10-42633Clemson 5-80010 5-59980 0-0 10-69995Duke 5-27819 5-43414 0-0 10-35616Florida State 5-69757 5-58193 0-0 10-63975Georgia Tech 5-44196 5-45308 0-0 10-44752Louisville 5-50700 4-46866 1-57280 10-49824Miami 5-61842 4-40810 1-68841 10-54129NC State 6-56793 3-51471 0-0 9-55019North Carolina 3-45150 6-42690 0-0 9-43510Pitt 6-41696 4-50738 0-0 10-45313Syracuse 6-37043 4-40996 0-0 10-38625Virginia 6-39705 3-37790 1-5438 10-35704Virginia Tech 4-65632 5-44569 0-0 9-53930Wake Forest 6-27047 4-47146 0-0 10-35087Totals 73-48142 61-47258 3-43853 137-47654

2018 Atlantic Coast ConferenceIndividual Statistics Through games of Nov 11, 2018
RUSHING Cl G Att. Yds Avg. TD Lg Avg/G
1. AJ Dillon-BC So 8 178 936 5.3 8 74 117.02. Travis Etienne-CU So 10 127 1076 8.5 15 70 107.63. Qadree Ollison-UP Sr 10 149 1054 7.1 10 97 105.44. Tobias Oliver-GT Fr 9 133 781 5.9 12 65 86.85. Darrin Hall-UP Sr 10 96 844 8.8 8 75 84.46. Jordan Ellis-VA Sr 10 165 835 5.1 8 75 83.57. TaQuon Marshall-GT Sr 9 159 751 4.7 11 45 83.48. Michael Carter-NC So 7 77 550 7.1 2 49 78.69. Travis Homer-UM Jr 10 134 732 5.5 3 70 73.2
10. Deon Jackson-DU So 10 132 725 5.5 7 75 72.5
PASSING AVG/GAME Cl G Comp-Att-Int Yds TD Avg/G
1. Ryan Finley-ST Sr 9 233-344-7 2864 17 318.22. Deondre Francois-FS Jr 9 194-328-8 2255 13 250.63. Daniel Jones-DU Jr 8 166-272-6 1948 16 243.54. Ryan Willis-VT Jr 8 143-238-4 1770 16 221.25. Sam Hartman-WF Fr 9 161-291-8 1984 16 220.46. Eric Dungey-SU Sr 10 183-303-5 2193 14 219.37. Nathan Elliott-NC Jr 9 183-301-7 1861 9 206.88. Bryce Perkins-VA Jr 10 168-263-9 1996 18 199.69. Jawon Pass-UL So 10 157-289-11 1918 8 191.8
10. Trevor Lawrence-CU Fr 10 152-228-4 1844 19 184.4
PASS EFFICIENCY Cl G Comp-Att-Int Yds TD Eff.
1. Trevor Lawrence-CU Fr 10 152-228-4 1844 19 158.62. Ryan Finley-ST Sr 9 233-344-7 2864 17 149.93. Bryce Perkins-VA Jr 10 168-263-9 1996 18 143.44. Ryan Willis-VT Jr 8 143-238-4 1770 16 141.45. Anthony Brown-BC So 10 123-212-5 1573 16 140.56. Daniel Jones-DU Jr 8 166-272-6 1948 16 136.27. Eric Dungey-SU Sr 10 183-303-5 2193 14 133.18. Sam Hartman-WF Fr 9 161-291-8 1984 16 125.29. Deondre Francois-FS Jr 9 194-328-8 2255 13 125.1
10. Kenny Pickett-UP So 10 128-213-5 1379 9 123.7
RECEPTIONS/GAME Cl G No. Yds TD Lg Yds/G Rec/G
1. Jakobi Meyers-ST Jr 8 62 658 2 39 82.2 7.82. Greg Dortch-WF So 10 75 921 7 54 92.1 7.53. Kelvin Harmon-ST Jr 9 65 965 5 74 107.2 7.24. Olamide Zaccheaus-VA Sr 10 67 807 6 86 80.7 6.75. Sean Riley-SU Jr 10 54 603 2 49 60.3 5.46. T.J. Rahming-DU Sr 10 53 518 6 48 51.8 5.37. Nyqwan Murray-FS Sr 10 48 650 3 58 65.0 4.88. Damon Hazelton-VT So 9 40 687 8 72 76.3 4.49. Jamal Custis-SU Sr 10 42 748 5 68 74.8 4.2
Johnathan Lloyd-DU Sr 10 42 545 5 68 54.5 4.2
RECEIVE YDS/GAME Cl G No. Yds TD Lg Avg/C Yds/G
1. Kelvin Harmon-ST Jr 9 65 965 5 74 14.8107.22. Greg Dortch-WF So 10 75 921 7 54 12.3 92.13. Jakobi Meyers-ST Jr 8 62 658 2 39 10.6 82.24. Olamide Zaccheaus-VA Sr 10 67 807 6 86 12.0 80.75. Damon Hazelton-VT So 9 40 687 8 72 17.2 76.36. Jamal Custis-SU Sr 10 42 748 5 68 17.8 74.87. Nyqwan Murray-FS Sr 10 48 650 3 58 13.5 65.08. Sean Riley-SU Jr 10 54 603 2 49 11.2 60.39. Anthony Ratliff-NC Jr 9 36 529 2 44 14.7 58.8
10. Nykeim Johnson-SU So 9 33 527 4 82 16.0 58.6
TOTAL OFFENSE Cl G Rush Pass Plays Total Yds/G
1. Ryan Finley-ST Sr 9 30 2864 372 2894 321.62. Eric Dungey-SU Sr 10 690 2193 450 2883 288.33. Daniel Jones-DU Jr 8 327 1948 352 2275 284.44. Bryce Perkins-VA Jr 10 657 1996 420 2653 265.35. Ryan Willis-VT Jr 8 282 1770 311 2052 256.56. Sam Hartman-WF Fr 9 275 1984 398 2259 251.07. Deondre Francois-FS Jr 9 -51 2255 385 2204 244.98. Nathan Elliott-NC Jr 9 29 1861 338 1890 210.09. Jawon Pass-UL So 10 90 1918 363 2008 200.8
10. Trevor Lawrence-CU Fr 10 58 1844 265 1902 190.2
SCORING Cl G TD FG XPT 2XP Pts Pts/G
1. Andre Szmyt-SU Fr 10 0 27 51 0 132 13.22. Travis Etienne-CU So 10 16 0 0 0 96 9.63. Christopher Dunn-ST Fr 9 0 17 32 0 83 9.24. Freeman Jones-NC Sr 9 0 16 24 0 72 8.0
Tobias Oliver-GT Fr 9 12 0 0 0 72 8.06. Nick Sciba-WF Fr 10 0 13 38 0 77 7.77. Greg Huegel-CU Sr 10 0 9 49 0 76 7.68. TaQuon Marshall-GT Sr 9 11 0 0 0 66 7.39. Eric Dungey-SU Sr 10 12 0 0 0 72 7.2
10. AJ Dillon-BC So 8 9 0 0 0 54 6.8
SCORING (TDs) Cl G TD Run Pass Ret Pat Pts Avg/G
1. Travis Etienne-CU So 10 16 15 1 0 0 96 9.62. Tobias Oliver-GT Fr 9 12 12 0 0 0 72 8.03. TaQuon Marshall-GT Sr 9 11 11 0 0 0 66 7.34. Eric Dungey-SU Sr 10 12 12 0 0 0 72 7.25. AJ Dillon-BC So 8 9 8 1 0 0 54 6.86. Reggie Gallaspy-ST Sr 9 9 9 0 0 0 54 6.0
Qadree Ollison-UP Sr 10 10 10 0 0 0 60 6.08. Damon Hazelton-VT So 9 8 0 8 0 1 50 5.69. Maurice Ffrench-UP Jr 10 9 2 5 2 0 54 5.4
Greg Dortch-WF So 10 9 0 7 2 0 54 5.4
SCORING (KICK) Cl G PAT FG Pts Avg/G
1. Andre Szmyt-SU Fr 10 51-51 27-29 132 13.22. Christopher Dunn-ST Fr 9 32-32 17-20 83 9.23. Freeman Jones-NC Sr 9 24-24 16-23 72 8.04. Nick Sciba-WF Fr 10 38-38 13-16 77 7.75. Greg Huegel-CU Sr 10 49-49 9-12 76 7.66. Alex Kessman-UP So 10 34-36 9-12 61 6.1
Collin Wareham-DU Sr 10 40-42 7-10 61 6.18. Brian Johnson-VT So 9 29-29 7-11 50 5.69. Bubba Baxa-UM Fr 10 37-38 6-9 55 5.5
10. Ricky Aguayo-FS Jr 10 27-28 8-13 51 5.1
PUNT RETURN AVG Cl G No. Yds TD Long Avg/G
1. Greg Dortch-WF So 10 22 253 2 70 11.52. Amari Rodgers-CU So 10 28 272 1 62 9.7
KICK RETURN AVG Cl G No. Yds TD Long Avg/G
1. Joe Reed-VA Jr 10 20 557 1 90 27.92. Michael Walker-BC Sr 10 32 793 0 60 24.83. Hassan Hall-UL Fr 10 30 739 1 93 24.64. Anthony Ratliff-NC Jr 9 20 420 0 31 21.05. Juanyeh Thomas-GT Fr 10 20 383 0 38 19.1

2018 Atlantic Coast ConferenceIndividual Statistics Through games of Nov 11, 2018
ALL PURPOSE Cl G Rush Rcv PR KR Yds Avg/G
1. Greg Dortch-WF So 10 5 921 253 353 1532 153.22. Michael Walker-BC Sr 10 54 182 252 793 1281 128.13. AJ Dillon-BC So 8 936 42 0 0 978 122.24. Deon Jackson-DU So 10 725 180 0 292 1197 119.75. Travis Etienne-CU So 10 1076 56 0 0 1132 113.26. Anthony Ratliff-NC Jr 9 60 529 0 420 1009 112.17. Qadree Ollison-UP Sr 10 1054 50 0 0 1104 110.48. Kelvin Harmon-ST Jr 9 0 965 0 0 965 107.29. Sean Riley-SU Jr 10 31 603 226 183 1043 104.3
10. Hassan Hall-UL Fr 10 234 67 0 739 1040 104.0
PUNTING Cl G No. Yds Lg I20 50+ TB Avg.
1. Pressley Harvin III-GT So 9 24 1086 62 10 9 2 45.22. Sterling Hofrichter-SU Jr 10 50 2202 58 21 15 3 44.03. Oscar Bradburn-VT So 9 47 2010 72 14 4 3 42.84. Logan Tyler-FS Jr 10 67 2861 61 12 16 4 42.75. A.J. Cole-ST Sr 9 30 1265 61 12 4 3 42.26. Dom Maggio-WF Jr 10 60 2490 55 17 8 3 41.57. Lester Coleman-VA Sr 10 39 1618 61 15 8 5 41.58. Austin Parker-DU Jr 10 46 1905 57 20 12 2 41.49. Mason King-UL So 10 58 2362 64 16 4 2 40.7
10. Hunter Lent-NC Sr 9 43 1737 60 14 7 0 40.4
FIELD GOALS Cl G Made Att. Long Pct. FG/G
1. Andre Szmyt-SU Fr 10 27 29 54 93.1 2.702. Christopher Dunn-ST Fr 9 17 20 44 85.0 1.893. Freeman Jones-NC Sr 9 16 23 49 69.6 1.784. Nick Sciba-WF Fr 10 13 16 47 81.2 1.305. Brian Delaney-VA So 10 9 11 46 81.8 0.90
Alex Kessman-UP So 10 9 12 55 75.0 0.90Greg Huegel-CU Sr 10 9 12 49 75.0 0.90
8. Blanton Creque-UL Jr 10 8 9 46 88.9 0.80Ricky Aguayo-FS Jr 10 8 13 53 61.5 0.80
10. Brian Johnson-VT So 9 7 11 45 63.6 0.78
FIELD GOAL PCT Cl G Made Att. Long Pct.
1. Andre Szmyt-SU Fr 10 27 29 54 93.12. Christopher Dunn-ST Fr 9 17 20 44 85.03. Freeman Jones-NC Sr 9 16 23 49 69.6
PAT KICKING PCT Cl G Made Att. Pct.
1. Andre Szmyt-SU Fr 10 51 51 100.0Greg Huegel-CU Sr 10 49 49 100.0Nick Sciba-WF Fr 10 38 38 100.0Christopher Dunn-ST Fr 9 32 32 100.0Brian Johnson-VT So 9 29 29 100.0Freeman Jones-NC Sr 9 24 24 100.0
7. Bubba Baxa-UM Fr 10 37 38 97.48. Ricky Aguayo-FS Jr 10 27 28 96.49. Collin Wareham-DU Sr 10 40 42 95.2
10. Alex Kessman-UP So 10 34 36 94.4

2018 Atlantic Coast ConferenceIndividual Statistics Through games of Nov 11, 2018
TACKLES (All positions) Cl G Pos Solo Ast Total Avg/G
1. Cole Holcomb-NC Sr 9 LB 53 40 93 10.32. Germaine Pratt-ST Sr 9 LB 50 41 91 10.13. Joe Giles-Harris-DU Jr 9 LB 34 47 81 9.04. Cameron Glenn-WF Sr 9 DB 49 27 76 8.45. Kielan Whitner-SU Sr 10 LB 52 32 84 8.46. Jaquan Johnson-UM Sr 8 DB 29 36 65 8.17. Connor Strachan-BC Sr 10 LB 43 38 81 8.18. Rayshard Ashby-VT So 8 LB 31 32 63 7.99. Justin Strnad-WF Jr 10 LB 46 32 78 7.8
10. Ryan Guthrie-SU Sr 10 LB 45 32 77 7.711. Dylan Singleton-DU Jr 10 41 32 73 7.312. Ben Humphreys-DU Sr 9 LB 24 41 65 7.213. Hamsah Nasirildeen-FS So 10 DB 40 32 72 7.214. Isaiah McDuffie-BC So 10 LB 37 34 71 7.115. Juan Thornhill-VA Sr 10 SS 45 24 69 6.916. Evan Foster-SU Jr 10 DB 49 19 68 6.817. Kendall Joseph-CU Sr 9 LB 31 29 60 6.718. Shaquille Quarterman-UM Jr 10 LB 35 31 66 6.6
Essang Bassey-WF Jr 10 DB 48 18 66 6.620. Reggie Floyd-VT Jr 9 DB 39 20 59 6.621. Jarius Morehead-ST Jr 9 SAF 30 27 57 6.322. Damar Hamlin-UP Jr 10 DB 47 16 63 6.3
Will Harris-BC Sr 10 DB 35 28 63 6.324. Nick McCloud-ST Jr 7 CB 27 16 43 6.125. Michael Pinckney-UM Jr 10 LB 31 30 61 6.126. Dee Smith-UL Jr 10 31 29 60 6.0
Joey Blount-VA So 9 31 23 54 6.0Isaiah Moore-ST Fr 8 LB 25 23 48 6.0
29. Zane Zandier-VA So 10 LB 26 33 59 5.930. J.K. Britt-NC Sr 9 DB 37 16 53 5.931. Dorian Etheridge-UL So 8 LB 27 20 47 5.932. Divine Deablo-VT So 7 DB 28 13 41 5.933. Dontavious Jackson-FS Jr 10 LB 36 20 56 5.6
Oluwaseun Idowu-UP Sr 10 LB 39 17 56 5.6Max Richardson-BC So 10 LB 26 30 56 5.6
36. Khalil Ladler-VT So 9 DB 29 20 49 5.437. Charles Snowden-VA So 10 LB 20 34 54 5.438. Marquis Waters-DU So 10 31 22 53 5.3
Isaiah Simmons-CU So 10 29 24 53 5.3A.J. Westbrook-FS Sr 10 DB 33 20 53 5.3
41. Tre Lamar-CU Jr 10 LB 26 26 52 5.242. Carlos Basham, Jr.-WF So 9 DL 25 21 46 5.143. Zach Allen-BC Sr 10 DL 22 28 50 5.0
Chuck Wade, Jr.-WF Sr 10 DB 24 26 50 5.0Malik Rivera-GT Sr 10 DB 27 23 50 5.0Gerald Willis III-UM Sr 10 DL 28 22 50 5.0Chris Peace-VA Sr 10 LB 22 28 50 5.0
48. Bryce Hall-VA Jr 10 CB 30 19 49 4.949. DeCalon Brooks-FS Fr 9 LB 15 29 44 4.950. Brant Mitchell-GT Sr 10 LB 25 23 48 4.8
SACKS Cl G Pos Solo Ast Total Avg/G
1. Brian Burns-FS Jr 10 DE 8 2 9.0 0.90Wyatt Ray-BC Sr 10 DL 8 2 9.0 0.90Alton Robinson-SU Jr 10 DL 9 0 9.0 0.90
4. Clelin Ferrell-CU Jr 10 DE 8 1 8.5 0.855. Kendall Coleman-SU Jr 10 DL 7 0 7.0 0.706. Chris Peace-VA Sr 10 LB 5 2 6.0 0.607. Germaine Pratt-ST Sr 9 LB 5 1 5.5 0.618. Jonathan Garvin-UM So 10 DL 4 3 5.5 0.55
Rashad Weaver-UP So 10 DL 5 1 5.5 0.55Zach Allen-BC Sr 10 DL 5 1 5.5 0.55Austin Bryant-CU Sr 10 DE 5 1 5.5 0.55
12. Shaquille Quarterman-UM Jr 10 LB 4 0 5.0 0.5013. James Smith-Williams-ST Jr 9 DE 4 2 5.0 0.5614. Joe Jackson-UM Jr 10 DL 4 2 5.0 0.50
Houshun Gaines-VT Jr 9 DL 4 1 4.5 0.50Jason Strowbridge-NC Jr 9 DL 4 1 4.5 0.50
17. Kingsley Jonathan-SU So 10 DL 3 2 4.0 0.40Dewayne Hendrix-UP Sr 10 DL 3 2 4.0 0.40Anree Saint-Amour-GT Sr 10 DL 4 0 4.0 0.40
20. Larrell Murchison-ST Jr 9 DT 3 2 4.0 0.44
TACKLES FOR LOSS Cl G Pos Solo Ast Total Avg/G
1. Gerald Willis III-UM Sr 10 DL 14 6 17.0 1.702. Alton Robinson-SU Jr 10 DL 15 0 15.0 1.503. Jonathan Garvin-UM So 10 DL 7 15 14.5 1.454. Brian Burns-FS Jr 10 DE 11 5 13.5 1.35
Zach Allen-BC Sr 10 DL 11 5 13.5 1.356. Clelin Ferrell-CU Jr 10 DE 11 4 13.0 1.307. Ryan Guthrie-SU Sr 10 LB 10 3 11.5 1.158. Rashad Weaver-UP So 10 DL 9 4 11.0 1.10
Shaquille Quarterman-UM Jr 10 LB 8 6 11.0 1.1010. Anree Saint-Amour-GT Sr 10 DL 9 3 10.5 1.05
Wyatt Ray-BC Sr 10 DL 8 5 10.5 1.0512. Christian Wilkins-CU Sr 10 DT 7 6 10.0 1.00
Chris Peace-VA Sr 10 LB 8 4 10.0 1.0014. Germaine Pratt-ST Sr 9 LB 8 4 10.0 1.1115. Joe Jackson-UM Jr 10 DL 6 7 9.5 0.9516. Austin Bryant-CU Sr 10 DE 7 4 9.0 0.90
Xavier Thomas-CU Fr 10 DE 8 2 9.0 0.90Kendall Coleman-SU Jr 10 DL 9 0 9.0 0.90
19. Reggie Floyd-VT Jr 9 DB 7 3 8.5 0.9420. Michael Pinckney-UM Jr 10 LB 6 5 8.5 0.85

2018 Atlantic Coast ConferenceIndividual Statistics Through games of Nov 11, 2018
PASSES DEFENDED Cl G BrUp Int. Total Avg/G
1. Bryce Hall-VA Jr 10 17 2 19 1.902. Hamp Cheevers-BC Jr 10 7 6 13 1.30
Essang Bassey-WF Jr 10 12 1 13 1.304. Andre Cisco-SU Fr 10 7 5 12 1.20
Taj-Amir Torres-BC Sr 10 10 2 12 1.206. Juan Thornhill-VA Sr 10 5 5 10 1.00
Nick McCloud-ST Jr 7 6 1 7 1.008. Amari Henderson-WF Jr 9 8 0 8 0.89
Asante Samuel-FS Fr 9 8 0 8 0.8910. Brandon Sebastian-BC Fr 10 7 1 8 0.8011. Caleb Farley-VT Fr 9 5 2 7 0.78
Dane Jackson-UP Jr 9 7 0 7 0.78Chris Ingram-ST So 9 6 1 7 0.78Patrice Rene-NC Jr 9 5 2 7 0.78
15. Ifeatu Melifonwu-SU Fr 8 6 0 6 0.75Michael Carter II-DU So 8 5 1 6 0.75
17. Trajan Bandy-UM So 10 4 3 7 0.70Charles Snowden-VA So 10 6 1 7 0.70Darrius Bratton-VA So 10 7 0 7 0.70Zach Allen-BC Sr 10 6 1 7 0.70
INTERCEPTIONS Cl G No. Yds TD Long Avg/G
1. Hamp Cheevers-BC Jr 10 6 112 1 81 0.602. Juan Thornhill-VA Sr 10 5 87 0 62 0.50
Andre Cisco-SU Fr 10 5 47 0 39 0.504. Stanford Samuels-FS So 10 3 21 0 11 0.30
Sheldrick Redwine-UM Sr 10 3 14 0 14 0.30Trajan Bandy-UM So 10 3 13 0 13 0.30Christopher Fredrick-SU Jr 10 3 -2 0 0 0.30
8. Joey Blount-VA So 9 2 31 0 31 0.22Reggie Floyd-VT Jr 9 2 9 0 5 0.22Patrice Rene-NC Jr 9 2 2 0 2 0.22
FUMBLES FORCED Cl G No. Avg/G
1. Dane Jackson-UP Jr 9 4 0.442. Cole Holcomb-NC Sr 9 3 0.333. Anree Saint-Amour-GT Sr 10 3 0.30
Brian Burns-FS Jr 10 3 0.305. Germaine Pratt-ST Sr 9 2 0.22
Tim Kidd-Glass-ST Jr 9 2 0.22Houshun Gaines-VT Jr 9 2 0.22
8. Oluwaseun Idowu-UP Sr 10 2 0.20Alton Robinson-SU Jr 10 2 0.20Isaiah Simmons-CU So 10 2 0.20
FUMBLES RECOVERED Cl G No. Avg/G
1. Charlie Thomas-GT Fr 8 3 0.382. Rashad Weaver-UP So 10 3 0.303. Dorian Etheridge-UL So 8 2 0.254. London Iakopo-UL Sr 9 2 0.22
Khalil Ladler-VT So 9 2 0.22Houshun Gaines-VT Jr 9 2 0.22Ben Humphreys-DU Sr 9 2 0.22Carlos Basham, Jr.-WF So 9 2 0.22Dane Jackson-UP Jr 9 2 0.22
10. Alton Robinson-SU Jr 10 2 0.20

2018 Atlantic Coast ConferenceConference Team Game Highs Through games of Nov 11, 2018
TEAM HIGHS (highest totals made by)
Points 77 Miami vs SAVANNAH STATE (Sep 08, 2018)77 Clemson vs LOUISVILLE (Nov 03, 2018)
Points scored kicking 18 Syracuse vs LOUISVILLE (Nov 09, 2018) [4fg,6pat]Touchdowns 11 Miami vs SAVANNAH STATE (Sep 08, 2018)
11 Clemson vs LOUISVILLE (Nov 03, 2018)Total offense yards 698 Clemson at Wake Forest (Oct 06, 2018) [471r,227p]
661 Clemson vs LOUISVILLE (Nov 03, 2018) [492r,169p]654 Pitt vs VIRGINIA TECH (11/10/18) [492r,162p]636 Syracuse vs CONNECTICUT (Sep 22, 2018) [341r,295p]634 Pitt vs DUKE (10/27/18) [484r,150p]
Total offense plays 105 Wake Forest vs BOSTON COLLEGE (Sep 13, 2018) [60r,45p]104 Wake Forest at Florida State (Oct 20, 2018) [50r,54p]
Total offense yards/play 13.9 Pitt vs VIRGINIA TECH (11/10/18) [47-654]11.6 Clemson vs LOUISVILLE (Nov 03, 2018) [57-661]
Rushing yards 542 Georgia Tech at Louisville (Oct 05, 2018)492 Clemson vs LOUISVILLE (Nov 03, 2018)492 Pitt vs VIRGINIA TECH (11/10/18)484 Pitt vs DUKE (10/27/18)471 Clemson at Wake Forest (Oct 06, 2018)
Rushing attempts 78 Georgia Tech at Virginia Tech (Oct 25, 2018)74 Georgia Tech at North Carolina (Nov 03, 2018)
Yards per rush 13.7 Pitt vs VIRGINIA TECH (11/10/18) [36-492]13.3 Clemson vs LOUISVILLE (Nov 03, 2018) [37-492]
Rushing TDs 8 Georgia Tech vs BOWLING GREEN (Sep 29, 2018)8 Georgia Tech at Louisville (Oct 05, 2018)
Longest rush 97 Pitt vs VIRGINIA TECH (11/10/18)87 Virginia Tech at Old Dominion (Sep 22, 2018)
Passing yards 480 Syracuse vs NC STATE (Oct 27, 2018)473 NC State at Syracuse (Oct 27, 2018)426 NC State vs GEORGIA STATE (Sep 08, 2018)421 Florida State at NC State (Nov 03, 2018)406 Syracuse vs NORTH CAROLINA (Oct 20, 2018)
Passing attempts 54 Wake Forest at Florida State (Oct 20, 2018)54 North Carolina at Syracuse (Oct 20, 2018)54 Louisville vs WAKE FOREST (Oct 27, 2018)54 Duke vs NORTH CAROLINA (Nov 10, 2018)
Passing TDs 5 Syracuse vs WAGNER (Sep 08, 2018)5 Miami vs SAVANNAH STATE (Sep 08, 2018)5 Boston College at Wake Forest (Sep 13, 2018)5 Clemson at Florida State (Oct 27, 2018)5 Clemson vs LOUISVILLE (Nov 03, 2018)
Longest pass 86 Virginia vs Ohio (Sep 15, 2018)86 Georgia Tech at North Carolina (Nov 03, 2018)
Passes completed 35 NC State vs WAKE FOREST (Nov 08, 2018)34 North Carolina at Syracuse (Oct 20, 2018)
Had intercepted 4 North Carolina at California (9/18/2018)4 Boston College at Purdue (Sep 22, 2018)
Pass completion pct 100.0 Georgia Tech at North Carolina (Nov 03, 2018) [2-2]85.0 Wake Forest vs RICE (Sep 29, 2018) [17-20]
Passing yards/attempt 52.0 Georgia Tech at North Carolina (Nov 03, 2018) [2-104]22.9 Georgia Tech vs BOWLING GREEN (Sep 29, 2018) [7-160]
Yards per catch 52.0 Georgia Tech at North Carolina (Nov 03, 2018) [2-104]32.0 Georgia Tech vs BOWLING GREEN (Sep 29, 2018) [5-160]
Field goal attempts 6 North Carolina vs VIRGINIA TECH (Oct 13, 2018)5 Virginia Tech vs NOTRE DAME (Oct 06, 2018)

2018 Atlantic Coast ConferenceTeam Game Highs Through games of Nov 11, 2018
5 North Carolina at Syracuse (Oct 20, 2018)Field goals made 4 North Carolina at ECU (Sep. 8, 2018)
4 North Carolina vs VIRGINIA TECH (Oct 13, 2018)4 NC State vs FLORIDA STATE (Nov 03, 2018)4 Syracuse vs LOUISVILLE (Nov 09, 2018)
Longest field goal 55 Pitt vs SYRACUSE (10/6/18)54 Syracuse at Pitt (10/6/18)54 Pitt vs DUKE (10/27/18)
Field goal pct 66.7 North Carolina vs VIRGINIA TECH (Oct 13, 2018) [4-6]60.0 Virginia Tech vs NOTRE DAME (Oct 06, 2018) [3-5]60.0 North Carolina at Syracuse (Oct 20, 2018) [3-5]
PAT kicks attempted 11 Miami vs SAVANNAH STATE (Sep 08, 2018)11 Clemson vs LOUISVILLE (Nov 03, 2018)
PAT kicks made 11 Miami vs SAVANNAH STATE (Sep 08, 2018)11 Clemson vs LOUISVILLE (Nov 03, 2018)
PAT kicks pct 100.0 Miami vs SAVANNAH STATE (Sep 08, 2018) [11-11]100.0 Clemson vs LOUISVILLE (Nov 03, 2018) [11-11]
2-point PAT attempts 1 Pitt vs ALBANY (9/1/18)1 Florida State vs SAMFORD (Sep 08, 2018)1 Pitt vs PENN STATE (9/8/18)1 Georgia Tech at Pitt (Sep 15, 2018)1 Boston College vs TEMPLE (Sep 29, 2018)1 NC State vs VIRGINIA (Sep 29, 2018)1 Boston College at NC State (Oct 06, 2018)1 Virginia Tech at North Carolina (Oct 13, 2018)1 Virginia at Duke (Oct 20, 2018)1 Pitt vs DUKE (10/27/18)1 North Carolina vs GEORGIA TECH (Nov 03, 2018)1 Miami vs DUKE (Nov 03, 2018)1 Virginia Tech at Pitt (11/10/18)
2-point PATs made 1 Florida State vs SAMFORD (Sep 08, 2018)1 Boston College vs TEMPLE (Sep 29, 2018)1 NC State vs VIRGINIA (Sep 29, 2018)1 Virginia Tech at North Carolina (Oct 13, 2018)1 Virginia at Duke (Oct 20, 2018)1 Pitt vs DUKE (10/27/18)1 North Carolina vs GEORGIA TECH (Nov 03, 2018)1 Virginia Tech at Pitt (11/10/18)
Punts 12 Wake Forest vs CLEMSON (Oct 06, 2018)12 Florida State vs CLEMSON (Oct 27, 2018)12 Boston College vs CLEMSON (Nov 10, 2018)
Longest punt 72 Virginia Tech vs BOSTON COLLEGE (Nov 03, 2018)64 Louisville vs INDIANA ST (Sep 08, 2018)
Yards punted 520 Boston College vs CLEMSON (Nov 10, 2018) [12-520]499 Florida State vs CLEMSON (Oct 27, 2018) [12-499]
Punting avg 50.0 Duke at Georgia Tech (Oct 13, 2018) [3-150]48.8 Virginia at NC State (Sep 29, 2018) [4-195]
Punt returns 6 Wake Forest vs BOSTON COLLEGE (Sep 13, 2018)5 Syracuse vs WAGNER (Sep 08, 2018)5 Florida State at Miami (Oct 06, 2018)5 Wake Forest vs CLEMSON (Oct 06, 2018)5 Boston College vs LOUISVILLE (Oct 13, 2018)5 Clemson at Florida State (Oct 27, 2018)5 Virginia vs NORTH CAROLINA (Oct 27, 2018)5 Wake Forest vs SYRACUSE (Nov 03, 2018)5 Clemson at Boston College (Nov 10, 2018)

2018 Atlantic Coast ConferenceTeam Game Highs Through games of Nov 11, 2018
Punt return yards 145 Florida State at Miami (Oct 06, 2018)136 Wake Forest vs TOWSON (Sep 08, 2018)
Punt return avg 43.5 Clemson vs FURMAN (Sep 01, 2018) [2-87]37.5 North Carolina at Syracuse (Oct 20, 2018) [2-75]
Punt return TDs 2 Wake Forest vs TOWSON (Sep 08, 2018)Longest punt return 86 Pitt at UCF (Sep 29, 2018)
75 North Carolina at Syracuse (Oct 20, 2018)Kick returns 9 Duke at Pitt (10/27/18)
8 Louisville vs GEORGIA TECH (Oct 05, 2018)8 Louisville at Clemson (Nov 03, 2018)
Kick return yards 247 Louisville at Clemson (Nov 03, 2018)213 Boston College at Purdue (Sep 22, 2018)
Kick return avg 61.0 Pitt at Notre Dame (Oct 13, 2018) [2-122]49.0 Pitt vs ALBANY (9/1/18) [2-98]
Longest kick return 99 Pitt at Notre Dame (Oct 13, 2018)93 Louisville at Clemson (Nov 03, 2018)
Kick return TDs 1 Pitt vs ALBANY (9/1/18)1 Pitt at Notre Dame (Oct 13, 2018)1 Louisville at Clemson (Nov 03, 2018)1 Virginia vs LIBERTY (Nov 10, 2018)
Interceptions 4 Florida State vs SAMFORD (Sep 08, 2018)Interception return yds 150 Miami vs NORTH CAROLINA (Sep 27, 2018)
117 Virginia vs MIAMI (Oct 13, 2018)Interception return avg 51.5 Wake Forest vs RICE (Sep 29, 2018) [2-103]
51.0 Boston College vs HOLY CROSS (Sep 08, 2018) [2-102]Longest interception rtn 95 Georgia Tech at Louisville (Oct 05, 2018)
83 Miami vs NORTH CAROLINA (Sep 27, 2018)Interception return TDs 2 Miami vs NORTH CAROLINA (Sep 27, 2018)Fumbles lost 3 Virginia vs Ohio (Sep 15, 2018)
3 Florida State vs NORTHERN ILLINOIS (Sep 22, 2018)3 North Carolina at Miami (Sep 27, 2018)3 Georgia Tech vs DUKE (Oct 13, 2018)3 Georgia Tech at North Carolina (Nov 03, 2018)3 Miami at Georgia Tech (Nov 10, 2018)
Fumbles recovered 3 Miami vs NORTH CAROLINA (Sep 27, 2018)3 Duke at Georgia Tech (Oct 13, 2018)3 North Carolina vs GEORGIA TECH (Nov 03, 2018)3 Georgia Tech vs MIAMI (Nov 10, 2018)
Sacked by opp 7 Louisville at Boston College (Oct 13, 2018)6 Florida State at Miami (Oct 06, 2018)6 Wake Forest at Florida State (Oct 20, 2018)6 Louisville at Clemson (Nov 03, 2018)6 Louisville at Syracuse (Nov 09, 2018)
QB sacks 7 Boston College vs LOUISVILLE (Oct 13, 2018)6 Boston College vs UMASS (Sep 01, 2018)6 Syracuse vs CONNECTICUT (Sep 22, 2018)6 Miami vs FLORIDA STATE (Oct 06, 2018)6 Florida State vs WAKE FOREST (Oct 20, 2018)6 Clemson vs LOUISVILLE (Nov 03, 2018)6 Syracuse vs LOUISVILLE (Nov 09, 2018)
Turnovers committed 6 North Carolina at Miami (Sep 27, 2018)5 Florida State vs VIRGINIA TECH (Sep 03, 2018)
Turnovers caused 6 Miami vs NORTH CAROLINA (Sep 27, 2018)5 Virginia Tech at Florida State (Sep 03, 2018)5 Florida State vs SAMFORD (Sep 08, 2018)
Kicks blocked 2 Miami vs SAVANNAH STATE (Sep 08, 2018)

2018 Atlantic Coast ConferenceTeam Game Highs Through games of Nov 11, 2018
2 Virginia at Indiana (Sep 08, 2018)2 Wake Forest vs BOSTON COLLEGE (Sep 13, 2018)2 Boston College at NC State (Oct 06, 2018)2 Boston College vs LOUISVILLE (Oct 13, 2018)
First downs 35 Georgia Tech at Virginia Tech (Oct 25, 2018)34 NC State vs BOSTON COLLEGE (Oct 06, 2018)
1st downs rushing 31 Georgia Tech at Virginia Tech (Oct 25, 2018)27 Georgia Tech at Louisville (Oct 05, 2018)
1st downs passing 20 Wake Forest at Tulane (8/30/2018)19 NC State vs GEORGIA STATE (Sep 08, 2018)19 Clemson vs NC STATE (Oct 20, 2018)19 Syracuse vs NC STATE (Oct 27, 2018)19 Louisville vs WAKE FOREST (Oct 27, 2018)19 Duke at Pitt (10/27/18)
1st downs by penalty 6 Boston College vs TEMPLE (Sep 29, 2018)6 Syracuse vs NC STATE (Oct 27, 2018)
Penalties 17 Louisville at Syracuse (Nov 09, 2018)16 Florida State vs CLEMSON (Oct 27, 2018)16 Florida State at NC State (Nov 03, 2018)
Penalties yards 134 Florida State vs CLEMSON (Oct 27, 2018)125 Pitt at UCF (Sep 29, 2018)125 Louisville at Syracuse (Nov 09, 2018)

2018 Atlantic Coast ConferenceConference Individual Game Highs Through games of Nov 11, 2018
INDIVIDUAL PLAYER GAME HIGHS
Points scored 24 Greg Dortch (Wake Forest) vs RICE (Sep 29, 2018)Touchdowns 4 Greg Dortch (Wake Forest) vs RICE (Sep 29, 2018)TD responsibility 5 Eric Dungey (Syracuse) vs WAGNER (Sep 08, 2018) [0r,5p]
5 Anthony Brown (Boston College) at Wake Forest (Sep 13, 2018) [0r,5p]5 Malik Rosier (Miami) at TOLEDO (Sep 15, 2018) [3r,2p]5 Eric Dungey (Syracuse) vs CONNECTICUT (Sep 22, 2018) [3r,2p]
Points scored kicking 18 Andre Szmyt (Syracuse) vs LOUISVILLE (Nov 09, 2018) [4fg,6pat]Total offense yards 547 Daniel Jones (Duke) vs NORTH CAROLINA (Nov 10, 2018) [186r,361p]Total offense plays 69 Daniel Jones (Duke) vs NORTH CAROLINA (Nov 10, 2018) [15r,54p]Total offense yards/play 29.0 Lyn-J Dixon (Clemson) vs LOUISVILLE (Nov 03, 2018) [4-116]Rushing yards 243 Matt Colburn II (Wake Forest) at Louisville (Oct 27, 2018)Rushing attempts 40 Tobias Oliver (Georgia Tech) at Virginia Tech (Oct 25, 2018)Yards per rush 14.7 Qadree Ollison (Pitt) vs VIRGINIA TECH (11/10/18) [16-235]Rushing TDs 3 AJ Dillon (Boston College) vs HOLY CROSS (Sep 08, 2018)
3 Tobias Oliver (Georgia Tech) at USF (Sep 08, 2018)3 Malik Rosier (Miami) at TOLEDO (Sep 15, 2018)3 Jordan Ellis (Virginia) vs Ohio (Sep 15, 2018)3 Eric Dungey (Syracuse) vs CONNECTICUT (Sep 22, 2018)3 Travis Etienne (Clemson) vs SYRACUSE (Sep 29, 2018)3 Travis Etienne (Clemson) at Wake Forest (Oct 06, 2018)3 Travis Etienne (Clemson) vs NC STATE (Oct 20, 2018)3 Tobias Oliver (Georgia Tech) at Virginia Tech (Oct 25, 2018)3 Jordan Mason (Georgia Tech) at Virginia Tech (Oct 25, 2018)3 Matt Colburn II (Wake Forest) at Louisville (Oct 27, 2018)3 Trey Smith (Louisville) vs WAKE FOREST (Oct 27, 2018)3 Darrin Hall (Pitt) at Virginia (Nov 02, 2018)3 Qadree Ollison (Pitt) vs VIRGINIA TECH (11/10/18)
Longest rush 97 Qadree Ollison (Pitt) vs VIRGINIA TECH (11/10/18)Passing yards 473 Ryan Finley (NC State) at Syracuse (Oct 27, 2018)Passing attempts 54 Jawon Pass (Louisville) vs WAKE FOREST (Oct 27, 2018)
54 Daniel Jones (Duke) vs NORTH CAROLINA (Nov 10, 2018)Passing TDs 5 Eric Dungey (Syracuse) vs WAGNER (Sep 08, 2018)
5 Anthony Brown (Boston College) at Wake Forest (Sep 13, 2018)Longest pass 86 Bryce Perkins (Virginia) vs Ohio (Sep 15, 2018)
86 Tobias Oliver (Georgia Tech) at North Carolina (Nov 03, 2018)Passes completed 35 Ryan Finley (NC State) vs WAKE FOREST (Nov 08, 2018)Had intercepted 4 Nathan Elliott (North Carolina) at California (9/18/2018)
4 Anthony Brown (Boston College) at Purdue (Sep 22, 2018)Pass completion pct 88.2 Sam Hartman (Wake Forest) vs RICE (Sep 29, 2018) [15-17]Pass yards/attempt 14.2 Sam Hartman (Wake Forest) vs RICE (Sep 29, 2018) [17-241]Pass yards/catch 16.1 Sam Hartman (Wake Forest) vs RICE (Sep 29, 2018) [15-241]Receiving yards 247 Olamide Zaccheaus (Virginia) vs Ohio (Sep 15, 2018)
247 Kelvin Harmon (NC State) at Syracuse (Oct 27, 2018)Receptions 15 Kelvin Harmon (NC State) vs WAKE FOREST (Nov 08, 2018)Yards per catch 61.5 Carl Tucker (North Carolina) vs VIRGINIA TECH (Oct 13, 2018) [2-123]Receiving TDs 4 Greg Dortch (Wake Forest) vs RICE (Sep 29, 2018)Longest reception 86 Olamide Zaccheaus (Virginia) vs Ohio (Sep 15, 2018)
86 Qua Searcy (Georgia Tech) at North Carolina (Nov 03, 2018)Field goal attempts 6 Freeman Jones (North Carolina) vs VIRGINIA TECH (Oct 13, 2018)Field goals made 4 Freeman Jones (North Carolina) at ECU (Sep. 8, 2018)
4 Freeman Jones (North Carolina) vs VIRGINIA TECH (Oct 13, 2018)4 Christopher Dunn (NC State) vs FLORIDA STATE (Nov 03, 2018)4 Andre Szmyt (Syracuse) vs LOUISVILLE (Nov 09, 2018)
Longest field goal 55 Alex Kessman (Pitt) vs SYRACUSE (10/6/18)

2018 Atlantic Coast ConferenceIndividual Game Highs Through games of Nov 11, 2018
Field goal pct 66.7 Freeman Jones (North Carolina) vs VIRGINIA TECH (Oct 13, 2018) [4-6]PAT kicks attempted 9 Bubba Baxa (Miami) vs SAVANNAH STATE (Sep 08, 2018)
9 Wesley Wells (Georgia Tech) vs BOWLING GREEN (Sep 29, 2018)9 Wesley Wells (Georgia Tech) at Louisville (Oct 05, 2018)
PAT kicks made 9 Bubba Baxa (Miami) vs SAVANNAH STATE (Sep 08, 2018)9 Wesley Wells (Georgia Tech) vs BOWLING GREEN (Sep 29, 2018)9 Wesley Wells (Georgia Tech) at Louisville (Oct 05, 2018)
Punts 12 Dom Maggio (Wake Forest) vs CLEMSON (Oct 06, 2018)12 Logan Tyler (Florida State) vs CLEMSON (Oct 27, 2018)12 Grant Carlson (Boston College) vs CLEMSON (Nov 10, 2018)
Yards punted 520 Grant Carlson (Boston College) vs CLEMSON (Nov 10, 2018) [12-520]Longest punt 72 Oscar Bradburn (Virginia Tech) vs BOSTON COLLEGE (Nov 03, 2018)Punting avg 50.0 Austin Parker (Duke) at Georgia Tech (Oct 13, 2018) [3-150]Punt returns 5 Greg Dortch (Wake Forest) vs BOSTON COLLEGE (Sep 13, 2018)
5 D.J. Matthews (Florida State) at Miami (Oct 06, 2018)5 Greg Dortch (Wake Forest) vs SYRACUSE (Nov 03, 2018)5 Amari Rodgers (Clemson) at Boston College (Nov 10, 2018)
Punt return yards 145 D.J. Matthews (Florida State) at Miami (Oct 06, 2018)Longest punt return 86 Rafael Araujo-Lopes (Pitt) at UCF (Sep 29, 2018)Punt return TDs 2 Greg Dortch (Wake Forest) vs TOWSON (Sep 08, 2018)Punt return avg 45.0 Jeff Thomas (Miami) vs SAVANNAH STATE (Sep 08, 2018) [2-90]Kick returns 8 Hassan Hall (Louisville) at Clemson (Nov 03, 2018)Kick return yards 247 Hassan Hall (Louisville) at Clemson (Nov 03, 2018)Kick return avg 61.0 Maurice Ffrench (Pitt) at Notre Dame (Oct 13, 2018) [2-122]Longest kick return 99 Maurice Ffrench (Pitt) at Notre Dame (Oct 13, 2018)Kick return TDs 1 Maurice Ffrench (Pitt) vs ALBANY (9/1/18)
1 Maurice Ffrench (Pitt) at Notre Dame (Oct 13, 2018)1 Hassan Hall (Louisville) at Clemson (Nov 03, 2018)1 Joe Reed (Virginia) vs LIBERTY (Nov 10, 2018)
Combined PR/KR yards 247 Hassan Hall (Louisville) at Clemson (Nov 03, 2018) [0pr-247kr]Interceptions 2 Caleb Farley (Virginia Tech) at Florida State (Sep 03, 2018)
2 Kyle Meyers (Florida State) vs SAMFORD (Sep 08, 2018)2 Andre Cisco (Syracuse) vs WAGNER (Sep 08, 2018)2 Juan Thornhill (Virginia) vs MIAMI (Oct 13, 2018)2 Trajan Bandy (Miami) at Virginia (Oct 13, 2018)
Interception return yds 95 Juanyeh Thomas (Georgia Tech) at Louisville (Oct 05, 2018)Interception return avg 43.0 Juan Thornhill (Virginia) vs MIAMI (Oct 13, 2018) [2-86]Longest interception rtn 95 Juanyeh Thomas (Georgia Tech) at Louisville (Oct 05, 2018)Interception return TDs 1 Lukas Denis (Boston College) vs UMASS (Sep 01, 2018)
1 Hamp Cheevers (Boston College) vs HOLY CROSS (Sep 08, 2018)1 Levonta Taylor (Florida State) vs SAMFORD (Sep 08, 2018)1 Leonard Johnson (Duke) at Baylor (Sep 15, 2018)1 Jarius Morehead (NC State) at MARSHALL (Sep 22, 2018)1 Joe Jackson (Miami) vs NORTH CAROLINA (Sep 27, 2018)1 Romeo Finley (Miami) vs NORTH CAROLINA (Sep 27, 2018)1 Anree Saint-Amour (Georgia Tech) vs BOWLING GREEN (Sep 29, 2018)1 Chuck Wade, Jr. (Wake Forest) vs RICE (Sep 29, 2018)1 Juanyeh Thomas (Georgia Tech) at Louisville (Oct 05, 2018)1 Isaiah Simmons (Clemson) vs LOUISVILLE (Nov 03, 2018)
All-purpose yards 403 Deon Jackson (Duke) at Pitt (10/27/18)Tackles 22.0 Cole Holcomb (North Carolina) vs GEORGIA TECH (Nov 03, 2018) [12-10]Sacks 4.0 Wyatt Ray (Boston College) at Wake Forest (Sep 13, 2018) [4-0]Tackles for loss 4.0 Gerald Willis III (Miami) vs LSU (Sep 02, 2018) [3-2]

2018 Atlantic Coast ConferenceIndividual Game Highs Through games of Nov 11, 2018
4.0 Wyatt Ray (Boston College) at Wake Forest (Sep 13, 2018) [4-0]4.0 Zach Allen (Boston College) vs TEMPLE (Sep 29, 2018) [4-0]4.0 Larrell Murchison (NC State) vs VIRGINIA (Sep 29, 2018) [4-0]4.0 Alton Robinson (Syracuse) at Pitt (10/6/18) [4-0]4.0 Chris Rumph II (Duke) at Georgia Tech (Oct 13, 2018) [4-0]4.0 Cameron Glenn (Wake Forest) at NC State (Nov 08, 2018) [4-0]

2018 Atlantic Coast ConferenceIndividual Stellar Games Through games of Nov 11, 2018
200-Yard Rushing Performances
243 Matt Colburn II (Wake Forest) at Louisville (Oct 27, 2018)235 Qadree Ollison (Pitt) vs VIRGINIA TECH (11/10/18)229 Darrin Hall (Pitt) at Virginia (Nov 02, 2018)215 Tobias Oliver (Georgia Tech) at Virginia Tech (Oct 25, 2018)203 Travis Etienne (Clemson) vs SYRACUSE (Sep 29, 2018)200 Eric Dungey (Syracuse) at Western Michigan (Aug 31, 2018)
100-Yard Rushing Performances
243 Matt Colburn II (Wake Forest) at Louisville (Oct 27, 2018)235 Qadree Ollison (Pitt) vs VIRGINIA TECH (11/10/18)229 Darrin Hall (Pitt) at Virginia (Nov 02, 2018)215 Tobias Oliver (Georgia Tech) at Virginia Tech (Oct 25, 2018)203 Travis Etienne (Clemson) vs SYRACUSE (Sep 29, 2018)200 Eric Dungey (Syracuse) at Western Michigan (Aug 31, 2018)192 Qadree Ollison (Pitt) vs SYRACUSE (10/6/18)186 Daniel Jones (Duke) vs NORTH CAROLINA (Nov 10, 2018)186 Darrin Hall (Pitt) vs VIRGINIA TECH (11/10/18)185 AJ Dillon (Boston College) at Wake Forest (Sep 13, 2018)175 TaQuon Marshall (Georgia Tech) at Louisville (Oct 05, 2018)171 Jordan Ellis (Virginia) vs Ohio (Sep 15, 2018)167 Travis Etienne (Clemson) at Wake Forest (Oct 06, 2018)165 Michael Carter (North Carolina) vs VIRGINIA TECH (Oct 13, 2018)163 Lyn-J Dixon (Clemson) at Wake Forest (Oct 06, 2018)162 Travis Etienne (Clemson) vs GEORGIA SOUTHERN (Sep 14, 2018)162 Deon Jackson (Duke) at Pitt (10/27/18)161 AJ Dillon (Boston College) vs TEMPLE (Sep 29, 2018)159 Moe Neal (Syracuse) vs LOUISVILLE (Nov 09, 2018)156 Steven Peoples (Virginia Tech) at Old Dominion (Sep 22, 2018)153 Travis Etienne (Clemson) vs LOUISVILLE (Nov 03, 2018)149 AJ Dillon (Boston College) vs HOLY CROSS (Sep 08, 2018)149 AJ Dillon (Boston College) vs MIAMI (Oct 26, 2018)149 Qadree Ollison (Pitt) vs DUKE (10/27/18)148 Michael Carter (North Carolina) at Duke (Nov 10, 2018)146 Jordan Ellis (Virginia) vs RICHMOND (Sep 01, 2018)137 V'Lique Carter (Pitt) vs DUKE (10/27/18)133 Travis Homer (Miami) vs DUKE (Nov 03, 2018)130 Cade Carney (Wake Forest) vs TOWSON (Sep 08, 2018)129 Malik Cunningham (Louisville) vs W. KENTUCKY (Sep 15, 2018)128 Adam Choice (Clemson) at Wake Forest (Oct 06, 2018)124 DeeJay Dallas (Miami) vs DUKE (Nov 03, 2018)123 Bryce Perkins (Virginia) at Indiana (Sep 08, 2018)122 Travis Etienne (Clemson) at Georgia Tech (Sep 22, 2018)120 Ben Glines (Boston College) vs TEMPLE (Sep 29, 2018)120 Tobias Oliver (Georgia Tech) at North Carolina (Nov 03, 2018)119 Qadree Ollison (Pitt) vs PENN STATE (9/8/18)119 Eric Dungey (Syracuse) at Wake Forest (Nov 03, 2018)118 Brittain Brown (Duke) vs N.C. CENTRAL (Sep 22, 2018)117 Matt Colburn II (Wake Forest) vs BOSTON COLLEGE (Sep 13, 2018)116 Cade Carney (Wake Forest) vs BOSTON COLLEGE (Sep 13, 2018)

2018 Atlantic Coast ConferenceIndividual Stellar Games Through games of Nov 11, 2018
116 Moe Neal (Syracuse) vs CONNECTICUT (Sep 22, 2018)116 Antonio Williams (North Carolina) at Syracuse (Oct 20, 2018)116 Lyn-J Dixon (Clemson) vs LOUISVILLE (Nov 03, 2018)115 Tobias Oliver (Georgia Tech) vs BOWLING GREEN (Sep 29, 2018)114 Antonio Williams (North Carolina) vs PITT (Sep 22, 2018)114 Travis Homer (Miami) vs FIU (Sep 22, 2018)114 DeeJay Dallas (Miami) vs NORTH CAROLINA (Sep 27, 2018)113 TaQuon Marshall (Georgia Tech) at USF (Sep 08, 2018)113 Deon Jackson (Duke) at Miami (Nov 03, 2018)112 David Bailey (Boston College) vs LOUISVILLE (Oct 13, 2018)112 Bryce Perkins (Virginia) vs NORTH CAROLINA (Oct 27, 2018)110 DeeJay Dallas (Miami) at TOLEDO (Sep 15, 2018)108 Bryce Perkins (Virginia) vs RICHMOND (Sep 01, 2018)108 Ricky Person (NC State) vs VIRGINIA (Sep 29, 2018)107 Darrin Hall (Pitt) vs SYRACUSE (10/6/18)107 Ben Glines (Boston College) vs LOUISVILLE (Oct 13, 2018)106 Reggie Gallaspy (NC State) vs FLORIDA STATE (Nov 03, 2018)106 Jordan Ellis (Virginia) vs LIBERTY (Nov 10, 2018)104 Reggie Gallaspy (NC State) vs BOSTON COLLEGE (Oct 06, 2018)103 TaQuon Marshall (Georgia Tech) at Pitt (Sep 15, 2018)103 Tobias Oliver (Georgia Tech) at Louisville (Oct 05, 2018)101 Tavien Feaster (Clemson) vs LOUISVILLE (Nov 03, 2018)
Number of 100-Yard Rushing Performances
Travis Etienne, Clemson - 5AJ Dillon, Boston College - 4Tobias Oliver, Georgia Tech - 4Qadree Ollison, Pitt - 4DeeJay Dallas, Miami - 3Jordan Ellis, Virginia - 3Darrin Hall, Pitt - 3TaQuon Marshall, Georgia Tech - 3Bryce Perkins, Virginia - 3Cade Carney, Wake Forest - 2Michael Carter, North Carolina - 2Lyn-J Dixon, Clemson - 2Eric Dungey, Syracuse - 2Reggie Gallaspy, NC State - 2Ben Glines, Boston College - 2Travis Homer, Miami - 2Matt Colburn II, Wake Forest - 2Deon Jackson, Duke - 2Moe Neal, Syracuse - 2Antonio Williams, North Carolina - 2David Bailey, Boston College - 1Brittain Brown, Duke - 1V'Lique Carter, Pitt - 1Adam Choice, Clemson - 1Malik Cunningham, Louisville - 1Tavien Feaster, Clemson - 1Daniel Jones, Duke - 1
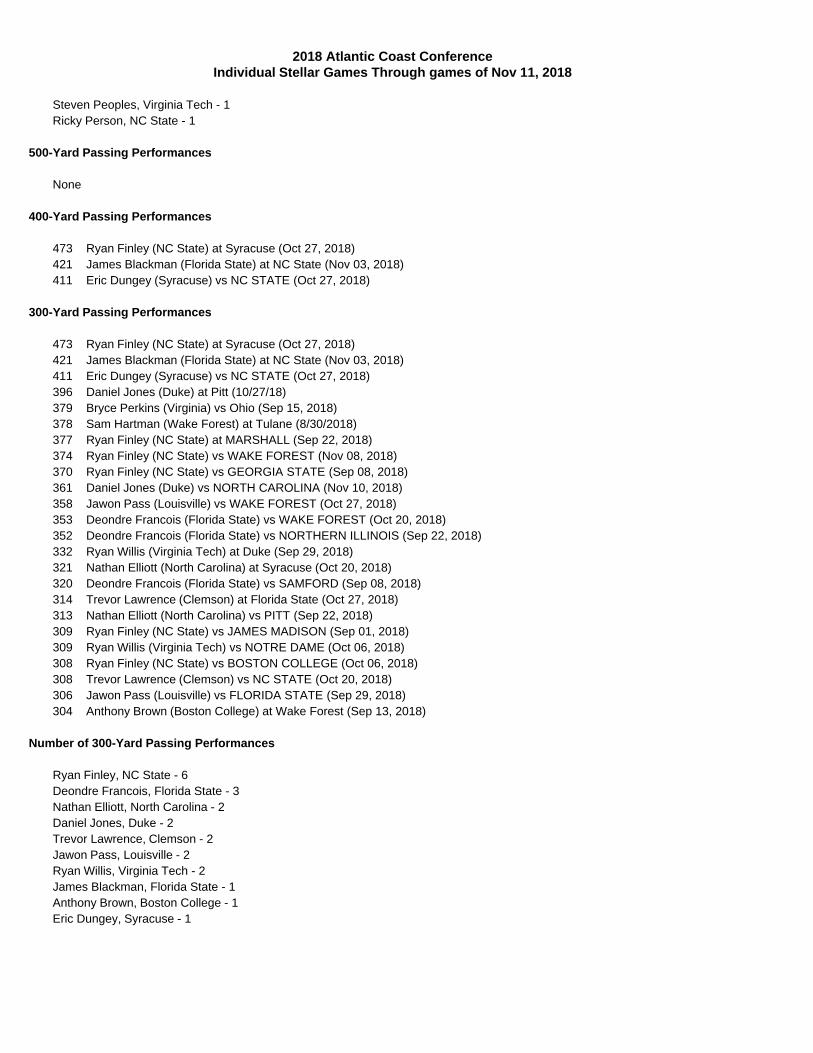
2018 Atlantic Coast ConferenceIndividual Stellar Games Through games of Nov 11, 2018
Steven Peoples, Virginia Tech - 1Ricky Person, NC State - 1
500-Yard Passing Performances
None
400-Yard Passing Performances
473 Ryan Finley (NC State) at Syracuse (Oct 27, 2018)421 James Blackman (Florida State) at NC State (Nov 03, 2018)411 Eric Dungey (Syracuse) vs NC STATE (Oct 27, 2018)
300-Yard Passing Performances
473 Ryan Finley (NC State) at Syracuse (Oct 27, 2018)421 James Blackman (Florida State) at NC State (Nov 03, 2018)411 Eric Dungey (Syracuse) vs NC STATE (Oct 27, 2018)396 Daniel Jones (Duke) at Pitt (10/27/18)379 Bryce Perkins (Virginia) vs Ohio (Sep 15, 2018)378 Sam Hartman (Wake Forest) at Tulane (8/30/2018)377 Ryan Finley (NC State) at MARSHALL (Sep 22, 2018)374 Ryan Finley (NC State) vs WAKE FOREST (Nov 08, 2018)370 Ryan Finley (NC State) vs GEORGIA STATE (Sep 08, 2018)361 Daniel Jones (Duke) vs NORTH CAROLINA (Nov 10, 2018)358 Jawon Pass (Louisville) vs WAKE FOREST (Oct 27, 2018)353 Deondre Francois (Florida State) vs WAKE FOREST (Oct 20, 2018)352 Deondre Francois (Florida State) vs NORTHERN ILLINOIS (Sep 22, 2018)332 Ryan Willis (Virginia Tech) at Duke (Sep 29, 2018)321 Nathan Elliott (North Carolina) at Syracuse (Oct 20, 2018)320 Deondre Francois (Florida State) vs SAMFORD (Sep 08, 2018)314 Trevor Lawrence (Clemson) at Florida State (Oct 27, 2018)313 Nathan Elliott (North Carolina) vs PITT (Sep 22, 2018)309 Ryan Finley (NC State) vs JAMES MADISON (Sep 01, 2018)309 Ryan Willis (Virginia Tech) vs NOTRE DAME (Oct 06, 2018)308 Ryan Finley (NC State) vs BOSTON COLLEGE (Oct 06, 2018)308 Trevor Lawrence (Clemson) vs NC STATE (Oct 20, 2018)306 Jawon Pass (Louisville) vs FLORIDA STATE (Sep 29, 2018)304 Anthony Brown (Boston College) at Wake Forest (Sep 13, 2018)
Number of 300-Yard Passing Performances
Ryan Finley, NC State - 6Deondre Francois, Florida State - 3Nathan Elliott, North Carolina - 2Daniel Jones, Duke - 2Trevor Lawrence, Clemson - 2Jawon Pass, Louisville - 2Ryan Willis, Virginia Tech - 2James Blackman, Florida State - 1Anthony Brown, Boston College - 1Eric Dungey, Syracuse - 1

2018 Atlantic Coast ConferenceIndividual Stellar Games Through games of Nov 11, 2018
Sam Hartman, Wake Forest - 1Bryce Perkins, Virginia - 1
200-Yard Receiving Performances
247 Olamide Zaccheaus (Virginia) vs Ohio (Sep 15, 2018)247 Kelvin Harmon (NC State) at Syracuse (Oct 27, 2018)
100-Yard Receiving Performances
247 Olamide Zaccheaus (Virginia) vs Ohio (Sep 15, 2018)247 Kelvin Harmon (NC State) at Syracuse (Oct 27, 2018)168 Jamal Custis (Syracuse) at Western Michigan (Aug 31, 2018)164 Sean Riley (Syracuse) vs NC STATE (Oct 27, 2018)163 Greg Dortch (Wake Forest) vs RICE (Sep 29, 2018)162 Jamal Custis (Syracuse) vs NORTH CAROLINA (Oct 20, 2018)161 Jakobi Meyers (NC State) vs JAMES MADISON (Sep 01, 2018)156 Amari Rodgers (Clemson) at Florida State (Oct 27, 2018)154 Damon Hazelton (Virginia Tech) at Old Dominion (Sep 22, 2018)150 Sage Surratt (Wake Forest) at Tulane (8/30/2018)150 Kelvin Harmon (NC State) at MARSHALL (Sep 22, 2018)149 Greg Dortch (Wake Forest) at Tulane (8/30/2018)145 Jeff Smith (Boston College) at Wake Forest (Sep 13, 2018)142 Tamorrion Terry (Florida State) at NC State (Nov 03, 2018)136 Nykeim Johnson (Syracuse) vs NC STATE (Oct 27, 2018)136 Johnathan Lloyd (Duke) at Pitt (10/27/18)135 Greg Dortch (Wake Forest) at Louisville (Oct 27, 2018)134 Kelvin Harmon (NC State) vs WAKE FOREST (Nov 08, 2018)133 D.J. Matthews (Florida State) at NC State (Nov 03, 2018)132 Jeff Thomas (Miami) vs LSU (Sep 02, 2018)132 Tutu Atwell (Louisville) vs WAKE FOREST (Oct 27, 2018)131 Damon Hazelton (Virginia Tech) vs NOTRE DAME (Oct 06, 2018)131 Nyqwan Murray (Florida State) vs WAKE FOREST (Oct 20, 2018)129 Kelvin Harmon (NC State) vs GEORGIA STATE (Sep 08, 2018)128 Kelvin Harmon (NC State) vs BOSTON COLLEGE (Oct 06, 2018)125 Jakobi Meyers (NC State) vs FLORIDA STATE (Nov 03, 2018)123 Tee Higgins (Clemson) at TAMU (Sep 08, 2018)123 Carl Tucker (North Carolina) vs VIRGINIA TECH (Oct 13, 2018)120 Sean Riley (Syracuse) vs CONNECTICUT (Sep 22, 2018)119 Tee Higgins (Clemson) vs NC STATE (Oct 20, 2018)117 Jakobi Meyers (NC State) vs WAKE FOREST (Nov 08, 2018)114 Aaron Young (Duke) vs ARMY WEST POINT (Aug 31, 2018)114 Thayer Thomas (NC State) vs GEORGIA STATE (Sep 08, 2018)114 Nyqwan Murray (Florida State) at Louisville (Sep 29, 2018)111 Clinton Lynch (Georgia Tech) at USF (Sep 08, 2018)110 Dazz Newsome (North Carolina) vs PITT (Sep 22, 2018)109 Olamide Zaccheaus (Virginia) at NC State (Sep 29, 2018)109 Sage Surratt (Wake Forest) at NC State (Nov 08, 2018)108 Olamide Zaccheaus (Virginia) vs NORTH CAROLINA (Oct 27, 2018)107 Damon Hazelton (Virginia Tech) vs WILLIAM & MARY (Sep 08, 2018)107 Jaylen, Smith (Louisville) vs WAKE FOREST (Oct 27, 2018)105 Jeff Thomas (Miami) at TOLEDO (Sep 15, 2018)

2018 Atlantic Coast ConferenceIndividual Stellar Games Through games of Nov 11, 2018
103 Justyn Ross (Clemson) vs GEORGIA SOUTHERN (Sep 14, 2018)103 Anthony Ratliff (North Carolina) vs GEORGIA TECH (Nov 03, 2018)102 Kobay White (Boston College) vs UMASS (Sep 01, 2018)102 Nykeim Johnson (Syracuse) vs NORTH CAROLINA (Oct 20, 2018)101 Olamide Zaccheaus (Virginia) vs RICHMOND (Sep 01, 2018)100 Jaylen, Smith (Louisville) vs FLORIDA STATE (Sep 29, 2018)100 Keyshawn Helton (Florida State) vs CLEMSON (Oct 27, 2018)
Number of 100-Yard Receiving Performances
Kelvin Harmon, NC State - 5Olamide Zaccheaus, Virginia - 4Greg Dortch, Wake Forest - 3Damon Hazelton, Virginia Tech - 3Jakobi Meyers, NC State - 3Jamal Custis, Syracuse - 2Tee Higgins, Clemson - 2Jaylen, Smith, Louisville - 2Nykeim Johnson, Syracuse - 2Nyqwan Murray, Florida State - 2Sean Riley, Syracuse - 2Sage Surratt, Wake Forest - 2Jeff Thomas, Miami - 2Tutu Atwell, Louisville - 1Keyshawn Helton, Florida State - 1Johnathan Lloyd, Duke - 1Clinton Lynch, Georgia Tech - 1D.J. Matthews, Florida State - 1Dazz Newsome, North Carolina - 1Anthony Ratliff, North Carolina - 1Amari Rodgers, Clemson - 1Justyn Ross, Clemson - 1Jeff Smith, Boston College - 1Tamorrion Terry, Florida State - 1Thayer Thomas, NC State - 1Carl Tucker, North Carolina - 1Kobay White, Boston College - 1Aaron Young, Duke - 1

2018 Atlantic Coast ConferenceTeam Statistics Through games of Nov 11, 2018
(Conference games)
SCORING OFFENSE G TD FG XPT 2XP DXP Saf Pts Avg/G
1. Clemson 7 46 7 46 0 0 0 343 49.02. Syracuse 7 31 20 30 0 0 0 276 39.43. Pitt 6 29 9 27 1 0 1 232 38.74. Georgia Tech 7 32 4 30 0 0 0 234 33.45. NC State 6 21 11 20 1 0 0 181 30.26. Boston College 6 22 5 20 0 0 0 167 27.87. Duke 6 22 3 22 0 0 0 163 27.28. North Carolina 7 22 11 21 1 0 0 188 26.99. Wake Forest 6 20 7 20 0 0 0 161 26.8
10. Virginia Tech 6 20 2 18 2 0 0 148 24.711. Virginia 6 15 10 14 1 0 0 136 22.712. Miami 6 18 4 15 0 0 0 135 22.513. Louisville 7 20 5 17 0 0 0 152 21.714. Florida State 7 18 5 18 0 0 0 141 20.1
SCORING DEFENSE G TD FG XPT 2XP DXP Saf Pts Avg/G
1. Clemson 7 10 6 9 0 0 0 87 12.42. Virginia 6 13 6 11 1 0 0 109 18.23. Miami 6 13 12 13 0 0 0 127 21.24. Boston College 6 19 4 18 0 0 0 144 24.05. Virginia Tech 6 21 7 21 0 0 0 168 28.06. Syracuse 7 24 12 23 0 0 0 203 29.0
Duke 6 22 6 18 2 0 1 174 29.0Pitt 6 22 7 19 1 0 0 174 29.0
9. Georgia Tech 7 28 4 27 1 0 0 209 29.910. NC State 6 24 8 23 0 0 0 191 31.811. Florida State 7 28 11 28 0 0 0 229 32.712. North Carolina 7 34 6 31 1 0 0 255 36.413. Wake Forest 6 32 6 31 0 0 0 241 40.214. Louisville 7 46 8 46 0 0 0 346 49.4
TOTAL OFFENSE G Rush Pass Plays Yards Avg/P TD Avg/G
1. Clemson 7 1844 1883 503 3727 7.4 43 532.42. Pitt 6 1861 881 364 2742 7.5 28 457.03. Syracuse 7 1271 1899 576 3170 5.5 31 452.94. North Carolina 7 1349 1735 522 3084 5.9 20 440.65. NC State 6 797 1845 455 2642 5.8 21 440.36. Wake Forest 6 1234 1356 511 2590 5.1 18 431.77. Duke 6 864 1625 437 2489 5.7 22 414.88. Georgia Tech 7 2394 437 492 2831 5.8 31 404.49. Virginia Tech 6 772 1482 424 2254 5.3 19 375.7
10. Louisville 7 799 1818 504 2617 5.2 19 373.911. Boston College 6 1042 1172 417 2214 5.3 19 369.012. Virginia 6 870 1167 390 2037 5.2 15 339.513. Miami 6 1069 945 382 2014 5.3 15 335.714. Florida State 7 437 1877 459 2314 5.0 17 330.6
TOTAL DEFENSE G Rush Pass Plays Yards Avg/P TD Avg/G
1. Clemson 7 555 1177 478 1732 3.6 8 247.42. Miami 6 1028 763 409 1791 4.4 12 298.53. Virginia 6 769 1189 371 1958 5.3 13 326.34. Georgia Tech 7 1019 1579 414 2598 6.3 26 371.15. Florida State 7 944 1853 573 2797 4.9 27 399.66. Boston College 6 965 1443 484 2408 5.0 17 401.37. Pitt 6 1129 1415 435 2544 5.8 22 424.08. Syracuse 7 1229 1770 528 2999 5.7 22 428.49. NC State 6 547 2034 412 2581 6.3 23 430.2
10. Virginia Tech 6 1576 1115 412 2691 6.5 21 448.511. Duke 6 1587 1137 449 2724 6.1 22 454.012. North Carolina 7 1688 1608 513 3296 6.4 31 470.913. Louisville 7 2259 1266 484 3525 7.3 42 503.614. Wake Forest 6 1308 1773 474 3081 6.5 32 513.5
RUSHING OFFENSE G Att. Yards Avg/A Long TD Avg/G
1. Georgia Tech 7 443 2394 5.4 65 27 342.02. Pitt 6 244 1861 7.6 97 22 310.23. Clemson 7 261 1844 7.1 70 24 263.44. Wake Forest 6 291 1234 4.2 74 7 205.75. North Carolina 7 254 1349 5.3 84 11 192.76. Syracuse 7 310 1271 4.1 68 22 181.67. Miami 6 219 1069 4.9 83 9 178.28. Boston College 6 265 1042 3.9 45 10 173.79. Virginia 6 223 870 3.9 36 6 145.0
10. Duke 6 195 864 4.4 75 8 144.011. NC State 6 229 797 3.5 38 9 132.812. Virginia Tech 6 231 772 3.3 39 4 128.713. Louisville 7 233 799 3.4 61 12 114.114. Florida State 7 199 437 2.2 85 4 62.4
RUSHING DEFENSE G Att. Yards Avg/A Long TD Avg/G
1. Clemson 7 269 555 2.1 53 6 79.32. NC State 6 181 547 3.0 28 9 91.23. Virginia 6 188 769 4.1 75 6 128.24. Florida State 7 313 944 3.0 45 8 134.95. Georgia Tech 7 214 1019 4.8 46 13 145.66. Boston College 6 247 965 3.9 42 8 160.87. Miami 6 250 1028 4.1 75 7 171.38. Syracuse 7 276 1229 4.5 69 13 175.69. Pitt 6 246 1129 4.6 60 11 188.2
10. Wake Forest 6 236 1308 5.5 70 20 218.011. North Carolina 7 297 1688 5.7 68 16 241.112. Virginia Tech 6 265 1576 5.9 97 17 262.713. Duke 6 279 1587 5.7 84 14 264.514. Louisville 7 336 2259 6.7 74 27 322.7
PASS OFFENSE G Comp-Att-Int Pct. Yds Avg/A TD Avg/G
1. NC State 6 151-226-6 66.8 1845 8.2 12 307.52. Syracuse 7 157-266-5 59.0 1899 7.1 9 271.33. Duke 6 142-242-6 58.7 1625 6.7 14 270.84. Clemson 7 160-242-6 66.1 1883 7.8 19 269.05. Florida State 7 150-260-7 57.7 1877 7.2 13 268.16. Louisville 7 145-271-10 53.5 1818 6.7 7 259.77. North Carolina 7 165-268-7 61.6 1735 6.5 9 247.98. Virginia Tech 6 116-193-3 60.1 1482 7.7 15 247.09. Wake Forest 6 111-220-5 50.5 1356 6.2 11 226.0
10. Boston College 6 92-152-1 60.5 1172 7.7 9 195.311. Virginia 6 105-167-7 62.9 1167 7.0 9 194.512. Miami 6 82-163-6 50.3 945 5.8 6 157.513. Pitt 6 68-120-2 56.7 881 7.3 6 146.814. Georgia Tech 7 22-49-1 44.9 437 8.9 4 62.4
PASS DEFENSE G Comp-Att-Int Pct. Yds Avg/A TD Avg/G
1. Miami 6 87-159-9 54.7 763 4.8 5 127.22. Clemson 7 109-209-7 52.2 1177 5.6 2 168.13. Louisville 7 94-148-3 63.5 1266 8.6 15 180.94. Virginia Tech 6 91-147-4 61.9 1115 7.6 4 185.85. Duke 6 93-170-0 54.7 1137 6.7 8 189.56. Virginia 6 105-183-7 57.4 1189 6.5 7 198.27. Georgia Tech 7 126-200-8 63.0 1579 7.9 13 225.68. North Carolina 7 126-216-6 58.3 1608 7.4 15 229.79. Pitt 6 113-189-3 59.8 1415 7.5 11 235.8
10. Boston College 6 135-237-9 57.0 1443 6.1 9 240.511. Syracuse 7 141-252-8 56.0 1770 7.0 9 252.912. Florida State 7 141-260-4 54.2 1853 7.1 19 264.713. Wake Forest 6 158-238-1 66.4 1773 7.4 12 295.514. NC State 6 147-231-3 63.6 2034 8.8 14 339.0

2018 Atlantic Coast ConferenceTeam Statistics Through games of Nov 11, 2018
(Conference games)
PASS EFFICIENCY G Comp-Att-Int Pct. Yds Avg/G TD Effic.
1. Clemson 7 160-242-6 66.1 1883 269.0 19 152.42. NC State 6 151-226-6 66.8 1845 307.5 12 147.63. Virginia Tech 6 116-193-3 60.1 1482 247.0 15 147.14. Boston College 6 92-152-1 60.5 1172 195.3 9 143.55. Georgia Tech 7 22-49-1 44.9 437 62.4 4 142.76. Pitt 6 68-120-2 56.7 881 146.8 6 131.57. Virginia 6 105-167-7 62.9 1167 194.5 9 131.08. Florida State 7 150-260-7 57.7 1877 268.1 13 129.49. Duke 6 142-242-6 58.7 1625 270.8 14 129.2
10. Syracuse 7 157-266-5 59.0 1899 271.3 9 126.411. North Carolina 7 165-268-7 61.6 1735 247.9 9 121.812. Wake Forest 6 111-220-5 50.5 1356 226.0 11 114.213. Louisville 7 145-271-10 53.5 1818 259.7 7 111.014. Miami 6 82-163-6 50.3 945 157.5 6 103.8
PASS DEFENSE EFFIC. G Comp-Att-Int Pct. Yds Avg/G TD Effic.
1. Miami 6 87-159-9 54.7 763 127.2 5 94.12. Clemson 7 109-209-7 52.2 1177 168.1 2 95.93. Boston College 6 135-237-9 57.0 1443 240.5 9 113.04. Virginia 6 105-183-7 57.4 1189 198.2 7 116.95. Syracuse 7 141-252-8 56.0 1770 252.9 9 120.46. Duke 6 93-170-0 54.7 1137 189.5 8 126.47. Virginia Tech 6 91-147-4 61.9 1115 185.8 4 129.28. Florida State 7 141-260-4 54.2 1853 264.7 19 135.19. North Carolina 7 126-216-6 58.3 1608 229.7 15 138.2
10. Pitt 6 113-189-3 59.8 1415 235.8 11 138.711. Georgia Tech 7 126-200-8 63.0 1579 225.6 13 142.812. Wake Forest 6 158-238-1 66.4 1773 295.5 12 144.813. NC State 6 147-231-3 63.6 2034 339.0 14 155.014. Louisville 7 94-148-3 63.5 1266 180.9 15 164.8
KICKOFF RETURNS G No. Yards TD Long Avg.
1. Clemson 7 11 268 0 40 24.42. Virginia 6 15 358 0 43 23.93. Louisville 7 31 730 1 93 23.54. Miami 6 20 464 0 53 23.25. Virginia Tech 6 21 470 0 45 22.46. Pitt 6 11 245 0 36 22.37. Boston College 6 21 455 0 44 21.7
North Carolina 7 18 390 0 34 21.79. NC State 6 9 184 0 47 20.4
10. Duke 6 17 339 0 46 19.911. Wake Forest 6 12 226 0 31 18.812. Florida State 7 19 342 0 35 18.013. Georgia Tech 7 10 177 0 26 17.714. Syracuse 7 8 137 0 26 17.1
PUNT RETURN AVG G No. Yards TD Long Avg.
1. Boston College 6 13 197 3 74 15.22. North Carolina 7 11 160 1 75 14.53. Florida State 7 15 208 1 74 13.94. Miami 6 7 77 0 49 11.05. Syracuse 7 12 116 0 40 9.76. Louisville 7 8 75 0 45 9.47. Virginia 6 20 165 0 43 8.28. Wake Forest 6 20 158 1 32 7.99. Clemson 7 25 175 1 58 7.0
10. Georgia Tech 7 7 46 0 15 6.611. Pitt 6 6 38 0 16 6.312. NC State 6 6 31 0 19 5.213. Virginia Tech 6 13 60 1 18 4.614. Duke 6 12 15 0 6 1.2
INTERCEPTIONS G No. Yards TD Long Avg.
1. Miami 6 9 189 2 83 21.02. Boston College 6 9 47 0 23 5.23. Syracuse 7 8 45 0 39 5.64. Georgia Tech 7 8 203 1 95 25.45. Virginia 6 7 159 0 62 22.76. Clemson 7 7 180 1 46 25.77. North Carolina 7 6 38 0 19 6.38. Florida State 7 4 11 0 11 2.89. Virginia Tech 6 4 4 0 4 1.0
10. Pitt 6 3 20 0 20 6.711. Louisville 7 3 34 0 34 11.312. NC State 6 3 1 0 1 0.313. Wake Forest 6 1 8 0 8 8.014. Duke 6 0 0 0 0 0.0
PUNTING G No. Yards Avg/P Ret. Avg/R TB Net/P
1. Georgia Tech 7 20 913 45.7 32 1.6 2 42.02. Syracuse 7 39 1703 43.7 116 3.0 3 39.23. Virginia Tech 6 36 1528 42.4 100 2.8 1 39.14. Virginia 6 22 918 41.7 19 0.9 3 38.15. NC State 6 23 953 41.4 63 2.7 1 37.86. North Carolina 7 31 1219 39.3 49 1.6 0 37.77. Wake Forest 6 44 1808 41.1 131 3.0 1 37.78. Pitt 6 24 962 40.1 58 2.4 1 36.89. Clemson 7 30 1194 39.8 84 2.8 1 36.3
10. Boston College 6 41 1667 40.7 143 3.5 2 36.211. Duke 6 31 1245 40.2 138 4.5 0 35.712. Florida State 7 53 2205 41.6 267 5.0 3 35.413. Louisville 7 40 1534 38.3 148 3.7 2 33.714. Miami 6 29 1093 37.7 173 6.0 0 31.7
KICKOFF COVERAGE G No. Yards Avg. Ret. TB NetAvg
1. Duke 6 31 1853 59.8 403 6 41.92. Virginia 6 29 1875 64.7 168 20 41.63. Syracuse 7 54 3357 62.2 148 39 41.44. Boston College 6 32 1980 61.9 442 9 41.05. North Carolina 7 37 2327 62.9 299 21 40.66. Clemson 7 60 3765 62.8 418 38 40.07. Louisville 7 31 1752 56.5 339 7 39.98. Pitt 6 43 2631 61.2 398 21 39.79. Virginia Tech 6 28 1812 64.7 100 24 39.7
10. NC State 6 36 2139 59.4 469 10 39.411. Wake Forest 6 33 1988 60.2 364 14 38.612. Georgia Tech 7 42 2552 60.8 722 9 38.213. Florida State 7 28 1697 60.6 196 18 37.514. Miami 6 27 1610 59.6 319 13 35.8
FIELD GOALS G Made Att Pct.
1. Pitt 6 9 9 1.000Wake Forest 6 7 7 1.000
3. NC State 6 11 12 . 9 1 74. Syracuse 7 20 22 . 9 0 95. Louisville 7 5 6 . 8 3 3
Boston College 6 5 6 . 8 3 37. Clemson 7 7 9 . 7 7 88. Virginia 6 10 13 . 7 6 99. Georgia Tech 7 4 6 . 6 6 7
Miami 6 4 6 . 6 6 711. Florida State 7 5 8 . 6 2 512. North Carolina 7 11 18 . 6 1 113. Duke 6 3 6 . 5 0 0
Virginia Tech 6 2 4 . 5 0 0

2018 Atlantic Coast ConferenceTeam Statistics Through games of Nov 11, 2018
(Conference games)
PAT KICKING G Made Att Pct.
1. Clemson 7 46 46 1.000Syracuse 7 30 30 1.000Duke 6 22 22 1.000North Carolina 7 21 21 1.000NC State 6 20 20 1.000Wake Forest 6 20 20 1.000Virginia Tech 6 18 18 1.000Florida State 7 18 18 1.000Virginia 6 14 14 1.000
10. Georgia Tech 7 30 31 . 9 6 811. Pitt 6 27 28 . 9 6 412. Boston College 6 20 21 . 9 5 213. Miami 6 15 17 . 8 8 214. Louisville 7 17 20 . 8 5 0
SACKS BY G No. Yards Avg/G
1. Syracuse 7 24 167 3.43Clemson 7 24 157 3.43
3. NC State 6 23 146 3.834. Florida State 7 21 159 3.005. North Carolina 7 20 131 2.866. Miami 6 16 102 2.677. Pitt 6 15 103 2.50
Boston College 6 15 97 2.50Virginia 6 15 82 2.50
10. Virginia Tech 6 14 89 2.3311. Duke 6 10 57 1.6712. Wake Forest 6 9 46 1.5013. Georgia Tech 7 8 51 1.1414. Louisville 7 4 26 0.57
SACKS AGAINST G No. Yards Avg/G
1. NC State 6 3 21 0.502. Georgia Tech 7 9 56 1.29
North Carolina 7 9 62 1.294. Clemson 7 10 68 1.435. Boston College 6 11 70 1.836. Pitt 6 12 88 2.007. Virginia Tech 6 13 79 2.178. Miami 6 15 95 2.509. Duke 6 17 109 2.83
10. Virginia 6 20 140 3.33Syracuse 7 20 132 2.86
12. Wake Forest 6 23 137 3.8313. Florida State 7 25 167 3.5714. Louisville 7 31 189 4.43
FIRST DOWNS G Rush Pass Pen Total Avg/G
1. Clemson 7 77 82 11 170 24.32. Georgia Tech 7 134 17 11 162 23.13. Syracuse 7 66 74 20 160 22.94. North Carolina 7 65 79 6 150 21.45. NC State 6 50 75 19 144 24.06. Louisville 7 53 80 8 141 20.17. Wake Forest 6 71 60 7 138 23.08. Duke 6 44 74 8 126 21.09. Virginia Tech 6 49 65 5 119 19.8
10. Pitt 6 78 31 7 116 19.311. Virginia 6 54 52 9 115 19.212. Florida State 7 25 72 8 105 15.013. Boston College 6 52 45 3 100 16.714. Miami 6 52 40 6 98 16.3
OPPONENT 1ST DOWNS G Rush Pass Pen Total Avg/G
1. Clemson 7 40 44 9 93 13.32. Virginia 6 39 57 8 104 17.33. Miami 6 59 39 8 106 17.74. Virginia Tech 6 69 44 9 122 20.35. NC State 6 35 78 12 125 20.86. Duke 6 72 52 4 128 21.37. Georgia Tech 7 60 65 6 131 18.78. Pitt 6 64 61 9 134 22.39. Boston College 6 57 72 8 137 22.8
10. Wake Forest 6 54 75 11 140 23.311. Syracuse 7 70 65 11 146 20.912. Florida State 7 64 76 18 158 22.6
North Carolina 7 84 67 7 158 22.614. Louisville 7 103 51 8 162 23.1
3RD-DOWN CONVERSIONS G Conv. Att. Pct.
1. Duke 6 42 92 45.72. Georgia Tech 7 40 88 45.53. Clemson 7 42 93 45.24. Virginia 6 35 81 43.25. NC State 6 36 84 42.96. Louisville 7 43 106 40.67. Syracuse 7 46 115 40.08. Pitt 6 27 68 39.79. Miami 6 32 81 39.5
10. North Carolina 7 40 108 37.011. Virginia Tech 6 31 90 34.412. Wake Forest 6 37 112 33.013. Boston College 6 28 94 29.814. Florida State 7 30 110 27.3
OPP 3RD-DN CONVERT G Conv. Att. Pct.
1. Clemson 7 28 113 24.82. Syracuse 7 29 107 27.13. Miami 6 28 89 31.54. Virginia Tech 6 28 80 35.05. NC State 6 29 81 35.86. Boston College 6 37 101 36.67. Florida State 7 45 122 36.98. Duke 6 34 87 39.19. Virginia 6 32 78 41.0
10. Wake Forest 6 45 106 42.511. Pitt 6 41 90 45.612. North Carolina 7 45 97 46.413. Georgia Tech 7 41 80 51.214. Louisville 7 47 91 51.6
4TH-DOWN CONVERSIONS G Conv. Att. Pct.
1. Pitt 6 6 6 100.02. Virginia Tech 6 10 18 55.6
NC State 6 5 9 55.64. Florida State 7 7 13 53.85. Wake Forest 6 10 19 52.66. Clemson 7 4 8 50.0
Boston College 6 5 10 50.0Georgia Tech 7 8 16 50.0
9. Virginia 6 4 9 44.4Syracuse 7 4 9 44.4
11. Miami 6 5 12 41.7North Carolina 7 5 12 41.7
13. Louisville 7 7 17 41.214. Duke 6 4 12 33.3

2018 Atlantic Coast ConferenceTeam Statistics Through games of Nov 11, 2018
(Conference games)
OPP 4TH-DN CONVERT G Conv. Att. Pct.
1. Clemson 7 4 13 30.82. Duke 6 5 12 41.73. Virginia Tech 6 4 9 44.44. Florida State 7 8 17 47.15. Virginia 6 6 12 50.0
Syracuse 7 6 12 50.0Wake Forest 6 6 12 50.0NC State 6 7 14 50.0Georgia Tech 7 4 8 50.0
10. Pitt 6 8 15 53.311. North Carolina 7 6 11 54.512. Boston College 6 10 18 55.613. Miami 6 4 7 57.114. Louisville 7 6 10 60.0
PENALTIES G No. Yards Avg/G
1. Duke 6 25 198 33.02. Georgia Tech 7 28 238 34.03. Clemson 7 30 259 37.04. North Carolina 7 36 298 42.65. Boston College 6 35 283 47.26. Virginia 6 32 291 48.57. Pitt 6 28 295 49.28. Syracuse 7 49 348 49.79. Virginia Tech 6 36 320 53.3
10. NC State 6 33 334 55.711. Wake Forest 6 31 335 55.812. Miami 6 40 336 56.013. Louisville 7 54 451 64.414. Florida State 7 70 571 81.6
OPPONENT PENALTIES G No. Yards Avg/G
1. Syracuse 7 58 480 68.62. NC State 6 50 402 67.03. Clemson 7 52 441 63.04. Virginia 6 38 361 60.25. Duke 6 33 337 56.26. Florida State 7 41 378 54.07. Miami 6 31 310 51.78. Wake Forest 6 33 281 46.89. Louisville 7 34 309 44.1
10. Georgia Tech 7 33 302 43.111. Pitt 6 32 254 42.312. North Carolina 7 36 287 41.013. Virginia Tech 6 32 240 40.014. Boston College 6 24 175 29.2
TIME OF POSSESSION G Total possession Avg/G
1. Georgia Tech 7 251:00 35:512. NC State 6 202:16 33:423. Virginia 6 195:50 32:384. Louisville 7 218:55 31:165. Syracuse 7 215:02 30:436. Pitt 6 183:41 30:367. Virginia Tech 6 177:41 29:368. Miami 6 175:07 29:119. Clemson 7 202:28 28:55
10. North Carolina 7 201:55 28:5011. Wake Forest 6 168:37 28:0612. Boston College 6 164:26 27:2413. Duke 6 161:20 26:5314. Florida State 7 181:35 25:56
TURNOVER MARGINGained Lost
Fum Int Tot Fum Int Tot Margin Per/G
1. Boston College 6 4 9 13 5 1 6 +7 1.172. Syracuse 7 9 8 17 4 5 9 +8 1.143. Georgia Tech 7 8 8 16 9 1 10 +6 0.864. Virginia Tech 6 6 4 10 2 3 5 +5 0.835. Pitt 6 5 3 8 4 2 6 +2 0.336. Virginia 6 2 7 9 1 7 8 +1 0.17
Miami 6 5 9 14 7 6 13 +1 0.178. North Carolina 7 8 6 14 8 7 15 -1 -0.14
Clemson 7 4 7 11 6 6 12 -1 -0.1410. NC State 6 4 3 7 3 6 9 -2 -0.3311. Wake Forest 6 4 1 5 3 5 8 -3 -0.5012. Duke 6 5 0 5 5 6 11 -6 -1.0013. Florida State 7 2 4 6 7 7 14 -8 -1.1414. Louisville 7 6 3 9 8 10 18 -9 -1.29
RED ZONE OFFENSE G Scores Pct. TDs (R-P) FGs TurnO
1. Clemson 7 33-35 94.3 27 15-12 6-7 12. Syracuse 7 37-42 88.1 23 19-4 14-14 23. Boston College 6 14-16 87.5 10 7-3 4-4 14. North Carolina 7 25-29 86.2 15 8-7 10-13 15. Louisville 7 18-21 85.7 15 11-4 3-3 2
Virginia Tech 6 12-14 85.7 10 3-7 2-2 07. Pitt 6 17-20 85.0 14 12-2 3-3 28. NC State 6 26-31 83.9 17 9-8 9-10 19. Georgia Tech 7 29-35 82.9 26 25-1 3-3 1
10. Wake Forest 6 19-23 82.6 13 5-8 6-6 111. Miami 6 16-20 80.0 12 7-5 4-5 012. Duke 6 15-19 78.9 12 6-6 3-4 313. Virginia 6 16-23 69.6 9 5-4 7-9 114. Florida State 7 10-15 66.7 8 3-5 2-3 1
RED ZONE DEFENSE G Scores Pct. TDs (R-P) FGs TurnO
1. Clemson 7 12-16 75.0 7 6-1 5-5 02. Virginia Tech 6 21-27 77.8 15 13-2 6-8 33. North Carolina 7 26-33 78.8 21 13-8 5-6 24. Duke 6 15-19 78.9 11 8-3 4-5 05. Boston College 6 19-24 79.2 15 8-7 4-5 1
NC State 6 19-24 79.2 14 8-6 5-6 37. Florida State 7 32-38 84.2 23 8-15 9-10 18. Miami 6 17-20 85.0 9 5-4 8-9 09. Georgia Tech 7 18-21 85.7 15 10-5 3-3 3
Syracuse 7 24-28 85.7 17 11-6 7-7 211. Pitt 6 19-22 86.4 14 9-5 5-6 112. Louisville 7 34-38 89.5 28 21-7 6-7 113. Virginia 6 12-13 92.3 8 4-4 4-4 014. Wake Forest 6 19-20 95.0 14 11-3 5-5 0
ON-SIDE KICKS BY G Recovered Attempts Success%
1. Virginia 6 1 1 100.02. Florida State 7 0 1 0.0
NC State 6 0 1 0.0Boston College 6 0 1 0.0Georgia Tech 7 0 1 0.0North Carolina 7 0 1 0.0Louisville 7 0 0 0.0Wake Forest 6 0 0 0.0Pitt 6 0 0 0.0Syracuse 7 0 0 0.0Miami 6 0 0 0.0Duke 6 0 0 0.0Virginia Tech 6 0 0 0.0Clemson 7 0 0 0.0

2018 Atlantic Coast ConferenceTeam Statistics Through games of Nov 11, 2018
(Conference games)
ON-SIDE KICKS AGAINST G Recovered Attempts Success%
1. Pitt 6 0 1 0.0Duke 6 0 1 0.0Clemson 7 0 1 0.0Syracuse 7 0 1 0.0Georgia Tech 7 0 0 0.0North Carolina 7 0 0 0.0Louisville 7 0 0 0.0Miami 6 0 0 0.0Virginia Tech 6 0 0 0.0Boston College 6 0 0 0.0Wake Forest 6 0 0 0.0Florida State 7 0 0 0.0Virginia 6 0 0 0.0
14. NC State 6 1 2 50.0
ATTENDANCE Home Away Neutral TotalBoston College 3-40164 3-49394 0-0 6-44779Clemson 3-80053 4-48776 0-0 7-62181Duke 3-29316 3-45324 0-0 6-37320Florida State 3-70305 4-53336 0-0 7-60608Georgia Tech 3-46840 4-48089 0-0 7-47554Louisville 3-51353 4-46866 0-0 7-48789Miami 3-63029 3-45041 0-0 6-54035NC State 4-57167 2-61032 0-0 6-58456North Carolina 3-45150 4-43668 0-0 7-44303Pitt 4-36823 2-40212 0-0 6-37953Syracuse 4-39058 3-47786 0-0 7-42799Virginia 4-39056 2-38938 0-0 6-39017Virginia Tech 2-65632 4-50578 0-0 6-55596Wake Forest 3-27684 3-57702 0-0 6-42693Totals 45-48475 45-48475 0-0 90-48475

2018 Atlantic Coast ConferenceIndividual Statistics Through games of Nov 11, 2018
(Conference games)
RUSHING Cl G Att. Yds Avg. TD Lg Avg/G
1. Qadree Ollison-UP Sr 6 94 763 8.1 8 97 127.22. Travis Etienne-CU So 7 92 807 8.8 11 70 115.33. Darrin Hall-UP Sr 6 69 688 10.0 8 75 114.74. Matt Colburn II-WF Sr 6 102 553 5.4 4 74 92.25. TaQuon Marshall-GT Sr 6 124 519 4.2 7 44 86.56. Deon Jackson-DU So 6 88 502 5.7 4 75 83.77. Tobias Oliver-GT Fr 6 96 497 5.2 7 65 82.88. Michael Carter-NC So 7 77 550 7.1 2 49 78.69. Travis Homer-UM Jr 6 85 456 5.4 2 70 76.0
10. Reggie Gallaspy-ST Sr 6 102 417 4.1 5 22 69.5
PASSING AVG/GAME Cl G Comp-Att-Int Yds TD Avg/G
1. Ryan Finley-ST Sr 6 150-223-6 1808 12 301.32. Daniel Jones-DU Jr 6 137-233-6 1559 12 259.83. Ryan Willis-VT Jr 5 99-161-3 1266 13 253.24. Deondre Francois-FS Jr 6 117-204-6 1367 8 227.85. Jawon Pass-UL So 7 129-233-7 1577 6 225.36. Eric Dungey-SU Sr 7 132-227-4 1505 5 215.0
Nathan Elliott-NC Jr 7 146-228-3 1505 8 215.08. Trevor Lawrence-CU Fr 7 126-186-3 1420 14 202.99. Sam Hartman-WF Fr 5 86-172-5 1013 8 202.6
10. Bryce Perkins-VA Jr 6 104-163-7 1158 9 193.0
PASS EFFICIENCY Cl G Comp-Att-Int Yds TD Eff.
1. Trevor Lawrence-CU Fr 7 126-186-3 1420 14 153.52. Ryan Willis-VT Jr 5 99-161-3 1266 13 150.53. Anthony Brown-BC So 6 78-129-1 1016 9 148.14. Ryan Finley-ST Sr 6 150-223-6 1808 12 147.75. Bryce Perkins-VA Jr 6 104-163-7 1158 9 133.16. Kenny Pickett-UP So 6 68-119-2 881 6 132.67. Nathan Elliott-NC Jr 7 146-228-3 1505 8 128.48. Daniel Jones-DU Jr 6 137-233-6 1559 12 126.89. Deondre Francois-FS Jr 6 117-204-6 1367 8 120.7
10. Eric Dungey-SU Sr 7 132-227-4 1505 5 117.6
RECEPTIONS/GAME Cl G No. Yds TD Lg Yds/G Rec/G
1. Kelvin Harmon-ST Jr 6 47 653 5 74 108.8 7.82. Jakobi Meyers-ST Jr 6 46 468 2 35 78.0 7.73. Olamide Zaccheaus-VA Sr 6 40 358 2 35 59.7 6.74. Greg Dortch-WF So 6 39 459 2 35 76.5 6.55. Sean Riley-SU Jr 7 42 429 0 48 61.3 6.0
T.J. Rahming-DU Sr 6 36 360 3 48 60.0 6.07. Johnathan Lloyd-DU Sr 6 29 302 2 68 50.3 4.88. Dazz Newsome-NC So 7 32 388 2 55 55.4 4.69. Nyqwan Murray-FS Sr 7 31 423 3 58 60.4 4.4
Tee Higgins-CU So 7 31 408 6 46 58.3 4.4
RECEIVE YDS/GAME Cl G No. Yds TD Lg Avg/C Yds/G
1. Kelvin Harmon-ST Jr 6 47 653 5 74 13.9108.82. Jakobi Meyers-ST Jr 6 46 468 2 35 10.2 78.03. Greg Dortch-WF So 6 39 459 2 35 11.8 76.54. Jamal Custis-SU Sr 7 29 517 2 68 17.8 73.95. Sean Riley-SU Jr 7 42 429 0 48 10.2 61.36. Nyqwan Murray-FS Sr 7 31 423 3 58 13.6 60.47. T.J. Rahming-DU Sr 6 36 360 3 48 10.0 60.08. Olamide Zaccheaus-VA Sr 6 40 358 2 35 8.9 59.79. Tee Higgins-CU So 7 31 408 6 46 13.2 58.3
10. Dazz Newsome-NC So 7 32 388 2 55 12.1 55.4
TOTAL OFFENSE Cl G Rush Pass Plays Total Yds/G
1. Daniel Jones-DU Jr 6 287 1559 301 1846 307.72. Ryan Finley-ST Sr 6 25 1808 243 1833 305.53. Ryan Willis-VT Jr 5 229 1266 218 1495 299.04. Eric Dungey-SU Sr 7 369 1505 332 1874 267.75. Bryce Perkins-VA Jr 6 329 1158 263 1487 247.86. Jawon Pass-UL So 7 83 1577 292 1660 237.17. Sam Hartman-WF Fr 5 132 1013 239 1145 229.08. Deondre Francois-FS Jr 6 -55 1367 245 1312 218.79. Nathan Elliott-NC Jr 7 -30 1505 254 1475 210.7
10. Trevor Lawrence-CU Fr 7 45 1420 216 1465 209.3
SCORING Cl G TD FG XPT 2XP Pts Pts/G
1. Andre Szmyt-SU Fr 7 0 20 30 0 90 12.92. Travis Etienne-CU So 7 12 0 0 0 72 10.33. Alex Kessman-UP So 6 0 9 27 0 54 9.04. Christopher Dunn-ST Fr 6 0 11 20 0 53 8.85. Darrin Hall-UP Sr 6 8 0 0 0 48 8.0
Qadree Ollison-UP Sr 6 8 0 0 0 48 8.07. Freeman Jones-NC Sr 7 0 11 21 0 54 7.78. Greg Huegel-CU Sr 7 0 6 35 0 53 7.69. TaQuon Marshall-GT Sr 6 7 0 0 0 42 7.0
Tobias Oliver-GT Fr 6 7 0 0 0 42 7.0
SCORING (TDs) Cl G TD Run Pass Ret Pat Pts Avg/G
1. Travis Etienne-CU So 7 12 11 1 0 0 72 10.32. Darrin Hall-UP Sr 6 8 8 0 0 0 48 8.0
Qadree Ollison-UP Sr 6 8 8 0 0 0 48 8.04. TaQuon Marshall-GT Sr 6 7 7 0 0 0 42 7.0
Tobias Oliver-GT Fr 6 7 7 0 0 0 42 7.06. Eric Dungey-SU Sr 7 8 8 0 0 0 48 6.97. Damon Hazelton-VT So 6 5 0 5 0 1 32 5.3
Eric Kumah-VT Jr 6 5 0 4 1 1 32 5.39. Tee Higgins-CU So 7 6 0 6 0 0 36 5.1
Jarveon Howard-SU Fr 7 6 6 0 0 0 36 5.1
SCORING (KICK) Cl G PAT FG Pts Avg/G
1. Andre Szmyt-SU Fr 7 30-30 20-22 90 12.92. Alex Kessman-UP So 6 27-28 9-9 54 9.03. Christopher Dunn-ST Fr 6 20-20 11-12 53 8.84. Freeman Jones-NC Sr 7 21-21 11-18 54 7.75. Greg Huegel-CU Sr 7 35-35 6-7 53 7.66. Nick Sciba-WF Fr 6 20-20 7-7 41 6.87. Colton Lichtenberg-BC Sr 5 15-15 5-6 30 6.08. Brian Delaney-VA So 6 8-8 8-10 32 5.39. Collin Wareham-DU Sr 6 22-22 3-6 31 5.2
10. Ricky Aguayo-FS Jr 7 18-18 5-8 33 4.7
PUNT RETURN AVG Cl G No. Yds TD Long Avg/G
1. D.J. Matthews-FS So 7 14 214 1 74 15.32. Amari Rodgers-CU So 7 22 174 1 58 7.93. Greg Dortch-WF So 6 16 83 0 29 5.24. T.J. Rahming-DU Sr 6 12 15 0 6 1.2
KICK RETURN AVG Cl G No. Yds TD Long Avg/G
1. Joe Reed-VA Jr 6 12 295 0 43 24.62. Deon Jackson-DU So 6 12 292 0 46 24.33. Hassan Hall-UL Fr 7 28 659 1 93 23.54. Michael Walker-BC Sr 6 19 433 0 44 22.85. DeeJay Dallas-UM So 6 14 313 0 53 22.46. Anthony Ratliff-NC Jr 7 14 303 0 31 21.6

2018 Atlantic Coast ConferenceIndividual Statistics Through games of Nov 11, 2018
(Conference games)
ALL PURPOSE Cl G Rush Rcv PR KR Yds Avg/G
1. Deon Jackson-DU So 6 502 167 0 292 961 160.22. Qadree Ollison-UP Sr 6 763 45 0 0 808 134.73. Hassan Hall-UL Fr 7 201 67 0 659 927 132.44. Michael Walker-BC Sr 6 27 137 155 433 752 125.35. Darrin Hall-UP Sr 6 688 31 0 12 731 121.86. Travis Etienne-CU So 7 807 33 0 0 840 120.07. Greg Dortch-WF So 6 -5 459 83 178 715 119.28. DeeJay Dallas-UM So 6 338 3 60 313 714 119.09. Kelvin Harmon-ST Jr 6 0 653 0 0 653 108.8
10. Anthony Ratliff-NC Jr 7 54 383 0 303 740 105.7
PUNTING Cl G No. Yds Lg I20 50+ TB Avg.
1. Pressley Harvin III-GT So 6 20 913 58 9 7 2 45.72. Sterling Hofrichter-SU Jr 7 39 1703 58 14 11 3 43.73. A.J. Cole-ST Sr 6 22 953 61 11 3 1 43.34. Oscar Bradburn-VT So 6 36 1528 72 10 2 1 42.45. Logan Tyler-FS Jr 7 52 2205 61 6 12 3 42.46. Dom Maggio-WF Jr 6 43 1796 55 12 7 1 41.87. Lester Coleman-VA Sr 6 22 918 53 8 5 3 41.78. Grant Carlson-BC So 6 40 1667 54 16 5 2 41.79. Austin Parker-DU Jr 6 29 1191 57 12 8 0 41.1
10. Kirk Christodoulou-UP Fr 6 24 962 52 6 3 1 40.1
FIELD GOALS Cl G Made Att. Long Pct. FG/G
1. Andre Szmyt-SU Fr 7 20 22 54 90.9 2.862. Christopher Dunn-ST Fr 6 11 12 44 91.7 1.833. Freeman Jones-NC Sr 7 11 18 48 61.1 1.574. Alex Kessman-UP So 6 9 9 55 100.0 1.505. Brian Delaney-VA So 6 8 10 46 80.0 1.336. Nick Sciba-WF Fr 6 7 7 47 100.0 1.177. Colton Lichtenberg-BC Sr 5 5 6 38 83.3 1.008. Greg Huegel-CU Sr 7 6 7 43 85.7 0.869. Blanton Creque-UL Jr 7 5 6 46 83.3 0.71
Ricky Aguayo-FS Jr 7 5 8 53 62.5 0.71
FIELD GOAL PCT Cl G Made Att. Long Pct.
1. Christopher Dunn-ST Fr 6 11 12 44 91.72. Andre Szmyt-SU Fr 7 20 22 54 90.93. Freeman Jones-NC Sr 7 11 18 48 61.1
PAT KICKING PCT Cl G Made Att. Pct.
1. Greg Huegel-CU Sr 7 35 35 100.0Andre Szmyt-SU Fr 7 30 30 100.0Collin Wareham-DU Sr 6 22 22 100.0Freeman Jones-NC Sr 7 21 21 100.0Nick Sciba-WF Fr 6 20 20 100.0Christopher Dunn-ST Fr 6 20 20 100.0Ricky Aguayo-FS Jr 7 18 18 100.0Brian Johnson-VT So 6 16 16 100.0Colton Lichtenberg-BC Sr 5 15 15 100.0
10. Alex Kessman-UP So 6 27 28 96.4

2018 Atlantic Coast ConferenceIndividual Statistics Through games of Nov 11, 2018
(Conference games)
TACKLES (All positions) Cl G Pos Solo Ast Total Avg/G
1. Cole Holcomb-NC Sr 7 LB 45 35 80 11.42. Joe Giles-Harris-DU Jr 5 LB 25 29 54 10.83. Germaine Pratt-ST Sr 6 LB 36 25 61 10.24. Connor Strachan-BC Sr 6 LB 34 26 60 10.0
Cameron Glenn-WF Sr 6 DB 39 21 60 10.06. Isaiah McDuffie-BC So 6 LB 31 27 58 9.77. Justin Strnad-WF Jr 6 LB 32 24 56 9.38. Ryan Guthrie-SU Sr 7 LB 36 27 63 9.0
Kielan Whitner-SU Sr 7 LB 35 28 63 9.0Rayshard Ashby-VT So 5 LB 21 24 45 9.0
11. Jaquan Johnson-UM Sr 5 DB 22 21 43 8.612. Hamsah Nasirildeen-FS So 7 DB 28 29 57 8.113. Damar Hamlin-UP Jr 6 DB 36 12 48 8.014. Kendall Joseph-CU Sr 6 LB 22 25 47 7.815. Michael Pinckney-UM Jr 6 LB 27 18 45 7.516. Shaquille Quarterman-UM Jr 6 LB 25 19 44 7.3
Will Harris-BC Sr 6 DB 24 20 44 7.318. Evan Foster-SU Jr 7 DB 38 13 51 7.319. Zane Zandier-VA So 6 LB 17 26 43 7.220. Reggie Floyd-VT Jr 6 DB 30 12 42 7.0
Dylan Singleton-DU Jr 6 26 16 42 7.0Charles Snowden-VA So 6 LB 14 28 42 7.0Essang Bassey-WF Jr 6 DB 32 10 42 7.0
24. Ben Humphreys-DU Sr 5 LB 15 19 34 6.825. Max Richardson-BC So 6 LB 15 25 40 6.726. Juan Thornhill-VA Sr 6 SS 25 14 39 6.5
Dorian Etheridge-UL So 6 LB 25 14 39 6.5Divine Deablo-VT So 6 DB 26 13 39 6.5
29. Luke Masterson-WF So 5 DB 20 12 32 6.430. DeCalon Brooks-FS Fr 6 LB 12 26 38 6.331. Oluwaseun Idowu-UP Sr 6 LB 25 12 37 6.232. Dee Smith-UL Jr 7 23 20 43 6.133. A.J. Westbrook-FS Sr 7 DB 24 18 42 6.0
Amari Henderson-WF Jr 6 DB 24 12 36 6.0Marquis Waters-DU So 6 21 15 36 6.0
36. Dontavious Jackson-FS Jr 7 LB 23 18 41 5.937. Joey Blount-VA So 6 16 19 35 5.8
Sheldrick Redwine-UM Sr 6 DB 18 17 35 5.8Jarius Morehead-ST Jr 6 SAF 22 13 35 5.8
40. J.K. Britt-NC Sr 7 DB 26 14 40 5.741. Chris Peace-VA Sr 6 LB 14 19 33 5.5
Bryce Hall-VA Jr 6 CB 17 16 33 5.543. Carlos Basham, Jr.-WF So 5 DL 16 11 27 5.444. Zach Allen-BC Sr 6 DL 10 22 32 5.345. Isaiah Moore-ST Fr 6 LB 18 13 31 5.2
Gerald Willis III-UM Sr 6 DL 17 14 31 5.2Elias Reynolds-UP So 6 LB 14 17 31 5.2
48. Brant Mitchell-GT Sr 7 LB 19 15 34 4.9Isaiah Simmons-CU So 7 19 15 34 4.9Jaiden Woodbey-FS Fr 7 DB 14 20 34 4.9
SACKS Cl G Pos Solo Ast Total Avg/G
1. Brian Burns-FS Jr 7 DE 8 2 9.0 1.292. Wyatt Ray-BC Sr 6 DL 7 1 7.5 1.253. Alton Robinson-SU Jr 7 DL 6 0 6.0 0.864. Kendall Coleman-SU Jr 7 DL 5 0 5.0 0.715. Germaine Pratt-ST Sr 6 LB 4 1 4.5 0.75
Chris Peace-VA Sr 6 LB 4 1 4.5 0.757. Jonathan Garvin-UM So 6 DL 3 2 4.0 0.67
Shaquille Quarterman-UM Jr 6 LB 3 0 4.0 0.67Larrell Murchison-ST Jr 6 DT 3 2 4.0 0.67James Smith-Williams-ST Jr 6 DE 3 2 4.0 0.67
11. Jason Strowbridge-NC Jr 7 DL 4 0 4.0 0.5712. Dewayne Hendrix-UP Sr 6 DL 3 1 3.5 0.58
Houshun Gaines-VT Jr 6 DL 3 1 3.5 0.5814. Clelin Ferrell-CU Jr 7 DE 3 1 3.5 0.50
Marvin Wilson-FS So 7 DT 3 1 3.5 0.50Chris Slayton-SU Sr 7 DL 3 1 3.5 0.50Austin Bryant-CU Sr 7 DE 3 1 3.5 0.50
18. Anree Saint-Amour-GT Sr 7 DL 3 0 3.0 0.43Kingsley Jonathan-SU So 7 DL 2 2 3.0 0.43
20. Joe Jackson-UM Jr 6 DL 3 0 3.0 0.50
TACKLES FOR LOSS Cl G Pos Solo Ast Total Avg/G
1. Brian Burns-FS Jr 7 DE 11 5 13.5 1.932. Alton Robinson-SU Jr 7 DL 12 0 12.0 1.713. Ryan Guthrie-SU Sr 7 LB 7 3 8.5 1.214. Wyatt Ray-BC Sr 6 DL 7 2 8.0 1.33
Germaine Pratt-ST Sr 6 LB 6 4 8.0 1.336. Christian Wilkins-CU Sr 7 DT 5 5 7.5 1.077. Shaquille Quarterman-UM Jr 6 LB 5 5 7.5 1.258. Xavier Thomas-CU Fr 7 DE 6 2 7.0 1.009. Gerald Willis III-UM Sr 6 DL 6 2 7.0 1.17
10. Anree Saint-Amour-GT Sr 7 DL 6 2 7.0 1.0011. Justin Strnad-WF Jr 6 LB 4 5 6.5 1.0812. Clelin Ferrell-CU Jr 7 DE 5 3 6.5 0.93
Chris Slayton-SU Sr 7 DL 6 1 6.5 0.9314. Zach Allen-BC Sr 6 DL 5 3 6.5 1.08
Reggie Floyd-VT Jr 6 DB 5 3 6.5 1.0816. Larrell Murchison-ST Jr 6 DT 4 4 6.0 1.00
Jonathan Garvin-UM So 6 DL 3 6 6.0 1.00Rashad Weaver-UP So 6 DL 5 2 6.0 1.00
19. Kendall Coleman-SU Jr 7 DL 6 0 6.0 0.8620. Charles Snowden-VA So 6 LB 3 6 6.0 1.00

2018 Atlantic Coast ConferenceIndividual Statistics Through games of Nov 11, 2018
(Conference games)
PASSES DEFENDED Cl G BrUp Int. Total Avg/G
1. Bryce Hall-VA Jr 6 9 2 11 1.832. Hamp Cheevers-BC Jr 6 5 4 9 1.503. Taj-Amir Torres-BC Sr 6 7 1 8 1.334. Juan Thornhill-VA Sr 6 4 3 7 1.17
Brandon Sebastian-BC Fr 6 6 1 7 1.176. Essang Bassey-WF Jr 6 6 0 6 1.00
Amari Henderson-WF Jr 6 6 0 6 1.00Asante Samuel-FS Fr 6 6 0 6 1.00Charles Snowden-VA So 6 5 1 6 1.00
10. Patrice Rene-NC Jr 7 4 2 6 0.8611. Caleb Farley-VT Fr 6 3 2 5 0.83
Chris Ingram-ST So 6 5 0 5 0.83Zach Allen-BC Sr 6 4 1 5 0.83
14. Phillipie Motley-UP Sr 5 3 1 4 0.8015. Andre Cisco-SU Fr 7 4 1 5 0.71
Christopher Fredrick-SU Jr 7 2 3 5 0.71Tariq Carpenter-GT So 7 4 1 5 0.71
18. Tre Swilling-GT Fr 6 3 1 4 0.67Trajan Bandy-UM So 6 2 2 4 0.67Dane Jackson-UP Jr 6 4 0 4 0.67
INTERCEPTIONS Cl G No. Yds TD Long Avg/G
1. Hamp Cheevers-BC Jr 6 4 28 0 23 0.672. Juan Thornhill-VA Sr 6 3 86 0 62 0.503. Christopher Fredrick-SU Jr 7 3 -2 0 0 0.434. Romeo Finley-UM Jr 6 2 83 1 83 0.33
Bryce Hall-VA Jr 6 2 19 0 19 0.33Trajan Bandy-UM So 6 2 13 0 13 0.33Caleb Farley-VT Fr 6 2 0 0 0 0.33
8. Malik Rivera-GT Sr 7 2 84 0 42 0.29Tanner Muse-CU Jr 7 2 25 0 25 0.29Stanford Samuels-FS So 7 2 11 0 11 0.29
FUMBLES FORCED Cl G No. Avg/G
1. Brian Burns-FS Jr 7 3 0.43Anree Saint-Amour-GT Sr 7 3 0.43Cole Holcomb-NC Sr 7 3 0.43
4. Dane Jackson-UP Jr 6 2 0.33Germaine Pratt-ST Sr 6 2 0.33Oluwaseun Idowu-UP Sr 6 2 0.33Derrick Tangelo-DU So 6 2 0.33Joe Jackson-UM Jr 6 2 0.33
9. Alton Robinson-SU Jr 7 2 0.29Isaiah Simmons-CU So 7 2 0.29
FUMBLES RECOVERED Cl G No. Avg/G
1. Carlos Basham, Jr.-WF So 5 2 0.40Ben Humphreys-DU Sr 5 2 0.40
3. Khalil Ladler-VT So 6 2 0.33London Iakopo-UL Sr 6 2 0.33Jonathan Garvin-UM So 6 2 0.33Dane Jackson-UP Jr 6 2 0.33
7. Ryan Guthrie-SU Sr 7 2 0.29Alton Robinson-SU Jr 7 2 0.29
9. Demetrius Kemp-WF Sr 5 1 0.2010. Mehdi El Attrach-BC Jr 6 1 0.17