AS MICRO NOTES
22
AS MICRO REVISION PACK
-
Upload
lija-rahman -
Category
Documents
-
view
228 -
download
0
description
AS Micro notes according to the OCR specification
Transcript of AS MICRO NOTES

AS MICRO
REVISION
PACK

COLOUR CODE TO REVISION GUIDE
GREENHEADING/SUB HEADING
BLUEDEFINITION
ORANGEEXPLAINING A CONCEPT

What is Economics?the study of how to allocate scarce resources in
the most effective way.
Economics ProblemScarce resources
Unlimited wants
Choice
MICROECONOMICSStudy of households and firms making decisions
in the market.
MACROECONOMICSStudy of issues that affects economies as a
whole.
FACTORS OF PRODUCTION
Things that are available to the economy and are used to
produce the goods and services.
LABOURThis is human resources that is available to the economy.
Quality and quantity are a key consideration.
CAPITALAny physical resource covering anything that can be
regarded as a man made aid for production. Machines and
infrastructure.
LANDland is used to create the products such as factories and
buildings
ENTREPRENEURSHIPPure human capital, people who come up with the ideas
OPPORTUNITY
COSTthe cost of the next best alternative, which is
forgone when a choice is made.
SPECIALISATION
Concentration of workers to a specific job of goods and
services.
ADVANTAGES OF SPECIALISATION An increase in output
Widening of the range of goods and services.
Exchange between developed and developing
countries
RISKS OF SPECIALISATION If a country has finite resources, they would run out
eventually
Bad weather may wipe out a years worth of crops
The taste of the consumers may change with in time
Any political reasons may effect the outcome of
specialisation

PCC- Reasons Two reasons for change in the PPC Curve
More resources for production
Economic growth
Technological changes
PCC – OPPORTUNITY COST PPC shows the opportunity cost by
choosing to increase the production
of one of the variables. For example,
if they decide to produce
more cars, then the
opportunity cost is less
television sets are
produced.
PPC CURVES
Shows maximum quantities at different
combinations at current resources
C=underproduction as it is
inefficient
D= is above the amount of
which they can produce with
their resources
A/B= possible combinations
If steep- devoting to
the X axis
If flat- devoting to Y
axis
TRADE OFF - The calculation involved in deciding on
whether to give up one good for another. For example,
having more television the trade off is less cars.
MARKET ECONOMY
In this economy the resources are allocates by the
forces of demand and supply through the price
mechanism.
The government has little interference in the market
economy, but keeps an eye on things.
But they interfere with things such as healthcare and
education so that it can be allocated, as these things
can not be allocated through the price mechanism.
Excess of supply from
firms
Fall in price Firms are willing to
supply less
Increase in price
More firms now willing to supply
Increase in supply
Fall in price
COMMAND ECONOMY
An economic system is which most resources are
state owned and also allocates centrally.
FEATURES:Government has the central role in all
decisions
They decode what is available to the consumer
and the manufacture
Government responsible for all allocations
Prices and wages are also controlled
Ownership of firms and businesses is owned
by the state
THERE IS ALWAYS GOVERNMENT INTERVENTION

CONSUMER SURPLUS
The extra amount that a consumer is willing to
pay for a product above the price that is
actually paid.
For example to go to the cinema it costs £1.50 but the person is willing to pay £4, the
surplus for the first visit is £3.50.
For the second trip he is willing to pay £3 for
the same admission fee, the surplus is £1.50.
When demand for five trip, he will receive a
surplus of £5.05. ( add up all the extra
surpluses)
CONSUMER SURPLUS CONTINUED
Consumer surplus can be presented
on the demand curve, showing the
additional money which the consumer
would be willing to pay.
If the market price were to change
then the consumer surplus would also
change.
WHAT EFFECTS THE DEMAND CURVE?
It is clear that price effect demand a lot
For example the purpose of a sale so to
get the consumers to spend more.
BUT THERE ARE OTHER FACTORS Consumer income
The prices of other products
Tastes and fashion
THESE ARE ALL NON-PRICE FACTORS

STRONG GOVERNMENT WEAK
WEAK MARKET STRONG
MIXED ECONOMY
Resources are allocated through a mixture of
government intervention and market
demand and supply
EXAMPLECZECH REPUBLICtransformed into a mixed economy from a
command economy.
Resulted in
Increase in GDP by 5-7 percent
Economic growth
Increase in production
Increase in aggregate demand
COMMAND ECONOMY MARKET ECONOMY
No
rth
Ko
rea
Ch
ina
Alb
an
ia
UK
FR
AN
CE
HU
NG
AR
Y
Sin
ga
po
re
USA
Allocation of Resources
DEMAND
NOTIONAL DEMANDThe desire for a product
EFFECTIVE DEMAND The willingness and ability to buy a product
CETERIS PARIBUSassuming all other variables are the same
RELATIONSHIP BETWEEN PRICE AND QUANTITY DEMANDED Inverse relationship between price and quantity
demanded
Lower price=more demanded
Higher price=less demanded
NOTE – consumers are rational as the stated above
so that they can save money
DEMAND CURVE
Representation of this relationship between
price and quantity demanded
The data for the demand curve is derived
from a demand schedule.
DEMAND SCHEDULE data used to create a demand curve
When there is a change in demand due to price change, it is called movement along the demand curve.
EXTENSION
CONTRACTION

CONSUMER INCOME
this is a great influence, because if there is a low income then
the consumers would be less willing to buy products.
If the price rises and is greater than the income, then the
real income has fallen.
This is not great as the ability to pay for the goods and
services has fallen.
DISPOSABLE INCOMEIncome after taxes such as the state benefits and income tax
REAL DISPOSABLE INCOME after all the taxes taken of and the addition of state benefits.
NORMAL GOODSGoods for which an increase in income leads to an increase in
demand. INFERIOR GOODSGoods for which an increase in income leads to a fall in
demand, such as basic foods.
THE PRICES OF OTHER PRODUCTS
The demand for a particular product can be affected
by a change in price from another but similar product
SUBSTITUTES Competing goods
If the a substitute for bread goes down in price then
the original bread would loose demand as the
substitute is cheaper.
COMPLEMENTSGoods for which there is a joint demand
If the price for airplanes increases, therefore leading
to an decrease in holidays, there would a decrease in
demand as there is an increase in price. This shows that complements, the price and the demand there is a inverse relationship.
TASTES AND FASHION Consumers tastes and fashions
always changes over time.
This can result in a change in
demand or price because of a
change in price.
All these key points, result in a change in demand, resulting in a shift on the demand curve
Change in demand due to Effect on the demand curve
An increase in consumer income A rise in in price of substitutesA fall in the price of complementsA positive change in tastes and fashion
A shift to the RIGHT
A fall in consumer income A fall in the price of substitutesA rise in the price of complementsA negative change in tastesand fashion
A shift to the LEFT
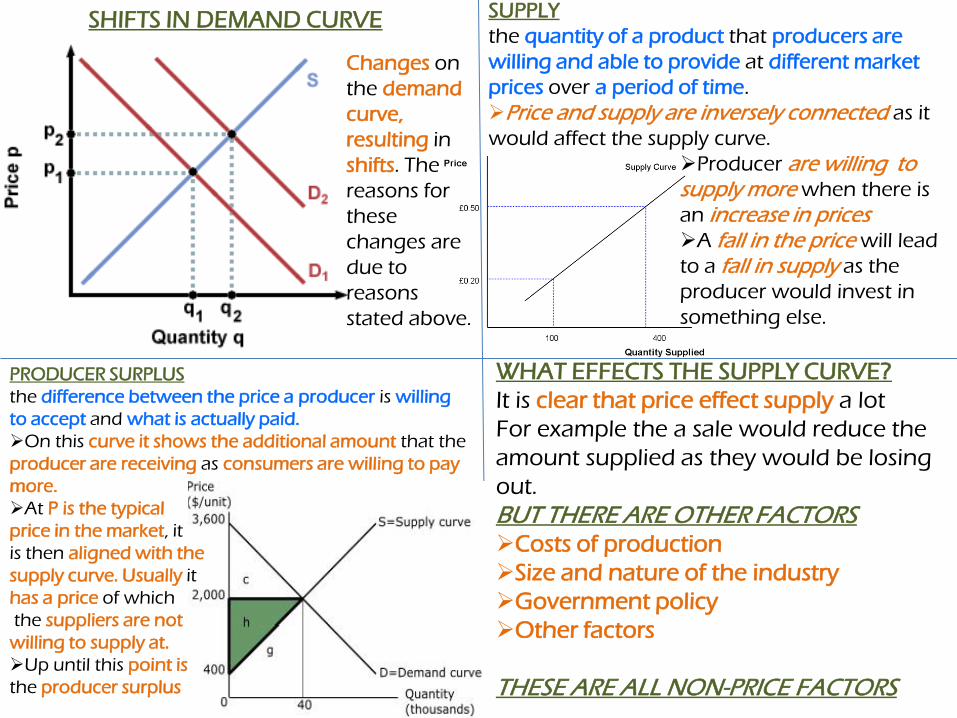
PRODUCER SURPLUS
the difference between the price a producer is willing
to accept and what is actually paid.
On this curve it shows the additional amount that the
producer are receiving as consumers are willing to pay
more.
At P is the typical
price in the market, it
is then aligned with the
supply curve. Usually it
has a price of which
the suppliers are not
willing to supply at.
Up until this point is
the producer surplus
SHIFTS IN DEMAND CURVE
Changes on
the demand
curve,
resulting in
shifts. The
reasons for
these
changes are
due to
reasons
stated above.
SUPPLY
the quantity of a product that producers are
willing and able to provide at different market
prices over a period of time.
Price and supply are inversely connected as it
would affect the supply curve.
Producer are willing tosupply more when there is
an increase in pricesA fall in the price will lead
to a fall in supply as the
producer would invest in
something else.
WHAT EFFECTS THE SUPPLY CURVE?
It is clear that price effect supply a lot
For example the a sale would reduce the
amount supplied as they would be losing
out.
BUT THERE ARE OTHER FACTORS Costs of production
Size and nature of the industry
Government policy
Other factors
THESE ARE ALL NON-PRICE FACTORS

COSTS OF PRODUCTION
the obvious factors are the factors of
production.
Change in the cost of resources
Change in cost of labour
Efficiency from labour to capital
A increase in this factors would lead to an increase market price .
A decrease in these factors would lead to a decrease in the market price.
SIZE OF NATURE OF INDUSTRY
For example there is a lot of competition in
the food industry.
So an increase in the prices would lead to
a great impact on the supply
On other remarkets if there is an increase
in resources then it would result in little or
no effects on the profits.
GOVERNMENT POLICY
All companies are effected by this as they all
have to pay VAT.
If there was an increase is passed onto the
consumers through an increase in price. This
then effects the willingness of producers to
supply.
Health and safety can lead to an increase in
cost for production.
However the government can provide
subsidies to farmers so that the costs are reduced
and so then the prices to customers. This then
leads to an increase in supply.
OTHER FACTORS
Bad wheatear
Scarcity of resources
Items such as these depends on the sorts of
products produced.

Change in supply due to Effect on the supply curve
A fall in raw materials costAn improvement in labour efficiency A reduction in the rate of indirect taxA positive technological advanceAny other positive factors
A shift to the RIGHT
An increase in the cost of raw materials An increase in labour costAn increase in the rate of indirect taxA failed technological advanceAny other negative effects
A shift to the LEFT
Changes on
the supply
curve,
resulting in
shifts. The
reasons for
these changes
are due to
reasons stated
above.
HOW PRICES ARE DETERMINED?
This is done through the use of equilibrium
price. Also known as clearing price.
EQUILIBRIUM PRICEThis is the market price where demand and
supply are equal.
EQUILIBRIUM QUANTITY The quantity that is demanded and supplied at
the equilibrium price.
DISEQUILIBRIUM When the market is unstable, when demand
and supply is not equal.
Surplus- an
excess supply
over demand
Shortage- an
excess of
demand over
supply
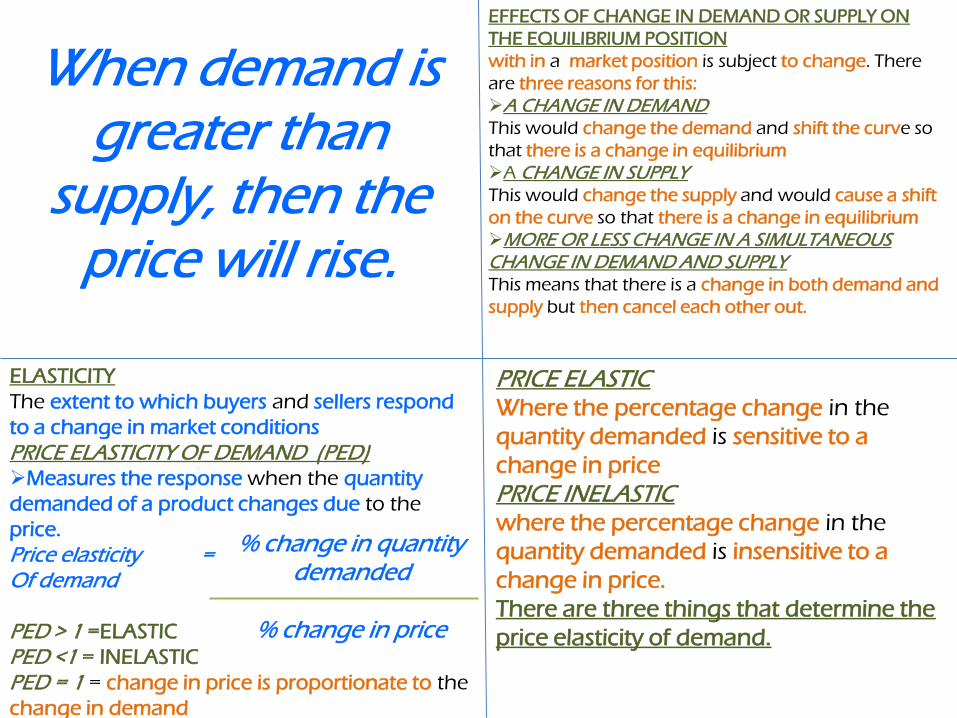
When demand is greater than
supply, then the price will rise.
EFFECTS OF CHANGE IN DEMAND OR SUPPLY ON
THE EQUILIBRIUM POSITION
with in a market position is subject to change. There
are three reasons for this:
A CHANGE IN DEMANDThis would change the demand and shift the curve so
that there is a change in equilibrium
A CHANGE IN SUPPLY This would change the supply and would cause a shift
on the curve so that there is a change in equilibrium
MORE OR LESS CHANGE IN A SIMULTANEOUS CHANGE IN DEMAND AND SUPPLYThis means that there is a change in both demand and
supply but then cancel each other out.
ELASTICITY
The extent to which buyers and sellers respond
to a change in market conditions
PRICE ELASTICITY OF DEMAND (PED)Measures the response when the quantity
demanded of a product changes due to the
price.
Price elasticity =Of demand
PED > 1 =ELASTIC
PED <1 = INELASTIC
PED = 1 = change in price is proportionate to the
change in demand
% change in quantity demanded
% change in price
PRICE ELASTICWhere the percentage change in the
quantity demanded is sensitive to a
change in price
PRICE INELASTICwhere the percentage change in the
quantity demanded is insensitive to a
change in price.
There are three things that determine the
price elasticity of demand.
% change in price of product B
% change in income
SUBSTITUTE If there is a substitute available and there is a change in
that price, this would effect the demand for the other
product. For example the price for a branded milk
increases then the demand for the substitute milk would
increase.
THE EXPENSE WITH RESPECT TO INCOMEIf the price takes up a small proportion of the income,
them buyer would be less sensitive to the change in price.
However if it takes up a larger proportion then they will be
more price sensitive in the changes in price.
TIMEmost consumers find it hard to alter their spending habits,
meaning that they would buy the product despite the
change in price. Although an increase in time would result
in the buyers finding substitutes and the demand for than
product would be more price elastic.
INCOME ELASTICITY OF DEMAND (YED)
the responsiveness of demand to a change
in income
Income elasticity of demand =
% change in quantity demanded
The sign positive or negative is important as it
indicates if there was increase or decrease in the
quantity demanded following the change in income.
When producing a graph showing the amount of
income changed, then the y axis would change into
income rather than price.
NORMAL GOODSGood with a positive income elasticity of income
GOODSIf the real disposable income increases demand for
these products will also increase. Example of these
include holidays, new clothes, home improvements and
organic food.
YED < 1 = income inelastic
Change in income produces a greater proportionate
change in demand
YED > 1 = income elastic
Change in income produces a less proportionate
change in demand.
Inferior GoodsGoods for which an increase in income leads to a fall in
demand. Such as Sainsbury’s basics food.
Inferior goods = negative YED Normal goods = positive YED
CROSS ELASTICITY OF DEMAND (XED)
Measure the responsiveness of demand for one
product following a change in the price of
another related product.
The elasticity measures the determinants of
demand, namely the prices of substitutes and
complements that can affect the demand for a
particular product.
Cross Elasticity of Demand
% change in quantity demanded of product A
=
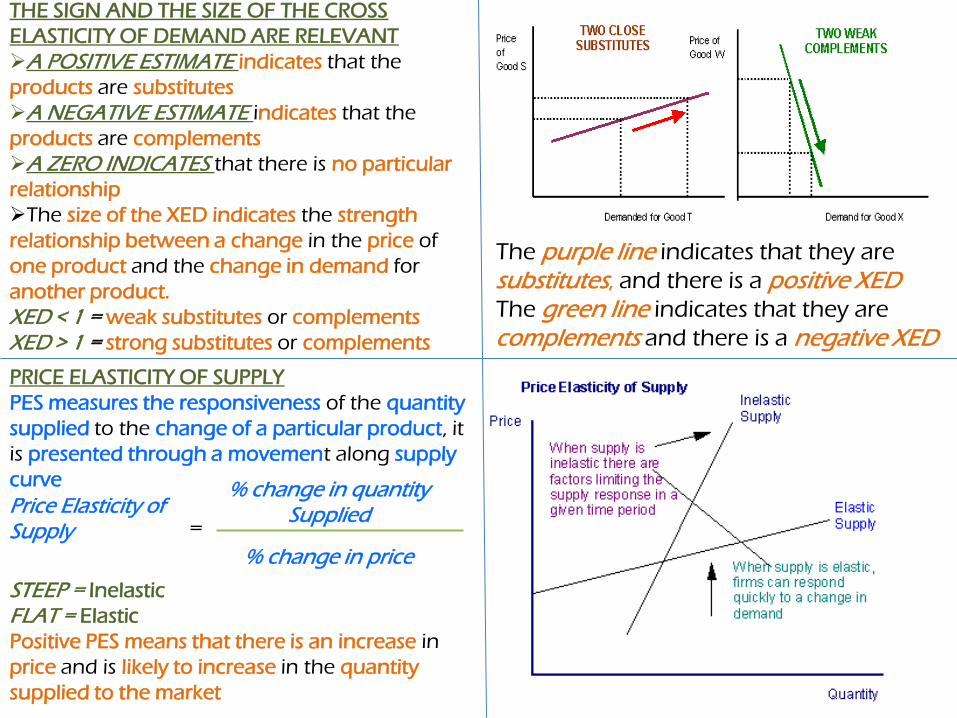
THE SIGN AND THE SIZE OF THE CROSS
ELASTICITY OF DEMAND ARE RELEVANT
A POSITIVE ESTIMATE indicates that the
products are substitutes
A NEGATIVE ESTIMATE indicates that the
products are complements
A ZERO INDICATES that there is no particular
relationship
The size of the XED indicates the strength
relationship between a change in the price of
one product and the change in demand for
another product.
XED < 1 = weak substitutes or complements
XED > 1 = strong substitutes or complements
The purple line indicates that they are
substitutes, and there is a positive XEDThe green line indicates that they are
complements and there is a negative XED
PRICE ELASTICITY OF SUPPLY
PES measures the responsiveness of the quantity
supplied to the change of a particular product, it
is presented through a movement along supply
curve
Price Elasticity of Supply
% change in quantity Supplied
% change in price
=
STEEP = Inelastic
FLAT = Elastic
Positive PES means that there is an increase in
price and is likely to increase in the quantity
supplied to the market
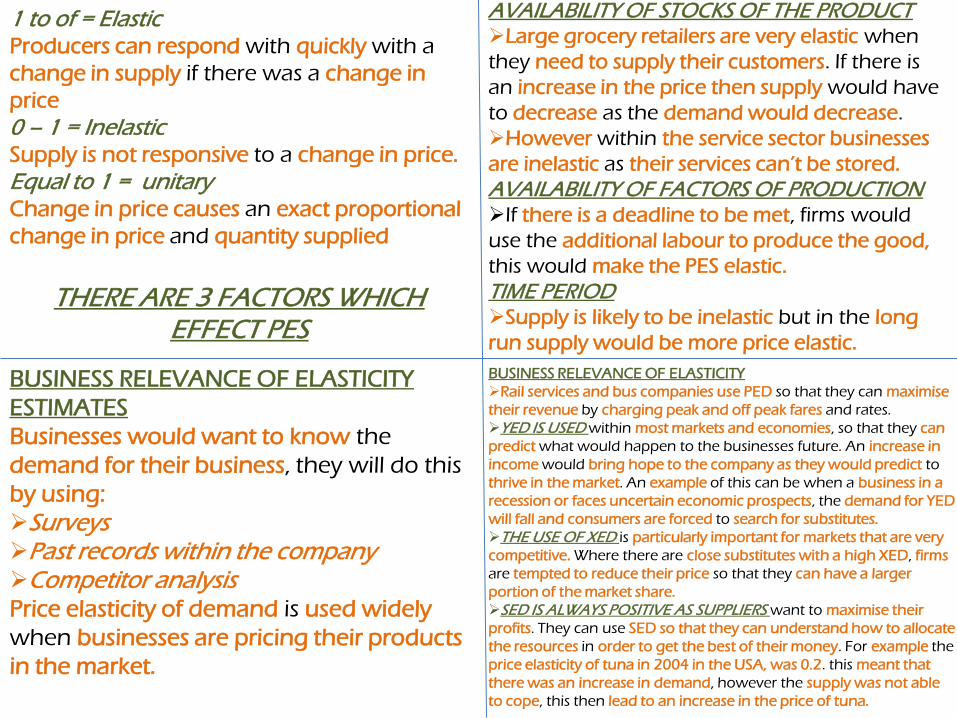
1 to of = Elastic Producers can respond with quickly with a
change in supply if there was a change in
price
0 – 1 = Inelastic Supply is not responsive to a change in price.
Equal to 1 = unitary Change in price causes an exact proportional
change in price and quantity supplied
THERE ARE 3 FACTORS WHICH EFFECT PES
AVAILABILITY OF STOCKS OF THE PRODUCT Large grocery retailers are very elastic when
they need to supply their customers. If there is
an increase in the price then supply would have
to decrease as the demand would decrease.
However within the service sector businesses
are inelastic as their services can’t be stored.
AVAILABILITY OF FACTORS OF PRODUCTION If there is a deadline to be met, firms would
use the additional labour to produce the good,
this would make the PES elastic.
TIME PERIODSupply is likely to be inelastic but in the long
run supply would be more price elastic.
BUSINESS RELEVANCE OF ELASTICITY
ESTIMATES
Businesses would want to know the
demand for their business, they will do this
by using:
SurveysPast records within the companyCompetitor analysis Price elasticity of demand is used widely
when businesses are pricing their products
in the market.
BUSINESS RELEVANCE OF ELASTICITY
Rail services and bus companies use PED so that they can maximise
their revenue by charging peak and off peak fares and rates.
YED IS USED within most markets and economies, so that they can
predict what would happen to the businesses future. An increase in
income would bring hope to the company as they would predict to
thrive in the market. An example of this can be when a business in a
recession or faces uncertain economic prospects, the demand for YED
will fall and consumers are forced to search for substitutes.
THE USE OF XED is particularly important for markets that are very
competitive. Where there are close substitutes with a high XED, firms
are tempted to reduce their price so that they can have a larger
portion of the market share.
SED IS ALWAYS POSITIVE AS SUPPLIERS want to maximise their
profits. They can use SED so that they can understand how to allocate
the resources in order to get the best of their money. For example the
price elasticity of tuna in 2004 in the USA, was 0.2. this meant that
there was an increase in demand, however the supply was not able
to cope, this then lead to an increase in the price of tuna.

ALLOCATIVE EFFICIENCY
EFFICIENCY- where the best use of resources is
made for the benefit of consumers
ALLOCATIVE EFFICIENCY- where consumer
satisfaction is maximised.
to achieve allocative efficiency the quantity
supplied must be equal to the quantity demanded,
in other words there needs to be a function of
equilibrium position.
This means that there is not being too much
supplied when there is a limited amount of
demand.
Or in other words the demand is not being met as
there is not enough supplies going around.
MARKET FAILURE
MARKET FAILURE- where the free markets
mechanism fails to achieve economic
efficiency.
PRODUCTIVE EFFICIENCY- where
production takes place using the least
amount of scarce resources
ECONOMIC EFFICIENCY- where both
allocative and productive efficiency are
achieved
INFORMATION FAILURE
A lack of information resulting in consumers and
producers making decisions that no maximise welfare
If there is not a lack of information then the market
would work efficiently, however if there is a lack then
there would be market failure, as there would a
inefficient allocation of resources.
The problem of information failure is that the
consumers and the producers make the decisions and
are based on the lack of ignorance due to inaccurate or
incomplete information. Example of this:
When consumers are not fully aware of the full
benefits
Persuasive advertising
Misleading product claims
ASYMMETRIC INFORMATION
In some situations a problem of information failure, it is called
asymmetric information. This occurs when the information is
not shared equally between the two parties carrying out a
transaction.
Example of this:
HEALTH CARE- when visiting the doctor, you don't
have the same medical knowledge, you rely on the
doctor and his competence to diagnosis the problem
ENVIRONMENT- as individuals we know little about
the consequences, however specialists are employed
so that they can carry out research and studies.
CONSUMER PURCHASE- thinking that you made a
good deal but then realising that there are strings
attached
INSURANCE- the seller relies on the his knowledge
on whether to sell the policy
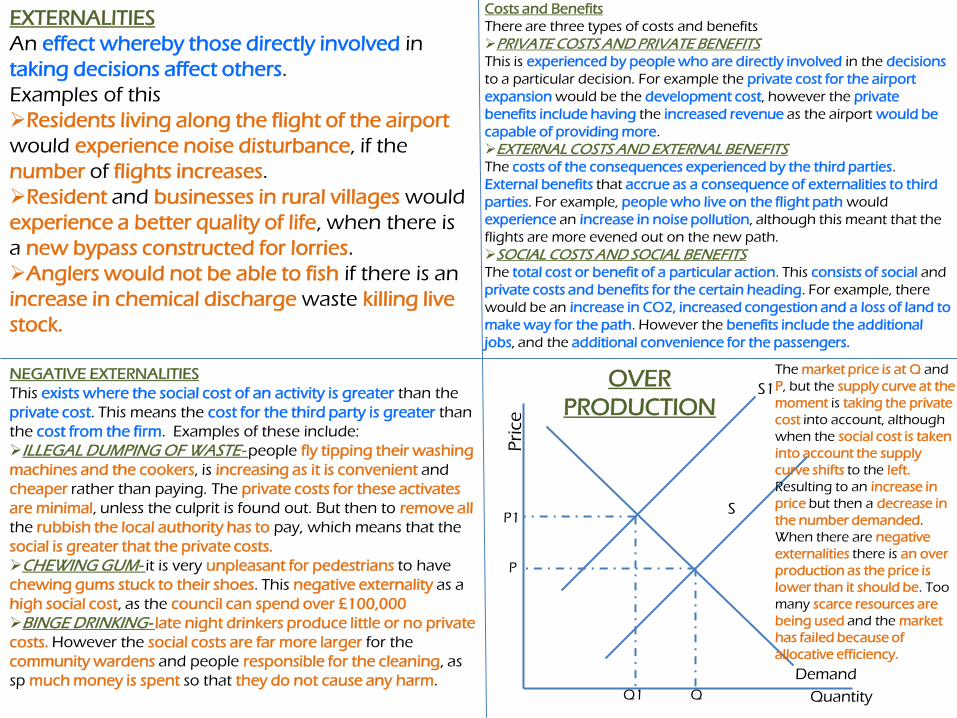
EXTERNALITIES
An effect whereby those directly involved in
taking decisions affect others.
Examples of this
Residents living along the flight of the airport
would experience noise disturbance, if the
number of flights increases.
Resident and businesses in rural villages would
experience a better quality of life, when there is
a new bypass constructed for lorries.
Anglers would not be able to fish if there is an
increase in chemical discharge waste killing live
stock.
Costs and Benefits
There are three types of costs and benefits
PRIVATE COSTS AND PRIVATE BENEFITSThis is experienced by people who are directly involved in the decisions
to a particular decision. For example the private cost for the airport
expansion would be the development cost, however the private
benefits include having the increased revenue as the airport would be
capable of providing more.
EXTERNAL COSTS AND EXTERNAL BENEFITS The costs of the consequences experienced by the third parties.
External benefits that accrue as a consequence of externalities to third
parties. For example, people who live on the flight path would
experience an increase in noise pollution, although this meant that the
flights are more evened out on the new path.
SOCIAL COSTS AND SOCIAL BENEFITS The total cost or benefit of a particular action. This consists of social and
private costs and benefits for the certain heading. For example, there
would be an increase in CO2, increased congestion and a loss of land to
make way for the path. However the benefits include the additional
jobs, and the additional convenience for the passengers.
NEGATIVE EXTERNALITIES
This exists where the social cost of an activity is greater than the
private cost. This means the cost for the third party is greater than
the cost from the firm. Examples of these include:
ILLEGAL DUMPING OF WASTE- people fly tipping their washing
machines and the cookers, is increasing as it is convenient and
cheaper rather than paying. The private costs for these activates
are minimal, unless the culprit is found out. But then to remove all
the rubbish the local authority has to pay, which means that the
social is greater that the private costs.
CHEWING GUM- it is very unpleasant for pedestrians to have
chewing gums stuck to their shoes. This negative externality as a
high social cost, as the council can spend over £100,000
BINGE DRINKING- late night drinkers produce little or no private
costs. However the social costs are far more larger for the
community wardens and people responsible for the cleaning, as
sp much money is spent so that they do not cause any harm. Quantity
Pri
ce
Demand
S
S1
The market price is at Q and
P, but the supply curve at the
moment is taking the private
cost into account, although
when the social cost is taken
into account the supply
curve shifts to the left.
Resulting to an increase in
price but then a decrease in
the number demanded.
When there are negative
externalities there is an over
production as the price is
lower than it should be. Too
many scarce resources are
being used and the market
has failed because of
allocative efficiency.
QQ1
P1
P
OVER
PRODUCTION
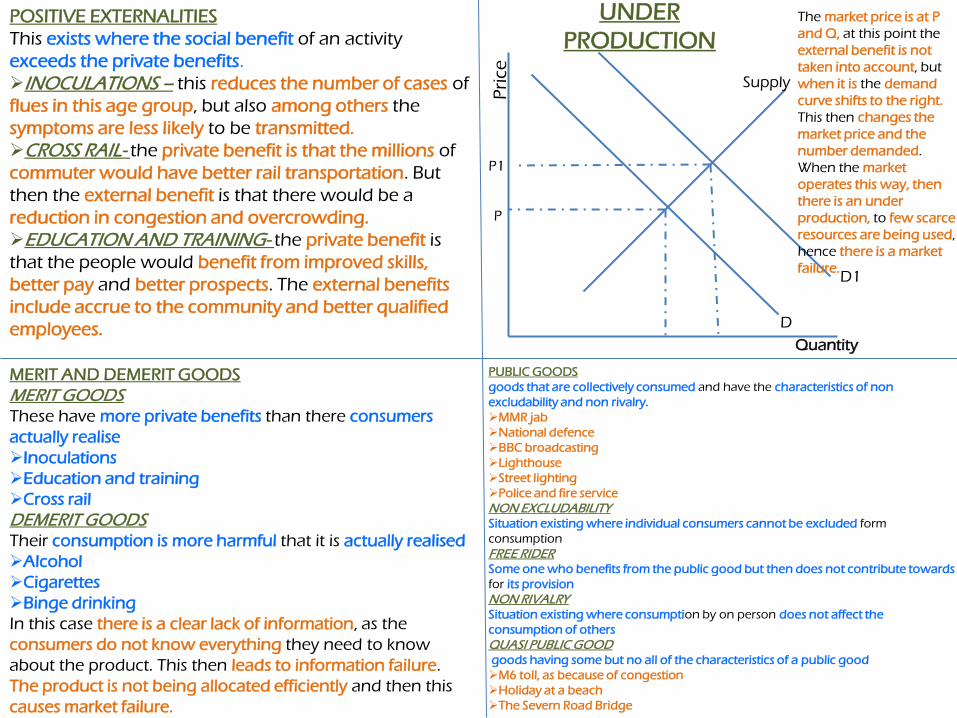
POSITIVE EXTERNALITIES
This exists where the social benefit of an activity
exceeds the private benefits.
INOCULATIONS – this reduces the number of cases of
flues in this age group, but also among others the
symptoms are less likely to be transmitted.
CROSS RAIL- the private benefit is that the millions of
commuter would have better rail transportation. But
then the external benefit is that there would be a
reduction in congestion and overcrowding.
EDUCATION AND TRAINING- the private benefit is
that the people would benefit from improved skills,
better pay and better prospects. The external benefits
include accrue to the community and better qualified
employees. Quantity
Pri
ce
D
P1
P
Supply
D1
The market price is at P
and Q, at this point the
external benefit is not
taken into account, but
when it is the demand
curve shifts to the right.
This then changes the
market price and the
number demanded.
When the market
operates this way, then
there is an under
production, to few scarce
resources are being used,
hence there is a market
failure.
UNDER
PRODUCTION
MERIT AND DEMERIT GOODS
MERIT GOODSThese have more private benefits than there consumers
actually realise
Inoculations
Education and training
Cross rail
DEMERIT GOODSTheir consumption is more harmful that it is actually realised
Alcohol
Cigarettes
Binge drinking
In this case there is a clear lack of information, as the
consumers do not know everything they need to know
about the product. This then leads to information failure.
The product is not being allocated efficiently and then this
causes market failure.
PUBLIC GOODS
goods that are collectively consumed and have the characteristics of non
excludability and non rivalry.
MMR jab
National defence
BBC broadcasting
Lighthouse
Street lighting
Police and fire service
NON EXCLUDABILITYSituation existing where individual consumers cannot be excluded form
consumption
FREE RIDER Some one who benefits from the public good but then does not contribute towards
for its provision
NON RIVALRY Situation existing where consumption by on person does not affect the
consumption of others
QUASI PUBLIC GOODgoods having some but no all of the characteristics of a public good
M6 toll, as because of congestion
Holiday at a beach
The Severn Road Bridge

MERIT GOODS and MARKET FAILURE
Supply
Private
benefit (D)
Social
benefit (D)
When taking the private
benefits into account there is
small amount demanded and
the price is also very low.
However with the full
information, and people being
aware of the social benefits
then the demand should
increase, this would then
increase the price and the
quantity demanded. The
shaded area is the welfare loss
due to information failure.
DE MERIT GOODS and MARKET FAILURE
Demand
Full information
Demand
Private benefit limited
information
Q1Q2Q3Q1 Q2
EXTERNAL
COST
GOVERNMENT INTERVENTION TO CORRECT MARKET FAILURE
Government intervene in the workings of the market
mechanism to correct the market failure, equitable distribution
of wealth and income and the performance of the economy.
NEGATIVE EXTERNALITIES Charges are made for those who fly tip and legislations and
regulations are put in place so that this can decrease. Binge
drinking, in some parts of the country owners have to pay local
levy for the trouble which is caused.
POSITIVE EXTERNALITIESIn the case of inoculations, it is free , by providing subsidies it
increases the number of people taking the vaccination. This is
the same for education and training.
MERIT GOODSThe provision of information and state provision is a way of
which the government seeks to address the problems of under
consumption, so that they can understand the real cost and
benefit.
DEMERIT GOODSThe provision of full information and indirect taxation is
a way of which the government seeks to regulate and
reduce the consumptions of these products.
PUBLIC GOODSThis is done through the use of general tax revenue
and state provision. In some cases such as broadcasting
a charge is made for the consumption. Market failure in
this sector would be corrected if there intervention
would produce a better allocation of resources. There
are two approaches
•Methods that involve manipulations of the market
mechanism, subsides, indirect taxation and the
provision of information
•Non market methods- direct provision and forms of
regulations and control.
Quantity
Pri
ce
Quantity
Pri
ce

TAXATION
There are two types of taxation
DIRECT TAXESThis includes income tax, co operation tax and national insurance
contribution; these taxes come directly from the firms and the
individual.
INDIRECT TAXESThis includes VAT, council tax and business rates are charged on the
ownership of houses and business premises.
The use of indirect taxes can effect the demand and the supply for a
certain product. This is determined by the elasticity of the product. for
example a de merit good has a high consumption, and the
government wishes to intervene, they would first try through the use
of indirect taxes. This would be imposed on the suppliers of the
product, as a result this would increase the making of the product and
would heighten their burden. However, since it is an inelastic product
the suppliers pass on this increase of cost to the consumers, increasing
their burden. This then would lead to a higher market price, but would
result in the same amount of revenue as that increase in income would
be used to pay the tax.
INDIRECT TAXES
Suppliers in a market which affects the cost of
production and therefore effects the market supply at
each price.
Takes on a specific item of consumer spending.
INDIRECT TAXESValue added tax (VAT)- a fixed tax per unit of goods
and services.
However there are some exceptions such a reduced
VAT. This is implanted in for domestic fuel and power
and for children car seats so that individuals can be safe
and follow by the law.
There is also another exception such as VAT exempt,
where there is no charge. This is implanted into private
education, finance and insurance and health and postal
service.
WHY IMPOSE INDIRECT TAX?
Increase tax revenue and fund the
government findings
It is more fair tax rather than
determining on wealth and income.
To change the demand for goods and
services. (reducing the demand for a de
merit good)
Indirect tax is easy to change and is
flexible.
Also it is harder to avoid, so everyone
has to contribute.

Consumer burden
Producer burden
CONSUMER AND PRODUCER BURDEN
At Q and P, the indirect tax has not been
implanted in resulting in number of Q demanded
and the market price at P. However, when the tax
is put into place, the supply curve shifts to the left,
which results in increase in price but a decrease in
supply at P1 and Q1. the difference between P and
P1 is the consumer burden, which is the extra
money which the consumer has to pay in in order
to get the product. However where Q1 and the
supply pre tax intersect is the producer burden.
And at P2 is the price of which the supplier is
willing to sell at. From P2 and P1 is the total
amount of tax.
THE ARGUMENTS AGAINST INDIRECT TAX
Some of the indirect tax can have a regressive impact
on people who earn a lower income
Tax burden is the heaviest on low income individuals
as large proportions is being spent on small items
This would then result in more unequal distributing of
income as the lower income individual have to spend
more in order to eat.
Higher indirect tax could therefore lead to inflation.
(suppliers passing on the burden and then increasing
the market price.
The indirect tax would cause services to be too
expensive and this would lead to boot legging. People
not following rules and regulations.
Loss of economic welfare as the increase in price
would cause a loss of producer and consumer surplus
Consumer burden
Producer burden
QQ1
P
P1
P2
Demand
Supply pre
tax
Supply post
taxELASTIC
QQ1
P
P1
P2
Demand
Supply pre
tax
Supply post
taxINELASTIC
Quantity
Pri
ce
Quantity
Pri
ce

CONSUMER AND PRODUCER BURDEN
At Q and P, the indirect tax has not been implanted in
resulting in number of Q demanded and the market
price at P. However, when the tax is put into place, the
supply curve shifts to the left, which results in increase
in price but a decrease in supply at P1 and Q1. the
difference between P and P1 is the consumer burden,
which is the extra money which the consumer has to
pay in in order to get the product. However where Q1
and the supply pre tax intersect is the producer
burden. And at P2 is the price of which the supplier is
willing to sell at. From P2 and P1 is the total amount of
tax. However, the product is inelastic meaning that
the producer can pass on the tax to the consumer, this
then increases the market price and should decrease
the demand for the de merit good.
SUBSIDES
It is a payment by the government to producers or consumers of
goods and services, to encourage production and consumption.
THE MAIN PURPOSE IS THEREFORE To reduce the cost in order to provide a higher level of
production or consumption than it would if it was left to the
market.
This is aimed at merit goods which generate positive
externalities
To keep the price of the product low
Boost demand for a certain product to encourage consumption
Reduce the cost of capital investment which would stimulate
long term economic development in the country.
Maintain the service which provides positive externalities
THE EFFECT OF THE SUBSIDY Is to increase the supply
It would decrease the market price and this would result in an
expansion demand
PRODUCER SUBSIDY an input in which subsidies the cost of certain inputs
used in production
Financial support – such a grant or a block of payment
to cover losses made by a business.
FARM SUBSIDIES Under the old common Agricultural Policy, the EU
provides direct payments to the producers based on
output, however now they receive payments in a single
income payment.
Such organic farmers would receive subsidies so that
the price for the product can be cheaper and this would
then increase the demand for the product. This would
help reduce the costs of making the fruits and
vegetables which in return would decrease the price. Demand
Supply
Pre Sub
Supply post
sub
P
P1
Q Q1
The effect of
using the
subsidy is that
the price has
dropped and
this in return
has increased
the supply, To
Q1 and P1.
SUBSIDY EFFECT
Quantity
Pri
ce

GAINERS FROM THE SUBSIDY
Consumers who are able to purchase the product at
a much higher price
Consumers who are the direct recipient of subsides
e.g. Payment of child care
Producers as their producer surplus increases as their
net revenue is higher
LOSER FROM THE SUBSIDY
General tax payers, who must fund for the subsidy
Other producers who are not entitled to the subsidy
Higher government spending, involves an
opportunity cost as the money can be spent on
alternatives
Subsides lead to inefficiencies in production due to
the lack of competitions. The producers are cushioned
by the subsidy.
TRADABLE PERMITS
market based tradable permits are used so that they
correct market failure.
Allows the owners to emit a specific amount of
pollution
Total amount of permits are controlled so that the
they can control the amount of pollution to an
acceptable level
They are bought and then can be sold at a price to be
agreed upon by their owner/purchaser
The incentive for the permit holder is to achieve a
lower level of pollution, any used permits can then be
sold off.
Firms who don’t have sufficient firms to cover their
pollution level would be prosecuted.
Demand
Demand 1
Supply
Supply is completely inelastic, as
there is a limited amount of permits,
so you can pay much higher but you
still would get the same amount.
Which is when there is an increase in
demand for the permits, the quantity
does not change but the price
increases drastically.
Quantity
Pri
ce


![Micro Processors & Micro Controllers Lecture Notesgopalmic.weebly.com/uploads/6/0/3/4/6034310/mpi_full_document.pdfMicro Processors & Micro Controllers Lecture Notes (As Per JNTUK-[R07]](https://static.fdocuments.us/doc/165x107/5aa2476a7f8b9a1f6d8d063d/micro-processors-micro-controllers-lecture-processors-micro-controllers-lecture.jpg)