AS BIOLOGY - The Student Room
24
Barcode v1.0 7401/2 AS BIOLOGY Paper 2 Specimen materials (set 2) 1 hour 30 minutes Materials For this paper you must have: • a ruler with millimetre measurements • a calculator, which you are expected to use where appropriate. Instructions • Use black ink or black ball-point pen. • Answer all questions. • You must answer the questions in the spaces provided. Do not write outside the box around each page or on blank pages. • All working must be shown. • Do all rough work in this book. Cross through any work you do not want to be marked. Information • The marks for questions are shown in brackets. • The maximum mark for this paper is 75. Please write clearly, in block capitals. Centre number Candidate number Surname Forename(s) Candidate signature
Transcript of AS BIOLOGY - The Student Room

Barcode v1.0 7401/2
AS BIOLOGY Paper 2 Specimen materials (set 2) 1 hour 30 minutes Materials For this paper you must have: • a ruler with millimetre measurements • a calculator, which you are expected to use where appropriate. Instructions • Use black ink or black ball-point pen. • Answer all questions. • You must answer the questions in the spaces provided. Do not write outside the box around each
page or on blank pages. • All working must be shown. • Do all rough work in this book. Cross through any work you do not want to be marked. Information • The marks for questions are shown in brackets. • The maximum mark for this paper is 75.
Please write clearly, in block capitals. Centre number Candidate number Surname Forename(s) Candidate signature

2
Barcode v1.0
Answer all questions in the spaces provided.
Many humans are unable to digest lactose. A scientist investigated the production of lactose-free milk. He produced gel beads containing the enzyme lactase and placed the beads in a column. He poured milk (Milk A) into the column and collected the milk (Milk B) after it had moved through the column over the beads. This is shown in Figure 1.
Figure 1
Milk A contains no glucose. Milk B contains glucose. Explain why Milk B contains glucose. [1 mark]
The enzyme was trapped within the gel beads. Suggest one advantage of trapping the enzyme within the gel beads.
[1 mark]
0 1 . 2
0 1 . 1
Gel beads containing lactase
0 1 . 1
0 1

3
Barcode Turn over
The scientist varied the flow rate of the milk through the column. The effect of flow rate on the concentration of glucose in Milk B is shown in Table 1.
Table 1
Flow rate of milk through the
column / cm3 minute–1 Concentration of glucose in Milk B /
arbitrary units
50 45
100 6
Explain the difference in the results in Table 1. [1 mark]
The gel beads were all similar sizes. Use the formula below to calculate the volume of one of the beads with a 3.0 mm diameter.
[1 mark] Volume of sphere = 4
3 𝜋r3
Galactose has a similar structure to part of the lactose molecule. Explain how galactose inhibits lactase. [2 marks]
0 1 . 3
0 1 . 4
mm3
0 1 . 5
Volume =
6

4
Barcode
A bacterium is shown in Figure 2.
Figure 2
Calculate the magnification of the image. [1 mark]
Complete Table 2 to show the features of a bacterium and a virus. Put a tick () in the box if the feature is shown.
[2 marks]
Table 2
Surface Bacterium Virus
Cell-surface membrane
Nucleus
Cytoplasm
Capsid
0 2 . 2
0 2 . 1
Magnification = ___________________
0.5 μm
0 2

5
Barcode Turn over
DNA and RNA can be found in bacteria.
Give two ways in which the nucleotides in DNA are different from the nucleotides in RNA.
[2 marks]
Turn over for the next question
0 2 . 3
2
1
5
6
Barcode
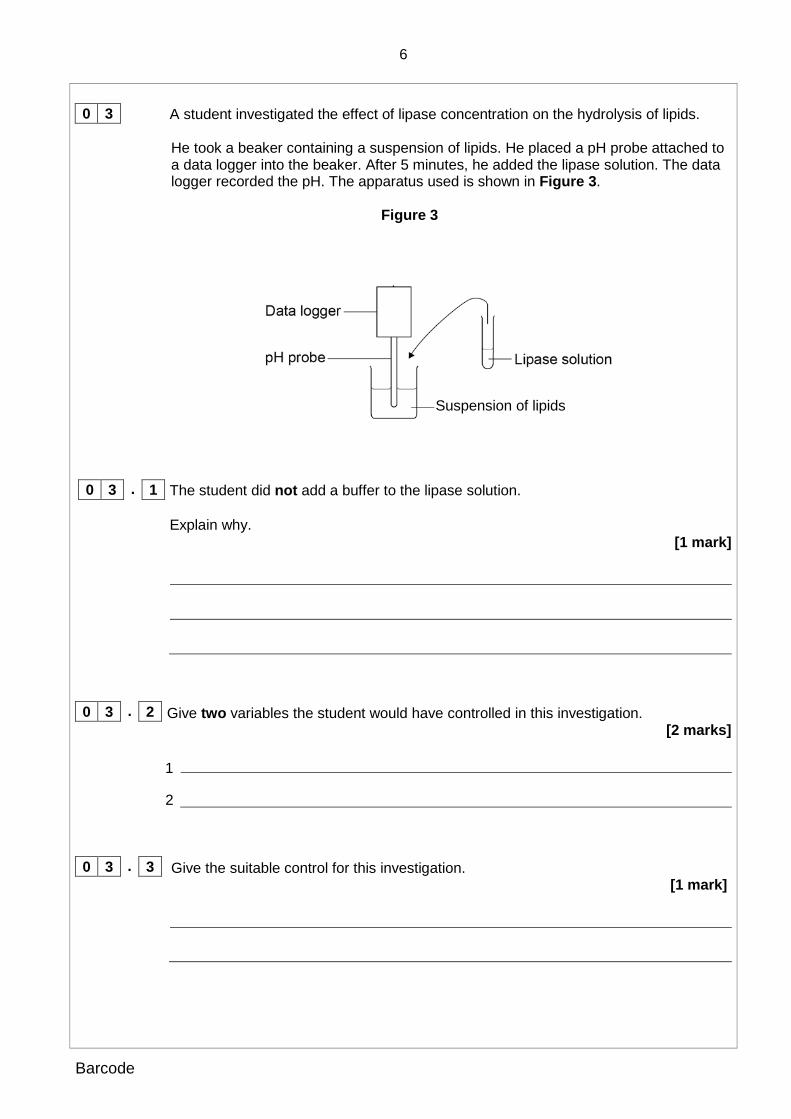
A student investigated the effect of lipase concentration on the hydrolysis of lipids. He took a beaker containing a suspension of lipids. He placed a pH probe attached to a data logger into the beaker. After 5 minutes, he added the lipase solution. The data logger recorded the pH. The apparatus used is shown in Figure 3.
Figure 3
The student did not add a buffer to the lipase solution. Explain why.
[1 mark]
Give two variables the student would have controlled in this investigation. [2 marks]
Give the suitable control for this investigation.
[1 mark]
0 3 . 1
0 3 . 2
0 3 . 3
2
1
Suspension of lipids
0 3

7
Barcode Turn over
The data logger recorded the pH. Figure 4 shows what happened after he added the lipase solution.
Figure 4
Draw a tangent on Figure 4 and use it to calculate the rate of change at 5 minutes.
[2 marks]
Explain the results shown in Figure 4. [2 marks]
Question 3 continues on the next page
0 3 . 4
0 3 . 5
Rate of change at 5 minutes = pH minute–1

8
Barcode
The student repeated the experiment with a higher concentration of lipase solution. Describe and explain the results you would expect him to get. [3 marks]
0 3 . 6
11

9
Barcode Turn over
In a eukaryotic cell, transcription results in a molecule of pre-mRNA that is modified to produce mRNA. In a prokaryotic cell transcription produces mRNA directly. Explain this difference.
[2 marks]
Give two differences between the structure of mRNA and the structure of tRNA.
[2 marks]
Turn over for the next question
0 4
0 4 . 1
0 4 . 2
1
2
4

10
Barcode
Explain four ways in which the structure of the aorta is related to its function.
[4 marks]
Figure 5 shows the oxyhaemoglobin dissociation curves for two different species, A and B.
Figure 5
0 5 . 1
Percentage saturation of haemoglobin with oxygen
Species A
Species B
Partial pressure of oxygen / kPa
0 0 2 4 6 8 10 12 14
20
40
60
80
100

11
Barcode Turn over
Species B is more active than species A. Use Figure 5 to explain how the haemoglobin of species B allows a greater level of activity.
[4 marks]
An electrocardiogram (ECG) shows the electrical activity of the heart. Figure 6 shows an ECG for an animal of species B at rest. Each large spike represents a contraction of the ventricles.
Figure 6
For species B, the mean voume of blood leaving the left ventricle during each contraction is 0.03 cm3. Calculate the mean volume of blood leaving the left ventricle per minute.
[2 marks]
0 5 . 2
0 5 . 3
Volume of blood = cm3 minute–1
Time / ms
10

12
Barcode
A scientist placed plant cells in solutions containing different concentrations of calcium
ions. She measured the rate of uptake of calcium ions by plant cells. Figure 7 shows her results.
Figure 7
What can you conclude from Figure 7 about the processes involved in the uptake of calcium ions by these plant cells? Use evidence from Figure 7 to support your answer. [5 marks]
0 6 . 1
Rate of uptake of calcium ions / arbitrary units
Concentration of calcium ions in solution / mg dm–3
0 6

13
Barcode Turn over
Suggest one way in which the scientist could have ensured the solutions she used for curve X contained no oxygen.
[1 mark]
Turn over for the next question
0 6 . 2
6

14
Barcode
Name the monomers from which a maltose molecule is made.
[1 mark]
Name the type of chemical bond that joins the two monomers to form maltose. [1 mark]
A student wanted to produce a dilution series of a maltose solution so he could plot a calibration curve. He had a stock solution of maltose of concentration 0.6 mol dm–3 and distilled water. He made a series of dilutions from 0.1 to 0.6 mol dm–3.
Complete Table 3 by giving all headings, units and the concentration of the maltose solution produced. [2 marks]
Table 3
Concentration of maltose solution
/ ……………..
Volume of 0.6 mol dm–3 maltose solution / cm3
……………………..
……….. / …………...
……… 5 10
0 7 . 1
0 7 . 3
0 7 . 2

15
Barcode Turn over
The student performed the Benedict’s test on six maltose solutions ranging from 0.1 mol dm–3 to 0.6 mol dm–3. He placed a sample of each solution in a colorimeter and recorded the light absorbance. His results are shown in Figure 8.
Figure 8
Explain how you would use Figure 8 to determine the maltose concentration with a light absorbance of 0.45 arbitrary units.
[2 marks]
0 7 . 4
Concentration of maltose / mol dm–3
Light absorbance / arbitrary units
6

16
Barcode
A student investigated the species richness and index of diversity of insects in three different habitats, a barley field, a wheat field and a hedge. Her results are shown in Table 4.
Table 4
Complete Table 4 for species richness and the total number of insects of each habitat. [2 marks]
Number of individuals of each insect species in each habitat
Insect species Barley field Wheat field Hedge
a 32 4 34
b 78 0 12
c 0 126 22
d 0 5 12
e 0 0 8
f 0 0 42
g 0 25 13
h 0 10 12
i 0 0 12
j 42 41 0 Species richness
Total number of insects (N)
0 8 . 1
0 8

17
Barcode Turn over
Calculate the index of diversity of the wheat field.
[2 marks]
Use the following formula:
d = N(N –1)Σn(n –1)
where N = total number of organisms
and n = total number of organisms of each species.
The index of diversity of the insects was higher in the hedge than in the barley field. Suggest why.
[3 marks]
Turn over for the next question
0 8 . 2
0 8 . 3
7
18
Barcode
Name the process by which bacterial cells divide.
[1 mark]
A microbiologist investigated the ability of different plant oils to kill the bacterium Listeria monocytogenes. She cultured the bacteria on agar plates. She obtained the bacteria from a broth culture.
Describe two aseptic techniques she would have used when transferring a sample of broth culture on to an agar plate. Explain why each was important.
[4 marks]
0 9 . 2
0 9 . 1

19
Barcode Turn over
The microbiologist tested five different plant oils at two different temperatures and determined the minimum concentration of plant oil that killed the L. monocytogenes.
Table 5 shows her results.
Table 5
Plant oil
Minimum concentration of plant oil that killed Listeria
monocytogenes / percentage
4 °C 35 °C
Bay 0.10 0.04
Cinnamon 0.08 0.08
Clove 0.05 0.05
Nutmeg ˃1.00 0.05
Thyme 0.02 0.03
Which plant oil is least effective at killing L. monocytogenes at 35 °C? [1 mark]
L. monocytogenes is a pathogen of great concern to the food industry, especially in foods stored in refrigeration conditions (4 °C) where, unlike most food-borne pathogens, it is able to multiply. It has been suggested that plant oils, together with refrigeration may help to reduce the growth of L. monocytogenes.
What conclusions can be drawn about the effectiveness of using plant oils with refrigeration to reduce food-borne infections caused by L. monocytogenes?
[3 marks]
Question 9 continues on the next page
0 9 . 3
0 9 . 4

20
Barcode
Plant oils are hydrophobic and can cross the cell-surface membrane of the bacterium. The low temperature of 4 °C can slow the rate of entry of plant oils into the cells. Suggest how the low temperature slows the rate of entry.
[1 mark]
0 9 . 5
10

21
Barcode Turn over
Describe the appearance and behaviour of chromosomes during mitosis.
[5 marks]
Question 10 continues on the next page
1 0 . 1
[Extra space]

22
Barcode
Describe and explain the processes that occur during meiosis that increase genetic variation.
[5 marks]
END OF QUESTIONS
1 0 . 2
[Extra space] 10

23
Barcode Turn over
There are no questions printed on this page
DO NOT WRITE ON THIS PAGE ANSWER IN THE SPACES PROVIDED

24
Barcode
There are no questions printed on this page
DO NOT WRITE ON THIS PAGE ANSWER IN THE SPACES PROVIDED
Acknowledgement of copyright holders and publishers Permission to reproduce all copyright material has been applied for. In some cases, efforts to contact copyright holders have been unsuccessful and AQA will be happy to rectify any omissions of acknowledgements in future papers if notified. Copyright © 2016 AQA and its licensors. All rights reserved.