arXiv:astro-ph/0611071 v1 2 Nov 2006
17
arXiv:astro-ph/0611071 v1 2 Nov 2006 Mon. Not. R. Astron. Soc. 000, 1–17 (2002) Printed 3 November 2006 (MN L A T E X style file v2.2) Spitzer spectroscopy of carbon stars in the Small Magellanic Cloud Eric Lagadec 1 ⋆ , Albert A. Zijlstra 1 , G.C. Sloan 2 , Mikako Matsuura, 3,1 Peter Wood 4 , G.J. Harris 5 , Jacco Th. van Loon 6 , J.A.D.L. Blommaert 7 , S. Hony 8 , M.A.T. Groenewegen 7 , M.W. Feast 9 , P.A. Whitelock 9,10,11 , J.W. Menzies 9 , M.-R. Cioni 12 , H. Habing 13 , L.B.F.M. Waters 14 1 University of Manchester, School of Physics & Astronomy, P.O. Box 88, Manchester M60 1QD, UK 2 Department of Astronomy, Cornell University, 108 Space Sciences Building, Ithaca NY 14853-6801, USA 3 Division of Optical and IR Astronomy, National Astronomical Observatory of Japan, Osawa 2-21-1, Mitaka, Tokyo 181-8588, Japan 4 Research School of Astronomy and Astrophysics, Australian National University, Cotter Road, Weston Creek, ACT 2611, Australia 5 Department of Physics and Astronomy, University College London, Gower Street, London WC1E 6BT, UK 6 Astrophysics Group, School of Physical & Geographical Sciences, Keele University, Staffordshire ST5 5BG, UK 7 Instituut voor Sterrenkunde, K.U. Leuven, Celestijnenlaan 200 D, B-3001 Leuven, Belgium 8 CEA, DSM, DAPNIA, Service d’Astrophysique, C.E. Saclay, F-91191 Gif-sur-Yvette Cedex, France 9 Department of Astronomy, University of Cape Town, 7701 Rondebosch, South Africa 10 South African Astronomical Observatory, PO Box 9, 7935 Observatory, South Africa 11 NASSP, Department of Mathematics & Applied Mathematics University of Cape Town, 7701, Rondebosch, South Africa 12 Institute for Astronomy, University of Edinburgh, Royal Observatory, Blackford Hill, Edinburgh EH9 3HJ, UK 13 Sterrewacht Leiden, Niels Bohrweg 2, 2333 RA Leiden, The Netherlands 14 Astronomical Institute, University of Amsterdam, Kruislaan 403, 1098 SJ Amsterdam, The Netherlands Accepted . Received ABSTRACT We present Spitzer Space telescope spectroscopic observations of 14 carbon-rich AGB stars in the Small Magellanic Cloud. SiC dust is seen in most of the carbon-rich stars but it is weak compared to LMC stars. The SiC feature is strong only for stars with significant dust excess, opposite to what is observed for Galactic stars. We argue that in the SMC, SiC forms at lower temperature than graphite dust, whereas the reverse situation occurs in the Galaxy where SiC condenses at higher temperatures and forms first. Dust input into the interstellar medium by AGB stars consists mostly of carbonaceous dust, with little SiC or silicate dust. Only the two coolest stars show a 30-micron band due to MgS dust. We suggest that this is due to the fact that, in the SMC, mass-losing AGB stars generally have low circumstellar (dust) optical depth and therefore effective heating of dust by the central star does not allow temperatures below the 650 K necessary for MgS to exist as a solid. Gas phase C 2 H 2 bands are stronger in the SMC than in the LMC or Galaxy. This is attributed to an increasing C/O ratio at low metallicity. We present a colour-colour diagram based on Spitzer IRAC and MIPS colours to discriminate between O- and C-rich stars. We show that AGB stars in the SMC become carbon stars early in the thermal-pulsing AGB evolution, and remain optically visible for ∼ 6 × 10 5 yr. For the LMC, this lifetime is ∼ 3 × 10 5 yr. The superwind phase traced with Spitzer lasts for ∼ 10 4 yr. Spitzer spectra of a K supergiant and a compact HII region are also given. Key words: circumstellar matter – infrared: stars — carbon stars — AGB stars — stars: mass loss — Magellanic Clouds 1 INTRODUCTION The late stages of the evolution of low and intermediate mass stars (hereinafter LIMS) are characterised by intense mass loss. This so-called superwind occurs during the Asymptotic Giant Branch (AGB) phase. The mass loss leads to the formation of a circumstel- ⋆ E-mail: [email protected] lar envelope composed of gas and dust. The chemical composition depends strongly on the C/O abundance ratio. CO is one of the first molecules to form and is very stable and unreactive. If C/O >1 by number, O will be trapped in the CO molecules, leading to a chem- istry dominated by molecules such as C2,C2H2, HCN and SiC dust grains (carbon stars). On the other hand, if C/O <1 we will observe oxygen-rich stars showing SiO, OH, H2O molecules and silicate dust. brought to you by CORE View metadata, citation and similar papers at core.ac.uk provided by CERN Document Server
Transcript of arXiv:astro-ph/0611071 v1 2 Nov 2006

arX
iv:a
stro
-ph/
0611
071
v1
2 N
ov 2
006
Mon. Not. R. Astron. Soc.000, 1–17 (2002) Printed 3 November 2006 (MN LATEX style file v2.2)
Spitzer spectroscopy of carbon stars in the Small Magellanic Cloud
Eric Lagadec1 ⋆, Albert A. Zijlstra1, G.C. Sloan2, Mikako Matsuura,3,1 Peter Wood4, G.J. Harris5,Jacco Th. van Loon6, J.A.D.L. Blommaert7, S. Hony8, M.A.T. Groenewegen7, M.W. Feast9,P.A. Whitelock9,10,11, J.W. Menzies9, M.-R. Cioni12, H. Habing13, L.B.F.M. Waters14
1University of Manchester, School of Physics & Astronomy, P.O. Box 88, Manchester M60 1QD, UK2Department of Astronomy, Cornell University, 108 Space Sciences Building, Ithaca NY 14853-6801, USA3 Division of Optical and IR Astronomy, National Astronomical Observatory of Japan, Osawa 2-21-1, Mitaka, Tokyo 181-8588, Japan4Research School of Astronomy and Astrophysics, Australian National University, Cotter Road, Weston Creek, ACT 2611, Australia5Department of Physics and Astronomy, University College London, Gower Street, London WC1E 6BT, UK6Astrophysics Group, School of Physical & Geographical Sciences, Keele University, Staffordshire ST5 5BG, UK7Instituut voor Sterrenkunde, K.U. Leuven, Celestijnenlaan 200 D, B-3001 Leuven, Belgium8CEA, DSM, DAPNIA, Service d’Astrophysique, C.E. Saclay, F-91191 Gif-sur-Yvette Cedex, France9 Department of Astronomy, University of Cape Town, 7701 Rondebosch, South Africa10South African Astronomical Observatory, PO Box 9, 7935 Observatory, South Africa11NASSP, Department of Mathematics & Applied Mathematics University of Cape Town, 7701, Rondebosch, South Africa12Institute for Astronomy, University of Edinburgh, Royal Observatory, Blackford Hill, Edinburgh EH9 3HJ, UK13Sterrewacht Leiden, Niels Bohrweg 2, 2333 RA Leiden, The Netherlands14Astronomical Institute, University of Amsterdam, Kruislaan 403, 1098 SJ Amsterdam, The Netherlands
Accepted . Received
ABSTRACTWe presentSpitzer Space telescope spectroscopic observations of 14 carbon-rich AGB starsin the Small Magellanic Cloud. SiC dust is seen in most of the carbon-rich stars but it is weakcompared to LMC stars. The SiC feature is strong only for stars with significant dust excess,opposite to what is observed for Galactic stars. We argue that in the SMC, SiC forms at lowertemperature than graphite dust, whereas the reverse situation occurs in the Galaxy where SiCcondenses at higher temperatures and forms first. Dust inputinto the interstellar medium byAGB stars consists mostly of carbonaceous dust, with littleSiC or silicate dust. Only thetwo coolest stars show a 30-micron band due to MgS dust. We suggest that this is due to thefact that, in the SMC, mass-losing AGB stars generally have low circumstellar (dust) opticaldepth and therefore effective heating of dust by the centralstar does not allow temperaturesbelow the 650 K necessary for MgS to exist as a solid. Gas phaseC2H2 bands are strongerin the SMC than in the LMC or Galaxy. This is attributed to an increasing C/O ratio at lowmetallicity. We present a colour-colour diagram based onSpitzer IRAC and MIPS colours todiscriminate between O- and C-rich stars. We show that AGB stars in the SMC become carbonstars early in the thermal-pulsing AGB evolution, and remain optically visible for∼ 6 × 10
5
yr. For the LMC, this lifetime is∼ 3 × 10⁵ yr. The superwind phase traced withSpitzer lasts
for ∼ 104 yr. Spitzer spectra of a K supergiant and a compact HII regionare also given.
Key words: circumstellar matter – infrared: stars — carbon stars — AGB stars — stars: massloss — Magellanic Clouds
1 INTRODUCTION
The late stages of the evolution of low and intermediate massstars(hereinafter LIMS) are characterised by intense mass loss.Thisso-called superwind occurs during the Asymptotic Giant Branch(AGB) phase. The mass loss leads to the formation of a circumstel-
⋆ E-mail: [email protected]
lar envelope composed of gas and dust. The chemical compositiondepends strongly on the C/O abundance ratio. CO is one of the firstmolecules to form and is very stable and unreactive. If C/O>1 bynumber, O will be trapped in the CO molecules, leading to a chem-istry dominated by molecules such as C2, C2H2, HCN and SiC dustgrains (carbon stars). On the other hand, if C/O<1 we will observeoxygen-rich stars showing SiO, OH, H2O molecules and silicatedust.
brought to you by COREView metadata, citation and similar papers at core.ac.uk
provided by CERN Document Server

2
The study of this mass loss is of high astrophysical interest,and impacts on the chemical evolution of galaxies. Indeed, the massloss from LIMS contributes to roughly half of all the gas recycledby stars (Maeder 1992). Mass loss from LIMS is one of two mainsources (along with WR stars and supernovae associated withmas-sive stars), of carbon in the universe (Dray et al. 2003). LIMS arealso the main source of heavy s-process elements (e.g. Ba, Pb) and,when including post-AGB evolution (e.g. novae), the major stellarsource of lithium.
The mass-loss process is, however, not fully understood. Themass loss results from a complicated interplay between stellar pro-cesses (turbulent convection, pulsation) and circumstellar processes(pulsation-driven shocks, radiation pressure) where especially therole of the dust composition is disputed (Woitke 2006). The ef-fect of metallicity on the mass-loss rates is poorly understood andmay vary with dust chemistry. Observational studies show nodif-ference between peak gas mass-loss rates for LMC and SMC stars(e.g. van Loon 2006). Theoretical studies (e.g. Bowen & Willson1991) predict that the mass-loss rates in AGB stars depend onthemetallicity: a lower metallicity leads to a lower dust-to-gas ratioand less efficient dust-radiation pressure. The effect may differ be-tween mineral (e.g. silicates) and non-mineral dust. In O-rich stars,all dust species are minerals (containing Si, Al for respectively sili-cates and corondum), whilst in C-rich stars dust contains both min-eral (e.g SiC) and non-mineral components (e.g. soot, amorphouscarbon).
The sensitivity reached by theSpitzer Space Telescope(Werner et al. 2004) enables, for the first time, the determinationof mass-loss rates from stars of different masses all along the AGBsequence at the distance of the Magellanic Clouds. The distancesto these two galaxies are also relatively well-known and themetalabundance of stars within can be estimated using age-metallicity re-lations. This allows one to measure absolute (dust) mass-loss ratesfor stars with known bolometric magnitudes and metallicities.
We have therefore conducted a survey of mass-losing starsin the Small and Large Magellanic Clouds (hereinafter SMC andLMC respectively). The aim of this project is to empiricallycali-brate the mass-loss rate of AGB stars as a function of mass, lumi-nosity and metallicity. Here we present the data from the SMC. Thedata from the LMC are presented in Zijlstra et al. (2006). A studyof the mass-loss rates will be presented in forthcoming papers.
2 TARGET SELECTION
We selected 17 stars in the SMC to obtain a sample of stars oflower metallicity than the LMC stars described in Zijlstra et al.(2006). The stars were all AGB stars, with preference being givento stars in the populous intermediate-age cluster NGC 419, starswith past infrared monitoring showing large-amplitude variabilityor stars with some ISO detection (Cioni et al. 2003).
The observed stars are shown in the MK vs J−K diagram inFig 1. Fourteen of the intended targets were observed withSpitzer,while peak-up failures occurred for 3 objects. In one case, the peak-up occurred on a noise spike so no target was observed, while inthe other two cases a brighter object in the peak-up image ledtothe detection of an HII region (MB 88, from Murphy & Bessell2000) and a red supergiant of spectral type K (PMMR 52, fromPrevot et al. 1983). The latter object is the single object lying in thesupergiant region of Figure 1.
The observed stars in the cluster NGC 419 whose names con-tain LE (NGC 419 LE 16, NGC 419 LE 18, NGC 419 LE 27 and
Figure 1. The MK, J−K diagram for the observed sample of mid-IRsources in the SMC (large filled circles). Stars in the cluster NGC 419are circled. For orientation, we also show a large sample of mid-infraredsources in the LMC from MSX (small open circles) and field stars from asmall area of the LMC bar (small dots) - see also Zijlstra et al. (2006). AGBstars are confined approximately to the region below the linemarked “AGBlimit”. Stars above this limit are red supergiants with masses above∼8 M⊙,or perhaps foreground stars. Distance moduli of 18.54 and 18.93 have beenassumed for the LMC and SMC, respectively (Keller & Wood 2006).
NGC 419 LE 35) were discovered by Lloyd Evans (1980) usingphotographic surveys in the V and I bands. The two other starsfrom this cluster, NGC 419 IR1 and NGC 419 MIR1 were discov-ered during a survey with ISOCAM (Tanabe et al. 1997). LEGC105 was discovered during an optical survey of the SMC (LloydEvans et al. 1988). RAW 960 appeared in the Rebeirot et al. cat-alogue (1993). IRAS 00554−7351 is described in Whitelock et al.(1989). Stars with names beginning with ISO were selected fromthe ISO/MACHO catalogue of variable AGB stars in the SMC(Cioni et al. 2003). The variable star GM 780 was discovered byGlen Moore using UK Schmidt plates but his work is unpublished.Literature data is summarised in Table 1. For LEGC 105, LloydEvans et al. (1988) suspect that the pulsation is irregular but theirapproximate period is confirmed with MACHO. RAW 960 has avery short period and is clearly a semi-regular rather than aMiravariable.
All 14 AGB stars that were observed turned out to be carbonstars. The dominance of C-stars is at variance with the MSX-basedclassification scheme of Egan et al. (2001) according to which thesample stars would be a mixture of carbon-rich and oxygen-richstars. Our LMC sample of AGB stars also showed that the Egan et

Carbon stars in the Small Magellanic Cloud 3
al. classification scheme is ineffective at separating M- and C-starson the AGB (Zijlstra et al. 2006).
The AGB stars in our SMC sample have JHK colours whichare reddened compared to stellar colours, but mostly not extremelyso. The J−K versus MK diagram is shown in Fig. 1. The SMC sam-ple has predominantly lower circumstellar extinction (bluer J−Kcolours) than the LMC sample in Zijlstra et al. (2006). The clusterstars from NGC 419 are mostly at the blue end of the AGB se-quence, but they also include the reddest star in the sample (NGC419 MIR1). IRAS 00554−7351 is also very red with J−K= 5.
Fig. 2 shows the colour-magnitude diagrams for known opticalcarbon stars in the Clouds. Open circles show theSpitzer samples ofZijlstra et al. (2006) and this paper. The distribution shows that weare observing the peak of the luminosity range of the opticalcarbonstar distribution. The LMC sample contains a larger fraction of red-der objects with higher dust mass-loss rates than the SMC sample.The gas mass-loss rates may be more compatible (e.g. Matsuura etal. 2006, van Loon 2006). However, this point should be takenintoaccount when comparing the samples, as later in this paper.
3 OBSERVATIONS
3.1 Spitzer
The observations were made with the InfraRed Spectrograph (IRS,Houck et al. 2004), on board theSpitzer Space Telescope. Weused the Short-Low (SL) and Long-Low (LL) modules to coverthe wavelength range 5-38µm. The SL and LL modules are eachdivided in two spectral segments, together known as SL2, SL1,LL2 and LL1; a “bonus” order covering the overlap between thetwo modules is also available. The data reduction is similarto thatdescribed in Zijlstra et al. (2006). The raw spectra were processedthrough theSpitzer pipeline S12. We replaced the bad pixels by val-ues estimated from neighbouring pixels. The sky subtraction wasdone by differencing images aperture by aperture in SL and nodby nod in LL. We used the software Spice (Spitzer IRS CustomExtractor) to extract the spectra. The flux calibration was made us-ing the reference stars HR 6348 (K0 III) in SL and HR 6348, HD166780 (K4 III) and HD173511 (K5 III) in LL. The spectra wereindividually extracted from the individual images. Both nods inboth apertures were then joined simultaneously, recalculating theerrors in the process by comparing the nods. The different nodswere averaged, using the differences to estimate the errors. The dif-ferent spectral segments were combined using scalar multiplicationto eliminate the discontinuities due to flux lost because of pointingerrors. The different segments were also trimmed to remove du-bious data at their edges. We also retained the bonus order whereit was valid. We obtained a standard wavelength calibrationaccu-racy of 0.06µm in SL and 0.15µm in LL. The calibration processis detailed in Sloan et al. (2003).
Even after sky removal, some interstellar emission lines re-main on the spectra, mostly observed longward of 30µm.
Two of the observed objects in NGC 419, LE 35 and LE 27,showed large discrepancies between SL and LL. The aperturesofthese two modules are perpendicular to each other on the sky.Anacquisition error may have led to the star being missed in oneaper-ture but not the other, or confusion in the cluster may have causedspectrum extraction problems. The SL spectra are those of AGBstars, with flux densities consistent with the MSX flux. The LLspectra are too faint and featureless. We therefore consider the SLobservations to have been successful and will only discuss their
Figure 4. Spectrum of the red object MB 88. This object shows emissionlines and could be associated with an HII region. Emission lines from SIV(10.51µm), NeII (12.81µm), SIII (18.71 and 33.48µm), SiII (34.83µm) andNeIII (35.97µm) are observed.
Figure 5. Spectrum of the oxygen-rich star PMMR 52. Typical spectral fea-tures of silicates are observed at 9.8µm and 18µm.
SL spectra. However, mispointings can affect the wavelength cal-ibration, flux calibration and even the slope of the spectralenergydistribution (SED). We can therefore not be as confident of thesespectra as we are for the remaining stars.
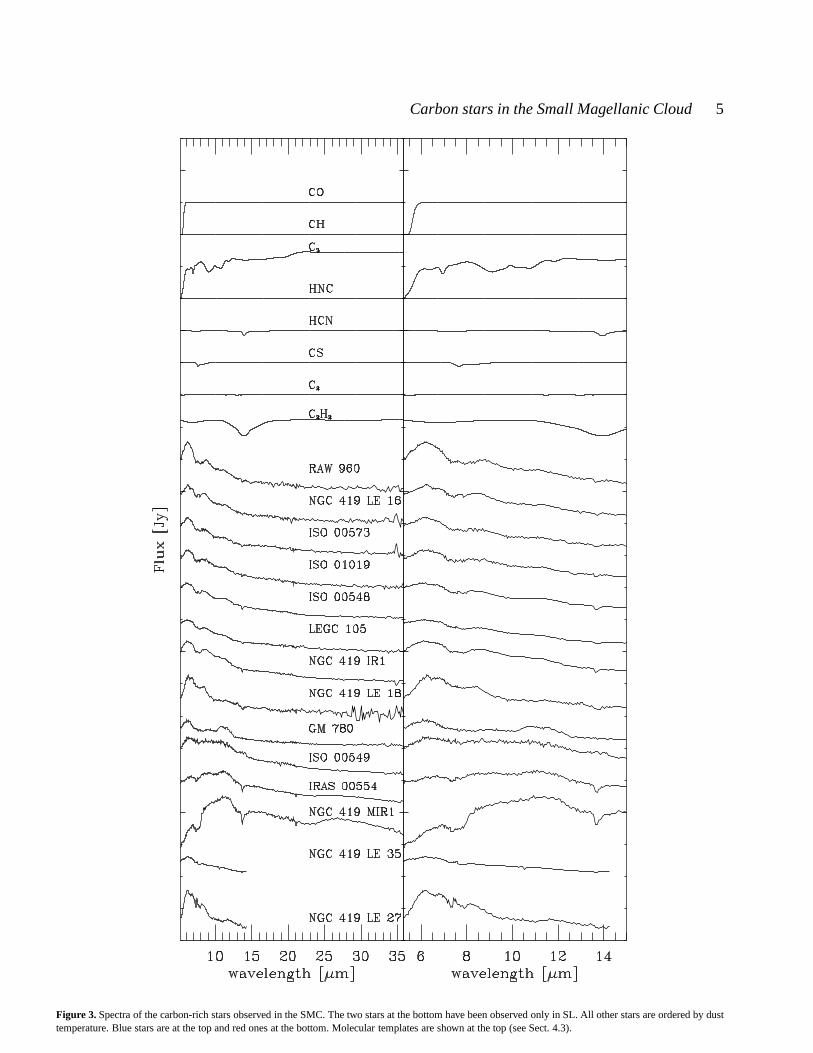
The spectra of the observed AGB stars, ordered by dust tem-peratures (see Sect. 6), are presented in Fig. 3. The molecular bandsdiscussed below show that all 14 objects are carbon-rich stars. Wecalculated equivalent magnitudes of our sources for IRAC 8µm andMIPS 24µm, by convolving these filter band passes with our spec-tra. These are listed in Table 2.
Finally, we present the spectra of the two objects acquired ac-cidently following peakup failure. MB 88 (Fig. 4) is a red objectwith emission lines, a spatial diameter of about 8 arcsec, and withseveral embedded stars. It is almost certainly an HII region. Emis-sion lines from SIV (10.51µm), NeII (12.81µm), SIII (18.71 and33.48µm), SiII (34.83µm) and NeIII (35.97µm) are observed. Itsspectrum is not analysed further here. The spectrum of the red su-pergiant PMMR 52 can be found in Fig. 5. It is discussed brieflyinSect. 5.1.

4
0 2 4 6-2
-4
-6
-8
-10
J - K
LMC
0 2 4 6-2
-4
-6
-8
-10
J - K
SMC
Figure 2. The MK, J−K diagram for all known optical carbon stars in the LMC and SMC. Samples are taken from Kontizas et al. (2001) and Rebeirot etal. (1993); infrared magnitudes are from 2MASS. Open circles show the Spitzer targets discussed in Zijlstra et al. (2006) and in this paper. LMC photometryfor these is from Groenewegen et al. (2007): where no J is available, we assumedJ − K ∼ 0.6 + 1.84 × (H − K). The J−K≈ 7 for NGC418 MIR1 wasestimated from its K−L colour.
3.2 Bolometric magnitudes and initial masses
We determined the bolometric magnitudes of the observed starsassuming a SMC distance modulus of18.93 ± 0.024 (Keller &Wood 2006) (∼60 kpc). JHKL photometry was taken nearly simul-tanously with theSpitzer observations. These observations weremade using the 2.3m Telescope at Siding Spring Observatory (SSO,Australia). The filters used were centred at 1.28µm (J), 1.68µm(H), 2.22µm (K) and 3.59µm (L). The observations are describedin Groenewegen et al. (2007). Zero flux was assumed at the fre-quencies 0 and3×1016 Hz to estimate the bolometric magnitudes.The flux from the star was then estimated by integrating undertheresulting SED. The line-of-sight extinction towards the SMC ofE(B − V) = 0.12 (Keller & Wood 2006) was ignored. The bolo-metric magnitudes are presented in Table 2.
Simultaneous observations in the K-band are important toobtain a reliable instantaneous luminosity estimate. However, themagnitudes are single-epoch measurements and therefore subjectto pulsation-induced variability. Earlier (literature) values are listedin Table 1. These generally agree to within 0.5 mag of the currentmeasurements, consistent with the variability expected for thesestars.
The histogram of the distribution is shown in Fig. 6. The SMCsample includes the carbon stars observed by Sloan et al. (2006)which cover a similar luminosity range. The LMC carbon-starsam-ple of Zijlstra et al. (2006) is also shown. There is no obvious dif-ference between the LMC and SMC distributions.
For comparison, in the third panel we show a complete carbonstar luminosity function for the LMC. This is derived from the car-bon star survey of Kontizas et al. (2001), which we cross-correlatedwith 2MASS. The bolometric magnitudes for this sample are de-rived from the 2MASS JHK magnitudes, using the bolometric cor-rection equation derived by Whitelock et al. (2006):
BCK = +0.972 + 2.9292 × (J − K) − 1.1144 × (J − K)2
+0.1595 × (J − K)3 − 9.5689 103(J − K)4 (1)
This relation differs by 0.2–0.3 mag from the one used by Costa &Frogel (1996) for1 < J−K < 2.5 . Positional agreement betweenthe 2MASS object and the carbon star is required to be better than1 arcsec. Stars with non-detections in one or more infrared band arenot included.
The bottom panel shows the same for the SMC carbon starstaken from Rebeirot et al. (1993). These stars were also cross-correlated with 2MASS, and the bolometric magnitudes derivedfrom the 2MASS JHK magnitudes. The coordinates in Rebeirotet al. are less accurate and we accepted co-identifications out to 2arcsec. A larger number of chance superpositions may be expected.
If we compare this histogram with Fig. 20 in Vassiliadis &Wood (1993), for SMC metallicities, this indicates that thestars weobserved have initial masses in the range 1–4 M⊙.
Six of the stars we observed are located in the cluster NGC419. This cluster has an age of 1.2×10⁹ yr, and a metallic-ity [Fe/H]=−0.60±0.21 (de Freitas Pacheco et al. 1998). The
Carbon stars in the Small Magellanic Cloud 5
Figure 3. Spectra of the carbon-rich stars observed in the SMC. The twostars at the bottom have been observed only in SL. All other stars are ordered by dusttemperature. Blue stars are at the top and red ones at the bottom. Molecular templates are shown at the top (see Sect. 4.3).

6
LMC
-3 -4 -5 -6 -70
50
100SMC
Figure 6. Top: distribution of bolometric magnitudes of the observedstarsin the SMC, assuming a distance modulus of 18.93 (Keller & Wood 2006).Both stars from this paper and from Sloan et al. (2006) are included. Sec-ond: the histogram for the LMC carbon stars observed by Spitzer (Zijlstraet al. 2006). Third: Optical carbon stars in the LMC (Kontizas et al. 2001).Bottom panel: Optical carbon stars in the SMC (Rebeirot et al. 1993). Thearrows indicate the location of the tip of the RGB (Bellazzini et al. 2001).
isochrones of Pietrinferni et al. (2006) for this age and forZ =0.004, give an initial mass of the thermal-pulsing AGB stars in thiscluster of 1.82 M⊙ for standard models and 2.08 M⊙ for models us-ing overshoot. (The difference shows the considerable uncertaintyin deriving stellar ages.) But their bolometric magnitudes(see alsovan Loon et al. 2005) are associated with higher-mass progenitorson the Vassiliadis & Wood (1993) tracks. Thus the stars reachahigher luminosity than predicted. This may indicate that the mass
Table 1. Bolometric magnitudes and periods from the literature. B83:Bessell et al. (1983); W91: Westerlund et al. (1991); T97: Tanabe et al.(1997); vL05: van Loon et al. 2005; W89: Whitelock et al (1989); LE88:Lloyd Evans et al. (1988); C03: Cioni et al (2003). The distance modulus tothe SMC is taken as 18.93.
Mbol Period ref.Star [mag] [days]
NGC 419 LE 27 −4.88, −4.98 B83,W91NGC 419 LE 18 −4.72, −4.82 B83,W91NGC 419 LE 16 −5.43 W91NGC 419 LE 35 −5.02 W91NGC 419 IR 1 −4.9, −5.3 T97, vL05NGC 419 MIR,1 −4.9 vL05IRAS 00554−7351 −6.1 : 800 W89LEGC 105 −4.7 310:,350 LE88,C03RAW 960 34 C03ISO 00573 −5.3 348 C03ISO 01019 −5.1 336 C03ISO 00548 −4.9 432 C03ISO 00549 −5.6 604 C03
Figure 7. The [6.4]−[9.3] versus [16.5]−[21.5] colour-colour diagram ofthe stars in our SMC sample.
loss is weaker (or the onset of the superwind later) than assumedfor the evolutionary model calculations (Zijlstra 2004).
4 OBSERVED SPECTRAL FEATURES
The spectra show clear and deep molecular bands. The two maindust features are less obvious. We will describe the dust bands first,followed by the observed molecular bands.
4.1 Dust bands
Most of the carbon stars in our sample show the presence of anemission feature around 11.3µm. This feature is attributed to emis-

Carbon stars in the Small Magellanic Cloud 7
Table 2. Observed SMC targets: names, adopted coordinates, and photometry. J and K are taken from near-simultaneous measurements at SSO. The 8µmand 24µm magnitude are calculated from our spectra using the IRAC and MIPS filter profiles; the zeropoints are taken as 63.5 ( 8.0µm) and 7.14 Jy (24µm)respectively.
Adopted name 2MASS name RA Dec J K 8µm 24µm mbol Mbol
(J2000) mag mag mag mag mag mag
AGB stars
NGC 419 LE 27 01082067−7252519 01 08 20.67 −72 52 52.0 12.68 10.99 6.05 14.49−4.44NGC 419 LE 18 01082495−7252569 01 08 24.95 −72 52 56.9 12.71 11.00 9.09 8.76 14.43−4.50NGC 419 LE 35 01081749−7253013 01 08 17.49 −72 53 01.3 12.67 10.88 7.16 14.33−4.60NGC 419 LE 16 01080114−7253173 01 08 01.14 −72 53 17.4 13.82 11.30 8.72 14.65−4.28NGC 419 IR1 01081296−7252439 01 08 12.97 −72 52 44.0 13.44 10.74 7.31 6.79 13.71−5.22NGC 419 MIR1 01 08 17.47 −72 53 09.5 15.49 14.33 −4.60IRAS 00554−7351 00570395−7335146 00 57 03.95 −73 35 14.7 15.90 11.09 5.69 4.12 12.67−6.26RAW 960 00555464−7311362 00 55 54.65 −73 11 36.3 13.29 10.92 14.42 −4.51ISO 00573 00572054−7312460 00 57 20.55 −73 12 46.0 12.87 10.75 8.61 8.20 14.17−4.76LEGC 105 00544685−7313376 00 54 46.85 −73 13 37.7 14.23 11.21 8.18 7.85 14.36−4.57ISO 01019 01015458−7258223 01 01 54.58 −72 58 22.4 13.05 10.88 8.21 8.12 14.15−4.78ISO 00548 00545075−7306073 00 54 50.76 −73 06 07.4 13.87 10.87 7.45 7.12 13.84−5.09ISO 00549 00545410−7303181 00 54 54.11 −73 03 18.2 14.59 10.99 7.24 6.14 13.80−5.13GM780 00353726−7309561 00 35 37.27 −73 09 56.2 12.88 10.18 7.67 6.57 13.58−5.35
Other objects
PMMR 52 00 53 09.12 −73 04 03.8MB 88 00 51 40.4 −73 13 33
sion from SiC. However, in several cases the feature is very weak,and in such cases it is hard to judge whether this feature is anemission feature or due to molecular absorptions on the blueandred side. SiC condenses at high temperatures and is expectedto bepresent for all dusty carbon stars. However, its abundance may belimited by the abundance of Si.
NGC419 LE 35 shows no discernable SiC feature. This is,however, one of the two sources with acquisition and/or extractionproblems. GM 780 has a very strong feature, compared to the otherstars, but the shape is peculiar. The shape is possibly affected by ex-traction problems but the strength of the feature is well established.This object is discussed below.
A wide emission feature, centred at∼ 30µm is observed intwo stars: NGC 419 MIR1 and (weaker) IRAS 00554−7351. Thisfeature is common in Galactic AGB and post-AGB stars, and at-tributed to emission from MgS (Hony et al. 2002). These two SMCstars have the reddest near-infrared colours in our sample,and thecoolest dust, with dust temperatures of respectively 409 and 589K (see section 6). In the LMC, this feature is observed only intheenvelopes of stars with dust temperature lower than 650K (Zijl-stra et al. 2006). This can be explained by the fact that MgS growson the surface of pre-existing grains, this process starting around600K and being complete around 300K. The two SMC detectionsare consistent with this.
4.2 Molecular bands
Most vibrational bands of simple molecules occur at wavelengthsshortward of 20µm. (HNC has a vibrational fundamental at 20µm.)This is the region where we observe clear bands. The main fea-tures, observed for most of the stars of our sample, are located at∼7.5µm and∼13.7µm respectively. Both are associated with ab-
sorption from C2H2. The 13.7µm band is due to theν5 bendingmode of acetylene and its associated hot and combination bands(Cernicharo et al. 1999). This absorption band is observed in almostall carbon stars of our sample, but it is not clear in ISO 00549andGM 780. The narrow band is flanked by broader bands, best seen inNGC419 MIR1. The double peaked band at 7.5µm observed in allof our spectra is associated with the C2H2 ν1
4+ν1
5 P- and R-branchtransition, as shown by Matsuura et al. (2006). The shape maybedifferent in NGC419 LE 27, perhaps with a contribution from CSand/or HCN.
A weak absorption band at 14.3µm is observed in the spec-tra of the two reddest stars of our sample (IRAS 00554 and NGC419 MIR1). This band has been observed in Galactic carbon stars(Aoki et al. 1999) and is attributed to HCN. The fact that it isob-served in the reddest stars of our sample, where the optical depth isimportant, and dust coolest, seems to indicate that this molecule ispresent in the outer layers of the observed envelopes.
A decrease of the spectral energy distribution is observed nearthe blue edge of all our spectra , around 5µm. This is due to severalmolecules: C2 and/or C3 starting from 6µm (blueward), and COabsorption very close to the 5µm. Several targets show a higherflux level at the blue edge with a sharp drop: this is not seen intheLMC spectra.
Zijlstra et al. (2006) have identified a weak absorption featurein the LMC sample at 5.8µm, attributed to carbonyl. This featureis not detected in our SMC sample. It could indicate an underabun-dance of CO with respect to stars in the LMC, as expected giventhat there is less O to start with.

8
4.3 Models of molecular opacity
The top lines in Fig. 3 show the calculated model spectra of a num-ber of molecules. Similar plots in Zijlstra et al. (2006) arebased onthe line lists and models of Jørgensen et al. (2000). Newer line listsare now available for some simple molecules (Harris et al. 2002,2006), such as HCN and HNC. We also revised opacity curves forCO, C2 and CS from Zijlstra et al. (2006).
The HCN/HNC linelist was computed using first principlesquantum mechanics. It contains about 160 000 rotation-vibrationenergy levels truncated at 18000 cm−1, and atJ = 60. There arearound4× 108 lines, but only34× 106 of these are strong enoughto contribute to opacity. Both the linear H-CN and H-NC geometricconfigurations are studied, as are some of the low lying delocalisedstates. The delocalised states are the states in which the H nucleusorbits the CN part of the molecule. The accuracy of the fundamen-tal vibrational transitions is about 3–4 cm−1; the error increasesat higher energies. The transition intensities agree well with lab-oratory data. Incorporation of laboratory data into the linelist hassignificantly improved the accuracy of the frequencies of the tran-sitions between these low lying states.
The opacity curves for CO, C2 and CS are calculated fromabsorption coefficients determined by Goorvitch (1994), Querci etal. (1994) and Chandra et al. (1995) respectively.
Using this, we determined the opacity for the HCN, HNC, CO,CS and C2 as a function of wavelength. To determine the transmis-sion function, we then used the Lambert-Beer law (Banwell & Mc-Cash 1994), i.e. the solution to the 1D equation of radiativetransferin the absence of an internal source.
Fitting the spectral features to get column densities is be-yond the scope of this paper and will be done in a forthcomingpaper. We can however determine which molecules are responsi-ble for the observed molecular bands. We thus calculated trans-mission curves using column densities for the different molecularspecies of1018cm−2 for the HCN, HNC, CS and C2 molecules and1022cm−2 for CO. A temperature of 1750 K was used for all themodels. The resulting transmittance curves are plotted at the topof Fig. 3, together with the transmittance curves from Jørgensenet al. (2000) for C2H2 and C3. This C2H2 model reproduces thebroad photospheric absorption, but not the narrow component, aris-ing from a cool layer (Jørgensen et al. 2000). Cherchneff (2006)shows that acetylene reaches its peak abundance in the extendedatmosphere, and its temperature is expected to be lower thanthephotospheric temperature (van Loon et al. 2006, Matsuura etal.2006).
5 INDIVIDUAL STARS
5.1 PMMR 52
PMMR 52 is a red supergiant of spectral type K (Prevot et al.,1983). This is the only oxygen-rich star in the sample. The spec-trum is shown in Fig. 5. The observed spectrum of PMMR 52 showsthe presence of spectral features of oxygen-rich dust (silicates at10µm and 18µm). The 18µm silicate feature is strong. The 10-µmsilicate band is remarkably weaker than observed in other O-richstars. Normally, in O-rich stars, the 18-µm feature should decreasesteeply after 19-20µm. But the one in PMMR 52 remains very flat.
There are no signatures of crystalline silicates, which indicatesthat the silicates are largely in an amorphous phase. Some small ab-sorption features are observed at 6.2 and 7.5µm. The 6.2µm featureis due to water, while the one at 7.5µm might be attributed to ab-
Figure 8. The peculiar spectrum of GM 780.
Table 3. Mid-infrared continuum bands for carbon stars for the so-called’Manchester system’. The last column gives the adopted flux correspondingto zero magnitude.
centralλ [µm] λ-range [µm] F0 [Jy]
6.4 6.25–6.55 96.59.3 9.1–9.5 45.716.5 16–17 15.421.5 21–22 9.1
sorption by SiO, but this feature is very faint and might be due tonoise.
5.2 GM 780
Fig. 8 shows the spectrum of GM 780. Compared to the othersources, C2H2 bands are noticeably absent. The weak band at 8µmis best fitted as CS, based on the models above. The 11-µm band isstrong but its shape is significantly different from that of the otherstars. There are no traces of silicates at 9.8 and 18µm. GM 780 isthe brightest star at K in our sample; the bolometric luminosity ishigh for our sample but lower than those of the luminous IRAS-selected carbon stars (van Loon et al. 1999b).
TheJ−K colour of this object,J−K = 2.6, is quite red, anddust should be present around it. The dust temperature is relativelyhigh, however, at 720 K.
The object is discussed further below (Section 9) where weargue the this star has a C/O ratio lower than that of other stars inthe sample.
6 COLOURS AND BAND STRENGTHS
As discussed above, the spectra of the observed stars are dom-inated by molecular and dust bands. This makes the definitionofthe continua difficult. To avoid this and to determine colours, weuse the Manchester system (Zijlstra et al. 2006, Sloan et al.2006).This system, valid for carbon stars but not for oxygen-rich stars,defines four narrow bands, selected to avoid the molecular and dustbands, to determine the continuum. Table 3 shows the wavelengths

Carbon stars in the Small Magellanic Cloud 9
Table 4. Photometry: colours measured using four narrow carbon stars con-tinuum bands.
target [6.4]−[9.3] [16.5]−[21.5][mag] [mag]
NGC 419 LE 27 0.067±0.018NGC 419 LE 18 0.067±0.020 0.126±0.098NGC 419 LE 35 0.215±0.013NGC 419 LE 16 0.325±0.021 −0.052±0.062NGC 419 IR1 0.496±0.011 0.047±0.017NGC 419 MIR1 1.343±0.012 0.352±0.012IRAS 00554 0.938±0.008 0.232±0.021RAW 960 0.199±0.022 0.017±0.115ISO 00573 0.255±0.017 −0.012±0.029LEGC 105 0.380±0.013 0.034±0.069ISO 01019 0.374±0.015 −0.156±0.039ISO 00548 0.399±0.013 −0.084±0.025ISO 00549 0.725±0.014 0.199±0.012GM 780 0.388±0.016 0.185±0.031
used to defined the four narrow-bands and the adopted flux corre-sponding to zero-magnitude, determined to give a zero colour fora Rayleigh-Jeans tail. Using this system, we can determine contin-uum flux at 6.4, 9.3, 16.5 and 21.5µm, by integrating the observedspectra over the defined bands. The choice of the wavelengthsusedto define the continua is discussed in Zijlstra et al. (2006).Table 4lists the measured continuum flux and colours for the observed car-bon stars.
This method permits us to determine two colour temperatures,[6.4]−[9.3] and [16.5]−[21.5]. The [6.4]−[9.3] colour is an indi-cation of the optical depth, whereas the [16.5]−[21.5] colour canbe use to determine the dust temperature. Table 6 lists the black-body temperatures derived from the [16.5]−[21.5] colours for theobserved stars. For the bluest objects, this method gives lowerlimits (<∼ 104K) as the Rayleigh-Jeans limit is reached. This isthe case for NGC 419 LE 16, NGC 419 IR1, RAW 960, LEGC 105,ISO 00573, ISO 01019 and ISO 00548. We thus do not give an es-timation of the dust temperature for these stars. Furthermore, thederived temperature can be affected by wavelength-dependent con-tinuum contamination from other sources in the beam. Thus, forthe bluest stars, we can obtain temperatures that are not physicallymeaningful.
Fig. 7 shows the [6.4]−[9.3] vs [16.5]−[21.5] colour-colourdiagram obtained with the Manchester method. The stars fromoursample form a well-defined sequence on this diagram. Some starsshow a negative [16.5]−[21.5] colour (NGC 419 LE 16, ISO 00573,ISO 01019, ISO 00548). These stars are very blue and their spectraare typical of naked carbon stars. Two blue stars, NGC 419 LE 18and GM 780, are offset in [16.5]−[21.5] colour by roughly 0.1mag. The spectrum of GM 780 is very noisy in LL, so that its[16.5]−[21.5] colour has higher uncertainties than the other ob-jects. The good correlation observed between [6.4]−[9.3] and[16.5]−[21.5] indicates that the choice of our continuum wave-lengths is appropriate.
For all the stars in our sample, we have measured the strengthof the observed features. We define small wavelength ranges onthe blue and red side of the features (Table 5), selected to avoidfeatures, to define the continuum. We then fit line segments fromboth sides of the feature that defines the continuum. As the rededge of the MgS feature is outside of the IRS wavelength range,
Table 5. Wavelengths used to estimate the continua for the SiC and C2H2
spectral features.
Features λ [µm] Blue continuum [µm] Red continuum [µm]
C2H2 7.5 6.08–6.77 8.22–8.55SiC 11.3 9.50–10.10 12.80–13.40
C2H2 13.7 12.80–13.40 14.10–14.70
this method can not be applied to the MgS feature. The continuumunder the MgS feature is thus assumed to be a blackbody with atemperature deduced from the [16.5]−[21.5] colour. After subtrac-tion of the continuum, we can measure the strength of each feature.For the molecular bands (C2H2 at 7.5 and 13.7µm), this strengthis estimated as an equivalent width. For the dust emission features(SiC and MgS), we use a line-to-continuum ratio, defined as the in-tegrated flux of the band divided by the integrated underlying con-tinuum, over the wavelength range of the feature. The MgS featureextend beyond the edge of the spectral coverage: its strength relatesonly to the part blueward of 38µm, and the continuum is calculatedas a black body (see Zijlstra et al. 2006).
We also measured the central wavelength of the SiC band.This central wavelength is defined as the wavelength at which, af-ter continuum removal, the flux on the blue side equals the fluxonthe red side. Table 6 lists the measured strength and centralwave-lengths of the observed features. The MgS feature central wave-length can not be measured from the available wavelength range.7 COLOUR-COLOUR DISCRIMINATIN BETWEEN C
AND O-RICH AGB STARS
Classification criteria for separating C-rich from O-rich stars pro-posed by Egan et al. (2001) are based on the K−A versus J−Kcolours (where A is the MSX band centred at 8.3µm). These arenow known not to work effectively (Zijlstra et al. 2006, Buchananet al. 2006). Better separation is possible using differentMSXbands (Whitelock et al. 2006) but in the Magellanic Clouds onlythe A-band was sensitive enough to detect the AGB stars.
A variety of colour-colour plots based on IRAC and MIPS ob-servations, useful in distinguishing chemical type, are discussed inBlum et al. (2006). These, however, rely on the IRAC bands outsideof the IRS wavelength coverage. We investigated whether a colour-colour diagram, based on Spitzer IRAC and MIPS colours, coulddiscriminate O-rich and C-rich stars usingλ > 5µm. The equiv-alent IRAC and MIPS flux for the observed objects were derivedfrom the IRS spectra and the transmission curves of the IRAC 5.8and 8.0µm filters and MIPS 24µm filter. As our sample containsjust one O-rich star, we added IRS spectra of evolved stars intheSMC and in the LMC from different programs.
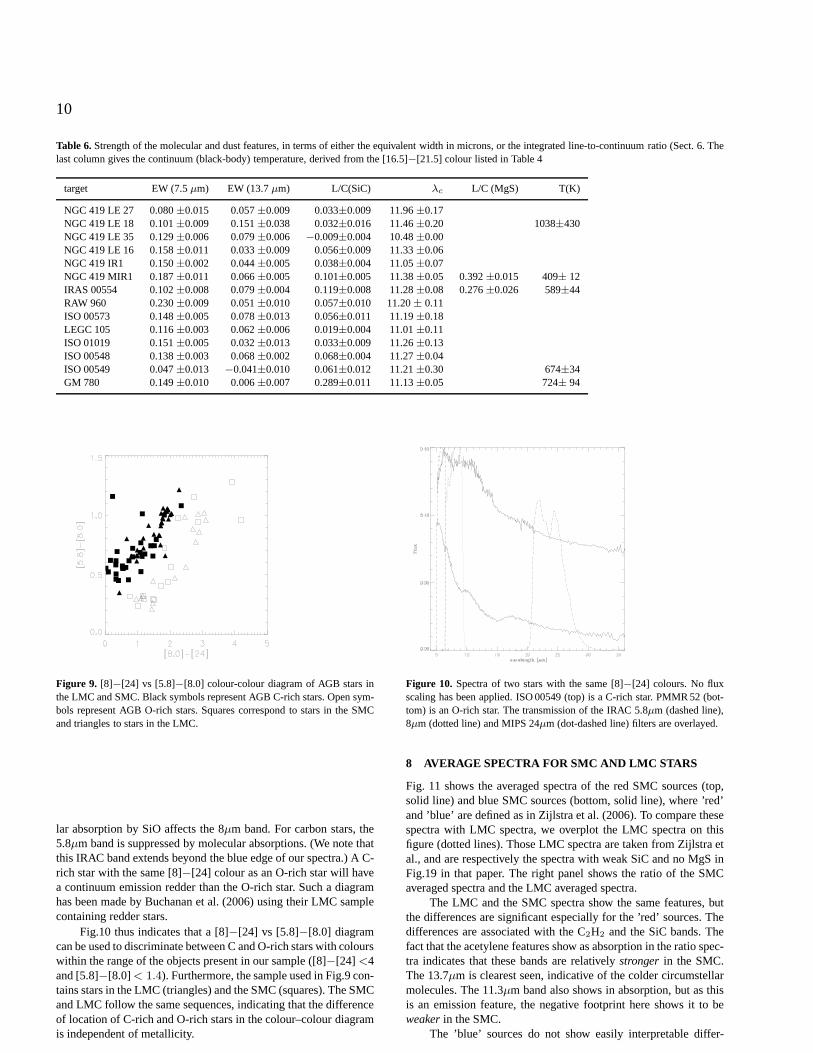
Fig.9 shows the distribution of the O-rich stars (open sym-bols) and C-rich stars (black symbols) from the combined sampleon a [8.0]−[24] vs [5.8]−[8.0] colour-colour diagram. The O-richand C-rich stars form two well-defined sequences on this diagram.The C-rich stars have redder [5.8]−[24] colour than O-rich starsfor the same [8.0]−[24] colour. Fig.10 explains this effect. We haveplotted the spectra of PMMR 52, an O-rich star, and ISO 00549,aC-rich star, with the transmission of the IRAC 5.8um (dashedline),8um (dotted line) and MIPS 24um (dotted-dashed line) bands su-perposed. The filter responses are affected by several molecular anddust bands. For O-rich stars, the blue edge of the MIPS 24µm fil-ter overlaps with the 18µm silicate emission feature, and molecu-
10
Table 6. Strength of the molecular and dust features, in terms of either the equivalent width in microns, or the integrated line-to-continuum ratio (Sect. 6. Thelast column gives the continuum (black-body) temperature,derived from the [16.5]−[21.5] colour listed in Table 4
target EW (7.5µm) EW (13.7µm) L/C(SiC) λc L/C (MgS) T(K)
NGC 419 LE 27 0.080±0.015 0.057±0.009 0.033±0.009 11.96±0.17NGC 419 LE 18 0.101±0.009 0.151±0.038 0.032±0.016 11.46±0.20 1038±430NGC 419 LE 35 0.129±0.006 0.079±0.006 −0.009±0.004 10.48±0.00NGC 419 LE 16 0.158±0.011 0.033±0.009 0.056±0.009 11.33±0.06NGC 419 IR1 0.150±0.002 0.044±0.005 0.038±0.004 11.05±0.07NGC 419 MIR1 0.187±0.011 0.066±0.005 0.101±0.005 11.38±0.05 0.392±0.015 409± 12IRAS 00554 0.102±0.008 0.079±0.004 0.119±0.008 11.28±0.08 0.276±0.026 589±44RAW 960 0.230±0.009 0.051±0.010 0.057±0.010 11.20± 0.11ISO 00573 0.148±0.005 0.078±0.013 0.056±0.011 11.19±0.18LEGC 105 0.116±0.003 0.062±0.006 0.019±0.004 11.01±0.11ISO 01019 0.151±0.005 0.032±0.013 0.033±0.009 11.26±0.13ISO 00548 0.138±0.003 0.068±0.002 0.068±0.004 11.27±0.04ISO 00549 0.047±0.013 −0.041±0.010 0.061±0.012 11.21±0.30 674±34GM 780 0.149±0.010 0.006±0.007 0.289±0.011 11.13±0.05 724± 94
Figure 9. [8]−[24] vs [5.8]−[8.0] colour-colour diagram of AGB stars inthe LMC and SMC. Black symbols represent AGB C-rich stars. Open sym-bols represent AGB O-rich stars. Squares correspond to stars in the SMCand triangles to stars in the LMC.
lar absorption by SiO affects the 8µm band. For carbon stars, the5.8µm band is suppressed by molecular absorptions. (We note thatthis IRAC band extends beyond the blue edge of our spectra.) AC-rich star with the same [8]−[24] colour as an O-rich star will havea continuum emission redder than the O-rich star. Such a diagramhas been made by Buchanan et al. (2006) using their LMC samplecontaining redder stars.
Fig.10 thus indicates that a [8]−[24] vs [5.8]−[8.0] diagramcan be used to discriminate between C and O-rich stars with colourswithin the range of the objects present in our sample ([8]−[24] <4and [5.8]−[8.0] < 1.4). Furthermore, the sample used in Fig.9 con-tains stars in the LMC (triangles) and the SMC (squares). TheSMCand LMC follow the same sequences, indicating that the differenceof location of C-rich and O-rich stars in the colour–colour diagramis independent of metallicity.
Figure 10. Spectra of two stars with the same [8]−[24] colours. No fluxscaling has been applied. ISO 00549 (top) is a C-rich star. PMMR 52 (bot-tom) is an O-rich star. The transmission of the IRAC 5.8µm (dashed line),8µm (dotted line) and MIPS 24µm (dot-dashed line) filters are overlayed.
8 AVERAGE SPECTRA FOR SMC AND LMC STARS
Fig. 11 shows the averaged spectra of the red SMC sources (top,solid line) and blue SMC sources (bottom, solid line), where’red’and ’blue’ are defined as in Zijlstra et al. (2006). To comparethesespectra with LMC spectra, we overplot the LMC spectra on thisfigure (dotted lines). Those LMC spectra are taken from Zijlstra etal., and are respectively the spectra with weak SiC and no MgSinFig.19 in that paper. The right panel shows the ratio of the SMCaveraged spectra and the LMC averaged spectra.
The LMC and the SMC spectra show the same features, butthe differences are significant especially for the ’red’ sources. Thedifferences are associated with the C2H2 and the SiC bands. Thefact that the acetylene features show as absorption in the ratio spec-tra indicates that these bands are relativelystronger in the SMC.The 13.7µm is clearest seen, indicative of the colder circumstellarmolecules. The 11.3µm band also shows in absorption, but as thisis an emission feature, the negative footprint here shows itto beweaker in the SMC.
The ’blue’ sources do not show easily interpretable differ-

Carbon stars in the Small Magellanic Cloud 11
Figure 11. On the left, averaged spectra from our SMC sample (solid lines). The upper solid line shows the averaged spectrum of the red sources. The lowersolid line shows the averaged spectrum of the blue sources. The dotted lines show the equivalent averaged spectra from the Zijlstra et al. LMC sample. Theright panel shows the SMC averaged spectrum divided by the LMC averaged spectrum for the red sources (top) and the blue sources (bottom).
ences. The broad 10µm absorption may contain a blue contributionfrom a molecular band (e.g. Zijlstra et al. 2006), in addition to SiC.The redward continuum may be affected by the photospheric broad14µm C2H2 band.
9 SILICON-CARBIDE DUST
9.1 Strength
Fig.11 clearly indicates that the 11.3µm SiC feature is strongerin the LMC than in the SMC, even if this feature is rather weakin blue sources. The divided spectra do not show any difference inthe shape of the SiC feature in the SMC and the LMC, but only inthe band strength. Thus, whereas the emission strength varies, theemission shape is constant. The composition of the SiC grains islikely the same for the two environments.
Fig.12 shows the strength of the SiC feature as a function ofthe [6.4]−[9.3] colour. To study the effect of metallicity on thestrength of the SiC features, we overlaid the measured strength ofthis feature on the Galactic and SMC sample of Sloan et al. (2006)as well as our LMC sample (Zijlstra et al. 2006). Sloan et al. (2006)find weaker SiC and MgS features in the SMC than in the Galaxy,related to the lower abundance of Si, S and Mg in the SMC.
Our SMC sample confirms that the strength of the SiC featureis lower in the SMC than in the LMC and the Galaxy. However,there are two noticeable exceptions from the Sloan et al. sample(filled triangles).
The distribution of strength with colour (optical depth) isfun-damentally different in the Galaxy compared to the SMC. In theSMC, there is a clear trend of increasing SiC strength with opticaldepth (left panel of Fig.12). In the Galaxy, SiC increases rapidlyup to [6.4]−[9.3]≈ 0.5, followed by a decline towards the SMCrelation. The difference in the Galactic and Magellanic Cloud dis-tributions is very clear in the right panel of Fig. 12. Note that oneSMC star follows the Galactic sample: GM 780, located outsideof the scale of the left panel (and therefore not shown). Thisobject(see Section 5.2) has a strong SiC feature but with an unusualshapeand rather weak dust continuum. We return to it below.
The rapid increase of SiC L/C for Galactic stars at very low[6.4]−[9.3] colour (Fig. 12) suggests that in the Galaxy, the SiCfeature is present while the dust excess is still low. The subsequentdecline in L/C ratio may include effects of optical depth withinthe feature (Speck et al. 2005), or it may be due to the increasingdust continuum. The LMC stars increase much more slowly withoptical depth, and reach the peak around [6.4]−[9.3]≈ 1.0; red-ward they are close to or a little below the Galactic stars. For the

12
Figure 12. The strength of the SiC feature as a function of the [6.4]−[9.3] colour in our SMC sample (left panel). The right panel combines this with starsfrom Sloan et al. SMC and Galactic samples: filled squares represent our SMC sample, triangles Sloan et al. (SMC), open circles Sloan et al. (Galactic) sampleand filled circles Zijlstra et al. (LMC).
SMC stars, there is no well-defined peak but most SMC stars with[6.4]−[9.3]< 1.0 have little or no SiC.
9.2 Condensation sequence
The difference between the SMC and the Galaxy can be understoodif for Galactic stars, SiC condenses first (i.e. at higher tempera-tures) and carbon dust later. For the LMC stars, the two form closetogether, while for the SMC stars, SiC forms last. Thus, there is areversal in condensation sequence over this range in metallicity.
The condensation temperature of graphite is around 1600 Kwhilst for SiCTc ≈ 1400 K. However, these are composition anddensity dependent. For high partial pressure, condensation occursat higher temperatures. The effect is shown by Bernatowicz et al.(2005). For increasing C/O ratio, graphite condenses at higher T .With decreasing Si abundance,Tc(SiC) will decrease. The effectis that SiC condenses first at high density, low C/O ratio (< 1.1)and high Si abundance. Fig. 12 suggests these conditions aremetfor Galactic stars. For LMC stars, SiC condensation is delayed,while for SMC stars in many cases SiC does not condense at all.The increasing C/O ratio also aids this process. Chigai & Ya-mamoto (1993) also suggest that under different conditions, SiCand graphite may form together, only SiC grains may form or onlygraphite forms.
Following this, we interpret GM 780 as a case where the den-sity in the dust-formation region is high and the C/O ratio low, lead-ing to SiC only. The relatively blue Manchester colour of this objectis due to the resulting lack of dust. The lack of clear C2H2 featuresis consistent with this interpretation.
If the condensation sequences discussed above are correct,theSiC abundance may be limited by Si in the Galaxy (where SiC con-denses first) but by the C/O ratio in the Magellanic Clouds (wheremuch of the carbon goes into the dust before SiC can form).
9.3 Central wavelength
Fig. 13 shows the apparent central wavelength of the SiC feature asa function of the [6.4]−[9.3] colour. The right panel displays ourmeasurements together with the other samples mentioned above.Our sample shows that for the stars with [6.4]−[9.3]<0.5, thereis a clear trend of decreasing central wavelength with increasingcolour, while the opposite is observed for redder stars. Thedashedline shows the fit proposed for Galactic stars (Sloan et al. 2006).
This shift could be due to two factors (Zijlstra et al. 2006).Thebroad C2H2 absorption band centred at 13.7µm is close to the SiCfeature and the red continuum wavelengths we use for SiC neces-sarily fall within this band. Thus stronger C2H2 absorption shiftsthe SiC central wavelength to the red. Speck et al. (2005) also sug-gested that self-absorption of SiC can also induce a shift toward thered of the SiC feature.
The shape of the SiC feature appears to be the same for allstars (e.g. Zijlstra et al. 2006). This argues against wavelength-dependent optical depth effects (Speck et al. 2005) for our samples.We note that the stars studied here have relatively low optical depthcompared to stars with known SiC absorption.
10 MAGNESIUM SULFIDE
Longward of 15µm, only the MgS feature is seen. The shape of thisfeature is similar in the SMC and the LMC. Furthermore, we haveshown (Sect.4.1) that this feature is present in the envelopes of thereddest stars, i.e. the stars with the lowest dust temperature. Thisis explained by the formation process of MgS which starts around600K and is complete around 300K.
The feature is only seen for two stars in the SMC sample, butthis appears to be due to the dust temperatures. Fig. 14 showsthecomparison between the SMC and the LMC. There is little dif-ference between them, and it appears the ratio between MgS andcarbon dust is less sensitive to the metallicity than is the SiC versus

Carbon stars in the Small Magellanic Cloud 13
Figure 13. Apparent central wavelength of the SiC feature as a functionof the [6.4]−[9.3] colour. Left panel: our SMC sample. Right panel: filledsquaresrepresent our SMC sample, triangles Sloan et al. (SMC), opencircles Sloan et al. (Galactic) sample and filled circles Zijlstra et al. (LMC). The dashed line isthe fit for Galactic stars (Sloan et al. 2006).
0 0.2 0.4
0
0.2
0.4
0.6
0.8
[16.5] - [21.5]
Figure 14. Strength of the MgS feature, versus [16.5]−[21.5] colour. Filledtriangles: SMC stars (present sample and Sloan et al. 2006);open trian-gles: LMC stars (Zijlstra et al. 2006). The band strength is defined as theintegrated line-to-continuum ratio (Sect. 6.
carbon dust. This may indicate that the MgS condensation is limitedby the available dust surface rather than the element abundances.
The shape of the continuum subtracted MgS feature is shownin Fig.15. The MgS band of NGC 419 MIR1 has a relatively flatshape, while the band observed in IRAS 00554−7351 diminishestoward the red. These shapes are similar to the shapes of the MgSfeatures observed in the LMC (Zijlstra et al. 2006). The study ofthis feature in Galactic sources has shown that it could be resolved
Figure 15. Shape of the MgS feature, continuum subtracted, for SMCcarbon-rich AGB stars.
in two subpeaks centred at 26 and 33µm (Volk 2002). Those sub-peaks are not observed in our sample, but this is not conclusive dueto the low signal.
11 GAS PROPERTIES
11.1 C2H2
Fig. 16 shows the equivalent width of the C2H2 band at 7.5µm,for SMC, LMC and Galactic stars. Due to a lower dust-to-gas ra-tio at lower metallicity, stars with the same gas mass-loss rate willhave a lower optical depth in the SMC than in the LMC and theGalaxy. If we use the [6.4]−[9.3] colour as a tracer of thedustmass-loss rate, the strength of the 7.5µm band is comparable in theGalactic sample and our SMC sample. However, the [6.4]−[9.3]colour will be different for a givengas mass-loss rate. Zijlstra etal. (2006) show that the effect of metallicity on the opticaldepth(lower metallicity stars have lower optical depth) is stronger forredder stars (see Fig. 10 in their paper). Most of the SMC stars inour sample have [6.4]−[9.3]<0.4. To be compared with stars withsimilar gas mass-loss rates, we should, according to the previous

14
Figure 17. The strength of the C2H2 7.5µm feature as a function of theSiC feature. Squares represent SMC stars from our sample andSloan et al.sample, black circles Zijlstra et al. LMC sample and open circles Sloan etal. Galactic sample.
work, compare those stars with stars with [6.4]−[9.3]≈ 0.5 and0.6 in the LMC and the Galaxy, respectively.
By applying this shift, we observe that the 7.5µm feature isstronger in the SMC than in the LMC and the Galaxy. This featureappears to be stronger in lower metallicity environments. This haspreviously been found for the LMC (Zijlstra et al. 2006, Matsuuraet al. 2006) and the SMC (Sloan et al. 2006). The stars in our sam-ple are bluer than the previous observed stars, and we confirmthatthe C2H2 feature is stronger in low metallicity environments evenwhen the stars are almost naked stars.
As noticed before in the LMC and SMC, this effect is moreclearly seen for the 7.5µm feature than for the 13.7µm one.
The divided spectra in Fig. 11 present absorption bands at 7.4and 13.7µm. This confirms that the C2H2 features are stronger inthe SMC than in the LMC.
Fig.17 shows a trend of increasing C2H2 strength with in-creasing SiC strength in the SMC. Such a trend is also observedin the LMC but the slope is different. Whether this trend is presentfor the Galaxy is less obvious. The SiC condensation sequence dis-cussed above is consistent with this: in the Galaxy, SiC is limitedby Si, and in the Magellanic Clouds by the C/O ratio. This predictsa correlation with C2H2 only for the Magellanic Clouds.
The distribution in Fig.17 clearly shows a separation intoSMC–LMC–Galaxy, from left to right. The ratio of C2H2 (gas)over SiC (dust) is higher in the SMC, then in the LMC and theGalaxy. This shows an increasing gas-to-SiC dust mass ratiowithdecreasing metallicity.
11.2 CO
In all the spectra, the flux drops sharply shortward of 6µm. This isdue to absorption by the CO molecule (Jørgensen 2000), C2 and/orC3 (Zijlstra et al. 2006), as shown by the spectra at the top of Fig.3. The slope of this feature is steeper in the LMC than in the SMC.We attribute this to an underabundance of CO in the SMC with
respect to the LMC. For carbon stars, the CO abundance is limitedby oxygen. Oxygen is a measure for the original metallicity:theCO band is therefore expected to vary with metallicity. Notethatthe responsivity at the blue edge of the spectra is low.
12 CARBON VERSUS OXYGEN-RICH STARS
A noticeable finding for both the LMC and the SMC is that theSpitzer targets are found to be strongly biassed towards carbonstars. The selection criteria were relatively insensitiveto the chem-ical type, and the bias is therefore intrinsic rather than a selectioneffect. Apart from stars observed as a result of acquisitionerrors,we found 14 carbon stars and no oxygen-rich stars.
Sloan et al. (2006) use 2MASS colours as part of their se-lection criteria. This gave a sample of 22 carbon stars versus10 oxygen-rich stars (excluding some other sources). The use of2MASS requires low circumstellar reddening and favours stars withsilicate dust where the reddening per unit dust mass is lower.
The LMC sample of Zijlstra et al. (2006) shows 28 carbonstars versus one oxygen-rich star (excluding one high-massproto-star). Buchanan et al. (2006) observed high-luminosity stars andfound 16 C-rich versus 4 O-rich AGB stars. Thus, the dominance ofcarbon stars is confirmed in all surveys of mass-losing stars, but theratio depends on the characteristics of the survey. The proportion ofC stars is lower in high luminosity, lower-optical depth surveys.
Cioni & Habing (2003) show that for optically visible evolvedstars in the Magellanic Clouds, the ratio of C over M stars is ap-proximately 3 for both clouds. Blum et al. (2006) surveying thefull population of AGB stars in the LMC, identify 17500 O-richand 7000 C-rich stars. The higher ratio of O to C stars found byBlum et al. may suggest that they include K-type stars, earlier onthe AGB. Cioni & Habing (2003) estimate that there are about 2250C stars in the SMC and 10000 in the LMC, the latter being roughlyconsistent with the Blum et al. numbers.
The high ratio (∼3) of C to O-rich stars is consistent withthe expectation that in the Magellanic Clouds, most stars becomecarbon stars early on the AGB, before the onset of the high mass-loss rate phase. There are almost no O-rich stars in the present andthe Zijlstra et al. (2006) samples of lower luminosity, highmassloss rate, AGB stars in the Magellanic Clouds. Only among thehighest mass, higher luminosity stars on the AGB do O-rich starscontribute significantly to the population of mass-losing stars.”
12.1 Carbon star evolution
Fig. 6 shows that in the LMC, the carbon star luminosity functionexhibits a flat peak with a width of 0.3 mag. This traces the part ofthe AGB evolution where essentially all stars have become carbonstars: the flat distribution results from the linear change of mag-nitude with time. (Stars more massive than∼ 4 M⊙ may avoid acarbon star phase due to hot bottom burning, but there are fewsuchstars.) At the high-luminosity end, the number of known stars dropsbecause of increasing obscuration and stars leaving the AGB.
In the SMC, the width of the flat peak is about 0.6 mag. Over106 yr, a star brightens by approximately 1 mag on the AGB. Thesenumbers therefore predict that the optical carbon star phase lasts3 × 105 to 6 × 10⁵ yr, for the LMC and the SMC respectively.These are lower limits to the total life time of the carbon star phaseon the AGB.
The SMC carbon star distribution peaks at lower luminosity

Carbon stars in the Small Magellanic Cloud 15
Figure 16. The equivalent width of the C2H2 band at 7.5µm (left) and 13.7µm (right) as a function of the [6.4]−[9.3] colour. Filled squares represents ourSMC sample, triangles the Sloan et al. SMC sample, open circles the Sloan et al. Galactic sample and filled circles the Zijlstra et al. LMC sample.
than in the LMC. The longer life time in the SMC is therefore due tothe stars becoming carbon-rich earlier, after fewer thermal pulses.
TheSpitzer targets all are at the high-luminosity end, and tracethe final stage of their evolution. The Manchester colours oftheSMC stars indicates mass-loss rates of10−5 M⊙ yr−1 or higher(Zijlstra et al. 2006, their Fig. 10). Assuming that a typical carbonstar expels0.2 M⊙ during the superwind, indicates a duration ofthis phase of order∼ 104 yr. The combined SMC samples haveapproximately 30 superwind stars, or roughly 1 per cent of the to-tal number of carbon stars predicted by Cioni & Habing (2003).This suggests a life time of the carbon star phase of∼ 106 yr.For comparison, the thermal-pulsing AGB lasts 1–2×10⁶ yr for 1–3 M⊙ stars. Thus, SMC stars become carbon stars during the firsthalf of the thermal-pulsing phase.
12.2 Mass loss and metallicity
A clear result from theSpitzer surveys is the enhancement of C2H2
in low metallicity environments. This has previously been foundfrom ground-based spectra. Van Loon et al. (1999b) and Matsuuraet al. (2002, 2005) argue that this is related to a higher C/O ra-tio in these stars. The C/O ratio is enhanced by two effects: (i) alower oxygen abundance means that less carbon is locked up inCO(e.g. Lattanzio & Wood 2004), and (ii) lower metallicity promotesmore efficient third dredge-up of carbon (Wood 1981, Vassiliadis &Wood 1993) with stars experiencing more thermal pulses (Lawlor& MacDonald 2006).
This seems to be confirmed by the finding that LMC car-bon stars have higher abundances of C2H2 than Galactic stars. Incontrast, oxygen-rich stars show low molecular abundancesat lowmetallicity (Zijlstra 2006).
Spitzer shows that in the LMC and SMC, high mass-loss starsare heavily dominated by carbon stars, unlike in the Galaxy (thispaper, Zijlstra et al. 2006, Sloan et al. 2006, van Loon et al.2006,Buchanan et al. 2006, Blum et al. 2006). In contrast, the soleoxygen-rich AGB star in the sample of Zijlstra et al. has a rathermoderate mass loss. Only the most luminous LMC stars show anO-rich population with thick dust shells.
This leads to the suggestion that at low metallicity, stellar massloss is mostly carbon-rich, as at the luminosity where stellar pulsa-tions develop an extended atmosphere leading to molecule and dustformation, the stars have already become carbon rich. Only in oldstellar systems (globular clusters, Galactic halo), wherethe stellarmasses are insufficient for third dredge-up, is an oxygen-rich windexpected.
The lack of silicon implies that the dust input into the ISMfrom LIMS in low metallicity systems would be lacking in sili-cates and silicate-carbides, but be dominated by carbonaceous dust,a ’soft’ (mineral-poor) type of dust (Zijlstra 2006, Matsuura et al.2006, Groenewegen et al. 2007).
13 CONCLUSION
We have presented aSpitzer spectroscopic survey of 14 carbon-richAGB stars in the SMC. The bolometric magnitudes of the observedstars indicates that their initial masses are in the range 1–4 M⊙. Wealso presented spectra of an accidentally-observed K supergiant andan HII region.
Our spectra covers the range 5-38µm. Molecular bands due toC2H2 at 7.5 and 13.7um are observed in most of the C-rich stars. Aweak absorption band at 14.3µm, attributed to HCN, is observedin the two reddest stars of our sample. The 5.8-micron band ofcar-bonyl observed in the LMC is not observed in our SMC sample.This could be due to an underabundance of CO in the SMC withrespect to the LMC. The acetylene bands provide clear evidencefor a higher C/O ratio in low metallicity carbon stars.
Using the “Manchester System”, we determined the contin-uum flux for the observed stars using four narrowbands centred at6.4, 9.3, 16.5 and 21.5µm. This enables us to determine two colourtemperatures, [6.4]−[9.3] and [16.5]−[21.5]. These colours are in-dicators of the optical depth and dust temperatures respectively.
We find evidence for a different behaviour of the SiC featurewith metallicity: in the Galaxy, it appears for stars with little dustexcess, while for the SMC it only appears for stars with cool dust.The LMC is intermediate. We suggest that this is due to a differ-

16
ent formation sequence, where at solar metallicity SiC precedesgraphite, while at SMC metallicity and its corresponding higherC/O ratio, graphite forms first.
The MgS feature at∼30µm has strength comparable to LMCstars, suggesting its abundance relative to that of amorphous carbonis less metallicity dependent. We suggest its formation is limitedby the available surface area of pre-existing dust grains, rather thanelemental abundances. The shape of the MgS and SiC features aresimilar in both galaxies, but the SiC feature is much stronger in theLMC than in the SMC.
We show that a colour-colour diagram using Spitzer IRACand MIPS filters ([5.8]−[8.0] vs [8.0]−[24]) is able to separateO-rich and carbon stars. This had been shown by Buchanan et al.2006 for redder stars; we confirm that it is also valid for bluestars([8]−[24])<3). Furthermore, we show that this separation is inde-pendant of metallicity. This suggests that it is possible todiscrim-inate C and O-rich AGB stars in other galaxies using onlySpitzerphotometry.
Carbon stars dominate the population of high mass loss rateAGB stars in the SMC. We derive a life time of the carbon starphase of>∼ 6 × 10⁵ yr, with the superwind phase lasting∼ 104 yr.Thus, stars become carbon-rich early on the thermal-pulsing AGB,long before the onset of the superwind. The LMC stars becomecarbon-rich later in their evolution, and last as carbon stars for >
∼
3 × 10⁵ yr.
ACKNOWLEDGMENTS
EL acknowledge support from a PPARC rolling grant. AAZ ac-knowledges a Royal Society grant to allow a visit to the SAAO,andis grateful for the hospitality of the SAAO. PRW has been partiallysupported in this research by a Discovery Grant from the AustralianResearch Council.
REFERENCES
Aoki, W., Tsuji, T., Ohnaka, K., 1999, A&A, 350, 945Bellazzini, M., Ferraro, F. R., Pancino, E., 2001, ApJ, 556,635Banwell, C. M., McCash, E. M., 1994, Fundamentals of molecularspectroscopy, 4th ed. (McGraw-Hill, London), p. 19.
Bernatowicz, T. J., Akande, O. W., Croat, T. K., Cowsik, R., 2005,ApJ, 631, 988
Bessell, M. S., Wood, P. R., & Evans, T. L., 1983, MNRAS, 202,59
Bowen, G. H., Willson, L. A., 1991, ApJL, 375, L53Blum, R. D., Mould, J. R.,Olsen, K. A., Frogel, J. A., Werner,M., Meixner, M., Markwick-Kemper, F., 2007, AJ, in press(astro-ph/0608189)
Buchanan, C. L., Kastner, J. H., Forrest, W. J., Hrivnak, B. J.,Sahai, R., Egan, M. P., Frank, A., & Barnbaum, C., 2006, AJ,132, 1890
Cernicharo, J., Yamamura, I., Gonzalez-Alfonso, E., de Jong, T.,Heras, A., Escribano, R., Ortigoso, J., 1999, ApJ, 526, L41
Chandra, S., Kegel, W. H., Le Roy, R. J., Hertenstein, T., 1995,A&AS, 114, 175
Cherchneff, I., 2006, A&A, 456, 1001Cioni, M.-R. L., Blommaert, J. A. D. L., Groenewegen, M. A. T.,Habing, H. J., Hron, J., Kerschbaum, F., Loup, C., Omont, A.,van Loon, J. Th., Whitelock, P. A., Zijlstra, A. A., 2003, A&A,406, 51
Cioni, M.-R., Habing, H. J., 2003, A&A, 402, 133Chigai, T., Yamamoto, T., 2003, Geochimica et CosmochimicaActa, 67, Issue 18, Supplement 1, p.A64
Costa, E., Frogel, J. A., 1996, AJ, 112, 2607Cutri, R. M., et al., 2003, The IRSA 2MASS All-Sky Point SourceCatalog, NASA/IPAC Infrared Science Archive, 2003, A&A,406, 51
de Freitas Pacheco, J. A., Barbuy, B., Idiart, T., 1998, A&A,332,19
Dray, L. M., Tout, C. A., Karakas, A. I., Lattanzio, J. C., 2003,MNRAS, 338, 973
Egan, M. P., Van Dyk, S. D., Price, S.D., 2001, AJ, 122, 1844Goorvitch, D., 1994, ApJS, 95, 535Groenewegen, M. A. T., et al., 2007, in preparationHarris, G. J., Polyansky, O. L., Tennyson, J. 2002, ApJ, 578,657Harris, G. J., Tennyson, J., Kaminsky, B. M., Pavlenko, Y. V.,Jones, H. R. A., 2006, MNRAS, 367, 400
Houck, J. R., et al., 2004, ApJS, 154, 18Hony, S., Waters, L. B. F. M., Tielens, A. G. G. M., 2002, A&A,390, 533
Jørgensen, U. G., Hron, J., Loidl, R., 2000, A&A, 356, 253Keller, S.C., Wood, P. R., 2006, ApJ, 642, 834Kontizas, E., Dapergolas, A., Morgan, D. H., Kontizas, M., 2001,A&A, 369, 932
Lawlor, T. M., MacDonald, J., 2006, MNRAS, 371, 263Lloyd Evans, T., 1980, MNRAS, 193, 87Lloyd Evans, T., Glass, I. S., Catchpole, R. M., 1988, MNRAS,231, 773
Matsuura, M., et al., 2005, A&A, 434, 691Matsuura, M., Zijlstra, A. A., van Loon, J. Th., Yamamura, I.,Markwick, A. J., Woods, P. M., Waters, L. B. F. M., 2002, ApJ,580, L133
Matsuura, M., Wood, P. R., Sloan, G. C.. Zijlstra, A. A., van Loon,J. Th., Groenewegen, M. A. T., et al., 2006, MNRAS, 371, 415
Maeder, A., 1992, A&A, 264, 105Murphy, M. T., Bessell, M. S., 2000, MNRAS, 311, 741Pietrinferni, A., Cassisi, S., Salaris M., Castelli, F., 2006, ApJ,642, 797
Pitman, K. M., Speck, A. K., Hofmeister, A. M., 2006, MNRAS,371, 1744
Prevot, L., Martin, N., Rebeirot, E., Maurice, E., Rousseau, J.1983, A&AS, 53, 255
Querci, F., Querci, M., Kunde, V. G., 1971, A&A, 15, 256Rebeirot, E., Azzopardi, M., Westerlund, B. E., 1993, A&AS,97,603
Sloan, G. C., Neremberg, P. S., Russel, M. R. 2003, IRS TechnicalReport 03001
Sloan, G. C., Kraemer, K. E., Matsuura, M., Wood, P. R., Price,S. D., Egan, M. P., 2006, ApJ, 645, 1118
Speck, A., Thompson, G. D., Hofmeister, A., 2005, ApJ, 634, 426Tanabe, T., Nishida, S., Matsumoto, S., Onaka, T., Nakada, Y.,Soyano, T., Ono, T., Sekiguchi, K., Glass, I. S., 1997, Nature,385, 509
van Loon, J. Th., Marshall, J. R., Cohen, M., Matsuura, M., Wood,P. R., Yamamura, I., Zijlstra, A. A., 2006, A&A, 447, 971
van Loon, J. Th., Marshall, J. R., Zijlstra, A. A., 2005, A&A,442,597
van Loon, J.Th., 2006, in: Stellar Evolution at Low Metallicity:Mass Loss, Explosions, Cosmology, ASP Conf. Ser. Vol. 353, inpress (astro-ph/0512326)
van Loon, J. Th., Groenewegen, M. A. T., de Koter, A., Trams,N. R., Waters, L. B. F. M., Zijlstra, A. A., Whitelock, P. A., Loup,

Carbon stars in the Small Magellanic Cloud 17
C., 1999a, A&A, 351, 559van Loon, J. Th., Zijlstra A. A., Groenewegen, M. A. T., 1999b,A&A, 346, 805
Vassiliadis, E., Wood, P. R., 1993, ApJ, 413, 641Volk, K., Kwok, S., Hrivnak, B. J., Szczerba, R., 2002, ApJ, 567,412
Wachter, A., Schroder, K.-P., Winters, J. M., Arndt, T. U.,Sedl-mayr, E., 2002, A&A, 384, 452
Whitelock, P. A., Feast, M. W., Marang, F., Groenewegen,M. A. T., 2006, MNRAS, 369, 751
Whitelock, P. A., Feast, M. W., Menzies, J. W., Catchpole, R.M.,1989, MNRAS, 238, 769
Werner, M. W., et al. 2004, ApJS, 154, 1Westerlund, B. E., Azzopardi, M., Rebeirot, E., Breysacher, J.,1991, A&AS, 91, 425
Woitke, P., 2006, A&A, in pressZijlstra, A. A., Matsuura, M., Wood, P. R., Sloan, G. C., Lagadec,E., van Loon, J. Th., Groenewegen, M. A. T., Feast, M. W.,Whitelock, P. A., et al., 2006, MNRAS, 370, 1961
Zijlstra, A. A. 2006, in IAU Symp 231, Planetary Nebulae.astro-ph/0605097
Zijlstra, A. A., 2004, MNRAS, 348, L23