arXiv:astro-ph/0409114v1 6 Sep 2004 analyze longslit spectral observations of fourteen Wolf-Rayet...
40
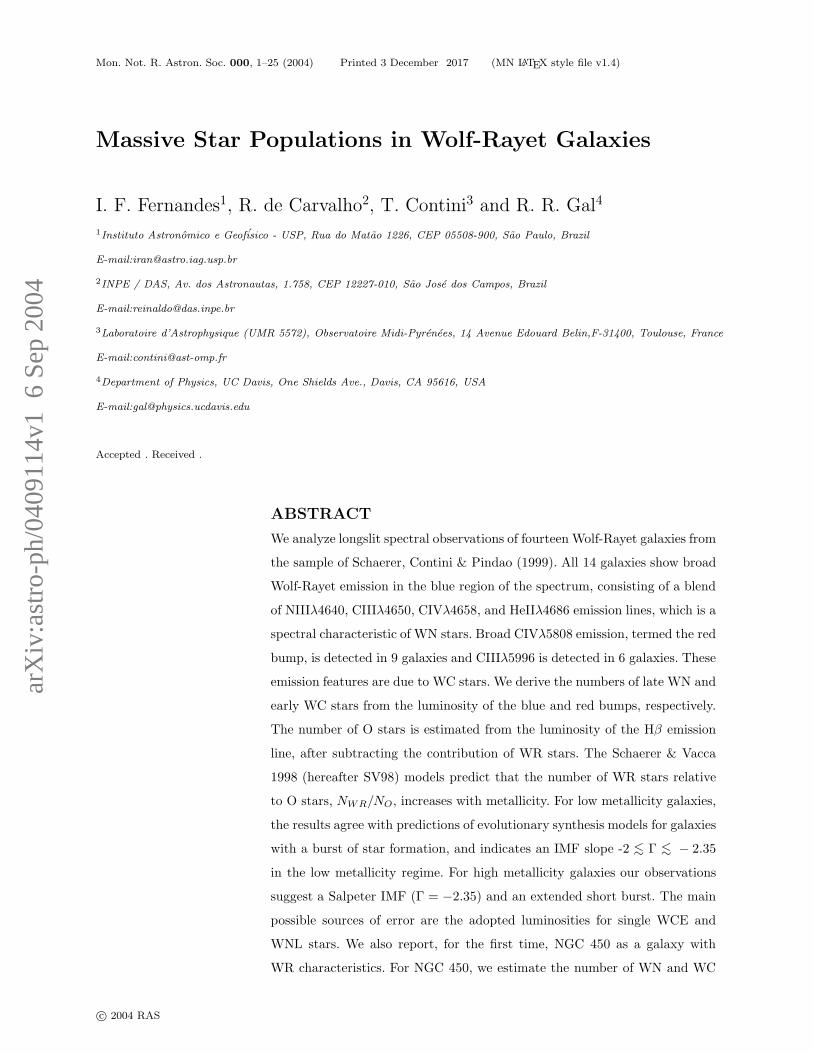
arXiv:astro-ph/0409114v1 6 Sep 2004 Mon. Not. R. Astron. Soc. 000, 1–25 (2004) Printed 3 December 2017 (MN L A T E X style file v1.4) Massive Star Populations in Wolf-Rayet Galaxies I. F. Fernandes 1 , R. de Carvalho 2 , T. Contini 3 and R. R. Gal 4 1 Instituto Astronˆ omico e Geof ´ isico - USP, Rua do Mat˜ao 1226, CEP 05508-900, S˜ ao Paulo, Brazil E-mail:[email protected] 2 INPE / DAS, Av. dos Astronautas, 1.758, CEP 12227-010, S˜ ao Jos´ e dos Campos, Brazil E-mail:[email protected] 3 Laboratoire d’Astrophysique (UMR 5572), Observatoire Midi-Pyr´ en´ ees, 14 Avenue Edouard Belin,F-31400, Toulouse, France E-mail:[email protected] 4 Department of Physics, UC Davis, One Shields Ave., Davis, CA 95616, USA E-mail:[email protected] Accepted . Received . ABSTRACT We analyze longslit spectral observations of fourteen Wolf-Rayet galaxies from the sample of Schaerer, Contini & Pindao (1999). All 14 galaxies show broad Wolf-Rayet emission in the blue region of the spectrum, consisting of a blend of NIIIλ4640, CIIIλ4650, CIVλ4658, and HeIIλ4686 emission lines, which is a spectral characteristic of WN stars. Broad CIVλ5808 emission, termed the red bump, is detected in 9 galaxies and CIIIλ5996 is detected in 6 galaxies. These emission features are due to WC stars. We derive the numbers of late WN and early WC stars from the luminosity of the blue and red bumps, respectively. The number of O stars is estimated from the luminosity of the Hβ emission line, after subtracting the contribution of WR stars. The Schaerer & Vacca 1998 (hereafter SV98) models predict that the number of WR stars relative to O stars, N WR /N O , increases with metallicity. For low metallicity galaxies, the results agree with predictions of evolutionary synthesis models for galaxies with a burst of star formation, and indicates an IMF slope -2 < ∼ Γ < ∼ − 2.35 in the low metallicity regime. For high metallicity galaxies our observations suggest a Salpeter IMF (Γ = −2.35) and an extended short burst. The main possible sources of error are the adopted luminosities for single WCE and WNL stars. We also report, for the first time, NGC 450 as a galaxy with WR characteristics. For NGC 450, we estimate the number of WN and WC c 2004 RAS
Transcript of arXiv:astro-ph/0409114v1 6 Sep 2004 analyze longslit spectral observations of fourteen Wolf-Rayet...
arX
iv:a
stro
-ph/
0409
114v
1 6
Sep
200
4Mon. Not. R. Astron. Soc. 000, 1–25 (2004) Printed 3 December 2017 (MN LATEX style file v1.4)
Massive Star Populations in Wolf-Rayet Galaxies
I. F. Fernandes1, R. de Carvalho2, T. Contini3 and R. R. Gal4
1Instituto Astronomico e Geofisico - USP, Rua do Matao 1226, CEP 05508-900, Sao Paulo, Brazil
E-mail:[email protected]
2INPE / DAS, Av. dos Astronautas, 1.758, CEP 12227-010, Sao Jose dos Campos, Brazil
E-mail:[email protected]
3Laboratoire d’Astrophysique (UMR 5572), Observatoire Midi-Pyrenees, 14 Avenue Edouard Belin,F-31400, Toulouse, France
E-mail:[email protected]
4Department of Physics, UC Davis, One Shields Ave., Davis, CA 95616, USA
E-mail:[email protected]
Accepted . Received .
ABSTRACT
We analyze longslit spectral observations of fourteen Wolf-Rayet galaxies from
the sample of Schaerer, Contini & Pindao (1999). All 14 galaxies show broad
Wolf-Rayet emission in the blue region of the spectrum, consisting of a blend
of NIIIλ4640, CIIIλ4650, CIVλ4658, and HeIIλ4686 emission lines, which is a
spectral characteristic of WN stars. Broad CIVλ5808 emission, termed the red
bump, is detected in 9 galaxies and CIIIλ5996 is detected in 6 galaxies. These
emission features are due to WC stars. We derive the numbers of late WN and
early WC stars from the luminosity of the blue and red bumps, respectively.
The number of O stars is estimated from the luminosity of the Hβ emission
line, after subtracting the contribution of WR stars. The Schaerer & Vacca
1998 (hereafter SV98) models predict that the number of WR stars relative
to O stars, NWR/NO, increases with metallicity. For low metallicity galaxies,
the results agree with predictions of evolutionary synthesis models for galaxies
with a burst of star formation, and indicates an IMF slope -2 <∼ Γ <
∼ − 2.35
in the low metallicity regime. For high metallicity galaxies our observations
suggest a Salpeter IMF (Γ = −2.35) and an extended short burst. The main
possible sources of error are the adopted luminosities for single WCE and
WNL stars. We also report, for the first time, NGC 450 as a galaxy with
WR characteristics. For NGC 450, we estimate the number of WN and WC
c© 2004 RAS
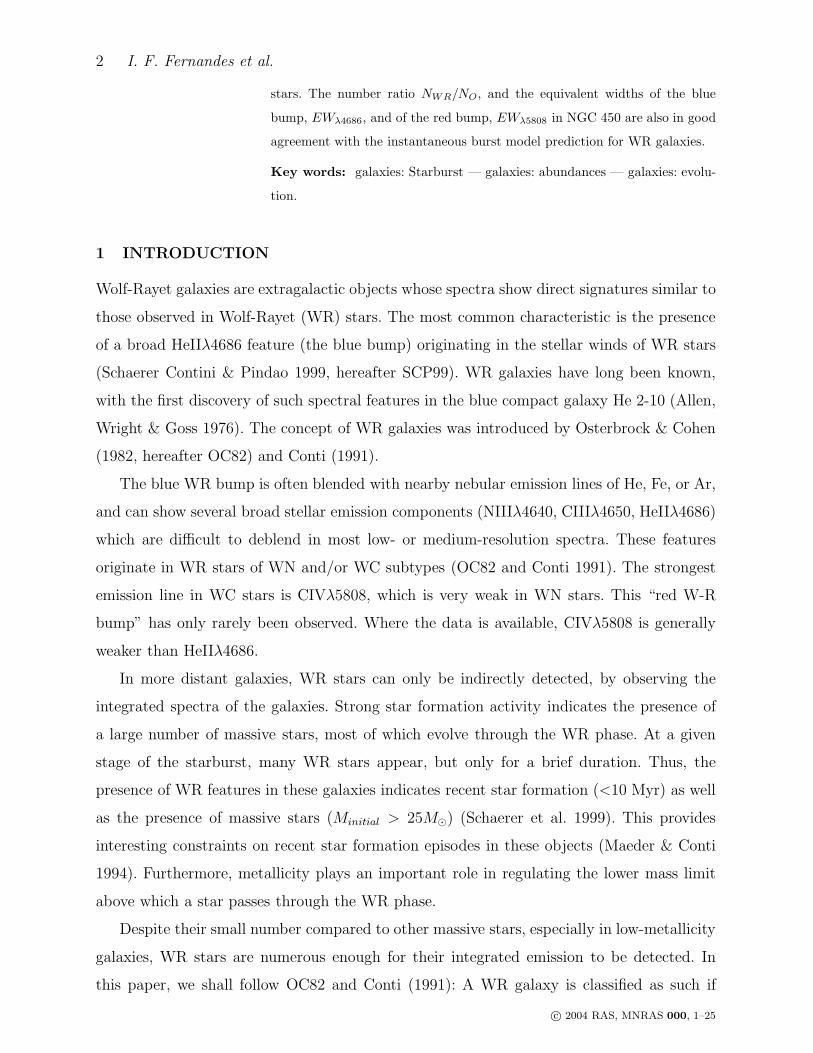
2 I. F. Fernandes et al.
stars. The number ratio NWR/NO, and the equivalent widths of the blue
bump, EWλ4686, and of the red bump, EWλ5808 in NGC 450 are also in good
agreement with the instantaneous burst model prediction for WR galaxies.
Key words: galaxies: Starburst — galaxies: abundances — galaxies: evolu-
tion.
1 INTRODUCTION
Wolf-Rayet galaxies are extragalactic objects whose spectra show direct signatures similar to
those observed in Wolf-Rayet (WR) stars. The most common characteristic is the presence
of a broad HeIIλ4686 feature (the blue bump) originating in the stellar winds of WR stars
(Schaerer Contini & Pindao 1999, hereafter SCP99). WR galaxies have long been known,
with the first discovery of such spectral features in the blue compact galaxy He 2-10 (Allen,
Wright & Goss 1976). The concept of WR galaxies was introduced by Osterbrock & Cohen
(1982, hereafter OC82) and Conti (1991).
The blue WR bump is often blended with nearby nebular emission lines of He, Fe, or Ar,
and can show several broad stellar emission components (NIIIλ4640, CIIIλ4650, HeIIλ4686)
which are difficult to deblend in most low- or medium-resolution spectra. These features
originate in WR stars of WN and/or WC subtypes (OC82 and Conti 1991). The strongest
emission line in WC stars is CIVλ5808, which is very weak in WN stars. This “red W-R
bump” has only rarely been observed. Where the data is available, CIVλ5808 is generally
weaker than HeIIλ4686.
In more distant galaxies, WR stars can only be indirectly detected, by observing the
integrated spectra of the galaxies. Strong star formation activity indicates the presence of
a large number of massive stars, most of which evolve through the WR phase. At a given
stage of the starburst, many WR stars appear, but only for a brief duration. Thus, the
presence of WR features in these galaxies indicates recent star formation (<10 Myr) as well
as the presence of massive stars (Minitial > 25M⊙) (Schaerer et al. 1999). This provides
interesting constraints on recent star formation episodes in these objects (Maeder & Conti
1994). Furthermore, metallicity plays an important role in regulating the lower mass limit
above which a star passes through the WR phase.
Despite their small number compared to other massive stars, especially in low-metallicity
galaxies, WR stars are numerous enough for their integrated emission to be detected. In
this paper, we shall follow OC82 and Conti (1991): A WR galaxy is classified as such if
c© 2004 RAS, MNRAS 000, 1–25
Massive Star Populations in Wolf-Rayet Galaxies 3
its integrated spectrum shows detectable WR broad features emitted by unresolved stellar
clusters.
The compilation of Conti (1991) included only 37 objects. Since then, the number of
cataloged WR galaxies has increased rapidly, with more than 130 known today (Guseva,
Izotov & Thuan 2000, hereafter GIT00; SCP99). WR galaxies do not form a homogeneous
class, exhibiting a variety of morphologies. Among the WR galaxies we find low-mass blue
compact dwarf (BCDs), irregular galaxies, massive spirals and ultra-luminous merging IRAS
galaxies. Recent studies show that WR features are also seen in LINERs and Seyfert 2
galaxies (OC82; Ho et al. 1995; Heckman et al. 1997; Schmitt et al. 1998 and Contini et al.
2001). The possibility of detecting WR stars in central cluster galaxies out to a redshift of
z ≥ 0.25 is discussed in Allen (1995).
The number of WR stars relative to massive stars is highly dependent on metallicity.
Theoretical evolutionary models predict that at fixed metallicity, the ratio between WR and
other massive stars varies strongly with the age of the starburst (Mass-Hesse & Kunth 1991;
Maeder 1991; Maeder & Meynet 1994; Meynet 1995; SV98). The maximum value of this
ratio decreases from 1 to 0.02 when the metallicity decreases from Z⊙ to Z⊙/50 (GIT00).
Similarly, the duration of the WR stage in the starburst also decreases with decreasing
metallicity. Hence, the number of galaxies with extremely low metallicity containing WR
stellar populations is expected to be small.
GIT00 derived the number of WCE and WNL stars from the luminosity of the red and
blue bumps, respectively, and the number of O stars from the Hβ luminosity, for 39 WR
galaxies with heavy element mass fractions between 1/50 and twice solar. In their sample,
the blue bump consists of an unresolved blend of WR and nebular lines. They proposed a new
technique to derive the number of WNL stars using NIIIλ4512 and SiIIIλ4565 emission lines.
They found that the relative number of Wolf-Rayet stars NWR/N(O+WR) and NWC/NWN
derived from observations are in satisfactory agreement with theoretical predictions (SV98).
The results obtained for the extremely metal-poor galaxies disagree with model predictions
likely due to the low emission line luminosity for WCE stars in metal-poor models.
Schaerer et al. (2000, hereafter SGIT00), using five metal rich objects from GIT00 and
new results on Mrk 309, attempted to constrain the properties of massive star populations
and star formation histories by comparing their observations with evolutionary synthesis
models. They found that extended burst durations of ∼ 4 − 10 Myr or a superposition of
several bursts were required to produce the observed WR population and red supergiant
c© 2004 RAS, MNRAS 000, 1–25
4 I. F. Fernandes et al.
features. The burst durations are longer than those obtained for other objects in Schaerer
et al. (1999) using the same models.
Pindao et al. (2002) analyzed the spectra of 85 high metallicity disk HII regions of nearby
spiral galaxies. In contrast with previous studies of low metallicity galaxies, they found
smaller values of I(WR)/I(Hβ) than predicted from evolutionary models at corresponding
metallicities. They suggested the use of two WR luminosity regimes to correct the model
predictions.
The goal of our study of these 14 galaxies is to search for and confirm the presence of WN
and WC stars in galaxies with different metallicities, and to compare the results obtained
for this sample with predictions from evolutionary synthesis models (SV98) and starbust99
(Leitherer et al. 1999). We also report NGC 450 as a newly classified WR galaxy.
The paper is structured as follows: the observations and procedures used to reduce the
data are described in §2. In this section we also discuss corrections for reddening and un-
derlying absorption affecting the emission lines. Section 3 describes how contamination of
a starburst spectrum by the presence of SN IIe and AGN is accounted for, while Section 4
explains how the physical parameters of the gas are calculated. The massive star population
and constraints on the evolutionary tracks of the starburst regions (age, burst duration, and
IMF) are derived in §5 from a comparison with evolutionary synthesis models. Finally, our
main results are summarized and discussed in §6.
2 SPECTROSCOPIC OBSERVATIONS AND DATA REDUCTION
2.1 Observations
We observed 14 galaxies from the sample of Wolf-Rayet galaxies and extragalactic HII regions
presented in SCP99. NGC 6764 was observed at two position angles, 67◦ and 90◦, with the
former along the major axis of the galaxy and the latter spanning a secondary emission
region near the central region. We suspected that WR stars may be present in this region,
but the spectra do not confirm this hypothesis.
Data were gathered at two different sites. We used the Palomar 200-inch telescope with
the longslit Double Spectrograph (Oke & Gunn 1982) on UT 1999 October 10-11, with the
1200 l/mm grating, blazed at 5000A, yielding a pixel size of 0.62′′ × 1.3A in the blue and
0.47′′ × 1.7A in the red, and a total wavelength coverage of 3600 − 6700A. The slit width
was set to 1′′, resulting in a spectral resolution of ∼ 5.6A in the blue and ∼ 5.7A in the red.
c© 2004 RAS, MNRAS 000, 1–25

Massive Star Populations in Wolf-Rayet Galaxies 5
The slit length was 180′′. Additional data were taken at the 3.6m ESO/NTT telescope using
the ESO Multi-Mode Instrument (EMMI) with CCD36 on UT 1999 April 17. The total
wavelength coverage was 4000-6600A. The slit width was set to 1′′, resulting in a spectral
resolution of ∼ 5.9A. The length of the slit was 120′′.
The slit was aligned along the major axis of the galaxy when possible, and centered on
the brightest region of the target. The journal of observations of all objects in the sample
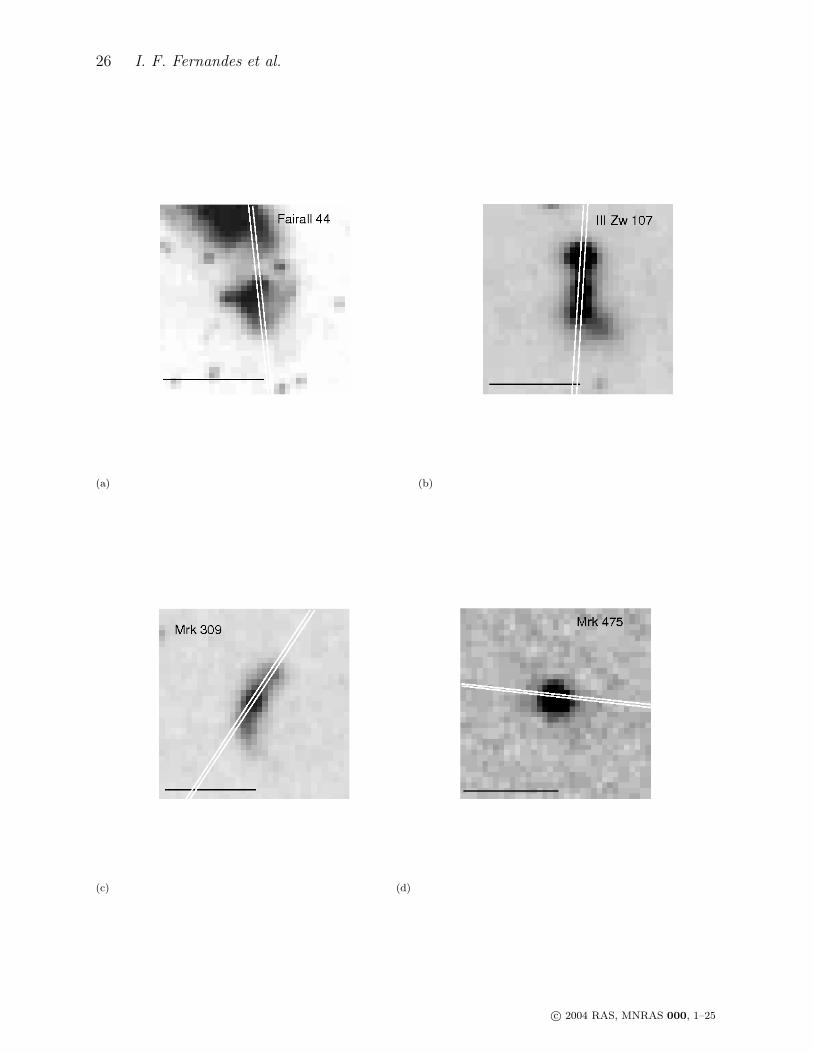
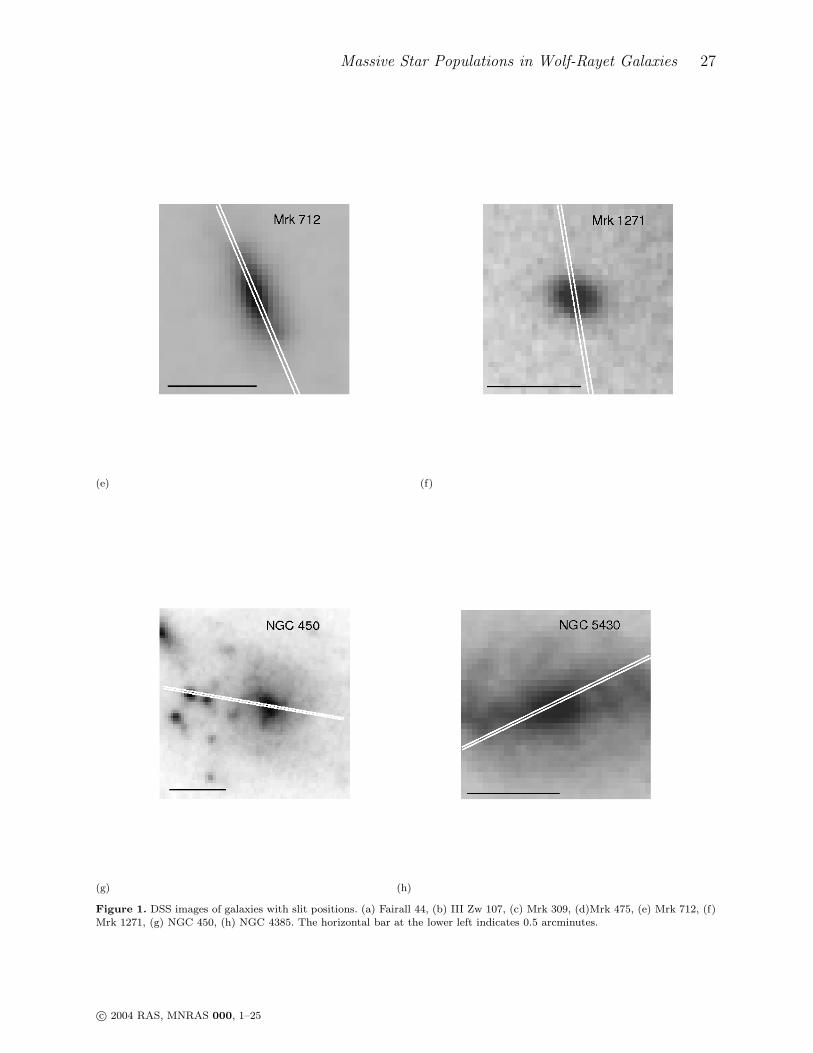
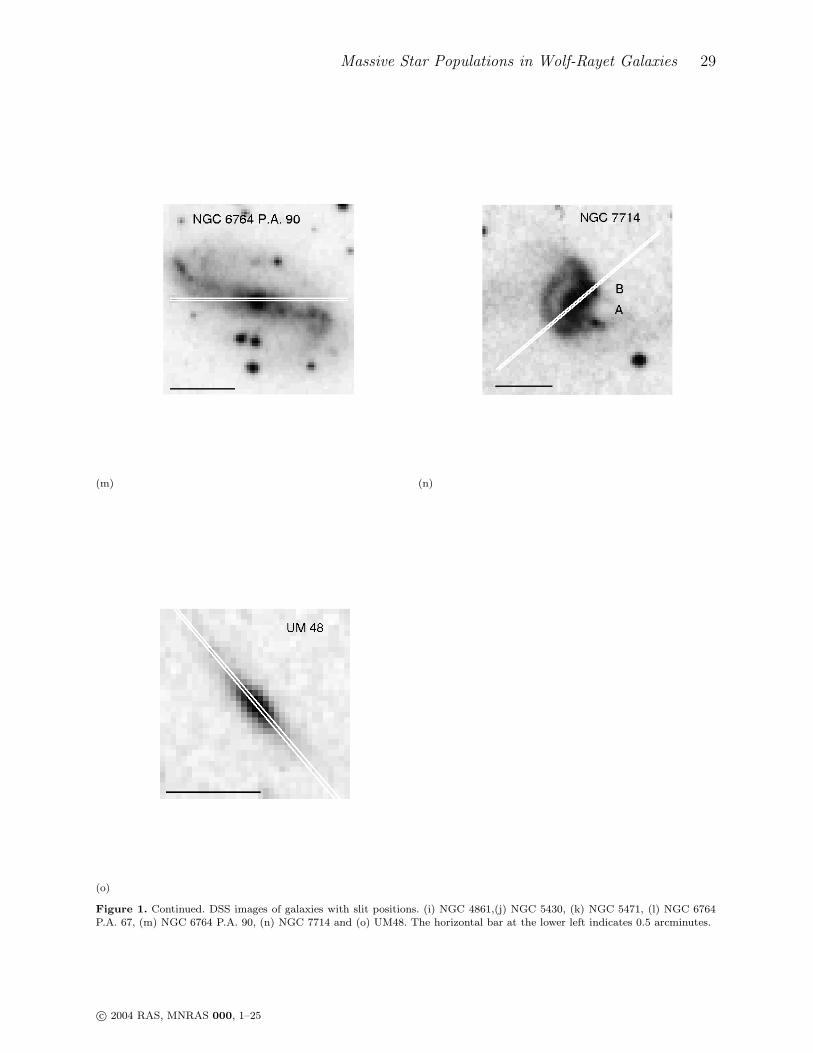
is provided in Table 1. Figures 1(a)-(o) show the images of each galaxy taken from the DSS
with the slit position overlaid.
2.2 Data Reduction
Initial data reduction was carried out following standard procedures with the IRAF task
ccdproc. The package includes bias subtraction, flat-field correction, subtraction of the night
sky background and bad column removal. The bias level was subtracted from each frame
using the overscan region of the CCD chip.
Spectrum extraction was performed using the IRAF task longslit. The task includes
correction for atmospheric extinction, wavelength calibration and flux calibration. Cosmic
rays were removed using the cosmicrays task with a threshold of 5%.
Spectrophotometric standard stars were observed each night to perform flux calibration.
Arc lamps were taken before and after each exposure in order to provide accurate wavelength
calibration. An average rms of 0.1A was obtained for the pixel to wavelength fit using a
third order spline.
We use a standard extraction aperture for each object whose width is such that the peak
intensity of the Hβ line decreases by 80% from the center, along the spatial direction. This
width is set independently for each side of the peak. For objects with more than one emission
region, different apertures were set for each knot. With this size we obtain the necessary
spectral properties for this study while minimizing possible contamination from the adjacent
stellar population.
The signal to noise ratio, S/N, was determined assuming Poisson statistics and using the
readout noise and gain of the CCD, the number of combined spectra, and the sky value. For
NTT data the readout noise is 5.43e−1 with a gain of 2.18 e−1 per ADU. For the Palomar
observations, the readout noise is 8.6 e−1 with a gain of 2.13 e−1 per ADU in the blue channel
and 7.5 e−1 and 2.00 e−1 per ADU in the red channel. The values of S/N are given in Table
c© 2004 RAS, MNRAS 000, 1–25
6 I. F. Fernandes et al.
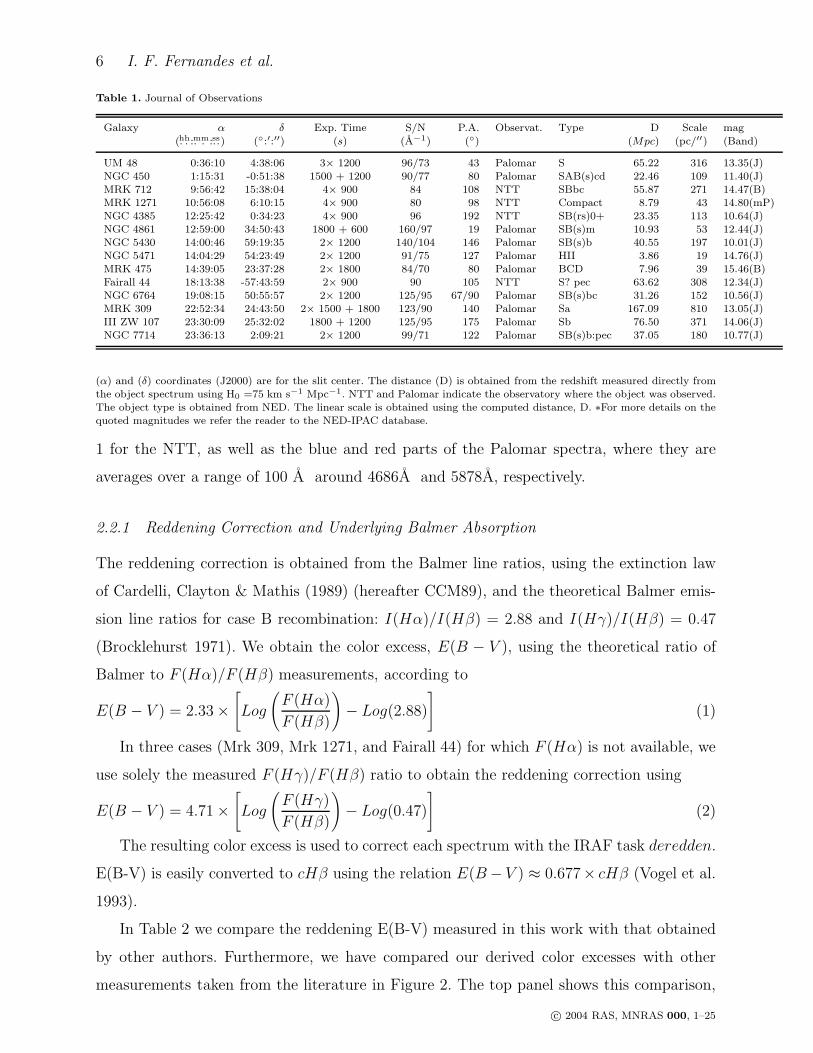
Table 1. Journal of Observations
Galaxy α δ Exp. Time S/N P.A. Observat. Type D Scale mag
(.h.h:.m.m:.s.s) (◦:′:′′) (s) (A−1) (◦) (Mpc) (pc/′′) (Band)
UM 48 0:36:10 4:38:06 3× 1200 96/73 43 Palomar S 65.22 316 13.35(J)NGC 450 1:15:31 -0:51:38 1500 + 1200 90/77 80 Palomar SAB(s)cd 22.46 109 11.40(J)MRK 712 9:56:42 15:38:04 4× 900 84 108 NTT SBbc 55.87 271 14.47(B)MRK 1271 10:56:08 6:10:15 4× 900 80 98 NTT Compact 8.79 43 14.80(mP)NGC 4385 12:25:42 0:34:23 4× 900 96 192 NTT SB(rs)0+ 23.35 113 10.64(J)NGC 4861 12:59:00 34:50:43 1800 + 600 160/97 19 Palomar SB(s)m 10.93 53 12.44(J)NGC 5430 14:00:46 59:19:35 2× 1200 140/104 146 Palomar SB(s)b 40.55 197 10.01(J)NGC 5471 14:04:29 54:23:49 2× 1200 91/75 127 Palomar HII 3.86 19 14.76(J)MRK 475 14:39:05 23:37:28 2× 1800 84/70 80 Palomar BCD 7.96 39 15.46(B)Fairall 44 18:13:38 -57:43:59 2× 900 90 105 NTT S? pec 63.62 308 12.34(J)NGC 6764 19:08:15 50:55:57 2× 1200 125/95 67/90 Palomar SB(s)bc 31.26 152 10.56(J)MRK 309 22:52:34 24:43:50 2× 1500 + 1800 123/90 140 Palomar Sa 167.09 810 13.05(J)III ZW 107 23:30:09 25:32:02 1800 + 1200 125/95 175 Palomar Sb 76.50 371 14.06(J)NGC 7714 23:36:13 2:09:21 2× 1200 99/71 122 Palomar SB(s)b:pec 37.05 180 10.77(J)
(α) and (δ) coordinates (J2000) are for the slit center. The distance (D) is obtained from the redshift measured directly fromthe object spectrum using H0 =75 km s−1 Mpc−1. NTT and Palomar indicate the observatory where the object was observed.The object type is obtained from NED. The linear scale is obtained using the computed distance, D. ∗For more details on thequoted magnitudes we refer the reader to the NED-IPAC database.
1 for the NTT, as well as the blue and red parts of the Palomar spectra, where they are
averages over a range of 100 A around 4686A and 5878A, respectively.
2.2.1 Reddening Correction and Underlying Balmer Absorption
The reddening correction is obtained from the Balmer line ratios, using the extinction law
of Cardelli, Clayton & Mathis (1989) (hereafter CCM89), and the theoretical Balmer emis-
sion line ratios for case B recombination: I(Hα)/I(Hβ) = 2.88 and I(Hγ)/I(Hβ) = 0.47
(Brocklehurst 1971). We obtain the color excess, E(B − V ), using the theoretical ratio of
Balmer to F (Hα)/F (Hβ) measurements, according to
E(B − V ) = 2.33×
[
Log
(
F (Hα)
F (Hβ)
)
− Log(2.88)
]
(1)
In three cases (Mrk 309, Mrk 1271, and Fairall 44) for which F (Hα) is not available, we
use solely the measured F (Hγ)/F (Hβ) ratio to obtain the reddening correction using
E(B − V ) = 4.71×
[
Log
(
F (Hγ)
F (Hβ)
)
− Log(0.47)
]
(2)
The resulting color excess is used to correct each spectrum with the IRAF task deredden.
E(B-V) is easily converted to cHβ using the relation E(B− V ) ≈ 0.677× cHβ (Vogel et al.
1993).
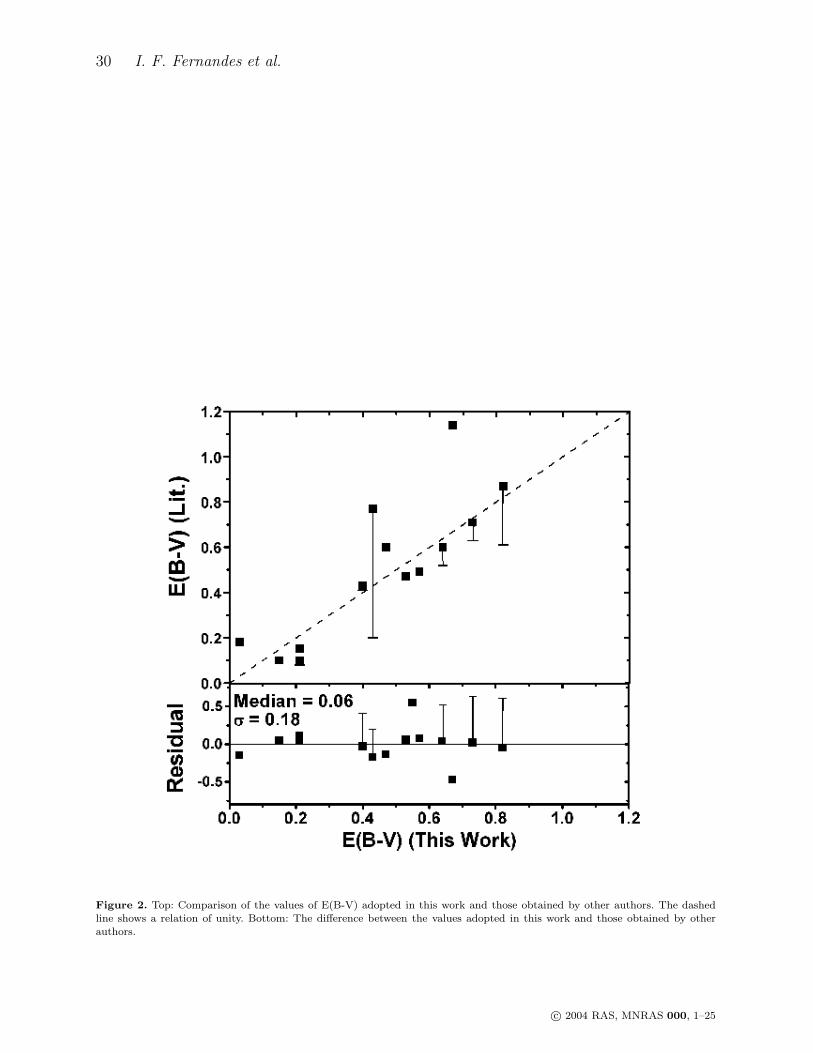
In Table 2 we compare the reddening E(B-V) measured in this work with that obtained
by other authors. Furthermore, we have compared our derived color excesses with other
measurements taken from the literature in Figure 2. The top panel shows this comparison,
c© 2004 RAS, MNRAS 000, 1–25

Massive Star Populations in Wolf-Rayet Galaxies 7
Table 2. E(B-V): Comparison with Literature.
Observed Literature Reference
Fairall44 0.47 0.60 5III Zw 107 0.53 0.47 9Mrk309 0.73 0.71, 0.63, 0.70 9, 2, 12Mrk475 0.21 0.10 7Mrk712 0.03 0.18 3Mrk1271 0.15 0.10 8NGC450 0.55 - -NGC4385 0.64 0.60, 0.52 2, 14NGC4861 0.43 0.20, (0.49, 0.62, 0.77) 2,(1)NGC5430 0.67 1.14 4NGC5471 0.21 0.15 13NGC6764 0.82,0.80 0.61,(0.87) 10, (6)NGC7714 0.40 (0.39,041), 0.43 (2), 11UM48 0.57 0.49 15
(1) Barth et al. 1994, (2) Calzetti 1997, (3) Contini et al. 1995, (4) Contini et al. 1997, (5) Durret 1990, (6) Eckart et al. 1996,(7) Izotov et al. 1994, (8) Izotov & Thuan 1998, (9) Gil de Paz et al. 2000, (10) Keel 1982, (11) Mattila & Meikle 2001, (12)Osterbrock & Cohen 1982, (13) Rosa & Bevenuti 1994, (14) Salzer et al. 1989 ,(15) Vogel et al. 1993
while the bottom panel shows the deviations as a function of E(B-V). The median difference
is 0.06 with a standard deviation of 0.18.
We note some differences between the values obtained for some of the objects. The
spectroscopic results taken from the literature are inhomogeneous in their instrumental
accuracy, observational techniques, and the S/N ratios of individual observations. However, it
is unlikely that instrumental differences dominate over variations in measured lines intensities
due to observing emission from different locations within each galaxy or star formation
region, different sized apertures, or slightly different position angles used by the authors.
After correcting the spectra for the total interstellar extinction using the Balmer line
ratios, some objects show F (Hγ)/F (Hβ) ratios lower than the theoretically predicted val-
ues. This effect is more significant for objects where the Hβ equivalent width is less than
70A (McCall, Rybski & Shields 1985, hereafter MRS85). The consequence of such under-
lying absorption is an overestimate of the reddening correction, which is then reflected in
all the observed emission lines. To correct for this effect, we use the method proposed by
MRS85 to compute the equivalent width in absorption, EWabs, given by the expression,(
F (Hγ)
F (Hβ)
)
dered
=I(Hγ)
I(Hβ)
(1 + EWabs/EW (Hβ))1−ε
(1 + EWabs/EW (Hγ)). (3)
The parameter ε is defined by
ε =
(
A(Hγ)AV
−A(Hβ)AV
)
(
A(Hα)AV
−A(Hβ)AV
) (4)
and represents the extinction reddening law (CCM89 and MRS85).
c© 2004 RAS, MNRAS 000, 1–25

8 I. F. Fernandes et al.
In the limit EWabs = 0, (F (Hγ)/F (Hβ))dered reaches the theoretical ratio (I(Hγ)/I(Hβ) =
0.47). In the opposite limit, as EWabs approaches unity, the ratio (F (Hγ)/F (Hβ))dered is
significantly altered from the theoretical expectation. The corrected equivalent widths of the
Balmer lines are obtained by adding EWabs to the observed equivalent widths.
The correction in the extinction due to underlying absorption lines, E(B-V)abs, is given
by the expression
E(B − V ) = −2.33× Log
(
1 + (EWabs/EW (Hα))
1 + (EWabs/EW (Hβ))
)
(5)
The value of EWabs for each object is listed in Table 3, along with the equivalent widths of
the emission lines EW (Hα), EW (Hβ) and EW (Hγ). Reddening and underlying absorption
corrected intensities are also given in the same Table.
3 HARD IONIZATION SOURCES
The contamination of a starburst by nearby objects such as SN IIe remnants and AGN
could occur, producing Wolf-Rayet-like features in the spectrum (Masegosa et al. 1991).
Embedded or superimposed supernova remnants (SNRs) can strongly affect the emission-
line properties in a predominantly photoionized HII region (e.g ., Peimbert, Sarmiento, &
Fierro 1991). It is crucial to distinguish between hot stars and other ionizing photon sources.
From an observational viewpoint, the presence of shocks in an ionized nebula can be detected
by the enhancement of low excitation lines, in particular [OI], [SII] and [NII] (Masegosa et
al. 1991).
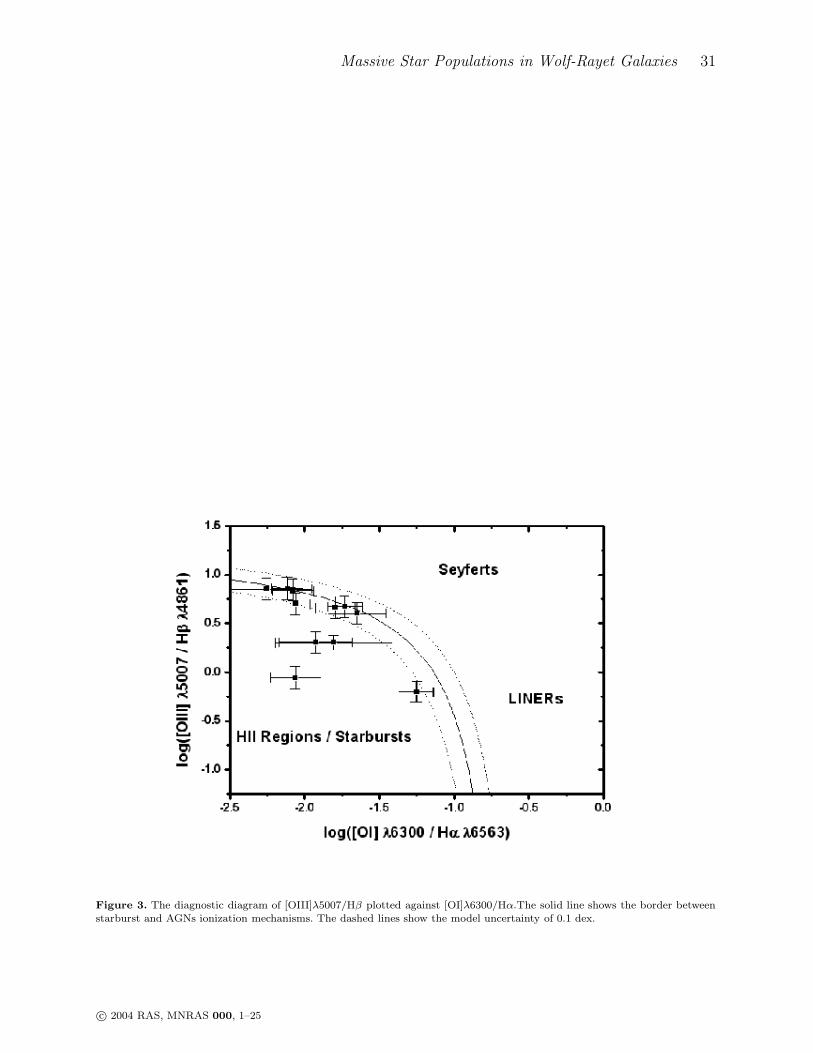
We used Veilleux & Osterbrock (1987) diagnostic diagrams to verify the ionization
sources in our galaxy sample. Since [SII]λλ6717, 6731 are not available in our spectra, we
use diagnostic diagrams plotting [OI]λ6300/Hα and [NII]λ6584/Hα line ratios against the
[OIII]λ5007/Hβ ratios (Figure 3 and 4).
The theoretical starburst limits shown in Figure 3 and 4 can be parameterized as:
log([OIII]λ5007)
Hβ=
0.61
log([NII]λ6584/Hα)− 0.47+ 1.19 (6)
log([OIII]λ5007
Hβ=
0.73
log([OI]λ6300/Hα) + 0.59+ 1.33 (7)
given by Kewley et al. (2001). The error range of their modeling in both planes is ± 0.1 dex.
All objects in our sample are located in the starburst and HII region loci in the plane
of [OI]λ6300/Hα and [NII]λ6584/Hα versus [OIII]λ5007/Hβ (Veilleux & Osterbrock 1987),
suggesting that the main sources of ionizing photons are stellar, and not AGN.
c© 2004 RAS, MNRAS 000, 1–25

Massive Star Populations in Wolf-Rayet Galaxies 9
Table 3. Corrected Emission Line Intensities Relative to Hβ = 1000
Fairall44 IIIZW107 MRK309 MRK475 Mrk712 Mrk1271
[OII]λ3727 - 2213±12 703±98 1093±4 - -[NeIII]λ3869 - 259±5 - 362.9±2.7 - -Hγ 475±2 470±5 466±46 470±3 470±3 470±8[OIII]λ4363 26±9 13±4 - 85±3 14±2 61±12HeIλ4471 53±9 49±5 59±38 42±2 67±2 61±15
[FeIII]λ4656 29±5 13±7 131±29 5±3 14±3 26±7HeII4686 19±5 3±9 - 17±4 - 35±11[ArIV]λ4711 - 14±10 - 8±3 8±2 -[ArIV]λ4740 - - - 7±3 - -HeIλ4922 - 12±8 - 11±3 19±2 -[OIII]λ4959 710±5 1215±7 104±25 1781±5 1613±4 1115±12[OIII]λ5007 2061±9 3632±18 381±33 5326±15 4881±11 3096±29[NI]λ5199 - 31±7 - 4±3 12±3 -[FeIII]λ5271 - - - 7±3 10±3 -[ClIII]λ5518 - 10±2 - 8±2 8±5 -[ClIII]λ5538 - 3±1 - 4±2 6±5 -[NII]λ5754 - 9±2 38±25 5±3 7±3 -HeIλ5876 126±4 129±2 24±17 99±1 228±3 119±9[OI]λ6300 48±6 53±2 26±22 24±1 36±3 65±11[SIII]λ6313 8±4 11±2 - 24±1 24±3 15±10[OI]λ6364 18±4 18±3 - 9±1 12±3 72±11[NII]λ6548 - 98±2 - 33±2 268±2 84±11Hα - 2855±14 - 2870±8 - 2899±25[NII]λ6584 - 280±2 - 66±1 - 221±9
EW(Hγ)(A) 32.17±0.23 26.65±0.35 3.00±0.18 73.08±3.35 45.98±0.21 15.42±0.20EW(Hβ)(A) 67.64±0.26 65.48±0.46 10.18±0.79 140.50±0.37 139.10±0.29 33.11±0.28EW(Hα)(A) - 329.60 ±3.70 - 936.20±10.98 - 109.20±1.16EWabs(A) - -0.98 - -1.18 - -0.69F(Hβ)(10−14 erg s−1 cm−2) 3.58±0.01 12.77±0.06 12.8±1.04 7.52±0.03 2.45±0.02 0.72±0.01E(B-V) 0.47 0.53 0.73 0.21 0.03 0.15E(B-V)abs - -0.012 - -0.007 - -0.015
Broad Emission Lines
NIIIλ4640 - 7±5 167±33 - 82±10 -HeIIλ4886 59±9 61±26 115±20 69±16 98±7 103±41CIIIλ5696 - - 15±4 - - -CIVλ5808 - - - 36±7 - -EWλ4640(A) - 0.37±0.38 1.36±0.21 - 7.23±0.98 -EWλ4686(A) 3.47±0.56 3.60±2.86 0.97±0.20 9.51±2.35 8.67±0.74 3.06±1.21EWλ5696(A) - - 0.26±0.05 - - -EWλ5808(A) - - - 8.02±1.46 - -
4 GAS CHEMICAL ABUNDANCES
The oxygen abundance O/H is a crucial parameter for our study since one of the main
purposes of this paper is to study the massive star populations in galaxies with different
metallicities. In order to obtain the chemical abundances of the galaxies in our sample,
three subclasses were defined depending on whether or not the [OIII]λ4363, [OII]λ3727 and
[OIII]λλ4959, 5007 features are present (see Kobulnicky et al. 1999):
Class 1. [OIII]λ4363, [OII]λ3727 and [OIII]λλ4959, 5007 are detected. When [OIII]λ4363 is
detected, the temperature is obtained from the [OIII]λλ5007, 4959/λ4363 line ratio, while
the density is measured from the [SII]λ6731/[SII]λ6717 line ratio (McCall 1984). Since our
c© 2004 RAS, MNRAS 000, 1–25
10 I. F. Fernandes et al.
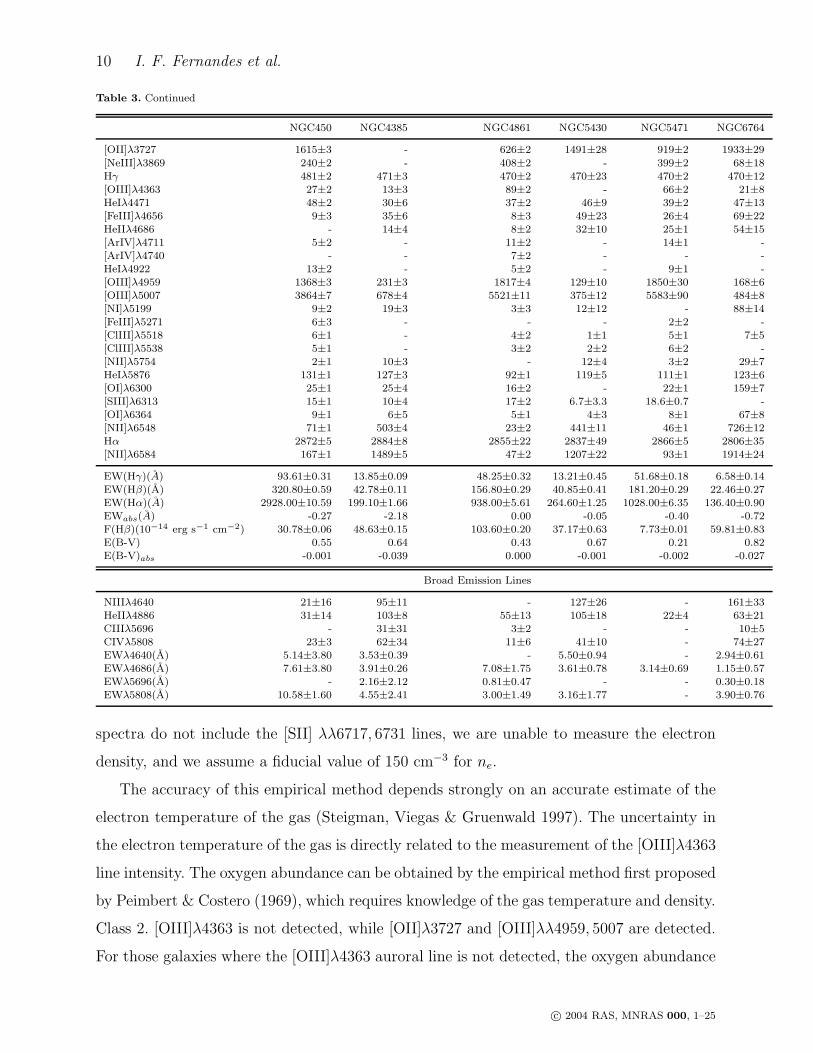
Table 3. Continued
NGC450 NGC4385 NGC4861 NGC5430 NGC5471 NGC6764
[OII]λ3727 1615±3 - 626±2 1491±28 919±2 1933±29
[NeIII]λ3869 240±2 - 408±2 - 399±2 68±18Hγ 481±2 471±3 470±2 470±23 470±2 470±12[OIII]λ4363 27±2 13±3 89±2 - 66±2 21±8HeIλ4471 48±2 30±6 37±2 46±9 39±2 47±13[FeIII]λ4656 9±3 35±6 8±3 49±23 26±4 69±22HeIIλ4686 - 14±4 8±2 32±10 25±1 54±15[ArIV]λ4711 5±2 - 11±2 - 14±1 -[ArIV]λ4740 - - 7±2 - - -HeIλ4922 13±2 - 5±2 - 9±1 -[OIII]λ4959 1368±3 231±3 1817±4 129±10 1850±30 168±6[OIII]λ5007 3864±7 678±4 5521±11 375±12 5583±90 484±8[NI]λ5199 9±2 19±3 3±3 12±12 - 88±14[FeIII]λ5271 6±3 - - - 2±2 -[ClIII]λ5518 6±1 - 4±2 1±1 5±1 7±5[ClIII]λ5538 5±1 - 3±2 2±2 6±2 -[NII]λ5754 2±1 10±3 - 12±4 3±2 29±7HeIλ5876 131±1 127±3 92±1 119±5 111±1 123±6[OI]λ6300 25±1 25±4 16±2 - 22±1 159±7[SIII]λ6313 15±1 10±4 17±2 6.7±3.3 18.6±0.7 -[OI]λ6364 9±1 6±5 5±1 4±3 8±1 67±8[NII]λ6548 71±1 503±4 23±2 441±11 46±1 726±12Hα 2872±5 2884±8 2855±22 2837±49 2866±5 2806±35[NII]λ6584 167±1 1489±5 47±2 1207±22 93±1 1914±24
EW(Hγ)(A) 93.61±0.31 13.85±0.09 48.25±0.32 13.21±0.45 51.68±0.18 6.58±0.14EW(Hβ)(A) 320.80±0.59 42.78±0.11 156.80±0.29 40.85±0.41 181.20±0.29 22.46±0.27EW(Hα)(A) 2928.00±10.59 199.10±1.66 938.00±5.61 264.60±1.25 1028.00±6.35 136.40±0.90EWabs(A) -0.27 -2.18 0.00 -0.05 -0.40 -0.72F(Hβ)(10−14 erg s−1 cm−2) 30.78±0.06 48.63±0.15 103.60±0.20 37.17±0.63 7.73±0.01 59.81±0.83E(B-V) 0.55 0.64 0.43 0.67 0.21 0.82E(B-V)abs -0.001 -0.039 0.000 -0.001 -0.002 -0.027
Broad Emission Lines
NIIIλ4640 21±16 95±11 - 127±26 - 161±33HeIIλ4886 31±14 103±8 55±13 105±18 22±4 63±21CIIIλ5696 - 31±31 3±2 - - 10±5CIVλ5808 23±3 62±34 11±6 41±10 - 74±27EWλ4640(A) 5.14±3.80 3.53±0.39 - 5.50±0.94 - 2.94±0.61EWλ4686(A) 7.61±3.80 3.91±0.26 7.08±1.75 3.61±0.78 3.14±0.69 1.15±0.57EWλ5696(A) - 2.16±2.12 0.81±0.47 - - 0.30±0.18EWλ5808(A) 10.58±1.60 4.55±2.41 3.00±1.49 3.16±1.77 - 3.90±0.76
spectra do not include the [SII] λλ6717, 6731 lines, we are unable to measure the electron
density, and we assume a fiducial value of 150 cm−3 for ne.
The accuracy of this empirical method depends strongly on an accurate estimate of the
electron temperature of the gas (Steigman, Viegas & Gruenwald 1997). The uncertainty in
the electron temperature of the gas is directly related to the measurement of the [OIII]λ4363
line intensity. The oxygen abundance can be obtained by the empirical method first proposed
by Peimbert & Costero (1969), which requires knowledge of the gas temperature and density.
Class 2. [OIII]λ4363 is not detected, while [OII]λ3727 and [OIII]λλ4959, 5007 are detected.
For those galaxies where the [OIII]λ4363 auroral line is not detected, the oxygen abundance
c© 2004 RAS, MNRAS 000, 1–25
Massive Star Populations in Wolf-Rayet Galaxies 11
Table 3. Continued
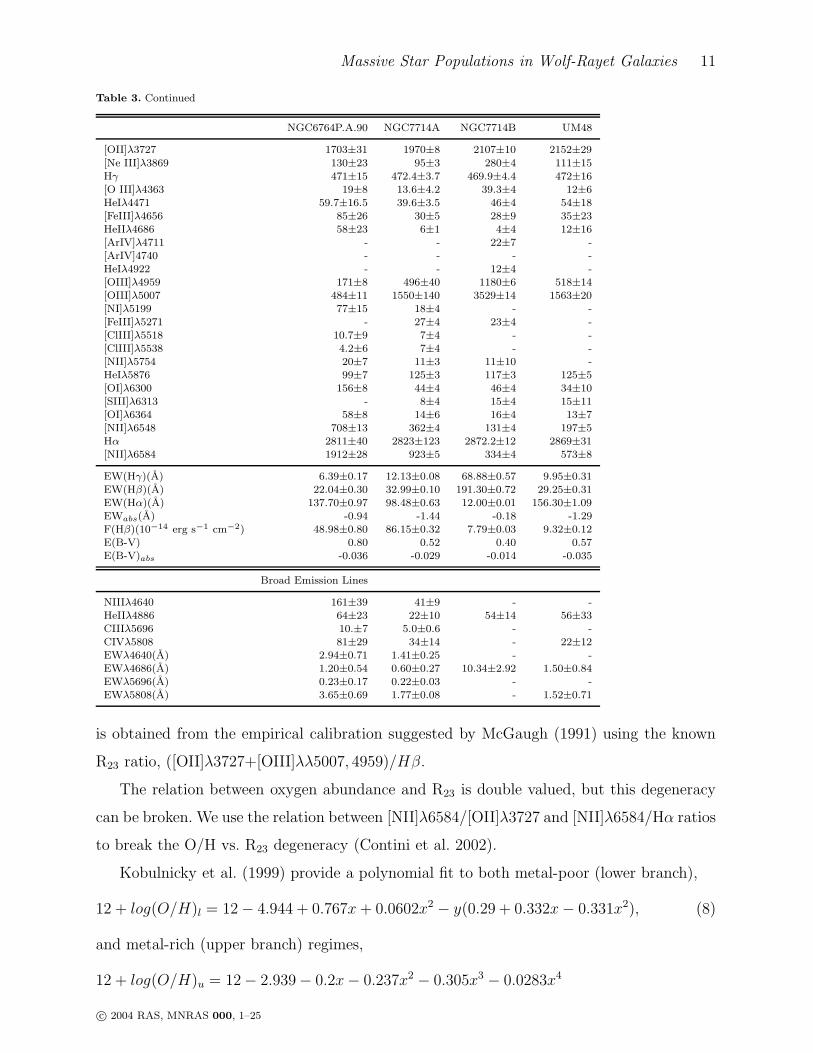
NGC6764P.A.90 NGC7714A NGC7714B UM48
[OII]λ3727 1703±31 1970±8 2107±10 2152±29
[Ne III]λ3869 130±23 95±3 280±4 111±15Hγ 471±15 472.4±3.7 469.9±4.4 472±16[O III]λ4363 19±8 13.6±4.2 39.3±4 12±6HeIλ4471 59.7±16.5 39.6±3.5 46±4 54±18[FeIII]λ4656 85±26 30±5 28±9 35±23HeIIλ4686 58±23 6±1 4±4 12±16[ArIV]λ4711 - - 22±7 -[ArIV]4740 - - - -HeIλ4922 - - 12±4 -[OIII]λ4959 171±8 496±40 1180±6 518±14[OIII]λ5007 484±11 1550±140 3529±14 1563±20[NI]λ5199 77±15 18±4 - -[FeIII]λ5271 - 27±4 23±4 -[ClIII]λ5518 10.7±9 7±4 - -[ClIII]λ5538 4.2±6 7±4 - -[NII]λ5754 20±7 11±3 11±10 -HeIλ5876 99±7 125±3 117±3 125±5[OI]λ6300 156±8 44±4 46±4 34±10[SIII]λ6313 - 8±4 15±4 15±11[OI]λ6364 58±8 14±6 16±4 13±7[NII]λ6548 708±13 362±4 131±4 197±5Hα 2811±40 2823±123 2872.2±12 2869±31[NII]λ6584 1912±28 923±5 334±4 573±8
EW(Hγ)(A) 6.39±0.17 12.13±0.08 68.88±0.57 9.95±0.31EW(Hβ)(A) 22.04±0.30 32.99±0.10 191.30±0.72 29.25±0.31EW(Hα)(A) 137.70±0.97 98.48±0.63 12.00±0.01 156.30±1.09EWabs(A) -0.94 -1.44 -0.18 -1.29F(Hβ)(10−14 erg s−1 cm−2) 48.98±0.80 86.15±0.32 7.79±0.03 9.32±0.12E(B-V) 0.80 0.52 0.40 0.57E(B-V)abs -0.036 -0.029 -0.014 -0.035
Broad Emission Lines
NIIIλ4640 161±39 41±9 - -HeIIλ4886 64±23 22±10 54±14 56±33CIIIλ5696 10.±7 5.0±0.6 - -CIVλ5808 81±29 34±14 - 22±12EWλ4640(A) 2.94±0.71 1.41±0.25 - -EWλ4686(A) 1.20±0.54 0.60±0.27 10.34±2.92 1.50±0.84EWλ5696(A) 0.23±0.17 0.22±0.03 - -EWλ5808(A) 3.65±0.69 1.77±0.08 - 1.52±0.71
is obtained from the empirical calibration suggested by McGaugh (1991) using the known
R23 ratio, ([OII]λ3727+[OIII]λλ5007, 4959)/Hβ.
The relation between oxygen abundance and R23 is double valued, but this degeneracy
can be broken. We use the relation between [NII]λ6584/[OII]λ3727 and [NII]λ6584/Hα ratios
to break the O/H vs. R23 degeneracy (Contini et al. 2002).
Kobulnicky et al. (1999) provide a polynomial fit to both metal-poor (lower branch),
12 + log(O/H)l = 12− 4.944 + 0.767x+ 0.0602x2 − y(0.29 + 0.332x− 0.331x2), (8)
and metal-rich (upper branch) regimes,
12 + log(O/H)u = 12− 2.939− 0.2x− 0.237x2 − 0.305x3 − 0.0283x4
c© 2004 RAS, MNRAS 000, 1–25

12 I. F. Fernandes et al.
−y(0.0047− 0.0221x− 0.102x2 − 0.0817x3 − 0.00717x4), (9)
where
x ≡ logR23 ≡ log([OII]λ3727 + [OIII]λλ5007, 4959)/Hβ) (10)
and
y ≡ logO32 ≡ log([OIII]λλ5007, 4959)/[OII]λ3727). (11)
The R23 calibration has an estimated uncertainty of ±0.10 in log(O/H) (Kobulnicky et
al. 1999).
Class 3. [OII]λ3727 is not detected, but [OIII]λ4363 and [OIII]λλ4959, 5007 are detected
(NTT data). It is not possible to break the degeneracy using the [NII]λ6584/[OII]λ3727 and
[NII]λ6584/Hα ratios.
In this case, we can derive the electron temperature but not the O/H abundance. We use
the temperature obtained from standard nebular analysis to select the appropriate metallic-
ity calibration with which we derive the oxygen abundance. After determining the metallicity
regime for each galaxy, we compute the O/H ratio using the upper branch given by Edmunds
& Pagel (1984),
log(O/H)u ≃ −0.69logR3 − 3.24, (12)
(0.6 ≤ logR3 ≤ 1.0)
R3 ≡F[OIII]λλ 5007,4959
FHβ
for galaxies in the high metallicity regime, and the lower branch
log(O/H)l ≃ 1.67logR3 + 6.43, (13)
(0.4 ≤ logR3 ≤ 1.1)
for low metallicity objects. The R3 calibration has an estimated uncertainty of ±0.20 in
log(O/H) (Edmunds & Pagel 1984).
Two additional empirical tools were used to obtain the oxygen abundance: the P-R23
calibration, with an estimated uncertainty of 0.10 dex (Pilyugin 2000, 2001a and 2001b),
and the [OIII]/[NII] calibration given by Pettini and Pagel (2004), with an uncertainty of
0.25 dex. In particular, for NTT data we use the calibration extrapolated to [OII]λ3727 = 0,
where the uncertainty increases to 0.30 dex (Pilyugin 2001a).
To compare the derived oxygen abundances, we use as many of the methods described
c© 2004 RAS, MNRAS 000, 1–25
Massive Star Populations in Wolf-Rayet Galaxies 13
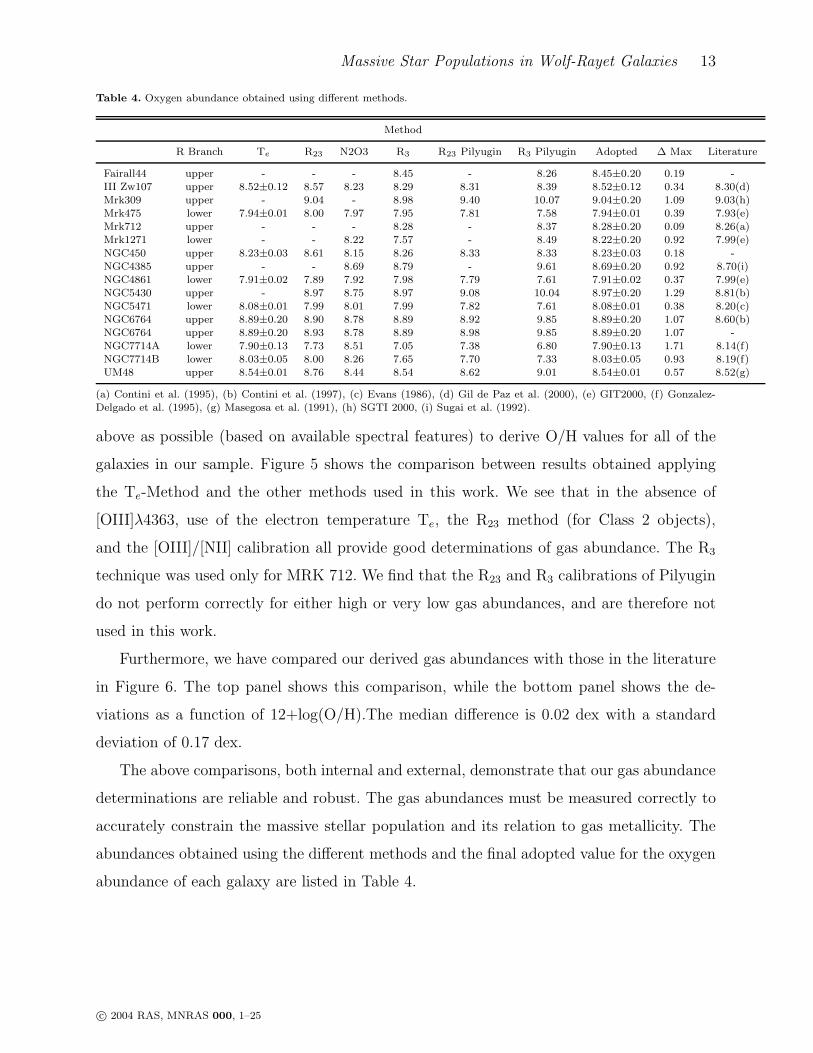
Table 4. Oxygen abundance obtained using different methods.
Method
R Branch Te R23 N2O3 R3 R23 Pilyugin R3 Pilyugin Adopted ∆ Max Literature
Fairall44 upper - - - 8.45 - 8.26 8.45±0.20 0.19 -III Zw107 upper 8.52±0.12 8.57 8.23 8.29 8.31 8.39 8.52±0.12 0.34 8.30(d)Mrk309 upper - 9.04 - 8.98 9.40 10.07 9.04±0.20 1.09 9.03(h)Mrk475 lower 7.94±0.01 8.00 7.97 7.95 7.81 7.58 7.94±0.01 0.39 7.93(e)Mrk712 upper - - - 8.28 - 8.37 8.28±0.20 0.09 8.26(a)Mrk1271 lower - - 8.22 7.57 - 8.49 8.22±0.20 0.92 7.99(e)
NGC450 upper 8.23±0.03 8.61 8.15 8.26 8.33 8.33 8.23±0.03 0.18 -NGC4385 upper - - 8.69 8.79 - 9.61 8.69±0.20 0.92 8.70(i)NGC4861 lower 7.91±0.02 7.89 7.92 7.98 7.79 7.61 7.91±0.02 0.37 7.99(e)NGC5430 upper - 8.97 8.75 8.97 9.08 10.04 8.97±0.20 1.29 8.81(b)NGC5471 lower 8.08±0.01 7.99 8.01 7.99 7.82 7.61 8.08±0.01 0.38 8.20(c)NGC6764 upper 8.89±0.20 8.90 8.78 8.89 8.92 9.85 8.89±0.20 1.07 8.60(b)NGC6764 upper 8.89±0.20 8.93 8.78 8.89 8.98 9.85 8.89±0.20 1.07 -NGC7714A lower 7.90±0.13 7.73 8.51 7.05 7.38 6.80 7.90±0.13 1.71 8.14(f)NGC7714B lower 8.03±0.05 8.00 8.26 7.65 7.70 7.33 8.03±0.05 0.93 8.19(f)UM48 upper 8.54±0.01 8.76 8.44 8.54 8.62 9.01 8.54±0.01 0.57 8.52(g)
(a) Contini et al. (1995), (b) Contini et al. (1997), (c) Evans (1986), (d) Gil de Paz et al. (2000), (e) GIT2000, (f) Gonzalez-Delgado et al. (1995), (g) Masegosa et al. (1991), (h) SGTI 2000, (i) Sugai et al. (1992).
above as possible (based on available spectral features) to derive O/H values for all of the
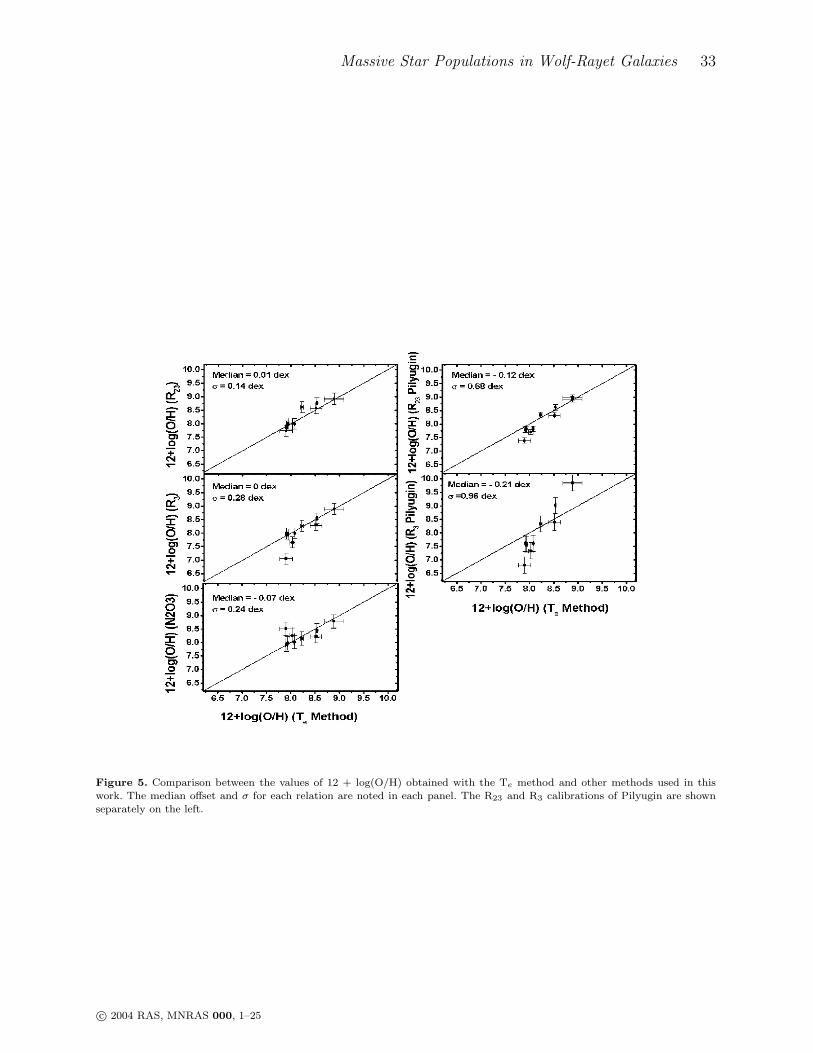
galaxies in our sample. Figure 5 shows the comparison between results obtained applying
the Te-Method and the other methods used in this work. We see that in the absence of
[OIII]λ4363, use of the electron temperature Te, the R23 method (for Class 2 objects),
and the [OIII]/[NII] calibration all provide good determinations of gas abundance. The R3
technique was used only for MRK 712. We find that the R23 and R3 calibrations of Pilyugin
do not perform correctly for either high or very low gas abundances, and are therefore not
used in this work.
Furthermore, we have compared our derived gas abundances with those in the literature
in Figure 6. The top panel shows this comparison, while the bottom panel shows the de-
viations as a function of 12+log(O/H).The median difference is 0.02 dex with a standard
deviation of 0.17 dex.
The above comparisons, both internal and external, demonstrate that our gas abundance
determinations are reliable and robust. The gas abundances must be measured correctly to
accurately constrain the massive stellar population and its relation to gas metallicity. The
abundances obtained using the different methods and the final adopted value for the oxygen
abundance of each galaxy are listed in Table 4.
c© 2004 RAS, MNRAS 000, 1–25
14 I. F. Fernandes et al.
5 MASSIVE STAR POPULATIONS: WR AND O STAR NUMBERS
The number of massive stars present in a region of a Wolf-Rayet galaxy can be derived
using the standard method developed by Conti (1991). A representative number of O and
WR subtype stars can be obtained directly from the optical spectra (Vacca & Conti 1992,
hereafter VC92).
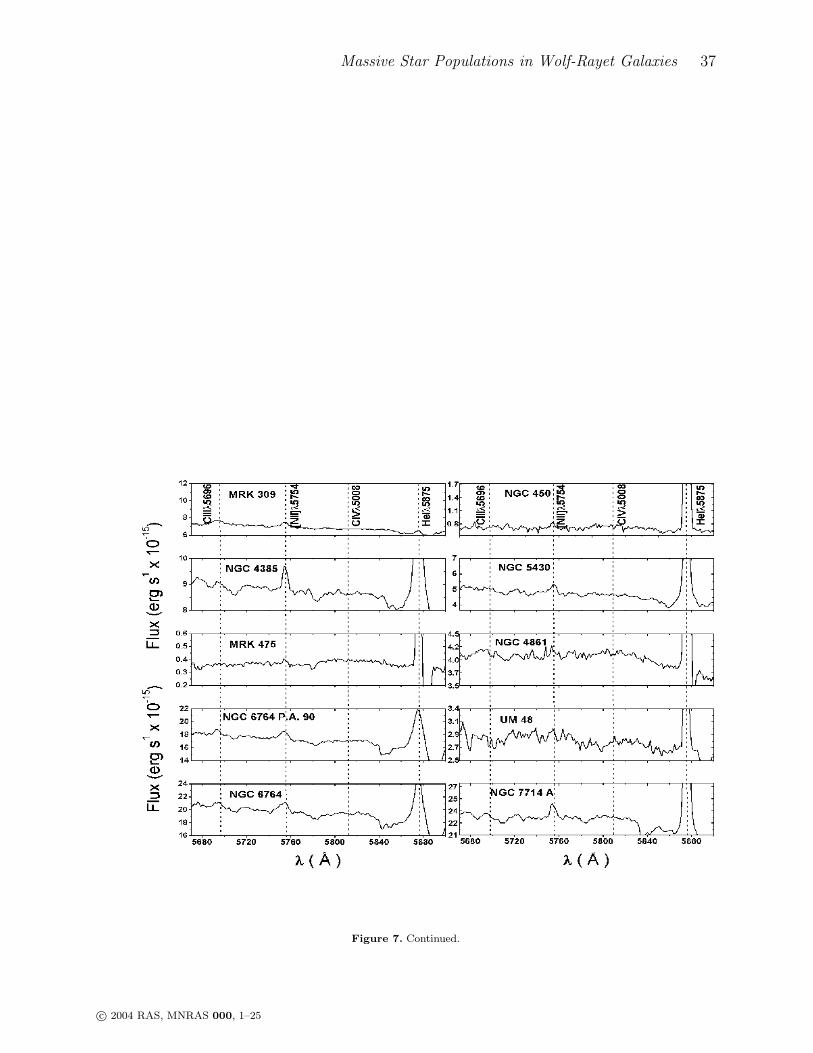
The absolute number of WR stars in the sampled galaxies was estimated using the blue
bump (λ4686) and red bump (λ5808) luminosities. The blue bump is a blend of NVλ4605,
NIIIλλ4634, 4640, CIIIλ4650, CIVλ4658 and HeIIλ4686 broad WR lines (GIT00). Super-
posed on the blue bump may be [FeIII]λ4658, HeIIλ4686, and [ArIV]λλ4711, 4740, which
are narrow nebular lines. The dominant contribution to the blue bump is from the broad
HeIIλ4686 line arising in WNL stars, while the red bump is mainly due to broad CIV λ5808
from WC stars (Schaerer et al. 1999, GIT00). However, some contribution from early WN
stars (WNE) might be present in the blue bump (SV98). The detectability of the red bump
is low compared to the blue bump. Figure 7 shows the spectral region of those galaxies in
our sample containing either the blue or red bump.
The dominant subtype of WR stars can be constrained by analyzing the presence of
particular lines. NIIIλ4640 and/or CIIIλ4650 are observed in 9 galaxies, while NVλ4604 is
absent. The former are due only to WN stars, thus indicating the predominance of WNL
stars (Schaerer et al. 2000).
To derive the number of WNL stars from the blue bump, we measured the flux of the
entire bump, and then subtracted the nebular lines and the contributions of NIIIλ4640 and
CIII/CIVλ4650/λ4658 when these lines were present. This procedure then retains only the
broad emission component of HeIIλ4686.
The CIIIλ5696 emission line is a signature of late type WC stars (WCL, GIT00), and their
presence is expected in high metallicity regions (Maeder, 1991). When CIIIλ5696 is absent,
but CIVλ5808 is present, the emission is likely due to early-type WC stars (WCE). WN
stars cannot be responsible for the CIVλ5808 emission, since the ratio HeIIλ4686/CIVλ5808
observed in our spectra ranges from 0.64 to 5, much lower than the value of ∼ 16 predicted
by SV98 (Schaerer et al. 2000).
The absolute population of WR subtype stars can be derived if the line luminosity
of a single subtype star is known. We use the integrated broad emission line luminosity
c© 2004 RAS, MNRAS 000, 1–25
Massive Star Populations in Wolf-Rayet Galaxies 15
of HeIIλ4686 in each of our galaxies to derive the number of WNL stars, the CIVλ5808
luminosity to derive the number of WCE stars, and CIIIλ5696 for WCL stars (GIT00).
In practice,
NWNL =LobsHeIIλ4686
LHeIIλ4686
, (14)
NWCE =LobsCIV λ5808
LCIV λ5808
, (15)
and
NWCL =LobsCIIIλ5696
LCIIIλ5696, (16)
where LobsHeIIλ4686, L
obsCIV λ5808 and Lobs
CIIIλ5696 are the total luminosities observed around the
corresponding spectral features. For the average luminosity of a single WNL star in the He
II λ4686 line we use LHeλ4686 = 1.6± 0.8× 1036 erg s−1, while for a single WCE star in the
CIVλ5808 line we use LCIV λ5808 = 3.0± 1.1× 1036 erg s−1, and for a single WCL star in the
CIIIλ5696 line we use LCIIIλ5696 = 8.1± 2.9× 1035 erg s−1(SV98).
Then, the total number of WR stars is defined by
NWR = NWCE +NWCL +NWNL. (17)
We note that these line luminosities are based on WR stars observed in the Milky Way,
assuming solar metallicity . The line luminosities show significant scatter depending on the
dominant WR subtype and the metallicity in the observed object.
To obtain the number of O stars in each galaxy, we assume that all ionizing photons,
Q0, are produced by O and WR stars (Conti 1991). Hence,
Qobs0 = NO7VQO7V +NWRQWR (18)
where NO7V is the number of O7V stars and QWR and QO7V are the number of ionizing
photons per second produced by WR stars (all subtypes summed up) and O7V stars, respec-
tively. Thus, the total number of ionizing photons can be obtained from the Hβ luminosity,
L(Hβ), through the relation
Qobs0 = 2.01× 10¹²LHβ . (19)
The number of O stars present is derived from the number of O7V stars after applying a
correction for the presence of other O star subtypes. In this sense, VC92 and Vacca (1994)
defined the conversion parameter as the proportion of O7V stars relative to all OV stars,
η0 = NO7V /NOV . (20)
c© 2004 RAS, MNRAS 000, 1–25

16 I. F. Fernandes et al.
Table 5. Star Population Parameters.
Q0(×1052) Age (Myr) η0(t)
Fairall44 3.96±0.59 3.0 0.50III Zw 107 18.61±2.79 4.0 0.53Mrk309 89.76±13.46 6.1 0.80Mrk475 0.12±0.02 4.1 0.48Mrk712 2.27±0.34 3.5 0.86
Mrk1271 0.04±0.01 4.7 0.36NGC450 3.52±0.53 2.6 1.50NGC4385 9.85±1.48 4.9 0.18NGC4861 3.18±0.48 4.0 0.53NGC5430 15.28±2.29 5.1 0.14NGC5471 0.03±0.00 3.8 0.65NGC6764 14.94±2.24 5.5 0.12NGC6764 12.40±1.86 5.5 0.12NGC7714A 29.68±4.45 5.4 0.52NGC7714B 2.79±0.42 3.7 0.72UM48 9.94±1.49 4.8 0.20
The parameter η0 depends on the IMF for massive stars and is a function of the time
elapsed since the beginning of the burst.
Using the models of SV98, which give the evolution of EW(Hβ) as a function of the time
elapsed from the beginning of an instantaneous burst for different metallicities, we derive
the starburst age t for each of our galaxies. These ages are in good agreement with the
predicted age and duration of the WR phase estimated from instantaneous burst models.
We use the models of SV98 to evaluate the parameter η0(t), adopting the oxygen abundance
obtained for objects as the metallicity, the canonical slope for a Salpeter initial mass function
Γ = −2.35, and a stellar mass upper limit of 120M⊙. The number of ionizing photons, the
age of the starburst and η(t) derived for each galaxy of our sample are given in Table 5.
Then, using equations (18),(19) and (20), the absolute number of O stars can be derived
as
NO = NOV =Qobs
0 −NWRQWR
η0(t)QO7V(21)
We adopt QWR = QO7V = 1.0× 1049s−1 (Schaerer et al. 1999).
The absolute number of O stars, Wolf-Rayet stars, NWNL and NWCE , and the ratio
NWR/NO are given in Table 6.
5.1 Comparison with Evolutionary Models
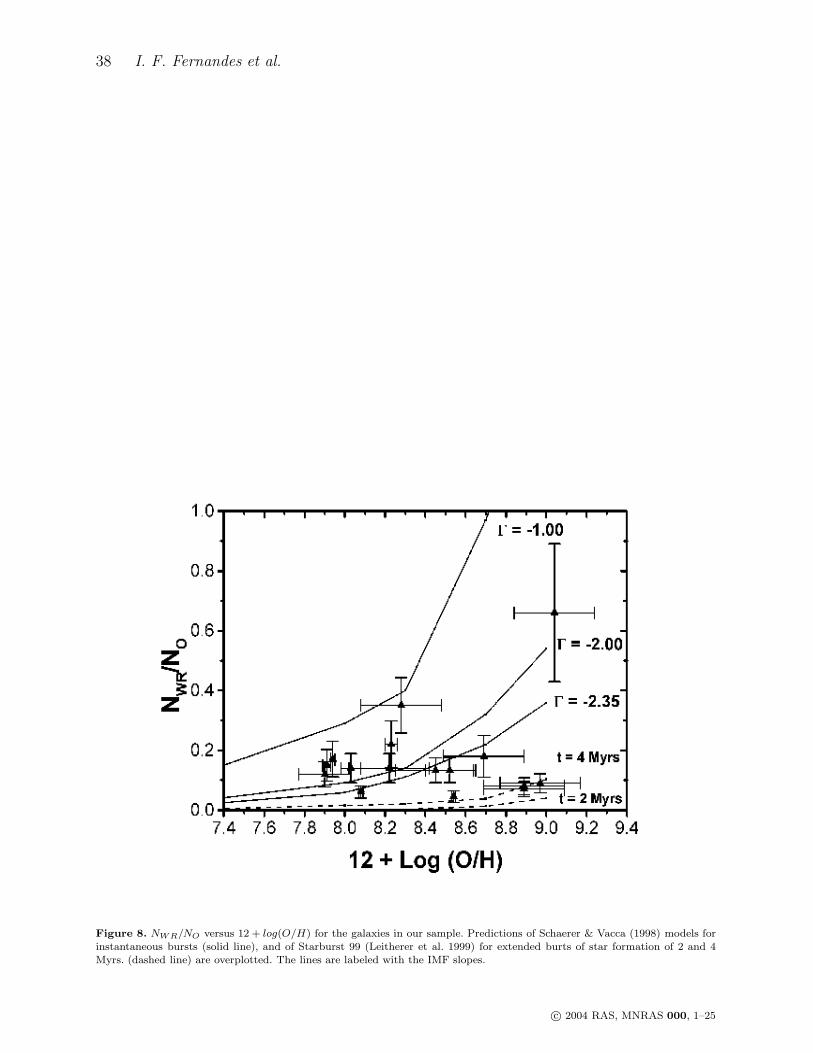
The relationship between the NWR/NO ratio and oxygen abundance obtained for the galaxies
in our sample is shown in Figure 8. We adopt a solar oxygen abundance of 12+ log(O/H)
= 8.70 (Grevesse & Anders 1989, Grevesse & Sauval 1998). The predictions of Schaerer &
c© 2004 RAS, MNRAS 000, 1–25

Massive Star Populations in Wolf-Rayet Galaxies 17
Table 6. Massive Star Population.
NWNL NWCL NWCE NWR NO NWR/NO* NWC/NWN ∗
Fairall44 692±363 - - 692±363 5660±623 0.12±0.04 -III Zw 107 3389±2211 - - 3389±2211 28726±4172 0.13±0.04 -Mrk309 30841±16314 7945±229 - 38786±16315 58498±16883 0.66±0.24 0.26±0.09Mrk475 25±14 - 7±3 32±14 186±29 0.17±0.16 0.28±0.10Mrk712 661±334 - - 661±334 1876±390 0.35±0.13 -
Mrk1271 11±7 - - 11±7 77±22 0.14±0.05 -NGC450 322±215 - 129±51 451±221 2044±147 0.22±0.08 0.40±0.14NGC4385 3037±1534 1208±960 972±634 5217±2288 25740±7610 0.20±0.07 0.72±0.25NGC4861 522±288 65±3 58±35 586±290 4375±489 0.15±0.05 0.24±0.08NGC5430 4761±2520 - 999±435 5761±2558 66149±17776 0.09±0.03 0.21±0.08NGC5471 2±1 - - 2±1 44±2 0.05±0.02 -NGC6764 2812±1687 859±42 1750±906 5421±2231 79325±14771 0.07±0.02 0.93±0.33NGC6764 2380±1457 735±49 1606±817 4721±1943 56180±11250 0.08±0.03 0.98±0.35NGC7714A 1920±1288 869±18 1596±883 5295±2277 44282±2655 0.12±0.04 0.87±0.31NGC7714B 451±255 - - 451±255 3276±357 0.14±0.04 -UM48 1654±1279 - 353±234 2007±1300 38967±6385 0.05±0.02 0.21±0.08
Vacca (1998) models for instantaneous bursts (solid line) with IMF slopes of -1, -2 and -2.35
(Salpeter), and of Starburst 99 (Leitherer et al. 1999) for extended bursts (duration of 2-4
Myrs) with IMF slope = -2.35 and mass limit of 100 M⊙ (dashed line) are plotted.
Evolutionary models predict that for a given metallicity, the ratio between WR and O
stars varies strongly with the age of the burst, and the duration of the WR stage in the
starburst also increases with increasing metallicity. (Maeder & Meynet 1994; Meynet 1995;
SV98). Maeder (1991) interpreted this behavior as the result of increased stellar mass loss
at higher metallicities. The increased stellar mass loss reduces the mass limit for forming
WR stars in metal rich galaxies (Maeder 1991).
In the low metallicity case, the results can be explained by an instantaneous burst with a
Salpeter IMF slope (Γ = -2 to -2.35). In the high metallicity regime, the results deviate from
the expected behavior based on models with an instantaneous burst for starburst galaxies
(SV98). A steeper IMF slope is required than in the low metallicity case, or we must invoke
an extended burst to explain the results. SGIT00 interpret this behavior for their sample of
high metallicity galaxies as implying an extended burst duration of ∼4-10 Myrs. Support for
this conclusion comes from the observed WR population relation (WC/WN) with metallicity
and the red supergiant star features observed in their objects (GIT00,SGIT00). NGC4385,
NGC 5430, NGC 6764 and UM 48, with 12 + log(O/H) > 8.4, are candidates for this type
of object.
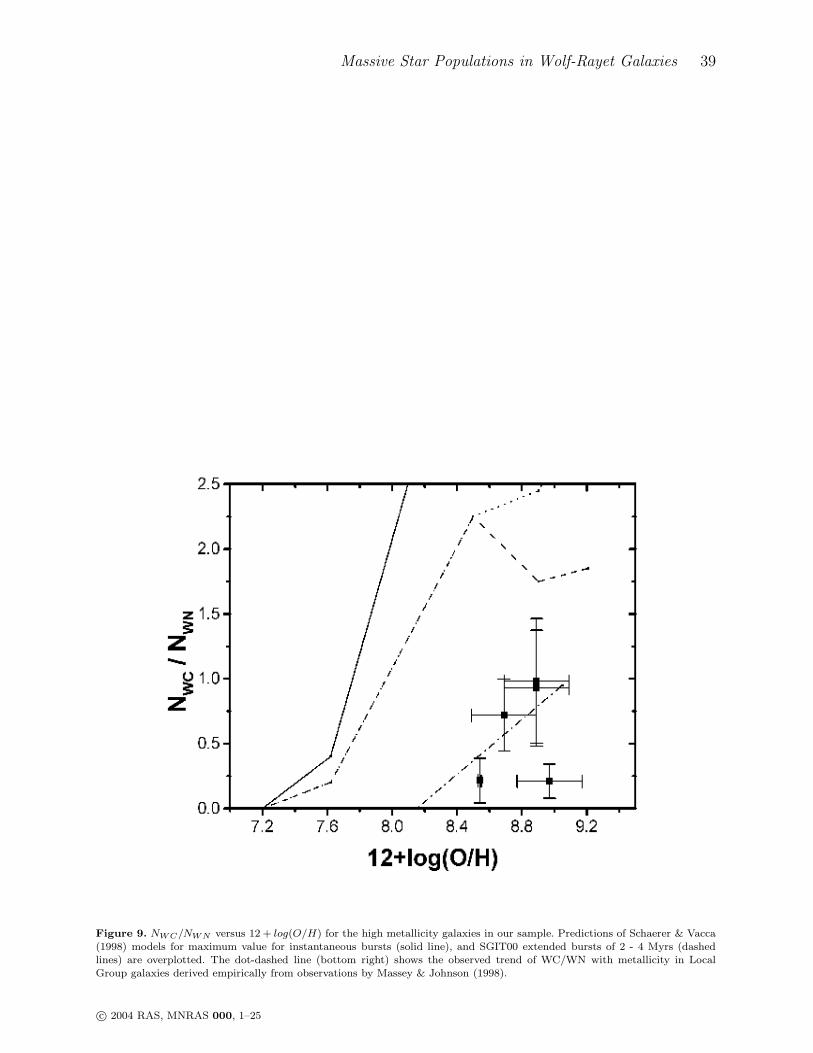
In Figure 9 we plot the ratio NWC/NWN (where WC = WCL + WCE) versus oxygen
abundance compared to the predictions of SV98 models for an instantaneous burst, as well
as extended bursts of 2 and 4 Myrs (Pindao et al. 2002). The dot-dashed line (bottom right)
c© 2004 RAS, MNRAS 000, 1–25
18 I. F. Fernandes et al.
shows the observed trend of WC/WN with metallicity in Local Group galaxies derived
empirically from observations by Massey & Johnson (1998). The NWC/NWN ratio is lower
than the instantaneous burst model predictions and, for galaxies with metallicity higher
than 12 + log(O/H) > 8.4, the ratio is closest to the values reported for galaxies in the
Local Group corresponding to a constant star formation regime (Massey & Johnson 1998).
These low NWC/NWN ratios might be partially explained by the assumption that the
predominant contribution to the CIVλ5808 line luminosity at high metallicities is from
WCE stars. If instead we assume that the main contribution to this line luminosity comes
from WCL stars, the lower luminosity of WCL stars can increase the ratio of WC to WN
stars by a factor of ∼ 3 − 4 (GIT00). Schaerer & Vacca 1998 predict a luminosity ratio
CIIIλ5696/CIVλ5808 for a WCL (WC7) star of ∼ 0.5, but galaxies in our sample where
WC emission lines are measured show lower CIIIλ5696/CIVλ5808 ratios.
We contend that the low NWC/NWN ratios observed in high metallicity galaxies are due
to the nature of the star formation bursts, with different durations for the WN and WC
stages (GIT00). These galaxies have low Hβ equivalent widths leading to ages greater than
5.3 Myr (except UM48 with age ≃ 4.8 Myr). They are therefore in the late stages of their
WR episodes (GIT00). At these later times, WN stars are still present, while the number
of WC star drops to zero (SV98). This supports an extended burst to explain the NWN/NO
ratio seen in these galaxies.
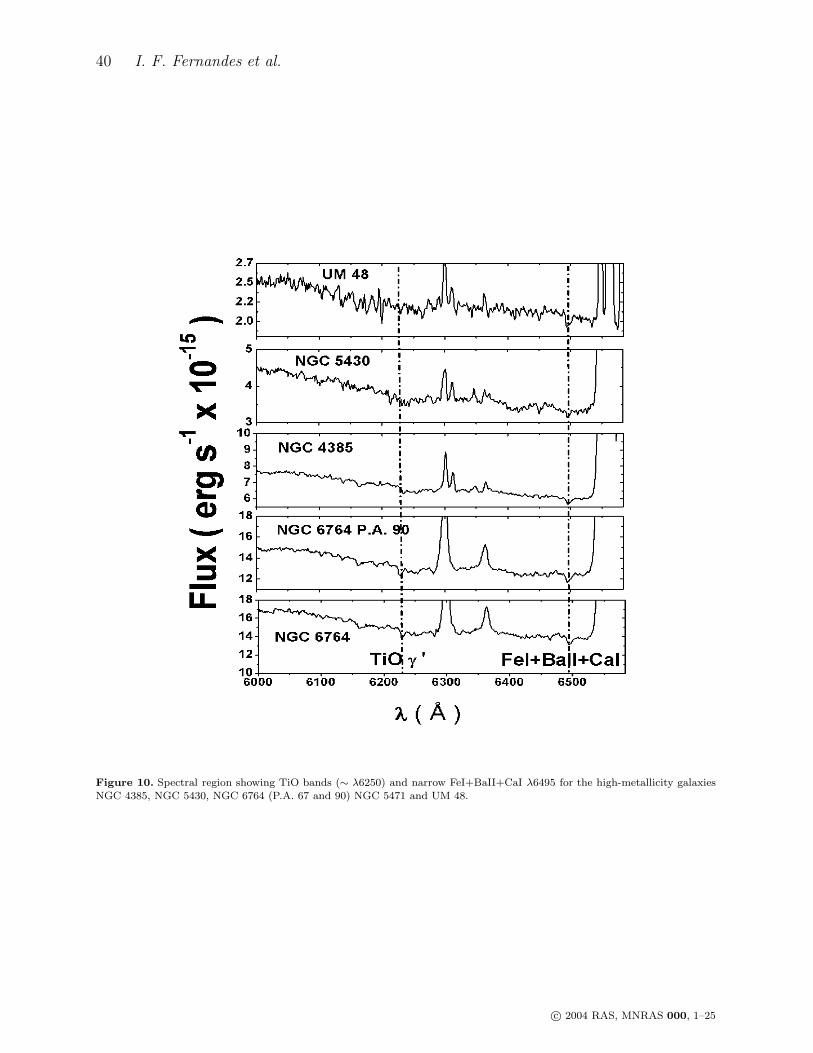
The presence of late type stellar features provides additional evidence supporting an
extended burst. These absorption features are commonly observed in integrated spectra of
stellar clusters, indicating the presence of red giants and supergiants (Bica & Alloin 1986).
The presence of late-type stars further supports the idea of an extended burst with an age
<7 Myr. In Figure 10 we present the spectra of these four high-metallicity galaxies which
show apparent TiO bands (∼ λ6250) and and a blend of FeI+BaII+CaIλ6495, which are
spectral features of characteristic of late-type stars.
Alternatively, Pindao et al. (2002) suggest that corrections to the evolutionary models
can reproduce the low observed NWR/NO ratios using an instantaneous burst. They invoke
the uncertainties in synthesis models of WR bumps to explain their results, since the WR
line luminosities show a large scatter in the WNL calibration sample of SV98 with Galactic
and LMC objects. A dependence between the WR luminosity and the bolometric stellar
luminosity may cause this discrepancy. The WR line luminosity L4686 is observed to increase
with increasing bolometric stellar luminosity. They suggest a more precise analysis, splitting
c© 2004 RAS, MNRAS 000, 1–25

Massive Star Populations in Wolf-Rayet Galaxies 19
the bolometric stellar luminosity in two domains (log(L/L⊙) < 6 and log(L/L⊙) > 6). The
different average line luminosities for each domain are L4686 = 5.6×1035 erg s−1 for log(L) < 6
and L4686 = 3.1 × 1036 erg s−1 for log(L) > 6. Using these values in synthesis models leads
to a reduction in the predicted number of WNL stars. Note that the line luminosity for a
WNL star with L > 6L⊙ is almost twice as large as that adopted by SV98 for their Galactic
calibration sample. Using these values in the synthesis models, their observed WR features
can be reproduced with an instantaneous burst and a standard Salpeter IMF (Pindao et al.
2002).The recalibrated (lower) luminosity of WN stars used in models leads to a significant
reduction in the WR bump intensity in the bursts with ages ≥ 4-5 Myrs.
Only the youngest bursts with very high EW (Hβ) are dominated by very luminous
WNL stars. For objects with low NWR/NO ratios, if we apply the suggested correction to
the L4686 luminosities in the actual observations (instead of the models), and recalculate
the number of WN stars at the highest metallicities (dominated by low luminosity WNL
stars), the lower luminosity of WNL stars can increase the fraction of WN stars by a factor
of ∼ 2− 2.3 (GIT00). With this change in assumed luminosity, we are unable to reproduce
the standard instantaneous burst model predictions for the NWR/NO ratio in the highest
metallicity galaxies. This analysis confirms that the low values of NWR/NO for objects with
12+ log(O/H) > 8.4, obtained for NGC4385, NGC 5430, NGC 6764 and UM 48, require an
extended burst with a Salpeter IMF slope.
6 CONCLUSION
In this work, we present a spectroscopic study of 14 Wolf-Rayet galaxies from the sample of
SCP98, as well as NGC450 for which the WR features are newly detected. Our goals were to
search for and confirm the presence of WN and WC stars, and to compare the results with
predictions from evolutionary synthesis models (SV98). We tested the agreement of these
models with observations for a large range of metallicities, spanning 7.90 ≤ 12 + log(O/H)
≤ 9.04.
Our main results can be summarized as follows:
1. The broad WR emission in the blue region of the spectrum, the blend of NIIIλ4640,
CIIIλ4650, CIVλ4658, and HeIIλ4686 emission lines, is present in all fourteen galaxies. The
WR population in these galaxies is dominated by late WN stars. However, the red bump
c© 2004 RAS, MNRAS 000, 1–25

20 I. F. Fernandes et al.
produced by the emission of broad C IVλ5808 from early WC stars is detected in only nine
galaxies.
2. The weak, broadWR emission line CIIIλ5696 is detected in six galaxies, which suggests
the presence of late WCL stars in these objects. This line is expected in high-metallicity envi-
ronments (GIT2000). A good example of this is Mrk 309, with a metallicity of 12+log(O/H)
= 9.04, where this line is strong.
3. We found good agreement when comparing the relative numbers of WR and O stars
(NWR/NO) obtained from observations and those predicted by the evolutionary synthesis
models of SV98 for low metallicity galaxies. The ratio NWR/NO in these galaxies can be
explained by a burst of star formation. The NWR/NO value and the observed equivalent
widths of the blue and red bumps also compare favorably with SV98 predictions. We found
that it is necessary to invoke an IMF slope between −2 <∼ Γ <
∼ −2.35 and an instantaneous
star formation event to explain the observed NWR/NO ratios in low metallicity regimes.
4. For NGC4385, NGC 5430, NGC 6764 and UM 48, the NWR/NO ratios are lower than
the predictions of models with an instantaneous burst for metallicities of 12 + log(O/H) >
8.4. The existence of an extended burst is supported by the presence of TiO bands (∼ λ6250)
in these objects spectra. The presence of this older stellar population is indicative of the
necessary time elapsed since the burst for stars to evolve through this phase. The NWN/NWC
ratios combined with their high metallicity suggest these objects are in the late stages of
their WR episodes (≥ 5.3Myr), when WN stars are present while the number of WC stars
drops to zero (SV98). The observations can be better represented using extended starbursts
with durations of 2-4 Myr and Salpeter IMF slope.
5. Massive stellar evolution models predict that the relative number of WR stars increases
when metallicity increases (Maeder & Meynet 1994, SV98). Our results do not confirm this
trend. The partial disagreement between our results and the models may arise from large
uncertainties in the luminosity of a single WR star and the uncertainties associated with the
best choice of the dominant contribution of WR star subtype in the high metallicity regime.
The massive stellar populations in Wolf-Rayet galaxies can be better understood if stud-
ies like this one are combined with other stellar population investigations. A detailed spec-
tral study in the infrared of molecular bands and low ionization absorption lines can provide
information about older stellar populations in a starburst (Origlia et al. 1999, GIT00). Spec-
troscopy in the UV (912−1800A) can provide information about the young star population
in galaxies. This UV spectral range contains resonant spectral lines of OVIλ1035, SiVλ1400
c© 2004 RAS, MNRAS 000, 1–25
Massive Star Populations in Wolf-Rayet Galaxies 21
and/or CIVλ1550 that are spectral signatures of young massive stars (Leitherer et al. 2002).
The combination of the IR and UV yields information on the current stellar populations,
and constrains the upper and lower limits of time elapsed since the burst (Leitherer et al.
2002, Olivia et al. 1999). Additionally, analysis of the α-element abundances can provide
additional constraints on the age of the burst and consequently the number of massive stars
(Lanfranchi, G. A. & Friaca 2003).
Acknowledgements : It is a pleasure to thank Sueli M. M. Viegas for discussions and con-
tributions with helpful comments. I.F.Fernandes is thankful to the Laboratoire d’Astrophysique,
Observatoire Midi-Pyrenees staff for their kind hospitality. This international collaboration
was possible thanks to the financial support of IAG-USP, FAPESP grant No 99/12721-5
and of . L.A.O.M.P. URA 285.
APPENDIX A: REMARKS ON INDIVIDUAL OBJECTS
In this section we present a brief description of some specific properties of each galaxy in
our sample. By doing so we can address specific issues related to these objects and compare
with results from other authors, and obtain important information for the analysis of the
population as a whole.
Fairall 44: Kovo & Contini (1999) reported the blue bump in their systematic search for
Wolf-Rayet stars in young starburst galaxies. We report the presence of WN stars in this
galaxy. We find that the WR/O ratio is 0.24.
III Zw 107: Kunth & Jobert (1985) reported a moderately strong emission band at
4686A due to WR stars in III Zw 107 S. We report the presence of NIIIλ4640 and HeIIλ4886
broad emission lines in this galaxy. The WR/O ratio is 0.12.
Mrk 309: This bright UV continuum galaxy has broad emission features at NIIIλ4640
and HeIIλ4686 from WR stars noted by OC82. They found that the number of WR stars
is comparable to the number of O stars in this galaxy and the nuclear region of NGC6764.
We note the presence of NIIIλ4640 and HeIIλ4686 in the blue bump and CIIIλ5696 in the
red bump in our spectrum of this galaxy. We find that the number of WR stars is similar
to that of O type stars in the nuclear region of Mrk 309. Our results are in good agreement
with SGIT00.
Mrk 475: Broad HeIIλ4686 and NIIIλ4640 emission lines were first noted by Conti (1991).
Strong blue and red bumps were detected by ITL94. GIT00 identified features of SiIIIλ4565,
c© 2004 RAS, MNRAS 000, 1–25
22 I. F. Fernandes et al.
HeIIλ4686, HeI,NIIλ5047, and CIVλ5808, where the blue bump is strongly contaminated by
nebular emission. We confirm the results of GIT00, and find a WR/O ratio of 0.17.
Mrk 712: Contini et al. (1995) reported the discovery of emission from WR stars in the
giant HII region 4.5′′ south of the nucleus. They estimated a WN/O ratio of 0.2 from the
HeIIλ4686 luminosity. The [ArV] emission line in their spectrum showed that the HII region
is strongly ionized by hot WR stars. The WN/WO ratio indicated a very young starburst
episode and a flat initial mass function with slope Γ between -1 and -2. We use the SV98
evolution models to compare with our observational results (§6.2).
Mrk 1271: Izotov & Thuan 1998 detected a broad blue bump. GIT00 identified the
NIIIλ4512, SiIIIλ4565, NIIλ4620 and HeIIλ4686 emission lines, and possibly CIVλ5808 in
their high quality spectrum. They reported the blue bump as being strongly contaminated
by nebular emission. We confirm only the presence of the HeIIλ4686 broad line in the nuclear
region of this galaxy. The CIVλ5808 broad line is not detected in our spectrum of Mrk 1271.
The WR/O ratio is 0.14.
NGC 450: There is no mention of WR detection in this galaxy in the literature. We report
a ratio of WR/O=0.22. The models of SV98 for an instantaneous star formation episode
predict a flat IMF slope (Γ = −1 to −2) to explain the presence of WR stars in this low
metallicity galaxy.
NGC 4385: HeIIλ4686 and NIIIλ4640 Wolf-Rayet features are present in this starburst
galaxy, according to Durret & Tarrab (1988). An optical spectrum by Salzer (1990) shows
essentially the same features. Conti (1991) identified a narrow emission feature near 4660A as
[FeIII], while Salzer et al. (1989) identifies it as CIV. We detect NIIIλ4640 and HeIIλ4686
in the blue bump and CIIIλ5696 and CIVλ5808 in the red bump. We find a high number
of WR stars compared to O stars. The WR/O ratio is 0.13 for the nuclear region of NGC
4385.
NGC 4861: Dinerstein & Shields (1986) and Izotov, Thuan & Lipovetsky (1997) detected
the blue and red bumps. GIT00 identified NIIIλ4512, SiIIIλ4565, NV λ4619, HeIIλ4686 and
CIVλ5808 broad emission lines, and a blue bump strongly contaminated by nebular emission.
Even with their high-quality spectrum, the NIIIλ4640 and CIVλ4658 lines appear blended.
In our spectrum of the central region of this galaxy, we can resolve the lines of the blue
bump. We report the presence of CIIIλ5696 and CIVλ5808 broad emission lines due to WC
stars.
NGC 5430: A strong emission feature near 4650A due to WR stars in the spectrum of
c© 2004 RAS, MNRAS 000, 1–25
Massive Star Populations in Wolf-Rayet Galaxies 23
a bright region SE of the galactic center was noted by Kell (1982). He identified NIIIλ4640
and HeIIλ4686 emission lines as coming from WN stars (Kell 1987). No strong emission
features are seen in the IUE spectrum of this source. A relatively older stellar population
appears in the center of NGC 5430. According to Kell (1987), the knot 20′′ southeast of the
nucleus might be a separate galaxy interacting with NGC 5430. For this knot we measure
the NIIIλ4640 and HeIIλ4686 blue bump broad components, as well as the CIIIλ5696 and
CIVλ5808 broad emission lines. A high WR/O ratio of 0.09 is found for NGC 5430.
NGC 5471: This is a massive giant HII region located in M101. Mass-Hesse & Kunth
(1991) found WR-HeIIλ4686/Hβ = 0.02 and a 3.5 Myr burst. NGC 5471 seems to be dom-
inated by a well-defined burst of star formation. A broad HeII emission line (FWHM≃2000
km s−1) was detected in this region by Castaneda et al. (1990) and was confirmed by Mass-
Hesse et al. (1991). We find a low ratio WR/O=0.04 for this galaxy.
NGC 6764: OC82 noted the presence of broad NIIIλ4640 and HeIIλ4686 emission line
features from WR stars. They attributed the 4660A emission line to CIII and not to [FeIII]
forbidden emission. The similarity of the overall emission line spectrum of NGC 6764 to that
of dwarf galaxies and to certain giant HII regions attracted the attention of these authors.
We observed this object at two position angles, 90◦ and 46◦. We find WN and WC stars in
the nuclear region of this galaxy. For both position angles the number of Wolf Rayet stars
is comparable to that of O type stars.
NGC 7714: Weedman et al. (1981) called this object a “prototype starburst” galaxy. van
Breugel et al. (1985) noted the spectral similarity of NGC7714 to Minkowski’s object and
extragalactic HII regions. They reported this galaxy as having weak WR emission features
near HeIIλ4686. Conti (1991) called attention to the importance of NGC 7714 for under-
standing the relation between starbursts and the presence of WR stars in this kind of galaxy.
We found WR stars in two regions of NGC 7714. In the nuclear region we find WR/O =
0.08, while in the secondary HII region, WR/O=0.14. In the nuclear regions we were able
to measure the CIIIλ5696 and CIVλ5808 broad emission lines due to WC stars.
UM48: A systematic search for Wolf-Rayet features in this galaxy was done by Masegosa
et al. (1991). The authors reported the presence of a WR blue bump. They assumed that
the global WR detection rate depends on the metallicity and they analyzed the SN IIe
contribution to the blue bump. They concluded that a large blue bump luminosity should
be expected in regions with SN contamination. We did not detect the NIIIλ4640 broad
emission line in this galaxy. We measure the WC broad emission line CIVλ5808.
c© 2004 RAS, MNRAS 000, 1–25
24 I. F. Fernandes et al.
REFERENCES
Allen, S. W. 1995 MNRAS 276, 947
Aller, D. A., Wright, A. E. & Goss, W. M. 1976 MNRAS 177, 91
Barth, C. S., Cepa, J., Vilchez, J. M., & Dottori, H. A.1994, AJ108, 2069
Bica, E. & Alloin, D. 1986,A&A 162, 21
Brocklehurst, M. 1971, MNRAS, 153, 471
Calzetti, D. 1997 AJ 113, 162
Cardelli, J. A., Clayton, G. C. & Mathis, J. S. 1989 ApJ 345, 245
Castaneda, H. O., Vilchez, J. M. & Copetti, M. V. F. 1990 ApJ, 365, 164
Contini, T., Davoust, E. & Considere, S. 1995 A&A 303,440
Contini, T., Wozniak, H., Considere, S. & Davoust, E. 1997, A&A 324 41
Contini, T., Kunth, D., Mas-Hesse, M. & Arribas, A., 2001 EAS Publications Series, Vol. 1 ”Active Galactic Nuclei in Their
Cosmic Environment”, B. Rocca-Volmerang, H. Sol (eds), EDP Sciences, 1, 163
Contini, T., Treyer, M. A., Sullivan, M. & Ellis, R. S., 2002, MNRAS, 330, 75
Conti, P. S. 1991, ApJ, 377, 115
Dinerstein, H. L. & Shields, G. A. 1986, ApJ, 311, 45
Durret, F. & Tarrab, I. 1988, A&A, 205, 9
Durret, F. 1990, A&A 229, 351
Eckart, A., Cameron, M., Boller, T., Krabbe, A., Blietz, M. & Nakai, N. 1996, ApJ 472, 588
Edmunds, M. G. & Pagel, B. E. J. 1984, MNRAS, 211, 507
Evans, I. N. 1986, ApJ 309, 544
Gil de Paz, A., Aragon-Salamanca, A., Gallego, J. & Alonso-Herrero, A. 2000, MNRAS 316, 357
Gonzalez-Delgado, R. M., Perez, E.; Diaz, A. I.; Garcia-Vargas, M. L., Terlevich, E. & Vilchez, J. M. 1995, ApJ 439, 604
Grevesse, N. & Anders, E. 1989, AIPC,183, 1
revesse, N. & Sauval, A. J. 1998, SSRv 85, 161
Guseva, N. G., Izotov, Y. I. & Thuan, T. X. 2000, ApJ, 531, 776
Heckman, T. M., Gonzalez, R. M. & Leitherer, C., et al., 1997, ApJ, 482, 114
Ho, L. C., Filippenko, A. V. b& Sargent, W. L. 1995, ApJS, 98, 477
Izotov, Y. I., Thuan, T. X. & Lipovetsky, V. A., 1994, ApJ, 435, 647
Izotov, Y. I., Thuan, T. X. & Lipovetsky, V. A., 1997, ApJS, 108, 1
Izotov, Y. I. & Thuan, T. X., 1998, ApJ, 500, 188
Kell, W. C. 1982 PASP, 94, 765
Kell, W. C. 1987 A&A, 172, 43
Kennicutt, R. C. 1983 ApJ, 271, 54
Kewley, L. J., Heisler, C. A., Dopita, M. A. & Lumsden, S. 2001 ApJS 132, 37
Kim, D.-C., Sanders, D. B., Veilleux, S., Mazzarella, J. M. & Soifer, B. T. 1995 ApJS 98, 129
Kim, D.-C., Veilleux, S. & Sanders, D. B. 1998 ApJ 508, 627
Kobulnicky, H. A., Kennicutt Jr., R. C. & Pizagno, J. L. 1999 ApJ 514, 544
Kovo, O. & Contini, T. 1999 IAUS 193, 604
Kunth, D. & Joubert, M. 1985 A&A 142, 411
Leitherer, C., Schaerer, D., Goldader, J. D., Delgado, R. M. G., Robert, C., Kune, D. F., de Mello, D. F., Devost, D. &
Heckman, T. M. 1999 ApJS 123, 3
Leitherer, C., Li, I.-H., Calzetti, D.& Heckman, T. M. 2002 ApJS 140, 303
Lanfranchi, G. A. & Friaa, A. C. S. 2003 MNRAS 343, 481
Maeder, A. 1991, A&A 242,93
c© 2004 RAS, MNRAS 000, 1–25

Massive Star Populations in Wolf-Rayet Galaxies 25
Maeder, A. & Conti, P. S., 1994, ARA&A 295, 171
Maeder, A. & Meynet, G., 1994, A&A 287, 816
Masegosa, J., Moles, M., & del Olmo, A. 1991, A&A, 244, 273
Mas-Hesse, J. M. & Kunth, D., 1991, A&A 88, 399
Mattila, S. & Meikle, W. P. S. 2001, MNRAS 324, 325
McCall, L. M., Rybski, P. M., & Shields, G. A. 1985, ApJS, 57,1
McCall, L. M. 1984 MNRAS, 208, 253
McGaugh, S. S. 1991 ApJ, 380, 140
Meynet, G., 1995, A&A 298, 767
Oke, J. B. & Gunn, J. E. 1982, PASP, 94, 586
Oliva, E., Origlia, L., Maiolino, R. & Moorwood, A. F. M. 1999, A&A 350, 9
Origlia, L., Goldader, J. D., Leitherer, C.; Schaerer, D. & Oliva, E. 1999, ApJ 514, 96
Osterbrock, D. E. & Cohen, R. D., 1982, ApJ 261, 64
Osterbrock, D. E. 1989, Astrophysics of Gaseous Nebulae and Active Galactic Nuclei
Pagel, B. E. J., Edmunds, M. G., Blackwell D. E., Chun, M. S. & Smith, G. 1979, MNRAS 189,95
Peimbert, M. & Costero, R. 1969 BOTT 5, 3
Peimbert, M., Sarmiento, A.& Fierro, J. 1991 PASP 103, 815
Pettini, M. & Pagel, B. E. J. 2004 MNRAS 348,59
Pidao, M., Schaerer, D., Gonzales-Delgado, R. M. & Stasinska, G. 2002 A&A 394, 443
Pilyugin, L. S. 2000 A&A 362, 325
Pilyugin, L. S. 2001 A&A 369, 594
Pilyugin, L. S. 2001 A&A 374, 412
Rosa, M. R. & Benvenuti, P. 1994, A&A 291 1
Salzer, J. J., MacAlpine, G. M., & Boroson, T. A. 1989, AJ, 70, 477
Shaerer, D.; Contini, T. & Kunth, D. 1999, A&A, 341, 399
Shaerer, D.; Contini, T. & Pindao, M. 1999, A&A, 136, 35
Shaerer, D. Guseva, N. G., Izotov, Y. I. & Thuan, T. X. 2000, A&A, 362, 53
Shaerer, D. & Vacca, W. D. 1998, ApJ, 497, 618
Steigman G.; Viegas, S. M. & Greenwald, R. 1997 ApJ 490,187
Schmitt, H.; Storchi-Bergmann, T. & Cid Fernandes, R. 1998 AAS 193 608
Sugai, H. & Taniguchi, Y. 1992, AJ 103 1470
Vacca, W. D. & Conti, P. S. 1992, ApJ 401, 543
Vacca, W. D. 1994, ApJ, 421, 140
van Breugel, W., Filippenko, A. V., Heckman, T. & Miley, G. 1985 ApJ 293, 83
Veilleux, S. & Osterbrock D. E. 1987 ApJS 63, 295
Vogel, S., Engels, D., Hagen, H.-J., Groote, D., Wisotzki, L. & Cordis, L. 1993, A&AS 98, 193
Weedman, D. W., Feldman, F. R., Balzano, V. A., Ramsey, L. W., Sramek, R. A. & Wuu, C.-C. 1981 ApJ 248, 105
This paper has been produced using the Royal Astronomical Society/Blackwell Science LATEX
style file.
c© 2004 RAS, MNRAS 000, 1–25
26 I. F. Fernandes et al.
(a) (b)
(c) (d)
c© 2004 RAS, MNRAS 000, 1–25
Massive Star Populations in Wolf-Rayet Galaxies 27
(e) (f)
(g) (h)
Figure 1. DSS images of galaxies with slit positions. (a) Fairall 44, (b) III Zw 107, (c) Mrk 309, (d)Mrk 475, (e) Mrk 712, (f)Mrk 1271, (g) NGC 450, (h) NGC 4385. The horizontal bar at the lower left indicates 0.5 arcminutes.
c© 2004 RAS, MNRAS 000, 1–25

28 I. F. Fernandes et al.
(i) (j)
(k) (l)
c© 2004 RAS, MNRAS 000, 1–25
Massive Star Populations in Wolf-Rayet Galaxies 29
(m) (n)
(o)
Figure 1. Continued. DSS images of galaxies with slit positions. (i) NGC 4861,(j) NGC 5430, (k) NGC 5471, (l) NGC 6764P.A. 67, (m) NGC 6764 P.A. 90, (n) NGC 7714 and (o) UM48. The horizontal bar at the lower left indicates 0.5 arcminutes.
c© 2004 RAS, MNRAS 000, 1–25
30 I. F. Fernandes et al.
Figure 2. Top: Comparison of the values of E(B-V) adopted in this work and those obtained by other authors. The dashedline shows a relation of unity. Bottom: The difference between the values adopted in this work and those obtained by otherauthors.
c© 2004 RAS, MNRAS 000, 1–25
Massive Star Populations in Wolf-Rayet Galaxies 31
Figure 3. The diagnostic diagram of [OIII]λ5007/Hβ plotted against [OI]λ6300/Hα.The solid line shows the border betweenstarburst and AGNs ionization mechanisms. The dashed lines show the model uncertainty of 0.1 dex.
c© 2004 RAS, MNRAS 000, 1–25

32 I. F. Fernandes et al.
Figure 4. The diagnostic diagram of [OIII]λ5007/Hβ plotted against [NII]λ6584/Hα.The solid line shows the border betweenstarburst and AGNs ionization mechanisms. The dashed lines show the model uncertainty of 0.1 dex.
c© 2004 RAS, MNRAS 000, 1–25
Massive Star Populations in Wolf-Rayet Galaxies 33
Figure 5. Comparison between the values of 12 + log(O/H) obtained with the Te method and other methods used in thiswork. The median offset and σ for each relation are noted in each panel. The R23 and R3 calibrations of Pilyugin are shownseparately on the left.
c© 2004 RAS, MNRAS 000, 1–25

34 I. F. Fernandes et al.
Figure 6. Top: Comparison of the values of 12 + log(O/H) adopted in this work and those obtained by other authors. Thedashed line shows a relation of unity. Bottom: The difference between the values obtained by other authors and those adoptedin this work.
c© 2004 RAS, MNRAS 000, 1–25

Massive Star Populations in Wolf-Rayet Galaxies 35
Figure 7. Enlargement of blue and red bump spectral regions of galaxies where the broad lines HeIIλ4686 and CIVλ5808 arevisible.
c© 2004 RAS, MNRAS 000, 1–25

36 I. F. Fernandes et al.
Figure 7. Continued.
c© 2004 RAS, MNRAS 000, 1–25
Massive Star Populations in Wolf-Rayet Galaxies 37
Figure 7. Continued.
c© 2004 RAS, MNRAS 000, 1–25
38 I. F. Fernandes et al.
Figure 8. NWR/NO versus 12 + log(O/H) for the galaxies in our sample. Predictions of Schaerer & Vacca (1998) models forinstantaneous bursts (solid line), and of Starburst 99 (Leitherer et al. 1999) for extended burts of star formation of 2 and 4Myrs. (dashed line) are overplotted. The lines are labeled with the IMF slopes.
c© 2004 RAS, MNRAS 000, 1–25
Massive Star Populations in Wolf-Rayet Galaxies 39
Figure 9. NWC/NWN versus 12 + log(O/H) for the high metallicity galaxies in our sample. Predictions of Schaerer & Vacca(1998) models for maximum value for instantaneous bursts (solid line), and SGIT00 extended bursts of 2 - 4 Myrs (dashedlines) are overplotted. The dot-dashed line (bottom right) shows the observed trend of WC/WN with metallicity in LocalGroup galaxies derived empirically from observations by Massey & Johnson (1998).
c© 2004 RAS, MNRAS 000, 1–25
40 I. F. Fernandes et al.
Figure 10. Spectral region showing TiO bands (∼ λ6250) and narrow FeI+BaII+CaI λ6495 for the high-metallicity galaxiesNGC 4385, NGC 5430, NGC 6764 (P.A. 67 and 90) NGC 5471 and UM 48.
c© 2004 RAS, MNRAS 000, 1–25