arXiv:astro-ph/0012455v1 21 Dec 2000
15
arXiv:astro-ph/0012455v1 21 Dec 2000 SUPERNOVA TYPES AND RATES * Enrico Cappellaro [email protected] Massimo Turatto [email protected] Osservatorio Astronomico di Padova vicolo dell’Osservatorio, 5 I-35122, Padova (Italy) Abstract We review the basic properties of the different supernova types identi- fied in the current taxonomy, with emphasis on the more recent devel- opments. To help orienting in the variegate zoo, the optical photometric and spectroscopic properties of the different supernova types are pre- sented in a number of summary figures. We also report the latest estimates of the supernova rates and stress the need for a dedicated effort to measure SN rates at high redshift. 1. INTRODUCTION Supernovae (SNe) are at the confluence of many different streams of astronomical researches. As the final episode of the life of many kinds of stars, SNe allow crucial tests of stellar evolution theories. Yet, in many cases we are still entangled with the basic problem of finding a viable progenitor scenario for each SN type. During and immediately after the explosions, there are a variety of fundamental physical mechanisms which can be probed, such as neutrino and gravitational wave emissions, flame propagation and explosive nucleosynthesis, radioactive decays and shocks with circumstellar matter. Relics of the explosions are collapsed remnants, neutron stars or black holes, and expanding gas clouds which ∗ Most of the material presented in this paper has been retrieved from the Padova Archive of SN observations. This is the product of a long standing effort for the monitoring of SNe conducted using ESO-La Silla and Asiago telescopes (Turatto et al. 1990). 1
Transcript of arXiv:astro-ph/0012455v1 21 Dec 2000

arX
iv:a
stro
-ph/
0012
455v
1 2
1 D
ec 2
000
SUPERNOVA TYPES AND RATES ∗
Enrico [email protected]
Massimo [email protected]
Osservatorio Astronomico di Padova
vicolo dell’Osservatorio, 5
I-35122, Padova (Italy)
Abstract We review the basic properties of the different supernova types identi-fied in the current taxonomy, with emphasis on the more recent devel-opments. To help orienting in the variegate zoo, the optical photometricand spectroscopic properties of the different supernova types are pre-sented in a number of summary figures.
We also report the latest estimates of the supernova rates and stressthe need for a dedicated effort to measure SN rates at high redshift.
1. INTRODUCTION
Supernovae (SNe) are at the confluence of many different streams ofastronomical researches. As the final episode of the life of many kinds ofstars, SNe allow crucial tests of stellar evolution theories. Yet, in manycases we are still entangled with the basic problem of finding a viableprogenitor scenario for each SN type. During and immediately afterthe explosions, there are a variety of fundamental physical mechanismswhich can be probed, such as neutrino and gravitational wave emissions,flame propagation and explosive nucleosynthesis, radioactive decays andshocks with circumstellar matter. Relics of the explosions are collapsedremnants, neutron stars or black holes, and expanding gas clouds which
∗Most of the material presented in this paper has been retrieved from the Padova Archiveof SN observations. This is the product of a long standing effort for the monitoring of SNeconducted using ESO-La Silla and Asiago telescopes (Turatto et al. 1990).
1

2
Ia
+10 months
Ib
II
max.
Figure 1. Basic SN types spectra. A SN which near maximum (left panel) showsclear signature of Hα is defined as type II, if it shows a strong SiII absorption atabout 6150 A is a type Ia, otherwise it is of type Ib/c (in the figure we show a SNIbcharacterized by strong He lines). Ten months later (right panel) SN Ia show strongemissions of [FeII] and [FeIII], SN Ib/c are dominated by [CaII] and [OI]. These samelines and strong Hα emission are typical of SNII.
heat and pollute the interstellar medium. Indeed, SNe are a main agentin the chemical evolution of galaxies.
Moreover, because of their huge luminosity and the fact that they canbe accurately calibrated, type Ia SNe are the best distance indicatorsfor measuring the geometry of the Universe.
For all these reasons, in the last decades there has been an increasedinterest in SN studies and a renewed effort in SN searches. As a conse-quence, the number of SN discoveries has increased from about 20/yr inthe early ’80, to about 200/yr in the last few years raising the numberof SNe discovered to date to ∼ 1800 (Barbon et al. 1999;http://merlino.pd.astro.it/~supern/ for a frequently updated ver-sion). It is not surprising that the enlarged sample combined with thebetter quality of the observations obtained by the new generation in-struments is deeply changing our understanding of the SN phenomenon.

Supernova types and rates 3
The aim of this paper is to give a snapshot of the SN zoo includingthe latest acquisitions. Other information can be found in Filippenko(1997), Wheeler and Benetti (2000) and reference therein. We will alsopresent the latest estimates of the SN rates which are fundamental tolink the evolution of stars and stellar systems.
2. BASIC SN TYPES
The affair of SN classification began with Minkowskii (1941) who no-ticed that there are at least two different kinds of SNe, showing (typeII) and not showing (type I) H in their spectra.
This subdivision was maintained until, in the ’80s, it was recognizedthat a number of peculiar SN I missing in the spectrum near maximumthe typical feature at ∼ 6510 A, had a completely different nebularspectrum dominated by forbidden Ca and O emissions instead of Felines (Gaskell et al. 1986). Examining more carefully the near maximumspectra it was noticed that these SNe come in at least two flavors: thoseshowing strong He lines were labeled Ib, the others Ic. We will arguelater however that this subdivision is at a lower hierarchical level. Thefirst branch of the SN classification is illustrated in Fig. 1.
In general, in the early phases the optical depth of the ejecta re-mains high and the emergent spectrum only probes the outermost layers.Therefore the early spectrum is most sensitive to variations in the den-sity and composition of the progenitor envelope. With time the densityand temperature decrease, the photosphere recedes in mass coordinatesand eventually the ejecta becomes optically thin. At this point the in-nermost regions becomes exposed and the yields of the explosions canbe probed. The fact that the nebular spectrum of SN Ib/c is similar tothat of SN II, but for the H emission, prompts for a similar explosionmechanism. Instead, the weakness of intermediate element emissions,in particular O, in the nebular spectrum of SN Ia excludes that theprogenitors of SN Ia are massive stars.
The SN taxonomy which originally was based on spectra near maxi-mum may result somewhat confusing when one try to build a coherentprogenitor scenario: indeed a more physical classification could be basedon the distinction between SNe arising from the collapse of massive stars(SNII and SNIb/c) and SNe due to thermonuclear explosions of low massstars (SN Ia). In the following we will give a brief description of the char-acteristics of each SN type describing the detailed taxonomy illustratedin Fig. 2.

4
days
mag mag
early phase
profileline
curve
late phaseHe light
Supernova taxonomy
Hypernovae
H
Siλ λ λ
daysIIb
II PIb
I
Ic II L
II
IInIa
Figure 2. The detailed classification of SNe requires not only the identificationof specific features in the early spectra, but also the analysis of the line profiles,luminosity and spectral evolutions
3. TYPE IA SNE
SN Ia are quite homogeneous events with similar luminosity and spec-tral evolution. Indeed until the early ’90s, it was commonly acceptedthat SN Ia were identical and that observed differences were mainly dueto observational errors (e.g Leibundgut & Tammann 1990). With theimprovement of the signal to noise of the observations it was definitelydemonstrated that differences do exist. In particular, though the lightcurve shapes remain similar, the absolute luminosities and the declinerates are different (Fig. 3). Actually, a relation has been found betweenthe rate of the luminosity decline and the absolute magnitudes at maxi-mum, with fast declining SNe being fainter (and redder). Because this iscrucial for recovering SN Ia as distance indicators, a large efforts is beingdevoted to the accurate calibration of the different expressions of thisrelation (Phillips et al. 1999, Riess et al. 1998, Perlmutter et al. 1999).To some extent, the spread in luminosity correlates with variations inthe spectral properties (Nugent et al. 1995). As shown in Fig. 4, very

Supernova types and rates 5
Figure 3. Light curves of 87 SN Ia relative to the phase and magnitude of maximum.The symbols identify objects with different ∆m15(B), the magnitude decline in theearly 15 days (Altavilla 2000).
bright or very faint SNe show distinctive spectral features, whereas thedifferences among “normal” SN Ia stand out only after a careful analysis.
It is generally agreed that the difference in luminosity call for oneorder of magnitude variance in the mass of the radioactive 56Ni whichis powering the early light curve. Controversial is the claim that lightcurves and spectral synthesis models require a factor two in the totalprogenitor mass (Cappellaro et al. 1997). The standard scenario for theSN Ia explosion consists of a binary system where one of the star is awhite dwarf (WD) which accretes matter for the secondary star, reachesthe Chandrasekhar limit, and undergoes a disruptive, thermonuclearexplosion (Nomoto et al. 1984,Woosley &Weaver 1986). It is still unclearwhether it is possible to reproduce the observed variance of SN Ia withinthe standard scenario (Mazzali et al. 2000).

6
15
1991T
1990N
1994D
1992A
1991bg
fain
tbr
ight
2 m
agbr
ight
0.7 M
1.4 M
1.4 M
1.4 M
2.0 M
o
o
m (B)
o
o
o
0.1 M
0.4 M
0.6 M
0.8 M
1.0 M
o
o
o
o
o
56Ni mass mass
total
0.94
1.07
1.31
1.95
1.47
SN Ia
∆
Figure 4. Comparison of the maximum light spectra of SN Ia with different declinerates (left), hence luminosities. On the right the ranges in 56Ni and total massessuggested by light curve and spectral synthesis models are indicated.
An interesting finding in this respect is that on average SN Ia in earlytype galaxies show a faster decline rate (hence are less luminous) thanSN Ia in late type galaxies (Fig. 5, cf. van den Bergh & Pazder(1992),Hamuy et al.(2000)). This suggests that (some of) the variance of SN Iais related to different ages of the progenitor population. Until this isnot well understood, a severe caveat remains on the use of SN Ia ascosmological distance indicators.
4. TYPE II SNE
One might say that the only thing in common for SN II is the presenceof H lines in the spectra. Indeed the maximum luminosities range overtwo orders of magnitudes and the spectral energy distributions and lineprofiles also shows dramatic differences. Historically, the first attemptto sort out some order was based on the light curve shapes (Barbon etal. 1979). In some cases, SN II after maximum remain on a plateauof almost constant luminosity for periods up to 2-3 months (II-P), in

Supernova types and rates 7
Figure 5. Histogram of ∆m15(B) for SN Ia in early type galaxies (upper panel)and in late type galaxies (lower panel). A Kolmogorov-Smirnov test shows that theprobability that the two distributions derive from the same population is only 0.004(Altavilla 2000).
other cases they decline more or less linearly (II-L). The two classes arenot separated and intermediate cases do exist (Clocchiatti et al. 1996).An extreme case of SN II-P is usually considered SN 1987A, the bestobserved SN ever, which after maximum showed a steadily increase ofmagnitude, lasting abound 3 months, until eventually the decline began(Fig. 6).
In general, it is assumed that SNII-L are brighter than SN IIP, butthere are many exceptions (Patat et al. 1994), e.g. SN 1983K the brightII- P shown in Fig. 6. At late time (> 200 d), many SN II settle on alinear decline rate of about 1 mag/100d. This is powered by the secondbranch of the radioactive decay chain 56Ni–56Co–56Fe. The fact that,despite the enormous difference at maximum, SN II at late time convergeto a similar luminosity was taken as an indication that the 56Ni massproduced in SN II was very similar, namely ∼ 0.1 M⊙ (Turatto et al.1990). Actually, even in this respect there may be significant variations (Schmidt et al. 1994). An extreme case is that of SN 1997D (Fig. 6) whichproduced only 0.002 M⊙ of 56Ni and showed extremely low expansionvelocities (Turatto et al. 1998).
8
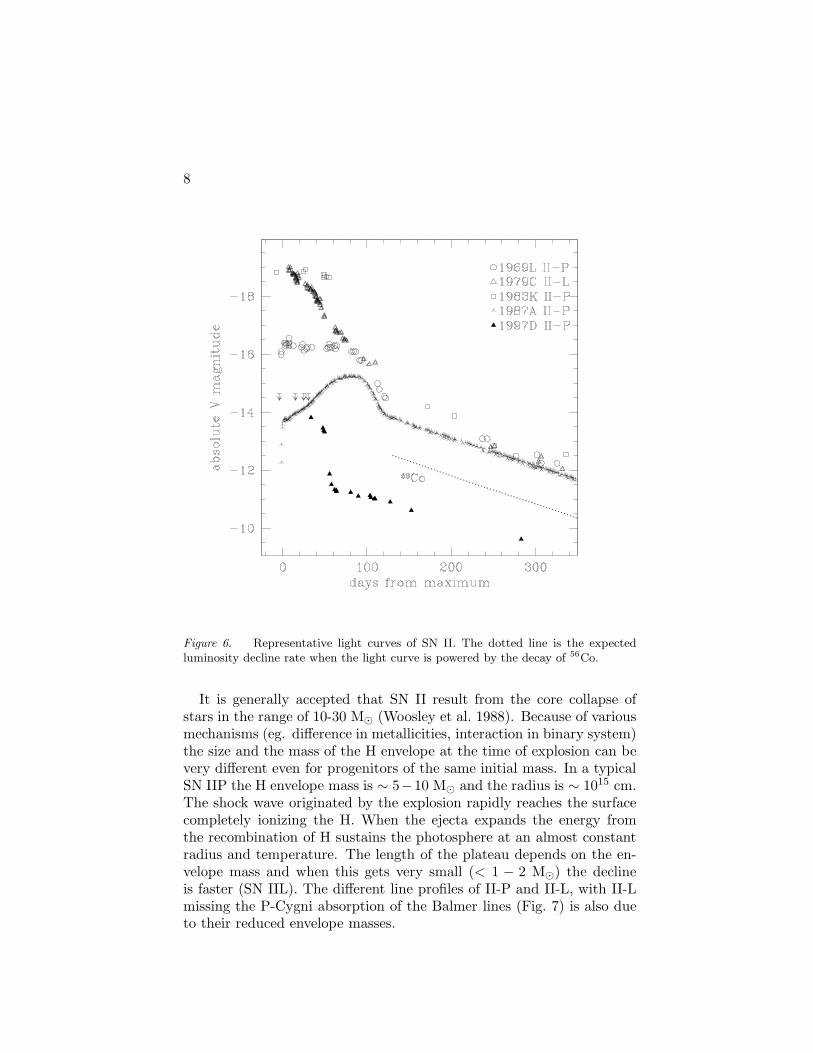
Figure 6. Representative light curves of SN II. The dotted line is the expectedluminosity decline rate when the light curve is powered by the decay of 56Co.
It is generally accepted that SN II result from the core collapse ofstars in the range of 10-30 M⊙ (Woosley et al. 1988). Because of variousmechanisms (eg. difference in metallicities, interaction in binary system)the size and the mass of the H envelope at the time of explosion can bevery different even for progenitors of the same initial mass. In a typicalSN IIP the H envelope mass is ∼ 5−10 M⊙ and the radius is ∼ 1015 cm.The shock wave originated by the explosion rapidly reaches the surfacecompletely ionizing the H. When the ejecta expands the energy fromthe recombination of H sustains the photosphere at an almost constantradius and temperature. The length of the plateau depends on the en-velope mass and when this gets very small (< 1 − 2 M⊙) the declineis faster (SN IIL). The different line profiles of II-P and II-L, with II-Lmissing the P-Cygni absorption of the Balmer lines (Fig. 7) is also dueto their reduced envelope masses.

Supernova types and rates 9
o
1987A
1980K
1988Z
1993J
IIn
IIP
IIb
IIL
1997cy
=GRB970514?IIpec ?−3M
Ni56
total ejecta (H)
0.07M
0.07Mo
o
? Mo
0.08M
o
o
10Mo
o25M
13Mo
o20M
o5M (1)
(10)o15M
8,30Mo o1,15M
o5M
(0.2)2.5M
SN II
Figure 7. Representative spectra of SN II. On the right we report for each objectthe best estimate of the 56Ni, total and ejecta masses (in parenthesis is the H massin the ejecta).
Instead the early luminosity depends on the radius of the progenitorstar at the time of explosion. If the progenitor was compact, 1012 cm inthe case of SN 1987A, much of the available energy is dissipated for theexpansion and until the radioactive decay input becomes dominant, theluminosity remains lower than in the case of an extended progenitor.
In most cases, the remnant of the explosion is expected to be a neutronstars, but it has been argued that the unusual properties of SN 1997Dmay be understood if the collapsed remnant is a black hole (Turatto etal. 1998).
In general, because of the very high expansion velocity, the emissionlines in the SN spectra are very broad but for possible contaminationof interstellar gas emissions. A significant fraction of SN II (10 − 15 %of the SN II currently discovered) show narrow components on top ofbroader emissions (Fig. 7). These SNe are labeled IIn, where “n” standsfor narrow–line (Schlegel 1990). It turns out that in many cases SN IInare very bright and their luminosity evolution is much slower than otherSN II (Fig. 8). Therefore, an additional source of energy powering the

10
Figure 8. Representative light curves of SN IIn are compared with that of a SN II-Pand of a SN Ia. The dotted line is as in Fig. 6
light curve in addition to the radioactive decay is required. It is currentlybelieved that the kinetic energy of the ejecta is converted into radiationwhen the ejecta shock a dense circumstellar medium (CSM) (Aretxagaet al. 1999). This dense CSM is most likely a relic of a strong mass lossepisodes occurring shortly before explosion. Differences in density anddistribution of the CSM might explain the large variance of luminosityevolution between different SN IIn.
A most interesting case is that of SN 1997cy for its possible associationwith GRB970514. Because of the emission line profile (Fig. 7), we believethat also in this case the CSM-ejecta interaction is powering the lightcurve (Fig.8) and a huge Ni mass is not required (Turatto et al. 2000).

Supernova types and rates 11
Figure 9. Representative light curves of SN Ib/c.
5. TYPE IB/C SNE
The explosion of SN 1993J in M81 was the missing link between SNeof type II and Ib/c. The spectrum of this SN evolved from that of arather normal type II to that of a type Ib in few weeks. The objectis therefore classified as the prototype of the intermediate class of SNIIb. Its observed properties have been explained with the explosion of amassive progenitor with a very small H envelope (0.2 M⊙). It is believedthat if the exploding star was left without the H envelope, the SN wouldappear as a typical SNIb. If even the He shell was removed the resultwill closely match the observational properties of type Ic. Other casesof SN Ic in which is detected a small amounts of H in the ejecta arereported in the literature (cf. Filippenko 1992; 2000H, Pastorello etal. 2000). There are also intermediate cases between type Ib and Ic inwhich residual amounts of He have been detected (eg. Filippenko et

12
1993J
=GRB980524
Ib
Ic/IIb
IIb
Ic
12−15M
1998bw
2000H
1994I
1984L 13−18Moo
o
0.1Mo0.2M{ 50Mo
o>10M2−3M
Ic 0.07M
SN Ib/c
o
{
o15M o1M
o
o
o
o
o
o
o0.08M
0.2M 15M40M
2M15M
o o 2.5M
56Nimass massmass
total ejecta
0.7M
Figure 10. Representative spectra of SNIb/c. On the right the best estimates of the56Ni, total and ejecta masses are reported . In some case different modeling producessignificantly different results.
al. 1995). These considerations have motivated the introduction of aunifying scenario where the sequence Ic-Ib-IIb-IIL has mass loss as thedriving parameter (Nomoto et al. 1996). At the moment the mechanismfor this huge mass loss has not yet been identified, although interactionin close binary systems is the first candidate.
One additional complication is that there are SN Ib/c in which the latelight curves seem to track the radioactive decay of 56Co (eg. SN 1984L)and other showing a luminosity decline similar or even faster than thatof SN Ia (Fig. 9). Because in all cases it is believed that radioactive56Co is present, one must admit that the trapping of the γ-rays from56Co is different which in turn call for a much smaller ejecta mass infast declining SNIb/c than in the slow declining ones. A summary ofthe 56Ni and ejecta masses for some SNIb/c is reported in Fig. 10
More recently two unusual SNe were discovered (SN 1997ef and 1998bw)that, although formally classified as type Ic because they miss the 6150A dip of SNIa, the H line of type II and the He lines of type Ib, showindeed a very peculiar spectrum (Fig. 10). This is the result of an ex-
Supernova types and rates 13
tremely high expansion velocities and in turn, of high explosion energy(Iwamoto et al. 1998, 2000). Most interesting is the case of SN 1998bwbecause of his close association with GRB250498 (Patat et al. 2000) Be-cause of these extreme characteristics these SNe, along with SN 1997cymentioned in the previous section, are often referred as hypernovae andmay indeed require specific progenitor scenarios and explosion mecha-nism.
6. SN RATES
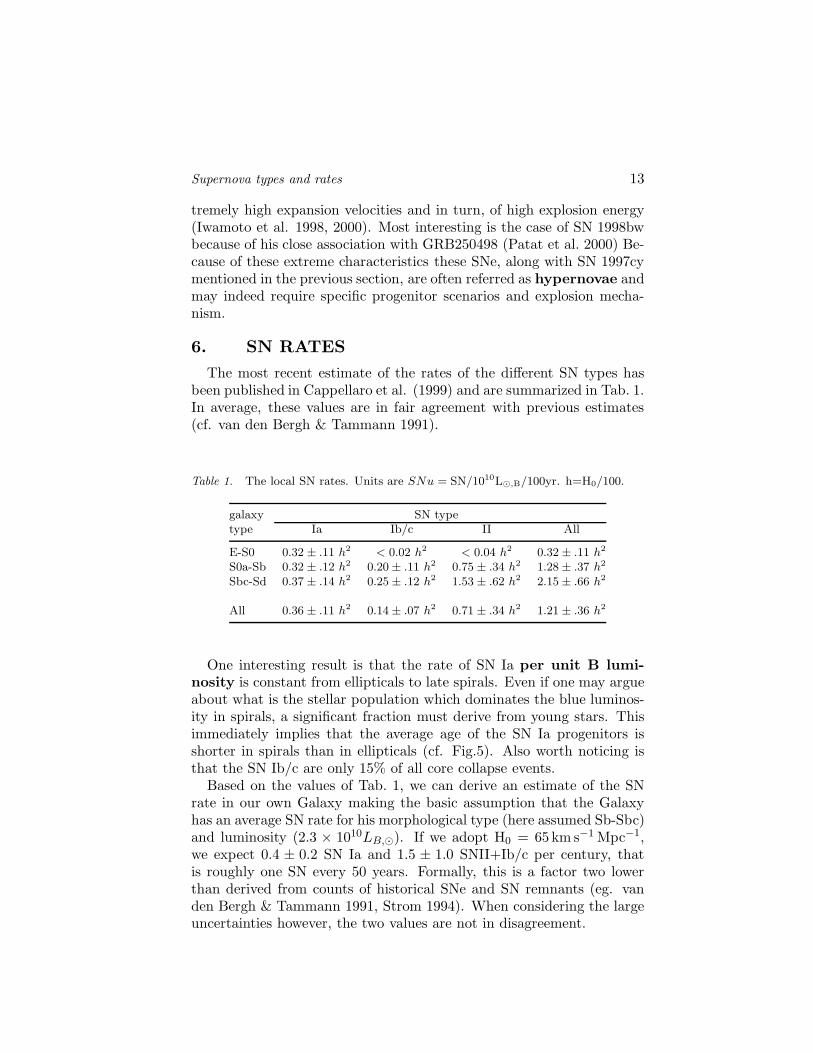
The most recent estimate of the rates of the different SN types hasbeen published in Cappellaro et al. (1999) and are summarized in Tab. 1.In average, these values are in fair agreement with previous estimates(cf. van den Bergh & Tammann 1991).
Table 1. The local SN rates. Units are SNu = SN/1010L⊙,B/100yr. h=H0/100.
galaxy SN typetype Ia Ib/c II All
E-S0 0.32 ± .11 h2 < 0.02 h2 < 0.04 h2 0.32± .11 h2
S0a-Sb 0.32 ± .12 h2 0.20± .11 h2 0.75 ± .34 h2 1.28± .37 h2
Sbc-Sd 0.37 ± .14 h2 0.25± .12 h2 1.53 ± .62 h2 2.15± .66 h2
All 0.36 ± .11 h2 0.14± .07 h2 0.71 ± .34 h2 1.21± .36 h2
One interesting result is that the rate of SN Ia per unit B lumi-nosity is constant from ellipticals to late spirals. Even if one may argueabout what is the stellar population which dominates the blue luminos-ity in spirals, a significant fraction must derive from young stars. Thisimmediately implies that the average age of the SN Ia progenitors isshorter in spirals than in ellipticals (cf. Fig.5). Also worth noticing isthat the SN Ib/c are only 15% of all core collapse events.
Based on the values of Tab. 1, we can derive an estimate of the SNrate in our own Galaxy making the basic assumption that the Galaxyhas an average SN rate for his morphological type (here assumed Sb-Sbc)and luminosity (2.3 × 10¹⁰LB,⊙). If we adopt H0 = 65km s−1 Mpc−1,we expect 0.4 ± 0.2 SN Ia and 1.5 ± 1.0 SNII+Ib/c per century, thatis roughly one SN every 50 years. Formally, this is a factor two lowerthan derived from counts of historical SNe and SN remnants (eg. vanden Bergh & Tammann 1991, Strom 1994). When considering the largeuncertainties however, the two values are not in disagreement.

14
For what concerns the SN rate in the local Universe, we have nowreached the point where the statistics is no longer limited by the SNdiscoveries but by the sample of galaxies for which the necessary infor-mation (distance, luminosity, morphological types and inclination) areavailable. In other words, to improve significantly the statistical accu-racy of the results, one needs not only to continue SN searches but alsoto obtain more complete galaxy catalogues.
A major effort is still required, instead, in “un-biased” SN search athigh redshift. In fact, the evolution of the SN rate with redshift bringsunique information on the progenitor scenarios, galaxy star formationhistory and initial mass function (eg. Yungelson & Livio 2000, Dahlen& Fransson, C. 1999).
Table 2. Estimate of SN rates at different redshift. h = H/100
< z > Ia II N(SN) sourceh2 SNu h2 SNu
0.01 0.36± 0.10 0.85 ± 0.41 137 Cappellaro et al. 19990.1 0.44+.0.35
−0.21 4 hardin0.38 0.82+.0.65
−0.45 3 Pain et al. 1996
0.55 0.62± 0.19 38 Pain et al. 2000#
# Not yet published. Reported in Ruiz-Lapuente & Canal 2000.
Current high-z SN searches are aimed to the discovery of SN Ia fortheir use as distance indicators. By construction, they are not wellsuited for estimating SN rates. This is obvious from Tab. 2 where welist all observational estimates of SN rates available at “high” redshiftand compare them with the local estimates. In this table N(SN) gives thestatistics of SNe on which the estimate is based. The very low statisticsand the fact that there is not an estimate yet for core-collapse SN rateoutside the local Universe is a clear indication of the work to be done.
References
Altavilla, G., 2000, Thesis Universita’ di Padova.
Aretxaga I., Benetti S., Terlevich R. J., Fabian A. C., Cappellaro E., Turatto M.,della Valle M., 1999, MNRAS, 309, 343
Barbon R., Ciatti F., Rosino L., 1979, A&A, 72, 287
Barbon R., Buondi V., Cappellaro E., Turatto M., 1999, A&A Suppl., 139, 531
Cappellaro E., Mazzali P. A., Benetti S., Danziger I. J., Turatto M., della Valle M.,Patat F., 1997, A&A, 328, 203
Cappellaro E., Evans R., Turatto M., 1999, A&A, 351, 459
Clocchiatti A., Benetti S., Wheeler J. C., et al., 1996, AJ, 111, 1286

REFERENCES 15
Dahlen, T., Fransson, C.: 1999 A&A350 359.
Filippenko A. V., 1992, ApJL, 384, L37
Fillipenko A. V., 1997, ARA&A, 35, 309
Filippenko A. V., Barth A. J., Matheson T., et al., 1995, ApJL, 450, L11
Gaskell C. M., Cappellaro E., Dinerstein H. L., Garnett D. R., Harkness R. P., WheelerJ. C., 1986, ApJL, 306, L77
Hamuy, M., Trager, S. C., Pinto, P. A., Phillips, M. M., Schommer, R. A., Ivanov, V.& Suntzeff, N. B. 2000, AJ, 120, 1479
Hardin, D., Afonso, C., Alard, C. et al, 2000 A&Ain press (astro-ph 0006424)
Iwamoto K., Mazzali P. A., Nomoto K., et al., 1998, Nature, 395, 672
Iwamoto K., Nakamura T., Nomoto K., et al., 2000, ApJ, 534, 660
Leibundgut B., Tammann G. A., 1990, A&A, 230, 81
Mazzali, P.A., Nomoto, K., Cappellaro, E., Nakamura, Y., Umeda, H., Iwamoto, K.,2000, ApJin press (astro-ph/0009490)
Minkowski R., 1941, PASP, 53, 224
Nomoto K., Thielemann F. -., Yokoi K., 1984, ApJ, 286, 644
Nomoto K., Iwamoto K., Suzuki T., Pols O. R., Yamaoka H., Hashimoto M., HoflichP., van den Heuvel E. P. J., 1996, IAU Symp. 165: Compact Stars in Binaries, 165,119
Pain R., Hook I. M., Deustua S., et al., 1996, ApJ, 473, 356
Nugent P., Phillips M., Baron E., Branch D., Hauschildt P., 1995, ApJL, 455, L147
Pastorello, A., Altavilla, G., Cappellaro, E., Turatto, M., Benetti S., 2000. IAU Cir-cular 7367.
Patat F., Barbon R., Cappellaro E., Turatto M., 1994, A&A, 282, 731
Patat, F., Cappellaro, E., Mazzali, P.A., et al., 2000, ApJin press
Perlmutter S., Aldering G., Goldhaber G., et al., 1999, ApJ, 517, 565
Phillips M. M., Lira P., Suntzeff N. B., Schommer R. A., Hamuy M., Maza J. ;, 1999,AJ, 118, 1766
Riess A. G., Filippenko A. V., Challis P., et al., 1998, AJ, 116, 1009
Ruiz-Lapuente, P., Canal, R., 2000, ApJLsubmitted (astro-ph 0009312)
Schmidt B. P., Kirshner R. P., Eastman R. G., et al., 1994, AJ, 107, 1444
Schlegel E. M., 1990, MNRAS, 244, 269
Strom R. G., 1994, A&A, 288, L1
Turatto M., Bouchet P., Cappellaro E., Danziger, I. J., della Valle, M., Frabsson, C.,Gouiffes, C., Lucy, L., Mazzali, P., Phillips, M., 1990, The Messenger, 60, 15
Turatto M., Cappellaro E., Barbon R., della Valle M., Ortolani S., Rosino L., 1990,AJ, 100, 771
Turatto M., Mazzali P. A., Young T. R., et al., 1998, ApJL, 498, L129
Turatto M., Suzuki T., Mazzali P. A., et al., 2000, ApJL, 534, L57
van den Bergh, S. & Pazder, J. 1992, ApJ, 390, 34
van den Bergh S., Tammann G. A., 1991, ARA&A, 29, 363
Wheeler, J. C., Benetti, S., in Allen’s astrophysical quantities, 4th ed. Publisher: NewYork: AIP Press; Springer, 2000.A. N. Cox.ed. p. 451.
Woosley S. E., Weaver T. A., 1986, ARA&A, 24, 205
Woosley S. E., Pinto P. A., Ensman L., 1988, ApJ, 324, 466
Yungelson, L., Livio, M.: 2000 ApJ528 108.