ArtPrize 2013' Economic Impact and Attendee Profile · 2014-01-29 · The economic impact from...
53
January 9, 2014 © Anderson Economic Group, LLC, 2014 Permission to reproduce in entirety granted with proper citation. All other rights reserved. Anderson Economic Group, LLC East Lansing | Chicago www.AndersonEconomicGroup.com ArtPrize 2013: Economic Impact and Attendee Profile Commissioned by: Prepared by: Anderson Economic Group, LLC Scott D. Watkins Lauren E. Branneman Tyler M. Theile
Transcript of ArtPrize 2013' Economic Impact and Attendee Profile · 2014-01-29 · The economic impact from...

January 9, 2014
© Anderson Economic Group, LLC, 2014Permission to reproduce in entirety granted with proper citation. All other rights reserved.
Anderson Economic Group, LLCEast Lansing | Chicago
www.AndersonEconomicGroup.com
ArtPrize 2013: Economic Impact and Attendee Profile
Commissioned by:
Prepared by:Anderson Economic Group, LLCScott D. WatkinsLauren E. BrannemanTyler M. Theile

Table of Contents
Table of Contents
I. Executive Summary................................................1
Introduction ........................................................................... 1Approach ............................................................................... 2Overview of Findings ........................................................... 2About Anderson Economic Group ........................................ 7
II. Overview of ArtPrize ...........................................8
What is ArtPrize? .................................................................. 8Highlights of ArtPrize 2013 ................................................ 10
III. ArtPrize Attendance ........................................12
Attendee Survey .................................................................. 12ArtPrize Attendee Origins ................................................... 12Attendee Demographics ...................................................... 15Attendee Preferences and Activities .................................. 17Estimated Attendance ......................................................... 20Attendee Spending .............................................................. 23
IV. Economic Impact Analysis................................24
Net Economic Impact Defined ............................................ 24Economic Impact From Attendee Spending ....................... 24Economic Impact From Operations Expenditures .............. 25Total Economic Impact ....................................................... 27
V. Cultural and Long-term Benefits .......................28
Increased Awareness of the Region .................................... 28Educational Programs ......................................................... 28Recognition by Media ......................................................... 30Downtown Development and Beautification ...................... 30
VI. Appendix A. Methodology ...............................A-1
Surveys .............................................................................. A-1Attendance Estimate ......................................................... A-1Economic Impact Estimate ............................................... A-2Cautions and Limitations .................................................. A-4
Anderson Economic Group, LLC

Table of Contents
VII. Appendix B. Data ...........................................B-1
VIII. Appendix C. Surveys .....................................C-1
IX. Appendix D. About AEG................................. D-1
Authors .............................................................................. D-1
Anderson Economic Group, LLC

I.Executive Summary
INTRODUCTION ArtPrize debuted in 2009 as the first-ever annual art competition of its kind. Each year since, artists from all over the world have submitted their work and competed for cash prizes, and the City of Grand Rapids becomes their gallery. The event draws crowds to the streets, museums, businesses, and other venues in Grand Rapids over a span of almost three weeks.
This report represents our second economic analysis of ArtPrize. We first ana-lyzed the economic impact of ArtPrize in 2011. That report provided a com-prehensive analysis of event attendance and spending, cultural and long-term benefits, and overall economic impacts. We do the same in this report for Art-Prize 2013. We also provide a detailed look at attendee demographics to illus-trate the broad audience that ArtPrize attracts to the Grand Rapids region, which, for the study, we define as Kent and Ottawa counties. For a map dis-playing our study area, please see Map 1, below.
MAP 1. Greater Grand Rapids Study Area
Source: Esri, Inc.; ArtPrizeAnalysis: Anderson Economic Group, LLC
Kent County
Ottawa County
Allegan County
Muskegon County
Barry County
Newaygo County
Montcalm County
£¤131
£¤31
§̈¦96
§̈¦196
WyomingWyomingKentwoodKentwood
MuskegonMuskegon
Grand RapidsGrand Rapids
Lake Michigan
§̈¦196
£¤131
ST45
A45
Fulton St E Div
isio
n A
ve N
Bridge St NW Michigan St NE
Ioni
a A
ve S
W
Wealthy St SW
Col
lege
Ave
NE
Lake Dr SE
Walker Ave NW
6th St NW
2nd St NW
Leonard St NW
196
Grand RapidsGrand Rapids
0 10.5Miles
0 105
Miles h
Greater Grand Rapids
ArtPrize District
County lines
City of Grand Rapids
© 2014, Anderson Economic Group, LLC 1
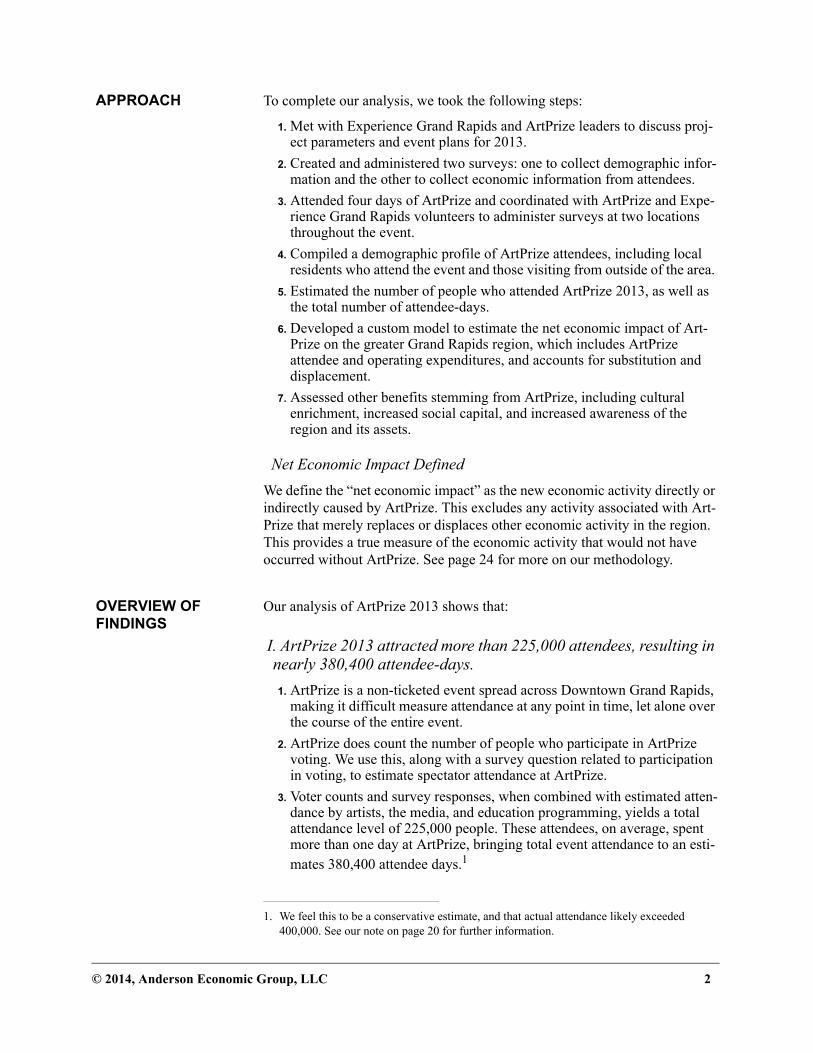
APPROACH To complete our analysis, we took the following steps:
1. Met with Experience Grand Rapids and ArtPrize leaders to discuss proj-ect parameters and event plans for 2013.
2. Created and administered two surveys: one to collect demographic infor-mation and the other to collect economic information from attendees.
3. Attended four days of ArtPrize and coordinated with ArtPrize and Expe-rience Grand Rapids volunteers to administer surveys at two locations throughout the event.
4. Compiled a demographic profile of ArtPrize attendees, including local residents who attend the event and those visiting from outside of the area.
5. Estimated the number of people who attended ArtPrize 2013, as well as the total number of attendee-days.
6. Developed a custom model to estimate the net economic impact of Art-Prize on the greater Grand Rapids region, which includes ArtPrize attendee and operating expenditures, and accounts for substitution and displacement.
7. Assessed other benefits stemming from ArtPrize, including cultural enrichment, increased social capital, and increased awareness of the region and its assets.
Net Economic Impact Defined
We define the “net economic impact” as the new economic activity directly or indirectly caused by ArtPrize. This excludes any activity associated with Art-Prize that merely replaces or displaces other economic activity in the region. This provides a true measure of the economic activity that would not have occurred without ArtPrize. See page 24 for more on our methodology.
OVERVIEW OF FINDINGS
Our analysis of ArtPrize 2013 shows that:
I. ArtPrize 2013 attracted more than 225,000 attendees, resulting in nearly 380,400 attendee-days.
1. ArtPrize is a non-ticketed event spread across Downtown Grand Rapids, making it difficult measure attendance at any point in time, let alone over the course of the entire event.
2. ArtPrize does count the number of people who participate in ArtPrize voting. We use this, along with a survey question related to participation in voting, to estimate spectator attendance at ArtPrize.
3. Voter counts and survey responses, when combined with estimated atten-dance by artists, the media, and education programming, yields a total attendance level of 225,000 people. These attendees, on average, spent more than one day at ArtPrize, bringing total event attendance to an esti-mates 380,400 attendee days.1
1. We feel this to be a conservative estimate, and that actual attendance likely exceeded 400,000. See our note on page 20 for further information.
© 2014, Anderson Economic Group, LLC 2

4. This 2013 attendance level is nearly 20 percent above the 2011 estimate of 322,000 attendee days.
For additional information on our attendance estimate see “ArtPrize Atten-dance” on page 12.
II. ArtPrize attendees came from across Michigan and around the world, providing participants and the region with exposure to an appealing demographic audience.
1. To determine attendee demographics we conducted intercept surveying during the event. The overall response rate was sufficient to report results with better than a 95 percent confidence level and less than a 5 point con-fidence interval.
2. Nearly 8 percent of ArtPrize attendees traveled from outside the State of Michigan to attend the event. Over 49 percent traveled from outside of Kent and Ottawa counties. See Map 3 on page 13 and Map 4 on page 14.
3. Those attending from outside of the Grand Rapids area tend, on average, to be slightly older and to have higher incomes compared to the overall average attendee. More specifically:
• In 2013, the average ArtPrize attendee was 50.5 years old, compared to
out-of-town attendee’s average age of 55.3 years.2 Attendee age distribu-tion can be seen in Figure 1 on page 4.
•The average household income for an ArtPrize attendee was found to be $75,431. Those attending from outside of the Grand Rapids area had higher income levels, averaging $79,005 per household.
•Nearly 33 percent of respondents at ArtPrize 2013 indicated an education attainment level of a Bachelor’s degree. An additional 23.3 percent indi-
TABLE 1. Summary of ArtPrize Attendance Estimate, 2013
I. Spectator Attendance Estimate
Adult and Child Spectator Estimate 213,930
Average Number of Days Attended 1.7
II. Artist, Media, and K-12 Education Program Attendance Estimate
K-12 Education Program Attendance 10,318
Average Length of Stay (days) 1.0
Artists and Media Visiting from Out-of-Area 1,051
Average Length of Stay (days) 2.0
Total Estimate of ArtPrize 2013 Attendee Days 380,379
Source: ArtPrize; Anderson Economic Group survey ArtPrize survey researchAnalysis: Anderson Economic Group, LLC
2. Age and income statistics were derived from both the demographic and economic surveys, as both surveys included that question. This also provides for a larger sample size. Weighted-average ages and incomes were estimated using the mid-point from the ranges provided in the survey questionnaire.
© 2014, Anderson Economic Group, LLC 3

cated they received a graduate or doctorate degree. This was similar for both local and out-of-town attendees.
•Over 72 percent of respondents at ArtPrize 2013 are homeowners; nearly 35 percent of respondents indicated they own their home free and clear. Out-of-town attendees are slightly more established than the overall Art-Prize attendee, with 42 percent indicating they own their home free and clear.
FIGURE 1. Age of Survey Respondents, 2013
Source: Anderson Economic Group survey research of 2013 ArtPrize attendees
4. Attendee preferences and activities, as indicated by responses to our demographic survey, provide further insight into the ArtPrize audience. These data show:
•Nearly 57 percent of ArtPrize attendees regularly travel domestically, and nearly 20 percent regularly travel internationally. Out-of-owners cited these as regular activities even more frequently, at 65 percent and 24 per-cent, respectively.
•Over half (51.2 percent) of attendees regularly shop local and visit farm-ers markets. Out-of-town attendees cited this as a regular activity less fre-quently (45 percent).
• Those attending ArtPrize from out of the area were more likely to regu-lary participate in activities involving gourmet food and fine dining (33 percent), as well as gardening (45 percent) than were local area attendees (30 percent and 41 percent, respectively).
• Ten percent of attendees indicated that collecting or buying artwork was a regular activity. Nearly 11 percent of attendee from outside the area indi-cated the same.
For additional information on the demographic profile of attendees see “Attendee Demographics” on page 15.
0%
5%
10%
15%
20%
25%
30%
35%
40%
45%
16-20 21-25 26-35 36-44 45-54 55-64 65-74 75 +
Shar
e of
Res
pond
ents
All Attendees
Out-of-towners
© 2014, Anderson Economic Group, LLC 4
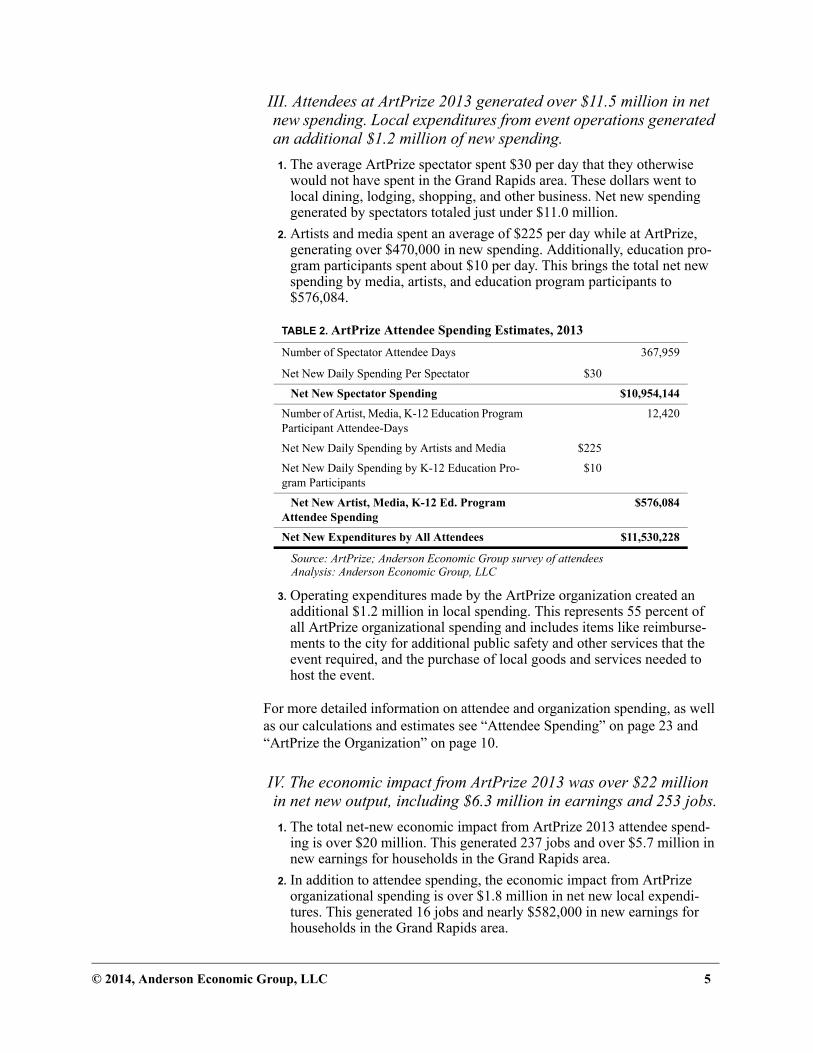
III. Attendees at ArtPrize 2013 generated over $11.5 million in net new spending. Local expenditures from event operations generated an additional $1.2 million of new spending.
1. The average ArtPrize spectator spent $30 per day that they otherwise would not have spent in the Grand Rapids area. These dollars went to local dining, lodging, shopping, and other business. Net new spending generated by spectators totaled just under $11.0 million.
2. Artists and media spent an average of $225 per day while at ArtPrize, generating over $470,000 in new spending. Additionally, education pro-gram participants spent about $10 per day. This brings the total net new spending by media, artists, and education program participants to $576,084.
3. Operating expenditures made by the ArtPrize organization created an additional $1.2 million in local spending. This represents 55 percent of all ArtPrize organizational spending and includes items like reimburse-ments to the city for additional public safety and other services that the event required, and the purchase of local goods and services needed to host the event.
For more detailed information on attendee and organization spending, as well as our calculations and estimates see “Attendee Spending” on page 23 and “ArtPrize the Organization” on page 10.
IV. The economic impact from ArtPrize 2013 was over $22 million in net new output, including $6.3 million in earnings and 253 jobs.
1. The total net-new economic impact from ArtPrize 2013 attendee spend-ing is over $20 million. This generated 237 jobs and over $5.7 million in new earnings for households in the Grand Rapids area.
2. In addition to attendee spending, the economic impact from ArtPrize organizational spending is over $1.8 million in net new local expendi-tures. This generated 16 jobs and nearly $582,000 in new earnings for households in the Grand Rapids area.
TABLE 2. ArtPrize Attendee Spending Estimates, 2013
Number of Spectator Attendee Days 367,959
Net New Daily Spending Per Spectator $30
Net New Spectator Spending $10,954,144
Number of Artist, Media, K-12 Education Program Participant Attendee-Days
12,420
Net New Daily Spending by Artists and Media $225
Net New Daily Spending by K-12 Education Pro-gram Participants
$10
Net New Artist, Media, K-12 Ed. Program Attendee Spending
$576,084
Net New Expenditures by All Attendees $11,530,228
Source: ArtPrize; Anderson Economic Group survey of attendeesAnalysis: Anderson Economic Group, LLC
© 2014, Anderson Economic Group, LLC 5

3. The economic impact from ArtPrize 2013 is notably higher than the $15.4 million that we estimated for the 2011 event. This growth was driven by increased attendance, more local spending by event organizers, and increases in multiplier effects.
Our economic impact analysis is discussed in more detail at “Economic Impact Analysis” on page 24.
V. An annual event like ArtPrize contributes positively to the culture and reputation of an area. Long-term, intangible benefits to the Grand Rapids area include cultural enrichment, increased social capital, and awareness of the region.
1. Nearly 73 percent of survey respondents indicated that their trip to Grand Rapids was primarily due to ArtPrize, showing that the event draws in significant numbers of attendees who otherwise would not have visited the area.
2. Programs for young children at ArtPrize foster the development of enhanced arts and culture for the region into future generations. These programs brought 132 schools and over 10,000 students to ArtPrize 2013.
3. Adults were able to continue their education and cultural understanding during Art Prize as well. Three educational speaker series were attended by more than 500 people during ArtPrize 2013.
4. Grand Rapids is home to four universities that provided access to their facilities during the event. Students were able to display their art work and participate in the ArtPrize competition as well. This provided an opportunity for the public to explore their campuses and to appreciate their presence in the community.
5. Finally, local and national media outlets have run stories featuring Art-Prize on multiple occasions over the past five years. The 2013 event even made the “Five Festive Events You Won’t Want to Miss in 2013” list in TIME Magazine’s style column, where it was the only U.S. based event recognized. Grand Rapids and the West Michigan shoreline were also named the number-one spot to visit in 2014 by Lonely Planet.
See “Cultural and Long-term Benefits” on page 28 for further discussion and information.
TABLE 3. Total ArtPrize Economic Impact Summary, 2013
Net NewOutput
Net NewEarnings
Net NewEmployment
Economic Impact from Attendee Spending $ 20,329,714 $ 5,751,662 237
Economic Impact from Local Operations Expenditures $ 1,857,368 $ 581,976 16
Total Economic Impact, ArtPrize 2013 $ 22,187,082 $ 6,333,638 253
Source: ArtPrize; Bureau of Labor Statistics’ RIMS II MultipliersAnalysis: Anderson Economic Group, LLC.
© 2014, Anderson Economic Group, LLC 6

ABOUT ANDERSON ECONOMIC GROUP
Anderson Economic Group, LLC (AEG) offers research and consulting in economics, finance, market analysis, and public policy. Since AEG’s found-ing in 1996, the company has helped clients including universities, state and local governments, non-profit organizations, and private and public compa-nies. AEG has completed economic impact studies for clients located throughout the United States. For more information on the report’s authors, please see “About AEG” on page D-1.
© 2014, Anderson Economic Group, LLC 7

Overview of ArtPrize
II. Overview of ArtPrize
WHAT IS ARTPRIZE? ArtPrize the Event
In its fifth year, ArtPrize 2013 ran for 19 days, from September 18 through Octo-ber 6. During this time, 1,524 artists from 45 states and 47 countries dis-played their work at locations through-
out Grand Rapids.3
Art exhibits included everything from traditional paintings and photographs, to a sculpture made of recycled tires. Popu-lar pieces from previous competition years, including the 2012 winning entry, were also on display. This work was shown at 169 different venues that were spread out over six neighborhoods and included museums, boutiques, restau-rants, university facilities, community parks, and more (see Map 2 on page 9).
Over $560,000 in prizes for the winners of the competition makes the event the world largest of its kind. For ArtPrize 2013, the popular vote portion of the competition yielded cash prizes of $360,000 for the top ten artists, with the top prize being $200,000. Individuals who register to vote can cast votes throughout the event via the internet or an ArtPrize application on their smart phone. A first round of voting determined the top-ten entries. Voters then cast a single vote among the top ten to determine the top prize winner. In total, over 446,000 votes were cast during ArtPrize 2013.
An additional $200,000 was awarded to six artists based on an expert panel of jurors. The panel selected a grand prize winner of $100,000 as well as five other winners who were the top in each of five categories: 2-D, 3-D, Time-Based,
Urban Space, and Venue.4
3. Information on artists and entries provided by ArtPrize.
4. Information on winners and prizes found at http://www.artprize.org, accessed October 2013.
“Elephants” by Adonna Khare, winner of ArtPrize 2012
© 2014, Anderson Economic Group, LLC 8

Overview of ArtPrize
MAP 2. Downtown Grand Rapids and ArtPrize 2013 Venues
Note: Fredrick Meijer Gardens served as a primary venue and is not within downtown Grand Rapids.
Gra
ndR
iver
St Mary'sHealth Care
BelknapBelknapParkPark
CoitCoitParkPark
MaryMaryWatersWaters
ParkPark
Gerald R Ford Fwy
131
State St SE
Jackson St NW
Trowbridge St NE
Emperor St SW
12th St NW
9th St NW
5th St NW
King Ct SW
Page St NE
Wealthy St SW
1st St NW
6th St NW
Hastings St NE
7th St NW
Fountain St NE
Douglas St NW
Chatham St NW
Sibley St NW
Fairbanks St NE
Lake Michigan Dr NW
California St NW
Veto St NW
Watson St SW
4th St NW
3rd St NW
Go
dfr
ey
Av
e S
W
Logan St SW
Oakes St SE
Sin
cla
ir A
ve
NE
LouisSt NW
Buckley St SW
La
Gra
ve
Av
e S
E
Da
vis
Av
e N
W
11th St NW
Ion
iaA
ve
SW
Lyon St NE
Je
ffe
rso
n A
ve
SE
Walnut St NE
Shirley St NE
Brenner St NE
Wi l liams St SW
Cla
nc
y A
ve
NE
Carrier St NE
Gh
ild
a P
l N
E
Pa
ris
Av
e S
E
Bartlett St SW
Mo
rris
Av
e S
E
Co
lle
ge
Av
e S
E
Cla
rem
on
t P
l N
E
Ott
aw
a A
ve
NW
Coldbrook St NE
Lyon St NW
Ind
ian
a A
ve
SW
Fro
nt
Ave
SW
He
ste
r P
l N
E
Wealthy St SE
2nd St NW
Logan St SE
Bo
stw
ick
Av
e N
E
Washington St SE
Pro
sp
ec
tA
ve
SE
Cherry St SW
Cedar St NE
Crescent St NE
Ion
ia A
ve
NW
Cherry St SE
Mu
sk
eg
on
Av
e N
W
Co
mm
erc
e A
ve
SW
Win
ter
Av
e N
W
Str
aig
ht
Av
e S
W
La
fay
ett
eA
ve
NE
Se
wa
rd A
ve
NW
Co
it A
ve
NE
Mo
nro
e A
ve
NW
Fro
nt
Av
e N
W
Ma
dis
on
Av
e S
E
Oa
kla
nd
Av
e S
WS
um
me
r A
ve
NW
Qu
arr
y A
ve
NW
Tu
rne
r A
ve
NW
Bo
nd
Av
e N
W
Fa
irv
iew
Av
e N
E
Sc
rib
ne
r A
ve
NW
Bro
ad
wa
y A
ve
NW
Pro
sp
ec
t A
ve
NE
Leonard St NE
W Fulton StFulton St W
Div
isio
n A
ve
NE
Oakes St SW
Mark
etAve
SW
Pla
infi
eld
Av
eN
E
Div
isio
n A
ve
S
Bridge St NW
Butterworth St SW
Sto
ckin
g A
ve N
W
Leonard St NW
Michigan St NW
Ion
ia A
ve
NW
Fulton St E
Michigan St NE
Pearl St NW
Co
lle
ge
Av
e N
END
ivis
ion
Av
e
Alp
ine
Av
e N
W
I-196U
S-1
31
US
-131 196
Grand RapidsGrand Rapids
ArtPrize 2013 Venue
ArtPrize District
© 2014, Anderson Economic Group, LLC 9

Overview of ArtPrize
ArtPrize the Organization
ArtPrize the event is possible because of the work of ArtPrize Grand Rapids, Inc., a non-profit organization that operates year-round to plan, host, and pro-mote further development for the annual competition. The work that goes into ArtPrize includes everything from fund-raising and marketing, to organizing events before, during, and after the competition, to recruiting hundreds of vol-unteers, and managing the technology platform that supports the public voting process.
For detailed information on the operational spending, revenue, and sponsor sup-port, please see “Economic Impact From Operations Expenditures” on page 25.
HIGHLIGHTS OF ARTPRIZE 2013
There were countless positive experiences and events that took place during ArtPrize 2013. Among these were:
Volunteerism
Volunteerism is an important part of ArtPrize and without those who give of their time and talents, the event would not be possible. Before opening day of ArtPrize 2013, a kick-off party was held for volunteers. Over 500 people were in attendance ready to be trained and assigned their duties in order to contribute to the event and their community. In total, over 800 volunteers gave over 13,000
hours to ArtPrize 2013.5
Overcoming the Government Shutdown
One might assume that politics and government stalemates would have no effect on an open-art competition, but this was not the case. Shortly after the top-ten exhibits for ArtPrize 2013 were announced, federal buildings were closed and workers were sent home after politicians in Washington D.C. failed to reach a budget agreement. The Gerald R. Ford Presidential Museum in downtown Grand Rapids housed a total of 14 entries. Four of these entries had made it into the top-ten. Two of these entries were already displayed outdoors on museum grounds providing the opportunity for spectators to continue viewing and voting for them. Two others were promptly moved outdoors so that they could remain in the running for the top prize as well.
The Winner of ArtPrize 2013—Michigan Pride
While artists from all over the globe participated, all three of the artists who were top prize winners in the 2013 popular vote had ties to Michigan.
5. Volunteer information provided by ArtPrize.
© 2014, Anderson Economic Group, LLC 10

Overview of ArtPrize
Third place winner, Andy Sacksteder, is originally from Adrian, Michigan and
has also lived in Jackson and Dearborn.6 The second place winner in 2013, Anni Crouter, grew up in Flint, Michigan where she continues to reside and work
today.7 The first place winner of ArtPrize 2013 was Ann Loveless,8 who created four quilted panels that display like a beautiful painting of scenery at the Sleep-ing Bear Dunes National Lakeshore. Loveless owns an art gallery in Beulah, Michigan that will also likely benefit from this new exposure.
6. MLive, “ArtPrize 2013 winner,” <http://www.mlive.com/artprize/index.ssf/2013/10/artprize_2013_winner_is_sleeping_bear_dune_lakeshore_quilt_by_ann_loveless.html>, accessed November 2013.
7. Artist website, <http://annicrouter.com/biography.html>, accessed November 2013.
8. ArtPrize, <http://www.artprize.org/>, accessed October 2013.
“Sleeping Bear Dune Lakeshore” by Ann Loveless, winner of ArtPrize 2013
© 2014, Anderson Economic Group, LLC 11

ArtPrize Attendance
III. ArtPrize Attendance
With the public nature and layout of ArtPrize, attendees are able to do more than view and vote on the artwork. The placement of artwork at different venues throughout the downtown creates an atmosphere of exploration, where both local and non-local attendees are likely to find themselves at a venue or business they have never visited before. This also makes it difficult to fully observe what types of people are drawn to the event.
ATTENDEE SURVEY We used two surveys to assess the makeup of ArtPrize 2013 attendees: a demo-graphic survey (which is the main focus of this section) and an economic survey (discussed in the economic impact section). The surveys were designed to iden-tify the demographic and socioeconomic characteristics of attendees, as well as the regular activities in which they participate. We were then able to compile profiles of ArtPrize attendees. Survey questions can be found starting on page C-1 and an explanation of our survey methodology on page A-1.
We aimed to gather a number of responses for each survey that would provide a fair representation of the entire ArtPrize-attendee population. The number of responses from each survey provided us with a confidence level of more than 95
percent and confidence interval of less than five percentage points.9 Because of this we can say with a relative level of certainty that the survey results provide meaningful descriptive statistics about the overall ArtPrize attendance base.
ARTPRIZE ATTENDEE ORIGINS
ArtPrize attendees in 2013 came from across the country and around the world. Below we further discuss attendee origins.
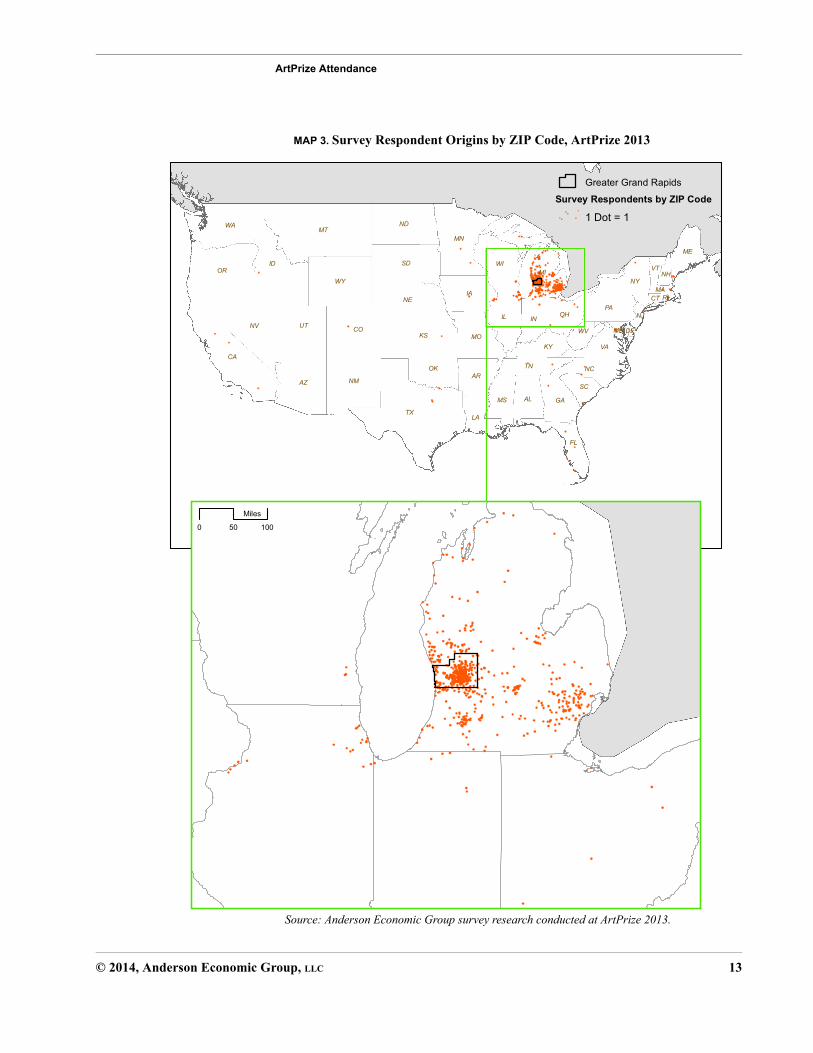
1. Of the survey participants, 13.3 percent indicated that they resided in the City of Grand Rapids, and an additional 36.8 percent in Kent or Ottawa County, but outside the city. Over 41.0 percent indicated they resided elsewhere in Michi-gan, and 7.9 outside the state. See Map 3, “Survey Respondent Origins by ZIP Code, ArtPrize 2013,” on page 13.
2. Map 4 on page 14 shows 2013 ArtPrize voter registration data. This shows 13.0 percent of registered voters lived in Grand Rapids and 44.3 percent lived else-where in Kent and Ottawa counties. Some 49.9 percent were from elsewhere in Michigan and 7.3 percent were from outside of Michigan.
3. Attendee zip codes were also collected by the Grand Rapids Women’s City Club, which allowed its historic building to be used as an ArtPrize venue. They recorded a total of 18,161 attendees, including persons from 40 states, the Dis-trict of Columbia, and 10 foreign countries (Canada, Australia, New Zealand, England, Germany, the Netherlands, Spain, Mexico, Peru, and Ecuador).
9. A confidence level of 95 percent tells us how confident we can be that the mean falls within the a specified confidence interval, or margin of error.
© 2014, Anderson Economic Group, LLC 12
ArtPrize Attendance
MAP 3. Survey Respondent Origins by ZIP Code, ArtPrize 2013
Source: Anderson Economic Group survey research conducted at ArtPrize 2013.
TX
MT
CA
ID
NV
AZ
OR
IL
NM
CO
MN
WY
SD
IA
ND
UTKS
NE
WA
WI
OK
MO
MINY
PA
FL
IN
AL GA
AR
LA
NC
VAKY
TN
OH
MS
ME
SC
WV
VTNH
MACT
MD
NJ
DE
RI
Greater Grand Rapids
Survey Respondents by ZIP Code
1 Dot = 1
0 10050
Miles
© 2014, Anderson Economic Group, LLC 13

ArtPrize Attendance
MAP 4. ArtPrize 2013 Registered Voters by ZIP Code
Source: ArtPrize 2013.
TX
MT
CA
ID
NV
AZ
OR
IL
NM
CO
MN
WY
SD
IA
ND
UTKS
NE
WA
WI
OK
MO
MINY
PA
FL
IN
AL GA
AR
LA
NC
VAKY
TN
OH
MS
ME
SC
WV
VTNH
MACT
MD
NJ
DE
RI
Greater Grand Rapids
1 Dot = 1 Registered Voter
0 10050
Miles
© 2014, Anderson Economic Group, LLC 14
ArtPrize Attendance
ATTENDEE DEMOGRAPHICS
In this section we look more closely at the demographics, consumer characteris-tics, and preferences of ArtPrize attendees. We focus on both overall ArtPrize attendees (below) as well as just those who visited from outside of the Grand Rapids area (see “Out-of-town Attendee Demographics” on page 16).
Overall Attendee Demographics
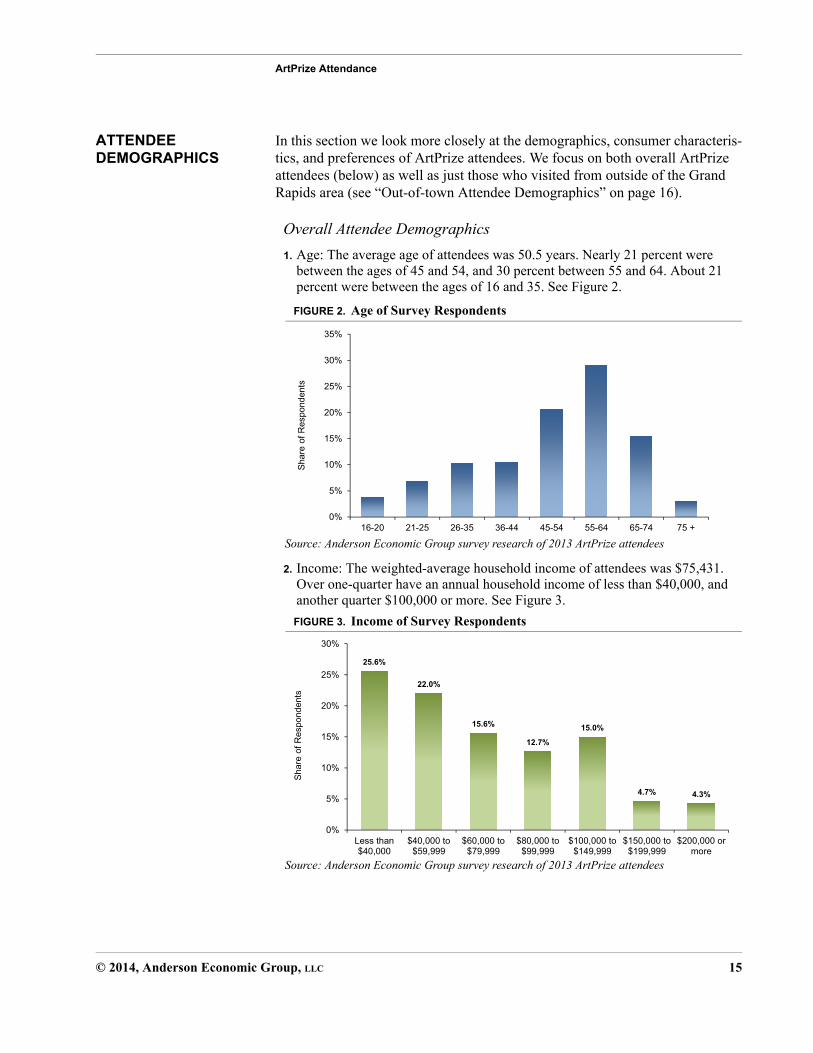
1. Age: The average age of attendees was 50.5 years. Nearly 21 percent were between the ages of 45 and 54, and 30 percent between 55 and 64. About 21 percent were between the ages of 16 and 35. See Figure 2.
FIGURE 2. Age of Survey Respondents
Source: Anderson Economic Group survey research of 2013 ArtPrize attendees
2. Income: The weighted-average household income of attendees was $75,431. Over one-quarter have an annual household income of less than $40,000, and another quarter $100,000 or more. See Figure 3.
FIGURE 3. Income of Survey Respondents
Source: Anderson Economic Group survey research of 2013 ArtPrize attendees
0%
5%
10%
15%
20%
25%
30%
35%
16-20 21-25 26-35 36-44 45-54 55-64 65-74 75 +
Shar
e of
Res
pond
ents
25.6%
22.0%
15.6%
12.7%
15.0%
4.7% 4.3%
0%
5%
10%
15%
20%
25%
30%
Less than$40,000
$40,000 to$59,999
$60,000 to$79,999
$80,000 to$99,999
$100,000 to$149,999
$150,000 to$199,999
$200,000 ormore
Shar
e of
Res
pond
ents
© 2014, Anderson Economic Group, LLC 15
ArtPrize Attendance
3. Education: Nearly 33 percent of attendees of ArtPrize 2013 have received a Bachelor’s degree. An additional 23.3 percent received a graduate or doctorate degree. Nearly 33 percent of attendees received an associate degree or had some college experience.
4. Home Ownership: Over 72 percent of attendees are homeowners; nearly 35 per-cent own their home free and clear, and another 38 percent have a mortgage on their home. Under 18 percent of attendees are renters.
5. Marital Status: Just under 60 percent of attendees are married, and another 4.6 percent unmarried but living with their partner. Approximately 16 percent of attendees are divorced, separated, or widowed; and about 18 percent single, never married.
6. Transportation: A majority of attendees’ primary means of transportation to Grand Rapids for ArtPrize was with their own vehicle (79 percent). Another 8.7 percent of attendees walked or biked.
Out-of-town Attendee Demographics
ArtPrize attendees who come from outside the Greater Grand Rapids region help to create an impact in the area that otherwise would not be realized. Below we summarize the “out-of-towner” demographic characteristics that stand apart from the overall ArtPrize attendee.
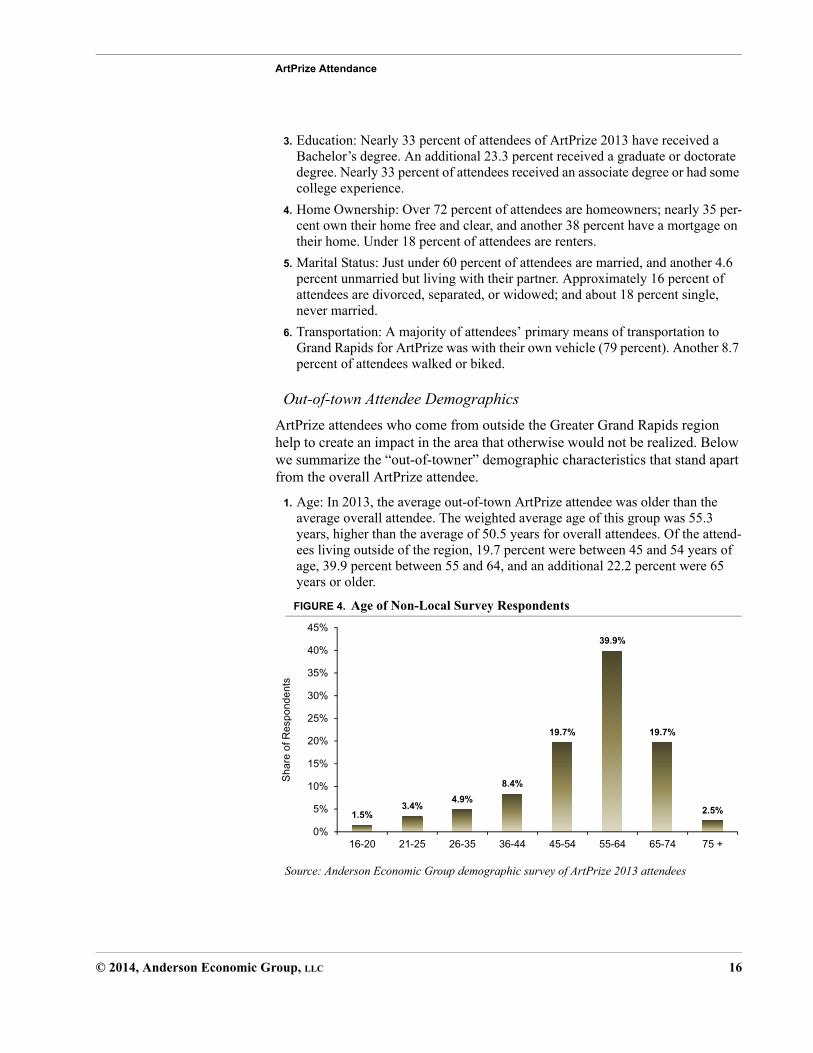
1. Age: In 2013, the average out-of-town ArtPrize attendee was older than the average overall attendee. The weighted average age of this group was 55.3 years, higher than the average of 50.5 years for overall attendees. Of the attend-ees living outside of the region, 19.7 percent were between 45 and 54 years of age, 39.9 percent between 55 and 64, and an additional 22.2 percent were 65 years or older.
FIGURE 4. Age of Non-Local Survey Respondents
Source: Anderson Economic Group demographic survey of ArtPrize 2013 attendees
1.5%3.4%
4.9%
8.4%
19.7%
39.9%
19.7%
2.5%
0%
5%
10%
15%
20%
25%
30%
35%
40%
45%
16-20 21-25 26-35 36-44 45-54 55-64 65-74 75 +
Sha
re o
f Res
pond
ents
© 2014, Anderson Economic Group, LLC 16
ArtPrize Attendance
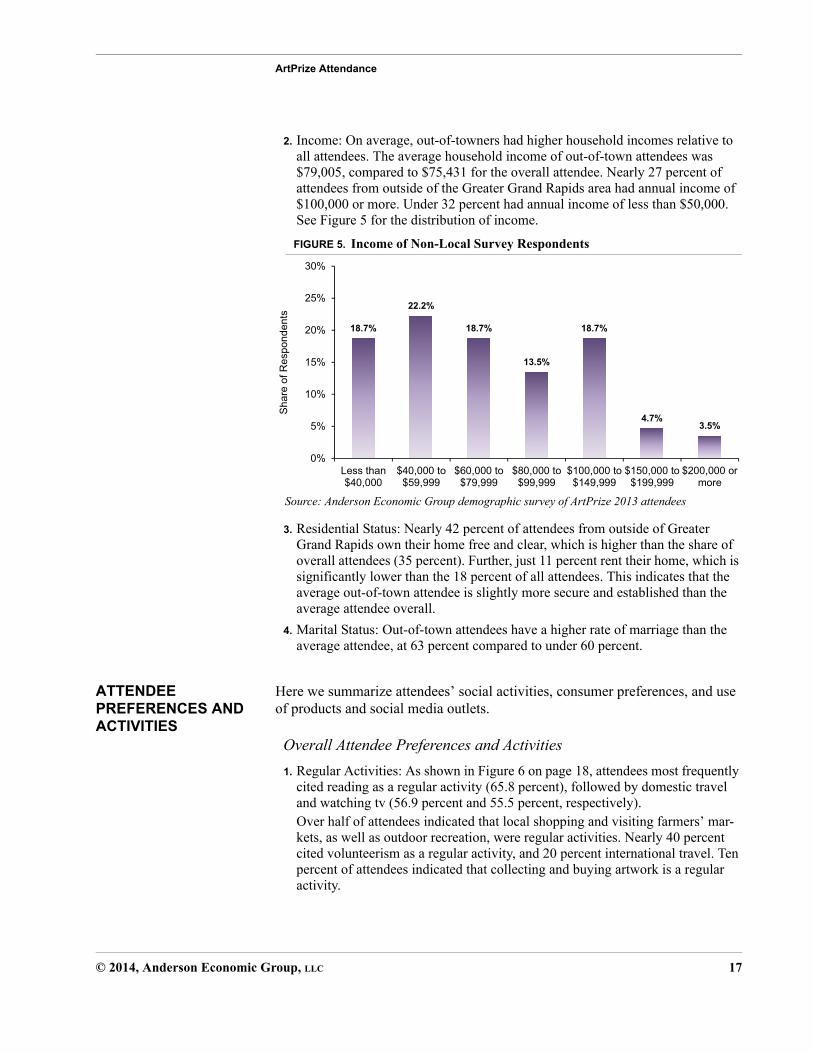
2. Income: On average, out-of-towners had higher household incomes relative to all attendees. The average household income of out-of-town attendees was $79,005, compared to $75,431 for the overall attendee. Nearly 27 percent of attendees from outside of the Greater Grand Rapids area had annual income of $100,000 or more. Under 32 percent had annual income of less than $50,000. See Figure 5 for the distribution of income.
FIGURE 5. Income of Non-Local Survey Respondents
Source: Anderson Economic Group demographic survey of ArtPrize 2013 attendees
3. Residential Status: Nearly 42 percent of attendees from outside of Greater Grand Rapids own their home free and clear, which is higher than the share of overall attendees (35 percent). Further, just 11 percent rent their home, which is significantly lower than the 18 percent of all attendees. This indicates that the average out-of-town attendee is slightly more secure and established than the average attendee overall.
4. Marital Status: Out-of-town attendees have a higher rate of marriage than the average attendee, at 63 percent compared to under 60 percent.
ATTENDEE PREFERENCES AND ACTIVITIES
Here we summarize attendees’ social activities, consumer preferences, and use of products and social media outlets.
Overall Attendee Preferences and Activities
1. Regular Activities: As shown in Figure 6 on page 18, attendees most frequently cited reading as a regular activity (65.8 percent), followed by domestic travel and watching tv (56.9 percent and 55.5 percent, respectively).Over half of attendees indicated that local shopping and visiting farmers’ mar-kets, as well as outdoor recreation, were regular activities. Nearly 40 percent cited volunteerism as a regular activity, and 20 percent international travel. Ten percent of attendees indicated that collecting and buying artwork is a regular activity.
18.7%
22.2%
18.7%
13.5%
18.7%
4.7%3.5%
0%
5%
10%
15%
20%
25%
30%
Less than$40,000
$40,000 to$59,999
$60,000 to$79,999
$80,000 to$99,999
$100,000 to$149,999
$150,000 to$199,999
$200,000 ormore
Sha
re o
f Res
pond
ents
© 2014, Anderson Economic Group, LLC 17

ArtPrize Attendance
FIGURE 6. Activities in which Attendees Regularly Participate
Source: Anderson Economic Group demographic survey of ArtPrize 2013 attendees
2. National Merchants and Brands: Among a selection of regional and national merchants, attendees indicated their preference for certain brands. Specifically:
• Attendees most frequently cited a preference for Meijer (72 percent), com-pared to Wal-Mart (18 percent) and Kroger (7 percent). Attendees had rela-tively equal preferences for Trader Joe’s (28 percent) and Whole Foods (23 percent).
• In terms of middle-end dining establishments, attendees indicated a greater preference for Bonefish Grill (14 percent) and P.F. Chang’s (14 percent) than Bravo! Cucina Italiana (3 percent).
• Attendees most frequently cited a preference for Target (44 percent), Kohl’s (36 percent), Macy’s (25 percent), and J.C. Penney (24 percent). There was less preference for Sears (10 percent), Nordstrom (10 percent), and Neiman Marcus (5 percent).
• Panera Bread and Subway received the greatest preference among casual din-ing establishments (46 percent and 33 percent), followed by (in order of pref-erence) McDonald’s, Taco Bell, Papa John’s Pizza, Hungry Howie’s, and Baja Fresh Mexican Grill.
• Among hardware stores, attendees indicated more preference for The Home Depot (34 percent) than Lowe’s (30 percent) or Menards (24 percent).
• Walgreen’s was the most cited among health and personal care stores at 30 percent, compared to Rite Aid (7 percent) and CVS Caremark (6 percent).
• More attendees indicated they preferred Verizon (38 percent) than other cellu-lar providers AT&T (20 percent) and Sprint (10 percent).
3. Technology Products: Attendees most frequently indicated they regularly use a laptop computer (63.8 percent), followed by smart phones (59.6 percent), digital
0%
10%
20%
30%
40%
50%
60%
70%
Sha
re o
f Res
pond
ents
© 2014, Anderson Economic Group, LLC 18
ArtPrize Attendance
cameras (46.4 percent), desktop computers (40.4 percent), and tablets/iPads/e-readers (38.0 percent).
4. Social Media Outlets: Nearly 80.0 percent of attendees indicated they regularly use Facebook; this was trailed by Google+ (32.6 percent), Pinterest (28.0 per-cent), and LinkedIn (18.4 percent). Twitter, Tumblr, and MySpace are less fre-quently used by survey respondents.
Out-of-town Attendee Preferences and Activities
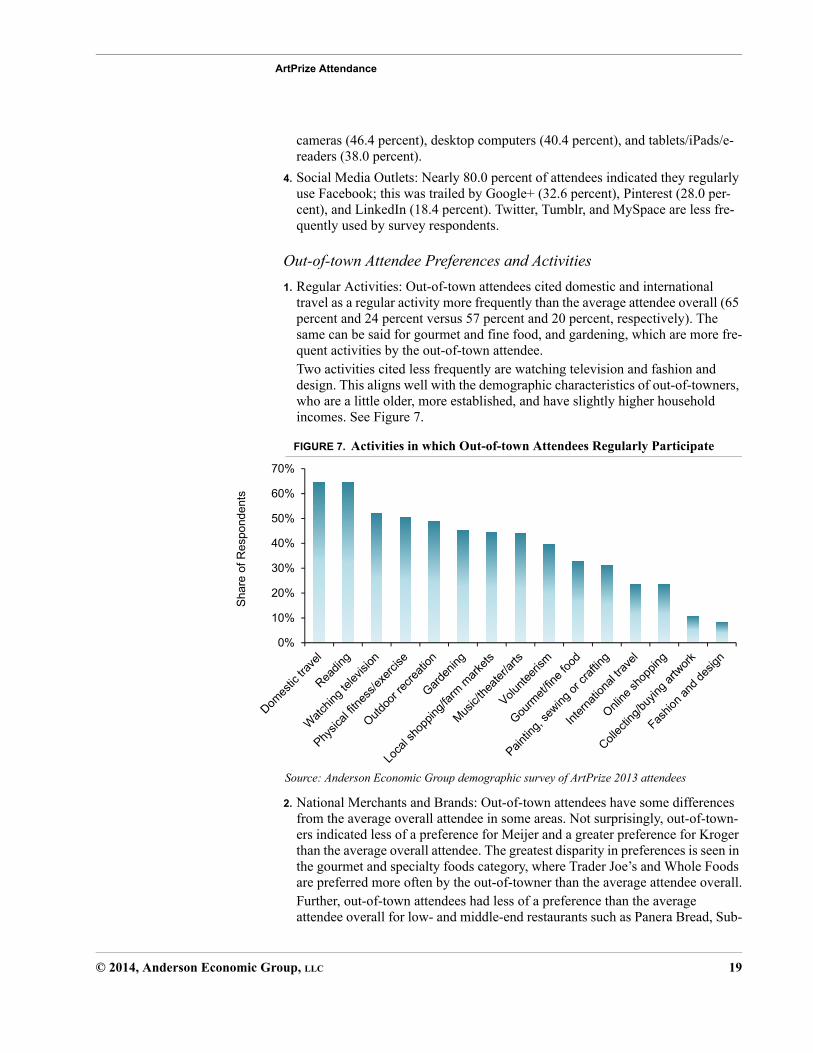
1. Regular Activities: Out-of-town attendees cited domestic and international travel as a regular activity more frequently than the average attendee overall (65 percent and 24 percent versus 57 percent and 20 percent, respectively). The same can be said for gourmet and fine food, and gardening, which are more fre-quent activities by the out-of-town attendee. Two activities cited less frequently are watching television and fashion and design. This aligns well with the demographic characteristics of out-of-towners, who are a little older, more established, and have slightly higher household incomes. See Figure 7.
FIGURE 7. Activities in which Out-of-town Attendees Regularly Participate
Source: Anderson Economic Group demographic survey of ArtPrize 2013 attendees
2. National Merchants and Brands: Out-of-town attendees have some differences from the average overall attendee in some areas. Not surprisingly, out-of-town-ers indicated less of a preference for Meijer and a greater preference for Kroger than the average overall attendee. The greatest disparity in preferences is seen in the gourmet and specialty foods category, where Trader Joe’s and Whole Foods are preferred more often by the out-of-towner than the average attendee overall.Further, out-of-town attendees had less of a preference than the average attendee overall for low- and middle-end restaurants such as Panera Bread, Sub-
0%
10%
20%
30%
40%
50%
60%
70%
Shar
e of
Res
pond
ents
© 2014, Anderson Economic Group, LLC 19

ArtPrize Attendance
way, and fast-food establishments. The same can be said for brands like Target, Macy’s, and Sears, and health and personal care stores like Walgreens.
Questions and responses from the demographic survey are included beginning on page C-2. The methodology used to administer and analyze the survey can be found in “Surveys” on page A-1.
ESTIMATED ATTENDANCE
ArtPrize draws a number of attendees visiting for different purposes. Many visit as spectators, some as artists participating in the event, and others as media to report on the event.
Spectators
Knowing the exact number of people who attended a public event is rarely pos-sible, as is the case with ArtPrize. However, we are able to estimate the number of attendees and attendee-days.
To estimate total attendance at ArtPrize 2013, we relied upon available informa-tion on voter registration (provided by ArtPrize) and estimates derived from sur-vey research. The survey collected information on the overall share of attendees that registered to vote. From these data we were able to estimate total spectator attendees (including children) and attendee-days.
These data show that:
1. There were a total of 49,078 people (required to be age 16+) registered to vote at ArtPrize 2013, and 39.0 percent of survey respondents indicated they were registered to vote. This yields an estimated adult spectator attendance of 125,841 people.
2. Attendees taking the survey reported that, on average, there were 0.70 children (under 16 years of age) attending per adult, and that they spent an average of 1.7
days at ArtPrize over the course of the event.10
3. With the adult spectator estimate of 125,841, and 0.70 children attending per adult, we reach an estimate of 213,930 spectator attendees.
4. With each attendee spending 1.7 days at ArtPrize, we estimate that ArtPrize
2013 generated 367,959 spectator attendee-days.11
10.AEG economic survey research from ArtPrize 2013.
11.This methodology is likely to have produced a conservative estimate of attendance as those willing to answer a survey are suspected to also be more likely to have engaged in voting in the competition. Grand Rapids Police estimated that attendance on Saturday, September 21st, was close to 100,000 for the day alone. Also, The Rapid bus service reported more than 158,000 rides taken by those with ArtPrize wristbands during the event. These estimates, along with our own observations of crowds during the event, suggest actual attendance exceeded our esti-mate.
© 2014, Anderson Economic Group, LLC 20
ArtPrize Attendance
Please see “Attendance Estimate” on page A-1 for further details on the estima-tion methodology. Also see “Questions Unique to the Economic Survey and Results” on page C-6 for survey questions and results.
Artists, Media, and Education Program Participants
There were over 1,500 artists who participated in ArtPrize 2013. Of these, we estimate that about two thirds came from outside of the Greater Grand Rapids region to compete and put their artwork on display. We estimate that artists coming from outside of the region stayed in town for an average of two days during the event.
We also estimate that 35 members of the media traveled from outside the Grand Rapids area to cover ArtPrize 2013,and stayed for an average of two days. There were also education programs that were attended by 10,318 K-12 stu-
dents. We estimate that these participants stayed an average of one day.12
Total Attendance Estimate
The 2013 ArtPrize estimates of 213,930 adult and child spectators and 11,369 artists, media, and education program participants total 225,299. When length of stay is factored in, we get an estimated 367,959 spectator attendee-days, and 12,420 media, artist, and program participant attendee-days. This brings our total attendee days estimate to 380,379, as shown in Table 4 on page 22.
12.Education program participants number provided by ArtPrize 2013 Events Stats and Facts.
© 2014, Anderson Economic Group, LLC 21

ArtPrize Attendance
TABLE 4. ArtPrize Attendance Estimate, 2013
I. Spectator Attendance Estimate
Adult and Child Spectator Estimate 213,930
Average Number of Days Attended 1.7
Total Estimate of Spectator Attendee Days 367,959
II. Artist, Media, and K-12 Education Program Attendance Estimate
K-12 Education Program Participation 10,318
Average Length of Stay (days) 1
Artists Visiting from Out-of-Area 1,016
Average Length of Stay (days) 2
Media Visiting from Out-of-Area 35
Average Length of Stay (days) 2
Total Estimate of Artist, Media, and K-12 Education Program Participant Attendee Days
12,420
Total Estimate of Attendee-Days 380,379
Source: Spectator estimate by Anderson Economic Group, using survey research. Artist, media, and K-12 education program information provided by ArtPrize and based on AEG observations.
Analysis: Anderson Economic Group, LLC
© 2014, Anderson Economic Group, LLC 22

ArtPrize Attendance
ATTENDEE SPENDING Spectators
Attendees of ArtPrize 2013 generated significant spending in the region. The range of shopping, dining, lodging, and entertainment opportunities drove the average spectator to spend nearly $30 per person per day, in addition to what
they would have spent in the Grand Rapids area if not for ArtPrize.13 This net new spending includes local residents who didn’t spend anything beyond what they normally would have; people who dined out while downtown for ArtPrize instead of eating at home; and attendees from out-of-state who stayed at a hotel, ate out for every meal, and bought gifts for family. When applied across the 367,959 attendee-days, this totals over $10.9 million in net new spending for the region.
Artist, Media, and Education Program Attendees
Only spending from artists, media, and K-12 education program participants from outside the area was considered in this study, as those local to the area would likely have had similar expenditure levels even without the event. We estimate that artists and media spent an average of $225 per day while at the event, and K-12 education program participants $10 each. These estimates include money spent on hotel stays, food, and other such expenses. With an esti-mated total of 12,420 attendance-days for out-of-area artists, media, and pro-gram participants, this totals $576,084 in net-new direct expenditures.
Total Attendee Spending
As shown in Table 5, net-new expenditures from all attendees totaled over $11.5 million. This translates to an average of $606,854 in net new spending per day during ArtPrize. However, the economic activity from these dollars does not stop there; please see “Economic Impact Analysis” on page 24 for informa-tion on the net economic impact of this spending.
13. Based on responses to question eight from our economic survey of ArtPrize attendees.
TABLE 5. ArtPrize Attendee Spending Estimates, 2013
Net New Daily Spending per Spectator $29.77
Number of Spectator Attendee-Days 367,959
Net New Spectator Spending $10,954,144
Net New Daily Spending per Artist and Media Attendees $225
Number of Artist and Media Attendee-Days 2,102
Net New Daily Spending per Education Program Participant $10
Number of Education Program Participant Attendee-Days 10,318
Net New Artist, Media, and Ed. Prgrm Participant Spending $576,084
Total Net New Expenditures by Attendees $11,530,228
Source and Analysis: Anderson Economic Group, LLC
© 2014, Anderson Economic Group, LLC 23
Economic Impact Analysis
IV. Economic Impact Analysis
In this section we quantify the direct and indirect economic impacts of ArtPrize 2013. Expenditures related to the event, generated by attendees and event oper-ations, provide a direct impact at the time of the transactions. These direct expenditures stimulate further spending, called indirect economic impacts. Indi-rect impacts act as a ripple effect, growing until the money is either transferred outside the region or saved.
NET ECONOMIC IMPACT DEFINED
We define “net economic impact” as new economic activity directly or indi-rectly caused by ArtPrize. To quantify the economic impact of the event, we asked, in effect, “What economic activity in Greater Grand Rapids is directly attributable to ArtPrize 2013?” There are two types of expenditures that are sources of new economic activity. The first include expenditures by ArtPrize from the event operations. The second comes from event attendees and visiting artists and media, who spend money on meals, accommodations, and inciden-tals.
In calculating the event’s impact, we include operating expenditures that go to individuals and companies in the region and exclude those that go to firms out-side of the area. Additionally, we exclude any expenditures that displace or replace other economic activity in Kent or Ottawa counties. For example, we do not include restaurant expenditures by resident attendees who, regardless of the event, would have spent that money in the region. By accounting for these sub-stitutions, we only include the net benefits of ArtPrize, which provides a better measure of the economic activity directly attributable to the event.
The impact from expenditures made during the ArtPrize goes beyond the direct economic activity that occurred Greater Grand Rapids. The dollars spent by Art-Prize the organization, as well as those spent by attendees, are then re-spent as
businesses and households purchase other goods and services in the region.14 To account for this indirect economic activity, we use the U.S. Bureau of Eco-nomic Analysis RIMS II Final Demand Multipliers for Output, Earnings, and Employment for the Kent and Ottawa County region. See “Economic Impact Methodology” on page A-1.
ECONOMIC IMPACT FROM ATTENDEE SPENDING
Every year, those attending ArtPrize contribute significantly to the local econ-omy. In 2013, attendee spending amounted to over $11.5 million (as discussed in “ArtPrize Attendance” on page 12). However, the impact does not end here.
14.We have excluded from event expenditures any amounts that were determined to have been from funding sources that would likely have been part of the local economy even without Art-Prize.
© 2014, Anderson Economic Group, LLC 24

Economic Impact Analysis
The $11.5 million in new spending circulates through the region’s economy, creating a multiplier effect that generates even more economic activity.
To arrive at the total net-new economic impact from attendee spending at Art-Prize 2013, we applied three different types of multipliers to the direct spending by attendees, including one for output, one for earnings, and one for employ-ment. Results from this analysis, shown in Table 6, reveal that:
1. The total economic impact from attendee spending at ArtPrize 2013 is estimated to be over $20.3 million for Greater Grand Rapids;
2. Attendee spending at ArtPrize generated an estimated $5.8 million in earnings to households throughout the region; and
3. ArtPrize 2013 spending helped support or create 237 jobs in the region.
See Table 11, “Economic Impact Analysis, 2013 ArtPrize Attendee Expendi-tures,” on page B-4.
ECONOMIC IMPACT FROM OPERATIONS EXPENDITURES
The cost of hosting ArtPrize 2013 came to over $2.3 million, with much of the funding coming primarily from the generosity of individual and corporate donors. Nearly 100 sponsors contributed to support ArtPrize operations in 2013. ArtPrize is also supported in part by artist and venue registration fees, ticket sales, and retail sales of ArtPrize merchandise. With all of this spending there is a concentrated effort to use local suppliers where ever possible. Organizing and running ArtPrize resulted in the organization spending over $2.2 million of the
total expenditures with local businesses and workers.15
Revenue Substitution. Some of ArtPrize’s $2.2 million in local spending was from funds that were simply redirected within the region. This would include sponsorship money that businesses gave to ArtPrize instead of spending on local advertisements, donations made to ArtPrize instead of other organizations
TABLE 6. Net Economic Impact of ArtPrize Attendee Expenditures, 2013
Net-New Expenditures by Attendees $11,530,228
Output Multiplier 1.76
Earnings Multiplier 0.50
Employment Multiplier (jobs per million in new demand) 20.52
Net New Economic Activity from Attendee Spending $20,329,714
Net New Earnings to Households from Attendee Spending $5,751,662
Employment Generated by Attendee Spending 237
Source: Bureau of Labor Statistics’ RIMS II Multipliers; ArtPrize; AEG survey researchAnalysis: Anderson Economic Group, LLC.
15.Aggregate expenditure information was provided by ArtPrize.
© 2014, Anderson Economic Group, LLC 25
Economic Impact Analysis
in the community, and revenue from ArtPrize merchandise sales that displaced merchandise sales from other community businesses. In Table 9 on page B-3 we present our analysis of ArtPrize revenues, which found that 55 percent of the total funds supporting the organization were net new to the community. In other words, we estimate that 45 percent of ArtPrize’s total revenue would still have had economic benefits to the community if ArtPrize were not held, but the other 55 percent was locally allocated as a result of ArtPrize.
Net-New ArtPrize Spending. To ensure our economic impact estimate does not miscount activity that was not caused by ArtPrize, we discount the local $2.2 million so as to only measure impacts supported by the 55 percent of Art-Prize funding that was net new to the region. As shown in Table 10 on page B-3, the net new local spending that generates an economic benefit is estimated to be $1.2 million.
As with the attendee spending, we estimate the total economic impacts from the operational spending by applying multipliers specific to the area and the indus-tries affected. In this instance we applied several different multipliers based on the type of industry that the ArtPrize spending was directed towards. In doing so we found:
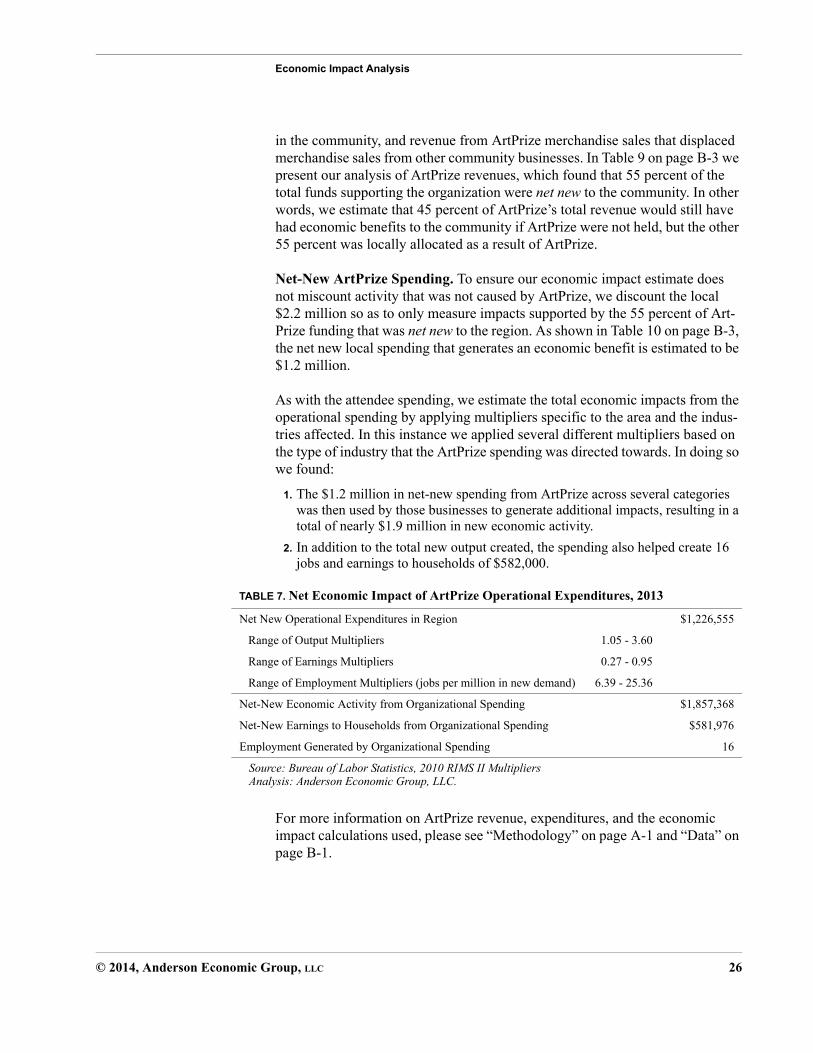
1. The $1.2 million in net-new spending from ArtPrize across several categories was then used by those businesses to generate additional impacts, resulting in a total of nearly $1.9 million in new economic activity.
2. In addition to the total new output created, the spending also helped create 16 jobs and earnings to households of $582,000.
For more information on ArtPrize revenue, expenditures, and the economic impact calculations used, please see “Methodology” on page A-1 and “Data” on page B-1.
TABLE 7. Net Economic Impact of ArtPrize Operational Expenditures, 2013
Net New Operational Expenditures in Region $1,226,555
Range of Output Multipliers 1.05 - 3.60
Range of Earnings Multipliers 0.27 - 0.95
Range of Employment Multipliers (jobs per million in new demand) 6.39 - 25.36
Net-New Economic Activity from Organizational Spending $1,857,368
Net-New Earnings to Households from Organizational Spending $581,976
Employment Generated by Organizational Spending 16
Source: Bureau of Labor Statistics, 2010 RIMS II MultipliersAnalysis: Anderson Economic Group, LLC.
© 2014, Anderson Economic Group, LLC 26

Economic Impact Analysis
TOTAL ECONOMIC IMPACT
As shown in Table 8 below, when we consider the total net new economic activ-ity from attendee spending and local expenditures made by the ArtPrize organi-zation we see that:
1. ArtPrize 2013 generated total economic output of $22.2 in Greater Grand Rap-ids;
2. The event stimulated earnings to local households of over $6.3 million; and
3. Spending by attendees and the ArtPrize organization helped created a total of 253 jobs in 2013.
For a detailed table with economic impact results, see Table 11 on page B-4 and Table 12 on page B-5. See also “Economic Impact Estimate” on page A-2 for a description of the methodology used for the economic impact estimates.
TABLE 8. Total Economic Impact of ArtPrize 2013
Output Earnings Employment
Impacts from Attendee Spending $ 20,329,714 $ 5,751,662 237
Impacts from Event Operations $ 1,857,368 $ 581,976 16
Total Economic Impact $ 22,187,082 $ 6,333,638 253
Source: Bureau of Labor Statistics, 2010 RIMS II Multipliers; ArtPrize; AEG survey researchAnalysis: Anderson Economic Group, LLC
© 2014, Anderson Economic Group, LLC 27

Cultural and Long-term Benefits
V. Cultural and Long-term Benefits
An annual event like ArtPrize contributes positively to the reputation of an area, providing significant cultural and long-term benefits not captured in the eco-nomic impact estimate. The qualitative benefits received by Grand Rapids and the region may not be directly measured in dollars and cents, however their ben-efits will have an impact long into the future.
INCREASED AWARENESS OF THE REGION
Over 72 percent of survey respondents indicated that their trip to Grand Rapids was primarily due to ArtPrize. This new visitor and tourist activity impacts the city positively. Facilities that participated in ArtPrize as official display venues or otherwise had many more visitors during ArtPrize than they would have had the event not taken place. A number of these visitors will now be planning to return. This is based on an experience that they may not have had without the existence of ArtPrize.
For a visitor to the area, or a tourist planning their next adventure, the reputation of the Grand Rapids community is important. The presence of ArtPrize has added to the reputation-building efforts of the region and signals to potential visitors that the city has the ability to provide a unique shopping and dining experience, with new and exciting activities in which to take part.
EDUCATIONAL PROGRAMS
ArtPrize facilitated several educational programs and events on a variety of top-ics. Programs for young children at ArtPrize foster the development of enhanced arts and culture for the region into future generations, providing those who participate with an exposure to art that they otherwise may not have had the opportunity to experience. The programs attracted a over 10,300 students from 132 participating public and private schools in 2013.
Students who participated were able to visit any of the partnering institutions including:
• Gerald R. Ford Presidential Museum
• Grand Rapids Art Museum
• Grand Rapids Children's Museum
• Grand Rapids Public Library
• Grand Rapids Public Museum
TABLE 7. Attendee Reason for Visit
I. Reason for Visit to the Grand Rapids Area
ArtPrize Was the Primary Reason 72.7%
ArtPrize Was Not the Primary Reason 27.3%
Source: Anderson Economic Group Survey of Attendees
© 2014, Anderson Economic Group, LLC 28

Cultural and Long-term Benefits
• Grand Valley State University
• Kendall College of Art and Design of Ferris State University
• St. Cecilia Music Center
• Urban Institute for Contemporary Art
These programs were also able to draw a demographically diverse group of par-ticipants. The attendance of boys and girls alike was nearly equal (47.9 percent to 52.1 percent, respectively). While over 60 percent of attendees indicated that they were Caucasian, minority groups were also well-represented: 16.4 percent indicated they were African American, 14.5 percent Hispanic, and 7.4 percent indicated other ethnicities.
ArtStart is one example of a unique educational opportunity available to children. ArtStart is an online art competition in which children under the age of 18 were able to participate. Entries were based on youth experi-ences at ArtPrize and the focus was on art education. Over 50 children from 20 schools submitted entries and ten were chosen as winners by members of the community who vol-unteered as judges.
Higher education students benefit from ArtPrize, as it serves the pur-pose of a real-world application of work for those studying fine arts. Grand Rapids is home to four univer-sities that provided access to their facilities during the event. Students were able to display their art work and participate in the ArtPrize com-petition as well. This also provided an opportunity for the public to explore their campuses and to appreciate their presence in the community.
Adults were able to continue their education and cultural understanding during ArtPrize by learning from internationally-recognized educators and artists alike. Events for 2013 were focused on the role of contemporary art. Five educational speaker series events were attended by 555 people during ArtPrize 2013.
ArtPrize 2013 also included five family days featuring activities that parents, kids, and everyone in between could enjoy. Families were able to participate in
ArtPrize attendees lined up for exhibits at the Kendall Col-lege of Art and Design during ArtPrize 2013.
© 2014, Anderson Economic Group, LLC 29

Cultural and Long-term Benefits
poetry classes, guided tours of Kendall College, as well as a crafting workshop, where they made luminaries to be used as part of a larger event that took place.
RECOGNITION BY MEDIA
ArtPrize has received extensive media attention over the last five years, includ-ing millions of media placements. In addition to local publications, national media outlets, such as USA Today, the New York Times, and The Washington Post, ran stories featuring ArtPrize. This wide-reaching exposure helps further position the community as a desirable place to work, live, and play.
For example, ArtPrize was listed as one of the “Five Festive Events You Won’t
Want to Miss in 2013” by TIME magazine;16 and Grand Rapids and the beauti-ful Lake Michigan shore were listed as the number one place to visit in 2014 by
Lonely Planet.17 Not only do these articles both highlight ArtPrize the event, but they pinpoint Grand Rapids as an interesting area to a national audience that otherwise may not have known about the vibrancy of the community.
DOWNTOWN DEVELOPMENT AND BEAUTIFICATION
In preparation for ArtPrize 2013, several venues and information hubs com-pleted property improvement and beautification projects that provide long-term quality benefits to the area.
Additionally, an unknown number of other businesses and local facilities in and around the area gained exposure from the event and had extra incentive to par-ticipate in the beautification process happening around them. The property improvements and beautification projects which were completed provide long-term benefits for the local community as well as the Greater Grand Rapids area.
The continuation of ArtPrize and growth in tourism in the community not only provides the economic means to make property improvements, but also the motivation to take advantage of the stage that is set by putting the entire city on display.
An appealing downtown environment and thriving community attracts residents that are highly-skilled and educated. Businesses want to locate where they have access to a good workforce. With a good workforce, businesses are provided the opportunity to thrive and grow even further. ArtPrize provides Grand Rapids with an additional cultural showpiece, enhancing quality of life for current resi-dents and showcasing the area’s appeal to a wider audience of people and busi-ness.
16.Five Festive Events You Won’t Want to Miss in 2013, <http://style.time.com/2013/01/17/five-events-you-wont-want-to-miss-in-2013/>, accessed on October 23, 2013.
17.Top 10 US Travel Destinations for 2014, <http://www.lonelyplanet.com/usa/travel-tips-and-articles/top-10-us-travel-destinations-for-2014>, accessed on December 20, 2013.
© 2014, Anderson Economic Group, LLC 30
Appendix A. Methodology
Here we describe the methods used to compile a detailed demographic profile of who attends ArtPrize as well as our methods and calculations for the 2013 atten-dance estimate and economic impacts.
SURVEYS We surveyed ArtPrize attendees using a 15-question demographic survey and a 12-question economic survey. Three questions related to age, income, and resi-dential zip code were asked on both surveys and responses were combined and used in the aggregate.
Please see “Surveys” on page C-1 for a full list of survey questions and responses.
The demographic survey was administered from September 23 to 29, 2013 at the ArtPrize HUB at the Experience Grand Rapids event booth in the Skywalk at the Amway Grand Plaza. In order to collect a random sample, surveys were handed out at different times of day, as well as on week days and weekend days, in order to capture the many different types of people who attended the event at different times and days. Consideration was also taken into account for the fact that the HUB was a voter registration location and the Skywalk was not. Volun-teers from Experience Grand Rapids and ArtPrize administered the surveys after receiving instruction from Anderson Economic Group staff.
The economic survey was administered in the same manner from September 30 to October 6, 2013 at the same locations. Several different time slots were used to ensure that a broad audience was surveyed.
Participants were entered into a drawing for prizes from Experience Grand Rap-ids to entice participation. Overall, the demographic survey was taken by 573 respondents and the economic survey was taken by 418 respondents. This response exceeded our minimal target of 384 completions for each survey. This response level provides a 5 percent margin of error (confidence interval) with a 95 percent confidence level, assuming a population of 400,000. The higher response rates help bring the actual confidence level closer to 98 percent for most questions.
ATTENDANCE ESTIMATE
We estimated ArtPrize’s 2013 attendance using an estimation method that uti-lized the actual count of unique voters participating in the selection of ArtPrize winners and the actual number of those who were registered compared to survey responses indicating participation in the same activities.
© 2014, Anderson Economic Group, LLC A-1
Specifically, we estimated by:
1. Obtaining, from ArtPrize, total hard counts of unique voters participating in ArtPrize 2013.
2. Dividing the total count of registered voters for ArtPrize 2013 by the percentage of respondents who completed the survey at our Skywalk location who voted at ArtPrize 2013, providing us with an estimate of attendees.
3. Estimating the number of children in attendance at the event based on how many children under 16 the adult survey respondents had indicated were in their party while visiting ArtPrize, on average. We assumed eight children per party when the respondent indicated “six or more.”
4. Multiplied the adult and children attendance estimate with survey information about how long the average attendee spent at the event.
See Appendix C. “Surveys” on page C-1 for all survey questions and responses.
For artist and members of the media who participated in ArtPrize we obtained hard numbers for their registration, attendance, and duration of visit from Art-Prize.
ECONOMIC IMPACT ESTIMATE
To estimate the economic impact generated by ArtPrize 2013, we took the fol-lowing steps:
1. Identified the impact region where in which the majority of ArtPrize activity both directly and indirectly provides a benefit. We determined this Grand Rap-ids area to consist of Kent and Ottawa Counties.
1. Estimated the total number of attendees and the related attendee-days during ArtPrize 2013 using survey results and voter registration data.
2. Calculated the total estimated direct expenditures by ArtPrize attendees by mul-tiplying the average amount spent per attendee per day by the number of attendee-days. The average amount spent per attendee-day was taken from our online survey, question 11, which asked specifically about net new spending. For those responding “over $50” we assumed an average of $75. We estimated media and visiting artist expenditures to be $225 per day. This is based on an approximated daily budget of $150 for accommodations, $50 for meals and incidentals, and $25 for transportation. For students attending the K-12 educa-tional programs, we assumed spending of $10 per day for food and other inci-dentals. An average is used to allow for the fact that some likely spent more per day, while others, including some artists who were hosted by local families and thus had no lodging expenses, spent less.
3. Assessed revenues and gross operating expenditure data as collected from Art-Prize.
4. Employed substitution-effect parameters to build into the economic impact model, to ensure a true net economic impact estimate. Substitution effect parameters account for expenditures that simply replace other expenditures in a region during the event, or displace other expenditures due to the event.
© 2014, Anderson Economic Group, LLC A-2
5. Obtained economic impact multipliers from the U.S. Bureau of Economic Anal-ysis for the Kent and Ottawa county area, and selected the most appropriate multipliers, based on expenditure patterns, for estimating total economic impacts, employment creation, and earnings estimates.
6. Multiplied the net-new direct expenditures estimates for attendees and ArtPrize operations by the multipliers to arrive at total net-new direct and indirect expen-ditures impact estimates.
Economic Impact Multipliers. This analysis utilizes multipliers from the U.S. Bureau of Economic Analysis RIMS II direct-effect multipliers. Indirect multi-pliers estimate the amount of indirect effects on expenditures that result from each additional dollar spent in a sector. For example, a regional indirect multi-plier of 1.0 implies that for each dollar spent in a given industry, one additional dollar is spent in the region. These expenditures circulate throughout the econ-omy until, eventually, they have leaked outside of the region.
The Problem of Exaggerated “Economic Impact” Claims
Unfortunately, promoters of many large events and projects have claimed eco-nomic benefits that proved to be too good to be true. There are now a number of thorough examinations of the actual and claimed “economic impact” of such events that prove, to the extent possible with the available data, that the original claims of many such promoters were grossly exaggerated. Improper handling of substitution effects and economic multipliers are two common sources of this.
Improper Handling of Substitution. To illustrate how a failure to account for the shifting of economic activity can exaggerate an economic impact, consider the following. The expenditures of a family from Grand Rapids attending Art-Prize rather than going to dinner and a movie do not have a net economic impact on Grand Rapids—their expenditures are simply a shift in economic activity away from another local activity. There would be a net economic impact, how-ever, if they went to ArtPrize instead of staying at home or spending a weekend outside of the region. The true economic impact of an event only accounts for net benefits, that is, dollars spent in the area that would otherwise be spent else-where or not at all.
Improper Use of Multipliers. Another source of exaggeration in other reports is the tendency to use multipliers that overstate the indirect impact of an event. One reason for this is a failure to consider how much of each dollar spent is transferred out of the local economy, such as profits from a restaurant or hotel chain going back to headquarters outside of the area.
However, there is no question that large events can and do provide significant economic benefits to a local region. Careful analyses of several events show that, in some cases, the economic benefits of such events far outweighed the local costs.
© 2014, Anderson Economic Group, LLC A-3

CAUTIONS AND LIMITATIONS
The analysis and projections in this report are based on available data, profes-sional judgement, and numerous assumptions regarding actual events. Because economic, market, and industrial conditions change; data can prove incomplete or misleading; and government policies are outside our control; we cannot war-rant that actual economic impacts during the period will align with those esti-mated in this report. We recommend careful consideration be given to actual market and industry conditions by any person using portions of this analysis in any investment decision, and do not guarantee the future outcome of any busi-ness venture, government policy, or legal or regulatory proceeding.
© 2014, Anderson Economic Group, LLC A-4

Appendix B. Data
Included in this appendix are:
• Table 8, “2013 ArtPrize Attendance Estimate,” on page B-2.
• Table 9, “2013 ArtPrize Organizational Revenues Assessment,” on page B-3.
• Table 10, “2013 ArtPrize Organizational Expenditures Assessment,” on page B-3.
• Table 11, “Economic Impact Analysis, 2013 ArtPrize Attendee Expenditures,” on page B-4.
• Table 12, “Economic Impact Analysis, 2013 ArtPrize Organizational Expendi-tures,” on page B-5.
© 2014, Anderson Economic Group, LLC B-1
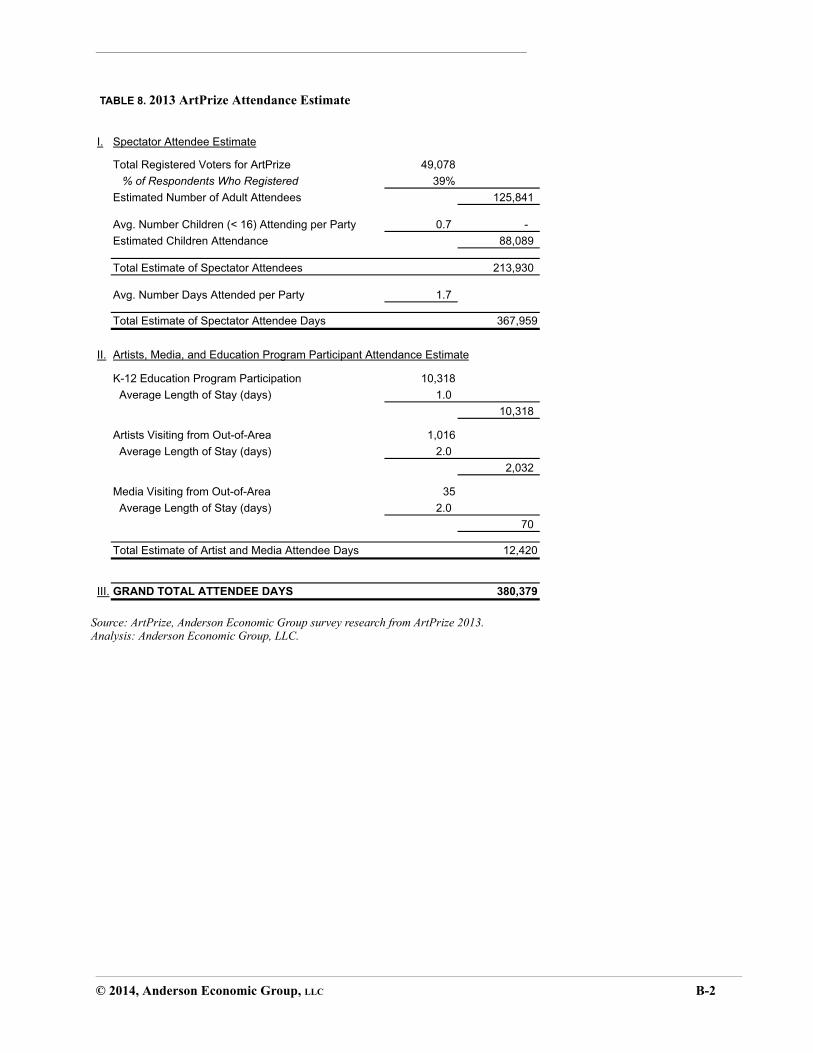
TABLE 8. 2013 ArtPrize Attendance Estimate
Source: ArtPrize, Anderson Economic Group survey research from ArtPrize 2013.Analysis: Anderson Economic Group, LLC.
I. Spectator Attendee Estimate
Total Registered Voters for ArtPrize 49,078% of Respondents Who Registered 39%
Estimated Number of Adult Attendees 125,841
Avg. Number Children (< 16) Attending per Party 0.7 -Estimated Children Attendance 88,089
Total Estimate of Spectator Attendees 213,930
Avg. Number Days Attended per Party 1.7
Total Estimate of Spectator Attendee Days 367,959
II. Artists, Media, and Education Program Participant Attendance Estimate
K-12 Education Program Participation 10,318 Average Length of Stay (days) 1.0
10,318
Artists Visiting from Out-of-Area 1,016 Average Length of Stay (days) 2.0
2,032
Media Visiting from Out-of-Area 35 Average Length of Stay (days) 2.0
70
Total Estimate of Artist and Media Attendee Days 12,420
III. GRAND TOTAL ATTENDEE DAYS 380,379
© 2014, Anderson Economic Group, LLC B-2
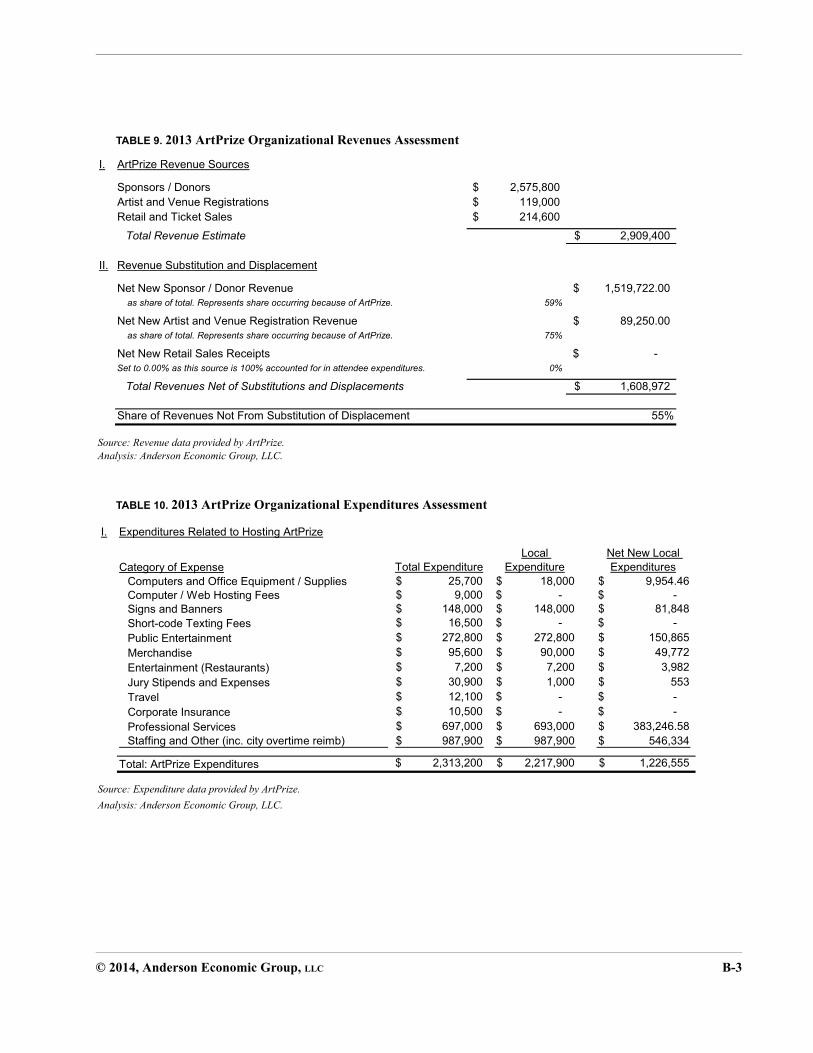
TABLE 9. 2013 ArtPrize Organizational Revenues Assessment
Source: Revenue data provided by ArtPrize.Analysis: Anderson Economic Group, LLC.
TABLE 10. 2013 ArtPrize Organizational Expenditures Assessment
Source: Expenditure data provided by ArtPrize.
Analysis: Anderson Economic Group, LLC.
Table X. ArtPrize Organizational Revenue, 2013
I. ArtPrize Revenue Sources
Sponsors / Donors 2,575,800$Artist and Venue Registrations 119,000$Retail and Ticket Sales 214,600$
Total Revenue Estimate 2,909,400$
II. Revenue Substitution and Displacement
Net New Sponsor / Donor Revenue 1,519,722.00$ as share of total. Represents share occurring because of ArtPrize. 59%
Net New Artist and Venue Registration Revenue 89,250.00$ as share of total. Represents share occurring because of ArtPrize. 75%
Net New Retail Sales Receipts -$Set to 0.00% as this source is 100% accounted for in attendee expenditures. 0%
Total Revenues Net of Substitutions and Displacements 1,608,972$
Share of Revenues Not From Substitution of Displacement 55%
I. Expenditures Related to Hosting ArtPrize
Category of Expense Total ExpenditureLocal
ExpenditureNet New Local Expenditures
Computers and Office Equipment / Supplies 25,700$ 18,000$ 9,954.46$Computer / Web Hosting Fees 9,000$ -$ -$Signs and Banners 148,000$ 148,000$ 81,848$Short-code Texting Fees 16,500$ -$ -$Public Entertainment 272,800$ 272,800$ 150,865$Merchandise 95,600$ 90,000$ 49,772$Entertainment (Restaurants) 7,200$ 7,200$ 3,982$Jury Stipends and Expenses 30,900$ 1,000$ 553$Travel 12,100$ -$ -$Corporate Insurance 10,500$ -$ -$Professional Services 697,000$ 693,000$ 383,246.58$Staffing and Other (inc. city overtime reimb) 987,900$ 987,900$ 546,334$
Total: ArtPrize Expenditures 2,313,200$ 2,217,900$ 1,226,555$
© 2014, Anderson Economic Group, LLC B-3

© B-4
S a;
A
2014, Anderson Economic Group, LLC
TABLE 11. Economic Impact Analysis, 2013 ArtPrize Attendee Expenditures
ource: Aggregate artist and media registration information data provided by ArtPrize and excludes local media who would have otherwise been in the areBureau of Labor Statistics, 2010 RIMS II Multipliers; AEG estimates and surveying for expenditure data.
nalysis: Anderson Economic Group, LLC.
Table X. Net Economic Impact of Attendee Expenditures at ArtPrize, 2013
I. Spectator Attendance and Spending
Spectator Attendance Days 367,959Net New Daily Expenditures Per Spectator 29.77$
Net New Spectator Spending Estimate 10,954,144$
II. Artist, Media, ansd K-12 Student Attendance and Spending
Artist and Media Attendee-Days 2,102Estimated Daily Expenditure Per Attendee (including accommodations) 225.00$
Net New Artist and Media Spending Estimate 472,904$
K-12 Student Education Program Attendee-Days 10,318Estimated Daily Expenditure Per Attendee 10.00$
Net New K-12 Student Program Attendee Spending Estimate 103,180$
TOTAL: NET NEW EXPENDITURES BY ATTENDEES 11,530,228$
note: daily average over 19-days 606,854$
III. Economic Impact Calculation
Output Multiplier 1.76Net New Economic Activity From ArtPrize Attendee Spending 20,329,714$
Earnings Multiplier 0.50Net New Earnings to Households From ArtPrize Attendee Spending 5,751,662$
Employment Multiplier 20.52Net New Employment From ArtPrize Attendee Spending 237

© B-5
er
398962693629
.2
.0
.0
.3
.1
.0
.5
.0
.0
2014, Anderson Economic Group, LLC
TABLE 12. Economic Impact Analysis, 2013 ArtPrize Organizational Expenditures
Source: Expenditure data provided by ArtPrize; Bureau of Labor Statistics, 2010 RIMS II Multipliers
Analysis: Anderson Economic Group, LLC
I. Economic Multipliers, RIMS II for Kent-Ottawa Counties
Expense and Multiplier Categories Output Multiplier Earnings Multiplier Employment Multipli
Computers and Office Equipment / Supplies 1.69 0.49 18.5Computer / web hosting fees 1.48 0.27 6.3Signs/banners 1.86 0.48 12.4Short-code Texting Fees 1.48 0.27 6.3Public Entertainment 1.73 0.55 19.6Merchandise 3.60 0.95 25.1Entertainment (restaurants) 1.81 0.49 25.3Jury stipends/expenses 1.05 0.28 9.1Travel 1.46 0.30 6.9Corporate Insurance 1.70 0.43 9.8Professional Services 1.75 0.66 14.2Staffing and Other (inc. city overtime reimb) 1.05 0.28 9.1
II. Economic Impacts from Net New Local Expenditures
Expense Categories Output Earnings Employment
Computers and Office Equipment / Supplies 16,807$ 4,875$ 0Computer / Web Hosting Fees -$ -$ -Signs and Banners 151,828$ 39,082$ 1Short-code Texting Fees -$ -$ -Public Entertainment 260,529$ 83,082$ 3Merchandise 179,165$ 47,473$ 1Entertainment (Restaurants) 7,201$ 1,969$ 0Jury Stipends and Expenses 579$ 155$ 0Travel -$ -$ -Corporate Insurance -$ -$ -Professional Services 668,919$ 251,985$ 5Staffing and Other (inc. city overtime reimb) 572,339$ 153,356$ 5
Total Economic Impact 1,857,368$ 581,976$ 16

Appendix C. Surveys
Included in this appendix are:
• “Questions Unique to the Demographic Survey and Results” on page C-2.
• “Questions Unique to the Economic Survey and Results” on page C-6.
• “Questions Posed on Both Surveys and Results” on page C-8.
© 2014, Anderson Economic Group, LLC C-1

Questions Unique to the Demographic Survey and Results
ResponsePercent
ResponseCount
0.0%79.1% 4538.9% 510.3% 20.9% 50.0%8.7% 502.1% 12
573
ResponsePercent
ResponseCount
48.8% 27735.2% 20048.6% 2762.3% 139.7% 553.9% 226.3% 36
5685
ResponsePercent
ResponseCount
56.9% 32310.4% 5940.7% 23129.8% 16951.4% 29219.4% 11039.4% 22445.4% 25849.3% 28030.3% 17210.0% 5765.8% 37455.5% 31551.2% 29125.4% 144
5685
Primarily walked
Gourmet/fine food
Commercial airline
Outdoor recreation
Other
Bus
What was your primary means of transportation to Grand Rapids for ArtPrize?
Painting, sewing or crafting
Walk/bike
Which of the below activities do you participate in on a regular basis? (Check all that apply.)
Train
skipped question
To get around during your time at ArtPrize, have you�? (Check all that apply.)
Physical fitness/exercise
answered question
Ridden a bicycle
answered question
Answer Options
Local shopping/farm markets
Music/theater/arts
Online shopping
Answer Options
Purchased and used an ArtPrize transportation wristband
Collecting/buying artwork
Answer Options
Domestic travel
skipped question
International travel
answered question
Volunteerism
Rental vehicle
Used a complimentary ArtPrize transportation wristband
Reading
My own vehicle
Found free parking
skipped question
Used public transportation including the Rapid or DASH
Private airline
Paid for parking
Fashion and designGardening
Watching television
© 2014, Anderson Economic Group, LLC C-2

ResponsePercent
ResponseCount
19.8% 11110.0% 5637.6% 2116.1% 347.0% 39
30.3% 1706.6% 37
71.7% 40218.2% 10244.0% 24727.6% 15523.0% 1293.4% 198.2% 462.5% 14
13.7% 7713.5% 7646.3% 2602.1% 12
19.1% 10732.8% 18418.4% 10323.9% 13436.2% 20324.8% 1394.5% 25
10.2% 5710.3% 5829.8% 16723.9% 13434.2% 192
56112
ResponsePercent
ResponseCount
59.6% 32938.0% 21063.8% 35240.4% 22313.0% 7211.8% 657.1% 39
46.4% 25655221
Bonefish Grill
Laptop computer
WalgreensKroger
Neiman Marcus
The Home Depot
Taco Bell
P.F. Chang's
Nordstrom
answered questionDigital camera
Verizon
Desktop computer
Answer Options
Whole Foods
Which of these products do you regularly use? (Check all that apply.)
Meijer
Hungry Howie's
answered question
Sears
skipped question
Mp3 player
Sprint
Subway
CVS Caremark
J.C. Penny
Baja Fresh Mexical Grill
Wal mart
Papa John's Pizza
skipped question
Rite Aid
Answer Options
Home theater system
Kohl's
Which of these national merchants do you prefer? (Check all that apply.)
Panera Bread
BRAVO! Cucina Italiana
Tablet/iPad/eReader
Target
Lowe's
Gaming system
Smartphone
Trader Joe's
Menards
Macy's
AT&T
McDonald's
© 2014, Anderson Economic Group, LLC C-3

ResponsePercent
ResponseCount
78.7% 37715.7% 7528.0% 1344.6% 22
18.4% 881.7% 8
32.6% 15610.2% 49
47994
ResponsePercent
ResponseCount
9.9% 537.4% 404.1% 223.2% 172.8% 15
78.1% 42053835
ResponsePercent
ResponseCount
2.2% 128.9% 48
19.8% 10713.0% 7032.8% 17723.3% 126
54033
ResponsePercent
ResponseCount
0.9% 53.3% 182.8% 15
90.1% 4850.9% 51.9% 10
53835
Black/African American
I live in downtown Grand Rapids
Answer Options
Other
Some high school
Which social media outlets do you regularly use? (Check all that apply.)
skipped question
I have used the ArtDASH bus service and would like the routes
Graduate or Doctorate degree
Answer Options
Tumblr
Answer Options
Hispanic/Latino
answered question
Which of the below statements describe you? (Check all that apply.)
I am attending school in downtown Grand Rapids
skipped question
answered question
High school graduate
answered question
White/Caucasian
skipped question
I would prefer to see the separate North and South DASH
Some college
skipped question
Answer Options
MySpace
What is your ethnicity?
What is the highest level of education you have completed?
None of these are applicable
Associate degree
Asian Pacific Islander
Native American/American IndianOther
answered question
Google+
Bachelor's degree
I work in downtown Grand Rapids
© 2014, Anderson Economic Group, LLC C-4

ResponsePercent
ResponseCount
37.8% 20434.7% 18717.6% 957.2% 392.6% 14
53934
ResponsePercent
ResponseCount
59.3% 3224.6% 25
12.3% 673.3% 18
18.4% 1002.0% 11
54330
answered question
I am staying with friends or family
skipped question
What is your current residential status?
Divorced or separatedWidowed
Other
Answer Options
skipped question
I am a renter
I have a mortgage on my home
answered question
Single, never married
Answer Options
What is your marital status?
I own my home free and clear
Other
MarriedUnmarried, living with partner
© 2014, Anderson Economic Group, LLC C-5

Questions Unique to the Economic Survey and Results
ResponsePercent
ResponseCount
48.9% 20451.1% 213
4171
ResponsePercent
ResponseCount
57.2% 23725.6% 1063.4% 14
13.8% 57414
4
ResponsePercent
ResponseCount
19.5% 8133.4% 13921.2% 8810.6% 444.3% 18
11.1% 46416
2
ResponseAverage
ResponseCount
3.87 416416
2
Yes
Close to 1 full day (5 12 hours)
skipped questionanswered question
Have you voted (or do you plan on voting) in this year�s ArtPrize competition? Select only one.
skipped question
No
No, I just want to see the art and don�t care about the voting
answered question
Are you registered to vote as part of the ArtPrize competition?
answered question
More than 4 full days
Answer Options
Half day (about 5 hours) or lessAnswer Options
skipped question
skipped question
Between 3 and 4 full days
Between 1 and 2 full days (12 24 hours)
How much time did you, or do you, anticipate spending at ArtPrize this year?
Answer Options
answered question
Between 2 and 3 full days
Yes, I have voted or will be voting
No, I�m not voting for other reasons not listed here
Number
How many people total (including you) are in your party while attending ArtPrize?
No, voting seems too complicated
Answer Options
© 2014, Anderson Economic Group, LLC C-6

ResponseAverage
ResponseCount
0.70 418418
ResponsePercent
ResponseCount
72.7% 296
27.3% 111
40711
ResponsePercent
ResponseCount
16.1% 6614.6% 6069.3% 285
4117
ResponsePercent
ResponseCount
8.6% 3514.5% 5936.3% 14820.8% 8519.9% 81
40810
Answer Options
NumberAnswer Options
Less than $10 per person I spent a little more than I would
skipped question
Yes, at a hotel or motel
answered questionskipped question
answered question
Was ArtPrize the primary reason for your trip to the Grand Rapids area?
$0.00 I would have spent about the same amount in the areaAnswer Options
skipped question
More than $50 per person I spent about this much more
skipped question
answered question
Yes, if ArtPrize was not occurring, I probably would not havevisited the area.
$10 $25 per person I spent about this much more than I
answered question
$25 $50 per person I spent about this much more than I
While attending ArtPrize, about how much did you spend (as a per person, per day average) inaddition to what you otherwise would have spent in the Grand Rapids area? Please consider
How many children (under 16) are in your party while attending ArtPrize?
While visiting ArtPrize, are you staying overnight?
No, I would have visited the area even if ArtPrize was notgoing on.
No
Answer Options
Yes, with family or friends
© 2014, Anderson Economic Group, LLC C-7

Questions Posed on Both Surveys and Results
All Attendees Response Count16 20 3.9% 3721 25 6.9% 6626 35 10.4% 9936 44 10.6% 10145 54 20.6% 19755 64 29.0% 27765 74 15.5% 14875 + 3.0% 29
95437
Response Count
886105
ResponsePercent Response Count
Less than $40,000 25.6% 208$40,000 to $49,999 12.9% 105$50,000 to $59,999 9.1% 74$60,000 to $69,999 7.5% 61$70,000 to $79,999 8.1% 66$80,000 to $89,999 5.8% 47$90,000 to $99,999 6.9% 56$100,000 to $124,999 10.7% 87$125,000 to $149,999 4.3% 35$150,000 to $174,999 2.8% 23$175,000 to $199,999 1.8% 15$200,000 or more 4.3% 35
812179skipped question
Please see map of responses.answered questionskipped question
What is your annual household income, pre tax?
Answer Options
answered question
What is your age?
Answer Options
answered questionskipped question
What is the zip code for your current place of residence?
Answer Options
© 2014, Anderson Economic Group, LLC C-8
Appendix D. About AEG
Anderson Economic Group, LLC was founded in 1996 and today has offices in East Lansing, Michigan and Chicago, Illinois. AEG is a research and consulting firm that specializes in economics, public policy, financial valuation, and mar-ket research. AEG’s past clients include:
• Governments such as the states of Michigan, North Carolina, and Wisconsin; the cities of Detroit, Cincinnati, Norfolk, and Fort Wayne; counties such as Oak-land County, Michigan, and Collier County, Florida; and authorities such as the Detroit-Wayne County Port Authority.
• Corporations such as Meijer, Spartan Stores, General Motors, Ford, Delphi, Honda, Taubman Centers, The Detroit Lions, PG&E Generating, Gambrinus, Labatt USA, InBev USA, Nestle, and automobile dealers and dealership groups representing Chrysler, Chevrolet, Cadillac, GMC, Dodge, Jeep, Toyota, Honda, Kia, Mercedes-Benz, and other brands.
• Nonprofit organizations such as the Michigan State University, Wayne State University, University of Michigan, Van Andel Institute, the Michigan Manu-facturers Association, United Ways of Michigan, Service Employees Interna-tional Union, Automation Alley, the Grand Rapids Area Chamber of Commerce, the Michigan Chamber of Commerce, and Detroit Renaissance.
Please visit www.AndersonEconomicGroup.com for more information.
AUTHORS Scott D. Watkins
Mr. Watkins is a Senior Consultant with Anderson Economic Group, LLC, with expertise in economic, industry, and market analyses, as well as public policy. As the firm’s Director of Market and Industry Analysis, he and his team work with clients in the public and private sectors to enhance their understandings economics and market conditions, and to develop strategies that strengthen competitive positions. Mr. Watkins also serves as the firm’s financial officer.
Among the clients for whom he has worked are more than 100 automobile deal-erships; the Project Management Institute; City of Sandusky, Ohio; City of Hamtramck, Michigan; City of Lansing, Michigan; Collier County, Florida; Northern Michigan University; Michigan State University; Ferris State Univer-sity; Lansing Community College; Michigan Retailers Association; Grand Rap-ids Chamber of Commerce, Spartan Stores, Meijer, and the West Virginia High Technology Consortium Foundation. Mr. Watkins has made presentations to a number of audiences and media outlets on topics concerning the automotive industry, economics, education finance, and industry trends.
Prior to joining Anderson Economic Group in 2001, Mr. Watkins was an analyst in the automotive market and planning group at J.D. Power and Associates, and a marketing assistant with Foster, Swift, Collins, and Smith P.C.
© 2014, Anderson Economic Group, LLC D-1

Mr. Watkins holds an M.B.A. from the Eli Broad College of Business at Michi-gan State University. He also has a B.A. in marketing from Eli Broad College of Business and a B.A. in international relations from the James Madison College, both at Michigan State University. He serves on the board of directors for the James Madison College Alumni Association and the Michigan Remembers 9-11 Fund, and is a member of the Research and Technical Assistance committee for the Michigan Tourism Strategic Plan.
Lauren Branneman
Ms. Branneman is a Senior Analyst with Anderson Economic Group working in the market and industry analysis practice area. Her areas of expertise include market analysis, urban and community development, location analysis, and trade area assessments. Ms. Branneman also manages the firm’s Geographic Information System (GIS).
Among the clients for whom she has worked are the Lansing Economic Devel-opment Corporation, Northern Michigan University, Automation Alley, Project Management Institute, and private developers and businesses across the coun-try. She has also worked on a number of auto dealership franchise cases, includ-ing a recent matter in which her work was cited as a primary factor for a favorable decision for the client.
Prior to joining Anderson Economic Group, Lauren served as an intern in Con-stituent Relations for the Michigan Senate and worked with the City of Wil-liamston under the Director of Planning and Development. She holds a Master’s degree in Local Government Public Administration from Western Michigan University and a Bachelor’s of Social Science degree in Urban and Regional Planning from Michigan State University.
Tyler Marie Theile
Tyler Theile is an Analyst at Anderson Economic Group. Her work includes research and analysis. She is also the firm’s Marketing and Quality Assurance Manager.
Ms. Theile has contributed to recent projects including a minority valuation for a beer distributor; an analysis of power transmission infrastructure projects; and an economic impact survey related to auto insurance legislation in Michigan. She has also contributed to previous reports including Automation Alley’s Annual Technology Industry Report and Michigan’s University Research Corri-dor: Annual Economic Impact Report.
Prior to joining AEG, Ms. Theile worked in the Executive Office of the Attor-ney General and in fund raising for the Michigan Republican Party and the DeVos for Governor Campaign.
© 2014, Anderson Economic Group, LLC D-2
Tyler is a graduate of Michigan State University, James Madison College, where she received a bachelor’s degree in international relations with a specialization in political economy.
© 2014, Anderson Economic Group, LLC D-3