Artificial Prediction Markets as a tool for Syndromic ...ceur-ws.org/Vol-1148/paper9.pdf ·...
13
Artificial Prediction Markets as a tool for Syndromic Surveillance Fatemeh Jahedpari 1 , Julian Padget 1 , Marina De Vos 1 , Benjamin Hirsch 2 1 Department of Computer Science, University of Bath, UK {f.jahedpari,j.a.padget,m.d.vos}@bath.ac.uk 2 EBTIC, Khalifa University, United Arab Emirates [email protected] Abstract. A range of data sources across the internet, such as google search terms, twitter topics and Facebook messages, amongst others, can be viewed as kinds of sensors from which information might be extractable about trends in the expression of matters of concern to people. We focus on the problem of how to identify emerging trends after the original textual data has been processed into a quantitative form suitable for the application of machine learning techniques. We present some preliminary ideas, including an agent-based implementation and some early results, about the application of artificial prediction markets to such data, taking the specific domain of syndromic surveillance (early stage recogni- tion of epidemics) as an example, using publicly available data sets. 1 Introduction This paper outlines some early stage research into the application of prediction markets to syndromic surveillance. Prediction markets are seen as a mechanism to forecast the outcome of future events by aggregating public opinion, in which market participants trade so-called securities that represent different probabilities about the (expected) out- come of a scenario. We describe prediction markets in more detail in section 2 and compare them with alternative approaches in section 5. Syndromic surveillance monitors population health indicators which are apparent be- fore confirmatory diagnostic tests become available, in order to predict a disease out- break within a society at the earliest possible moment, with the aim of protecting com- munity health. Clearly, the earlier a health threat within a population is detected, the lower the morbidity and the higher the number of lives that may be saved. Syndromic surveillance data sources include, but are not limited to, coding of diagnoses at ad- mission or discharge emergency department, chief complaints, medical encounter pre- diagnostic data, absentee rates at schools and workplaces, over-the-counter pharmacy sales, Internet and open source information such as people post in social media. Each of these types of data can generate a signal during a disease development. Therefore, given
Transcript of Artificial Prediction Markets as a tool for Syndromic ...ceur-ws.org/Vol-1148/paper9.pdf ·...
Artificial Prediction Markets as a tool for SyndromicSurveillance
Fatemeh Jahedpari1, Julian Padget1, Marina De Vos1, Benjamin Hirsch2
1 Department of Computer Science, University of Bath, UK{f.jahedpari,j.a.padget,m.d.vos}@bath.ac.uk
2 EBTIC, Khalifa University, United Arab [email protected]
Abstract. A range of data sources across the internet, such as google searchterms, twitter topics and Facebook messages, amongst others, can be viewed askinds of sensors from which information might be extractable about trends in theexpression of matters of concern to people. We focus on the problem of how toidentify emerging trends after the original textual data has been processed into aquantitative form suitable for the application of machine learning techniques. Wepresent some preliminary ideas, including an agent-based implementation andsome early results, about the application of artificial prediction markets to suchdata, taking the specific domain of syndromic surveillance (early stage recogni-tion of epidemics) as an example, using publicly available data sets.
1 Introduction
This paper outlines some early stage research into the application of prediction marketsto syndromic surveillance. Prediction markets are seen as a mechanism to forecast theoutcome of future events by aggregating public opinion, in which market participantstrade so-called securities that represent different probabilities about the (expected) out-come of a scenario. We describe prediction markets in more detail in section 2 andcompare them with alternative approaches in section 5.
Syndromic surveillance monitors population health indicators which are apparent be-fore confirmatory diagnostic tests become available, in order to predict a disease out-break within a society at the earliest possible moment, with the aim of protecting com-munity health. Clearly, the earlier a health threat within a population is detected, thelower the morbidity and the higher the number of lives that may be saved. Syndromicsurveillance data sources include, but are not limited to, coding of diagnoses at ad-mission or discharge emergency department, chief complaints, medical encounter pre-diagnostic data, absentee rates at schools and workplaces, over-the-counter pharmacysales, Internet and open source information such as people post in social media. Each ofthese types of data can generate a signal during a disease development. Therefore, given
the vast amount of these data sources, a proper mechanism is necessitated to integratethem as soon as they become available.
In this research, we focus on developing a novel syndromic surveillance technique byintegrating different data sources inspired by the crowd-sourcing behaviour of predic-tion markets. To achieve our goal, we train a multiagent system in an artificial predictionmarket in a semi-supervised manner.
2 Prediction Markets
Prediction markets have been used to forecast accurately the outcome of political con-tests, sporting events, and economic outcomes [19]. In this research, we use an artifi-cial prediction market as a mechanism to integrate several syndromic surveillance datasources to predict a level of disease activity within a population on a specific date. Thissection briefly explains the preliminaries of prediction markets.
The prediction market, also known as an information market, originated at the IowaElectronic Marketplace (IEM) in 1988 as a means to bet on presidential elections. Aprediction market aims to utilise the aggregated wisdom of the crowd in order to predictthe outcome of a future event [16]. In these markets, traders’ behaviour has the effect ofexternalising their private information and beliefs about the possible outcomes, and canhence be used to forecast an event accurately [12]. Prediction markets are increasinglybeing considered as approaches for collecting, summarising and aggregating dispersedinformation by governments and corporations [10].
In prediction markets, traders bet on the outcome of future events by trading securities.A security is a financial instrument, like a financial stock, that pays a profit (or makesa loss) based on the outcome of the event. Each outcome of an event has a securityassociated with it. Traders can buy or sell any number of securities before the expirytime of the security. A security expires when the outcome of the event is realised. Toillustrate a simple case, a prediction market can be used to predict “if candidate ‘X’ willwin the election” by offering two securities of ‘Yes’ and ‘No’. Assuming the marketfinally ends with candidate ‘X’ winning the election, all traders will receive $1 payofffor each ‘Yes’ security they own and $0 for their ‘No’ securities, losing the money theyspent on buying them.
The aggregated monetary bets made by market traders dynamically determine the priceof each security before the market ends. The market price of a security represents theprice at which the security can be bought or sold. Also, it can be interpreted as repre-senting the probability of that outcome occurring by fusing the beliefs of all the marketparticipants. Arguably, the price that an agent would pay to buy a security indicateshow confident s/he is in the outcome of the event. For example, if a trader believes thatthe chance of candidate ‘X’ winning is 80%, s/he then would be willing to buy a ‘Yes’security at any price up to $0.80.
A prediction market is run by a market-maker who is the company or individual thatinteracts with traders to buy and sell securities. The market-maker determines the mar-ket price using a market trading protocol. The logarithmic market scoring rule (LMSR)designed by Hanson [9] is an automated market maker. Using LMSR, the price and costof a security is calculated as follows:
C(qi) = b ∗ log(m∑i=1
eqi/b)
and
P (qi) =exp(qi/b)∑mj=1 exp(qj/b)
respectively, where m is number of securities that market offers, each for one possibleoutcome and qi ∈ (q1, q2, . . . , qm) represents the number of units of security i heldby market traders The larger the value of b, the more money the market maker canlose. It also means that traders can purchase additional quantities of a security withoutcausing significant price swings. Note that the price of a security only applies for buyinga infinitesimal number of shares and the price of the security immediately changes assoon as a traders start trading. In order to calculate the cost of a trading X securities,the market makers must calculate C(q +X)− C(q).
3 Agent-Based Simulation Architecture
In order to explore empirically the application of artificial prediction markets to syn-dromic surveillance, we have developed an agent-based simulation, which we now de-scribe, followed by some preliminary results in section 4.
3.1 Agents and Strategies
Our model integrates data and beliefs of different data streams by simulating an artificialprediction market to predict the outcome of an event, which in this case is the diseaseactivity level on a specific date. Each data stream includes the quantitative value of aparticular disease activity level for a specific place for different period of time. Eachagent is responsible for one data stream and trades securities in various prediction mar-kets based on its capital and belief about the disease activity level of the market eventdate. Trading agents will in due course (see below) learn from each market based on therevenue they receive and the losses they make when the market closes. Consequently,they can update their strategy, beliefs and confidence for the future markets.
The system has a market-maker that uses a scoring rule to calculate the market pricefor each security in the market, and a data distributor that provide agents with the datastream for which they are responsible, and trading agents. The simulation mechanism,
specified in Algorithm 1, is as follows. At the beginning of the simulation, all the tradingagents are awarded an equal amount of initial capital. For each training example, aprediction market (let us say prediction market for week T ) is established. At this time,the Data Distributor Agent provides available data to the trading agents, according totheir role. Then, the trading agents participate in the market according to their availablecapital, beliefs, and trading strategies. Agents can trade any number of securities beforethe deadline for the closing of the market. Once the market deadline is reached, themarket-maker reveals the winning security and rewards the winning security holderswith $1 for each winning security they own. These revenues are added to their capital.However, the agents who own losing securities, lose capital equal to the amount spenton purchasing them.
During the simulation, agents with superior data, strategy and analysis algorithms arelikely to accumulate greater capital and hence affect market prices and eventually theoutcome. In other words, important – by these metrics – agents are identifiable and havegreater influence in predicting the outcome of the event. This increased influence of themore successful agents should increase the accuracy of the system overall: the agentsare not in competition per se, so we do not care which agents are better, but we do wantthe better ones to have more effect on the prediction mechanism.
The first agent strategy is based on zero intelligence [7], and so has no scope for learn-ing: buy-sell and security choices are random subject to the constraint of not trading at aloss. For the second strategy, we add a basic learning mechanism, following the designof zero intelligence plus [3], in which agents update their trading strategy and beliefsbased on the reward they received from the market in order to improve their reward infuture markets. This is achieved by incorporates a simple machine learning mechanism(Widrow-Hoff) to adapt their individual behaviour to the market trend.
3.2 Market Instantiation
Different data sources have different timeliness in detecting a disease outbreak. Forexample, some data sources such as social media data can signal a disease activity levelperhaps two weeks earlier than physician data. Therefore, for the system to be capableof forecasting the outcome at the earliest possible moment and not wait for all theagents’ data to arrive to start prediction, we will run multiple concurrent markets forconsecutive prediction weeks. For example, if the simulation week number is 1, then4 further markets for weeks 2 to 5 will also be open. Once the deadline of the firstmarket (week 2) is reached, then that market (week 2) closes and another market afterthe last market is opened (week 6). Consequently, the agents who have data for thosefurther markets can start trading earlier in those markets and take advantage of cheaperprices, which will lead to the updating of market prices as early as possible. In addition,all data with different timeliness ranging from 4 weeks to one day before the event datewill be incorporated in each market and at the same time agents can use their knowledgeachieved from the previous market when predicting the outcome of a given market.
Algorithm 1: Agent-Based Simulation Architecture Algorithm
1 Give start up capital to each agent
2 Simulation-Current-Week C;
3 Market-Date T;
4 for T ← 1 to end do
5 Data Distributor disseminate data, which are accessible by week C, to each agentaccording to agent expertise;
6 Start Prediction Market for Week-T;
7 while Market deadline is not reached do8 Wait();
9 In here, agents will decide the level of disease activity in week T and tradesecurity according to their belief and strategy;
10 end
11 End Prediction Market;
12 Reveal the winning security (Based on the label of training examples);
13 Each agent new capital← previous capital + revenue gained in this market − amountspent for purchasing securities;
14 Now, according to the utility received in this market, agents should update theirtrading strategy and beliefs ;
15 T=T+1;16 C=C+1;
17 end
For the sake of simplicity, Algorithm 1 considers just the one market, as does our currentimplementation.
4 Preliminary Results
The configuration of the controlling parameters of our system need thorough investiga-tion through running a large number of simulation experiments. These settings includebut are not limited to constraints on number of market participants, required time foreach market, initial capital for each agent, type of monitored diseases, constraints andrequirements for agents to trade, and the minimum required number of training exam-ples. We have only just begun to explore this parameter space.
As discussed in Section 1, there is a vast number of syndromic surveillance data sources.Much research has been done to compare these data sources with the actual value of dis-ease activity level for a specific disease in a particular place. For example, Culotta [5]
stated that he could track influenza rates in the United States using Twitter messageswith 95% correlation. Corley [4] could track flu rates in the United States with a cor-relation of 76% by examining the proportion of blogs containing the two keywords of“influenza” and “flu”. Google Flu Trend [6] can predict ’flu activity level with a 97%correlation by analysing queries sent to the Google search engine.
In the first two batches of experiments, we have tried two well-known trading strategiesfor trading agents: Zero Intelligence (ZI) [7] and Zero Intelligence Plus (ZIP) [3], theformer to provide a baseline behaviour and the latter to investigate the effect of a simplelearning mechanism on the trading decision. We now discuss each of these in moredetail.
4.1 Preliminary Results with ZI
In the first set of experiments, agents use a Zero Intelligence strategy (adapted from[7]) when trading securities in the market. In this model, agents consider a limit price,according to their data, for each security of the market. In each day of the market, theychoose one security randomly and purchase a random quantity of that security, if itslimit price is higher than its market price or they sell a random quantity of that securityif its limit price is less than its market price. In both situations, the agents considers themaximum number of securities that can be traded, based on their available capital andthe securities they own. LMSR, described in Section 2, is used as market scoring rule,as it provides infinite liquidity [8] and does not suffer in thin markets where the numberof traders are small.
Each agent in the experiment is awarded $10 at start up and one market is establishedfor each training example. The winning security is chosen based on the United Stateinfluenza-like illnesses rate from 30 September 2002 to 01 September 2003 3. Eachmarket offers eight securities, corresponding to one security for each standard deviationfrom the mean, covering from −4 to +4 standard deviations.
Figure 1 shows how extending the period of a prediction market can help agents topredict the outcome of the event better. It demonstrates that accuracy goes up and themis-classification rate falls as the duration of the market increases. As can be seen fromthe figure, accuracy increased from 82% for 10-day-long markets to 93% for 90-day-long markets, after which it is almost flat. From this, we conclude that 110 days seems asufficient period for each market and hence our subsequent experiments at this stage usethis market length. Longer duration markets provide agents with sufficient time to tradeenough numbers of the desired securities and approach more closely the equilibriumprice.
The purpose of the experiments reported in this paper is primarily to establish confi-dence in the behaviour of the simulation, by providing tailored data feeds with known
3 http://www.cdc.gov/flu/weekly/fluviewinteractive.htm
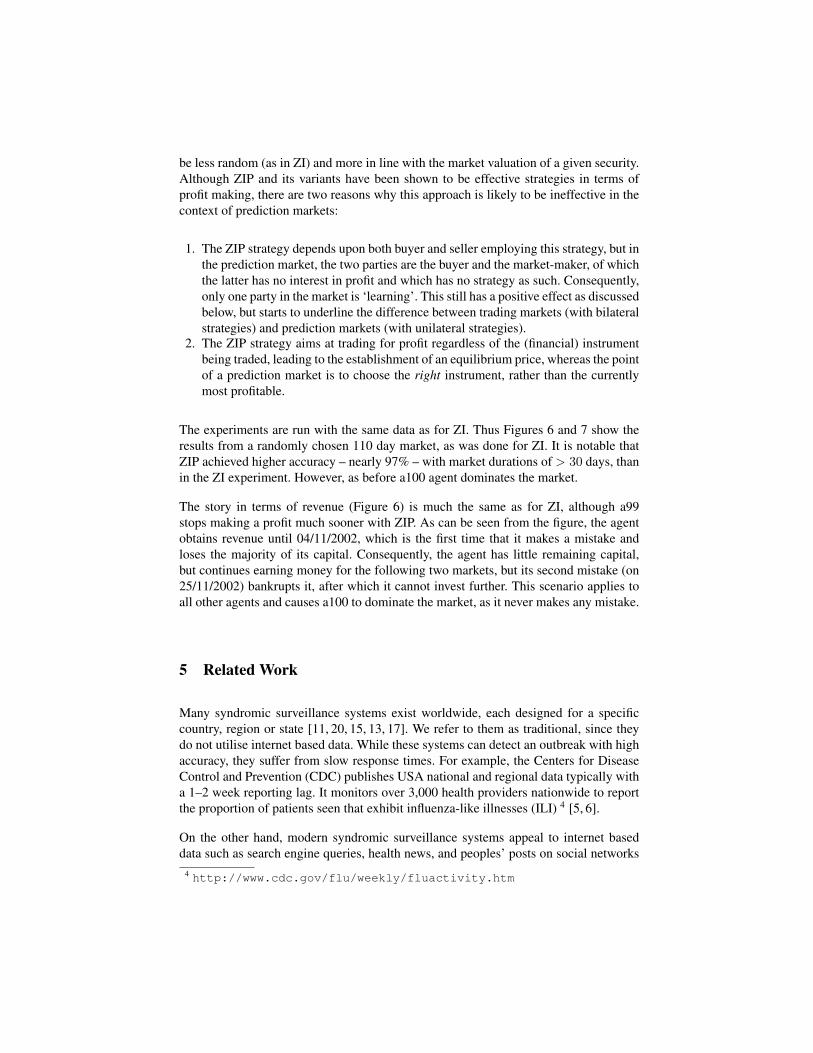
properties and then observing whether the agents achieve their expected level of perfor-mance, given that data and their (known) strategy. These experiments have a populationof 20 agents, each receiving data from data streams with a specified correlation withthe United States influenza-like illnesses rate. The agent names in the following figuresrepresents the type of data the agent is receiving. For instance, a95 denotes an agentthat receives data with a 95% correlation with the United States influenza-like illnessesrate.
Since all the agents in these experiments are essentially identical in terms of strategy,the difference in their data sources should lead to them obtaining different amountsof revenue in each market. Figure 2 shows their revenue when each market ends. Asthe Figure shows, a100 agent, which has complete information about all the events ofthe experiment, earns high revenue in all markets with the exception of 31/07/2003. Inthis case, it was not making the wrong choice – it cannot – but was trying to purchasea large number of securities and since the price of a security increases as a result ofits purchase, the agent (as explained in Section 2), did not have sufficient capital tocomplete the deal. In other words, for agents without perfect information, the enforcedrandom choice of security to trade (the ZI strategy) means the agent cannot select themost appropriate one, but rather the one that chance dictates and hence it makes a loss.
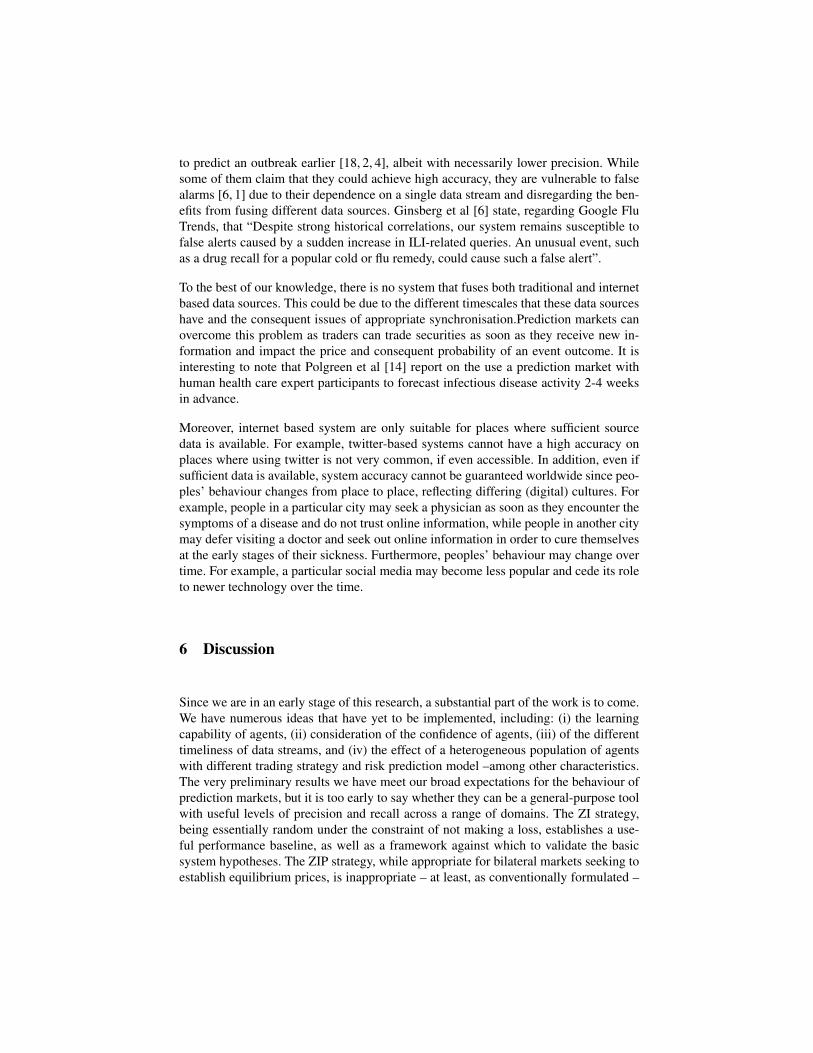
Figure 3 shows the capital held by each agent at the end of each market in one ex-periment and Figure 4 shows the average capital of agents over 50 runs. The mainobservation from these figures is that, as expected, agents with higher quality data areable to achieve higher levels of revenue. As can be seen from these figures, agent a100accumulates more capital than other agents even those with high quality data such asa99. The reason for this is that a100 never makes a mistake while the other agents doand as soon as one agent predicts an outcome, it dedicates most of its capital to purchasethe corresponding security. Therefore, once an agent predicts a wrong outcome, it losesall its capital, while agent a100 keeps earning revenue in each market and accumulatesmore capital and hence invests more on upcoming markets and earns more revenueagain. Also, agent a100 causes the price of the correct security to increase rapidly as itpurchase a large quantity of it and, therefore, makes it difficult for other agents to buysignificant quantities of that security due its high price.
Clearly, more comprehensive experimentation is necessary, backed up with appropriatestatistical confidence tests. In this section, we have only used the most basic of strategiesand one that has known flaws [3]. However, it provides both a useful baseline perfor-mance, as well as a setting in which initial hypotheses about the effectiveness of theprediction market model can be validated (such as the agent with 100% correlated datadominating the market and all others losing all their investments).
4.2 Preliminary Results with ZIP
In the second set of experiments, we have changed the agent strategy from ZI to ZIP, bywhich the agent uses data about trends in the market in order to adjust their behaviour to
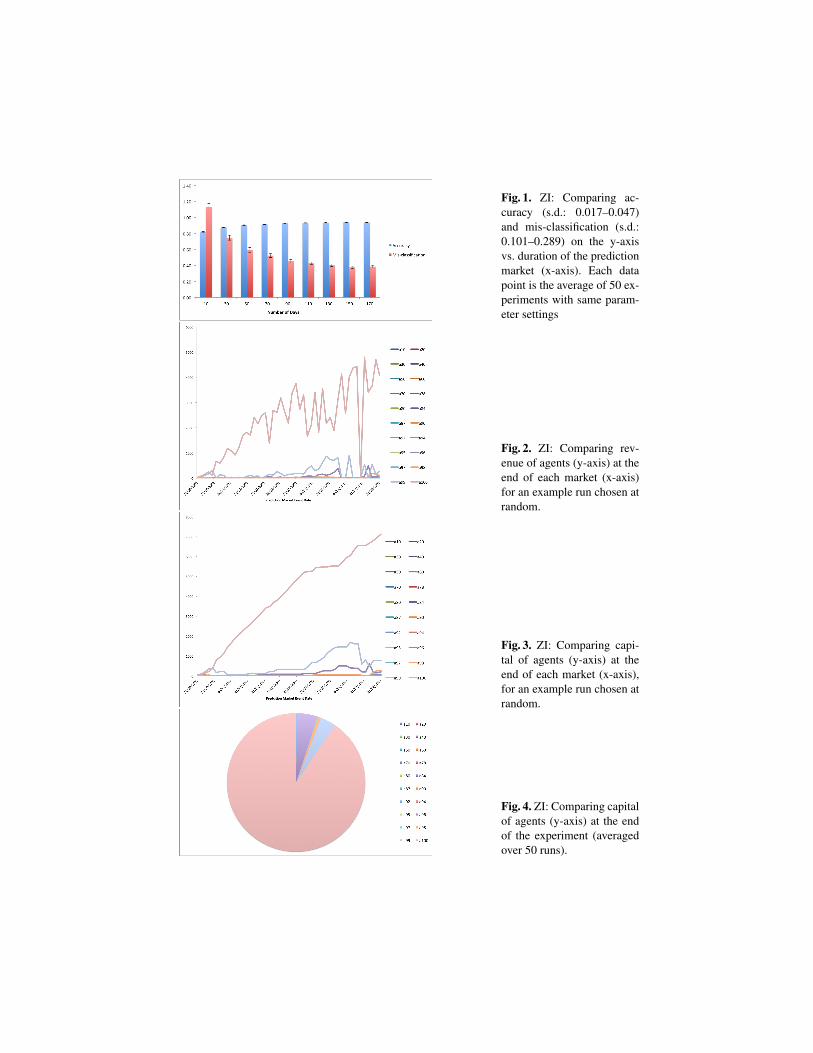
Fig. 1. ZI: Comparing ac-curacy (s.d.: 0.017–0.047)and mis-classification (s.d.:0.101–0.289) on the y-axisvs. duration of the predictionmarket (x-axis). Each datapoint is the average of 50 ex-periments with same param-eter settings
Fig. 2. ZI: Comparing rev-enue of agents (y-axis) at theend of each market (x-axis)for an example run chosen atrandom.
Fig. 3. ZI: Comparing capi-tal of agents (y-axis) at theend of each market (x-axis),for an example run chosen atrandom.
Fig. 4. ZI: Comparing capitalof agents (y-axis) at the endof the experiment (averagedover 50 runs).
be less random (as in ZI) and more in line with the market valuation of a given security.Although ZIP and its variants have been shown to be effective strategies in terms ofprofit making, there are two reasons why this approach is likely to be ineffective in thecontext of prediction markets:
1. The ZIP strategy depends upon both buyer and seller employing this strategy, but inthe prediction market, the two parties are the buyer and the market-maker, of whichthe latter has no interest in profit and which has no strategy as such. Consequently,only one party in the market is ‘learning’. This still has a positive effect as discussedbelow, but starts to underline the difference between trading markets (with bilateralstrategies) and prediction markets (with unilateral strategies).
2. The ZIP strategy aims at trading for profit regardless of the (financial) instrumentbeing traded, leading to the establishment of an equilibrium price, whereas the pointof a prediction market is to choose the right instrument, rather than the currentlymost profitable.
The experiments are run with the same data as for ZI. Thus Figures 6 and 7 show theresults from a randomly chosen 110 day market, as was done for ZI. It is notable thatZIP achieved higher accuracy – nearly 97% – with market durations of > 30 days, thanin the ZI experiment. However, as before a100 agent dominates the market.
The story in terms of revenue (Figure 6) is much the same as for ZI, although a99stops making a profit much sooner with ZIP. As can be seen from the figure, the agentobtains revenue until 04/11/2002, which is the first time that it makes a mistake andloses the majority of its capital. Consequently, the agent has little remaining capital,but continues earning money for the following two markets, but its second mistake (on25/11/2002) bankrupts it, after which it cannot invest further. This scenario applies toall other agents and causes a100 to dominate the market, as it never makes any mistake.
5 Related Work
Many syndromic surveillance systems exist worldwide, each designed for a specificcountry, region or state [11, 20, 15, 13, 17]. We refer to them as traditional, since theydo not utilise internet based data. While these systems can detect an outbreak with highaccuracy, they suffer from slow response times. For example, the Centers for DiseaseControl and Prevention (CDC) publishes USA national and regional data typically witha 1–2 week reporting lag. It monitors over 3,000 health providers nationwide to reportthe proportion of patients seen that exhibit influenza-like illnesses (ILI) 4 [5, 6].
On the other hand, modern syndromic surveillance systems appeal to internet baseddata such as search engine queries, health news, and peoples’ posts on social networks
4 http://www.cdc.gov/flu/weekly/fluactivity.htm
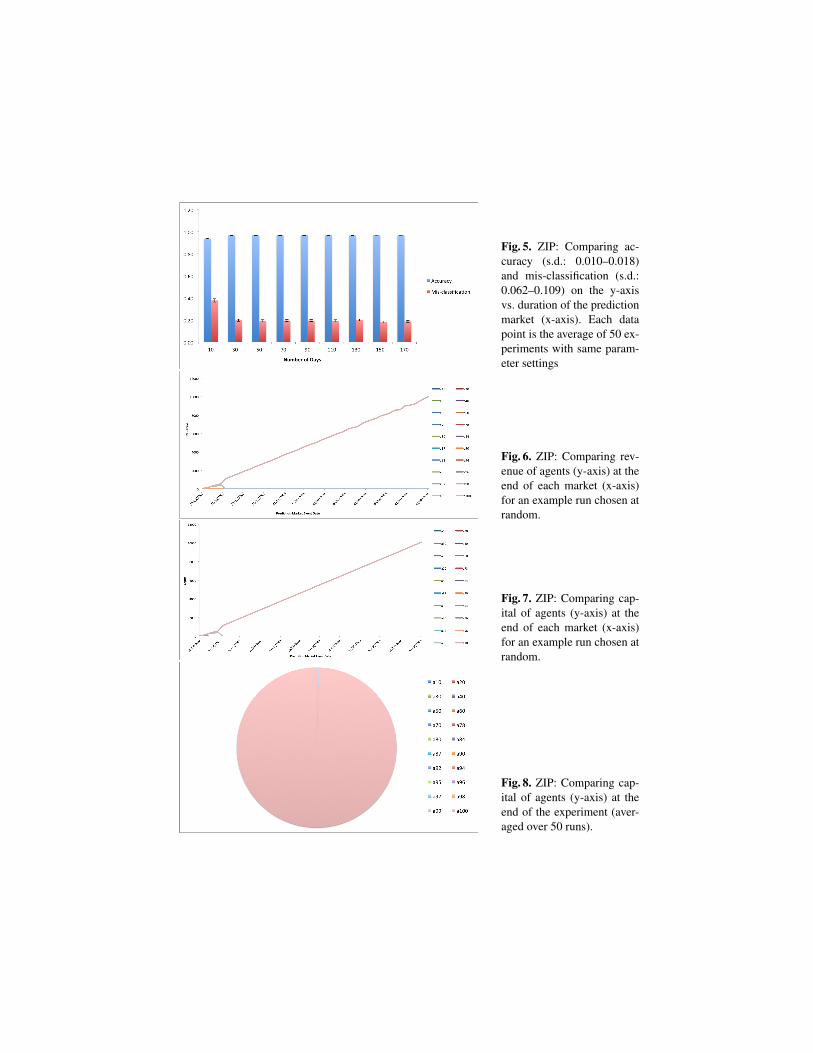
Fig. 5. ZIP: Comparing ac-curacy (s.d.: 0.010–0.018)and mis-classification (s.d.:0.062–0.109) on the y-axisvs. duration of the predictionmarket (x-axis). Each datapoint is the average of 50 ex-periments with same param-eter settings
Fig. 6. ZIP: Comparing rev-enue of agents (y-axis) at theend of each market (x-axis)for an example run chosen atrandom.
Fig. 7. ZIP: Comparing cap-ital of agents (y-axis) at theend of each market (x-axis)for an example run chosen atrandom.
Fig. 8. ZIP: Comparing cap-ital of agents (y-axis) at theend of the experiment (aver-aged over 50 runs).
to predict an outbreak earlier [18, 2, 4], albeit with necessarily lower precision. Whilesome of them claim that they could achieve high accuracy, they are vulnerable to falsealarms [6, 1] due to their dependence on a single data stream and disregarding the ben-efits from fusing different data sources. Ginsberg et al [6] state, regarding Google FluTrends, that “Despite strong historical correlations, our system remains susceptible tofalse alerts caused by a sudden increase in ILI-related queries. An unusual event, suchas a drug recall for a popular cold or flu remedy, could cause such a false alert”.
To the best of our knowledge, there is no system that fuses both traditional and internetbased data sources. This could be due to the different timescales that these data sourceshave and the consequent issues of appropriate synchronisation.Prediction markets canovercome this problem as traders can trade securities as soon as they receive new in-formation and impact the price and consequent probability of an event outcome. It isinteresting to note that Polgreen et al [14] report on the use a prediction market withhuman health care expert participants to forecast infectious disease activity 2-4 weeksin advance.
Moreover, internet based system are only suitable for places where sufficient sourcedata is available. For example, twitter-based systems cannot have a high accuracy onplaces where using twitter is not very common, if even accessible. In addition, even ifsufficient data is available, system accuracy cannot be guaranteed worldwide since peo-ples’ behaviour changes from place to place, reflecting differing (digital) cultures. Forexample, people in a particular city may seek a physician as soon as they encounter thesymptoms of a disease and do not trust online information, while people in another citymay defer visiting a doctor and seek out online information in order to cure themselvesat the early stages of their sickness. Furthermore, peoples’ behaviour may change overtime. For example, a particular social media may become less popular and cede its roleto newer technology over the time.
6 Discussion
Since we are in an early stage of this research, a substantial part of the work is to come.We have numerous ideas that have yet to be implemented, including: (i) the learningcapability of agents, (ii) consideration of the confidence of agents, (iii) of the differenttimeliness of data streams, and (iv) the effect of a heterogeneous population of agentswith different trading strategy and risk prediction model –among other characteristics.The very preliminary results we have meet our broad expectations for the behaviour ofprediction markets, but it is too early to say whether they can be a general-purpose toolwith useful levels of precision and recall across a range of domains. The ZI strategy,being essentially random under the constraint of not making a loss, establishes a use-ful performance baseline, as well as a framework against which to validate the basicsystem hypotheses. The ZIP strategy, while appropriate for bilateral markets seeking toestablish equilibrium prices, is inappropriate – at least, as conventionally formulated –
for prediction markets, although the dampening effect of the learning mechanism doeslead to higher prediction rates and smoother overall behaviour.
We welcome feedback on the appropriateness of the approach and the above directionsfor development as well as alternative mechanisms that might be incorporated in theprediction market setting.
References
1. Harshavardhan Achrekar, Avinash Gandhe, Ross Lazarus, Ssu-Hsin Yu, and Benyuan Liu.Predicting flu trends using twitter data. In Computer Communications Workshops (INFO-COM WKSHPS), 2011 IEEE Conference on, pages 702–707. IEEE, 2011.
2. Herman Anthony Carneiro and Eleftherios Mylonakis. Google trends: a web-based tool forreal-time surveillance of disease outbreaks. Clinical infectious diseases, 49(10):1557–1564,2009.
3. Dave Cliff and Janet Bruten. Minimal-intelligence agents for bargaining behaviours inmarket-based environments. Technical Report HPL-97-91, Hewlett-Packard Laboratories,1997. Available via http://www.hpl.hp.com/techreports/97/HPL-97-91.html, retrieved 20071115.
4. Courtney D Corley, Diane J Cook, Armin R Mikler, and Karan P Singh. Text and struc-tural data mining of influenza mentions in web and social media. International journal ofenvironmental research and public health, 7(2):596–615, 2010.
5. Aron Culotta. Detecting influenza outbreaks by analyzing twitter messages. arXiv preprintarXiv:1007.4748, 2010.
6. Jeremy Ginsberg, Matthew H Mohebbi, Rajan S Patel, Lynnette Brammer, Mark S Smolin-ski, and Larry Brilliant. Detecting influenza epidemics using search engine query data. Na-ture, 457(7232):1012–1014, 2008.
7. Dhananjay K Gode and Shyam Sunder. Allocative efficiency of markets with zero-intelligence traders: Market as a partial substitute for individual rationality. Journal of polit-ical economy, pages 119–137, 1993.
8. Robin Hanson. Combinatorial information market design. Information Systems Frontiers,5(1):107–119, 2003.
9. Robin Hanson. Logarithmic market scoring rules for modular combinatorial informationaggregation. Journal of Prediction Markets, 1:3–15, 2007.
10. Robin Hanson, Ryan Oprea, and David Porter. Information aggregation and manipulationin an experimental market. Journal of Economic Behavior & Organization, 60(4):449–459,2006.
11. Michael D Lewis, Julie A Pavlin, Jay L Mansfield, Sheilah OBrien, Louis G Boomsma, Yev-geniy Elbert, and Patrick W Kelley. Disease outbreak detection system using syndromic datain the greater Washington DC area. American journal of preventive medicine, 23(3):180–186, 2002.
12. Evdokia Nikolova and Rahul Sami. A strategic model for information markets. In Proceed-ings of the 8th ACM conference on Electronic commerce, pages 316–325. ACM, 2007.
13. Yasushi Ohkusa, M Shigematsu, K Taniguchi, and N Okabe. Experimental surveillance usingdata on sales of over-the-counter medications-japan, November 2003–April 2004. MMWRMorb Mortal Wkly Rep, 54:47–52, 2005.
14. Philip M. Polgreen, Forrest D. Nelson, and George R. Neumann. Use of prediction marketsto forecast infectious disease activity. Clinical Infectious Diseases, 44(2):pp. 272–279, 2007.
15. Emergency department syndromic surveillance system: England & Northern Ireland,September 2013.
16. Russ Ray. Prediction markets and the financial “wisdom of crowds”. Journal of BehavioralFinance, 7(1):2–4, 2006.
17. Communicable and respiratory disease report for england & wales, October 2013.Available from: http://www.hpa.org.uk/webc/HPAwebFile/HPAweb_C/1317139997178, retrieved 20131216.
18. Alessio Signorini, Alberto Maria Segre, and Philip M. Polgreen. The use of twitter to tracklevels of disease activity and public concern in the U.S. during the Influenza A H1N1 Pan-demic. PLoS ONE, 6:e19467, 05 2011.
19. Erik Snowberg, Justin Wolfers, and Eric Zitzewitz. Prediction markets for economic fore-casting. Working Paper 18222, National Bureau of Economic Research, July 2012. Availablefrom: http://www.nber.org/papers/w18222.
20. Fu-Chiang Tsui, Jeremy U Espino, Virginia M Dato, Per H Gesteland, Judith Hutman, andMichael M Wagner. Technical description of rods: a real-time public health surveillancesystem. Journal of the American Medical Informatics Association, 10(5):399–408, 2003.