Artificial Photosynthesis: Water Oxidation Electrocatalysts · Artificial Photosynthesis: Water...
48
Artificial Photosynthesis: Water Oxidation Electrocatalysts in a Prototype “Artificial Leaf” An outlook on the upscaling of the process Authors: E. Tanis & A. Rosu Mentor: : R. Purchase, Faculty of Science, Leiden Institute of Chemistry 19-2-2016
Transcript of Artificial Photosynthesis: Water Oxidation Electrocatalysts · Artificial Photosynthesis: Water...

Artificial Photosynthesis:
Water Oxidation Electrocatalysts
in a Prototype “Artificial Leaf”
An outlook on the upscaling of the process
Authors: E. Tanis & A. Rosu
Mentor: : R. Purchase, Faculty of Science, Leiden Institute of Chemistry
19-2-2016
1
Preface With an energy demand higher than ever and still on the rise, we need to find a new energy
source that does not harm our environment. Luckily nature already has provided us with the
solution: photosynthesis. Plants harness the power of light and use it to produce oxygen and
carbon-based compounds that fuel the organism’s activities.
A research field known as ‘artificial photosynthesis’ tries to replicate this process by using
light energy to split water into oxygen and hydrogen gas, which can be used as fuel for cars.
In the future, when this technology has been further developed, we could even add CO2 to this
reaction to produce carbon-based fuels.
In this research paper, we will focus on the production of hydrogen gas through artificial
photosynthesis and the possible upscaling of this process to a commercial level. The research paper is divided into two sections. The introduction part provides the reader with
the essential background information on artificial photosynthesis to increase the
understanding on the subject. The second part of our research paper describes our actual
performed research and includes the results and conclusions. From the beginning on we were particularly interested in already existing applications that
have implemented this artificial photosynthetic process. With help of Ms. Purchase we were
able to get hold of the first prototype “artificial leaf” in the Netherlands. This prototype was
designed by Huub de Groot and Edward Maloney in the “BioSolar Cells” consortium. We
were both intrigued by the device and wanted to perform experiments on it to test its
functioning and investigate possible deficiencies. At this moment there is still a lot of research on water oxidation electrocatalysts in a lab three-
electrode set-up. The water oxidation electrocatalysts that we worked on are easy to make and
self-assemble under a particular potential. They assist a reaction that splits water into
hydrogen gas and oxygen. As self-assembling water oxidation electrocatalysts had not yet
been tested inside the “artificial leaf” we thought it would be a perfect idea to test them
ourselves. We first did cyclic voltammetry and chronoamperometry experiments on three
known water oxidation electrocatalysts in the lab three-electrode set-up. For water oxidation
electrocatalysts to properly function inside the “artificial leaf” they had to undergo several
criteria. They had to function properly at a high potential (2.4 V) for a long time and they had
to produce a high current, for an optimal efficiency. The Ni-Based Water Oxidation
Electrocatalyst performed best under these criteria and we therefore tested this electrocatalysts
inside the “artificial leaf”. By analysing what went well and what did not, we have been able
to find crucial points of improvements for possible future artificial photosynthetic
applications.
We would like to thank Mrs. Purchase and Mr. Lodewijkx for their help and support while
writing this paper.

2
Tabel of Contents Preface 0
Introduction 4
1. Why do we need renewable energy sources? 4
1.1 Why hydrogen? 5
2. Natural Photosynthesis as the foundation of Artificial Photosynthesis 6
2.1 What is (sun)light? 6
2.2 General overview natural photosynthesis 7
2.3 Light dependent reaction 9
2.4 Light independent reaction (Calvin-Benson Cycle) 12
3. Artificial Photosynthesis 14
3.1 Introduction to Artificial Photosynthesis 14
3.2 The process of Artificial Photosynthesis 14
3.2.1 Light Harvesting 15
3.2.2 Charge Separation 16
3.2.3 Water Splitting 17
3.2.4 Fuel production 17
3.2.5 The energy budget for artificial photosynthesis 17
3.3 Artificial photosynthesis in the future: challenges and possibilities 18
4 Research Methods 20
4.1 Cyclic voltammetry 20
4.2 Chronoamperometry 22
Our research 23
5 Key question and sub-questions 23
6 First part of the research: testing of three water oxidation electrocatalysts 24
6.1 Introduction to the three water oxidation electrocatalysts 24
6.2 Purpose 24
6.3 Experimental section 25
6.4 Results: characteristics of the three electrocatalysts 27
6.4.1 Ni-Based Water Oxidation Electrocatalyst 27
6.4.2 Cobalt-Derived Water Oxidation Electrocatalyst 29
6.4.3 Water oxidation electrocatalyst containing Phosphate and Co2+ 31
6.5 Conclusion: best catalyst for our purposes 34

3
7 Second part of the research: testing of a water oxidation electrocatalyst in the “artificial leaf” 35
7.1 Introduction to the “artificial leaf” 35
7.2 Purpose 37
7.3 Experimental Section 37
7.4 Results 39
7.5 Conclusion 42
8 Third part of our research: investigating the deficiencies of the prototype “artificial leaf” and possible solutions 43
Discussion 45
Acknowledgements 45
References 46

4
Introduction
1. Why do we need renewable energy sources?
We live in a world where we are addicted to fossil fuels. We use them to power our cars, to make electricity, to make plastic and so on. When we burn these fuels for energy, we emit greenhouse gasses such as CO2. In this way, we contribute to the greenhouse-effect which threatens our world. The greenhouse-effect means that a layer of greenhouse-gasses builds up around the earth and traps heat within our atmosphere. “The Intergovernmental Panel on Climate Change (IPCC), which includes more than 1,300 scientists from the United States and other countries, forecasts a temperature rise of 2.5 to 10 degrees Fahrenheit over the next century.” [1] This excessive heat can cause significant changes in global temperatures, leading to desertification and melting of the polar caps. This means the global water level will rise, leading to global disasters such as floods, tsunamis and stronger storms. However, the growing threat to our environment is not our only problem. We are starting to run into yet another problem: we are running out of fossil fuels. According to official reports of B.P. the total world proved oil reserves reached 1700.1 billion barrels at the end of 2014 and are sufficient to meet 52.5 years of global production. [2] This is not a long time. We have not got much left until we run out of oil entirely and the production of other fuels will stop. Not only might we run out of fuel for our cars, but also for making other materials such as plastics. A possible solution to this energy crisis seems to be in our hands. Electricity is seen more and more as the way forward and it could be produced in renewable ways. The power of the wind, sun and even tidal waves is already being harnessed to produce electricity, without leaving a carbon footprint, to power factories, cars, our homes, etc. However, there is a huge flaw regarding electricity. It cannot be stored as electricity, it must be converted to another form of energy such as chemical energy in batteries, like those used in cars. But these batteries have drawbacks as they are made of rare metals, of which we might someday run out, and harmful chemicals, which can cause damage to nature. On top of that, batteries cannot store a huge amount of electricity, so they are not too good a solution in the long run. However, there is a solution. Plants harness the power of light and use it to split water into hydrogen and oxygen. They also produce carbon-based compounds out of carbon dioxide and water. These two processes, respectively the light- and dark reaction, form the process of photosynthesis. If we could manage to replicate photosynthesis, we could use hydrogen as a natural fuel and use carbon compounds to make synthetic materials. The best part is that when hydrogen is burnt, water is formed and it goes back into the water cycle, creating a closed cycle. The only added energy is sunlight. The carbon dioxide created by burning the carbon-based compounds, is reused to make new compounds, also creating a closed cycle. In this research paper, we will focus on the production of hydrogen gas through artificial photosynthesis and the possible upscaling of this process.

5
1.1 Why hydrogen?
With artificial photosynthesis hydrogen could be produced in an environmentally friendly way. Hydrogen can easily be used as a fuel for cars. There are already cars that run on hydrogen, eliminating the need for fossil fuels and expensive, inefficient batteries. Hydrogen cells could even be placed on the roof of your garage so you could make your hydrogen around the house and fill up your car; all that would be needed to create hydrogen is sunlight and water. On average, about 110 watts of solar energy per square metre reaches the earth in North-West Europe. [3] If you assume 12 hours of sun per day, this comes out to 481,800 watt-hours per square metre per year. If we could use this huge amount of power, we could solve the energy problems of the world and enter a new age where environmentally friendly hydrogen fuels will knock the fossil-fuels off their throne. An advantage of hydrogen over, for example, electricity is the fact that, like fossil fuels, it is easily transportable, thus not needing a huge amounts of infrastructure and lifestyle modification. Hydrogen produced by artificial photosynthesis can also be used for other industrial needs other than fuels.
Figure 1: Production of solar fuels Source: Royal Society of Chemistry

6
2. Natural Photosynthesis as the foundation of Artificial Photosynthesis
Photosynthesis is the process used by plants, algae and certain bacteria to convert light energy from the sun into chemical energy. This chemical energy is stored in carbon based compounds like glucose. The energy can later be released to fuel the organism’s activities. The principles of natural photosynthesis are the foundation of artificial photosynthesis. In order to get a better understanding of artificial photosynthesis we shall first explain the process as it occurs in plants.
2.1 What is (sun)light? We already know that autotrophic1 organisms make their energy from the ultimate energy source: sunlight. But what is sunlight, actually? Light is part of the electromagnetic spectrum (see: figure 2), the entire range of electromagnetic radiation, which ranges from radio waves to gamma rays. [4] Light consists of photons, small packages of energy. Each photon carries a different amount of energy with it. The shorter the wavelength2 of the photon, the bigger the amount of energy the photon carries. This is why ultraviolet photons carry more energy than infrared photons (see: figure 2). This regularity can be proven using Planck’s equation, E = h × ƒ also written as E / ƒ = h (1) in combination with c = ƒ × λ. (2) In equation 1, E is the energy of a photon in joules or electron volts, ℎ is Planck’s constant (6.62606957 × 10⁻³⁴ m2 kg/s) and ƒ is the frequency in Hertz. In equation 2, c is the speed of light (299 792 458 m/s) and λ is the wavelength in meters. Equation 2 confirms that a photon with a smaller wavelength has a higher frequency as they are inversely proportional: when the wavelength decreases, the frequency must increase because c (the speed of light) is a constant. Equation 1 confirms that a photon with a bigger frequency has a larger amount of energy because they are directly proportional: if there is an increasing frequency the amount of energy must also increase because h (Planck’s constant) is a constant. These two statements exemplify that photons with a smaller wavelength carry a larger amount of energy with them. Sunlight is the visible part of the electromagnetic spectrum and has a wavelength spectrum from 400 nanometres to 700 nanometres. A relevant measure for the large number of light particles in sunlight is the ‘mole’: 1 mole photons corresponds to 6.02214129 × 10²³ light particles. The average amount of photons, from the whole spectrum, that reaches the earth’s surface in the Netherlands per day is approximately 40 mole/m2. [5]
1 Autotrophic organisms: any organism capable of synthesizing its own food by using inorganic materials as a
source of nutrients and by using photosynthesis a source of energy 2 Wavelength: The distance between one peak or crest of a wave and the next peak or crest.

7
Figure 2: The electromagnetic spectrum Source: http://www.astronomersgroup.org/EMspectrum.htmlhttp://www.immunolight.com/technology/
2.2 General overview natural photosynthesis
Natural photosynthesis consists of two simultaneous reactions: the light reaction and the dark reaction or Calvin cycle. The light reaction occurs only in the presence of light and is therefore called the light-dependent reaction. The dark reaction also occurs in absence of light and is therefore called the light-independent reaction. Note that the dark reaction can occur in light, too, this reaction just does not depend on light to occur.
Figure 3: Schematic overview of photosynthesis Source: http://slideplayer.nl/slide/2075386/

8
Figure 3 shows a schematic overview of photosynthesis. The processes take place in the chloroplast (see: figure 4). These chloroplasts contain the pigment chlorophyll which can absorb light. During photosynthesis the sunlight penetrates the surface of the leaf and strikes the chloroplast. The light dependent reaction occurs in the thylakoid membrane of the chloroplasts and converts ADP into ATP, an energy carrier within the cells, and NADP+ into NADPH, an electron donor molecule, under the influence of sunlight. The dark reaction occurs in the stroma of the chloroplasts. The stroma is the empty space between columns of grana, a collection of disc-shaped membranes, stacked into columns like plates. This reaction requires the ATP and the NADPH which have been formed in the light dependent reaction. Carbon dioxide and energy from ATP along with NADPH are used to form glucose. The only waste product of this photosynthetic reaction to the plant is oxygen, which we can in turn use to breath. [6]
The overall chemical reaction involved in these two processes is:
6 CO2 + 6 H2O (+8hv)→ C6H12O6 + 6 O2 or CO2 + H2O (+8hv) → (H2CO) +O2
This overall chemical reaction results from the two half-reactions that make up photosynthesis: [5] 1. 2 H2O (+4hv) → O2 + 4 H+ + 4 e_ 2. CO2 + 4 H+ + 4 e_ (+4hv) → H2CO +H2O The two half-reactions require four photons each (indicated by ‘4hv’), and together they lead to the net production of carbohydrate fuel via transported protons and electrons, using ATP and NADPH as intermediate energy carriers. To reduce (see: Intermezzo: Redox, page 22) one molecule of CO2 requires a minimum of eight quanta of light. However, if you consider additional energy needs for cell maintenance and for concentrating CO2, 10–12 quanta are required. [7]
Figure 4: The structure of a leaf Source: https://online.science.psu.edu/biol011_sandbox_7239/node/7267

9
2.3 Light dependent reaction
In the thylakoid membrane there are two photosystems, photosystem I (PSI) and photosystem II (PSII), which are the sites of light dependent photosynthesis reactions. In contrast to what one might expect, PSII operates before PSI. There is a simple explanation for this: PSI was discovered before PSII.
Figure 5: The thylakoid membrane inside the chloroplast where the light dependent reaction occurs. Source:http://fhs-bio-wiki.pbworks.com/w/page/12145797/Photosynthesis%20-%20light These photosystems contain an antenna complex. The antenna complex contains light harvesting chlorophyll a pigments and accessory pigments, such as carotenes, that absorb light in regions of the spectrum where chlorophyll does not absorb well. Part of the light spectrum, green, is not absorbed by chlorophyll a but is reflected, which is the reason that most plants have a green colour. Each chloroplast contains approximately 200 molecules of chlorophyll. Only a few of the chlorophylls are associated with a photochemical reaction centre where the energy of the absorbed light is transformed into chemical energy. All of the other chlorophyll and pigment molecules are light harvesting or antenna molecules. They absorb photons (light energy packets) and transfer the energy to the reaction centres, see figure 6. [8] The antenna complexes in plants can absorb light with a wavelength of under 700 nm and this is called the Photosynthetically Active Radiation part of the spectrum. [9] Notice that both photosystems only absorb light from the visible part of the electromagnetic spectrum. They do not use the energy from the photons from the infrared spectrum (IR). The process of photosynthesis begins when a chlorophyll molecule absorbs a photon. A chlorophyll molecule that has absorbed a photon is in an excited state, and is called an exciton. The excited molecule will eventually return to the ground state, the lowest possible energy level, giving up the energy as either heat, electron transfer, exciton transfer or as emission of a photon of light at a longer wavelength (fluorescence). Exciton transfer, also called Förster resonance energy transfer after its discoverer, is the

10
transfer of energy (not an electron) by an excited donor, through a nonradiative process to a neighbouring molecule (see: figure 6) [8]. It is the mechanism by which excitonic energy is passed between light-harvesting pigments to get it to the reaction centre. You could imagine this process as a group of organized domino pieces. If you touch one of them, a chain reaction occurs and all the dominoes move into a different position until the last domino is reached and the reaction ends. When one chlorophyll molecule is ‘touched’ by the light, thus absorbing the photon energy, a chain reaction occurs that passes the energy between light-harvesting pigments to reach the reaction centre of PS II, the end station. This reaction centre contains a special pair of chlorophyll molecules that can also directly absorb a photon. This special pair is called P680 in PSII and P700 in PSI. They are the primary electron donors in PSI and PSII, respectively. 680 and 700 correspond to the wavelength, in nanometres, of light that is best absorbed by this pair of chlorophyll molecules. When the special pair absorbs a photon or accepts excitonic energy, an electron is expelled from the reaction centre. This process is called photoinduced charge separation.
Figure 6: Exciton transfer Source: https://www.tamu.edu/faculty/bmiles/lectures/photosynthesis.pdf The reaction centre has now lost an electron, which created an ‘electron hole’. To fill these holes a H2O molecule donates one of its own electrons. A manganese centre, a complex containing 4 manganese atoms, oxidises the water. The reaction that takes place is called photolysis. [7] The general reaction of photosynthetic photolysis can be given as:
2 H2O (+4hv) → O2 + 4H+ + 4e_ After electrons are expelled from the reaction centre they get accepted by the first member of the chain of electron carriers, the pheophytin molecule. Ultimately these electrons reach NADP+, reducing it into NADPH. This pathway of electrons from water to NADP+ has a ‘Z’-shape when drawn and is referred to as the Z-scheme (see: figure 7).

11
Concurrently with the electron transfer, this Z-scheme generates a chemiosmotic potential across the membrane. In biological processes, the direction an ion moves by diffusion or active transport across a membrane is determined by the electrochemical gradient. In chloroplasts, proton gradients are used to generate this chemiosmotic potential that is also known as a proton motive force. [10] This potential energy is used to pump H+ into the thylakoid lumen, creating a high concentration of H+-ions. Molecules always want to go from a place with a high concentration of that specific molecule to a place with a low concentration of that molecule; this is the principle of diffusion. Therefore H+-ions travel from the lumen through an ATP synthase molecule to the stroma. In this way, the high concentration of H+ inside the lumen is used to drive ATP synthesis putting ADP (adenosine diphosphate) and Pi, phosphate, together to form ATP (adenosine triphosphate). This process is called photophosphorylation (see: picture 5). So the ATP synthase enzyme uses the chemiosmotic potential, a concentration difference of H+-ions, to drive ATP synthesis during photophosphorylation, whereas NADPH is the product of the final redox reaction in the Z-scheme. The Z-scheme in figure 7 indicates how the electrons pass through a redox gradient over the pheophytin (Pheo) and quinones (QA and QB) to the cytochrome b6f complex, the box in the diagram, and on to the photo-oxidized PSI. The electron from PSI passes through quinones (A0 and A1) and iron–sulfur clusters (Fx, FA, FB) to reach ferredoxin (FD) that reduces NADP+:
2 reduced ferredoxin + NADP+ + H+ 2 oxidized ferredoxin + NADPH
In an alternative pathway, the electrons from ferredoxin are transferred back to the plastocyanin (Pc) electron-transfer protein via the cytochrome b6f complex. This is called cyclic electron transport and does not require the input of free energy by PSII. [7] On the vertical scale the energy relationships are shown in volts.
Figure 7: The Z-scheme of the electron transport chain through PSII and PSI. Source: http://www.life.illinois.edu/govindjee/ZSchemeG.html Both the ATP and the NADPH are then transported to the light independent reaction.

12
2.4 Light independent reaction (Calvin-Benson Cycle)
At this moment, research on artificial photosynthesis mainly focuses on the production
of H2 gas, as this is easier than the production of carbon based fuels. For this reason, the
light dependent reaction is of greater importance to the nearest future, as this process
involves H+ -ions that can be combined to form H2 molecules. We shall therefore only
slightly introduce the light independent reaction to give you a glimpse of how carbon
based fuels can be produced through the process of photosynthesis.
As we explained NADPH and ATP are formed in the light dependent reaction and
transported to the light independent reaction or Calvin-Benson Cycle. In the subsequent
dark reactions of the Calvin–Benson cycle they are both used to reduce CO2, which is
captured from the atmosphere by the enzyme RuBisCO, to carbohydrates (see:
Intermezzo: Redox, page 22). This process is called carbon fixation:
CO2 + 4 H+ + 4 e_ (+4hv) → H2CO +H2O
The Calvin-Benson Cycle releases three-carbon sugars, which are later combined to form
sucrose and starch (see: figure 8). For the net synthesis of 1 G3P (glyceraldehyde-3-
phosphate), the cycle must take place 3 times, fixing 3 CO2 molecules. The Calvin-Benson
Cycle consists of three parts [11]:
1. Carbon fixation: RuBisCO catalyses a reaction between CO2 and RuBP, a five
carbon sugar. Each turn of the cycle involves only one RuBP and one CO2 and
forms two molecules of 3-phosphoglycerate.
2. Reduction: Six molecules of ATP and NADPH are used to convert the six
molecules of 3-phosphoglycerate into six molecules of a chemical called
glyceraldehyde 3-phosphate (G3P).
The formed G3P is carried off as an output to produce sugar and other organic
molecules used to create cellulose and polymers
3. Regeneration of the CO2 acceptor (RuBP): This is an energy requiring phase of
Calvin Cycle. It utilises 3 ATP in order to regenerate the CO2 acceptor, ribulose
bisphosphate (RuBP). Most (5 out of 6 molecules) of the G3P produced is used to
regenerate RuBP so the process can continue.
The overall equation for the light-independent reactions in green plants is:
3 CO2 + 9 ATP + 6 NADPH + 6 H+ → C3H6O3-phosphate + 9 ADP + 8 Pi + 6 NADP+ + 3 H2O

13
Figure 8: Schematic overview of the Calvin-Benson Cycle. Source: https://johnnydissidence.wordpress.com/tag/ps-2/

14
3. Artificial Photosynthesis
We have discussed why we are in desperate need of renewable energy sources to be able to sustain ourselves in the future. We have also demonstrated the quantity of energy the sun gives us for “free” and the way in which the plants collect this energy and store it. So what is the next logical step we should take? Artificial photosynthesis.
3.1 Introduction to Artificial Photosynthesis
By replicating the natural photosynthesis system(s) we could convert the energy from the sun into fuel. This would open up a whole new world of renewable energy opportunities for us. However, we soon run into a few challenges. The natural photosynthesis system is, as explained in the previous chapter, very complicated at a molecular level. This chapter is about how these challenges can be overcome and what our options might be at building an artificial photosynthesis system.
3.2 The process of Artificial Photosynthesis
Artificial photosynthesis consists of four steps and is aimed at mimicking natural photosynthesis:
1. Light harvesting: Trapping light particles or photons and concentrating their energy in the reaction centre (RC).
2. Separation of charge: In the reaction centre, sunlight is used to separate the different electrical charges: positive ‘holes’ and electrons.
3. Splitting water: The positive charges obtained from the charge separation are used to split water into hydrogen ions (protons) and oxygen.
4. Fuel production: With the energy from new photons, the negative charges from step 2 are used together with the hydrogens ions from step 3 to produce hydrogen or might in the future be used together with carbon-dioxide to produce a carbon-based fuel.
Given the purpose of our research, we will look at the functionality of a water oxidation electrocatalyst in a prototype “artificial leaf” that splits water into hydrogen gas and oxygen, we will now mainly focus on the production of hydrogen. This is also because the production of carbon-based fuel is much more complicated. Only four hydrogen ions, four electrons and four photons are needed for the production of two hydrogen molecules:
4 H+ + 4 e- → 2 H2 (4 hv needed) Hydrogen is a very efficient fuel, but there are however some issues. For example, hydrogen is very flammable in combination with oxygen. This is why after the splitting of water into hydrogen ions and oxygen molecules, these two must be separated immediately from each other. Another issue is that hydrogen is a gas and the current fuel infrastructure is based on fluids, so this is something which would need to change in order for the transport and distribution of hydrogen to work.

15
Figure 9: The production of hydrogen by mimicking photosystem II. Source: www.chembites.org
3.2.1 Light Harvesting
As we explained, nature has an excellent system for achieving light harvesting and charge separation. The light-harvesting pigment complexes in natural photosynthesis capture and focus the energy from sunlight and transfer this energy among themselves and then through to the reaction centre. This energy transfer is achieved due to Förster resonance energy transfer. A task for researchers in the field of artificial photosynthesis is now to develop strategies similar to that found in nature. In such an artificial system multiple absorbers with complementary absorption profiles that are capable of efficient excitation energy transfer are used as light harvesters. These light harvesters must then transfer their excitation energy to an artificial reaction centre. These light-harvesting systems could be made from organic molecules. Alternatively, semiconductors, like a solar cell, could be used. The most widely used solar cells are silicon solar cells. These cells absorb light with a wavelength of under 1100 nm. This means that they absorb even more light than the natural light-harvesting complex of plants. However, there is a problem. The maximum wavelength of the absorbed light defines the potential difference of the electrons produced during the charge separation. For the naturally harvested 700 nm wavelength the potential difference is 1.8 V, but for the silicon’s harvested 1100 nm the potential difference is just 1.1 V. [5] This is a problem as there simply is not enough energy for the water-oxidation to take place, at least 1.23 V is required to oxidise water. Although such materials can efficiently absorb sunlight, separate charges and are stable with extended exposure to sunlight, they have a limited flexibility and a work has to be done to give them the desired properties. As a last option organic light harvesting molecules could also be used in combination with semiconductor charge separators.

16
Figure 10: A tandem system for artificial photosynthesis and utilization of incoming photons. Green section is the visible light, from 400 nm to 700 nm. The purple section is the infrared light from 700 nm to 1100 nm. Resource: http://rsfs.royalsocietypublishing.org/content/5/3/20150014 Natural photosynthesis is a tandem system as it operates in two light-absorbing stages: photosystem I and photosystem II. A disadvantage of this system is the fact that both systems only absorb photons in the visible part electromagnetic spectrum, from 400 to 700 nanometres, without making any use of the infrared spectrum. This means plants only use half of the incoming photons, consequently half of the incoming energy, which reduces plant efficiency to turn energy from sunlight into chemical energy. In general artificial photosynthesis is aimed at mimicking nature. But why not improve on it? This led scientists to start researching an alternative system for artificial photosynthesis: a tandem system of two unique photosystems that each absorb different wavelengths from the electromagnetic spectrum (see: figure 10). With this technique all the incoming light is effectively used and we will be able to capture as much energy as possible in the most efficient way.
3.2.2 Charge Separation Photoinduced charge separation is the process of an electron in an atom or molecule, being excited to a higher energy level by the absorption of a photon and then leaving the atom or molecule to a nearby electron acceptor. This process is very similar to the process in natural photosynthesis.

17
3.2.3 Water Splitting
The positive charges obtained from the charge separation are used to oxidise water and split the hydrogen from the oxygen. This is done with the help of a water oxidation electrocatalyst. Without a catalyst, this reaction is very endothermic, requiring high temperatures (at least 2500 K) and high amount of energy to occur. [12] A catalyst reduces this amount of energy for the reaction to occur. In this research paper we will test three different water oxidation electrocatalysts and we will see which proves to be the most efficient.
3.2.4 Fuel production
The easiest way hydrogen gas (H2 gas) can be made is on the surface of noble metals such as platinum. However, scientists are busy looking for a substitute as noble metals are expensive and scarce, and therefore difficult to commercialise. As we said, at this point the production of H2 gas is the main focus. But maybe in the somewhat extended future we could try to reduce CO2 to these various products [13]:
2 H+ + 2 e- → H2 CO2 + 2 H+ + 2 e− → CO + H2O CO2 + 2 H+ + 2 e− → HCOOH CO2 + 4 H+ + 4 e− → HCHO + H2O CO2 + 6 H+ + 6 e− → CH3OH + H2O CO2 + 8 H+ + 8 e− → CH4 + 2 H2O This is practically an artificial reproduction of the Calvin Cycle.
3.2.5 The energy budget for artificial photosynthesis The potential difference of the electrons is a measurement for the amount of energy they carry. In an artificial tandem system, where both photosystems are sensitive for different wavelengths, the total potential difference of the produced electrons is 1.1 V + 1.8 V = 2.9 V. [7] This is called the energy budget: the amount of energy that can be spent on breaking the bonds in water, creating bonds in oxygen and creating bonds in the fuel (hydrogen or carbon-based compounds). If the system is aimed at producing hydrogen, the following criteria for its budget to suffice [5]:
● The standard redox potential (see: Intermezzo: Redox, page 22) for splitting water is 1.23 V, but in practice a higher amount will be required. For thermodynamic reasons, an extra 0.25 V is required to produce heat, bringing the total potential difference to 1.48 V.
● At least 0.5 V is necessary to prevent the reaction from going in the opposite direction.
● Catalysts need an over potential as they rarely succeed at getting the reactions to take place at the minimal potential. As the splitting of water is a complex four-stage reaction, the needed over potential (with today’s technology) is 0.4 V.
● The overpotential for the production of hydrogen is 0.2 V. ● It costs 0.2 V to transport the hydrogen ions. ● In a stand-alone system, the energy needed to compress the hydrogen gas for
storage must come from its own energy budget and this is at least 0.2 V.
18
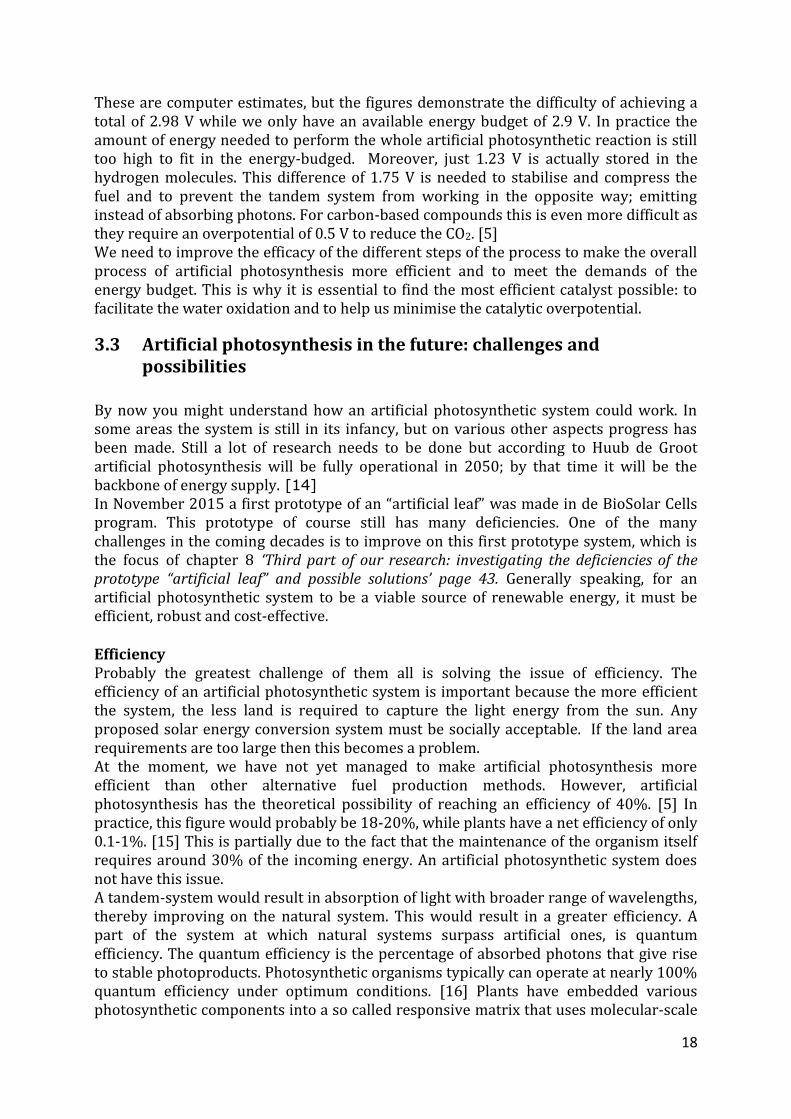
These are computer estimates, but the figures demonstrate the difficulty of achieving a total of 2.98 V while we only have an available energy budget of 2.9 V. In practice the amount of energy needed to perform the whole artificial photosynthetic reaction is still too high to fit in the energy-budged. Moreover, just 1.23 V is actually stored in the hydrogen molecules. This difference of 1.75 V is needed to stabilise and compress the fuel and to prevent the tandem system from working in the opposite way; emitting instead of absorbing photons. For carbon-based compounds this is even more difficult as they require an overpotential of 0.5 V to reduce the CO2. [5] We need to improve the efficacy of the different steps of the process to make the overall process of artificial photosynthesis more efficient and to meet the demands of the energy budget. This is why it is essential to find the most efficient catalyst possible: to facilitate the water oxidation and to help us minimise the catalytic overpotential.
3.3 Artificial photosynthesis in the future: challenges and possibilities
By now you might understand how an artificial photosynthetic system could work. In some areas the system is still in its infancy, but on various other aspects progress has been made. Still a lot of research needs to be done but according to Huub de Groot artificial photosynthesis will be fully operational in 2050; by that time it will be the backbone of energy supply. [14] In November 2015 a first prototype of an “artificial leaf” was made in de BioSolar Cells program. This prototype of course still has many deficiencies. One of the many challenges in the coming decades is to improve on this first prototype system, which is the focus of chapter 8 ‘Third part of our research: investigating the deficiencies of the prototype “artificial leaf” and possible solutions’ page 43. Generally speaking, for an artificial photosynthetic system to be a viable source of renewable energy, it must be efficient, robust and cost-effective. Efficiency Probably the greatest challenge of them all is solving the issue of efficiency. The efficiency of an artificial photosynthetic system is important because the more efficient the system, the less land is required to capture the light energy from the sun. Any proposed solar energy conversion system must be socially acceptable. If the land area requirements are too large then this becomes a problem. At the moment, we have not yet managed to make artificial photosynthesis more efficient than other alternative fuel production methods. However, artificial photosynthesis has the theoretical possibility of reaching an efficiency of 40%. [5] In practice, this figure would probably be 18-20%, while plants have a net efficiency of only 0.1-1%. [15] This is partially due to the fact that the maintenance of the organism itself requires around 30% of the incoming energy. An artificial photosynthetic system does not have this issue. A tandem-system would result in absorption of light with broader range of wavelengths, thereby improving on the natural system. This would result in a greater efficiency. A part of the system at which natural systems surpass artificial ones, is quantum efficiency. The quantum efficiency is the percentage of absorbed photons that give rise to stable photoproducts. Photosynthetic organisms typically can operate at nearly 100% quantum efficiency under optimum conditions. [16] Plants have embedded various photosynthetic components into a so called responsive matrix that uses molecular-scale

19
vibrations to control energy exchange with the environment and to guide reactions. Think about the Förster resonance energy transfer. Through such a responsive matrix nature has enabled itself to construct a self-assembling, self-repairing system from a limited set of materials that operates with a high efficiency. [5] Scientist now believe it is possible to create an artificial system with its own ‘responsive matrix’ that is capable of mimicking nature’s tricks. If scientist would succeed this would result in a much more efficient artificial photosynthetic system, and less materials would be required because of the self-repairing aspects of the ‘responsive matrix’.
Robustness An artificial photosynthesis system must be robust enough to resist the test of time. An “artificial leaf” will take a lot of use and wear as a consumer product. Added to that, the system has to be resistant to possible extreme weather conditions. Furthermore, there must be an easy way of renewing the catalyst and other components of the artificial photosynthetic system, when needed. The self-repairing aspects of the earlier described ‘responsive matrix’ could be beneficial for the durability of an “artificial leaf”. The system could simply repair itself when damaged. Cost An “artificial leaf” as a product needs to be financially affordable, thus also easy and cheap to produce. This means that rare and expensive materials, such as platinum for example, should be avoided. The costs must be minimal if we want this system to be able to compete with other technologies. An advantage of artificial photosynthesis over other alternative fuel production methods, such as bio-ethanol production, is that it does not compete with food production, and thus does not have any harmful effects on nature or human society.
In order to make these fantastic dreams come true, we must first upscale the technology from its embryonic laboratory stage to a usable and viable product. We aim, through our research, to take the first steps in the upscaling of artificial photosynthesis by testing different catalyst on the prototype “artificial leaf”’ (or hydrogen generator as this is what the “artificial leaf”’ does: generate hydrogen gas). These are still small steps in this research field, but in the very far future we might one day be able to produce a diverse array of complex organic compounds as photosynthesis has a lot more to offer than a system for the production of hydrogen gas.
20
4 Research Methods
We have used a technique called voltammetry for testing the catalysts. In voltammetry, information on properties of analytes is obtained by measuring the current as the potential is varied. The analyte is a substance that is of interest in an analytical procedure. In our case these substances of interest were three different water oxidation electrocatalysts. Further information on these different catalysts can be found in the section 6.4 ‘Results: characteristics of the three electrocatalysts’ on page 27. There a several different types of voltammetry. The two methods we have used are cyclic voltammetry and chronoamperometry.
4.1 Cyclic voltammetry
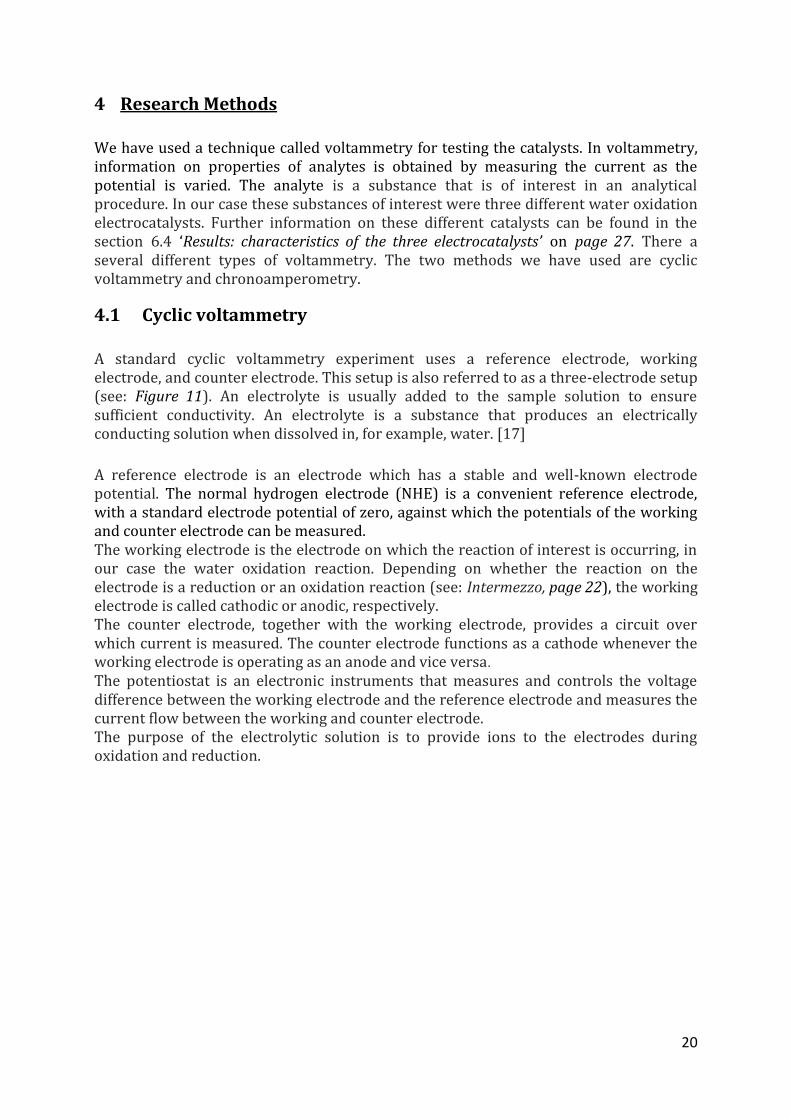
A standard cyclic voltammetry experiment uses a reference electrode, working electrode, and counter electrode. This setup is also referred to as a three-electrode setup (see: Figure 11). An electrolyte is usually added to the sample solution to ensure sufficient conductivity. An electrolyte is a substance that produces an electrically conducting solution when dissolved in, for example, water. [17]
A reference electrode is an electrode which has a stable and well-known electrode potential. The normal hydrogen electrode (NHE) is a convenient reference electrode, with a standard electrode potential of zero, against which the potentials of the working and counter electrode can be measured. The working electrode is the electrode on which the reaction of interest is occurring, in our case the water oxidation reaction. Depending on whether the reaction on the electrode is a reduction or an oxidation reaction (see: Intermezzo, page 22), the working electrode is called cathodic or anodic, respectively. The counter electrode, together with the working electrode, provides a circuit over which current is measured. The counter electrode functions as a cathode whenever the working electrode is operating as an anode and vice versa. The potentiostat is an electronic instruments that measures and controls the voltage difference between the working electrode and the reference electrode and measures the current flow between the working and counter electrode. The purpose of the electrolytic solution is to provide ions to the electrodes during oxidation and reduction.

21
Figure 11: Three-electrode setup: schematic overview water oxidation In our experiment water oxidation took place at the working electrode. The working electrode is thus called the anode:
2 H2O → O2 + 4 H+ + 4 e- The reaction occurring at the counter electrode was the reduction of H+-ions to hydrogen gas:
4 H+ + 4e- → 2 H2 In a cyclic voltammetry experiment the working electrode potential is increased over time. When the potential is increased more water oxidation takes place at the working electrode and the catalyst is formed on the glassy surface of the working electrode, you see the current rising as water is split and more ions appear in the solution. After a set potential is reached in a CV experiment, the working electrode's potential is ramped in the opposite direction to return to the starting potential. When lowering the potential more reduction takes place at the working electrode and the catalyst is partly reduced from the glassy surface of the working electrode, you see the current fall. These cycles of ramps in potential can be repeated as many times as desired. The current that flows between the working electrode and the counter electrode is plotted versus the applied potential to give the cyclic voltammogram trace. On page 27 you can see the results of the cyclic voltammetry we did on the three different water oxidation electrocatalysts.

22
Intermezzo: Redox
Redox reactions involve the transfer of electrons between species. Redox reactions are really composed of two different reactions:
● oxidation: the loss of electrons ● reduction: the gain of electrons
The electrons that are lost in the oxidation reaction are the same electrons that are gained in the reduction reaction. These two reactions are commonly called half-reactions; the overall reaction is called a redox reaction. An example, a reaction with zinc metal and an aqueous copper(II)sulfate solution:
𝑍𝑛 (𝑠) + 𝐶𝑢2+ → 𝑍𝑛2+ + 𝐶𝑢 This overall reaction is really composed of two half-reactions, shown below. Oxidation half-reaction — the loss of electrons:
𝑍𝑛 (𝑠) → 𝑍𝑛2+ + 2𝑒− Reduction half-reaction — the gain of electrons:
𝐶𝑢2+ + 2𝑒− → 𝐶𝑢 (𝑠) In this reaction the copper cation (Cu2+) is the oxidizing agent, it accepts the electrons from the chemical species that is being oxidized, and zinc (Zn) is the reducing agent, it provides the electron. The oxidizing agent is the species that is being reduced, and the reducing agent is the species that is being oxidized. [18]
4.2 Chronoamperometry
Chronoamperometry is an electrochemical technique in which you apply a constant voltage and you measure the current as a function of time. The current is limited by the rate of transport of the analyte to the working electrode. On page 28 you can see the results of the chronoamperometry we did on the three different water oxidation electrocatalysts.

23
Our research
5 Key question and sub-questions
The key research question: Research part 1: Which of the three tested electrocatalysts would be the best candidate for use in the “artificial leaf” from the BioSolar Cells Programme? Research part 2 and 3: What are the main deficiencies of the “artificial leaf” and how can we improve upon them? Sub-questions: Research part 1:
1) Which electrocatalyst performs best at higher voltages? 2) Which electrocatalyst generates the highest current? 3) Which electrocatalyst resist a fixed potential of 1.8 V (vs. NHE) over a minimum
timespan of approximately 20 hours most effectively? And which electrocatalyst generates the highest current during this time span at this fixed potential?
Research part 2 and 3:
1) How does the chosen electrocatalyst behave inside the “artificial leaf”? 2) Will the electrical connection system inside the “artificial leaf” be able to provide
a constant potential across the whole surface area of the glass slide? 3) Is the filling system to insert the catalyst solution into the “artificial leaf” an
efficient mechanism? 4) Can we improve upon the design of the “artificial leaf” to make it more practical
and easy to use?

24
6 First part of the research: testing of three water oxidation electrocatalysts
6.1 Introduction to the three water oxidation electrocatalysts
In our experiment we have used three different types of water oxidation electrocatalyst. An electrocatalyst is a catalyst that participates in electrochemical reactions. That is, any process either caused or accompanied by the passage of an electric current and involving in most cases the transfer of electrons between two substances—one a solid and the other a liquid. [19] Electrocatalysis is a catalytic process involving oxidation or reduction through the direct transfer of electrons between the electrode and reactants. The electrocatalysts assist in transferring the electrons. Catalysts are not consumed in a reaction, therefore only a small amount of catalyst needs to be used. The electrocatalysts are necessary for electrochemical reactions because they avoid a large overpotential in the delivery of electrons. [20] Overpotential is the potential difference (voltage) between the half-reaction's thermodynamically determined reduction potential and the potential at which the redox event is experimentally observed. We earlier talked about the energy budget for artificial photosynthesis. We explained that 2.9 V is the energy budget for breaking down the chemical bonds in water and forming the new bonds that hold together oxygen and fuel. Now you might understand that electrocatalysts are of key importance because they make sure that we use the lowest possible potential for certain chemical reaction to occur. This makes it more likely to be able to perform the whole artificial photosynthetic process from the 2.9 V energy budget we acquired from the sun’s energy. During the experiments the electrocatalysts self-assemble from a solution, under the influence of an applied potential, on a particular surface. This makes them very easy to make. The Ni-Based Water Oxidation Electrocatalyst and the Cobalt-Derived Water Oxidation Electrocatalyst were developed by the Leiden University. [21] [22] The Water Oxidation Electrocatalyst containing Phosphate and Co2+ was developed in the laboratory of Daniel Nocera. [23] All the three electrocatalysts are made from cheap and readily available materials.
6.2 Purpose
The ultimate goal of our research was to perform water oxidation experiments with the “artificial leaf” from the LIS and BioSolar Cells programme. As this is the first prototype “artificial leaf” still a lot of improvements can be made on the system. We therefore wanted to test a known water oxidation electrocatalyst in this “artificial leaf” to test the functionality of the system and encounter its deficiencies. This electrocatalyst we were looking for had to meet a few requirements to be able to perform well in the “artificial leaf”. It had to be able to resist the high voltages (theoretically around 2.4 V) generated by the solar cells in the light harvesting section of the “artificial leaf”. The electrocatalyst had to be capable of surviving (meaning not disintegrate) under a high potential for a long time. The longer the electrocatalyst can survive the less often it has to be renewed, which is more practical and more cost-efficient. Another criterion was the current emission of the electrocatalyst: the catalyst must help generate the highest current possible to ensure a

25
high efficiency. Using CV we analysed the current emission of the electrocatalysts and analysed at what potentials the catalyst could still survive. Using chronoamperometry we analysed the time the electrocatalyst would survive under a particular potential. The catalyst that would perform best under these criteria would be our optimal candidate for testing in the “artificial leaf”.
6.3 Experimental section The experimental set-up: For cyclic voltammetry and chronoamperometry, a three electrode configuration pyrex glass cell was used, see figure 12. The water oxidation reaction, the hydrogen formation reaction and oxygen evolution measurement investigations were carried out in a conventional three electrode cell. A stirring bar was placed inside the cell to ensure an even mixture of substances in the solution. All solutions were prepared in ultrapure water (Millipore MilliQ) and all electrochemical measurements were performed in aqueous solutions at room temperature. We used Indium-tin-oxide (ITO) coated glass slides (8-12 Ω/sq surface resistivity) as working electrodes. Platinum wire (thickness: 1 mm), shaped into a spiral, was used as a counter electrode (CE). A silver-silver chloride electrode (Ag/AgCl) was used as reference electrode. All potentials will be referred to normal hydrogen electrode (NHE): when we performed a cyclic voltammetry measurement at 1.4 V Ag/AgCl this voltage will be referred to as 1.6 vs. NHE, as NHE is used in most published scientific papers. Cyclic voltammetry experiments were performed with an Autolab PG-stat10 potentiostat controlled by GPES-4 software. Specification on the performed experiment: In the three electrode configuration pyrex glass cell we tested three different water oxidation electrocatalysts. The Cobalt-Derived Water Oxidation Electrocatalyst was generated in situ from a 30 ml 0.2 M NaHCO3-solution containing 0.3 ml 0.1 M Co(NO3)2- solution, on a ITO coated glass slide (WE) during the CVs between 0 - 1.6 V (vs. NHE), 0 - 1.8 V (vs. NHE), 0 - 2.0 V (vs. NHE) and 0 - 2.5 V (vs. NHE). The Ni-Based Water Oxidation Electrocatalyst was generated in situ from a 0.3 ml 0.1 M Ni(NO3)2-solution in 30 ml 0.2 M NaHCO3-solution, on a ITO coated glass slide (WE) during the CVs between 0 - 1.6 V (vs. NHE), 0 - 1.8 V (vs. NHE), 0 - 2.0 V (vs. NHE) and 0 - 2.5 V (vs. NHE). The Water Oxidation Electrocatalyst containing Phosphate and Co2+ was generated in situ from a 30 ml 0.1 M phosphate-buffer containing 0.3 ml 0.1 M Co(NO3)2- solution, on a ITO coated glass slide (WE) during the CVs between 0 - 1.6 V (vs. NHE), 0 - 1.8 V (vs. NHE), 0 - 2.0 V (vs. NHE) and 0 - 2.5 V (vs. NHE). With each catalyst the cycles of ramps in potential were repeated around 10 times to give the cyclic voltammogram trace. Before we tested the catalysts we did a blank; we did a CV with only the NaHCO3-solution and another CV with only the phosphate-buffer. These experiments were done to exclude that any current we measured during CV was caused by the buffer solutions. After the CV experiments of each different electrocatalyst we did an overnight chronoamperometry at a fixed potential: 1.8 V (vs. NHE).

26
Materials: The phosphate buffer, Co(NO3)2.6H2O (99.999%), Ni(NO3)2.nH2O (99.999%) and sodium bicarbonate (NaHCO3, 99.5-100.5 %)(pH = 6.7–6.8) were purchased from Sigma Aldrich. Indium-tin-oxide (ITO) coated glass slides (8-12 Ω/sq surface resistivity) were purchased from Sigma Aldrich. The spiral platinum counter electrode that was used for electrolysis was flame annealed and washed with pure water before placing it into the cell. The ITO slides were cleaned in succession with methanol and acetone, and ultimately washed with Millipore water.
Figure 12: The set-up in the three electrode configuration pyrex glass cell.

27
6.4 Results: characteristics of the three electrocatalysts
6.4.1 Ni-Based Water Oxidation Electrocatalyst This nickel-based catalyst works best at a pH of around 6.8. CO2 is usually added to lower the pH and make it easier for the reaction to take place and for the Ni(NO3)2 to dissolve in the NaHCO3-solution. We expected the Ni(NO3)2 not to dissolve well in NaHCO3-solution, as previous literature had shown, but this appeared to be no problem. We did add CO2 to one of CV experiments but this made absolutely no difference, so we decided not to pump CO2 in the solution with the further CVs.
Figure 13: Cyclic voltammetry curve of the Ni-Based Water Oxidation Electrocatalyst. The graph is plotted between 0 - 2.0 V (vs. NHE). After the formation of the electrocatalyst on the ITO coated glass slides, a catalyst formation bump appears at about 1.1 V (vs. NHE) in the cyclic voltammetry curve. This bump indicates the catalyst has been formed. Due to the catalyst formation the water oxidation reaction is able to occur, this is seen in the graph by a sharp catalytic current rise at >1.4 V (vs. NHE), accompanied by the generation of tiny oxygen bubbles at the anode (= at the working electrode). The current rises with further potential increase, and we can see a catalytic deposit on the ITO glass surface. The backward sweep generates the corresponding reduction wave between 0.85 and 0.5 V (vs. NHE). The catalyst has now been reduced and the catalytic deposit on the ITO glass surface partly disappears. The oxygen evolution current (in the reaction at the WE water is split in oxygen, protons and electrons) attains a value of more than 9 mA at only 2.0 V (vs. NHE) showing remarkable catalytic activity. During the potential cycles the current increased, revealing the growth of catalytic deposit on the ITO glass surface. This growth of catalytic deposit is the result of more oxidation than reduction taking place at the ITO glass surface. The catalyst formation bump, the sharp catalytic current rise and the reduction wave can be identified in a similar way in the following graphs.

28
Figure 14: Cyclic voltammetry curve of the Ni-Based Water Oxidation Electrocatalyst. The graph is plotted between 0 - 2.5 V (vs. NHE). In this figure, we can see a catalyst formation bump at around 1.0 V (vs. NHE), followed by a sharp catalytic current rise at >1.4 V (vs. NHE). The corresponding reduction wave occurs between 0.85 V and 0.4 V (vs. NHE). A maximum current of 18 mA is reached at 2.5 V (vs. NHE). This is the high voltage we could expect to be present in the “artificial leaf”. Remarkably the Ni-Based Water Oxidation Electrocatalyst seemed to perfectly resist this high voltage and additionally produced a proper maximum current.
Figure 15: Chronoamperometry of the Ni-Based Water Oxidation Electrocatalyst at 1.8 V (vs. NHE).

29
Figure 15 shows the long-term fixed potential measurement of the Ni-Based Water Oxidation Electrocatalyst. A constant voltage of 1.8 V (vs. NHE) was applied for a period of 140000 seconds, approximately 40 hours, with an interval of 8 s. The fixed potential of 1.8 V (vs. NHE), is a higher voltage than previous studies have tested. We expected the electrocatalyst to fall apart faster at a voltage of 2.5 V (vs. NHE). We therefore took a somewhat lower, but still relatively high, voltage as we expected the voltage in the “artificial leaf” to be relatively high, too. Again, the Ni-Based Water Oxidation Electrocatalyst showed remarkable activity, easily resisting this high voltage for over the 40 hours we measured. After 25 hours, approximately 90 000 s, the current even started to rise again. The average produced current of around 4 mA is promising too. As a matter of time we stopped the experiment after 40 hours as we had gathered enough information from the measurement for this part of our research.
6.4.2 Cobalt-Derived Water Oxidation Electrocatalyst
Figure 16: Cyclic voltammetry curve of the Cobalt-Derived Water Oxidation Electrocatalyst. The graph is plotted between 0 - 2.0 V (vs. NHE). In this graph, we can distinguish the start of a catalyst formation bump at around 0.75 V (vs. NHE), followed by a sharp catalytic current rise at >1.3 V (vs. NHE). The corresponding reduction wave occurs between 1.2 V and 0.4 V (vs. NHE). A maximum current of 17 mA is reached at 2.0 V (vs. NHE). We noticed a clear difference between the size of the catalyst formation bump of the Ni-Based Electrocatalyst and the Cobalt-Derived Electrocatalyst. Since we do not know how either of the electrocatalyst form, or what their structure is, it is hard to say anything about the origin of the differences in size of catalyst formation bumps.

30
Figure 17: Cyclic voltammetry curve of the Cobalt-Derived Water Oxidation Electrocatalyst. The graph is plotted between 0 - 2.5 V (vs. NHE). Based on figure 17 we can conclude that the Cobalt-Derived Electrocatalyst did not function properly anymore at a voltage of above 2.0 V (vs. NHE). The catalyst could have fallen apart but it is still difficult to tell what chemistry would be involved in this process.
Figure 18: Chronoamperometry of the Cobalt-Derived Water Oxidation Electrocatalyst at 1.8 V (vs. NHE).

31
Figure 18 shows the long term fixed potential measurement of the Cobalt-Derived Water Oxidation Electrocatalyst. At constant voltage of 1.8 V (vs. NHE) was applied during a time of 70000 seconds, approximately 20 hours, with an interval of 8 s. The graphs clearly shows that the catalyst lost its function after approximately 25 000 seconds. This decrease in current could have been the result of an increasing layer of catalyst precipitation on the working electrode over time. This deposit of catalyst on the working electrode could have been the result of the remarkably high current produced by the constant water oxidation reaction taking place at the WE. The layer of catalyst on
the WE gets thicker over time until the water oxidation reaction can no longer occur. At that point, the ions in the solution that form the catalyst are nearly depleted and the ions
that are still present in the solution cannot reach the electrical conducting glassy surface of the
working electrode because the layer of catalyst that formed on this surface got to thick. This decreasing current over time could also have other causes that we do not yet know. At this moment many researchers do not yet have a full understanding of the exact process that is taking place during water oxidation with many experimental catalysts.
6.4.3 Water oxidation electrocatalyst containing Phosphate and Co2+
Figure 19: Cyclic voltammetry curve of the Water Oxidation Electrocatalyst containing Phosphate and Co2+. The graph is plotted between 0 - 2.0 V (vs. NHE).

32
Figure 20: Cyclic voltammetry curve of the Water Oxidation Electrocatalyst containing Phosphate and Co2+. The graph is plotted between 0 - 2.5 V (vs. NHE). Both figure 19 and 20 do not show a properly functioning electrocatalyst. We cannot even distinguish a catalyst formation bump. We have also tested the Water Oxidation Electrocatalyst containing Phosphate and Co2+ between 0 - 1.6 V and 0 - 1.8 V (vs. NHE) and saw that at these lower potentials the electrocatalyst did function more properly, see figure 21 and 22. The Water Oxidation Electrocatalyst containing Phosphate and Co2+ can apparently not tolerate the higher voltages.
Figure 21: Cyclic voltammetry curve of the Water Oxidation Electrocatalyst containing Phosphate and Co2+. The graph is plotted between 0 – 1.6 V (vs. NHE).

33
Figure 22: Cyclic voltammetry curve of the Water Oxidation Electrocatalyst containing Phosphate and Co2+. The graph is plotted between 0 – 1.6 V (vs. NHE).
Figure 23: Chronoamperometry of the Water Oxidation Electrocatalyst containing Phosphate and Co2+ at 1.8 V (vs. NHE). Figure 23 shows the long term measurement of the Water Oxidation Electrocatalyst containing Phosphate and Co2+. A constant voltage of 1.8 V (vs. NHE) was applied for a period of 210000 seconds, approximately 60 hours, with an interval of 8 s. We had originally set the time for the measurement at 64800 seconds but when we came in the next day it appeared that the electrocatalyst was still functional so we continued the experiment. Although the catalyst survived under this voltage for a long time, the produced current is somewhat lower than with the Ni-Based Electrocatalyst. The current also slowly started to decrease after approximately 70 000 s.

34
6.5 Conclusion: best catalyst for our purposes When comparing all the different data on the three water oxidation electrocatalyst we concluded that the Ni-Based Water Oxidation Electrocatalyst was the best candidate to test in the “artificial leaf” for a few reasons:
1. This electrocatalyst was the only catalyst that still functioned properly at the highest voltage we tested: 2.5 V (vs. NHE). The other two electrocatalysts gave weird graphs at this particular potential.
2. The chronoamperometry of the Ni-Based electrocatalyst looked most promising. The catalyst resisted the high voltage of 1.8 V (vs. NHE) for a very long time and produced a high average current of 4 mA. This electrocatalyst performed much better than the other two electrocatalyst.
3. The Ni-Based electrocatalyst generated a higher current (9 mA) at a potential of 2.0 V (vs. NHE) than the Water Oxidation Electrocatalyst containing Phosphate and Co2+ (7 mA). Although the Co-Derived electrocatalyst generated a way higher current (17 mA) at this potential (2.0 V vs. NHE), the Co-Derived electrocatalyst did not survive at the potential of 2.5 V (vs. NHE) and lost its function in an early stage of the chronoamperometry.
4. The Ni-Based electrocatalyst generated the highest current at a potential of 2.5 V (vs. NHE) as this was the only catalyst that still functioned well at this potential.
Altogether, the Ni-Based Water Oxidation Electrocatalyst appeared to be the best functioning catalyst under our established criteria and therefore suitable for testing in the “artificial leaf”.

35
7 Second part of the research: testing of a water oxidation electrocatalyst in the “artificial leaf”
7.1 Introduction to the “artificial leaf”
Within the BioSolar Cells programme, work is being done to unravel the fundamental principles of photosynthesis and then apply this knowledge not only to improve natural photosynthesis, but also to mimic it in a device. The aim is, amongst others, to develop two prototype artificial leaves, which will be able to split water into hydrogen and oxygen. After this, the research results will be translated into commercially viable systems. [5] In April 2015 researcher from the BioSolar Cells programme succeeded in the development of the first prototype “artificial leaf”, see figure 24. The BioSolar Cells programme yielded the expertise, the Leiden local authority funded the project and student from the LIS (Leidse Instrumentmakers School) developed the actual device. [24] This “artificial leaf” is, according to literature, able to generate hydrogen gas from water with an efficiency of 5%. [15] This prototype naturally still has its deficiencies, which we too have encountered during our experiments. These deficiencies with suggestions for possible solutions will be discussed in chapter 8 ‘Third part of our research: investigating the deficiencies of the prototype “artificial leaf” and possible solutions’ on page 43. Further research on this artificial system will need to improve on the efficiency. An efficiency of 18-20% may be achievable within 5 to 10 years. [15]
Figure 24: First prototype of the “artificial leaf” from the BioSolar Cells programme. We do not know a lot about the solar cells inside the “artificial leaf” as they are heavily protected by patents. The few things we known is that the solar cells were donated by Dutch Space (Airbus Defence & Space Netherlands). These solar cells are of very high quality and give out a potential of 2.4 V. Figure 25 shows the exploded view of the “artificial leaf”. We are not familiar with the properties and names of all the different components used inside the device. However, this figure does give some insight in the construction of the device. The device consists of many different layers. The first layer is where the solar cells are located and the energy from sunlight is captured. Then you have the anode, where the

36
splitting of water into oxygen and protons is catalysed by the electrocatalyst. The electrocatalyst solution is present in a cavity with a nafion membrane dividing the cavity in two parts, see figure 26. Nafion functions as a proton exchange membrane that allows protons only pass the membrane in one way. On the other side of the membrane is the cathode where the protons produced in the water splitting reaction are reduced to form hydrogen. This process is catalysed by a thin layer of platinum.
Figure 25: Exploded view of the prototype of the “artificial leaf” from the BioSolar Cells programme.
Figure 26: Internal view of the “artificial leaf”’. The ITO glass slide in the left figure functions as working electrode. In the right figure the conducting iron ring is shown and the nafion membrane, behind which another glass is located that functions as counter electrode.

37
7.2 Purpose
We were very intrigued by “artificial photosynthesis” and wanted to look at possibilities to implement this in society. The aim of the second part of our experiments was to find out how the Nickel-Based Electrocatalyst functions in the “artificial leaf”. This is to replicate a more “realistic” surrounding in which an electrocatalyst needs to function when the process of artificial photosynthesis is implemented in a device. This is a very different and new situation to test the electrocatalyst as opposed to the easily controllable and observable lab setup of the first part of our experiments. However, this interesting new experimental setup, the “artificial leaf” in which we going to test the electrocatalyst, came with a number of challenges. The only electrocatalyst tested before in this “artificial leaf” was iron oxide, commonly known as rust. This is not an efficient electrocatalyst. That is why we wanted to test a more efficient one to see how it would perform inside the ‘artificial leaf’. We were the first ones to test a solution of self-assembling electrocatalysts inside this system. This set of experiments gave us a better insight into what the shortcomings of the “artificial leaf” are, and how these should be improved upon in the future.
7.3 Experimental Section
The experimental set-up: For chronoamperometry, the “artificial leaf” was used and a halogen lamp with luminous flux of 8545 lm, see figure 28. The solar cells could theoretically provide a constant voltage of 2.4 V. The water oxidation reaction, the hydrogen formation reaction and the oxygen evolution were carried out inside the “artificial leaf”. The whole setup was connected to a voltmeter and an ampere metre. These were then connected to the CoachLab II+ and then to a PC. The measurements and graphs have all been made with the program “CoachLab II+”. All solutions were prepared in ultrapure water (Millipore MilliQ) and all electrochemical measurements were performed in aqueous solutions at room temperature. We used an Indium-tin-oxide (ITO) coated glass slide (8-12 Ω/sq surface resistivity) as working electrode. A thin layer of platinum functioned as counter electrode. We also coated different ITO glass slides with electrical conducting material in order to try to improve conductivity and to create an even potential across the glass slide. We tested a blank ITO glass slide, an ITO glass slide with a silver-grid, one with a copper-tape-grid and one with a graphite-grid. We later coated the silver-grid with a layer of glue to prevent the oxidation of silver.

38
Figure 27: ITO coated glass slides with:
1) Silver grid 2) Copper tape grid 3)Graphite grid
Specification on the performed experiment: The Ni-Based Water Oxidation Electrocatalyst was generated in situ from a 0.3 ml 0.1 M Ni(NO3)2-solution in 30 ml 0.2 M NaHCO3-solution, on a ITO coated glass slide (WE) inside the “artificial leaf” at a ‘theoretical’ 2.4 V generated by the solar cells. Before we tested the catalysts we did a blank test: a test with a non-coated ITO glass slide in only the NaHCO3-solution. This experiment was done to exclude that any current we measured during chronoamperometry was caused by the buffer-solutions. Than we did a chronoamperometry of the Ni-Based Water Oxidation Electrocatalyst inside the artificial leave with an ITO glass slide that was not coated with electrical conducting material. In the chronoamperometry experiments that followed we changed the Ni-Based Water Oxidation Electrocatalyst each experiment and we looked at the effects of the different ITO glass slides, coated with various electrical conducting materials. At the halfway point of each measurement (except for the first blank test), we halved the distance between the “artificial leaf” and the lamp: from 1.0 m to 0.5 m. Materials used: Ni(NO3)2.nH2O (99.999%) and sodium bicarbonate (NaHCO3, 99.5-100.5 %) were purchased from Sigma Aldrich. Indium-tin-oxide (ITO) coated glass slides (8-12 Ω/sq surface resistivity) were purchased from Aldrich. The silver-grid was made by the ‘fijn mechanische dienst’ of the faculty of science at Leiden University. The copper-tape-grid and the graphite-grid were made by us respectively with copper tape and graphite conductive adhesive paste. The aqueous based graphite conductive adhesive paste was produced by Alfa Aesar. The copper tape was manufactured by Wurth Elektronik. The glue used to coat the silver-grid was produced by Bison. The halogen lamp was produced by Brennenstuhl (serial nr. 1171360).

39
Figure 28: Experimental set-up used in the second part of our research. The light produced by the halogen lamp, shines directly onto the solar cells of the “artificial leaf”.
7.4 Results
Figure 29: Blank chronoamperometry with only the NaHCO3-solution and a non-coated ITO glass slide in the “artificial leaf”. From the following measurement onwards, the jump in the voltage graph (the green line) results from halving the distance between the “artificial leaf” and the light source.

40
Figure 30: Chronoamperometry of the Ni-Based Water Oxidation Electrocatalyst with a non-coated ITO glass slide inside the “artificial leaf” . When the potential rises, the current also rises a bit. However, it is less than what we hoped it to be.
Figure 31: Chronoamperometry of the Ni-Based Water Oxidation Electrocatalyst with a silver-grid coated ITO glass slide inside the “artificial leaf”. In the case of the silver-grid the current remains approximately the same after the voltage rises.

41
Figure 32: Chronoamperometry of the Ni-Based Water Oxidation Electrocatalyst with a copper-grid coated ITO glass slide inside the “artificial leaf”. Surprisingly enough, the current actually drops, in the case of the copper-grid, after the voltage rises.
Figure 33: Chronoamperometry of the Ni-Based Water Oxidation Electrocatalyst with a graphite-grid coated ITO glass slide inside the “artificial leaf” (second attempt).

42
Figure 34: Chronoamperometry of the Ni-Based Water Oxidation Electrocatalyst with a silver-grid (coated with glue) coated ITO glass slide in the “artificial leaf”. When we coated the silver-grid with glue, we got a significantly lower current. This might suggest that the current in the measurement of the silver-grid without glue was due to oxidation of the silver instead of the catalytic water splitting. However, the silver without glue showed no visible signs of oxidation after the previous experiments.
7.5 Conclusion The catalyst of our choice did work in the “artificial leaf”, although not very efficiently. We have also found multiple ways to improve the distribution of current on the glass plates by testing various grids, but it was not very clear which worked the best. Testing the catalyst inside the “artificial leaf” has really helped us in understanding what the challenges are regarding the “full-scale” application of artificial photosynthesis as an energy source. The problems we have come across as well as their possible solutions will be discussed in the next chapter.
43
8 Third part of our research: investigating the deficiencies of the prototype “artificial leaf” and possible solutions
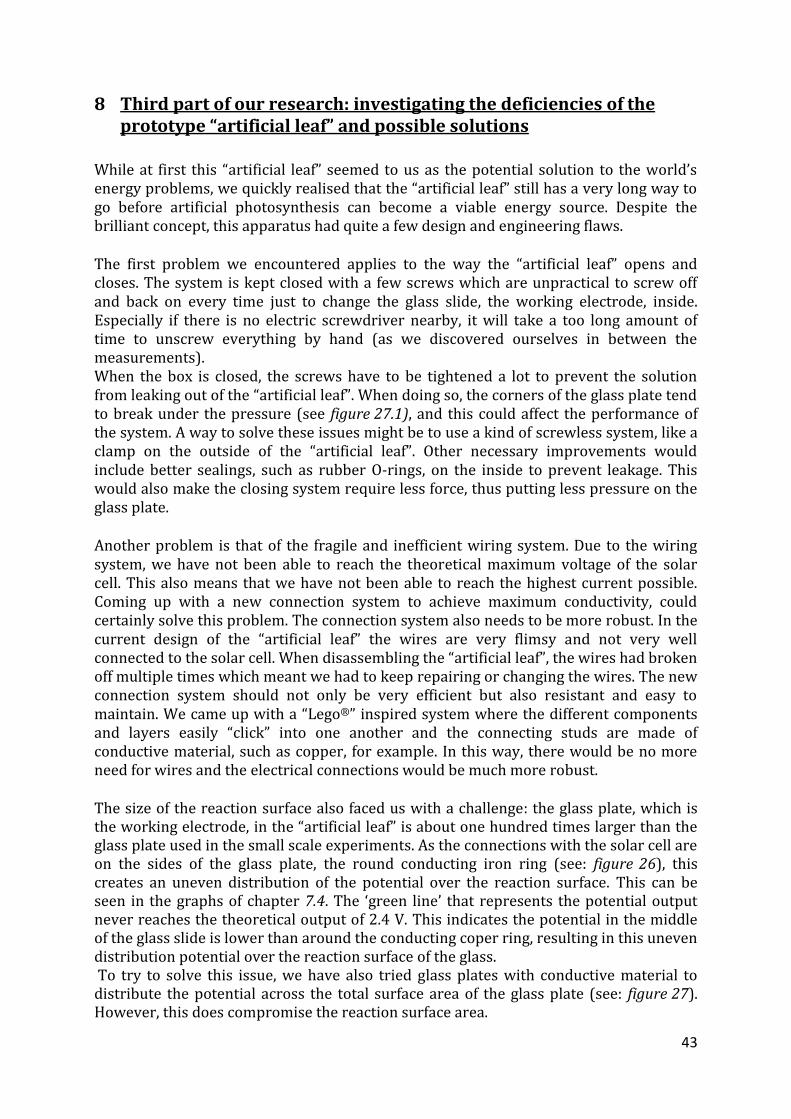
While at first this “artificial leaf” seemed to us as the potential solution to the world’s energy problems, we quickly realised that the “artificial leaf” still has a very long way to go before artificial photosynthesis can become a viable energy source. Despite the brilliant concept, this apparatus had quite a few design and engineering flaws. The first problem we encountered applies to the way the “artificial leaf” opens and closes. The system is kept closed with a few screws which are unpractical to screw off and back on every time just to change the glass slide, the working electrode, inside. Especially if there is no electric screwdriver nearby, it will take a too long amount of time to unscrew everything by hand (as we discovered ourselves in between the measurements). When the box is closed, the screws have to be tightened a lot to prevent the solution from leaking out of the “artificial leaf”. When doing so, the corners of the glass plate tend to break under the pressure (see figure 27.1), and this could affect the performance of the system. A way to solve these issues might be to use a kind of screwless system, like a clamp on the outside of the “artificial leaf”. Other necessary improvements would include better sealings, such as rubber O-rings, on the inside to prevent leakage. This would also make the closing system require less force, thus putting less pressure on the glass plate. Another problem is that of the fragile and inefficient wiring system. Due to the wiring system, we have not been able to reach the theoretical maximum voltage of the solar cell. This also means that we have not been able to reach the highest current possible. Coming up with a new connection system to achieve maximum conductivity, could certainly solve this problem. The connection system also needs to be more robust. In the current design of the “artificial leaf” the wires are very flimsy and not very well connected to the solar cell. When disassembling the “artificial leaf”, the wires had broken off multiple times which meant we had to keep repairing or changing the wires. The new connection system should not only be very efficient but also resistant and easy to maintain. We came up with a “Lego®” inspired system where the different components and layers easily “click” into one another and the connecting studs are made of conductive material, such as copper, for example. In this way, there would be no more need for wires and the electrical connections would be much more robust. The size of the reaction surface also faced us with a challenge: the glass plate, which is the working electrode, in the “artificial leaf” is about one hundred times larger than the glass plate used in the small scale experiments. As the connections with the solar cell are on the sides of the glass plate, the round conducting iron ring (see: figure 26), this creates an uneven distribution of the potential over the reaction surface. This can be seen in the graphs of chapter 7.4. The ‘green line’ that represents the potential output never reaches the theoretical output of 2.4 V. This indicates the potential in the middle of the glass slide is lower than around the conducting coper ring, resulting in this uneven distribution potential over the reaction surface of the glass. To try to solve this issue, we have also tried glass plates with conductive material to distribute the potential across the total surface area of the glass plate (see: figure 27). However, this does compromise the reaction surface area.

44
Therefore, in a new connection system the electricity transfer from the solar cell to the glass plate must also be improved. In the “Lego®” system as mentioned before, we can create more connection points between the conductive studs and the copper glass-plate connector. We also need to find an optimum balance between the amount of conductive material on the glass plate and the amount of reaction surface area left for the electrocatalyst to act on. When inserting the Nickel-Based Electrocatalyst solution into the “artificial leaf”, we noticed the connection between the nozzle and the tube was leaking heavily. We managed to minimise this by sealing it with “Parafilm”, however we still had a few leaks. This is a crucial flaw that would need fixing in a new design of an “artificial leaf”. This could be improved with better rubber sealing. In some follow-up experiments, Mrs. Purchase noticed a strong correlation between the amount of solution inside and the performance of the system. This emphasises furthermore the need for a more simple way of filling the system and a way to tell exactly how full the “artificial leaf” is. A larger nozzle with a valve to prevent reflux would help a lot. We sometimes found it difficult to fill the “artificial leaf” through the small tube and the solution would regularly flow back if the “artificial leaf” was not held upright. Through trial and error, we have managed to discover the most important deficiencies of the “artificial leaf”. We hope this information could be of vital use in designing a second version of the “artificial leaf”.

45
Discussion It was great to be pioneers in this field of science and to have been given the opportunity to experiment with new technologies. The first set of experiments went quite well. This is due to the fact that these were not new experiments and thus had known working procedures and predictable outcomes. Mrs. Purchase explained all the procedures clearly so we quickly got everything up and running. We really got good results, even better than expected. The second set of experiments however, was a lot more complicated. Nobody had tested the nickel-based catalyst in this “artificial leaf” before. We found it took longer than expected to set up the “artificial leaf” for the experiments and to get everything working properly. It required a certain level of improvisation as we often encountered unexpected technical difficulties, which have been mentioned in chapter 8. As far as the literary research part goes, we got a lot of help from Mrs. Purchase and Mr. Lodewijkx as they both provided us with good reading material. Although this part was a lot of work and it sometimes was difficult to find information about artificial photosynthesis, as it is such a new technology, we are very satisfied with the end result. The cooperation between the two of us went very smoothly and effectively. Overall, even though we have had our ups and downs, we are pleased with how this complete research report has turned out.
Acknowledgements First of all, we would like to thank Pre-University for getting us in touch with Mrs. Purchase and making this research at Leiden University possible. We did our experiments at the “Gorlaeus Laboratorium” under the supervision of Robin Purchase. Without her nothing would have been possible. We would like to thank her for always helping us when needed, for leading us into the world of scientific research and most of all for being a mentor to us. Of course we also want to thank Huub de Groot for all the work he has done concerning artificial photosynthesis and for continuing the quest towards a sustainable future. We would also like to thank Henk Buisman for letting us use his lab equipment and helping us set up the second set of experiments. Special thanks also go to Mr. Lodewijkx who helped us shape our research into our “profielwerkstuk” for school. It was very exciting to have done experiments in such a new domain and it certainly was a very memorable experience.

46
References
[1] Holly Shaftel, “NASA: Climate Change and Global Warming,” NASA's Jet Propulsion Laboratory, 10 February 2016. [Online]. Available: http://climate.nasa.gov/effects/.
[2] “BP Statistical Review of World Energy June 2015,” [Online]. Available: http://www.bp.com/content/dam/bp/pdf/energy-economics/statistical-review-2015/bp-statistical-review-of-world-energy-2015-oil-section.pdf.
[3] J. Hermans, Energy survival guide, Leiden Publications, 2011, p. 9.
[4] “Andor an Oxford Instruments Company,” [Online]. Available: http://www.andor.com/learning-academy/what-is-light-an-overview-of-the-properties-of-light.
[5] R. Purchase, H. de Vriend and H. de Groot, Artificial Photosynthesis, For the conversion of sunlight to fuel, 1 ed., Propress, Wageningen, 2015, pp. 10, 14, 19, 20, 23, 25, 35.
[6] A. Bos, M. Gommers, A. Jansen, O. Kalverda, T. Rouw, de , G. Smits, B. Waas and R. Westra, “Koolstofassimilatie,” in Biologie voor jou, 's-Hertogenbosch, Malmberg, 2014, pp. 24-31.
[7] D. S. Ginley, D. Cahen and H. Groot, de, Fundamentals of Materials for Energy and Environmental Sustainability, vol. Engineering natural photosynthesis, Cambridge University Press, 2011, pp. 367-368, 22.
[8] B. Miles, “Photosynthesis,” 7 March 2003. [Online]. Available: https://www.tamu.edu/faculty/bmiles/lectures/photosynthesis.pdf.
[9] “Wikipedia: Light-dependent reactions,” 28 January 2016. [Online]. Available: https://en.wikipedia.org/wiki/Light-dependent_reactions.
[10] “Wikepedia: Electrochemical gradient,” 24 December 2015. [Online]. Available: https://en.wikipedia.org/wiki/Electrochemical_gradient.
[11] “Boundless - Textbook Innovation,” [Online]. Available: https://www.boundless.com/biology/textbooks/boundless-biology-textbook/photosynthesis-8/the-light-independent-reactions-of-photosynthesis-82/the-calvin-cycle-377-11603/.
[12] J. Bockris, B. Dandapani, D. Cocke and J. Ghoroghchian, “International Journal of Hydrogen Energy, On the splitting of water,” Elsevier , no. 3, p. 179–201, 2012.
[13] “Photoelectrochemical reduction of CO2,” 30 December 2015. [Online]. Available: https://en.wikipedia.org/wiki/Photoelectrochemical_reduction_of_CO2.
[14] D. v. d. Hoeven, “Huub de Groot: artificial photosynthesis is going to be the backbone of energy supply,” Bio Based Press, 6 January 2013. [Online]. Available: http://www.biobasedpress.eu/2013/01/huub-de-groot-artificial-photosynthesis-is-going-to-be-the-backbone-of-energy-supply/.
[15] R. Purchase, H. Vriend, de and H. Groot, de, “Productie natuurlijke brandstof komt binnen bereik,” Milieu, November 2015.
[16] R. E. Blankenship, “Comparing Photosynthetic and Photovoltaic Efficiencies and Recognizingthe Potential for Improvement,” Science, no. 332, p. 806, 2011.
[17] “Cyclic voltammetry,” Wikipedia , 22 January 2016. [Online]. Available: https://en.wikipedia.org/wiki/Cyclic_voltammetry.
47
[18] “Redox Reactions: Oxidation and Reduction,” For Dummies, A Wiley Brand, [Online]. Available: http://www.dummies.com/how-to/content/redox-reactions-oxidation-and-reduction.html.
[19] J. O. Bockris, “Electrochemical reaction,” Encyclopedia Britannica, [Online]. Available: http://www.britannica.com/science/electrochemical-reaction.
[20] “Electrochemical reaction mechanism,” Wikipedia, 19 May 2015. [Online]. Available: https://en.wikipedia.org/wiki/Electrochemical_reaction_mechanism.
[21] K. S. Joya, H. Groot, de and Y. F. Yoya, “Ni-Based Electrocatalyst for Water Oxidation Developed In-Situ in a HCO 3 − /CO 2 System at Near-Neutral pH,” MaterialsViews, 2014.
[22] K. S. Joya, H. Groot, de and K. Takanabe, “Surface Generation of a Cobalt-Derived Water Oxidation Electrocatalyst Developed in a Neutral HCO 3 − /CO 2 System,” MaterialsViews, 2014.
[23] M. W. Kanan and D. G. Nocera, “In Situ Formation of an Oxygen-Evolving Catalyst in Neutral Water Containing Phosphate and Co 2+,” Science, no. 321, 2008.
[24] “Leidse waterstofgenerator voor schone bussen,” Leiden Gemeentesite, 22 April 2015. [Online]. Available: http://gemeente.leiden.nl/nieuwsitem/artikel/leidse-waterstofgenerator-voor-schone-bussen-1/.