Artificial intelligence.. methodology, systems and applications.. proc., Varna 2004
545
-
Upload
judith-butler -
Category
Documents
-
view
250 -
download
0
Transcript of Artificial intelligence.. methodology, systems and applications.. proc., Varna 2004


Lecture Notes in Artificial IntelligenceEdited by J. G. Carbonell and J. Siekmann
Subseries of Lecture Notes in Computer Science
3192

This page intentionally left blank

Christoph Bussler Dieter Fensel (Eds.)
Artificial Intelligence:Methodology, Systems,and Applications
11th International Conference, AIMSA 2004Varna, Bulgaria, September 2-4, 2004Proceedings
Springer

eBook ISBN: 3-540-30106-2Print ISBN: 3-540-22959-0
©2005 Springer Science + Business Media, Inc.
Print ©2004 Springer-Verlag
All rights reserved
No part of this eBook may be reproduced or transmitted in any form or by any means, electronic,mechanical, recording, or otherwise, without written consent from the Publisher
Created in the United States of America
Visit Springer's eBookstore at: http://ebooks.springerlink.comand the Springer Global Website Online at: http://www.springeronline.com
Berlin Heidelberg

Preface
The 11th Conference “Artificial Intelligence: Methodology, Systems, Applications –Semantic Web Challenges” (AIMSA 2004) continued successfully pursuing the mainaim of the AIMSA series of conferences – to foster the multidisciplinary communityof artificial intelligence researchers, embracing both the theoretic underpinnings of thefield and the practical issues involved in development, deployment, and maintenanceof systems with intelligent behavior. Since the first conference in 1984 AIMSA hasprovided an ideal forum for international scientific exchange between Central/EasternEurope and the rest of the world and it is even more important nowadays in the unify-ing Europe.
The current AIMSA edition is focused on Semantic Web methods and technologies.The Internet is changing the everyday services landscape, and the way we do things inalmost every domain of our life. Web services are rapidly becoming the enablingtechnology of today’s e-business and e-commerce systems, and will soon transform theWeb as it is now into a distributed computation and application framework. Theemerging Semantic Web paradigm promises to annotate Web artefacts to enableautomated reasoning about them. When applied to e-services, the paradigm hopes toprovide substantial automation for activities such as discovery, invocation, assembly,and monitoring of e-services.
One hundred and seventy-six interesting papers were submitted to the conference.Each paper was reviewed by at least three independent reviewers. The programmecommittee selected for the conference program 56 high-quality contributions. 52 ofthem were prepared in time to form the current volume. These papers concern a widespectrum of artificial intelligence areas, e.g., ontology engineering, Semantic Webtools and services, but also some traditional AI topics, e.g., knowledge representation,machine learning and data mining, natural language processing, soft computing,multi-agent systems, e-learning Systems, intelligent decision making, and intelligentinformation retrieval.
AIMSA 2004 invited two keynote speakers: Jeffrey T. Pollock from Network Infer-ence for his contributions to AI business applications, and Darina Dicheva for herwork on Semantic Web approaches to e-learning.
We would like to thank the AIMSA program committee and the additional reviewersfor their hard work in helping make this conference a success.
July 2004 Christoph BusslerDieter Fensel

VI Program Committee
Conference Chair
Dieter FenselDigital Enterprise Research InstituteInnsbruck, Austria
Program Committee Chair
Christoph BusslerDigital Enterprise Research InstituteGalway, Ireland
Program Committee
Karl Aberer (Switzerland)Nabil Adam (USA)Sudhir Agarwal (Germany)Gennady Agre (Bulgaria)Marco Aiello (Italy)Yuan An (Canada)Anupriya Ankolekar (USA)Budak Arpina (USA)Boualem Benatallah (Australia)Bettina Berendt (Germany)Sonia Bergamaschi (Italy)Abraham Bernstein (Switzerland)Elisa Bertino (Italy)Omar Boucelma (France)Paolo Bresciani (Italy)Diego Calvanese (Italy)Fabio Casati (USA)Tiziana Catarci (Italy)Edward Chang (USA)Vincenzo D’Andrea (Italy)Veleria de Antonellis (Italy)Maarten de Rijke (The Netherlands)Stefan Decker (Ireland)Christo Dichev (USA)Ying Ding (Austria)Danail Dochev (Bulgaria)Asuman Dogac (Turkey)Jerome Euzenat (France)Martin Frank (USA)Martin Gaedke (Germany)Jonathan Gelati (Italy)Carole Goble (UK)Asun Gomez-Perez (Spain)Sergio Greco (Italy)William Grosso (USA)Francesco Guerra (Italy)Siegfried Handschuh (Germany)Andreas Hotho (Germany)
Zachary Ives (USA)Paul Johannesson (Sweden)Gerti Kappel (Austria)Vipul Kashyap (USA)Alfons Kemper (Germany)Rania Khalaf (USA)Roger King (USA)Atanas Kiryakov (Bulgaria)Mauel Kolp (Belgium)Irena Korpinska (Australia)Manolis Koubarakis (Greece)Winfried Lamersdorf (Germany)Doug Lea (USA)Alain Leger (France)Qing Li (Hong Kong)Xuemin Lin (Australia)Chengfei Liu (Australia)Jianguo Lu (Canada)Raphael Malyankar (USA)Ioana Manolescu (France)Maurizio Marchese (Italy)Massimo Marchiori (Italy)David Martin (USA)Pat Martin (Canada)Brian McBride (UK)Massimo Mecella (Italy)Sergey Melnik (Germany)Michele Missikoff (Italy)Pavlos Moraitis (Cyprus)Boris Motik (Germany)Enrico Motta (UK)Haralambos Mouratidis (UK)Claire Nedellec (France)Natasha Noy (USA)Borys Omelayenko (The Netherlands)Maria Orlowska (Australia)Massimo Paolucci (USA)Mike Papazoglou (The Netherlands)

Program Committee VII
Loris Penserini (Italy)Giacomo Piccinelli (UK)Dimitris Plexousakis (Greece)Christoph Quix (Germany)Zbigniew Ras (USA)Michael Rosemann (Australia)Michael Rys (USA)
Shazia Sadiq (Australia)Wasim Sadiq (Australia)Monica Scannapieco (Italy)Guus Schreiber (The Netherlands)Karsten Schulz (Australia)Ming-Chien Shan (USA)Keng Siau (USA)
Additional Reviewers
David AhnFerda N. AlpaslanNedjem AyatKartik BabuShahram BahadoriToby BaierRoberta BenassiMarco BenedettiD. BeneventanoDaniela BerardiStephan BloehdornGeorge BoukeasLars BraubachAndrea CalìMalu CastellanosJean CaussanelS. Sze-Man ChanJing ChenPhilipp CimianoDana CobzasAhmet CosarSimon CoxGregory CraskeP. Cudre-MaurouxArun D. QamraAgnieszka DardzinskaAnwitaman DattaLuigi DragoneLudger van ElstPeter FankhauserAlain FerrariniRudi FreundAlfredo GarroGionata GelatiRosella Gennari
Georgi GluhchevDaniel GmachOzgur GulderenChris HalaschekNadim HaqueDau HoangBodo HuesemannPrasad JayaweeraAndrew JenningsEsther KaufmannMarkus KeidlShailesh KelkarChristoph KieferStephen KimaniFabius KlemmJacek KopeckyIris KöstersRichard KuntschkeBrian LamAlexander LazovikJens LechtenboergerYuangui LeiElvis LeungSonia LippeRiccardo MarogliaF. Martin-RecuerdaEric Max MeisnerMichele MelchioriDiego MilanoWillie MilnorDaniele MiselliVladimir MonovDaniele MontanariKemal OflazerEmanuele Olivetti
Navneet PandaMarkus PetersEleftheria PetrakiAlexander PokahrGeorge PotamiasJean-Francois PugetMaurizio RafanelliDnyanesh RajpathakAndreas RauberMartin ReczkoRobert RichardsonMark RidingJean-Claude SaghbiniNora SanchezFederica SchiappelliChristoph SchmitzRon Van SchyndelZhe ShanSpiros SkiadopoulosGleb SkobeltsynDiego SonaNikolaos SpanoudakisPeter StuckeyYannis StylianouAndrea TagarelliFrancesco TaglinoJulien TaneIsmail Hakki TorosluF. ToumaniErwan TranvouezIrina TrubitsynaVassil VassilevS. VeeramachaneniKunal VermaPeter Vorburger

VIII Program Committee
Wei-Jen WangPeter WesterkampAlicja WieczorkowskaGang Wu
Jie WuYi WuMurat YukselenMassimo Zancanaro
Bernhard ZellerNing ZhangYuting ZhaoAnna Zhdanova
Local Organizers
Danail Dochev (Chair)Gennady Agre
Violeta MagerskaIvo Marinchev
Kamenka Staykova

Table of Contents
Ontology Engineering
Adoption of the Classical Theory of Definition to Ontology ModelingPatryk Burek
An Approach to Evaluate Existing Ontologies for Indexing aDocument Corpus
Nathalie Hernandez, Josiane Mothe
Capturing Semantics Towards Automatic Coordinationof Domain Ontologies
Konstantinos Kotis, George A. Vouros, Kostas Stergiou
Towards a Semantic Representation of Documentsby Ontology-Document Mapping
Mustapha Baziz
Using an Aligned Ontology to Process User QueriesKleber Xavier Sampaio de Souza, Joseph Davis
Semantic Web Services
An Experiment on Modelling Agents and Knowledgefor the Semantic Web
Alvaro E. Arenas, Brian M. Matthews
Automatic Creation and Monitoring of Semantic Metadata in aDynamic Knowledge Portal
Diana Maynard, Milena Yankova, Niraj Aswani, Hamish Cunningham
Coordinating Semantic PeersP. Bouquet, L. Serafini, S. Zanobini
Identification of Communities of Peers by Trust and ReputationAlessandro Agostini, Gianluca Moro
Integration of B2B Logistics Using Semantic Web ServicesJavier Esplugas Cuadrado, Chris Preist, Stuart Williams
Planning and Monitoring Web Service CompositionM. Pistore, F. Barbon, P. Bertoli, D. Shaparau, P. Traverso
1
11
22
33
44
54
65
75
85
96
106

X Table of Contents
Knowledge Presentation and Processing
A Logic of InequalitiesNikolai G. Nikolov
Exploiting the Constrainedness in Constraint Satisfaction ProblemsMiguel A. Salido, Federico Barber
Orthogonal Operators for User-Defined Symbolic PeriodicitiesLavinia Egidi, Paolo Terenziani
Solving Constraints Between Lines in Euclidean GeometryPhilippe Balbiani, Khalil Challita
Machine Learning and Data Mining
An Oracle Based Meta-learner for Function DecompositionR. Shyam Sundar Yadav, Deepak Khemani
Bagged Voting EnsemblesS.B. Kotsiantis, Panayiotis E. Pintelas
Cluster Validation for High-Dimensional DatasetsMinho Kim, Hyunjin Yoo, R.S. Ramakrishna
Emergent Behaviours Based on Episodic Encoding and FamiliarityDriven Retrieval
Emilia I. Barakova
Increasing the Classification Accuracy of Simple Bayesian ClassifierS.B. Kotsiantis, Panayiotis E. Pintelas
Outlier Detecting in Fuzzy Switching Regression ModelsHong-bin Shen, Jie Yang, Shi-tong Wang
PubMiner: Machine Learning-Based Text Mining Systemfor Biomedical Information Mining
Jae-Hong Eom, Byoung-Tak Zhang
Natural Language Processing
Advances in Profile Assisted Voicemail ManagementKonstantinos Koumpis
Computing Speech ActsGemma Bel Enguix, M. Dolores Jimenez Lopez
High Performance Part-of-Speech Tagging of BulgarianVeselka Doychinova, Stoyan Mihov
116
126
137
148
158
168
178
188
198
208
216
226
236
246

Table of Contents XI
The Definite Article of Bulgarian Adjectives and Numerals in DATRVelislava Stoykova
Towards a Better Understanding of the Language Content in theSemantic Web
Pavlin Dobrev, Albena Strupchanska, Galia Angelova
Soft Computing
A Study on Neural Networks and Fuzzy Inference Systemsfor Transient Data
Fevzullah Temurtas
Automatic Design of Hierarchical TS-FS Model Using AntProgramming and PSO Algorithm
Yuehui Chen, Jiwen Dong, Bo Yang
Forecasting Stock Price by SVMs RegressionYukun Bao, Yansheng Lu, Jinlong Zhang
Harmonic Detection Using Neural Networkswith Conjugate Gradient Algorithm
Nejat Yumusak, Fevzullah Temurtas, Rustu Gunturkun
Neural Networks
Neural Model of Osmotic Dehydration Kinetics of Fruits CubesIeroham Baruch, Próspero Genina-Soto, Boyka Nenkova,Josefina Barrera-Cortés
Robust and Adaptive Load Frequency Control of Multi-area PowerNetworks with System Parametric Uncertainties Using TemporalDifference Based MLP Neural Networks
Farzan Rashidi, Mehran Rashidi
Rule Based Neural Networks Construction for Handwritten ArabicCity-Names Recognition
Labiba Souici, Nadir Farah, Toufik Sari, Mokhtar Sellami
E-learning Systems
A generic E-learning Engineering Framework Embracingthe Semantic Web
Johannes Lischka, Dimitris Karagiannis
An Integrated Environment for Building Distributed Multi-agentEducational Applications
Tasos Triantis, Panayiotis E. Pintelas
256
267
277
285
295
304
312
321
331
341
351

XII Table of Contents
A Tutoring System Supporting Experimentation with VirtualMacroeconomic Environments
Manuel Núñez, Ismael Rodríguez, Fernando Rubio
Multi-agent Systems
An Agent Based Approach for Migrating Web Servicesto Semantic Web Services
László Zsolt Varga, Ákos Hajnal, Zsolt Werner
Constructing a BDI Agent to Deploy in an Interactive ComputerGame Environment
In-Cheol Kim
Learning Obstacle Avoidance Behavior Using Multi-agent Learningwith Fuzzy States
Ming Lin, Jihong Zhu, Zengqi Sun
Towards Well-Defined Multi-agent Reinforcement LearningRinat Khoussainov
Variant Extensions to Prove MAS BehavioursBruno Mermet, Dominique Fournier
Pattern Recognition
Arabic Words Recognition with Classifiers Combination:An Application to Literal Amounts
Nadir Farah, Labiba Souici, Lotfi Farah, Mokhtar Sellami
Curved Segmentation Path Construction for UnconstrainedHandwritten Hangul Segmentation
Sungho Park, Wontaek Seo, Beom-joon Cho
Efficient Segmentation Path Generation for UnconstrainedHandwritten Hangul Character
Wontaek Seo, Beom-joon Cho
Intelligent Decisionmaking
Designing Hybrid Cooperations with a Component Languagefor Solving Optimization Problems
Carlos Castro, Eric Monfroy
Multicriteria Optimization in CSPs : Foundations and DistributedSolving Approach
Inès Ben Jaâfar, Naoufel Khayati, Khaled Ghédira
Nonlinear State Feedback Control of Rigid Robot ManipulatorsMahdi Jalili-Kharaajoo
361
371
381
389
399
409
420
430
438
447
459
469

Table of Contents
Qualitative Model of Decision Making
Information Retrieval
Information Retrieval Model Based on User ProfileRachid Arezki, Pascal Poncelet, Gérard Dray, David William Pearson
Schema Matching in GISSnezhana Manoah, Omar Boucelma, Yassine Lassoued
The Web as an Autobiographical AgentMaya Dimitrova, Emilia I. Barakova, Tino Lourens, Petia Radeva
Author Index
480
490
500
510
521
XIII

This page intentionally left blank

Adoption of the Classical Theory of Definition toOntology Modeling
Patryk Burek
Onto-Med Research Group, University of Leipzig, [email protected]
Abstract. Ontology modeling requires modeling languages expressive enoughto represent various definition types. A definition type which seems to be ofparticular significance is that provided by the Classical Theory of Definition. Inthis paper we investigate if and how far the Classical Theory of Definition isadopted by some of the ontology modeling formalisms, namely by UML, ORMand DL. Moreover, we provide a means for representing some crucial issues inthe context of the Classical Theory of Definition which seem to have no repre-sentation in the formalisms discussed. Among them are the identification of es-sential, peculiar and incidental predications and the representation of subsump-tion in the manner of the genus-differentia definition.
Keywords: Knowledge Representation, Ontology Engineering, KnowledgeModeling.
1 Introduction
The backbone of ontology modeling is the construction of a taxonomy of conceptsfounded on subsumption links. It seems so far that there is no agreement on the natureof subsumption [2], [17] and on the rules of taxonomy evaluation [5]. Moreover, onecan observe that the definitional status of the concepts in most of the domains is notequal. There are various techniques used for defining concepts and there are tacitassumptions often lost during the ontology engineering/knowledge modeling process.The development of data models/ontologies not suffering from deformation of theinput knowledge is still a difficult task. Of some help here may be the theories of con-cepts, definitions and categorization developed across philosophy, linguistics andcognitive science. Here we concentrate on the oldest of these theories, namely on theClassical Theory of Definition. The Classical Theory of Definition seems especiallypromising for modeling taxonomies, since it provides an interesting genus-differentiapattern for representing subsumption and permits making more explicit some of thetacit assumptions underlying the concept definitions.
In this paper we examine how far the Classical Theory of Definition is adopted bysome of the languages proposed for ontology modeling. The formalisms investigatedinclude Unified Modeling Language (UML), Object Role Modeling (ORM) and De-scription Logic (DL). Arguments for adopting UML, which was developed for soft
C. Bussler and D. Fensel (Eds.): AIMSA 2004, LNAI 3192, pp. 1–10, 2004.© Springer-Verlag Berlin Heidelberg 2004

2 P. Burek
ware engineering, in ontology engineering are proposed in [4], [7]. It seems thatORM, which is, like UML, a commonly used software engineering technique, may beof some use in ontology engineering for the same reasons. DL has recently become aprime candidate for ontology modeling especially in the context of the Semantic Web.
The purpose of this work is not to provide a comparison or a ranking of the for-malisms discussed: our work concentrates only on the following issue: how far theClassical Approach is adopted in each of these formalisms and what consequences itmay have on ontology modeling.
For those aspects of the Classical Theory of Definition that are not reflected in theformalisms discussed we propose a framework of definitional tags. Our framework oftags is not intended as a new formalism for ontology modeling but rather as the gen-eral extension pattern of the formalisms discussed. Among the issues supported by theframework introduced are the identification of essential, peculiar and incidental predi-cations and the representation of subsumption in the manner of the genus-differentiadefinition.
In the case of UML, only class diagrams will be investigated and only classes willbe interpreted as ontological concepts. The notions of concept, UML class and ORMentity type are used here as equivalent.
We use the notions of concept extension and intension as they are generally ac-cepted in the literature. By concept extension we understand the set of all objects forwhich a concept can be truly predicated. By concept intension we understand a set ofits defining characteristics [15].
Section 2 discusses the basic tenets of the Classical Theory of Definition. In section3 the distinction between essential, peculiar and incidental components of definitionsis discussed. In section 4 the genus-differentia definition is analyzed, and in section 5conclusions are presented. The overall structure of sections 2, 3 and 4 is as follows:first the preliminaries are presented, secondly DL, UML and ORM are analyzed withrespect to the given issues and finally our proposal is introduced.
2 Basic Tenets of the Classical Theory of Definition
We consider here the Classical Theory of Definition in a broad sense dating back toancient Greek philosophy. The following two fragments encode the Classical Theoryof Definition: 1
Most concepts (esp. lexical concepts) are structured mental representations that en-code a set of necessary and sufficient conditions for their application. [8]
The Classical Theory of Definition has two principal tenets: that there are intensionaldefinitions for each of the class terms which we use; and that a ‘proper’ intensional
1 The first paragraph refers to the Classical Theory of Definition, concerned with the structureof definition, while the second refers to the Classical Theory of Concepts concerned with thestructure of concepts. For our purposes this distinction is not relevant so we treat both theo-ries as aspects of the same approach, called later the Classical Approach or the ClassicalTheory of Definition.

Adoption of the Classical Theory of Definition to Ontology Modeling 3
definition states in the definiens the logically necessary and sufficient condi-tions for the application of the definiendum. [15]
Both fragments have in common the optimistic assumption that concepts are defin-able by the necessary and sufficient conditions of concept application.
Furthermore, both fragments reveal the second tenet of the Classical Approachconcerning the definition’s structure: the definition is a compound of sufficient andnecessary conditions for the concept application. The definition consists of the de-finiendum, the definiens and the copula jointing them. The definiendum contains theconcept to be defined. Of interest for our purposes here are the definitions where thedefiniendum contains only the defined term – explicit definitions.
The definiens defines the definiendum and is understood here as the conjunction ofthe true predications about the definiendum, although other functional patterns of thedefiniens [10] may be investigated in the future. The definiens and the definiendumare linked by the copula being the equivalence functor, which indicates that the defini-ens provides both sufficient and necessary conditions.
2.1 Analysis: Basic Tenets in DL, UML, and ORM
Generally in knowledge modeling the first tenet of the Classical Approach is com-monly accepted - knowledge is definable and presentable in the form of intensionaldefinitions. The second tenet seems to be accepted too. We will see that the classicalstructure of the definition is adopted in UML, ORM and DL.
In DL concepts are defined in the Terminology Box (TBox) by explicit definitionsin the classical manner. The definitions can be equivalences with only the definedconcept in the definiendum [1].
In UML definitions have a graphical form. Each class is represented by a rectangledivided into compartments separated by horizontal lines (Fig.1) [12]. The top com-partment containing only a class name can be interpreted as the definiendum. Themiddle list compartment holds the list of attributes, the bottom one the list of opera-tions. Together with associations assigned to the class they provide the intensionspecification and can be interpreted as the definiens.
In UML classes are defined by necessary and sufficient conditions. The full list ofclass attributes, operations and associations delimits precisely the direct class exten-sion. Hence we see that UML meets also the second tenet of the Classical Approach.
In ORM concepts, called entity types, are also defined in a graphical form (Fig 2)[6]. Each entity type is presented as an oval with a name of the entity type in it. Theoval with the name can be interpreted as the definiendum. Entity types play roles infacts. Facts are depicted as rectangles divided into named boxes. Each box representsthe role of the entity linked with it by an arc. The list of all roles played by an objectprovides the necessary and sufficient conditions for instantiation of the entity.
We see then that all three formalisms permit the definitions of the classical struc-ture. UML and ORM moreover seem to restrict the definition types to only the classi-cal one, while DL allows also another, less restrictive, definition type in form of theinclusion axiom.

4 P. Burek
Fig. 1. An UML diagram with a discriminator
Fig. 2. An ORM diagram
3 Account of Essence
Originally, the classical definition not only provided necessary and sufficient condi-tions, but according to Aristotle it was the account of essence [9], [13]. An account ofessence is the answer to the question “what makes a thing what it is?”. The sentence “ahuman is an animal” tells something which is fundamental (essential) for human, buton the other hand saying that “human is civilized” is not fundamental for human butrather something that merely happens to be universally true for human and only forhim. The second predication, in contrast to the essential, is called peculiar. The predi-cation reflecting nonessential features that are not shared by all referents of the con-cept is called incidental [9], [13].

Adoption of the Classical Theory of Definition to Ontology Modeling 5
It is questionable whether one can reveal the essence of things, and whether such ademand is not the result of the excessively high ambitions of some philosophers. Thisquestion is, however, outside the scope of our interest here. The point here is to dis-tinguish statements that are true parts of definitions from those which only happen tobe true. Hence we understand an essence in a “lite” version, not as the true objectivenature of things, but as the intentions of a definition’s author. The essence of a conceptis what an author of the concept’s definition believes is fundamental for an object to beunderstood as a member of the concept’s extension.
3.1 Analysis: Account of Essence in DL, UML, and ORM
The distinction between essential, peculiar and incidental predications is partiallyadopted in systems performing classification, where the properties that are true partsof definitions are separated from those nonessential. The nonessential properties areshared by all members of the concept’s extension but are not considered as parts of theconcept’s definition. The classification algorithm requires that the position of a con-cept in a taxonomy does not depend on contingent facts, even those which are univer-sally true. In CLASSIC [3] nonessential properties are modeled not as parts of a con-cept’s definition but as rules that do not take part in the classification. Brachman sug-gests in [1] to model nonessential properties in DL not as parts of definitions in TBoxbut in ABox. Nonessential properties are treated then not as definitional knowledgebut as assertional knowledge.
Here one may raise the question of whether the assertion that “Socrates is a human”and the assertion that “a human is civilized” have the same relevance for the definitionof the human. It seems that the second statement although not essential for humansstill plays a definitional role while the first does not. The ABox does not provide anymeans to separate the assertions involved, even non-essentially, in definitions, fromthose not involved in definitions at all. The definitional relevance of nonessentialpredication seems to be of particular importance in cases where revealing the essenceof concepts is problematic. In many domains, including scientific and technical do-mains, definitions are not intended to provide an account of the essence. It seems thatauthors of those definitions do not intend to point at any fundamental features of con-cept referents. In such cases, if we strictly follow the above suggestion many conceptswould lack definitions in TBox completely and all knowledge stated about themwould be contained only in ABox, where nonessential but definitional knowledgewould be mixed with purely assertional knowledge.
We observe then that the explicit representation of the distinction between essen-tial, peculiar and incidental properties in DL runs into some problems. Neither inUML nor ORM do we find a means to represent it.
3.2 Proposal: Definitional Tags
The essential, peculiar and incidental properties can be introduced by the definitionaltags. The following tags can be introduced: [essential], [peculiar], and [incidental].These tags can be assigned to any predication present in the definiens, for example:

6 P. Burek
In both examples the extension of human is the same. The intentions seem to beequal as well, since both definitions use the same, animal and rational, predications.
What distinguishes these two definitions is the relevance of the predication ra-tional. In the first definition humans are essentially rational animals (humans are es-sentially animals and essentially rational). In the second example humans are essen-tially animals but the fact that that they are rational is not essential, although commonto all humans. It seems that although both definitions have the same extension andintension the assumptions and the intents behind them are different. The definitionaltags [essential], [peculiar], [incidental] permit us to grasp these differences.
4 Genus-Differentia Definition
A well-known representative of the Classical Approach is the genus-differentia defini-tion. It was introduced by Aristotle and later elaborated by medieval philosophers [9],[14]. It has a peculiar structure, where the definiens is composed of two elements: thegenus and the differentia. The genus subsumes the defined concept and its extensionshould be possibly the closest to the extension of the defined concept, thus the genusshould be the nearest (genus proximum). The differentia specifies the features distin-guishing the referents of the defined concept from the referents of other conceptssubsumed by the same genus. An example of the genus-differentia definition is theAristotelian definition of a human: “a human is a rational animal”. Here an animal isthe genus and rational is the differentia which distinguishes humans from beasts.
4.1 Analysis: Genus-Differentia Definition in DL, UML, and ORM
DL permits definitions of the form: However the ele-ments of the conjunction are not recognizable in any way as the genus and the differ-entia. Hence we see that DL does not permit us to explicitly identify the roles playedby the components of the genus-differentia definition.
In UML, a generalization with a discriminator can be interpreted as the genus-differentia definition. The generalization associates the class to its parent class. Theparent class can thus be interpreted as the nearest genus. The discriminator names thepartition of the parent class. The discriminator joins the generalization arc with othergeneralization arcs taking part in the same partition. In our example on the left-handside of Fig. 1, rationality is a discriminator.
The discriminator name must be unique among the attributes and association rolesof the parent class. Multiple occurrences of the same discriminator name are permittedand indicate that the children belong to the same partition. Hence one could say thatthe discriminator names the feature to which the differentia refers. However, it doesnot name the differentia itself nor does any other element of UML. All attributes,operations and associations of the child class distinguish it form the parent. However,they can not all be treated as the differentia, since some of them may be shared withother children in the same partition.

Adoption of the Classical Theory of Definition to Ontology Modeling 7
In ORM subtype entities are introduced by subtype links which are directed linesegments from subtypes to supertypes and by the definitions written under the dia-gram. The following two definitions specify the subtype entity human on Fig. 2: Eachhuman is an animal which is rational; Each human is an animal which is featherlessand has two legs. The first example in the context of the diagram presented in Fig. 2can be read: Each human is an animal who has rationality of level “rational”. “Ra-tional” is a value of a reference mode of the entity type rationality related to the su-pertype animal. It plays the role of the differentia in the definition of human. In thesecond example, the differentia is a conjunction of two conditions. The first one is aunary fact featherless related to the supertype animal, the second is the number re-striction on the has (legs) fact.
The above examples show that the definition pattern adopted in ORM allows everydiagram element to play the role of the differentia. However, in ORM the differentia isnot marked out in the diagram, and is present only in the additional definition belowthe diagram. Neither the value rational, the fact featherless nor the number restriction2 on the fact has (legs) are marked in any way on the diagram as the differentia. Theirapplication in the definition of an entity type human cannot be read from the diagram.Moreover, we can observe that the discriminator is not present in ORM at all.
4.2 Proposal
We propose to decompose the notion of differentia to the notions of relationally inter-preted differencing principle and difference. Then we introduce the definitional tagsfor representing subsumption by the pattern of the genus-differentia definitions.
4.2.1 Differencing PrincipleThe notion of the genus is present in all three formalisms discussed and is crucial forontology modeling. However, the notion of the differentia is not so popular. Twodifferent aspects seem to be of importance in the context of the differentia.
The first one is the discriminator present in UML. The discriminator can be inter-preted as the principle of the class partition. Hence we call the discriminator the dif-ferencing principle applied to the parent class. A close look to the differencing princi-ple shows that it could be understood as the attribute or the role of the parent class.This corresponds to the UML requirements for the uniqueness of the discriminatorname among the parent class attributes and roles.
Furthermore we can observe that the discriminator refers to some other element ofthe class model. In the right-hand side of Fig. 1 the discriminator number of legs refersto the multiplicity of the association ending. UML, however, does not in any waypoint to the model element that is used as the discriminator. The discriminator in UMLis independent from all other model elements.
Instead of treating the discriminator as independent from other model elements wesuggest interpreting it as a relational entity. We interpret the discriminator as the roleof some model element in the partition of the given parent class. We say that somemodel element is applied to the given class as a differencing principle. In this case the

8 P. Burek
multiplicity of the association end number of legs plays the role of the differencingprinciple applied to the class animal.
The differencing principle is the ground on which subclasses of the class to which itis applied are distinguished. In other words the differencing principle is a branchingpoint of an ontology or an ontological choice. By applying differencing principles tocategories, the hierarchical structure of the ontology is built.
The differencing principle can be interpreted as the attribute of the class it is ap-plied to or as a question grounding the partition of that class. Is rational? and howmany legs does it have? are both questions underlying the partition of the class ani-mal. The differencing principle presented in the form of the question may be particu-larly fruitful. A linguistic analysis of the question structure can provide the additionalproperties of differencing principles and can help in further analysis of subsumptionlinks based on them.
4.2.2 DifferenceThe second relevant aspect of the differentia, in addition to the differencing principle,is the differentia itself, which is the difference distinguishing the child class. It justifiesthe introduction of a child class in the context of a given partition. The differentiacannot be identified explicitly in UML or DL but only in ORM’s subtypes definitions.The differentia can be interpreted as the value of the differencing principle or theanswer to the question stated in the differencing principle. In the Aristotelian defini-tion of human being, rationality is the differencing principle and the value rational isthe differentia.
The differentia firstly distinguishes the child class from the parent class. Human isdistinct from animal since it is rational. Secondly, the differentia distinguishes a classfrom other children classes in the given partition (with the same underlying differenc-ing principle). This, however, only holds for the classification, while in the case of atypology the children concepts may overlap.
4.2.3 Genus-Differentia TagsWe propose to interpret the hierarchical structure based on the genus-differentia defi-nition as the application of a differencing principle to a parent class, where the differ-encing principle is the role of some element of the model or has the references ex-tending the model. We propose a genus-differentia subsumption pattern based not on abinary subsumption relation, graphically presented by the arrowed edge linking theparent class with the child class, eventually with a discriminator, but as a relation withthe following four arguments:1. Genus as the supertype;2. Species as the subtype;3. Differencing principle as the role of some other model element or as the external
reference;4. Differentia - the property of the species interpreted as the corresponding value of
the differencing principle or as the answer to the question stated by it.These four elements of the subsumption can be identified by the following three tags:[gen], [spec], [diff ref=””]. The tags [gen] and [spec] identify, respectively, the su-pertype and the subtype; the differentia is tagged with [diff ref=””] where ref=”” refers

Adoption of the Classical Theory of Definition to Ontology Modeling 9
to the element playing the role of the differencing principle. For example the defini-tion “A human is a rational animal” annotated with the tags would have the followingform:
where [spec]human and [gen]animal state, respectively, that human is a species andanimal is a genus. [diff ref=“rationality”]rational states that rational is the differentiawith the underlying differencing principle rationality which is present in the model orrefers to an external source.
5 Conclusions
In the current paper we analyzed how far the Classical Theory of Definition is adoptedby the selected ontology modeling languages. We analyzed UML, ORM and DL withrespect to the issues relevant for the Classical Theory of Definition. We have observedthat some of the tenets of the Classical Approach are accepted in all three formalismsdiscussed, for example the optimistic assumption of definability of knowledge by bothsufficient and necessary conditions. However, we have found that some of the issuesof the Classical Approach are not supported by any of the formalisms discussed, likethe distinction between essential, peculiar and incidental predications, and some aresupported only partially, like the genus-differentia definition. To enable the represen-tation of these issues we have proposed a framework of the definitional tags.
We believe that the Classical Approach adopted by the tags offers several advan-tages for modeling the taxonomical structures of concepts. Among them the following:1. Tags [essential], [peculiar], [incidental] identify the tacit intuitions of the author of
a definition; separate the essential knowledge from the nonessential; and permitconcepts to be distinguished even if their intension and extension are equal.
2. Tags [spec], [gen], [diff ref=””] bind a parent concept and a child concept with theprinciple of partition and make the subsumption more explicit:
[ref=””] identifies the differencing principle, which is a branching point of thetaxonomy and serves as the principle of partition. It seems particularly useful inthe case of multiple partitions of parent concept;[diff ref=””] labels the characteristics that distinguish the concept in the givenpartition and that makes the concept a member of that partition. In the case ofthe multiple subsumption it enables us to state the features by which a concept isassigned to each partition;[ref=””] reduces redundancy in the case of UML and ORM. Instead of adding anew independent model element, one already present in the model is identifiedas the differencing principle;[ref=””] permits the definitional dependencies in UML and ORM to be traced. Itenables one to identify which concepts are suitable as the foundations for thedefinitions of other concepts. In our second example, we observe that for defin-ing the concept human, the concept of rationality is needed;[ref=””] identifies the borderlines of the model. In some cases the differencingprinciple may refer to a concept that is not present in a model. By treating a dif-

10 P. Burek
ferencing principle as the relational entity, we can state explicitly that the modelrefers at this point to the external source.
The tags introduced are not intended as a new ontology modeling formalism butrather as a general modeling pattern that could be embodied as an extension to theformalisms discussed. The framework is not intended to be a normative theory oftaxonomy evaluation either as it is in the OntoClean approach [5]. Nevertheless, theimportant task which exceeds the scope of this paper, however, is to compare the tagspresented with the meta-properties of OntoClean.
Acknowledgments. I am indebted to Professor Heinrich Herre, FrankLoebe, Hannes Michalek for fruitful discussions and to Hesham Khalil, EvanMellander and the anonymous reviewers for feedback on earlier versions of this paper.
References
1.2.
3.
4.5.
6.
7.8.
9.10.
11.12.
13.
14.15.
16.
17.
Baader, F., et al. (eds.): Description Logic Handbook. Cambridge University Press (2002)Brachman, R.: What isa is and isn’t: an analysis of taxonomic links in semantic networks.IEEE Computer, 16(10) (1983)Brachman, R. et al.: Living with CLASSIC: When and how to use a KL-ONE-like lan-guage. In Sowa J (ed.): Principles of Semantic Networks. Morgan Kaufmann (1991)Cranefield S., Purvis M.: UML as an ontology modeling language. Proc. IJCAI-99 (1999)Guarino, N., Welty C.: Ontological Analysis of Taxonomic Relationships. In Leander, A.,Storey, V. (eds.): Proc. ER-2000. Springer-Verlag LNCS (2000)Halpin, T.: Object-Role Modeling. In Bernus, P., Mertins, K., Schmidt, G. (eds.): Hand-book on Architectures of Information Systems. Springer-Verlag, Berlin (1998)Kogut P., et al.: UML for Ontology Development. http://www.sandsoft.com/docs/ker4.pdfLaurence, S., Margolis. E. Concepts and Cognitive Science. In Laurence, S., Margolis. E.(eds.): Concepts Core Reading. MIT Press (1999)Kotarbi ski, PWN. Warszawa (1985)Rickert, H.: The Theory of Definition. In Seger J., C.: Essays on Definition. John Ben-jamins Publishing Company. Amsterdam / Philadelphia (2000)Robinson, R.: Definition. Oxford University Press (1963)Rumbaugh, J., Jacobsson, I., Booch, G.: The Unified Modeling Language ReferenceManual. Addison Wesley Longman Inc. (1999)Smith, R.: Aristotle’s Logic. In Edward N. Zalta (ed.): The Stanford Encyclopedia ofPhilosophy. URL =http://plato.stanford.edu/archives/fall2003/entries/aristotle-logic. (2003)Sowa J.: Knowledge Representation. Brooks/Cole (2000)Swartz, N.: Definitions, Dictionaries, and Meaning.URL=http://www.siu.ca/philosophy/swartz/definitions.htm#part2.1 (1997)Temmerman, R.: Towards New Ways of Terminology Description. John Benjamins Pub-lishing Company. Amsterdam / Philadelphia (2000)Woods, W.: Understanding subsumption and taxonomy: A framework for progress. inSowa, J.F. (ed.) Principles of Semantic Networks. Morgan Kaufmann, San Mateo, CA(1991)

An Approach to Evaluate Existing Ontologies forIndexing a Document Corpus
Nathalie Hernandez1,2 and Josiane Mothe1,2
1 IRIT, 118 route de Narbonne,31040 Toulouse, France
{hernandez, mothe}@irit.fr2 IUFM, 56 av. de l’URSS,
31078 Toulouse cedex, France
Abstract. Using ontologies for IR is one of the key issues for indexing. It is notalways easy to decide which ontology to use for the corpus to index. Wepropose to define measures reflecting the adequacy of an ontology to a corpus.The goal of these measures is to evaluate if an ontology suits a corpus, but alsoto compare the adequacy of two or more ontologies to the same corpus. Themeasures are based on a lexical and a conceptual analysis of the corpus and theontology. We have carried out a first validation of these measures on a corpusand samples of the ontologies. The results are encouraging.
Keywords: ontology, information retrieval, indexing, adequacy
1 Introduction
As defined in [12], “the semantic web is an extension of the current Web in whichinformation is given well-defined meaning... It is based on the idea of having data onthe web defined and linked such that it can be used for more effective discovery,automation, integration, and reuse across various applications”. In order to be able toadd semantics to the current web, ontologies are used as a mechanism for representingsuch formal and shared domain descriptions. Many newly developed techniquesrequire and enable the specification of ontologies [25]. Thanks to the growing interestin ontologies in the field of information systems, freely accessible ontologies areemerging. Nowadays a key issue in Information Retrieval (IR) is to develop searchengines capable of taking into account the knowledge represented by these ontologies.Indexing documents using ontologies makes it possible to define descriptorsrepresented by concepts instead of keywords which are often ambiguous [7]. It alsogives a structure to the information [1]. The first step in such processes is to findwhich domain ontology will contain the right knowledge to improve the indexing of adocument corpus. One solution is to create an ontology from the corpus that isindexed either manually or through techniques based on natural language processing.This solution is costly and does not take into consideration the existence of resourcesthat could be reused. The aim of the study presented in this article is thus to definemeasures capable of identifying if an existing ontology is appropriate to index a
C. Bussler and D. Fensel (Eds.): AIMSA 2004, LNAI 3192, pp. 11–21, 2004.© Springer-Verlag Berlin Heidelberg 2004

12 N. Hernandez and J. Mothe
document corpus and also in the case when several ontologies exist which one is themost suited. The application field is astronomy. In this field, two freely accessibleontologies exist [8] [14]. Both contain more than a thousand concepts. Building a newontology from an astronomy corpus is a challenging task as in this domain a hugenumber of notions or concepts can be found.
This paper is organized as follows. We will first present a state of the art onontologies and IR. We will then propose measures which aim to evaluate theadequacy of an ontology to a document corpus. Finally, we will present a firstvalidation of these measures taking examples from a document corpus linked to thefield of astronomy and ontologies freely accessible in this field.
2 Ontology and IR
2.1 Definitions
The term “ ontology ” has been borrowed from the field of philosophy in which itmeans “the essence of the essential”. In the field of knowledge management, itsmeaning is different. Gruber [11] introduces the concept of ontology as “an explicitspecification of a conceptualisation”. This definition has been modified slightly byBorst [4] and the combination of their two definitions is commonly summarized as“an explicit and formal specification of a shared conceptualisation”. An ontologyprovides a sound base for communication between machines and also betweenhumans and machines by defining the meaning of objects first through the symbols(words and phrases) that represent and characterize them and secondly through thestructured or formal representation of their role in the domain. Different semioticlevels must be taken into consideration in an ontology [18]. The lexical level coversall the terms used to transcribe the meaning of concepts. The conceptual levelrepresents the concepts and the conceptual relationships between them. Numeroustypes of knowledge structures lie behind the word ontology (taxonomy, thesaurus ...).These data structures may be both terminological (containing a set of terms), andconceptual (defining concepts). However, these structures may differ in their content(general knowledge: WordNet, Cycl; knowledge of a specific domain: MeSH...), inthe type of semantic relations between the concepts (taxonomical, meronymical ...)and in the level of formalisation (logical representation, representation in a SemanticWeb language such as DAML+OIL, OWL ...).
2.2 Use of Ontologies in IR
More and more research is being devoted to the formulation of queries and theindexation of documents using ontologies. Such a semantic approach in IR systemsseems particularly promising for improving their performance [19]. An ontology

An Approach to Evaluate Existing Ontologies for Indexing a Document Corpus 13
should thus lead to a refining of a system based on a traditional indexing process byincreasing the likelihood of a query being formulated with terms or descriptors whichbest represent the information needed. The query can be expanded, and recall1 [24]increased, thanks to the relations between the concepts present in the query and thosepresent in the ontology. In OntoBroker and [2] [9] for example, web pages aremanually annotated according to the concepts of the ontology. For any given query,all the concepts related to the concept found in the query are inferred and added to thequery. In the same way, the terms used in the query will be disambiguized whenreferred to the definitions and the relations between the concepts present in theontology, thus improving precision2[24].
An ontology can also be used to index documents. In this case, the descriptors ofthe documents are no longer taken directly from the documents but from the ontologyitself. The texts are therefore indexed by concepts which reflect their meaning ratherthan by words which are frequently ambiguous. It is necessary in this case to use anontology which reflects the domain(s) of knowledge treated in the documentcollection.
Moreover, indexing collections using an ontology presents the followingadvantages: [1].
It helps the user formulate the query. By presenting the user with the ontology, it ispossible to guide him/her in his/her choice of terms used in the query. Severalinterfaces for the visualisation and exploration of ontologies have been proposed, forexample KAON [5], Graphlet [13].
It facilitates IR in heterogeneous collections by indexing all types of documentsaccording to the same concepts.
In the IR context, an ontology is not usually represented logically. The formalismused generally facilitates the management of concepts as objects, their classification,the comparison of their properties and navigation within the ontology by accessing aconcept and those related with it.
3 Ontology Adequacy to a Corpus
This study concerns the use of an ontology to index and explore a corpus linked to aspecific domain. Rather than aim at generating a new ontology to cover a particulardomain, we have focused on evaluating the link between the information and anexisting ontology or ontologies. Measuring adequacy will enable us to evaluate therelevance of the choice of the starting ontology and then its shortcomings and the
1
2
recall refers to the proportion of correctly retrieved documents among the pertinentdocuments in the collectionprecision refers the proportion of correctly retrieved documents among the documentsretrieved by the system

14 N. Hernandez and J. Mothe
modifications needed when it is updated in function of the corpus to be treated. It willalso make it possible to evaluate over a period of time the evolution of the terms andconcepts of a domain in function of the updating required. We propose to evaluate theadequacy between an ontology and a corpus independently of information retrievalresults. The model and the mechanism chosen for retrieval influence the performanceof the system. We want the measures to be system independent. We consider that anontology is appropriate for a corpus if the knowledge stated in the ontology reflectsthe knowledge stated in the corpus. Therefore the evaluation of the adequacy is basedon different levels of analysis used in the domain of Knowledge Management (section3.1)and on similarity measures defined in the domain on Information Theory (section3.2). The ontologies considered in this study are composed of concepts (defined byone or eventually several terms or labels) and by taxonomical and non-taxonomicalrelations between concepts whose nature is specified (transitive, symmetric...). Theyare written in OWL-Lite.
3.1 Levels of Analysis
Two levels of analysis must be defined [18]: lexical analysis and conceptual analysis.Our approach therefore studies these two levels.
3.1.1 Lexical AnalysisLexical analysis consists in comparing the list of terms in the ontology and the list ofterms in the collection. This analysis is based on two steps.
The percentage of terms in the ontology also present in the corpus is calculated soas to evaluate the extent to which the ontology covers the corpus. If the number ofterms of an ontology found in the collection is limited, the ontology is not consideredadapted to the collection.
The terms which are representative of a collection are extracted using the measuretf.idf [24] which is frequently used in IR and which also indicates that a term is all themore representative if it occurs frequently in the text but is not frequent in thecollection of texts. The percentage of these terms found in the collection is calculated.It is therefore possible to evaluate whether the important terms of the collection canbe found in the ontology. An ontology formed from a list of terms covering that of thecollection but not containing the representative terms must be updated. The terms canbe added to the ontology by becoming labels of existing concepts or by defining newconcepts.
3.1.2 Conceptual AnalysisThis level of analysis determines whether the organisation of concepts within theontology reflects the knowledge present in the document collection. This analysis isbased on the following principle: “a concept is representative of a domain if it is

An Approach to Evaluate Existing Ontologies for Indexing a Document Corpus 15
related to other concepts of the domain”[7]. All the concepts of the ontology presentin the corpus are extracted in order to calculate their representative power. One way tocalculate this power would be to consider the number of relations involving theconcept in the ontology regardless of the type of relation; this would give a basicevaluation of the principle. However, the relations present in an ontology are in factof several types (taxonomical, meronymical, causal, functional, or with no logicalproperty). Not taking the type into consideration would mean ignoring part of thesemantic content of the ontology. We thus propose a solution based on semanticsimilarity between concepts taking into acount the type of relation. It is presented inthe next section.
3.2 Measures of Adequacy
We propose to evaluate the representative power of a concept within an ontologyaccording to a given corpus thanks to semantic similarity measures defined in thefield of information theories.
3.2.1 Similarity Between Concepts Within an OntologyThe evaluation of the semantic link between two concepts based on networkrepresentations has long been a problem in the fields of artificial intelligence andpsychology. Semantic similarity is an evaluation of the semantic link which aims atestimating the degree to which two concepts are close in meaning [22]. Lin’sdefinition of semantic similarity draws on three suppositions [16]. The similarity oftwo concepts is linked to the characteristics the concepts have in common (the morethere are, the more similar they will be), and to their differences (the more twoconcepts are different, the less similar they will be). Maximum similarity is obtainedwhen two concepts are identical.
There exists several measures of similarity between concepts linked by therelation “is a” The relation “is a” is a transitive, asymmetrical relation. The measurespresented in [21] and [28] are calculated from the depth of each concept in theontology. The measure proposed in [28] is more pertinent than the former as it takesinto account the structure of the hierarchy by considering the depth of the subsuming(or generalising) concept of the two concepts in question. However, it accepts that thesemantic distance between two concepts linked by the relation “is a” is equal whereasthis is not necessarily the case. For example, astronomy is a science, as is cosmology,but astronomy is a more general science than cosmology. The semantic power of therelation “is a” is due to the choices made during the construction of the taxonomy.The drawbacks of the measures described above can be overcome by differentmeasures which take into account the information content of the concepts. Thesemeasures are based on the following principle : the concepts are weighted by thefunction IC(c) = -log (p(c)) corresponding to the information content of a concept.The probability of a concept c is calculated on the probability of obtaining thisconcept (and the concepts which subsume it) in a document collection in the domain.

16 N. Hernandez and J. Mothe
where word(c) represents all the terms representing the concept c and the conceptssubsumed by c, count(n) the number of occurrences of n in the corpus, and N the totalnumber of concepts found in the corpus.
Several similarity measures [22] [15] [16] have been defined considering that
where S(c1,c2) is the set of concepts which subsume c1 and c2.
The probability of obtaining a concept takes into account the probability ofobtaining this concept and all the concepts subsuming it, pms leads totaking the probability of the most specific subsumer of c1 and c2. The measure wehave adopted (1) is that of [16]. This measure takes into account the informationcontent of the most specific concept subsuming c1 and c2 but also that of c1 and c2,which differentiates the similarity between several pairs of concepts with the samesubsumer. This measure takes the values in [0,1] (0 corresponding to the conceptswhich are not similar and 1 to those which are identical). This measure has beenrecognized as giving good results in numerous works on calculating similaritybetween concepts [16] [6] [17].
Our aim in considering information content is to use the probability of obtaining aconcept in a document corpus to counteract subjectivity in the choice of relations inthe ontology. It is appropriate to use this measure in the context of evaluating acorrelation between an ontology and a corpus as the evaluation is based on both theterms of the corpus and the organisation of the concepts in the ontology. Since thetwo ontologies of the astronomy domain were developed manually and thereforesubjectively, the semantic distance represented by the relations must be measured.The measure (1) is also used to evaluate the similarity of concepts related by othertransitive relations.
Ontologies generally use semantic relations other than the relation “is a”. Theontologies of astronomy also includes the relation “part of” and “is related to”.Mereology, which studies the relations “part of” and “whole of” plays an importantrole in ontologies. Studies generally recognized that these relations were transitive.However, Winston et al [26] have shown that this is not always the case as theserelations do not represent a type of relation but a family of relations: component-object (pedal-bicycle), member-collection (tree-forest), portion-mass (slice-cake)matter-object (steel-bicycle), characteristic-object (pay-go shopping), place-region(oasis-desert). The ontologies used treat different aspects of the domain of astronomywhich can call on different elements of the family of mereological relations (forexample sun-solar system or core-earth). In this study, the relation “part of” is thusconsidered as non-transitive. The same is true for the relation “is related to”. It is in

An Approach to Evaluate Existing Ontologies for Indexing a Document Corpus 17
fact intuitive to consider that three concepts linked by two relations “is related to” arenot systematically related to each other. However unlike the relation “part of”, therelation “is related to” is symmetric which means that the relation can be consideredin both ways (if c1 is related to c2 by this relation, c2 is also related to c1).
The similarity measure (1) is then also used to evaluate the similarity betweenconcepts related by non-transitive relations in so far as the path relating these twoconcepts contains other concepts related by this type of relation only once. In theopposite case, similarity is equal to 0. The possibility of having a symmetric relationis also taken into account by considering the relation both ways.
3.2.2 Representative Power of a Concept and Representative Power of anOntology
The representative power of a concept in an ontology is then calculated as follows:
c being the set of concepts of the ontology found in the documents.
Very often, an ontology contains at least several hundred concepts, in which caseit seems impossible to analyse each of the concepts individually. We proposetherefore to define the representative power of the ontology O (result of theconceptual analysis) which is calculated by:
c being the set of concepts of the ontology found in the documents.
4 Validation
A validation of the measures presented in the previous section has been carried out onan astronomy corpus and the two existing ontologies. In order to validate our result byastronomers, we have limited the domain considered to the field of “X RAY”. Acorpus containing 134 abstracts of articles related to this theme (published in thejournal A&A in 1995) and a sample of the two ontologies [14] [8] have beenconsidered. In figure 1, the samples of the ontologies (called A and B) are presented.The concepts are represented by the name of the concept and if necessary other labelsdescribing the concept. All the concepts are subconcepts of a concept top_astronomy(not represented in the figure). The concepts with a dark border are the ones found inthe corpus.

18 N. Hernandez and J. Mothe
Fig. 1. Ontology A and Ontology B of X ray
To illustrate the measures presented in 3.2, here is how the representative powerof the concept wave in ontology B is calculated.
as the concept wave appears 17 times in the corpus, its uniquesubsumer X ray 206 times and the total number of termsdescribing concepts form ontology B found in the corpus is 342
Power(wave)=sim(wave,x ray) +sim(wave,x ray source) + sim(wave,x ray scattering)+ sim(wave, x ray background) + sim(wave, background radiation) +sim(wave,radiation) + sim(wave,photon) + sim(wave,particle) =0,914+0,29+0,136+0,198+0,075+0,002+0,0022=1,6172
The concepts X ray pulsar and pulsar are also found in the corpus, but theirsimilarity to wave is not calculated as more than one non-transitive relation linkswave to this concept.
as wave is the most specific sub-
sumer of wave and x ray
as top is the most specific sub-
sumer of wave and particle. The probability of the top_astronomy concept iscalculated by dividing the number of terms describing concepts found in the corpusminus 1 by the number of terms describing concepts found in the corpus. This enablesits IC to be very low but the similarity can still be calculated.
The value of the concept wave power is for the most part due to its similarity to itssubsumer x ray but the similarity to other concepts still influences the value. Thevalues of the similarity to concepts related to wave through a non transitive relation

An Approach to Evaluate Existing Ontologies for Indexing a Document Corpus 19
(e.g. background relation) are higher than the values of similarity to concepts whosesubsumer is top_astronomy concept (e.g. Particle). This is coherent as a concept ismore similar to one that is related to it than to a concept of the domain not directlylinked to it. This also shows that is it beneficial to take into consideration the otherrelations than ‘is a’.
We have considered several power measure results to evaluate if this measure waslikely to reflect the adequacy of a concept to a corpus and to compare concepts foundin the two ontologies.
First, we considered the concept celestial body in ontology A. The power value ofthis concept in ontology A is 0,8. This value is lower than the average value obtainedfor the other concepts in this ontology. This is explained by the fact that this conceptis only related to one concept found in the corpus. The term celestial body obtains ahigh score with the tf.idf measure. According to astronomers this concept isrepresentative of the corpus. Its presence in the ontology is then justified but the valueof the power indicates that its representation in the ontology is probably notappropriate (not correctly classified in the ontology). We are evaluating the powermeasure on other corpus and we aim to fix a threshold that will be able to tell if therepresentation of a concept is likely to be appropriate or not for a corpus.
Secondly, we considered the concept wave in ontology A The value of the powerof this concept in ontology A is 1,7. This value is higher than the one obtained for thisconcept in ontology B (1,6). This is linked to the fact that in ontology A, the conceptwave shares its super class X-ray with two concepts (hard x ray and soft x ray)considered by astronomers to be representative of the corpus that are not in ontologyB. However, the power of wave in ontology A remains at the same scale as inontology B, as it is linked to two representative concepts (x ray scattering and x raybackground) not present in ontology A. Thus we can see that the measure of therepresentative power gives more importance to similarity with concepts that arerelated by the ‘is a’ relation than to concepts related by non transitive relations. Thisseems fair.
5 Conclusion
The use of ontologies is one of the key issues in IR. Deciding which ontology is mostappropriate for indexing a corpus, however, is not evident. A solution followed in[27] among others, is to acquire automatically a domain ontology from the corpus. Inthe application field of our study (astronomy) two domain ontologies exist. Oursolution is thus to reuse these existing resources which is also one of the aims of thesemantic web. We have chosen to define measures reflecting the adequacy of anontology to a corpus. The goal of these measures is to evaluate if an ontology suits acorpus, but also to compare the adequacy of two or more ontologies to the samecorpus. The measures are based on a lexical and a conceptual analysis of the corpusand the ontology. Measures concerning ontologies have been defined in the literature.

20 N. Hernandez and J. Mothe
Contrary to [18] that proposes to evaluate similarity between existing ontologies, ouraim is to find the most suited to the corpus. [7] and [23] propose to evaluate adequacybetween ontology and corpus but the ontologies considered were taxonomies. Themeasures presented in this article are defined for all transitive, non transitive andsymmetric relations. We have carried out a first validation of these measures on acorpus and samples of the ontologies. The results are encouraging. An interface thatenables a user to evaluate the results of the measures on two ontologies in OWLaccording to the same corpus is being developed. The concepts are presented infunction of the results of the measures.
Future works will consist in carrying out other evaluations with astronomers asthis study is part of a project on large scale data in astronomy. We also plan to takeinto consideration in the measures the data properties (according to OWLspecifications), this will make the evaluation more accurate. A future step will also beto propose an ontology updating mechanism according to the measure results.
References
[1]
[2]
[3]
[4]
[5]
[6]
[7]
[8][9]
[10]
[11]
[12]
[13]
Aussenac-Gilles N., Mothe J., Ontologies as Background Knowledge to ExploreDocument Collections, RIAO, pp 129-142 2004.Benjamins R., Fensel D., Decker D., Gomez Perez A., (KA)2 : building ontologies for theinternet: a mid-term report, International Workshop on ontological engineering on theglobal information infrastructure, pp 1-24, 1999.Bourigault D., Fabre C., “ Approche linguistique pour 1’analyse syntaxique de corpus ”,Cahiers de Grammaires, n° 25, 2000, Université Toulouse - Le Mirail, p. 131-151Borst P., Construction of Engineering Ontologies for Knowledge Sharing and Reuse,Ph.D Dissertation, Twente University, 1997.Bozsak E., Ehrig M., Handschuh S., Hotho A., Maedche A., Motik B., Oberle D., SchmitzC., Staab S., Stojanovic L., Stojanovic N., Studer R., Stumme G., Sure Y., Tane J., VolzR., Zacharias V., KAON - Towards a Large Scale Semantic Web, EC-Web 2002, pp 304-313, 2002.Budanitsky A., Hirst G., Semantic distance in WordNet: An experimental, application-oriented evaluation of five measures, Workshop on WordNet and Other LexicalResources, ACL, 2001.Desmontils E., Jaquin C., Indexing a web site with a terminology oriented ontology, TheEmerging Semantic Web, I.F. Cruz S. Decker J. Euzenat and D. L. McGuinness Ed., IOSPress, pp 181-197, 2002 (ISBN 1-58603-255-0).http://www.site.uottawa.ca:4321/astronomy/index.htmlFensel D., Ontologies: a silver bullet for Knowledge Management and ElectronicCommerce, Berlin, Springer Verlag, 2001.Guarino N., Masolo C., Vetere G., OntoSeek: Content-Based Access to the Web, IEEEIntelligent Systems, 14 (3), pp 70-80, 1999.Gruber R. T., A Translation Approach to Portable Ontology Specification, KnowledgeAcquisition (5), pp 199-220, 1993.Hendler, J., Berners-Lee,T., Miller E.: Integrating Applications on the semantic Web.http://www.w3.org/2002/07/swint (2002)Himsolt M., The graphlet system, Graph Drawing, volume 1190 of Lecture Notes inComputer Science, Springer- Verlag, pp 233-240, 1996.

An Approach to Evaluate Existing Ontologies for Indexing a Document Corpus 21
[14][15]
[16]
[17]
[18]
[19]
[21]
[22]
[23]
[24][25]
[26]
[27]
[28]
http://msowww.anu.edu.au/library/thesaurus/Jiand J.J., Conrath D.W, Semantic similarity based on corpus statistics and lexicalterminology, ICCL, 1998.Lin D., An information-theoretic definition of similarity, international conference onMachine Learning, pp 296-304, 1998.Lord P.W., Stevens R.D., Brass A., Goble C.A, Semantic similarity measures as tools forexploring the Gene Ontology, Pacific Symposium on Biocomputing, pp 601-612, 2003.Maedche A., Staab S., Measuring similarity between ontologies, EKAW, pp 251-263,2002Masolo C., Ontology driven Information retrieval: Stato dell’arte, Rapport de IKF(Information and Knowledge Fusion) Eureka Project E!2235. LADSEB-Cnr, Padova (I),2001.Rada R., Mili H., Bickel E., Developement and application of a metric on semantic nets,IEEE transaction on systems, 19(1), pp 17-30, 1989.Resnik P., Semantic similarity in a taxonomy : an information based measure and itsapplication to problems of ambiguity in natural langage, Journal of Artificial IntelligenceResearch, pp 95-130, 1999.Rothenburger B., A Differential Approach for Knowledge Management, ECAI, Workshopon Machine Learning and Natural Language Processing for Ontology Engineering, 2002Salton G., The Smart retrieval system, Prentice Hall, Englewood Cliffs, NJ, 1971S. Staab, R.Studer (eds.): Handbook on Ontologies, Springer Series on Handbooks inInformation Systems, ISBN 3540408347, (2004)Winston M., Chaffin R., Herramann D., A taxonomy of Part-Whole relations, CognitiveScience, 11:417-444, 1987.Wu SH, Tsai TH, Hsu WL, Domain Event Extraction and Representation with DomainOntology, in proceedings of the IJCAI-03 Workshop on Information Integration on theWeb, Acapulco, Mexico, pp. 33-38, 2003.Wu Z., Palmer M., Verb semantics and lexical selection, 32nd annual meeting of theAssociation for Computational Linguistics, 1994.

Capturing Semantics Towards Automatic Coordinationof Domain Ontologies
Konstantinos Kotis, George A. Vouros, and Kostas Stergiou
Dept. of Information & Communications Systems Engineering,University of the Aegean,
Karlovassi, Samos,83100, Greece
{kkot,georgev,konsterg}@aegean.gr
Abstract. Existing efforts on ontology mapping, alignment and merging varyfrom methodological and theoretical frameworks, to methods and tools thatsupport the semi-automatic coordination of ontologies. However, only latest re-search efforts “touch” on the mapping /merging of ontologies using the wholebreadth of available knowledge. Addressing this issue, the work presented inthis paper is based on the HCONE-merge approach that makes use of the in-tended informal interpretations of concepts by mapping them to WordNetsenses using lexical semantic indexing (LSI). Our aim is to explore the level ofhuman involvement required for mapping concepts of the source ontologies totheir intended interpretations. We propose a series of methods for ontologymapping/merging with varying degrees of human involvement and evaluatethem experimentally. We conclude that, although an effective fully automatedprocess is not attainable, we can reach a point where the process of ontologymapping/merging can be carried out efficiently with minimum human involve-ment.
Keywords: Ontology mapping, Ontology merging, Latent Semantic Indexing
1 Introduction
Ontologies have been realized as the key technology to shaping and exploiting infor-mation for the effective management of knowledge and for the evolution of the Se-mantic Web and its applications. In such a distributed setting, ontologies establish acommon vocabulary for community members to interlink, combine, and communicateknowledge shaped through practice and interaction, binding the knowledge processesof creating, importing, capturing, retrieving, and using knowledge. However, it seemsthat there will always be more than one ontology even for the same domain [1]. Insuch a setting where different conceptualizations of the same domain exist, informa-tion services must effectively answer queries bridging the gaps between their formalontologies and users’ own conceptualizations. Towards this target, networks of se-mantically related information must be created at-request. Therefore, coordination (i.e.mapping, alignment, merging) of ontologies is a major challenge for bridging the gapsbetween agents (software and human) with different conceptualizations.
C. Bussler and D. Fensel (Eds.): AIMSA 2004, LNAI 3192, pp. 22–32, 2004.© Springer-Verlag Berlin Heidelberg 2004

Capturing Semantics Towards Automatic Coordination of Domain Ontologies 23
There are many works towards coordinating ontologies. These works exploit lin-guistic, structural, domain knowledge and matching heuristics (e.g [3], [4]). Recentapproaches aim to exploit all these types of knowledge and further capture the in-tended meanings of terms by means of heuristic rules [5]. The HCONE (Human Cen-tered ONtology Eng.)-merge [6] approach to merging ontologies exploits all theabove-mentioned types of knowledge. In a greater extent than existing approaches tocoordinating ontologies, this approach gives much emphasis on “uncovering” theintended informal interpretations of concepts specified in an ontology. Linguistic andstructural knowledge about ontologies are exploited by the Latent Semantics Indexingmethod (LSI) [7] for associating concepts to their informal, human-oriented intendedinterpretations realized by WordNet senses. Using concepts’ intended interpretations,the proposed merging method translates formal concept definitions to a common vo-cabulary and exploits the translated definitions by means of description logics’ rea-soning services.
The HCONE-merge approach requires humans to validate the intended interpreta-tions suggested by LSI for every term in the ontology. Since this process is quite frus-trating and error-prone even for small ontologies, we need to investigate the requiredhuman involvement for mapping concepts to their intended interpretations efficiently.The ultimate achievement would be to fully automate this mapping, and also to fullyautomate the merging of ontologies. Towards this goal, the paper investigates a seriesof novel techniques and heuristics for ontology mapping and merging, with varyinghuman involvement. The paper concludes that a fully automated ontology map-ping/merging process is far from realistic, since there must always be a minimum setof human decisions present, at least when the LSI method is employed.
2 HCONE-Merge Approach to Ontology MergingAccording to [5], an ontology is considered to be a pair O=(S, A), where S is the on-tological signature describing the vocabulary (i.e. the terms that lexicalize conceptsand relations between concepts) and A is a set of ontological axioms, restricting theintended interpretations of the terms included in the signature. In other words, A in-cludes the formal definitions of concepts and relations that are lexicalized by naturallanguage terms in S. This is a slight variation of the definition given in [5], where S isalso equipped with a partial order based on the inclusion relation between concepts. Inour definition, conforming to description logics’ terminological axioms, inclusionrelations are ontological axioms included in A. It must be noticed that in this paper weonly deal with inclusion and equivalence relations among concepts.
Ontology mapping from ontology to is considered to bea morphism of ontological signatures such that i.e. all interpreta-tions that satisfy axioms also satisfy translated axioms. Consider for instancethe ontologies depicted in Figure 1. Given the morphism f such thatf(Infrastructure)=Facility and f(Transportation)=Transportation System, it is true that
therefore f is a mapping. Given the mor-phism f’, such that f’(Infrastructure)=Transportation System and f’(Transportation=Transportation Means, it is not true that ,therefore f’ is not a mapping.

24 K. Kotis, G.A. Vouros, and K. Stergiou
However, instead of a function, we may articulate a set of binary relations betweenthe ontological signatures. Such relations can be the inclusion and the equivalence
relations. For instance, given the ontologies in Figure 1, we can say thatSystem, and
Then we have indicated an alignment of the two ontologies and we can merge them.Based on the alignment, the merged ontology will be ontology in Figure 1. It holdsthat and
Fig. 1. Example Ontologies
Looking at Figure 1 in an other way, we can consider to be part of a larger in-termediary ontology and define the alignment of ontologies and by means ofmorphisms and Then, the merging of the two ontologies is theminimal union of ontological vocabularies and axioms with respect to the intermediateontology where ontologies have been mapped. Therefore, the ontologies mergingproblem (OMP) can be stated as follows: Given two ontologies find an alignmentbetween these two ontologies, and then, get the minimal union of their (translated)vocabularies and axioms with respect to their alignment.
The HCONE-merge approach, as already pointed, maps concepts to word senses inWordNet. Each sense in a WordNet synset describes a concept. WordNet senses arerelated among themselves via the inclusion (hyponym – hyperonym) relation. Termsthat lexicalize the same concept (sense) are considered to be equivalent through thesynonym relation.Note that we do not consider WordNet to include any intermediateontology, as this would be very restrictive for the specification of the original ontolo-gies (i.e. the method would work only for those ontologies that preserve the inclusionrelations among WordNet senses).
We now briefly describe the HCONE-merge method. A detailed description can befound in [6]. The method constructs an intermediate ontology including a vocabularywith the lexicalizations of the specific senses of WordNet synsets corresponding to theontologies’ concepts, and axioms that are the translated axioms of the original ontolo-gies. We call this ontology hidden intermediate. Initially, the method finds a semanticmorphism between the original ontologies and a hidden intermediate ontology. To dothis, we use the semantic morphism (s-morphism, symbolized by fs), which is based onthe lexical semantic indexing (LSI) method. LSI [7] is a vector space technique forinformation retrieval and indexing. It assumes that there is an underlying latent se-mantic structure that it estimates using statistical techniques. Lexical Semantic Analy-sis (LSA) allows the arrangement of the semantic space to reflect the major associa-tive patterns in the data. As a result, terms that did not actually appear in a sense maystill end up close to the sense, if this is consistent with the major patterns of associa-tion in the data [7]. Therefore, it must be emphasized that although LSI exploitsstructural information of ontologies and WordNet, it ends up with semantic associa-

Capturing Semantics Towards Automatic Coordination of Domain Ontologies 25
tions between terms. Given a query (a concept description), retrieval aims to locate apoint in space that is close to the WordNet sense that expresses the intended meaningof this concept.
The semantic space is constructed by terms in the vicinity of the senses S1,S2...Sm that are the senses of a WordNet lexical entry C’, where C’ is a linguisticvariation of a concept C [6]. Therefore, we have to decide what constitutes the vicinityof a sense for the calculation of the semantic space. The query to the retrieval mecha-nism is constructed by the concept names of all concepts in the vicinity of the givenconcept. In an analogous way we have to decide what constitutes the vicinity of anontology concept for the calculation of the query string. The goal is to provide LSIwith the necessary information without distracting it with “noise”. Experiments usingvarious ontologies have shown that we can achieve 70% precision in mapping con-cepts to WordNet senses, if the vicinity of the senses that are in the focus of the algo-rithm includes the following information:
S1. The term C’ that corresponds to C. C’ is a lexical entry in WordNetS2. Terms that appear in C’ WordNet sensesS3. Terms that constitute hyperonyms / hyponyms of each C’ sense.
The vicinity of the ontology concept should include the following:Q1. Concept’s C primitive super-conceptsQ2. Concepts that are immediate sub-concepts of C (subsumed by C)Q3. Concepts that are related to C via domain specific relations
Using this method, each ontology concept is associated with a set of graded WordNetsenses. For instance, the concept “facility” is associated with the five senses thatWordNet assigns to the term “facility”, whose meaning range from “something createdto provide a service” to “a room equipped with washing and toilet facilities”. Thehighest graded sense expresses the most possible informal meaning of the corre-sponding concept. This sense can be further validated by a human. In case the humanindicates another sense to be the most preferable, then this sense is considered to cap-ture the informal intended meaning of the formal ontology concept. Otherwise, themethod considers the highest graded sense as the concept’s intended interpretation.
Using the intended meanings of the formal concepts, we construct an ontologyn=1,2, where, includes the lexicalizations of the senses associated to
the concepts1 of the ontology n=1,2, and contain the translated inclu-sion and equivalence relations between the corresponding concepts. Then, it holds that
and the ontology with the corresponding associations fromto is a model of n=1,2.... These associations define a mapping from
toHaving found the mappings with the hidden intermediate ontology, the translated
ontologies can be merged, taking into account the axioms and (which are thetranslated axioms of and The merging decisions are summarized in Table 1.We must emphasize that, as shown in Table 1, the semantic information concerningontology concepts is exploited by the description logics reasoner during merging.
1 Future work concerns mapping domain relations to WordNet senses as well.

26 K. Kotis, G.A. Vouros, and K. Stergiou
The HCONE-merge approach requires users to be involved in every concept map-ping in order to validate the LSI-suggested WordNet sense. For a small ontology, thismay not be considered a major hindrance. However, in real environments with hun-dreds of concepts, one can guess the frustration when validating the suggested map-pings. This problem has led us to investigate the amount in which ontology mappingand merging can be automated. In other words, the question to be answered concerns“how much, if any, human involvement is required for ontology mapping and mergingand in which stages of the merging process”.
3 On Automating the Mapping of Ontologies
Given the crucial role of uncovering the intended semantics of concepts to the merg-ing process, we aim at automating the following two major steps for the merging oftwo ontologies and a) The mapping of to WordNet senses, and b) The map-ping of to the senses corresponding to the concepts of The motivation for step(b) is that LSI must consider senses that are “close” to the meaning of the concepts inthe hidden intermediate ontology. Therefore, for the merging of with the con-cepts in must be mapped to the intended interpretations of concepts in
3.1 On Automating the Computations of the s-Morphism of
2
3Match in this case means linguistic match of the concept names from the two ontologies.Match means that both concepts have been mapped to the same WordNet sense
In the following we present three methods towards automating the mapping process.Each method differs from the others in the level of human involvement. All the ex-periments we have conducted involve ontologies between 10 and 100 concepts. Forpresentation reasons, we discuss here the results of experiments conducted with a 10-concept ontology taken from the Transportation domain:

Capturing Semantics Towards Automatic Coordination of Domain Ontologies 27
3.1.1 Fully Automated MappingFully automated mapping is achieved by running the mapping algorithm describedpreviously without any human intervention. That is, we simply map each concept ofthe given ontology to the best-ranked sense returned by the algorithm. This approachto computing the s-morphism for the ontology, gives the results shown in the“Automated iteration” column of Table 2.
A mapping is considered to be “correct” when the concept is associated with theinterpretation intended by the ontology developer. To compute the mappings, thesemantic space and the query string are constructed as it is specified in Section 2. Inorder to increase the mapping precision by taking advantage of the correct mappingsproduced, we also investigated the following method: Given the computed mappingsof concepts to WordNet senses, the algorithm re-computes the s-morphism. Althoughthe semantic space is computed in the same way as in the first iteration, the querystring for the 2nd iteration is constructed by taking into account the most frequentterms of the WordNet senses associated with the ontology concepts. The key pointhere is that the query string is re-computed in the 2nd iteration by using the new con-cept mappings produced. Thus, if the mapping for a concept C has been changed dur-ing the 2nd iteration, then the new associated sense will be used for the computation ofthe query string for every concept that is related to C via an inclusion relation. Con-cerning our example, the mapping of the concept Vehicle has been changed in thesecond iteration of the mapping algorithm since the query string for this concept hasbeen changed due to the corrections made in the mappings of the concepts Craft andCar. The latter concepts are related to the concept Vehicle via inclusion relations.Column “Automated 2nd iteration” of Table 2 shows the results of this method.
A problem with this method is that, due to changes in the mappings of other con-cepts, some correct mappings from the first run did change to wrong mappings. So,even if the precision of the mapping has been improved, the problem raised here is thecomputation of wrong mappings, which were computed correctly in the first run. Theinability to correct the mapping of some concepts is due to the fact that the mappings

28 K. Kotis, G.A. Vouros, and K. Stergiou
of their related concepts have not been changed. Concerning our example, the inabilityto correct the mapping of concept Truck is explained as follows: the query string re-mains the same since it is computed by considering only the concept Motor Vehicle,whose mapping has been left unchanged.
3.1.2 User-Based Mapping
To overcome the above problem, we can insist that the “correct” mappings of the 1 strun are preserved. We can achieve this by requesting users’ feedback on the results ofthe first run. The user is provided with a list of all the concepts of the ontology, andhe/she can choose the concepts that are not mapped to their correct senses. Doing soin the example ontology one can choose to improve the mappings of the three con-cepts Car, Craft, and Truck. The mapping of the concept Truck remains unchanged(for the reasons described before), but the mappings of the other two concepts arecorrected, as the “User-based” column of Table 2 demonstrates.
Although we have achieved 90% precision with this method, the user must checkall the returned mappings one-by-one and validate them manually against the intendedconcept interpretations. Thus, because of this overhead, we are simply back where westarted i.e. to the HCONE-merge approach to mapping.
3.1.3 Semi-automated Mapping
To minimize the time spent for the validation of mappings and thus minimize userinvolvement, we explored methods for the automatic computation of the mappingsthat need user validation. Along this line we implemented a method that locates incon-sistencies between the translated axioms of ontology and WordNet inclusionrelations. An inconsistency occurs when the mapping to WordNet senses of two con-cepts related via an inclusion relation is not a morphism. It must be pointed that al-though we do not insist that mappings of original ontologies must preserve inclusionrelations between WordNet senses, the consistency-checking heuristic rule providesuseful suggestions for improving the mapping. A similar technique is used in the map-ping algorithm proposed in [4].
Concerning our example, the method suggested 4 concept pairs whose mapping isinconsistent to WordNet corresponding senses’ relations. For example, the pairCraft/Vehicle is inconsistent since (a) Craft is mapped to the sense of “craft, crafts-manship, workmanship -- (skill in an occupation or trade)”, (b) Vehicle is mapped tothe sense “vehicle -- (a conveyance that transports people or objects)” and (c) theirmapping to these WordNet senses does not preserve their inclusion relation specifiedin the ontology.
Each suggested pair must be checked to identify which of the two concepts causesthe inconsistency. In our example it is the Craft concept that is not mapped correctly.By running the mapping algorithm for this concept, the mapping becomes consistent.However, making mappings consistent does not ensure that mappings become “cor-rect”, since a consistent mapping does not necessarily reflect the intended interpreta-tion of the concept.

Capturing Semantics Towards Automatic Coordination of Domain Ontologies 29
To achieve a higher mapping precision we have employed the following heuristic:In case the mapping is still wrong or produces an inconsistency then the mappings ofthe concepts that are semantically related to the suggested concepts are further vali-dated. For instance, the mapping of the pair Craft/Vehicle produces an inconsistency.Then their immediate super-concept’s mapping, i.e. the mapping of the conceptTransport, is validated. Since the mapping of Transport is wrong, the user runs themapping algorithm again only for the concept Transport. Having the mapping ofTransport corrected, the user re-runs the mapping algorithm for Craft, resulting in a“correct” and consistent mapping. The precision percentage of this method is depictedin the “Semi-automated” column of Table 2.
3.1.4 Comparison of the Methods
Based on the basic algorithm for computing the s-morphism, we have shaped an ap-proach to ontology mapping, where human inspection and validation has been reduceddown to the number of algorithm runs needed to correct the suggested inconsistentconcept pairs. We have compared the proposed methods according to the amount ofautomation they achieve and their mapping precision:
The fully automated method, requires the minimum number of user actions, but atthe same time it achieves the lowest precision (80% correct mappings). On the otherhand, the user-based method achieves higher precision percentage (90%), but theactions that are required by the user imply considerable effort, since the user has tovalidate the mapping of each ontology concept. It must be pointed that this case re-quires also a considerable number of additional algorithm runs, equal to the percent-age of wrong mappings. The semi-automated method however, in addition to the highpercentage of precision (90%) can significantly reduce the number of concepts thatneed validation by the user. However, in the worst case where each concept is in-volved in at least one inconsistency, validation of all concepts is required.
3.2 Map Ontology B to Ontology A
Having reached the point where has been mapped to the hidden intermediate on-tology, there is one more step prior to merging: the mapping of The first step is torepeat the mapping process described in Section 2 for the ontology. Havingmapped the concepts of to WordNet, definitions of the concepts that have beenmapped to the same WordNet sense, as already shown in section 2, can readily bemerged. However, in order to increase the precision of the method for those pairs ofconcepts and that are not mapped to the same WordNet sense, from the on-tology is mapped to the translated ontology, rather than to WordNet.The mapping method is as follows:
For each concept of and each concept of for which either (a) or (b)happens:
(a) Both and correspond to the same WordNet lexical entry andbelong to the same synset
(b) and correspond to a different WordNet lexical entry and either orbelong to or corresponding WordNet sysnset

30 K. Kotis, G.A. Vouros, and K. Stergiou
Run the mapping algorithm for the conceptThe query string is constructed by taking into account the most frequentterms of fs(C), for every concept C that has a corresponding concept (via fs)to a concept of and is related to via an inclusion relation.The semantic space is constructed by taking into account the senses of thathave been computed by mapping to WordNet.
Using the example ontologies of Section 2 and the proposed semi-automated methodfor mapping, the algorithm produced the mapping of the concept “Transportation” tothe concept “Transportation System”, and of the concept “Facility” to the concept“Installation”.
Although current experiments have shown that additional mappings can be identi-fied through this technique, further investigation is needed in order to identify theamount of information that is necessary to further improve the initial mappings as wellas to reduce the impact of reversing the order of the ontologies that have to bemapped.
3.3 Evaluating Semi-automated Ontology Merging with Real-Life Ontologies
Initial experiments showed that the semi-automated ontology mapping/merging proc-ess described in Section 3.1.3 achieves high accuracy with little human involvement.To further investigate this, we conducted experiments with real-life ontologies takenfrom the DAML ontology library4. These experiments followed the requirements ofsimilar experiments conducted with PROMPT [13]. We have measured the recall andprecision of the suggested merging actions. Generally, recall is defined as the fractionof correct matches that the algorithm identifies, and precision is defined as the fractionof correct matches among the matches that the algorithm identifies. We have alsomeasured the distance to a manually produced gold-standard ontology that is themerging result of two ontologies widely used in other experiments and taken from theAcademia domain.
We compared the results of mappings produced by the HCONE-merge and theSemi-automated merge methods (Section 3.1.3). The recall that both methods return is97%, which means that there is a high percentage of correspondence of ontology con-cepts to terms in the WordNet database. The precision that the two methods return is69% and 79% respectively, when the user is not involved at the validation of map-pings. The two methods are different in their design principles as described previ-ously, and therefore result in different percentages of correct mappings. Semi-automated merge returns the higher percentage since this method takes advantage ofthe LSI runs that make use of previously automatically corrected mappings to thecomputation of the vicinity for further mappings. HCONE-merge cannot make use ofthe same advantage since it is a step-by-step assignment of WordNet senses to ontol-ogy concepts. For instance, concepts “Visiting Scholar” and “Visiting Staff” are as-signed a correct mapping in the Semi-automated merge method whereas in theHCONE-merge they are not. However, when the user is involved (with manually as-signment of the correct mappings), as expected, the standard HCONE-merge method
4 DAML. DAML ontology library 2004, www.daml.org

Capturing Semantics Towards Automatic Coordination of Domain Ontologies 31
reaches the highest precision percentage (97%). The precision of semi-automatedmethod on the other hand, even user involvement (by re-running LSI for selectedmappings) was expected to positively influence the result, in this experiment it had noimpact at all.
It is difficult to compare recall and precision percentages of HCONE-oriented ap-proaches with results of other approaches such as GLUE (66-97% precision [12]) and
(60-76% precision [9]). The trade-off between precision percentagesand time/human involvement spent during mapping must be carefully examined whendoing such comparisons, as well as the input requirements (kind of knowledge used)of the approach i.e. use of instances or additional information sources such as lexiconsor corpus. However, a comparison based on the distance to the “gold-standard” ontol-ogy has shown that HCONE-oriented approaches are closer than other approaches (forinstance, PROMPT) due to their capability of uncovering semantic similarity betweennodes. To our knowledge, the only similar to our mapping approach is S-Match [4],which computes semi-automatic matching with a high overall estimation (90%) usingsemantic similarity measures but works only for those ontologies that preserve therelations among WordNet senses.
4 Concluding Remarks
In this paper we presented a number of methods dealing with the mapping of conceptsto their intended interpretations, with the aim to identify the minimum user interven-tions required during the mapping and merging of ontologies. From our results we canconclude that a precision of around 80% with a variable number of validations can beachieved with a semi-automated method of mapping.
On automating the mapping and merging processes we conjecture that in real envi-ronments such as the Semantic Web humans’ intended interpretations of conceptsmust always be captured. The aim of our research is to reduce human involvement forcapturing the intended interpretations of concepts. Existing efforts [10][12][11], placethis involvement after the mapping between sources ontologies has been produced, aswell as during, or at the end of the merging method. The user is usually asked to de-cide upon merging strategies or to guide the process in case of inconsistency. Someother efforts head towards automatic mapping techniques [9], [8], [5] but they havenot shown that a consistent and automatic merging will follow. The HCONE-mergeapproach places human involvement at the early stages of the mapping/merging proc-ess. If this involvement leads to capturing the intended interpretation of conceptuali-zations, then the rest is a consistent, error-free merging process, whose results aresubject to further human evaluation. The new methods proposed in this paper showthat human involvement is necessary to produce valid mappings between ontologies,however they can be reduced significantly.
Finally, we have identified that apart from [9] [4] [12] all efforts do not consult sig-nificant domain knowledge. However, to make use of such knowledge, additionalinformation must be specified in the ontology. WordNet is a potential source of suchinformation [9] [4].
Future work concerns mapping relations of concepts too.

32 K. Kotis, G.A. Vouros, and K. Stergiou
References
1.
2.
3.
4.
5.
6.
7.
8.
9.
10.
11.
12.
13.
Uschold M. and Gruninger M.: Creating Semantically Integrated Communities on theWorld Wide Web. Invited Talk, Semantic Web Workshop, WWW 2002 Conference, May,(2002)Uschold M.: Where are the Semantics in the Semantic Web? AI Magazine, Volume 24,No.3, Fall (2003)Madhavan J., Bern-stein P. A., Domingos P., and Halevy A. Y.: Representing and rea-soning about mappings between domain models. Proc. of the 18th AAAI, (2002) 80–86Giunchiglia F. and Shvaiko P., Yatskevich M.: S–Match: An Algorithm and Implemen-tation of Semantic Matching. The Semantic Web: Research and Applications, LectureNotes in Computer Science, Vol. 3053, Springer-Verlag, (2004) 61-75Kalfoglou Y. and Schorlemmer M.: Ontology mapping: the state of the art. The Knowl-edge Engineering Review 18(1): 1-31 (2003)Kotis K. and Vouros G. A.: HCONE approach to Ontology Merging. The Semantic Web:Research and Applications, Lecture Notes in Computer Science, Vol. 3053, Springer-Verlag, (2004) 137-151Deerwester S., Dumais S. T., Furnas G. W., Landauer T. K., Harshman R.: Indexing byLatent Semantic Analysis. Journal of the American Society of Information Science (1990)Madhavan J., Bernstein P. A., and Rahm E.: Generic schema matching with Cupid. VLDBJournal (2001) 49-58Serafini L., Bouquet P., Magnini B., and Zanobini S.: An Algorithm for Matching Con-textualized Schemas via SAT. In Proc.of CONTEX (2003)Gangemi A., Pisanelli D. M., Steve G.: An Overview of the ONIONS Project: ApplyingOntologies to the Integration of Medical Terminologies. Data and Knowledge Engineer-ing, 1999, vol. 31, (1999) 183-220Stumme G., Mädche A.: FCA-Merge: Bottom-Up Merging of Ontologies. In: B. Nebel(Ed.): Proc. 17th Intl. Conf. on Artificial Intelligence (IJCAI ’01). Seattle (2001) 225-230Doan A., Madhavan J., Domingos P., and Halvey A.: Learning to map between ontologieson the semantic web. In Proc. Of WWW-02, 11th InternationalWWW Conf., Hawaii(2002)Noy N. and Musen M.: A. M.: PROMPT: Algorithm and tool for automated ontologymerging and alignment. In Proceedings of 7th National Conference on AI, Austin (2000)

Towards a Semantic Representation of Documentsby Ontology-Document Mapping
Mustapha Baziz
IRIT, Campus universitaire ToulouseIII118 rte de Narbonne,
F-31062 Toulouse Cedex 4, [email protected]
Abstract. This paper deals with the use of ontologies in Information Retrievalfield. It introduces an approach for document content representation byontology-document matching. The approach consists in concepts (mono andmultiword) detection from a document via a general purpose ontology, namelyWordNet. Two criterions are then used: co-occurrence for identifying importantconcepts in a document, and semantic similarity to compute semanticrelatedness between these concepts and then to disambiguate them. The result isa set of scored concepts-senses (nodes) with weighted links called semanticcore of document which best represents the semantic content of the document.We regard the proposed and evaluated approach as a short but strong steptoward the long term goal of Intelligent Indexing and Semantic Retrieval.
Keywords: Information Retrieval, Semantic representation of documents,ontologies, WordNet.
1 Introduction
Ontology-based information retrieval (IR) approaches promise to increase the qualityof responses since they aim at capturing within computer systems some part of thesemantics of documents, allowing for better information retrieval. Two keycontributions can then be distinguished: query reengineering and documentrepresentation. In both oh these two cases, the expected advantage is to get a richerand more precise meaning representation in order to obtain a more powerfulidentification of relevant documents meeting the query. Concepts from an ontologywhich are semantically related to the query can be added in order to select moredocuments, namely those using a different vocabulary but dealing with the same topic[1], [2], [3], [4]. In document representation, known as semantic indexing and definedfor example by [2] and [5], the key issue is to identify appropriate concepts thatdescribe and characterize the document content. The challenge is to make sure thatirrelevant concepts will not be kept, and that relevant concepts will not be discarded.In this paper, we propose an automatic mechanism for the selection of these conceptsfrom documents using a general purpose ontology, namely the WordNet lexical data-base [6].
C. Bussler and D. Fensel (Eds.): AIMSA 2004, LNAI 3192, pp. 33–43, 2004.© Springer-Verlag Berlin Heidelberg 2004

34 M. Baziz
We propose to build a semantic network for representing the semantic content of adocument. The semantic network to which we refer here is one as defined by [7]:“semantic network is broadly described as any representation interlinking nodes witharcs, where the nodes are concepts and the links are various kinds of relationshipsbetween concepts”. The resulted scored concepts could be used in indexing and thensearching phases of an Information Retrieval System (IRS).
The paper is organized as follows: section 2 gives a brief overview on semantic-basedinformation retrieval and semantic relatedness measures between concepts usingsemantic representations. Section 3 describes the proposed approach of matching anontology with a document. The steps include: concept extraction (3.1), conceptweighting (3.2), computing semantic relatedness between concepts (3.4) and buildingand scoring a document’s semantic core (3.5). Section 4 presents the evaluation of theapproach. Conclusions and prospects are drawn in section 5.
2 Related Works on the Use of Semantics in InformationRetrieval
Recently, some approaches have been proposed to use semantics in IR. In semantic-based IR, sets of words, names, noun phrases are mapped into the concepts theyencode [8]. By this model a document is represented as a set of concepts: to this aim acrucial component is a semantic structure for mapping document representations toconcepts. A semantic structure can be represented using distinct data structures: trees,semantic networks, conceptual graphs, etc. Such structures may be dictionaries,thesauri and ontologies [3]. They can be either manually or automatically generated orthey may pre-exist. WordNet and EuroWordNet are examples of (thesaurus-based)lexical data-based including a semantic network. As such, they are close toontologies.They are widely employed to improve the effectiveness of IR system. In [9], theauthors propose an indexing method based on WordNet synsets: the vector spacemodel is employed, by using synsets as indexing space instead of word forms. In [2]and [10] concepts from an ontology (“regions” for the first paper) are connected tothose in documents (text for the first and xml data for the second). Both authorspropose a method for measuring the similarity between concepts via the semanticnetwork of an ontology. [11] proposed in their system (OntoLearn) a method calledstructural semantic interconnection to disambiguate WordNet glosses (definitions).
Similarity between concepts in semantic networks is already in the scope ofvarious research works. Several methods and metrics are proposed. The principles ofpath based measures are presented in [12]; [13] use Information Content measure(similarity between two given concepts is based on the most specific concept, i.e. theleast common upper node, in the hierarchy which subsumes both of them) and [14]’sapproach uses an adapted Lesk [15] algorithm based on gloss overlaps betweenconcepts for disambiguating words in text. In our case, the finality is not especiallyWord Sense Disambiguation (WSD) —for a complete survey of WSD, the interestedreader may refer to the Senseval home page (http://www.senseval.org) —. However,we were inspired by the Pederson’s and colleagues approach described in [14] forcomputing semantic similarity between concepts in our semantic core building

Towards a Semantic Representation of Documents by Ontology-Document Mapping 35
process. We will explain further on (section 3.3) the interest of using semanticrelations for a more efficient concept comparison.
3 Matching a Document with an Ontology
Roughly, the approach consists in 3 steps. At the first step, being given a document,terms (mono and multiwords) corresponding to entries in the ontology are extracted.At step 2, the ontology semantic network is used, first to identify the different sensesof each extracted concept and then to compute relatedness measures between thesesenses (concept-senses). Finally at step 3, a document’s semantic core is built up. It isformed by the best group of concepts from the document which can best cover thetopic expressed in this document.
3.1 Concepts Extraction
Before any document processing, in particular before pruning stop words, an importantprocess for the next steps consists in extracting mono and multiword concepts fromtexts that correspond to nodes in the ontology. The recognized concepts can be namedentities like united_kingdom_of_great_britain_and_northern_ireland or phrases likepull_one’s_weight. For this purpose, we use an ad hoc technique that relies solely onconcatenation of adjacent words to identify ontology compound concepts. In thistechnique, two alternative ways can be distinguished. The first one consists in projectingthe ontology on the document by extracting all multiword concepts (compound terms)from the ontology and then identifying those occurring in the document. This methodhas the advantage of being speedy and makes it possible to have a reusable resourceeven if the corpus changes. Its drawback is the possibility to omit some concepts whichappear in the source text and in the ontology with different forms. For example if theontology recognizes a compound concept solar battery, a simple comparison do notrecognizes in the text the same concept appearing in its plural form solar batteries. Thesecond way, which we adopt in this paper, follows the reverse path, projecting thedocument onto the ontology: for each multiword candidate concept trained bycombining adjacent words in the text, we first question the ontology using these wordsjust as they are, and then we use their base forms if necessary.Concerning word combination, we select the longest term for which a concept isdetected. If we consider the example shown on Figure 1, the sentence contains three (3)different concepts: external oblique muscle, abdominal muscle and abdominal external obliquemuscle.
The first concept abdominal muscle is not identified because its words are notadjacent. The second one external oblique muscle and the third one abdominal externaloblique muscle are synonyms, their definition is:
Fig. 1. Example of text with different concepts

36 M. Baziz
The noun external oblique muscle has 1 sense1. external oblique muscle, musculus obliquus externus abdominis, abdominal
external oblique muscle, oblique -- (a diagonally arranged abdominal muscle on eitherside of the torso)
The selected concept is associated to the longest multiword abdominal external obliquemuscle which corresponds to the correct sense in the sentence. Remind that in wordcombination, the order must be respected (left to right) otherwise we could be confrontedto the syntactic variation problem (science library is different from library science).
The extraction of multiword concepts in plain text is important to reduce ambiguity.These concepts generally are monosemous even thought the words they contain canbe individually several times ambiguous. For example, when taking each wordseparately in the concept ear_nose_and_throat_doctor, we have to disambiguatebetween 5 senses for the word ear, 13 senses (7 for the noun nose and 6 for the verbnose) for the word nose, 3 senses for throat (and is not used because it is a stop-word)and 7 senses (4 for the noun and 3 for the verb) for the word doctor. So, we wouldhave a number of 5x13x3x7= 1365 possible combinations of candidate senses. Butwhen considering all the words forming a single multiword concept (of course, themultiword concept must be recognized in the ontology), we only will have one sense.
In the case of this example, the full concept and its definition (gloss in WordNet) areas follows:
The noun ear-nose-and-throat doctor has 1 sense1. ENT man, ear-nose-and-throat doctor, otolaryngologist, otorhinolaryngologist,
rhinolaryngologist -- (a specialist in the disorders of the ear or nose or throat.)
In WordNet2.0, there are a total of 63,218 multiword concepts (composed of 2-9words). 56,286 (89%) of these are monosemous, 6,238 have 2 senses (9.867%) and only694 (0.01) of multiword concepts have more than 2 senses. Thus, the more there aremultiword concepts in a document to be analyzed, the easier is their disambiguation.
3.2 Weighting Concepts
The extracted concepts are then weighted according to a kind of tf.idf that we calledcf.idf. For a concept c composed of n words, its frequency in a document equals to thenumber of occurrences of a concept itself, and the one of all its sub-concepts. Formally:
Where Length(c) represents the number of words and sub_concepts(c) is the set ofall possible sub-concepts which can be derived from c: concepts of n-1 words from c,concepts of n-2, and all single words of c. For example, if we consider a concept“elastic potential energy” composed of 3 words its frequency is computed as:

Towards a Semantic Representation of Documents by Ontology-Document Mapping 37
f(“elastic potential energy”) = count(“elastic potential energy”) + 2/3count(“potential energy”) + 1/3 count(“elastic”) + 1/3 count(“potential”) + 1/3count(“energy”).
Knowing that potential energy is itself also a multiword concept and here, it is aquestion of adding the number of occurrences of potential energy and not itsfrequency.
Other methods for concept frequencies are proposed in the literature, they use ingeneral statistical and/or syntactical analysis [16], [17]. Roughly, they add singlewords frequencies, multiply them or multiply the number of concept occurrences bythe number of single words forming this concept (equation 2):
The global frequency idf(C) of a concept in a collection is:
Where N is the total number of documents and df (document frequency) is the numberof documents a concept occurred in. If the concept occurs in all the documents, itsfrequency is null. We have used 2 as a frequency threshold value.Once the most important concepts are extracted from a document, they are used to buildup the semantic core of this document. The link between two nodes is a condensedvalue resulting from a comparison of the two concept-senses (nodes) using severalsemantic relations. It has no precise meaning but expresses the semantic closeness of thetwo concept meanings. In the next section, we introduce the method of computingsemantic relatedness between concepts using a semantic network of ontology.
3.3 Computing Semantic Relatedness Between Concepts
Being given a set of n relations from an ontology and twoconcepts, and with affected senses and and The semanticrelatedness (overlaps) between and noted or
is defined as follows:
It represents the adapted Lesk intersection (number of common words which is squaredin the case of successive words) between the strings corresponding to the informationreturned by all relations from when applied to the concept senses and Forexample: if we suppose a sense 1 of the concept applied_scienceand a sense 1 of the concept information_science, and
as known relations (gloss and holonymy definitions are givenbelow), Relatedness applied for R1 and R2 between the two concepts equals to 11:

38 M. Baziz
(applied_science#n#1)= (the discipline dealing with the art or science ofapplying scientific knowledge to practical problems; “he had trouble deciding whichbranch of engineering to study”)
(information science#n#1)= (the branch of engineering science that studies(with the aid of computers) computable processes and structures).
Overlaps (applied_science#n#1)=lx “science” +1x “branch of engineering” + 1x“study”
The relations depend on those available in theontology. In our case (WordNet), weused the following WordNet relations:
gloss which represents the definition of a concept with possibly specific example(s)from the real world. For example, the gloss of sense 1 of noun car (car#n#1) is:
(4-wheeled motor vehicle; usually propelled by an internal combustion engine; “he needs a car to get towork”). The real world example is given between quotes mark.
hypernymy for the is-a relation (physics is-a natural science) and hyponymy itsreverse relation,meronymy for the has-a relation (car has-a {accelerator, pedal, car seat}) andholonymy (its reverse relation),domain relations: domain specific relations may be relevant to assess semanticrelatedness between concepts. [18] have used domain relations extracted using asupervised method. In our case we used an automatic method since these relationshave recently been added to WordNet (Wn2.0 version).
We used six domain relations: domain–category (dmnc: for example acropetalbotany,phytology), domain–usage (dmnu: bloody intensifier), domain–region (dmnr:sumo Japan). And the domain member relations are: member of domain-categoryfor nouns (dmtc: matrix_algebra diagonalization, diagonalisation), member of domain-usage for nouns (dmtu: idiom euphonious, spang), member of domain-region for nouns(dmtr: Manchuria Chino-Japanese_War, Port Arthur).
Fig. 2. Use of gloss information for detecting “hidden” semantic links between concepts.
Among all the above relations, we manly used the gloss one. It is a cross-categorial “relation”. It is not in itself a relation [15] but rather than a concept

Towards a Semantic Representation of Documents by Ontology-Document Mapping 39
definition. It is used for exploiting the entire semantic nets of WordNet regardless ofparts of speech1 and for detecting “hidden” relatedness between concepts. To illustratethis, let us consider as an example the two concepts Henry Ford and car. In WordNet,there is no, explicit semantic relation between these two concepts. But if we considertheir gloss information, we find some word overlaps which are indicative of thestrong relation between the 2 concepts: as shown in Figure2, there is one overlapbetween the gloss of the first concept (Henry Ford) and the synset of the second (car);which is the term automobile. And there is a very interesting overlap between, in onehand, the synset of Henry Ford and the gloss of the hyponym of the concept car whichis the compound Henry Ford; and between the gloss of Henry Ford and the gloss of ahyponym of car which are automobile and mass product in other hand. The hyponymis what comes after the symbol and it is given in the example of Figure2 only onehyponym between the 30 returned by WordNet to the sense 1 of the concept (car).
3.4 Building a Semantic Network
Let
be the set of the selected concepts from a document D following the extractionmethod described in section 3.2. Concepts should be mono or multiword and eachhas a certain number of senses represented by WordNet synsets noted
Concept has senses.If we choose one sense for each concept from we will always have a set SN(j) ofm elements, because we are sure that each concept from has at least one sense,being given that it belongs to the ontology semantic network.We define a semantic net SN(j)as:
It represents a configuration of concepts senses from are senseindexes between one and all possible senses for respectively conceptsFor the m concepts of different semantic networks could be constructed using allsense combinations. The number of possible semantic networks Nb_SN depends onthe number of senses of the different concepts from
1 WordNet is designed into four non-interacting semantic nets — one for each open wordclass (nouns, verbs, adjectives and adverbs). This separation is based on the fact that theappropriate semantic relations between the concepts represented by the synsets in thedifferent parts of speech are incompatible.

40 M. Baziz
For example, Figure3 represents a possible semantic networkresulting from a combination of the sense of the first concept, the sense of
the sense of (we suppose that null links are not represented). Links betweenconcepts senses in Figure3 are computed as defined in the previous section.
To build the best semantic network representing a document, the selection of each ofits nodes (concept senses) relies on the computation of a score (C_score) for everyconcept sense. The score of a concept sense equals to the sum of semantic relatednesscomputed for all couples where it belongs to. For a concept the score of its sensenumber k is computed as:
And then, the best concept sense to retain is the one which maximizes C_score:
Let be n is the number of possible senses of the concept By doing so, we havedisambiguated the concept which will be a node in the semantic core. The finalsemantic core of a document is where nodes correspondrespectively to
Fig. 3. A semantic network built from one configuration of concepts
4 Evaluation
4.1 Evaluation Method
We evaluated our approach in Information Retrieval (IR). The semantic cores ofdocuments are used for semantic indexing. We compared searching results to thosereturned when using a classical keywords indexing. In keywords indexing, nocompound concepts are used and all frequencies are computed by tf/idf formula bothfor documents and queries. In semantic indexing, cf/idf(c) formula with 2 as athreshold is used to select concepts. Links values between concepts in the resultedsemantic core of each document are not used. The values of c_scores are used forweighting concepts in documents and queries. However, they are passed to log inorder to attenuate too large variations. All other terms, ie those which do not belong tosemantic cores of documents in which they appear, are indexed using simple key-word indexing. We have used in our experiments the Mercure search engine[19] for

Towards a Semantic Representation of Documents by Ontology-Document Mapping 41
Fig. 4. Search results for key-words versus semantic indexing
which we add some modifications namelly to support multiword concept indexingand the proposed cf/idf(c) weighting. The test collection is taken from the MuchMoreproject [20]. This collection includes 7823 documents with 25 topics from which thequeries are extracted and a relevance judgement file done by domain experts.Documents deal with the medical domain, however, the vocabulary is rather generaland is roughly covered by WordNet. Our experimental method follows the one usedin Trec’s campaigns [21]. For each query, the top 1000 retrieved documents arereturned by the search engine and precisions are computed at different points (top 5,10, 15, 20, 30, 100 and 1000 retrieved documents). We have choosen to use a smallcollection because of the computing complexity: the building of semantic cores forthe overall documents of the collection takes about one week (1 minute per documentin average).
4.2 Experimental Results
In Figure4, results of search precision are given at different points: 5, 10, 15, 20, 30,100 and 1000 top selected documents and the average at the last. At each point, theaverage precision for the 25 queries is given for the two cases of keyword-basedindexing and semantic indexing. Results clearly show the advantage of usingsemantic indexing compared to a simple indexing for enhancing system accuracy.To sum up, Precision is higher in the case of semantic indexing for all the precisionpoints and especially when considering only the first selected documents. Forexample, the precision for the 5 top selected documents is 0,3440 with keywordindexing. It goes up to 0,432 (+20%) when semantic indexing is used. And theaverage precision equals 0,2581 in the case of semantic indexing and only 0,2230when classical key-word indexing is used.We can also remark that the gap between semantic and keyword indexing falls whenthe number of selected documents increases. This can be explained by the totalnumber of relevant documents which is relatively small (even if it may vary from onetopic to another) being given the size of the collection.

42 M. Baziz
5 Conclusion
The work developed in this paper lies within the scope of the use of ontologies in theinformation retrieval field. We have introduced an approach for representing thesemantic content of documents. The result is a semantic network where nodesrepresent disambiguated and scored concepts and edges are materialized by the valueof semantic similarity between nodes. This similarity is calculated on the basis ofdifferent WordNe semantic relationst. These scored concepts can be considered as adocument semantic index. Tests show that the retrieval accuracy is higher thatn withsimple keyword indexing. This approach could be generalized to any ontologyincluding a semantic network as defined by [7]: a set of concepts and semanticrelations between these concepts.
One possible prospect is to take advantage of the C_score measure of nodes fordetecting sub-topics in documents. Admitting the hypothesis that nodes(disambiguated concepts) belonging to the same “scale” of scores, belong to the sametopic. In the same manner, at inter-document level, semantic cores of documentscould be compared for thematization. Documents with closest semantic cores couldbe regarded as covering the same subject.
References
1.2.
3.
4.
5.
6.7.
8.
9.
10.
OntoQuery project net site: http://www.ontoquery.dkKhan, L., and Luo, F.: Ontology Construction for Information Selection In Proc. of 14thIEEE International Conference on Tools with Artificial Intelligence, pp. 122-127,Washington DC, November 2002.Guarino, N., Masolo, C., and Vetere, G. “OntoSeek : content-based access to the web”.IEEE Intelligent Systems, 14:70-80, (1999).Baziz, M ., Aussenac-Gilles, N. et Boughanem M.: Désambiguïsation et Expansion deRequêtes dans un SRI: Etude de 1’apport des liens sémantiques. Revue des Sciences etTechnologies de 1’Information (RSTI) série ISI, Ed. Hermes, V. 8, N. 4/2003, p. 113-136,déc. 2003.Mihalcea, R. and Moldovan, D.: Semantic indexing using WordNet senses. In Proceedingsof ACL Workshop on IR & NLP, Hong Kong, October 2000.Miller, G. Wordnet: A lexical database. Communication of the ACM, 38(11):39--41, (1995).Joon Ho Lee, Myong Ho Kim, and Yoon Joon Lee. “Information retrieval based onconceptual distance in IS-A hierarchies”. Journal of Documentation, 49(2): 188{207, June1993.Haav, H. M., Lubi, T.-L.: A Survey of Concept-based Information Retrieval Tools on theWeb. In Proc. of 5th East-European Conference ADBIS*2001, Vol 2., Vilnius “Technika”,pp 29-41.Gonzalo, J., Verdejo, F., Chugur I., Cigarrán J.: Indexing with WordNet synsets canimprove text retrieval, in Proc. the COLING/ACL ’98 Workshop on Usage of WordNetfor Natural Language Processing, 1998.Zarg Ayouna, H., Salotti, S.: Mesure de similarité dans une ontologie pour l’indexationsémantique de documents XML. Dans Ing. des Connais, IC’2004, Lyon Mai 2004. P 249-260.

Towards a Semantic Representation of Documents by Ontology-Document Mapping 43
11.
12.
13.
14.
15.
16.
17.
18.
19.
20.
21.
Cucchiarelli, R. Navigli, F. Neri, P. Velardi. Extending and Enriching WordNet withOntoLearn, Proc. of The Second Global Wordnet Conference 2004 (GWC 2004), Brno,Czech Republic, January 20-23rd, 2004Hirst, G., and St. Onge, D.: Lexical chains as representations of context for the detectionand correction of malapropisms. In C. Fellbaum, editor, WordNet: An electronic lexicaldatabase, pages 305–332. MIT Press, 1998.Resnik, P., “Semantic Similarity in a Taxonomy: An Information-Based Measure and itsApplication to Problems of Ambiguity in Natural Language”, Journal of ArtificialIntelligence Research (JAIR), 11, pp. 95-130, 1999.Banerjee, S. and Pedersen, T.: An adapted Lesk algorithm for word sense disambiguationusing Word-Net. In Proc. of the Third International Conference on Intelligent TextProcessing and Computational Linguistics, Mexico City, February 2002.Lesk, M.: Automatic sense disambiguation using machine readable dictionaries: How totell a pine cone from a ice cream cone. In Proc. of SIGDOC ’86, 1986.Croft, W. B., Turtle, H. R. & Lewis, D. D. (1991). The Use of Phrases and StructuredQueries in Information Retrieval. In Proceedings of the Fourteenth Annual InternationalACM/SIGIR Conference on Research and Development in Information Retrieval, A.Bookstein, Y. Chiaramella, G. Salton, & V. V. Raghavan (Eds.), Chicago, Illinois: pp. 32-45.Huang, X. and Robertson, S.E. “Comparisons of Probabilistic Compound Unit WeightingMethods”, Proc. of the ICDM’01 Workshop on Text Mining, San Jose, USA, Nov. 2001.Magnini, B. and Cavaglia, G.: Integrating Subject Field Codes into WordNet. In Proc. of the2nd International Conference on Language resources and Evaluation, LREC2000, Atenas.M. BOUGHANEM, T. DKAKI, J. MOTHE ET C. SOULÉ-DUPUY “Mercure at TREC-7”. InProceeding of Trec-7, (1998).Paul Buitelaar, Diana Steffen, Martin Volk, Dominic Widdows, Bogdan Sacaleanu, SpelaVintar, Stanley Peters, Hans Uszkoreit. Evaluation Resources for Concept-based Cross-LingualIR in the Medical Domain In Proc. of LREC2004, Lissabon, Portugal, May 2004.The Sixth Text REtrieval Conference (TREC{6). Edited by E.M. Voorhees and D.K.Harman. Gaithersburg, MD: NIST, 1998.

Using an Aligned Ontology to Process User Queries
Kleber Xavier Sampaio de Souza1,2,3 and Joseph Davis2
1Embrapa Information Technology, Cx. Postal 6041, 13.083-886 Campinas SP, Brazil2School of Information Technologies, Madsen Building F09, University of Sydney, NSW
2006 Australia3Research supported by Capes grant BEX0687/03-0
{kleber,jdavis}@it.usyd.edu.au
Abstract. Ontologies have been developed for a number of knowledgedomains as diverse as clinical terminology, photo camera parts and micro-arraygene expression data. However, processing user queries over a set ofoverlapping ontologies is not straightforward because they have often beencreated by independent groups of expertise, each of them adopting differentconfigurations for ontology concepts. A project being carried out at theBrazilian Corporation of Agricultural Research has produced ontologies in sub-domains such as beef cattle, dairy cattle, sheep and beans, among others. Thispaper focuses on an alignment method for these ontologies based on FormalConcept Analysis, a data analysis technique founded on lattice theory, and astrategy for processing user queries.
1 Introduction
Ontologies, knowledge specifications of conceptualizations [9], play an important rolein knowledge sharing because they establish a common terminology to be used by themembers of a community. They have been used in knowledge-based systems torepresent objects of a universe of discourse, such as: agreements about objects andmessages (requests, queries, assertions etc.) agents exchange with each other,conceptual schemas of database systems, and business objects in a softwareengineering project.
Differences in terminology and structure of the ontologies may occur even whenone constructs them for sub-domains of a specific domain. This is precisely whathappened in Embrapa’s Information Agency Project that we worked on, whichproduced separate but overlapping ontologies in sub-domains of the agriculturaldomain such as: beef cattle, dairy cattle, sheep and beans, among others. Thenecessity of integrating these various sources of information led to the search for amethod of integration. The method proposed in this paper is the alignment of sub-domain ontologies with an upper-ontology based on Agrovoc [7]. The alignmentprocess also uses Formal Concept Analysis (FCA) [8,27], a data analysis techniquebased on lattice theory. Although the examples are developed in agricultural domain,the results are general and can be applied to any domain.
C. Bussler and D. Fensel (Eds.): AIMSA 2004, LNAI 3192, pp. 44–53, 2004.© Springer-Verlag Berlin Heidelberg 2004

Using an Aligned Ontology to Process User Queries 45
The remainder of the paper is as follows. In the next section, we comment onrelated work. Next, the formalism associated to Formal Concept Analysis and LatticeTheory is introduced. This formalism is associated with an upper-merged ontology inan alignment method in the subsequent section. Then, the result of the aligningprocess is used for processing queries. Finally, conclusions are drawn.
2 Related Work
Ontology Mapping, which encompasses integration, merging, alignment, articulationand fusion of ontologies, has received much attention recently. For an excellentreview on the subject we refer to the work of Kalfoglou and Schorlemmer [11]. Oneof their conclusions is that the process of production of a fully automated method forontology mapping has not been achieved by any of the proposed approaches.Moreover, full automation in the actual mapping methods would lead tocombinatorial explosion. That is one of the reasons why we favor the alignmentstrategy anchored on a thesaurus, instead of trying to come up with a merged ontologyfor the whole agricultural domain.
The difference between merge and alignment is that in the merge process oneontology is produced as a result of a fusion process, whereas the alignment is a pair ofontological mappings between an intermediate ontology (called articulation of two
[11]) and the source ontologies. This articulation, which we call alignedontology, is used as a reference for the comparison of the source ontologies.
Ontology Merging: The design and integration of ontologies have been addressedby many papers [1,2,5,12,13,15,18,19]. They typically use heuristic rules to findappropriate matches among nodes in corresponding source ontologies. They havepowerful features to support the user in the task of finding the best matches for agiven node, some of them including similarity measures [5]. However, there stillremains a lot of work that the user must carry out in order to produce a mergedontology.
Distributed Data and Ontologies: There are several initiatives describing the useof ontologies in integration of information [26]. OBSERVER system [16], forexample, explores syntactic relations among elements in ontologies (formalized inDescription Logics) to translate a query across multiple related ontologies. Ourapproach differs from the syntactic ones, because the alignment of ontologiesanchored on a thesaurus provides a structural rather syntactical comparison betweenontologies (details in Section 4).
Ontology Merging and FCA: Formal Concept Analysis has also been applied toontology merging [22,23]. The FCA-Merge method uses a set of documents related tothe two ontologies to be merged and processes them through natural languageprocessing techniques, producing a pruned concept lattice. That lattice is then used forthe generation of the final merged ontology. In our approach, the documents linked tothe source ontologies are not reprocessed to find their best classification in the alignedontology. As of their original classification, they were already linked to theappropriate terms in the thesaurus and were associated to the nodes in thecorresponding ontology [21].

46 K.X.S. de Souza and J. Davis
The formalization of botanical taxonomies with FormalConcept Analysis was studied in [20]. Thesaurus applied organization structuring ofmedical discharge summaries was reported in [4]. None of these approachesaddressed the alignment of ontologies anchored on thesaurus, however.
3 Formal Concept Analysis and Lattice Theory
Formal Concept Analysis (FCA), or Galois Lattice, is a method for data analysisbased on Lattice Theory and Propositional Calculus. It has been applied in manydomains: from structuring information systems [10], to knowledge discovery indatabases [24], political science, understanding building regulations and psychology[4]. For space limitation reasons, we will assume that the reader has familiarity withthe Formal Concept Analysis theoretical background. Please, refer to [8] for a detailedexplanation.
FCA analyses which subsets share the same subsets viz. subsets ofobjects with the same attributes. represents the projection of the set E into A (seeFigure 1), as determined by the binary relation R Similarly, representsthe projection of I into O. Formally, the projection (E,I), with is aformal concept if, and only if, and
The set of all formal concepts is called a formal context, denoted by(O,A,R).
Fig. 1. Galois Connection between O and A
E is called the extent and I the intent of the formal concept (E,I). It can be seenfrom the definition above that E is the set of all objects that share the same attributesin I. Similarly, I is the set of all attributes that are shared by the same objects in E.The duality between E and I, or Galois Connection, establishes a subconcept-superconcept relation, such that:

Using an Aligned Ontology to Process User Queries 47
This partial ordering results in a complete ordering among all elements of theformal context (O,A,R), with corresponding infimum (or meet) and supremun (orjoin). Moreover, this ordered set is a lattice, called concept lattice [8].
Theorem 1 (The basic theorem on concept lattices (adapted from [8])). Theconcept lattice B(O, A, R) is a complete lattice in which infimum and supremum aregiven by:
4 Applying Formal Concept Analysis to the Alignment ofOntologies
Using a direct merge of the concepts in the source ontologies to process a query wasdiscarded because the same concept had been used with different meaning (almostalways unreconcilable ones). Moreover, the partial orderings of terms were verydissimilar. For this reason, there was a need to refer to a unified view of the twosource ontologies anchored in a common partial ordering. Such view and orderingwas provided by a thesaurus, namely Agrovoc.
4.1 Alignment of Ontologies Anchored on Agrovoc
Agrovoc [7] is a multilingual agricultural thesaurus. The terms it contains aresupposed to cover the majority of objects, events and processes that occur inagricultural domain. Moreover, a thesaurus is a partially ordered set ofterms [10,6], which are organized into many sub-trees. Each sub-tree contains theterm’s definition, its super-concept and sub-concepts, and related terms. The formaldefinition of a thesaurus used in this paper is as follows:
Definition 1. A thesaurus is a set of terms organized in accordance toa partial order
The Embedding of the thesaurus in the lattice is realized in the following way:initially, each term is transformed into one attribute of the formal context(O,A,R). Then, the partial order is guaranteed by requiring that the inclusion of aterm implies the inclusion of all of its predecessors. This embedding is stated formallyin Theorem 2.

48 K.X.S. de Souza and J. Davis
Theorem 2. Let B(O,A,R) be a concept lattice and the partial order of athesaurus of terms T embedded in B be expressed as
Then, such that impliesProof. From the embedding procedure So,
must exist as a relation. From (2) above: Therefore, ifand then
The fact that confirms that or and are in the same node of the lattice,or must come from a node above. This result is confirmed when three nodes arecompared, as it can be seen in the following corollary.
Corollary 1. For all such that withand then
Proof. From Theorem 1, If andthen
The preceding corollary shows that if the term is a common attribute betweentwo nodes and it precedes terms and in the thesaurus ordering, then it is anelement of the least upper bound (or join) of these nodes. This means that the in thelattice in a position nearest to the top than and
Having established the common ordering through which ontological similaritiesand differences can be observed, the alignment of ontologies can now be defined:
Definition 2. Let and be the set of objects, attributes andrelations of ontologies and respectively. The formal context representing thealigned ontology is defined by
Table 1 shows the formal concept containing part of the ontologies of Beef Cattleand Dairy Cattle. The Objects correspond to rows in the table and Attributes, tocolumns. Whenever there is a relation between an object and an attribute, theintersection is marked in the table with an X. Objects relating to Beef Cattle ontologyare marked with an A before the name, and to Dairy Cattle ontology with a B.
Naturally, the tool used to construct the lattice (Galicia1) does not considerordering among attributes because that is not the standard approach. This isconstructed manually by putting a sign to remind the ontology designer thatwhenever she or he marks the intersection, the other one must be marked because itcorresponds to a predecessor concept in the thesaurus. For example,
means that is marked whenever ismarked.
5 Processing User Queries
The Hasse diagram corresponding to the formal context displayed in Table 1 isdisplayed in Figure 2. The names near each node correspond to thesaurus terms andthe names in boxes are objects of ontologies A and B, respectively. The objects
1 Galicia: Galois Lattice Interactive Constructor, http://www.iro.umontreal.ca/galicia/

Using an Aligned Ontology to Process User Queries 49
positioned in a certain node of the diagram inherit all the attributes of the nodes in thepath from it to the top node. The object A pasture usage, for example, is linked inits context to grazing systems, feeding systems, growth, developmentalstages, continuous grazing, intensive beef cattle.
That diagram also confirms the correct positioning of thesaurus concepts predictedby Theorem 2. An example is the node developmental that is a parentnode to the nodes post-weaning, growth.
There are cases in which two concepts, one being the predecessor of the other,were collapsed into a single node. This occurred because there are no other nodeswith that same predecessor, viz. the nodes and BrachiariaDecumbens were collapsed because there are no other kinds of thecontext. However, the predecessor of in its turn, which is poaceae,was represented in a separate node because it is also a predecessor of Pennisetum,another type of grass.
Regarding the result of the alignment, the objects corresponding to ontologyconcentrated in the right side of the diagram, whereas those of ontology on theleft side. In the middle there are the linking nodes, i.e. whenever a concept is commonto both ontologies, it is dragged to the middle of the diagram.
The queries formulated by the user have currently the form of a set of terms andAND/OR connectors. This matches perfectly with the thatcan be performed over the concept lattice. As Chaudron observed in [3], the conceptlattice corresponds to a zero order logical language. This logical language arisesnaturally from Galois Connection among subsets of objects and attributes.
Theorem 1 proves how the infimum and supremum between every pair of objectsis defined in terms of the usual set operators For example, in Figure2, the objectsB A feeding in common the attributes(join) developmental and feeding systems, because the conceptcorresponding the supremum of the former has these attributes as intents.
The concept pasture usage, in the example given previously, is a ofgrazing systems, feeding systems, growth, developmental stages,continuous grazing, intensive beef cattle.
Whenever the user submits a query, the processing engine accesses thealigned ontology (see Figure 3) and executes the search. It identifies in the lattice theset of servers that contain objects satisfying this query. If the result shows that there isonly one ontology, the query can be redirected to the server containing that ontology.
If the user searches for documents relating to intensive andfeeding systems, the only nodes that satisfy the query are those below theintersection (meet) in the lattice (see Figure 2) are B elephant grass, Bintensive, A brachiaria2, A feeding A pasture usage. Ifthe user further restricts the query, adding to it, then only the latter twonodes satisfy it. In this case, it means that the system contains the requestedinformation only in the domain of beef cattle.
If the query were Brachiaria or Pennisetum, the join node would be the oneidentified by poaceae. The result of the query would be all the objects belowpoaceae, namely B elephant grass, B intensive, A Brachiaria2 and ABrachiaria.

50 K.X.S. de Souza and J. Davis
It is interesting to note that the alignment provides a means of analysis of thewhole set of objects. In the latter result, we showed that nodes satisfying intensivehusbandry, feeding and exist only in the context of beefcattle. This fact may serve as an alert to the system managers, in the sense thatthere might be some information relating these three concepts in dairywell, and that information is not in the system.

Using an Aligned Ontology to Process User Queries 51
5.1 Complexity Issues
The problem of generating the set of all concepts (E,I) in an concept lattice has beenaddressed by many works. For a review, please refer to the work of Kuznetsov andObiedkov [14]. In their work, they compared the performance of several of theexisting algorithms, except for Titanic [24], which had just been published. They havepointed out that although the number of concepts can be exponential in size of theinput context, many algorithms perform reasonably well, provided the formal contextshave a reasonable size. In their experiment, they went up to 900 objects and 100attributes.
Fig. 2. Hasse Diagram corresponding to the formal context of Table 1.
Fig. 3. Aligned ontology providing common view to the search engine

52 K.X.S. de Souza and J. Davis
Titanic [24] also performed well for ontologies containing up to 10,000 objects and141 attributes, generating 124,574 concepts.
It is interesting to note that, the computation of the lattice is performed just once,and can be done when processing demands are lower. After that, the resulting latticeis used in the processing of user queries, which can be done very efficiently, becausethey involve only the evaluation of join and meet points.
6 Conclusion
This article presented a method for processing user queries based on an alignmentmethod for ontologies. This method is based on Formal Concept Analysis, or GaloisLattices, a data analysis technique grounded on Lattice Theory and PropositionalCalculus.
The results showed that anchoring two ontologies in a common partial ordering,provided by a lattice of terms (thesaurus), provides an excellent view of a set ofobjects existing in a database. Based on this analysis, one can evaluate and decidewhich set of objects is the best answer for a given query. Actually, a complete logicalsystem can be constructed using lattice terms as first order predicates [3]. As a result,a complex logical system can be built over the lattice, enabling the system to processelaborate queries involving logical operators.
References
1.
2.
3.
4.
5.
6.
7.
8.9.
10.
Fernandez-Breis, J. Martinez-Bejar, R.: A Cooperative Framework for IntegratingOntologies. International Journal of Human-Computer Studies (56) (2002) 665-720Chalupsky, H.: OntoMorph: A Translation System for Symbolic Knowledge. Principles ofKnowledge Representation and Reasoning In: Proceedings of the Seventh InternationalConference on Knowledge Representation and Reasoning (KR-2000), Breckenridge,Colorado, USA. (2000)Chaudron, L., Maille, N., Boyer, M.: The cube lattice model and its applications. AppliedArtificial Intelligence 17 (2003) 207-242Cole, R. and Eklund, P.: Application of Formal Concept Analysis to Information Retrievalusing a Hierarchically Structured Thesaurus. In: Proceedings of the InternationalConference on Conceptual Graphs (ICCS96), University of New South Wales, Sydney,(1996) 1-12Doan, A., Madhavan, J., Domingos, P. ,Halevy, A.: Learning to Map Between Ontologieson the Semantic Web. In: Proceedings of the Eleventh International WWW Conference,Hawaii, US (2002) 662-673Dyvik, H.: Translations as Semantic Mirrors. In: Proceedings of Workshop W13:Multilinguality in the Lexicon II, The 13th Biennial European Conference on ArtificialIntelligence (ECAI98), Brighton, UK (1998) 24-44FAO (Food and Agriculture Organization of the United Nations): AGROVOC:multilingual agricultural thesaurus. FAO. Rome (1995) 612p. http://www.fao.org/agrovoc/Ganter B., Wille R.: Formal Concept Analysis. Springer (1998)Gruber, T.R.: Translation Approach to Portable Ontology Specifications. KnowledgeAcquisition, 5 (2) (1993) 199-220Groh, B., Strahringer S. and Wille, R.: TOSCANA-Systems Based on Thesauri. In: M.-L.Mugnier and M. Chein (Editors), Conceptual Structures: Theory, Tools and Applications,LNAI 1453, Springer-Verlag, (1998) 127-138

Using an Aligned Ontology to Process User Queries 53
11.
12.
13.
14.
15.
16.
17.
18.
19.
20.
21.
22.
23.
24.
25.
26.
27.
Kalfoglou, Y., Schorlemmer, M.: Ontology mapping: the state of the art. The KnowledgeEngineering Review, 18(1) (2003) 131Kalfoglou, Y. Schorlemmer, M.: Information-flow-based ontology mapping. In: On theMove to Meaningful Internet Systems 2002 LNLS 2519, Springer (2002) 11321151Kay, J., Holden, S.: Automatic Extraction of Ontologies from Teaching DocumentMetadata. In: Proceedings of the International Conference on Computers in Education(ICCE 2002). Auckland, New Zealand. (2002) 1555-1556Kuznetsov, S.O., Obiedkov, S.A.: Comparing performance of algorithms for generatingconcept lattices. Journal Exp. Theor. Artif. Intell. 14(2-3)(2002) 189-216McGuiness, D.L., Fikes, R., Rice, J., Wilder, S.: An Environment for Merging and TestingLarge Ontologies. In: Proceedings of Seventh International Conference on Principles ofKnowledge Representation and Reasoning (KR2000), Breckenridge, Colorado, USA.(2000)Mena, E., Kashyap, V., Illarramendi, A., Sheth, A.: Domain Specific Ontologies forSemantic Information Brokering on the Global Information Infrastructure. In: Proceedingsof the 1st International Conference on Formal Ontology in Information Systems (FOIS98)(1998) 269283Mitra, P., Wiederhold, G.: An Algebra for the Composition of Ontologies. In: Proceedingsof the Workshop on Knowledge Transformation for the Semantic Web. Lyon, France(2002)Noy N. F., Musen M.A.: PROMPT: Algorithm and Tool for Automated OntologyMerging and Alignment. In: Seventeenth National Conference on Artificial Intelligence(AAAI-2000), Austin, TX (2000)Park, J., Hunting, S.: XML Topic Maps - Creating and Using Topic Maps for the Web.Addison-Wesley (2002) 544p.Priss, U.: Formalizing Botanical Taxonomies In: De Moor; Lex; Ganter (eds.), ConceptualStructures for Knowledge Creation and Communication. Proceedings of the 11thInternational Conference on Conceptual Structures, Springer Verlag, LNAI 2746 (2003)309-322Souza, K.X.S., Davis, J., Souza, M.I.F.: Organizing Information for the AgribusinessSector: Embrapa’s Information Agency In: Proceedings of 2004 International Conferenceon Digital Archive Technologies. Taipei: Institute of Information Science - AcademiaSinica (2004) 159-169.Stumme, G., Madche, A.: FCA-Merge: Bottom-up merging of ontologies. In: Proceedingsof the 7th Intl. Conf. on Artificial Intelligence (IJCAI ’01), Seattle, WA (2001) 225-230Stumme, G., Studer, R., Sure, Y. Towards and Order-Theoretical Foundation forMaintaining and Merging Ontologies In: Proceedings of Referenzmodellierung 2000.Siegen, Germany. (2000)Stumme, G., Taouil, R., Bastide, Y., Pasquier, N., Lakhal, L.: Computing iceberg conceptlattices with Titanic. Data & Knowledge Engineering 42(2002) 189-222Valtchev, P., Hacene, M. R., Huchard, M., Roume, C.: Extracting Formal Concepts out ofRelational Data In: Proceedings of the 4th Intl. Conference Journes de l’InformatiqueMessine (JIM’03): “Knowledge Discovery and Discrete Mathematics”, Metz, France(2003) 37-49Wache, H.; Vogele, T.; Visser, U., Stuckenschmidt, H.; Schuster, G.; Neumann, H.; andHubner, S. Ontology-based integration of information - a survey of existing approaches.In: Stuckenschmidt, H., ed., IJCAI-01 Workshop: Ontologies and Information Sharing(2001) 108-117Wille, R.: Restructuring Lattice Theory: an Approach Based on Hierarchies of Concepts.In: Rival, I. (ed.), Ordered Sets. Reidel, Dordrecht Boston (1982) 445-470

An Experiment on Modelling Agents and Knowledgefor the Semantic Web
Alvaro E. Arenas and Brian M. Matthews
CCLRC Rutherford Appleton LaboratoryBusiness and Information Technology Department
Oxfordshire, OX11 0QX, UK{A.E.Arenas, B.M.Matthews}@rl.ac.uk
Abstract. This paper contributes to the area of software engineering for Se-mantic Web development. We describe how to apply MAS-CommonKADS, anagent-oriented extension of CommonKADS, to the development of the ITtalksWeb Portal. Domain-specific knowledge is modelled by reusing well-knownontologies such as FOAF and RDFiCal. We also describe how to specifyCommonKADS problem-solving methods as web services, expressed using theOWL-S language.
Keywords: Semantic Web, Knowledge Modelling, CommonKADS, Problem-Solving Methods, Web Services.
1 Introduction
Realising the Semantic Web vision calls for the development and support of intelli-gent agents as well as the ontologies for sharing knowledge. Several methodologieshave been proposed for developing agent-based system [19] and ontologies [6] aswell as knowledge-based systems [1, 18]. How to combine these different modellingtechniques and adapt them for the semantic web have been identified as an open re-search question that requires urgent attention [13, pp. 24].
This paper contributes to solve this research question by studying the application ofMAS-CommonKADS [16], an agent-oriented extension of the knowledge-basedmethodology CommonKADS [18], to the design of the ITtalks Web Portal [7]. IT-talks is a case study developed as part of the DAML project at the University ofMaryland, USA. It offers access to information about talks, seminars, colloquia andother information technology (IT) related events, making use of DAML+OIL ontolo-gies for knowledge base representation, reasoning, and agent communication.
Section 2 summarises the MAS-CommonKAD methodology. Section 3 describeshow to model agents and tasks for ITtalks. Section 4 presents the knowledge model-ling. We show how domain-specific knowledge can be defined by making reuse ofwidely-used ontologies such as FOAF and RDFiCal. Further, CommonKADS prob-lem-solving methods are modelled as web services using the OWL-S language. Sec-tion 5 relates our work with that of others while section 6 presents our conclusionsand highlights future work.
C. Bussler and D. Fensel (Eds.): AIMSA 2004, LNAI 3192, pp. 54–64, 2004.© Springer-Verlag Berlin Heidelberg 2004

An Experiment on Modelling Agents and Knowledge for the Semantic Web 55
2 The MAS-CommonKADS Methodology
Many agent-oriented methodologies have evolved from object-oriented technologies,for instance Burmeister [2] and INGENIAS [14] among others. By contrast, othermethodologies have evolved from the knowledge engineering community, for exam-ple MAS-CommonKADS [16], or from a pure perspective of agent theory, for exam-ple Vowel Engineering [11] and Gaia [20]. In this paper we apply MAS-CommonKADS, an agent-oriented extension of the knowledge-based methodologyCommonKADS [18], to developing semantic web applications. We have selectedMAS-CommonKADS for its emphasis on identifying and modelling the knowledge tobe used by the agents, an important characteristic of agents in the Semantic Webarena.
MAS-CommonKADS is based on a set of models covering specific aspects of thedevelopment process. The agent model specifies agents’ characteristics such as rea-soning capabilities, sensor/effectors, and services. The task model describes the tasksthat the agents can carry out. The knowledge model defines the knowledge needed bythe agents to achieve their goals. The organisation model describes the social organi-sation of the agent society. The coordination model illustrates the conversation be-tween agents. The communication model details the human-software agent interac-tions. Finally, the design model includes, in addition to the typical action of the designphase, the design of relevant aspects of the agent network, selecting the most suitableagent architecture and the agent development platform.
The application of the methodology consists in developing the different models.Due to space limitation, we concentrate here on the agent, tasks and knowledge mod-els.
3 Modelling Agents and Tasks
ITtalks is organised around domains, which correspond to event-hosting organisationssuch as universities, research labs or professional groups. Each domain is representedby a separate web domain. Users can access the system through the web or throughagents acting on her/his behalf. The web portal includes features such as registration,search, and domain administration. ITtalks users can view information such as loca-tion, speaker, hosting organisation and talk topic.
3.1 The Model Agent
For ITtalks, we have identified four agents:
User Agent: Interface agent representing a user. It interacts with the system byservicing particular requests from users and by managing user profiles.Talk Agent: software agent that discovers the talks in a particular domain accord-ing to requests received from the User agent. There is one agent per domain. Forinstance, three possible domains in the Oxford area are CCLRC, University of Ox-

56 A.E. Arenas and B.M. Matthews
ford and Oxford Brookes University. There will be an agent for each domain, man-aging the information about talks in these places.Calendar Agent: software agent that manages the calendar of the users of a par-ticular domain. There is one agent per domain.Location Agent: software agent that provides the service of locating places near toa particular location.The outcome of the agent model is a set of textual templates, one for each agent,
which shows information such as agent description, role, etc. For instance, Table 1presents the template for Talk Agent.
Similar templates are defined for the other three agents.
3.2 The Task Model
This model describes the tasks each agent can carry out. Use cases are useful for thisactivity. We have defined the following tasks to be performed for each agent:
User Agent: introduce user profile; update user profile; request talk; confirm talkin user calendar; delete talk from user calendar.Talk Agent: search talk; contrast talk timing with user availability; notify usersabout new talk.Calendar Agent: include talk in user calendar; delete talk from user calendar;check availability for user.Location Agent: provide distance between two locations; provide nearby loca-tions.
Tasks can be split into subtasks. UML activity diagrams can be used for repre-senting the subtasks involved in realising a task. For instance, the Search Talk task re-

An Experiment on Modelling Agents and Knowledge for the Semantic Web 57
alises the request “give me talks in area X on topic Y during period Z”. This task in-volves subtasks such as selecting domains in area X; requesting talks on topic Y to alldomains in the area; or qualifying a talk according to user’s interest and speakerreputation. Figure 1 shows the subtask flow for Search Talk task.
Fig. 1. Subtasks involved in Search Talk Task
The methodology also offers templates for describing tasks. Table 2 describessubtask Determine Talk Relevance.
4 Knowledge Modelling
The more relevant model for this paper is the knowledge model. It describes the rea-soning capabilities of the agents needed to carry our specific tasks and achieve theirgoals. This model includes the specification of domain knowledge, modelled as con-cepts, properties, and relationships. The methodology provides a semi-formal lan-guage for such modelling, called the Conceptual Modelling Language (CML) [18].Instead of using CML, we have opted for a UML-based graphical language to repre-sent domain knowledge, then expressing this model in Semantic Web languages suchas RDF and OWL. This change has been motivated for the existence of automatictools for processing knowledge represented in RDF/OWL [15].

58 A.E. Arenas and B.M. Matthews
4.1 Modelling Domain-Specific Knowledge
In this part we model specific aspects of the ITtalks domain. One of the importantcharacteristics of the semantic web is the use of common ontologies. There are sev-eral simple ontologies available for modelling domains such as people and their inter-ests, e.g. FOAF [3], and calendars, e.g. RDFiCal [17]. We have reused these ontolo-gies for defining our main elements. Figure 2 illustrates the domain knowledge.
Fig. 2. Domain Knowledge for ITtalks
A domain-knowledge description typically consists of two types of ingredients:one or more domain schemas, and one or more knowledge bases. In our case, domainschemas are given by general ontologies such as FOAF and RDFiCal. The knowledgebases correspond to instances of the ontologies. For example, the concept Person canbe defined as follows.
4.2 Modelling Problem-Solving Methods
Problem-Solving Methods (PSMs) are software components that can be assembledwith domain knowledge bases to create application systems. The knowledge-engineering community has identified and developed PSMs of general usefulness orfor specific high-level tasks such as diagnosis, assessment, planning, etc. Knowledge-based methodologies such as CommonKADS [18] or MIKE [1] consider PSMs as es-sential structures for controlling the methodological activities that must be carried out

An Experiment on Modelling Agents and Knowledge for the Semantic Web 59
to build expertise models. Here, we define PSMs as services described using semanticweb technologies.
Let us first consider the Assessment PSM as described in CommonKADS. Thismethod aims at finding a decision category for a case based on a set of domain-specific norms. For instance, determining the relevance of a talk can be seen as ap-plying an assessment method, where the case corresponds to information about thetalk to be qualified; the norms are the set of rules for qualifying a talk according to theuser’s profile and the importance of the speaker; and the decision category corre-sponds to the qualification of the talk. The usual solution involves steps such as ab-stracting information from the input case data; finding the norms that can be used forthe case, this information is normally domain-specific; and evaluating the norm withrespect to the case data.
We can represent PSMs as services using the mark-up language OWL-S. This hasadvantages associated to web services such as facilitating automatic composition andinteroperability through their semantic description. Our goal here is interoperabilityand reuse though semantic description, aiming at providing a library of PSMs that canbe used in the implementation of knowledge-intensive tasks for the web. We useOWL-S Processes to describe the functionalities of the method.
We give the process description for the assessment method as a subclass of OWL-S Process. It receives two parameters: a Case, which corresponds to a list of things -domain-specific objects that constitute the case to be assessed; and Norms, which cor-responds to a list of things denoting the norms (evaluation guide) to assess the case.The output is Decision, a thing indicating a decision category. We define classes foreach parameter data type.
To make it easier to express, we also give classes to define the input and output pa-rameters (i.e. the parameters as opposed to the parameter values). We give only Ca-seInput for brevity
Finally we define the new PSM Assessment. It is a subclass of the generic atomicprocess class.

60 A.E. Arenas and B.M. Matthews
4.3 Linking Tasks and Problem Solving Methods
This part describes the invocation of the service specified in the previous subsectionfor the case of task Determine Talk Relevance. The input Case corresponds to a listincluding two elements: the grade that the user has giving to the topic of the talk (do-main-specific information that is part of the user profile, corresponding a value be-tween 0 –less relevant- and 1 –very relevant-) and the ranking of the speaker accord-ing to services such as CiteSeer (we supposed here that in a previous subtask, thenumber of times that the speaker is cited was requested, corresponding to an integer inthe range of 0 to 1000, we assume relevance 0 in case is not in the first 1000 authors).

An Experiment on Modelling Agents and Knowledge for the Semantic Web 61
The input Norms corresponds to the rule for determining the relevance of the talk: it isa method indicating that the relevance is obtained by giving 70% of value to the userinterest and 30% value to the speaker reputation. The output category decision in thiscase is a real between 0 and 1 indicating the relevance of the talk.
To define the specific instance of the process for the task Determine Talk Rele-vance, we provide an instance of the Assessment class, with appropriate newdatatypes. This is defined as follows. First we provide new classes for the specifictypes of the input and outputs.
Then add properties for the two values given in the Case.
Similar definitions are provided for Norms and Decision. Now for the specificservice we give the following instance of the Assessment class which we have defined. Webind the input and output parameters to the specific ITtalks types.

62 A.E. Arenas and B.M. Matthews
5 Related Work
Our work has been inspired by works in the agent and ontology communities. Therehas been a fresh interest in studying the application of agent-oriented methodologiesfor Semantic Web applications. In [4], it is presented an agent-oriented approach tobuild Semantic Web applications. A web service is seen as an agent itself or as part ofan agent – an extension that the agent can incorporate into itself once it finds andchooses to adopt a service. Behaviour-Oriented Design (BOD) methodology is em-ployed, extended with DAML-S to mark up services. The Nuin agent platform [12] isdesigned for Semantic Web applications around the belief-desire-intension (BDI)principles. Nuin agents are deliberative reasoners in the tradition of first-order logic-based inference, implemented on top of the Jena toolkit [15]. The Agentcities initia-tive has been also studying the interaction between agents and Semantic Web appli-cations through web services. In [10], it is explored the access of services by agents,when services are represented using the DAML-S model. They are interested in theautomatic discovery of services and their composition rather than methodological as-pects related to the development of agent-oriented applications.
Our work has been also influenced by research on ontologies. In [8], Crubezy andMusen analyses the relation between problem-solving methods and ontologies. Theypropose a methodology in which domain knowledge bases and problem-solvingmethods are described as ontologies that can be reused in different applications. Theirapproach has been further applied to the Internet Reasoning Service [9], a web-basedfront-end which provides online problem-solving resources. They have influencedour work, although our interest has been in analysing the use of problem solvingmethods within the context of agent-oriented methodologies for the case of semanticweb applications. Close-related is the topic of knowledge-based service composition[5], in which domain-specific knowledge is exploited to compose Web/Grid servicesinto a workflow specification. They also exploit mark up languages as DAML-S forproviding semantic characterisation of available services for discovery and appropri-ate utilisation.
6 Conclusions
This paper presents our experience in using MAS-CommonKADS for modelling se-mantic web applications. The methodology’s emphasis on the identification and mod-elling of knowledge has made it suitable for designing agents for the Semantic Web.This is an important characteristic that does not feature in other methodologies suchas Gaia [20] or INGENIAS [14].
Another central feature of our work is the representation of problem-solving meth-ods using the OWL-S language. By contrast to traditional web-service discovery, weshow how tasks (services) can be determined when modelling a system based on theinvolved knowledge, so that the development of the service profile can be derivedfrom the development process.
This work is part of an ongoing project aimed at generating a library of problem-solving methods using semantic web technologies. Many issues still remain and will

An Experiment on Modelling Agents and Knowledge for the Semantic Web 63
necessitate further research. In particular, we plan to combine OWL-S with other lan-guages such as RuleML in order to gain more expressive power in the description ofsome method components.
Acknowledgments. This work was carried out as part of the Semantic WebAdvanced Development for Europe project --- SWAD-Europe and supported by theIST Programme of the European Commission.
References
1.
2.
3.4.
5.
6.
7.
8.
9.
10.
11.
12.
13.
14.
15.
16.
J. Angele, D. Fensel, D. Landes, and R. Studer. Developing Knowledge-Based Systemswith MIKE. Journal of Automated Software Engineering, 5(4):389–419, 1998.B. Burmeister. Models and Methodologies for Agent-Oriented Analysis and Design. InWorking Notes of the KI’96 Workshop on Agent-Oriented Programming and DistributedSystems, 1996.D. Brickley. Friend of a Friend RDF Vocabulary, http://xmlns.com/foaf/0.1/, 2001.J. J. Bryson, D. L. Martin, S. A. McIltraith, and L. A. Stein. Toward Behavioural Intelli-gence in the Semantic Web. IEEE Computer, pages 48–54, November 2002.L. Chen, N. R. Shadbolt, C. Goble, F. Tao, S. J. Cox, C. Puleston, and P. R. Smart. To-wards a Knowledge-Based Approach to Semantic Service Composition. InternationalSemantic Web Conference. Lecture Notes in Computer Science, vol. 2870,2003.O. Corcho, M. Fernández-López, and A. Gómez-Pérez. Methodologies, Tools and Lan-guages for Building Ontologies. Where is Their Meeting Point? Data & Knowledge Engi-neering, 46(1):41–64, 2003.R. Scott Cost, T. Finin, A. Joshi, Y. Peng, C. Nicholas, I. Soboroff, H. Chen, L. Kagal, F.Perich, Y. Zou, and S. Tolia. ITtalks: A Case Study in the Semantic Web andDAML+OIL. IEEE Intelligent Systems, pages 40–47, January/February 2002.M. Crubezy and M. A.Musen. Ontologies in Support of Problem Solving. Handbook onOntologies, pages 321–341, 2003.M. Crubezy, E. Motta, W. Lu, and M. A. Musen. Configuring Online Problem-SolvingResources with the Internet Reasoning Service. IEEE Intelligent Systems, 18:34–42,2003.J. Dale, and L. Ceccaroni. Pizza and a Movie: A Case Study in Advanced Web Services.In: Agentcities: Challenges in Open Agent Environments Workshop, Autonomous Agentsand Multi-Agent Systems Conference 2002, Bologna, Italy, 2002.Y. Demazeau. From Cognitive Interactions to Collective Behaviour in AgentBased Sys-tems. In European Conference on Cognitive Science, 1995.I. Dickinson and M. Wooldrige. Towards Practical Reasoning Agents for the SemanticWeb. In Second International Conference on Autonomous Agents and Multiagent Sys-tems, Lecture Notes in Artificial Intelligence, 2003.J. Euzenat. Research Challenges and Perspectives of the Semantic Web. Report of the EU-NSF Strategic Workshop, Sophia-Antipolis, France. 2002.J. J. Gómez-Sanz and R. Fuentes. Agent Oriented Software Engineering with INGENIAS.In IBERAGENTS 2002, 4th Iberoamerican Workshop on Multi-Agent Systems, 2002.HP Labs. The Jena Semantic Web Toolkit, http://www.hpl.hp.com/semweb/jena-top.html.2002.C. A. Iglesias, M. Garijo, J. Centeno-Gonzalez, and J. R. Velasco. Analysis and Design ofMultiagent Systems using MAS-CommonKADS. In Agent Theories, Architectures, andLanguages, Lecture Notes in Artificial Intelligence, pages 313– 327, 1997.

64 A.E. Arenas and B.M. Matthews
17.
18.
19.
20.
L. Miller and D. Connolly. RDFiCal: iCalendar in RDF.http://swl .iltr.org/discovery/2003/11/rdfical/final.html, 2004.G. Schreiber, H. Akkermans, A. Anjewierden, R. de Hoog, N. Shadbolt, W. Vand deVelde, and B. Wielinga. Knowledge Engineering and Management: The CommonKADSMethodology. The MIT Press, 2000.A. Tveit. A Survey of Agent-Oriented Software Engineering. In NTNU Computer ScienceGraduate Student Conference, Norwegian University of Science and Technology, 2001.F. Zambonelli, N. Jennings and M. Wooldridge. Developing Multiagent Systems: the GaiaMethodology. ACM Transactions on Software Engineering and Methodology, Vol. 12,No. 3, 2003.

Automatic Creation and Monitoring of SemanticMetadata in a Dynamic Knowledge Portal
Diana Maynard, Milena Yankova, Niraj Aswani, and Hamish Cunningham
Dept of Computer Science, University of Sheffield, Sheffield, UK{diana,milena,niraj,hamish}@dcs.shef.ac.uk
Abstract. The h-TechSight Knowledge Management Portal enablessupport for knowledge intensive industries in monitoring informationresources on the Web, as an important factor in business competitive-ness. Users can be automatically notified when a change occurs in theirdomain of interest. As part of this knowledge management platform,we have developed an ontology-based information extraction systemto identify instances of concepts relevant to the user’s interests and tomonitor them over time. The application has initially been implementedin the Employment domain, and is currently being extended to otherareas in the Chemical Engineering field. The information extractionsystem has been evaluated over a test set of 38 documents and achieves97% Precision and 92% Recall.
Keywords: semantic metadata, ontologies, dynamic knowledge manage-ment
1 Introduction
The h-TechSight project integrates a variety of next generation knowledge man-agement (NGKM) technologies in order to observe information resources au-tomatically on the internet and notify users about changes occurring in theirdomain of interest. In this paper we describe one part of the knowledge man-agement portal, which aims at creating semantic metadata automatically fromweb-mined documents, and monitoring concepts and instances extracted overtime. By tracking their usage and dynamics automatically, a user can be in-formed about new developments and other topics of interest in their field. Wehave developed a sample application in the employment domain, and are cur-rently integrating other domains into the system.
1.1 Motivation
Employment is a general domain into which a great deal of effort in terms ofknowledge management has been placed, because it is a generic domain thatevery company, organization and business unit has to come across. Many HumanResources departments have an eye open for knowledge management to monitortheir environment in the best way. Many Recruitment Consultant companies
C. Bussler and D. Fensel (Eds.): AIMSA 2004, LNAI 3192, pp. 65–74, 2004.© Springer-Verlag Berlin Heidelberg 2004

66 D. Maynard et al.
have watchdogs to monitor and alert them to changes. A number of job searchengines (portals) have been launched using knowledge management extensivelyto link employees and employers1 2.
The employment domain contains many generic kinds of concepts. Firstthis means that an existing Information Extraction system can more easily beadapted to this domain (because it does not require too many modifications),and second, it does not require a domain expert to understand the terms andconcepts involved, so the system can easily be created by a developer withoutspecial domain skills. These two considerations are very important in the fastdevelopment of a system.
1.2 Knowledge Management Platform
The Knowledge Management Platform is a dynamic knowledge portal consistingof several different applications, which can be used in series or independently.These can be divided into two parts: tools for generic search (MASH) and toolsfor targeted search (ToolBox, WebQL and GATE). We shall concentrate here onthe GATE tool.
GATE is used to enable the ontology-based semantic annotation of web mineddocuments. It is run as a web service which takes as input a URL and an ontol-ogy, and produces a set of annotations. The web service performs informationextraction on the documents, and outputs an HTML page with instances ofconcepts highlighted. These results are stored in GATE’s database and can bereused from another sub-module of GATE for statistical analysis.
2 Semantic Metadata Creation
There are several existing tools for semantic metadata creation, both semi-automatic and fully automatic.
Semi-automatic methods are generally more reliable, but require human in-tervention at some stage in the process. Usually this involves the user annotatingdata manually in order to provide training material for the system, which thentakes over the annotation process. Examples of this kind of approach are MnM[10], S-CREAM[5] and AeroDAML[6]. These systems can usually be adapted tonew domains and ontologies, but will need retraining by the user. This meansthat they are generally best suited to annotating large volumes of data within asingle domain, and in situations where the user has an interest in investing someinitial time and effort in the application. They are less suitable for the casualuser who wants a ready-made tool to provide instant annotations for his data.
Automatic methods of annotation tend to be less reliable, but they canbe suitable for large volumes of text where very high performance is not asparamount as having some kind of result. Because they require no human inter-vention, they are much more suitable for the casual user who wants a fast result,
1
2http://www.job-search.com/http://www.aspanet.org/solutionstemp/jobport.html

Automatic Creation and Monitoring of Semantic Metadata 67
but does not want to invest time and effort in ensuring a very high quality out-put. Automatic methods tend to be more dynamic in that they can be adaptedto new ontologies with no intervention. Ontology modification may also be a partof the process, thereby ensuring that a lifecycle is created by enabling feedbackfrom the modified ontology to reflect in the application. Examples of automatedtools are SemTag[4] and KIM[11]. Both of these systems find instances in thetext using a large ontology, and perform disambiguation where instances arepresent in more than one place in the ontology. While SemTag aims more foraccuracy of classification, KIM aims more for high recall.
3 Ontology-Based Information Extraction
3.1 GATE
GATE is an architecture for language-engineering developed at the Universityof Sheffield [2], which contains a suite of tools for language processing, andin particular, a vanilla Information Extraction (IE) system. In traditional IEapplications, GATE is run over a corpus of texts to produce a set of annotatedtexts in XML format. In this case, however, the input to GATE takes the formof a set of URLs of target webpages, and an ontology of the domain. Its outputcomprises annotated instances of the concepts from the ontology. The ontologysets the domain structure and priorities with respect to relevant concepts withwhich the application is concerned.
GATE’s IE system is rule-based, which means that unlike machine-learningbased approaches, it requires no training data (see e.g. [9]). On the other hand,it requires a developer to manually create rules, so it is not totally dynamic. Thearchitecture consists of a pipeline of processing resources which run in series.Many of these processing resources are language and domain-independent, sothat they do not need to be adapted to new applications [8]. Pre-processingstages include word tokenisation, sentence splitting, and part-of-speech tagging,while the main processing is carried out by a gazetteer and a set of grammarrules. These generally need to be modified for each domain and application,though the extent to which they need to be modified depends on the complexityand generality of the domain. The gazetteer contains a set of lists which helpidentify instances in the text. Traditionally, this is a flat structure, but in anontology-based information extraction (OBIE) application, these lists can belinked directly to an ontology, such that instances found in the text can then berelated back to the ontology.
3.2 Employment Ontology
For the employment domain in h-TechSight, a domain-specific OBIE applicationhas been created, which searches for instances of concepts present in a sampleEmployment ontology. The ontology can be submitted as DAML+OIL or RDF,both of which are handled in GATE. The employment ontology has 9 Concepts:

68 D. Maynard et al.
Fig. 1. Section of Employment Ontology in GATE
Location, Organisation, Sectors, JobTitle, Salary, Expertise, Person and Skill.Each concept in the ontology has a set of gazetteer lists associated with it.Some of these (default lists) are reused from previous applications, while oth-ers (domain-specific lists) need to be created from scratch. The default lists arequite large and contain common entities such as first names of persons, loca-tions, abbreviations etc. Collection of these lists is done through corpus analysis(examining the texts manually and/or performing statistical analysis to spotimportant instances and concepts), unless a set of texts has been manually an-notated by a user (in which case, the list collection process can be automatic[7]). Grammar rules for recognition of new types of entities mainly use theselists. However, there are also other lists collected for recognition purposes thatcontain keywords and are used to assist contextually-based rules. Some of thekeyword lists are also attached to the ontology, because they clearly show theclass to which the identified entity belongs. All lists that correspond to the on-tology are ordered in a hierarchy similar to the class hierarchy in the ontology.A sample screenshot of a section of the ontology, the mappings from the lists tothe ontology, and the contents of a list is shown in Figure 1.
The concepts (and corresponding instances) in which we are interested can beseparated into 3 major groups. The first group consists of classic named entities

Automatic Creation and Monitoring of Semantic Metadata 69
which are general kinds of concepts such as Person, Location , Organisation. Thesecond group is more specific to the chosen domain of employment, and consistsof the following types:
JobId - shows the ID of posted job advertisements;Reference - shows the reference code of the job position;Status - shows the employment/position type;Application - shows the documents necessary and the method of job appli-cation (e.g. by email, letter, whether a CV should be sent, etc.);Salary - shows the information available in the text about salary rates, bonuspackages, compensations, benefits etc.;Qualification - shows the qualifications required for the advertised position,mainly a University degree;Citizenship - shows restrictions about the applicant’s citizenship and workallowance;Expertise - shows the required expertise / skills for the job;
For both groups, the grammar rules check if instances found in the textbelong to a class in the ontology and if so, they link the recognised instance tothat same class and add the following features:
The third group presents instances already annotated with HTML or XMLtags (if such exist), and consists of the following:
Company - contains the name of the organisation advertising the job;Date_Posted - shows the date when the job advertisement was posted;Title - shows the job title;Sector - shows the sector of the job that is advertised;
If these are not already annotated in the texts, they are identified usingfurther rules.
3.3 Grammar Rules
The grammar rules for creating annotations are written in a language calledJAPE (Java Annotations Pattern Language) [3] .The rules are implemented ina set of finite-state transducers, each transducer usually containing rules of adifferent type, and are based on pattern-matching. In traditional IE applications,the rules find a pattern on the LHS, in the form of annotations, and on the RHSan action such as creating a new annotation for the pattern. In OBIE applicationssuch as this, the rules also add information about the class and ontology on theRHS of the rule. So for example the string “PhD” found in the text might beannotated with the features:

70 D. Maynard et al.
This information is taken from the gazetteer, which is mapped to an ontology,as described earlier. The rules do not just match instances from the ontologywith their occurrences in the text, but also find new instances in the text whichdo not exist in the ontology, through use of contextual patterns, part-of-speechtags, and other indicators.
In total the application contains 33 grammars, which run sequentially overthe text. Each grammar contains anything from 1 to about 20 rules, dependingon the complexity of the annotation type.
4 Export and Presentation of Results
The GATE application for the employment domain has been implemented in theh-TechSight portal as a web service. Here a user may input a URL and choosethe concepts for the ontology. A new web page is created from the selected URL,with highlighted annotations. The result can be saved as an XML file.
Not only is the presentation of instances useful in itself, but furthermore,the occurrence of such instances over time is even more interesting. As well asthe visual presentation, the results are also stored dynamically in a databaseand their statistical analysis is presented inside the hTechSight knowledge man-agement portal. Results currently span January to June 2004. They have beencollected by dynamically populating a Microsoft Access database with the fol-lowing structure:
Concepts: the concept which the record set of the database is about;Annotations: the instance of the record set annotated inside a document;Document_ID: a unique ID for the document;Time_Stamp: a time stamp found inside the document.
5 Monitoring Instance-Based Dynamics
One of the most primitive dimensions of ontologies is the display of data asconcrete representations of abstract concepts, i.e. as instances. Gate leads thedata driven analysis in hTechSight, as it is responsible for extracting from thetext instances represented in the ontology. These results are stored in a databaseand statistical analysis is invoked to present instance-based dynamics.
In the h-TechSight platform, we try to monitor the dynamics of ontologiesusing two approaches: dynamics of concepts and dynamics of instances. Usersmay not only annotate their own websites according to their ontology, but mayalso see the results of a dynamic analysis of the respective domain. They maysee tabular results of statistical data about how many annotations each concepthad in the previous months, as well as seeing the progress of each instance inprevious time intervals (months). Following this analysis, end users may also

Automatic Creation and Monitoring of Semantic Metadata 71
see the dynamics of instances with an elasticity metric that indicates the trendof each individual instance. Developments in the GATE results analysis haveeliminated human intervention, as the results are created automatically in adynamic way.
The two approaches to the monitoring of dynamics are described in moredetail in the following sections.
5.1 Dynamics of Concepts
Dynamic metrics of concepts are calculated by counting the total occurrences ofannotated instances over time intervals (per month). A visual representation ofthis analysis follows is shown in Table 1.
This analysis is dynamic in that counts of months are calculated automati-cally and new columns are added without human intervention. This automaticprocess is extremely useful, as a record of the performance of concepts is storedin a log file and may lead experts to useful conclusions and quick, wiser decisions.Occurrences per month may also help experts to monitor dynamics of specificconcepts, groups of concepts or even the whole ontology. This analysis may helpthe decision making of stakeholders, by directing their resources according tothe trends of the market of their domain.
5.2 Dynamics of Instances
By clicking on the concepts, a user may see the instances related to a concept.Instances are presented in a time series where the total occurrences per monthand a calculation of an elasticity metric of instances are presented in tabularform. The elasticity metric (Dynamic Factor) counts the differences between

72 D. Maynard et al.
the total occurrences of every instance over time intervals (per month) takinginto consideration the volume of data of each time period (documents annotatedper month). Table 2 shows the dynamic factor (DF) and frequency of instancesfor the concept Organisation from January to March 2004. The higher the DF,the greater the upward trend. Looking at only 3 months of data does not givesufficient results for any conclusions to be drawn, but inferences can clearly bemade from results over a longer period of time. Looking at the instances forthe concept “Organisation” can monitor which companies are looking for newemployees and track the recruitment trends for different companies. Monitoringinstances for concepts such as Skills and Expertise can show which kinds of skillsare becoming more or less in demand.
6 Evaluation
We conducted an initial evaluation of the IE application on a small set of 38documents containing job advertisements in the Chemical Engineering domain,mined from the website http://www.jobserve.com. The web portal is mineddynamically using a web content agent written in a commercial web crawlingsoftware [1]. We manually annotated these documents with the concepts usedin the application, and used the evaluation tools provided in GATE to comparethe system results with the gold standard. Overall, the system achieved 97%Precision and 92% Recall. Table 3 shows the results obtained in more detail. Thefirst column shows the annotation type. The next 4 columns show the numbersof correct, partially correct, missing and spurious annotations found. The last 3columns show the figures for Precision, Recall and F-measure.
Some of the concepts show figure s of 100% Precision and Recall becausethey were taken directly from the original markup of the document (i.e. thisinformation was already encoded in the HTML). The lowest performance wasfor concepts such as Skills and Expertise. This is unsurprising because this kindof information can be encoded in many different ways, and is hard to identify(not only for a rule-based system, but also for a learning-based one). We reliedon contextual information and use of keywords to identify such concepts, but

Automatic Creation and Monitoring of Semantic Metadata 73
the rules could be improved further. Overall, the results are very encouraging,however.
7 Conclusions
In this paper we have presented an application for automatic creation of semanticmetadata from webpages in the Chemical Engineering domain. This is incorpo-rated into a dynamic Knowledge Management Platform which also enables themonitoring of instances found and modification of the ontologies used. The ap-plication has been tested in the Employment sector with ecxcellent results, andis currently being ported to other genres of text such as news items and companyreports. This involves adaptation of some of the rules, and integration of a newontology more specific to the domain.
There are some problems still to resolved. For example, the system currentlyonly adds class information to the instances found when the instances are alreadypresent in the ontology. It is still an open question how to decide where to linknew instances, or where to link instances found in more than one place in theontology. Currently we are investigating the use of coreference information andmachine learning techniques to solve these problems.
References
1. Caesius. WebQL User’s Guide: Introduction to WebQL. http://www.webql.com

74 D. Maynard et al.
2.
3.
4.
5.
6.
7.
8.
9.
10.
11.
H. Cunningham, D. Maynard, K. Bontcheva, and V. Tablan. GATE: A Frameworkand Graphical Development Environment for Robust NLP Tools and Applications.In Proceedings of the 40th Anniversary Meeting of the Association for Computa-tional Linguistics (ACL’02), 2002.H. Cunningham, D. Maynard, and V. Tablan. JAPE: a Java Annotation PatternsEngine (Second Edition). Research Memorandum CS-00-10, Department of Com-puter Science, University of Sheffield, November 2000.S. Dill, N. Eiron, D. Gibson, D. Gruhl, R. Guha, A. Jhingran, T. Kanungo, S.Rajagopalan, A. Tomkins, J. A. Tomlin, and J. Y. Zien. SemTag and Seeker: Boot-strapping the semantic web via automated semantic annotation. In Proceedings ofWWW’03, 2003.S. Handschuh, S. Staab, and F. Ciravegna. S-CREAM – Semi-automatic CRE-Ation of Metadata. In 13th International Conference on Knowledge Engineeringand Knowledge Management (EKAW02), pages 358–372, Siguenza, Spain, 2002.P. Kogut and W. Holmes. AeroDAML: Applying Information Extraction to Gen-erate DAML Annotations from Web Pages. In First International Conference onKnowledge Capture (K-CAP 2001), Workshop on Knowledge Markup and Seman-tic Annotation, Victoria, B.C., 2001.D. Maynard, K. Bontcheva, and H. Cunningham. Automatic Language-Independent Induction of Gazetteer Lists. In Fourth International Conference onLanguage Resources and Evaluation ( LREC 2004), Lisbon, Portugal, 2004.D. Maynard and H. Cunningham. Multilingual Adaptations of a Reusable Informa-tion Extraction Tool. In Proceedings of the Demo Sessions of EACL ’03, Budapest,Hungary, 2003.D. Maynard, V. Tablan, and H. Cunningham. NE recognition without trainingdata on a language you don’t speak. In ACL Workshop on Multilingual and Mixed-language Named Entity Recognition: Combining Statistical and Symbolic Models,Sapporo, Japan, 2003.E. Motta, M. Vargas-Vera, J. Domingue, M. Lanzoni, A. Stutt, and F. Ciravegna.MnM: Ontology Driven Semi-Automatic and Automatic Support for SemanticMarkup. In 13th International Conference on Knowledge Engineering and Knowl-edge Management (EKAW02), pages 379–391, Siguenza, Spain, 2002.B. Popov, A. Kiryakov, A. Kirilov, D. Manov, D. Ognyano., and M. Goranov. KIM– Semantic Annotation Platform. Natural Language Engineering, 2004. To appear.

Coordinating Semantic Peers
P. Bouquet1, L. Serafini2, and S. Zanobini1
1 Department of Information and Communication Technology – University of TrentoVia Sommarive, 10 – 38050 Trento (Italy)
2 ITC–IRSTVia Sommarive, 15 – 38050 Trento (Italy)
{bouquet,zanobini}@dit.unitn.it, [email protected]
Abstract. The problem of finding an agreement on the meaning of heterogeneousschemas is one of the key issues in the development of the Semantic Web. In thispaper, we propose a new algorithm for discovering semantic mappings acrosshierarchical classifications based on a new approach to semantic coordination.This approach shifts the problem of semantic coordination from the problemof computing linguistic or structural similarities (what most other proposedapproaches do) to the problem of deducing relations between sets of logicalformulas that represent the meaning of nodes belonging to different schemas.We show how to apply the approach and the algorithm to an interesting familyof schemas, namely hierarchical classifications. Finally, we argue why this is asignificant improvement on previous approaches.
Keywords: Semantic Web, Semantic Interoperability, Information retrieval, Au-tomated Reasoning
1 Introduction and Approach
One of the key challenges in the development of open distributed systems is enablingthe exchange of meaningful information across applications which (i) may use au-tonomously developed schemas for organizing locally available data, and (ii) need todiscover mappings between schema elements to achieve their users’ goals. Typical ex-amples are databases using different schemas, and document repositories using differentclassification structures. In restricted environments, like a small corporate Intranet, thisproblem is typically addressed by introducing shared models (e.g., ontologies) through-out the entire organization. However, in open environments (like the Web), this approachcan’t work for several reasons, including the difficulty of ‘negotiating’ a shared modelof data that suits the needs of all parties involved, and the practical impossibility ofmaintaining such a shared model in a highly dynamic environment. In this kind of sce-narios, a more dynamic and flexible method is needed, where no shared model can beassumed to exist, and mappings between elements belonging to different schemas mustbe discovered on-the-fly.
The method we propose assumes that we deal with a network of semantic peers,namely physically connected entities which can autonomously decide how to organizelocally available data (in a sense, are semantically autonomous agents). Each peer orga-nizes its data using one or more abstract schemas (e.g., database schemas, directories in
C. Bussler and D. Fensel (Eds.): AIMSA 2004, LNAI 3192, pp. 75–84, 2004.© Springer-Verlag Berlin Heidelberg 2004

76 P. Bouquet, L. Serafini, and S. Zanobini
a file system, classification schemas, taxonomies, and so on). Different peers may usedifferent schemas to organize the same data collection, and conversely the same schemascan be used to organize different data collections. We assume to deal with schemas withmeaningful labels, where ‘meaningful’ means that their interpretation is not arbitrary,but is constrained by the conventions of some community of speakers/users1. We alsoassume that semantic peers need to compute mappings between its local schema andother peers’ schemas in order to exchange data.
The first idea behind our approach is that mappings must express semantic relations,namely relations with a well-defined model-theoretic interpretation2. For example, wewant to state that the two elements of the schema are equivalent, or that one is more/lessgeneral, or that they are mutually exclusive. As we will argue, this gives us many advan-tages, essentially related to the consequences we can infer from the discovery of such arelation.
Fig. 1. Mapping abstract structures
The second idea is that, to discover such semantic relations, one must make explicitthe meaning implicit in each element of a schema. Our claim is that addressing theproblem of discovering semantic relations across schemas, where meaningful labels areused, as a problem of matching abstract graphs is conceptually wrong.
To illustrate this point, consider the difference between the problem of mappingabstract schemas (like those in Figure 1) and the problem of mapping schemas withmeaningful labels (like those in Figure 2). Nodes in abstract schemas do not have animplicit meaning, and therefore, whatever technique we use to map them, we will findthat there is some relation between the two nodes D in the two schemas which dependsonly on the abstract form of the two schemas. The situation is completely differentfor schemas with meaningful labels. Intuitively, the semantic relations between the twonodes MOUNTAIN and the two nodes FLORENCE of structures in Figure 2 are different,despite the fact that the two pairs of schemas are structurally equivalent between them,
1
2
In the following we show how this problem is extremely different from the problem of deter-mining the similarity across different graphs.This is an important difference with respect to approaches based on matching techniques, wherea mapping is a measure of (linguistic, structural, . . . ) similarity between schemas (e.g., a realnumber between 0 and 1). The main problem with such techniques is that the interpretation oftheir results is an open problem: should we interpret a 0.9 similarity as the fact that one conceptis slightly more general or slightly less general than the other one, or that their meaning 90%overlaps? See [1] for a more detailed discussion.

Coordinating Semantic Peers 77
and both are structurally isomorphic with the pair of abstract schemas in Figure 13. Thiswhy we can make explicit a lot of information that we have about the terms which appearin the graph, and their relations (e.g., that Tuscany is part of Italy, that Florence is inTuscany, and so on).
Fig. 2. Mapping schemas with meaningful labels
Using such an information, human reasoners (i) understand the meanings expressedby nodes: e.g., ‘images of Tuscan mountains’ (say ‘images of Italian mountains’(say ‘images of Florence in Tuscany’ (say and ‘images of Florence in Italy’(say and finally (ii) determine the semantic relations between nodes comparing themeanings, namely that and
In [2], we claim that, for extracting such meanings and for comparing them, we needat least of three kinds of informations:Lexical knowledge: knowledge about the words used in the labels. For example, thefact that the word ‘Florence’ can be used to indicate ‘a city in Italy’ or ‘a city in the SouthCarolina’, and, conversely, to handle the synonymy;World knowledge: knowledge about the relation between the concepts expressed bywords. For example, the fact that Tuscany is part of Italy, or that Florence is in Italy;Structural knowledge: knowledge deriving from how labeled nodes are arranged in agiven schema. For example, the fact that the node labeled MOUNTAIN is below a nodeIMAGES tells us that it classifies images of mountains, and not, say, books about moun-tains.
Summarizing, the process of discovering semantic relations across meaningful la-beled schemas can take advantage of exploiting the complex degree of semantic coor-dination implicit in the way a community uses the language from which the labels aretaken4. The method is based on a procedure for explicitating the meaning associated to
3
4
Indeed, for the first pair of nodes, the set of documents we would classify under the nodeMOUNTAIN on the left hand side is a subset of the documents we would classify under the nodeMOUNTAIN on the right; whereas the set of documents which we would classify under the nodeFLORENCE in the left schema is exactly the same as the set of documents we would classifyunder the node FLORENCE on the right hand side.Notice that the status of this linguistic coordination at a given time is already ‘codified’ inartifacts (e.g., dictionaries, but today also ontologies and other formalized models), whichprovide senses for words and more complex expressions, relations between senses, and otherimportant knowledge about them. Our aim is to exploit these artifacts as an essential source ofconstraints on possible/acceptable mappings across structures.

78 P. Bouquet, L. Serafini, and S. Zanobini
each node in a schema (notice that schemas such as the two classifications in Figure 2 arenot semantic models themselves, as they do not have the purpose of defining the meaningof terms they contain; however, they presuppose a semantic model, and indeed that’sthe only reason why we humans can read them quite easily) and for comparing them.As we clearly show in the next section, this approach shifts the problem of semanticcoordination from the problem of computing linguistic or structural similarities (whatmost other proposed approaches do) to the problem of deducing relations between setsof logical formulas representing the meaning of nodes belonging to different schemas.
2 The Algorithm: CTXMATCH
In this section we show how to apply the general approach described in the previoussection to the problem of coordinating Hierarchical Classifications (hereafter HCs),namely concept hierarchies [3] used for grouping documents in categories5.
In our approach, we assume the presence of a network of semantic peers, where eachpeer is defined as a triple where: is a set of documents; representsthe set of schemas used by the peer for organizing its data; and is defined asa pair composed by a lexicon L and a world knowledge representation O. The struc-ture of the semantic peer reflects the three levels of knowledge we showed before:represents structural knowledge, L contains lexical knowledge, and O is world knowl-edge. Formally, L is a repository of pairs where is a word and C is a set ofconcepts. Each pair represents the set of concepts C denoted by a word Forexample, a possible entry for a lexicon should express that the word ‘fish’ can denote atleast two concepts: ‘an aquatic vertebrate’ and ‘the twelfth sign of zodiac’. An importantexample of this kind of repository is represented by WORDNET [4]. A world knowledgeO expresses the set of relations holding between different concepts. For example, aworld knowledge O should express that the concept ‘an aquatic vertebrate’ denoted bythe word ‘fish’ stays in a IsA relation with the concept of ‘animal’ (‘fish is an animal’)and that the concept ‘the twelfth sign of zodiac’ denoted by the same word ‘fish’ staysin a IsA relations with a geometrical shape (‘fish is a geometrical shape’). Formally,world knowledge is a logical theory written is a specific language, as for example Prologclauses, RDF triples, DAML/OIL, OWL.
Our method is designed for the following scenario: a peer A (called the seeker) needsto find new documents relative to some category in one of its HCs, S. Imagine that peerA knew that peer B (the provider) owns interesting documents, and imagine that Bclassify its documents by means of a HC This problem can be solved in a standardway coordinating the two HCs. Formally, we define the problem of coordinating S and
as the problem of discovering a mapping whereR is a semantic relation between and Five relations are allowed between nodes ofdifferent is more general than is less general than
5 Some well-known examples of HCs are web directories (see e.g. the Google™ Directory or theYahoo!™ Directory), file systems and document databases in content/knowledge managementsystems.

Coordinating Semantic Peers 79
is equivalent to is compatible with is disjointfrom
The algorithm CTXMATCH takes as inputs the HC S of the seeker and the HC thelexicon L and the world knowledge O of the provider6. As we will show in the following,the lexicon L and the world knowledge O play a major part in determining the mappingbetween schemas. But, from the definition of semantic peer follows that each peer hasits own lexicon and world knowledge. A consequence of this consideration is that themapping returned by the algorithm expresses the point of view (regarding the mapping)of the provider, and, consequently, is directional: the seeker, mutata mutandis, can finda different mapping.
The output of the algorithm will be a set M of triples where R is thesemantic relation holding between the nodes and
The algorithm has essentially the following two main macro steps.Steps 2–3: in this phase, called Semantic explicitation, the algorithm tries to interpretpair of nodes in the respective HCs S and by means of the lexicon L and theworld knowledge O. The idea is trying to generate a formula approximating the meaningexpressed by a node in a structure and a set of axioms formalizing the suitable worldknowledge Consider, for example, the node FLORENCE in left lower HC of Figure 2:steps 2–3 will generate a formula approximating the statement ‘Images of Florence inTuscany’ and an axiom approximating the statement ‘Florence is in Tuscany’The pair called contextualized concept, expresses, in our opinion, the meaningof a node in a structure.Step 4: in this phase, called Semantic comparison, the problem of finding the semanticrelation between two nodes and is encoded as the problem of finding the semanticrelation holding between two contextualized concepts, and
Finally, step 5 generates the mapping simply by reiteration of the same process overall the possible pair of nodes and step 6 returns the mapping.
6 In the version of the algorithm presented here, we use WORDNET as a source of both lexicaland world knowledge. However, WORDNET could be replaced by another combination of alinguistic resource and a world knowledge resource.

80 P. Bouquet, L. Serafini, and S. Zanobini
The two following sections describe in detail these two top-level operations, imple-mented by the functions SEMANTIC–EXPLICITATION and SEMANTIC–COMPARISON.
2.1 Semantic Explicitation
In this phase we make explicit in a logical formula7 the meaning of a node into a structure,by means of a lexical and a world knowledge. In steps 1 and 2, the function EXTRACT–CANDIDATE–CONCEPTS uses lexical knowledge to associate to each word occurring inthe nodes of an HC all the possible concepts denoted by the word itself. Consider thelower left structure of Figure 2. The label ‘Florence’ is associated with two concepts,provided by the lexicon (WORDNET), corresponding to ‘a city in central Italy on theArno’ (florence#1) or a ‘a town in northeast South Carolina’ (florence#2). In orderto maximize the possibility of finding an entry into the Lexicon, we use both a postaggerand a lemmatizator over the labels.
In the step 3, the function EXTRACT–LOCAL–AXIOMS tries to define the ontologicalrelations existing between the concepts in a structure. Consider again the left lowerstructure of Figure 2. Imagine that the concept ‘a region in central Italy’ (tuscany#1)has been associated to the node TUSCANY. The function EXTRACT–LOCAL–AXIOMS hasthe aim to discover if it exists some kind of relation between the concepts tuscany#1,florence#1 and florence#2 (associated to node FLORENCE). Exploiting world knowl-edge resource we can discover, for example, that ‘florence#1 PartOf tuscany#1’, i.e.that exists a ‘part of ’ relation between the first sense of ‘Florence’ and the first sense ofTuscany.
7 The choice of the logics depends on how expressive one wants to be in the approximation ofthe meaning of nodes, and on the complexity of the NLP techniques used to process labels.In our first implementation we adopted propositional logic, where each propositional lettercorresponds to a concept (synset) provided by WORDNET.

Coordinating Semantic Peers 81
World knowledge relations are translated into logical axioms, according to Table1. So, the relation ‘florence#1 PartOf tuscany#1’ is encoded as ‘florence#1tuscany#1,8.
Step 4 has the goal of filtering out unlikely senses associated to each node. Goingback to the previous example, we try to discard one of the senses associated to nodeFLORENCE. Intuitively, the sense 2 of ‘Florence’ , as ‘a town in northeast South Carolina’(florence#2), can be discarded, because the node FLORENCE refers clearly to the cityin Tuscany. We reach this result by analyzing the extracted local axioms: the presenceof an axiom such as ‘florence#1 PartOf tuscany#1’ is used to make the conjecturethat the contextually relevant sense of Florence is the city in Tuscany, and not the city inUSA. When ambiguity persists (axioms related to different senses or no axioms at all),all the possible senses are left and encoded as a disjunction.
Step 5 has the objective of building a complex concept (i.e., the meaning of a nodelabel when it occurs in a specific position in a schema) for nodes in HCs. As describedin [2], node labels are singularly processed by means of NLP techniques and translatedinto a logical formula9. The result of this first process is that each node has a preliminaryinterpretation, called simple concept, which doesn’t consider the position of the node inthe structure. For example, the simple concept associated to the node FLORENCE of thelower left hand structure of Figure 2 is trivially the atom florence#1 (i.e. one of thetwo senses provided by WORDNET and not discarded by the filtering). Then, these resultsare combined for generating a formula approximating the meaning expressed by a nodeinto a structure. In this version of the algorithm, we choose to express the meaning of anode as the conjunction of the simple concepts associated to the nodes lying in the pathfrom root to So, the formula approximating the meaning expressed by the same nodeFLORENCE into the HC is
Step 6 returns the formula expressing the meaning of the node and the set of localaxioms founded by step 3.
8
9
For heuristic reasons – see [2] – we consider only relations between concepts on the same pathof a HC and their siblings.Although in this paper we present very simple examples, the NLP techniques exploited in thisphase allow us to handle labels containing complex expressions, as conjunctions, commas,prepositions, expressions denoting exclusion, like ‘except’ or ‘but not’, multiwords and so on.

82 P. Bouquet, L. Serafini, and S. Zanobini
2.2 Semantic Comparison
This phase has the goal of finding the semantic relation holding between two contextu-alized concepts (associated to two nodes in different HCs).
In Step 1, the function EXTRACT–RELATIONAL–AXIOMS tries to find axioms whichconnect concepts belonging to different HCs. The process is the same as that offunction EXTRACT–LOCAL–AXIOMS, described above. Consider, for example, the sensesitaly#1 and tuscany#1 associated respectively to nodes ITALY and TUSCANY of Fig-ure 2: the relational axioms express the fact that, for example, ‘Tuscany PartOf Italy’(tuscany#1 italy#1).
In steps 2–6, the problem of finding the semantic relation between two nodes and(line 2) is encoded into a satisfiabilityproblem involving both the contextualized conceptsassociated to the nodes and the relational axioms extracted in the previous phases. So, toprove whether the two nodes labeled FLORENCE in Figure 2 are equivalent, we check thelogical equivalence between the formulas approximating the meaning of the two nodes,given the local and the relational axioms. Formally, we have the following satisfiabilityproblem:
It is simple to see that the returned relation is Note that the satisfiability problem forfinding the semantic relation between the nodes MOUNTAIN of Figure 2 is the following:
The returned relation is

Coordinating Semantic Peers 83
3 Conclusions and Related Work
In this paper we presented a new approach to semantic coordination in open and dis-tributed environments, and an algorithm that implements this method for hierarchicalclassifications. The algorithm, already used in a peer-to-peer application for distributedknowledge management (the application is described in [5]), has been tested on real HCs(i.e., pre-existing classifications used in real applications) and the results are describedin [6].
CTXMATCH faces the problem of semantic coordination deducing semantic relationsbetween sets of logical formulas. Under this respect, to the best of our knowledge, thereare no other works to which we can compare ours. However, there are three other familiesof approaches that we want to compare to: graph matching, automatic schema matchingand semi-automatic schema matching. For each of them, we will discuss the proposalthat, in our opinion, is more significant. The comparison is based on the followingdimensions: (i) if and how structural, lexical and world knowledges are used; (ii) thetype of returned relation. The general results of our comparison are reported in Table 2.
In graph matching techniques, a concept hierarchy is viewed as a labeled tree, but thesemantic information associated to labels is substantially ignored. Matching two graphsG and means finding an isomorphic sub-graph of w.r.t. G. Some examples ofthis approach are described in [7,8]. CUPID [9] is a completely automatic algorithm forschema matching. Lexical knowledge is exploited for discovering linguistic similaritybetween labels (e.g., using synonyms), while the schema structure is used as a matchingconstraint. That is, the more the structure of the subtree of a node is similar to thestructure of a subtree of a node the more is similar to In case of equivalent conceptsoccurring in completely different structures, and completely independent concepts thatbelong to isomorphic structures, the match fails. MOMIS [10] is a set of semi–automatictools for information integration of (semi-)structured data sources, whose main objectiveis to define a global schema that allows an uniform and transparent access to the datastored in a set of semantically heterogeneous sources. This integration is performed byexploiting knowledge in a Common Thesaurus together with a combination of clusteringtechniques and Description Logics. The approach is very similar to CUPID and presentsthe same drawbacks in matching hierarchical classifications.

84 P. Bouquet, L. Serafini, and S. Zanobini
References
1.
2.
3.
4.
5.
6.
7.
8.
9.
Giunchiglia, F., Pavel, S.: Semantic matching. Proceedings of the workshop on SemanticIntegration Sanibel Island (Florida, USA) (2003)Bouquet, P., Serafini, L., Zanobini, S.: Semantic coordination: a new approach and an ap-plication. In Sycara, K., ed.: Second International Semantic Web Conference (ISWC-03).Lecture Notes in Computer Science (LNCS), Sanibel Island (Florida, USA) (2003)Büchner, A., Ranta, M., Hughes, J., Mäntylä, M.: Semantic information mediation amongmultiple product ontologies. In: Proc. 4th World Conference on Integrated Design & ProcessTechnology. (1999)Fellbaum, C., ed.: WordNet: An Electronic Lexical Database. The MIT Press, Cambridge,US (1998)Bonifacio, M., Bouquet, P., Mameli, G., Nori, M.: Kex: a peer-to-peer solution for distributedknowledge management. In Karagiannis, D., Reimer, U., eds.: 4th Intern. Conf. on PracticalAspects of Knowledge Management (PAKM-2002), Vienna (Austria) (2002)Magnini, B.M., Serafini, L., Doná, A., Gatti, L., Girardi, C., , Speranza, M.: Large–scaleevaluation of context matching. Technical Report 0301–07, ITC–IRST, Trento, Italy (2003)Zhang, K., Wang, J.T.L., Shasha, D.: On the editing distance between undirected acyclicgraphs and related problems. In Galil, Z., Ukkonen, E., eds.: Proc. of 6th Symposium onCombinatorial Pattern Matching. Volume 937., Finland, Springer-Verlag, Berlin (1995)Pelillo, M., Siddiqi, K., Zucker, S.W.: Matching hierarchical structures using associationgraphs. Lecture Notes in Computer Science 1407 (1998)Madhavan, J., Bernstein, P.A., Rahm, E.: Generic schema matching with cupid. In: TheVLDB Journal. (2001) 49–58Bergamaschi, S., Castano, S., Vincini, M.: Semantic integration of semistructured and struc-tured data sources. SIGMOD Record 28 (1999) 54–59
10.

Identification of Communities of Peers by Trustand Reputation
Alessandro Agostini1 and Gianluca Moro2
1 ITC-IRST TrentoVia Sommarive 18, 38050 Povo, Trento
[email protected] DEIS - University of Bologna
Via Venezia 52, I-47023 Cesena (FC)[email protected]
Abstract. We present a new model and a partial solution to the prob-lem of semantic routing in peer-to-peer networks. When a peer receivesa query, an attempt to solve the query by using both linguistic and con-textual knowledge is made. In our proposal, each peer analyzes the resultof its queries and increases the trust of those peers who reply with moreappropriate semantic contents. In this respect, our approach is adap-tive. As queries are resolved, the routing strategy of each peer becomesmore and more trust-based, namely, based on the semantics of contentsrather than on a mere syntactic matching of keywords. This leads to theemergence of communities of peers semantically related, which in turncorresponds to a peer-to-peer network clustered by contents, capable toresolve queries with a reduced number of hops.
Keywords: Peer-to-peer systems, peer-to-peer communities, informa-tion retrieval, semantic routing, trust and reputation.
1 Introduction
Peer-to-peer systems and communities (see for instance [11,17,22,32,12]), areoften established dynamically with peers that are unrelated and unknown toeach other. This is also true in cooperative conversations [15] and, sometimes, inquery-answering systems [10,20,14,30,6], where knowledge “seekers” connect tounknown “providers” by means of query propagation and information retrieval.
Deployed peer-to-peer (P2P) systems such as Gnutella, FreeNet and others[16] give rise to unstructured P2P networks, where contents spread over thenetwork are localized by flooding messages. Several P2P proposals in literature[23,29] structure P2P networks by distributing resources according to a priorihash function common to all peers. These proposals adopt a routing mechanismbased on the idea of representing data with a “distributed hash table” (DHT)[24]. Any searching procedure carried out by DHT routing mechanisms concep-tually corresponds to looking up the keyword of the target record in the hashtable, which is distributed across the peers; each peer connecting to the P2Pnetwork assumes responsibility to manage a certain range of keywords.
C. Bussler and D. Fensel (Eds.): AIMSA 2004, LNAI 3192, pp. 85–95, 2004.© Springer-Verlag Berlin Heidelberg 2004

86 A. Agostini and G. Moro
Peers have identifiers taken from the same addressing space of the keywords—usually this being strings of digits of some fixed length. Each peer maintains alocal routing table consisting of a small subset of nodes of the network. When apeer receives a query for a keyword in the local table, an attempt to solve thequery locally is made. Otherwise, when the peer receives a query for a keywordfor which it is not responsible, the peer routes the query to the neighbor peer inthe network that makes the most progress towards solving the query.
With regard to the definition of “progress” and the way to assign relevance toquery answering, algorithms differ. Existing DHT routing algorithms are basedon linguistic, or syntactic matching of the search keyword with a single attributeof the hash table. Syntactic matching arises when keywords are compared byusing simple prefixes and linguistic analysis. They do not allow, for instance,similarity search based on data contents. These existing DHT mechanisms pro-vide syntactic routing. Moreover, they assume a data space structured accordingto the distributed hash table, whose schema must be known a priori to each peerin the system. On the one hand, the use of a homogeneous distributed table lim-its the possibility of representing and querying unstructured and semi-structureddata. On the other hand, the use of a common hash function forces each peer touse a priori hard-coded mechanism to classify data. In fact, the hash functionmay be thought of as a static classification procedure.
In this paper, we propose an approach to resource routing that provides syn-tactic and structural matching of a search keyword with a peer’s identifier. Wecall it semantic routing. Structural matching arises when keywords are comparedby using their content, or semantics, with respect to the local knowledge of eachpeer. Local knowledge is organized in structures, each called a “context,” whichrepresent the main data structure in our framework. By constructing structuralmatching on top of syntactic matching, the low-level routing mechanism of ourapproach, which runs at the beginning of system evolution until the end of alearning phase, can be any DHT existing solution. In contrast to the static clas-sification procedure provided by the hash function in DHT approaches, semanticrouting concerns with the dynamic classification of peers knowledge.
Semantic routing offers the following advantages to existing DHT approaches:(1)(2)(3)(4)
similarity search based on data contents;reduction of the number of hops needed to find relevant resources;absence of an a priori hard-coded mechanism in the peers to classify data;higher query expressivity and complex data modeling than what provided
by existing DHT approaches.We define semantic routing by using an adaptive approach (Section 2, see also
[5,3]) to logically cluster the P2P network by its semantic contents, each forminga community of peers with similar semantics (Section 3). The network clusteringis not imposed, but rather it emerges gradually by point-to-point interactionamong the peers with the highest reputation [19,1,34,32]. In the selection oftrustworthy peers, which forms the basis of our routing procedure, reputationbecomes significant. You can think of reputation as the expectation about apeer’s future behavior based on information about the peer’s past behavior.

Identification of Communities of Peers 87
2 Adaptive Query Interaction Game
We image that peers in the system build their communication language in anadaptive process. Adaptation is fundamental, as we model a system of peers, byits nature highly dynamic and open to new peers’ entry. Each peer uses the sametext retrieval and linguistic analysis techniques. In particular, given a document
we denote by the set of keywords that result from text retrieval.1
Peers build their classifications of documents by using “contexts” and con-ceptualize the world by using features from the same set of features. Moreover,peers have preferences over the meaning of their language, language success andusage, as well as a lexicon, where each peer stores and updates words accordingto preferences’ evolution. A context is a simplified version of a concept hierarchy(see for instance [9]). We rely on the following definition.
Definition 1. A context is a concept hierarchy such that (a) each nodein C is labelled by a label from language (b) each node is (or “classifies”)documents from a set and (c) E induces a tree structure over C.
Intuitively, a context is created and managed according to the needs of each peer,for example by using a special editor, see [8,7]. For simplicity, given a document
in a context a peer uses an unique set of features for namely, the set ofpairs of the form where is a “keyword in extracted by using retrievaltechnique Text (·)—that is, and is weight, orpreference with respect to the context in which is classified. Note that aword has the same weight in the same context for each peer in the system.
2.1 Query-Answering Protocol: Routing
In introducing this paper, we have compared the problem of resource routing ina P2P network with query-answering. We continue along the same way.
Suppose that a user, in the role of a seeker, selects one or more providers asthe target peers for a query. Such query may be thought of as the keyword tomatch, in a routing problem, with the identifier of a node of the P2P network,namely, an attribute of the distributed hash table. There is no minimal require-ment about the peers’ capability to provide information in order to solve a query.The user the seeker and the target provider(s)—say, the “players,”continuously go through a loop performing the following actions (“game rules”):
Step 0. (Before the game starts - Lexicons initialization) Each concept node(C) in every context of each peer in the system is labelled by thesystem itself with a linguistic expression in the peer’s language. Suchlinguistic expression is formed by the conjunction of terms with
1 For space limitations, we refer to [5,3] for a detailed description of text retrieval andlinguistic analysis. Our presentation is self-contained, although, and basic terminol-ogy is introduced along the course of the paper.

88 A. Agostini and G. Moro
maximum weight computed on the set of documents in theconcept node C.
For each term in the quadruple is added to lexiconwith initial preference where
F is the set of features which uniquely characterizes C with respect tocontext repository, and and (“rate of success”).
Step 1. (Query Context choice) A context —called query context, isselected by the user. The context is used by the user to classify thedocuments in the seeker’s document repository. Only documents clas-sified by the selected context are assumed to be currently in the fieldof attention of the user.(Query Cluster and Focus identification) One document theexample) in the context’s domain is chosen by the user as the query—we call this action querying by example. The document determinesthe query cluster (K) . The path in the query context between thequery cluster and the root of the query context—in symbols
is called the focus of the query.
(Query formation) For every concept node in the focus, the seekercomputes the features that characterize with respect to (thatis, the setand retrieves the associated linguistic expressions (“concept labels”)from the lexicon. The seeker orders each linguistic expression accord-ing to decreasing preference (i.e., the sum of weight and rate of successof the linguistic expression in the lexicon). For linguistic expressionswith identical preference, the seeker takes first the linguistic expres-sion that appears first in the lexicon. The resulting sequence of labels
is called query expression.
(Query submission) The seeker sends to the target provider(s) thequery expression.
(Answer discovery - Language matching) An attempt is made byeach target provider to find possible features distinguishing the example
from the set of documents in a document repository local to theprovider.The provider’s attempt is made by accessing to the provider’s lexicon
essentially a kind of dynamic “local ontology” for somebody),according to linguistic expressions and their relative ordering in thequery expression.
(Answer submission) Suppose that is a term in the first linguis-tic expressions of the query expression such that appears in theprovider’s lexicon. Then, the provider sends to the seeker both andthe documents, or a suitable representation of them, possibly limited inthe number by a user-driven parameter) which are characterized by thefeatures (F) associated with in the provider’s lexicon with maximumpreference.
Step 2.
Step 3.
Step 4.
Step 5.
Step 6.

Identification of Communities of Peers 89
Step 7. (Answer evaluation and back propagation) The seeker evaluateseach received document against the example “vectorized” by a vec-tor composed by the weights (“inverse frequency”) of the terms con-tained in the query expression. Evaluation is computed according to alocal similarity metric and an user-driven parameter of acceptance (see[5,3] for technical details). The seeker sends back to the provider theresult of the evaluation, say a message: accepted / do not accepted).(Re-classification—context evolution) The documents that re-ceive positive evaluation are accepted—these documents are similarto the example. The seeker shows them to the user, who may decideto download or to store each document. The seeker might provide arecommendation to the user about the cluster in the focus to use forstoring. In this case, the documents are stored in the cluster correspond-ing to the successful linguistic expression in the query expression, Step6. Alternatively, an independent classification procedure can be used;among others we refer to [2].(Lexicon updating—winning associations) Suppose that the num-ber of accepted documents is at least one. Then, the seeker and theprovider increase the value of features (precisely, success rate asso-ciated to with maximum preference in their lexicon (cf. Steps 3, 6).The value of the updating is proportional to the number of accepteddocuments.At the same time, the seeker decreases the value of features associatedwith any term in the lexicon that appears in the query expressionexcept (“competing associations”). Similarly, the provider decreasesthe value of any set of features associated with in its lexicon thatdoes not characterize the documents sent to the seeker.(Lexicon updating—losing associations) Suppose that the num-ber of accepted documents is zero. Then, the seeker and the providerdecrease the value of features (i.e., success rate associated to withmaximum preference in their lexicon (cf. Steps 3, 6). The value of up-dating is proportional to the number of unaccepted documents.
Step 8.
Step 9.
Step 10.
On the basis of the foregoing steps, to be thought of as being performed atgeneric stage 2 we define the adaptive query interaction game
where is a query expression in the senseof Step 3. Observe: is a repeated game in the sense of game theory (cf. [21]).
3 Community Formation, Reputation, and Trust
The formation of collaboration networks is an important latent effect in manycomputational systems of peers. Importantly, given the diverse skills, language,local knowledge and knowledge representation models that such collaborative
2 Let N denote the set of natural numbers. For simplicity, in defining Steps 1-10 wehave omitted time sup- and sub-scripts from notation.

90 A. Agostini and G. Moro
peers involve, deciding which partners to cooperate with—what target providersan information seeker should have, see Step 4—is both critical and difficult. Theformation of collaborative communities is crucial for efficient resource routing inunstructured peer-to-peer systems.
Two particularly important factors that influence cooperative behavior ofpeers are trust and reputation. In this section, we show how these factors con-tribute to community building through the analysis of query results and, as amain consequence, to the semantic routing of resources in P2P systems.
3.1 Query Propagation—Trust
We have seen how local knowledge, structured in a context, is used by a peer inthe role of a seeker to make a query. After query formulation, the seeker checkswhat peers are connected (“active”) and chooses, among those connected, thepeer(s) to send the query to. A query session is then opened to manage theanswers from each peer, or from the peers that are connected with the peerin charge to solve the query. Now, what “strategy” the seeker uses to select aprovider and what referrals from the providers it uses to select the most relevantprovider to solve the query is an important issue that we have not discussed sofar. We discuss the issue below. An interesting and quite related paper aboutthis topic is [33]; other references are listed therein.
Trust and reputation are complex, multifaceted issues and are related toother themes such as risk, competence, security, beliefs and perceptions, utilityand benefit, and expertise [26]. In the selection of trustworthy peers, reputationbecomes significant. You can think of reputation as the expectation about apeer’s future behavior based on information about the peer’s past behavior.
The automatic generation of a trust rating for peers—and therefore the iden-tification of hubs—deserves thorough investigation, for which reason we now relyon the routing mechanism of Section 2. Formally, we introduce the following def-inition. (Recall that by N we denote the set {0,1,2,...} of natural numbers.)
Definition 2. Let peers and query expression com-puted at time by in Step 3 of repeated game be given. We say thattrust over Q at just in case
where in is calculated by restricting to the interac-tions of in the game up to stage We write todenote that trust over Q at some time.
Let peer in the role of a seeker be given. The seeker faces the problem ofselecting who among the peers is able to solve a query Q with highest prob-ability, or who makes the most progress towards solving the query. To decide,the seeker constructs a list of peers to contact. After a finite number of

Identification of Communities of Peers 91
repeated playing of the adaptive query interaction game the seeker managesa list of trusted peers to whom submit the query. The list isconventionally ordered according to decreasing trust:
The seeker’ strategy of query resolution is then clear. The seeker first asks tosecond to finally to if it has not obtained relevant answers from previouspeers in the list. It is important to note that the list of trusted peers evolveswith the system. The game history suggests to each peer what peers are the“trusted-best” providers to solve specific queries. A further question arises: Howa peer who receives a query for which it is not responsible propagates the queryto relevant peers, at the least able to make some progress towards solving thequery?3 In the next subsection, we define “relevant” peers in terms of reputation.
3.2 Reputation Systems and Communities
Most existing reputation systems [25] require a central server to store and dis-tribute the available information about trust and reputation of peers concerned;see for instance [32] for references. A challenge, see also [32], is to build a decen-tralized, scalable P2P trust management system that is efficient in both trustcomputation and trust data storage.
A reputation system of peers collects, distributes, and aggregates feedbackabout peers’ past behavior. Following [25], a reputation system requires at leastthree properties to operate: a. peers are “long-lived,” so that there is an expecta-tion of future interaction; b. feedback about current interactions is captured, ex-plicitely represented and distributed into the P2P network, so that it is availableto all peers in all future transactions; c. feedback about current interactions be-comes past feedback, which is paid attention to by the peers in making decisions.These requirements are at the basis of the following definition of “reputation.”
Definition 3. Let peer and query expression com-puted at time by some peer in Step 3 of repeated game be given. Wedefine the reputation of over Q at as follows.
where denotes the set of active peers in the system at time We define thereputation of symbols the maximum reputation ofover every query expression Q computed at time by some peer except
By a mechanism of query propagation, it is always possible that results fora given query come from peers that the seeker has not directly asked to solve.3 This question emphasizes the concept of progressive solution of a query, which is an
important focus of the evolutive, self-adapting approach of this paper.

92 A. Agostini and G. Moro
In order to define such mechanism, we have to define the “propagation space,”namely, the set of active peers to whom the seeker should send the query. We nowintroduce the notion of community as our proposal for a propagation space.In particular, the next definition presents the concept of a “community of peers”in terms of the reputation that each active peer has gained in the system.
Definition 4. Let query expression Q computed at time by some peer inStep 3 of repeated game be given. We define a community of peers for Qat time in symbols
where denotes the set of active peers in the system at time
We return to query propagation and suppose that a peer (the seeker) aims tosolve a query Q at any stage of game We propose the following strategyto propagate Q over the network of peers, who interact pairwise by playing
At time the seeker first looks at community and choosesone peer in the community. The seeker’s decision within the selected communityis based on internal preferences, or simply “it takes it random.” Let be thechosen peer. Then, either solves the query directly, if it is able to do so,or submits Q to a third-party peer in the community so that Qpropagates from to through Again, decision on what peer in theselected community to submit the query is open to personal preference and otherfactors, like for example user-interaction design and computational efficiency,which we do not investigate in this paper. Similarly, propagation of Q runs untileither Q is solved or there are no new members to whom submit the query. Inthe former case, solution is back-propagated to through all peers concerned(“propagation chain”); lexicon of the peers in the chain is updated to enforcewinning associations (Step 9) in future interactions. In the latter case, a failuremessage is propagated backwards to together with feedback from each peer inthe propagation chain according to Step 10 of the game.
As an important consequence of the foregoing procedure of query propaga-tion, communities evolve with time, because reputation of each member of acommunity modifies according to success or failure in solving the query.New members may entry while some old members may leave out.
4 Conclusion
The approach to semantic routing in P2P networks that we have presented inthis paper is based on trust management and reputation. Starting from an adap-tive mechanism of query-answering, a kind of repeated game, we have definedthe reputation of each peer, in order to be able to logically cluster the P2P net-work by its contents, each forming a reputation-based community of peers withsimilar semantics. As a main consequence, the P2P network self-organizes, and

Identification of Communities of Peers 93
the network clustering is not imposed, but rather emerges gradually by point-to-point interaction among the peers with the highest reputation. Communitiesof peers have been finally used to advance our proposal for semantic routing.
Our framework is useful to construct a variety of peer-to-peer applicationswhere the “problem of naming” is relevant. Our approach has been inspired bylanguage games [31] and by self-organizing distributed data structures [13], andsome seminal ideas on naming games in artificial intelligence and robotics [27,28] and advertising games [4] have been used.
Experimental work remains to be done to demonstrate the practical benefitsof our model to peers’ selection and effective resource routing. Initial experimen-tal setting is in progress within a system of knowledge exchange [8,7,3].
References
1.
2.
3.
4.
5.
6.
7.
8.
9.
K. Aberer and Z. Despotovic. Managing trust in a peer-to-peer information system.In H. Paques, L. Liu, and D. Grossman, editors, Proceedings of CIKM-01, pages310–317, New York, NY, 2001. ACM Press.G. Adami, P. Avesani, and D. Sona. Bootstrapping for hierarchical documentclassification. In Proceedings of the Twelfth ACM International Conference onInformationand Knowledge Management(CIKM-03), pages 295–302, New York,USA, 2003. ACM Press.A. Agostini. SDS games: Similar documents service by games. Technical report,ITC-IRST, Trento, Italy, May 2004.A. Agostini and P. Avesani. Advertising games for web services. In R. Meersman,Z. Tari, and D. Schmit, editors, Proceedings of the Eleventh International Con-ference on Cooperative Information Systems (CoopIS-03), pages 93–110, BerlinHeidelberg, 2003. Springer-Verlag LNCS 2888.A. Agostini and P. Avesani. Adaptive querying to knowledge exchange. Technicalreport, ITC-IRST, Trento, Italy, January 2004.A. Agostini and P. Avesani. On the discovery of the semantic context of queriesby game-playing. In Proceedings of the Sixth International Conference On FlexibleQuery Answering Systems (FQAS-04), pages 203–216, Berlin Heidelberg, 2004.Springer-Verlag LNAI 3055.M. Bonifacio, P. Bouquet, G. Mameli, and M. Nori. KEx: A Peer-to-Peer solutionfor distributed knowledge management. In Proceedings of the Fourth InternationalConference on Practical Aspects of Knowledge Management (PAKM-02), pages490–500, Heidelberg, 2002. Springer-Verlag LNAI 2569.M. Bonifacio, P. Bouquet, G. Mameli, and M. Nori. Peer - mediated distributedknowledge management. In Proceedings of AAAI Spring Symposium on Agent Me-diated Knowledge Management (AMKM-03), Stanford, CA, 2003. Stanford Uni-versity.A. Büchner, M. Ranta, J. Hughes, and M. Mäntylä. Semantic information media-tion among multiple product ontologies. In Proceedings of IDPT-99, 1999.P. Dell’Acqua, L. M. Pereira, and A. Vitória. User preference information in queryanswering. In T. Andreasen, A. Motro, H. Christiansen, and H. L. Larsen, editors,Proceedings of FQAS-02, pages 163–173, Berlin Heidelberg, 2002. Springer-VerlagLNAI 2522.G. W. Flake, S. Lawrence, C. L. Giles, and F. M. Coetzee. Self-organization andidentification of Web communities. IEEE Computer, 35(3):66–71, 2002.
10.
11.

94 A. Agostini and G. Moro
12.
13.
14.
15.
16.
17.
18.
19.
20.
21.
22.
23.
24.
25.
26.
27.
28.
29.
G. Moro, A. M. Ouksel, C. Sartori. Agents and peer-to-peer computing: A promis-ing combination of paradigms. In Proceedings of AP2PC-02, Bologna, Italy, 2002.pages 1–14. Springer-Verlag LNCS 2530.A. M. Ouksel, G. Moro. G-Grid: A Class of Scalable and Self-Organizing DataStructures for Multi-dimensional Querying and Content Routing in P2P Networks.In Proceedings of AP2PC-03, Melbourne, Australia, 2003. pages 78–89. Springer-Verlag LNCS 2872.T. Gaasterland, P. Godfrey, and J. Minker. An overview of cooperative answering.Journal of Intelligent Information Systems, 1(2):123–157, 1992.H. Grice. Logic and Conversation. In P. Cole and J. Morgan, editors, Syntax andSemantics. Academic Press, New York, 1975.Gene Kan. Peer-to-Peer: Harnessing the Benefits of Disruptive Technologies, chap-ter 8, pages 94–122. O’Reilly & Associates, 2001.M. S. Khambatti, K. D. Ryu, and P. Dasgupta. Efficient discovery of implicitlyformed peer-to-peer communities. International Journal of Parallel and DistributedSystems and Networks, 5(4): 155–163, 2002.J. Kubiatowicz, D. Bindel, Y. Chen, P. Eaton, D. Geels, R. Gummadi, S. Rhea, H.Weatherspoon, W. Weimer, C. Wells, and B. Zhao. Oceanstore: An architecturefor global-scale persistent storage. In Proceedings of ACM ASPLOS, volume 35,pages 190–201. ACM, November 2000.P. S. Marsh. Formalising Trust as a Computational Concept. PhD thesis, Univer-sity of Stirling, 1994.J. Minker. An overview of cooperative answering in databases (invited paper). InT. Andreasen, H. Christiansen, and H. L. Larsen, editors, Proceedings of FQAS-98,pages 282–285, Berlin Heidelberg, 1998. Springer-Verlag LNCS 1495.M. J. Osborne and A. Rubinstein. A Course in Game Theory. The MIT Press,Cambridge, MA, 1994.O. F. Rana and A. Hinze. Trust and reputation in dynamic scientific communities.IEEE Distributed Systems Online, 5(1), 2004.Sylvia Ratnasamy, Paul Francis, Mark Handley, Richard Karp, and Scott Shenker.A scalable content addressable network. In Proceedings of ACM SIGCOMM 2001,pages 161–172, 2001.Sylvia Ratnasamy, Scott Shenker, and Ion Stoica. Routing algorithms for DHTs:Some open questions. In 1st IPTPS, 2002.P. Resnick, R. Zeckhauser, E. Friedman, and K. Kuwabara. Reputation systems.Communications of the ACM, 43(12):45–48, 2000.J. Sabater and C. Sierra. REGRET: A reputation in gregarious societies. InJ. P. Müller, E. Andre, S. Sen, and C. Frasson, editors, Proceedings of AGENTS-01, pages 194–195, New York, NY, 2001. ACM Press. Also IIIA Techni-cal Report, Artificial Intelligence Research Institute, Spain. Available online atwww.iiia.csic.es/ sierra/articles/2001/reputation.pdf.L. Steels. Self-organizing vocabularies. In C. Langton and T. Shimohara, editors,Proceedings of the V Alife Conference, Cambridge, MA, 1996. The MIT Press.L. Steels and A. McIntyre. Spatially distributed naming games. Advances inComplex Systems, 1(4):301–324, 1998.Ion Stoica, Robert Morris, David Karger, M. Francs Kaashoek, and Hari Balakr-ishnan. Chord: A scalable peer-to-peer lookup service for internet applications. InSIGCOMM, pages 149–160. ACM Press, 2001.

Identification of Communities of Peers 95
30.
31.32.
33.
34.
A. Trigoni. Interactive query formulation in semistructured databases. In T. An-dreasen, A. Motro, H. Christiansen, and H. L. Larsen, editors, Proceedings of theFifth International Conference on Flexible Query Answering Systems (FQAS-02),pages 356–369, Berlin Heidelberg, 2002. Springer-Verlag LNAI 2522.L. Wittgenstein. Philosophical Investigations. Blackwell, Oxford, UK, 1953.L. Xiong and L. Liu. PeerTrust: Supporting reputation-based trust for peer-to-peerelectronic communities. IEEE Transactions on Knowledge and Data Engineering(TKDE), Special Issue on Peer-to-Peer Based Data Management, 2004. To appear.P. Yolum and M. P. Singh. Emergent properties of Referral Systems. In J. S.Rosenschein, T. Sandholm, M. Wooldridge, and M. Yokoo, editors, Proceedings ofthe Second International Joint Conference on Autonomous Agents and MultiagentSystems (AAMAS-03), pages 592–599, New York, NY, 2003. ACM Press.B. Yu and M. P. Singh. A social mechanism of reputation management in electroniccommunities. In M. Klush and L. Kerschberg, editors, Proceedings of the FourthInternational Workshop on Cooperative Information Agents (CIA-00), Berlin Hei-delberg, 2000. Springer-Verlag LNAI 1860.

Integration of B2B Logistics Using Semantic WebServices
Javier Esplugas Cuadrado, Chris Preist, and Stuart Williams
HP Labs, Filton Rd, Stoke Gifford, Bristol BS32 8QZ, [email protected]
[email protected]@hp.com
Abstract. In this paper, we present a case study about the integration of a newpartner into a freight logistics chain using semantic web services. We do this inthe context of conceptual architecture of the EU Semantic Web-enabled WebServices project [5]. The case study is based on the process of substituting oneof our freight forwarders (ocean shipping) with another logistic partner. Theresult of substitution must be the same functionally as existed before thesubstitution. We present the service description requirements which weencountered during its development. We discuss our experiences in usingOWL-S to describe the services.
Keywords: Logistics, Semantic Web Services, Enterprise Integration, SCM
1 Introduction
In a world where global outsourcing and business-to-business integration arecommonplace in product manufacturing, logistics interactions are becoming more andmore significant. The prices of logistic transportation are between 4.1 % (Topperformers) and 5.3 % (on average) of the cost of product development, excluding thecosts of inventory[1]; When this is also included, logistics costs can reach as high as13.7%. In a $100 Billion industry such an overhead is significant. Hence the selectionof the right logistics provider in terms of price competitiveness and efficiencybecomes critical for any enterprise. In a B2B context, logistics interactions betweenparties are supported by the use of electronic message exchanges. There are 3 mainmessaging standards used to do this; The UN-Standard EDIFact (Electronic DataInterchange for Administration Commerce & Transport) [2], the US-Standard ANSIX.12 [3] and more recently, RosettaNet PIPs (Partner Interchange Processes) [4].
One logistic shipment can use several freight forwarders (This is known as a multi-leg shipment). Management of such a shipment can be complex: Goods must transitsmoothly from one logistic provider to another, and the messages sent and receivedby the different parties must be coordinated. We consider a scenario in which there isa three-leg shipment taking place between a supplier in the UK and a manufacturingplant in Russia. Unexpectedly, logistics provider two (responsible for a shipmentbetween Southampton and St. Petersburg) is unable to provide the required service
C. Bussler and D. Fensel (Eds.): AIMSA 2004, LNAI 3192, pp. 96–105, 2004.© Springer-Verlag Berlin Heidelberg 2004

Integration of B2B Logistics Using Semantic Web Services 97
and must be substituted. The logistics coordinator is responsible for locating areplacement and integrating it seamlessly into the logistics chain.
Fig. 1. Multi-leg Shipment
In this paper we present the service description requirements which we encounteredduring the development of this case study. We do this in the context of the SWWSconceptual architecture [5]. Figure 2 shows how our case study is organized withinthis architecture. In section 2, we discuss the knowledge representation requirementson the logistics service description at the business layer of the architecture. This isdone in the context of a contract template, describing a set of possible logisticsservices. We also discuss how the discovery and pre-contractual conversationsassociated with the service are used to manipulate this contract template to come to anagreed definition of the service to be provided. In section 3, we discuss therequirements on the service description at the interaction layer of the architecture.
Fig. 2. Case study alignment with the EU SWWS Project Conceptual Architecture

98 J. Esplugas Cuadrado, C. Preist, and S. Williams
2 Service Discovery and Contract Formation
2.1 The Contract and the Contract Template
From the perspective of the business layer of the architecture, a logistic service ischaracterized by a set of parameters. These parameters are: start location; destinationlocation; start date/time; arrival date/time; number of packages; dimensions andweight of each package and the Incoterms to be provided. These parameters constitutethe terms of the service. For example, a specific service may be the shipping of 12pallets from Southampton to St. Petersburg, leaving at 10:00 AM on the 2nd of Juneto arrive by 10:00 PM on the 8th of June. In addition to its terms, a service will havepayment information; the price of the service, the means of payment and the terms ofpayment. Thirdly, at the interaction layer of the architecture, a service will haveinteraction information defining the format and sequencing of messages (according tosome message protocol or choreography) which will accompany its execution. Whenterms, payment and interaction information are agreed between a service provider andservice consumer, this constitutes a contract specifying exactly what service will beprovided.
The role of the discovery and contract formation phases are for a service requestorto locate a service provider and agree a definition of the service to be provided. Thekey document used during these phases is the contract template. A contract templatedescribes a contract as outlined above, but with all parameters left un-instantiated.
2.2 Discovery
During discovery, a service requestor interacts with a discovery service to determineif any service providers may be able to meet their needs. In the context of theconceptual architecture, the request and provider adverts consist of a contracttemplate with constraints on some of the parameters. For example, a logistics serviceprovider may advertise a contract template with the start location constrained to be aport in the UK and the destination to be a port in Russia, without specifying which,and leaving all other information (times, sizes, prices, etc) unconstrained. A requestormay state that they want a shipment of specific dimensions to leave Plymouthsometime after 10am on June to arrive in St Petersburg before midnight on June
Discovery consists of determining whether the two partially constrained templatesare compatible. The exact definition of compatibility is beyond the scope of thispaper. See [8] [9] for existing proposals. If two templates are compatible, then theadvertiser may be able to meet the requestor’s needs, and the two parties enter into apre-contractual conversation.
2.3 The Pre Contractual Phase
In the context of our case study, the pre-contractual phase consists of a set ofconversations between the requestor and the possible service providers located

Integration of B2B Logistics Using Semantic Web Services 99
through the discovery phase. The outcome, if successful, will be a specific contractagreed between the requestor and one service provider. Each conversation is a simplethree-stage exchange;
1.
2.
3.
The service requestor sends the provider a version of the contract templatewith parameters instantiated or constrained to define the class of service theyrequire. This would be similar to the constrained template used for discovery,described in section 2.2. The requestor may also provide a time deadline bywhich responses are required.
The service provider replies with all possible contract instances which satisfythe constrained template. This will include a fixed price for the service. Forexample, a provider could offer the service instance described in section 2.1for a price of £600.
The requestor selects one from the set of all responses, and sends anacceptance to the corresponding provider.
Note that such a protocol allows comparison but not negotiation of parameters such asprice.
2.4 Using OWL-S Within Contract Templates and Contracts
The contract templates and contracts we developed as part of our case study containOWL-S descriptions of services. This work has allowed us to identify areas whereOWL-S requires augmenting to handle our case study.In OWL-S, the service profile is the primary representation used for servicediscovery. It presents properties of the service such as: service name, servicecategory, contact information, and service provider ratings. It also describes therequired Inputs, Outputs, Preconditions and Effects of the service.
The OWL-S profile is primarily designed to categorise a service, rather than togive a complete and structured business-layer description of specifically what aservice provider offers. For this reason we have augmented it with a structureddescription of a logistics service, using a simple logistics ontology allowingrepresentation of appropriate geographical information (beyond ‘service radius’ ofOWL-S), information about container dimensions and weight, and Incoterms.
Furthermore, the OWL-S profile assumes that profile parameters are fullyinstantiated within an advertisement, which means it cannot be straightforwardly usedwithin a contract template and provides no means of constraining parameters. Toovercome this, we have developed a set of ‘constrained’ classes (e.g ‘UK port’,‘Before June etc) which can be used within the description of a serviceadvertisement or request. These are developed in OWL, which does not provide anymathematical reasoning, and hence the numerical range constraints (such as ‘BeforeJune are somewhat unnatural and are reasoned with by considering them as aset of instances.
The service profile currently (OWL v1.0) only provides a place-holder forpreconditions of the service, without defining any structure for them. In the pre-

100 J. Esplugas Cuadrado, .C. Preist, and S. Williams
contractual conversation we can expect a certain degree of flexibility in terms of theinputs used. For example, a service requester could either specify a pair of Date andtime structures (start & arrival), or a start date and time plus a maximum permittedtime for transportation. The different inputs will require different treatments by theservice interactions (as defined in the OWL-S process model). However, there is nomeans to specify how the existence or the absence of some inputs affects the processmodel interpretation. This lack of expressivity of dependencies between inputs andthe process model has also been observed [11] in a different application.
3 Description of the Service Execution
So far, we have focused our attention on the business-layer description of the logisticsservice. However, as we mentioned in section 2.1 a service also has an interactionlayer description, describing the possible exchanges of messages between providerand requestor which can occur as the service is executed. Such a description may alsobe decided as part of the contract agreement process. Within our case study, ouranalysis determined that, at a certain level of abstraction, there is one singleinteraction protocol which is used by most logistics services. This interaction protocolprovides for actioning and monitoring of the progress of the service provided by thefreight forwarded. The way in which protocol interactions are related to the lifecycleof the freight forwarding service is shown in Figure 3.
Awaiting action 1: An ASN (Advance Shipment Notice) message sequence will beinitiated by the Service Requester when it is about to deliver the shipment to thecollection site. Once the shipment is collected (no message sequence captures thisevent), the Service Requester can initiate an SSM (Shipment Status Message)message sequence at any time to receive status information from the serviceprovider.Active phase 2: An ASN message sequence will be initiated by the ServiceProvider when it is about to deliver the shipment to its final destination.Active phase 3: Once the ASN sequence of the previous phase has completed, theservice provider initiates both a POD (Proof of Delivery) and a FI (Freight Invoice)sequence. These sequences can occur in either order and indeed may overlap intime. The proof of delivery sequence informs the requestor that the delivery hasbeen made successfully, and the freight invoice sequence requests payment for theservice.Once the POD Sequence is finished, the service requester cannot initiate any moreSSM sequences and the communication for this specific service is finished.
Each message exchange sequence (ASN, POD, FI and SSM) is a two way messageexchange with no guarantee of security or delivery.In addition to this conversational behavior, partners also need to have a sharedunderstanding of the context in which the exchange occurs. Specifically, partnersneed to:

Integration of B2B Logistics Using Semantic Web Services 101
Share a common vocabulary of concepts used within messages. Currently,logistics partners do this by an informal shared understanding. In our case study,we use an ontology to formalize this vocabulary.Share a common understanding of how actions in the physical world relate to thesending/receiving of messages. For the purpose of this case study, we assume thisunderstanding is implicit. Figure 3 shows the model used.
Fig. 3. Freight forwarding life-cycle
The abstract protocol can be implemented using any of the three standards(RosettaNet, EDIFact or X.12) and there may be differences between the way twologistics providers use the same standard. For this reason, two logistics partners mayuse quite different concrete realizations of the same abstract protocol. Hence, there isan important role for protocol mediation in this case study. However, discussion ofthis is beyond the scope of this paper and we present a single protocol based on theway these standards are typically used.
We now show how we create a description of the service execution protocol.Firstly we develop a complete specification of the protocol as a state machine fromthe perspective of each of the participants. This complete specification containsfeatures which cannot currently be captured in the OWL-S process model. For thatreason, we transform this state machine into a simpler process algebra representation,omitting such features. This can then be represented using the OWL-S process model.
In figure 4, we present the overall architecture of interaction. The service providerand consumer implement an abstract state machine embodying the behaviour required

102 J. Esplugas Cuadrado, .C. Preist, and S. Williams
by the protocol. The required exchange of messages for ASN, SSM, POD and FIinteractions are implemented using web service technology. The combination of allthese web services results in the required abstract state machine.
The state machine giving a complete specification of the protocol from theperspective of the service provider is shown in figure 5. It shows how the sequencesof business actions are translated into lower-level message request/indications. Wecan’t make any assumptions on the reliability of the communications channel,therefore we must ensure that any state can receive/send re-transmits, can handle lossof confirmations, etc. To achieve the necessary degree of control we use timers anddynamically assigned variables (e.g. Max-Retransmissions = 5). In the interests ofspace, we have omitted the SSM message sequence from this state machine.
Fig. 4. Service-to-Service Abstract State machine conceptualization
OWL-S is neither able to represent timers nor exception handling. This need forexception handlers was already presented by Fensel and Bussler in [16]. For thisreason, we present a simplified description of this protocol using process algebra(This time we include the SSM exchange) [10]. Again, this is from the perspective ofthe service provider. The description is in CCS [11] and has been implemented on theEdinburgh Concurrency Workbench [13]With the exception of the omission of timeout information and exception handling,this is equivalent to the complete protocol presented in Figure 5. In Figure 6, weprovide a UML process sequence diagram of the process algebra description.

Integration of B2B Logistics Using Semantic Web Services 103
Fig. 5. The Service Provider State Machine

104 J. Esplugas Cuadrado, .C. Preist, and S. Williams
Fig. 6. UML Specification of the Process sequence
Implementing the Service Execution Model in OWL-S
We have implemented the process specified above using the OWL-S process model.The complete model is provided in [14], and mirrors closely the structure of Figure 6.For example, the split occurring at the second stage of the overall process isrepresented as follows;
The requirements of our case study went beyond the capabilities of the OWL-S 1.0process model in several ways. As we explained earlier, our protocol required thespecification of timeouts (requiring timers in the process language) and exceptionhandling. Furthermore, OWL-S 1.0 does not handle the synchronisation of parallelprocesses with the degree of control our application requires. Specifically, we want tosynchronise any SSM_RECEIVED process to terminate when the POD_SENTprocess has been successfully completed, as SSM messages are no longer valid afterthis point. However, the ‘join’ operator of OWL-S only allows the joining of processeswhich previously were generated in the same split, so cannot synchronise two parallelprocesses which were initiated independently.

Integration of B2B Logistics Using Semantic Web Services 105
4 First Conclusions and Further Work
In this paper, we have presented a case study for semantic web services based on amulti-leg freight transportation scenario. We have also presented our experiences withapplying existing semantic web services technology, in the form of OWL-S 1.0.Specifically, we identified the following requirements not currently met;
1.2.3.4.5.
A more structured model of services at the ‘business’ layer of abstraction.An ability to constrain service parameters in advertisements and requests.Representation of timers in service process models.Handling of exceptions in service process models.Complex synchronization of parallel processes in service process models.
We are currently working in conjunction with others in the SWWS consortium onthe design of a service description language able to meet requirements 1 and 2 and aconversation/choreography language able to meet requirements 3-5. We hope ourexperiences in this will feed into future versions of WSMO [15] and OWL-S [6]
References
[1]
[2]
[3][4][5]
[6]
[7]
[8]
[9]
[10]
[11]
[12][13]
[14]
[15]
[16]
McKinsey and Institute fur Supply Chain Management. Survey over 40 Multinationalsand Consumer Goods in Europe. 2002-03EDIFACT- United Nations Directories for Electronic Data Interchange forAdministration, Commerce and Transport. Available atwww.unece.org/trade/untdid/texts/unredi.htmX.12 - Accredited Standards Committee Reference Web-Site at http://www.x12.org.RosettaNet Consortium Reference Web-Site www.rosettanet.org.Preist, C. A Conceptual Architecture for Semantic Web Services, submitted toInternational Semantic Web Conference (ISWC2004), Hiroshima, JapanThe OWL Services Coalition, OWL-S: Semantic Mark-up for Web Services v.1.0.Available at http://www.daml.org/services/owl-s/1.0/owl-s.pdfThe DAML/OWL Services Coalition, DAML-S: Semantic Markup for Web Servicesv.0.9. Available at http://www.daml.org/services/daml-s/0.9/daml-s.pdfPaolucci, M., Kawamura, T., Payne, T.R. and Sycara, K: Semantic Matching of WebService Capabilities. Proc. International Semantic Web Conference (2002) 333-347Trastour, D., Bartolini, C. and Gonzalez-Castillo,J.: A Semantic Web Approach to ServiceDescription for Matchmaking of Services. In Proceedings of the Semantic Web WorkingSymposium, Stanford, CA, USA, July 30 - August 1, 2001Object Management Group. OMG Unified Modelling Language Specification v1.5 formal2003-03-1. Available at http://www.omg.org/docs/formal/03-03-01.pdfRichards D., Sabou M. Semantic Markup for Semantic Web Tools: A DAML-Sdescription of an RDF-Store. In: Proceedings of the Second International Semantic WebConference (ISWC2003), Florida, USA, 20-23 October 2003CSS Process Algebra - Milner, R., Communication and Concurrency. Prentice Hall, 1989Faron Moller, Perdita Stevens. The Edinburgh Concurrency Workbench. Reference WebSitewww.dcs.ed.ac.uk/home/cwb/Javier Esplugas, Chris Preist, Stuart Williams. 2003. SWWS - D8.2 Ontologies &ServicesDumitru Roman, Holger Lausen, Uwe Keller. 2004. The Web Service ModellingOntology WSMO. Available online via http://www.wsmo.org/papers/deliverablesFensel D. and Bussler C. 2002. The Web Service Modeling Framework WSMF.ElectronicCommerce: Research and Applications, 1 (2002) 113-117.

Planning and Monitoring Web Service Composition*
M. Pistore1, F. Barbon2, P. Bertoli2, D. Shaparau2, and P. Traverso2
1 University of Trento - [email protected]
2 ITC-irst - Trento - ITALY{barbon,bertoli,traverso,shaparau}@irst.itc.it
Abstract. The ability to automatically compose web services, and to monitortheir execution, is an essential step to substantially decrease time and costs inthe development, integration, and maintenance of complex services. In this paper,we exploit techniques based on the “Planning as Model Checking” approach toautomatically compose web services and synthesize monitoring components. Byrelying on such a flexible technology, we are able to deal with the difficultiesstemming from the unpredictability of external partner services, the opaquenessof their internal status, and the presence of complex behavioral requirements. Wetest our approach on a simple, yet realistic example; the results provide a witnessto the potentiality of this approach.
1 Introduction
The emerging paradigm of web services provides the basis for the interaction and coor-dination of business processes that are distributed among different organizations, whichcan exchange services and can cooperate to provide better services, e.g., to third par-ties organizations or to individuals. One of the big challenges for the taking up of webservices is the provision of computer automated support to the composition of serviceoriented distributed processes, in order to decrease efforts, time, and costs in their devel-opment, integration, and maintenance. The ability to automatically plan the compositionof web services, and to monitor their execution is therefore an essential step toward thereal usage of web services.
BPEL4WS (Business Process Execution Language for Web Services) [1] is an emerg-ing standard for the specification and execution of service oriented business processes.BPEL4WS has been designed with two functions in mind. On the one hand, executableBPEL4WS programs allow the specification and execution of the processes internalto an organization (internal processes in the following). On the other hand, abstractBPEL4WS specifications can be used to specify and publish the protocol that externalagents have to follow to interact with a web service (external protocols in the following).Therefore, BPEL4WS offers the natural starting point for web service composition.
In this paper, we devise a planning technique for the automated composition and au-tomated monitoring of web services. Automated composition allows providing services
The work is partially funded by the FIRB-MIUR project RBNE0195K5, “Knowledge LevelAutomated Software Engineering”.
C. Bussler and D. Fensel (Eds.): AIMSA 2004, LNAI 3192, pp. 106–115, 2004.© Springer-Verlag Berlin Heidelberg 2004
*

Planning and Monitoring Web Service Composition 107
that combine other, possibly distributed, services, in order to achieve a given businessgoal. Starting from the description of the external protocols (e.g., expressed as an ab-stract BPEL4WS specification) and given a “business requirement” for the process (i.e.the goal it should satisfy, expressed in a proper goal language), the planner synthesizesautomatically the code that implements the internal process and exploits the servicesof the partners to achieve the goal. This code can be expressed in a process executionlanguage such as executable BPEL4WS.
Our planning techniques are also exploited to automatically generate a monitor ofthe process, i.e., a piece of code that is able to detect and signal whether the externalpartners do not behave consistently with the specified protocols. This is vital for thepractical application of web services. Run-time misbehaviors may take place even forautomatically composed (and possibly validated) services, e.g. due to failures of the un-derlying message-passing infrastructure, or due to errors or changes in the specificationof external web services.
In order to achieve these results, our planner must address the following difficulties,which are typical of planning under uncertainty:
Nondeterminism: The planner cannot foresee the actual interaction that will takeplace with external processes, e.g., it cannot predict a priori whether the answer toa request for availability will be positive or negative, whether a user will confirm ornot acceptance of a service, etc.Partial Observability: The planner can only observe the communications withexternal processes; that is, it has no access to their internal status and variables. Forinstance, the planner cannot know a priori the list of items available for selling froma service.Extended Goals: Business requirements often involve complex conditions on thebehavior of the process, and not only on its final state. For instance, we might requirethat the process never gets to the state where it buys an item costing more than theavailable budget. Moreover, requirements need to express conditional preferenceson different goals to achieve. For instance, a process should try first to reserveand confirm both a flight and an hotel from two different service providers, andonly if one of the two services is not available, it should fall back and cancel bothreservations.
We address these problems by developing planning techniques based on the “Planningas model checking” approach, which has been devised to deal with nondeterministic do-mains, partial observability, and extended goals. A protocol specification for the availableexternal services is seen as a nondeterministic and partially observable domain, whichis represented by means of a finite state machine. Business requirements are expressedin the EaGLe goal language [8], and are used to drive the search in the domain, in or-der to synthesize a plan corresponding to the internal process defining the web-servicecomposition. Plan generation takes advantage of symbolic model checking techniques,that compactly represent the search space deriving from nondeterministic and partiallyobservable domains. These are also exploited to produce compact monitoring automatathat are capable to trace the run-time evolution of external processes, and thus to detectincorrect interactions.

108 M. Pistore et al.
In this paper, we define the framework for the planning of composition and mon-itoring of distributed web services, describe it through an explanatory example, andimplement the planning algorithm in the MBP planner. We provide an experimentalevaluation which witnesses the potentialities of our approach.
2 A Web-Service Composition Domain
Our reference example consists in providing a furniture purchase & delivery service. Wedo so by combining two separate, independent existing services: a furniture producer,and a delivery service.
We now describe the protocols that define the interactions with the existing services.These protocols can be seen as very high level descriptions of the BPEL4WS externalprotocols that would define the services in a real application.
The protocol provided by the furniture producer is depicted in Fig. 1.3. The protocolbecomes active upon a request for a given item; the item may be available or not — inthe latter case, this is signaled to the request applicant, and the protocol terminates withfailure. In case the item is available, the applicant is notified with informations about theproduct, and the protocol stops waiting for either a positive or negative acknowledgment,upon which it either continues, or stops failing. Should the applicant decide that the offeris acceptable, the service provides him with the cost and production time; once more,the protocol waits for a positive or negative acknowledgment, this time terminating inany case (with success or failure).
The protocol provided by the delivery service is depicted in Fig. 1.2. The protocolstarts upon a request for transporting an object of a given size to a given location. Thismight not be possible, in which case the applicant is notified, and the protocol terminatesfailing. Otherwise, a cost and delivery time are computed and signaled to the applicant;the protocol suspends for either a positive or negative acknowledgment, terminating(with success or failure respectively) upon its reception.
The idea is that of combining these services so that the user may directly ask thecombined service to purchase and deliver a given item at a given place. To do so, weexploit a description of the expected protocol the user will execute when interacting withthe service. According to the protocol (see Fig. 1.1), the user sends a request to get agiven item at a given location, and expects either a signal that this is not possible (inwhich case the protocol terminates, failing), or an offer indicating the price and cost ofthe service. At this time, the user may either accept or refuse the offer, terminating itsinteraction in both cases.
Thus a typical (nominal) interaction between the user, the combined purchase &delivery service P&S, the producer, and the shipper would go as follows:
1.2.
3.
4.
the user asks P&S for a certain item I, that he wants to be transported at location L;P&S asks the producer some data about the item, namely its size, the cost, and howmuch time does it take to produce it;P&S asks the delivery service the price and cost of transporting an object of such asize to L;P&S provides the user a proposal which takes into account the overall cost (plus anadded cost for P&S) and time to achieve its goal;

Planning and Monitoring Web Service Composition 109
Fig.1. The protocols and their combination.
5. the user confirms its order, which is dispatched by P&S to the delivery and producer.
Of course this is only the nominal case, and other interactions should be considered, e.g.,for the cases the producer and/or delivery services are not able to satisfy the request, orthe user refuses the final offer.
3 Planning via Model Checking
The “Planning as Model Checking” framework [5] is a general framework for planningunder uncertainty. It allows for non-determinism in the initial state and in the outcomeof action execution. It allows modeling planning domains with different degrees of run-time observability, where e.g. the domain state is only partially visible via sensing, and

110 M. Pistore et al.
for expressing temporally extended planning goals, i.e., goals that define conditions onsequences of states resulting from the execution of a plan, rather than just on final states.
In this framework, a domain is a model of a generic system with its own dynamics;formally, it is expressed as a (non-deterministic) finite state automaton. The domain iscontrolled by a plan which is also represented as a (deterministic) finite state automaton.During execution, the plan produces actions, which constitute the input of the domain,on the basis of the sensing coming from the domain and of its internal state. In turn, thedomain evolves its state in response to the action, and produced a new output. That is,the execution can be seen as the evolution of the synchronous product of the automata(formal details are presented in [5]).
This generality involves a high complexity in the plan synthesis. In particular, partialobservability involves the need for dealing with uncertainty about the current domainstate: at every plan execution step, the executor must consider a set of equally plausiblestates, also called a belief state or simply belief [7,4]. When searching for a plan, alsothe planner must consider beliefs and the result of actions and sensing over them. There-fore, the search in a partially observable domain can be described as search inside acorrespondent fully observable “belief-level”, or knowledge-level, domain whosestates are the beliefs of Knowledge-level domain can be produced by a power-setconstruction upon
This leads to the important consequence that planning under partial observabilitycan be performed by planning for full observability over the associated knowledge-leveldomain [3]:
Fact 1 Let be a ground-level domain and be a knowledge-level goal for Let alsobe the knowledge level domain for Then is a plan that achieves on if, and
only if, achieves (the knowledge-level interpretation of) on
Also notice that the knowledge-level domain describes all the valid observable be-haviors of the domain. Therefore, we can use it as a monitor, to check at run time whetherthe domain really behaves as predicted in the domain model.
In the “Planning as Model Checking” framework, extended goals have been origi-nally expressed as CTL [10] formulas, inheriting a standard semantics over the executionstructure. Planning with CTL goals has been studied in [13,14] under the hypothesis offull observability and in [5,3] in the more general case of partial observability. However,CTL is often inadequate for planning, since it cannot express crucial aspects such as fail-ure and recovery conditions, intentionality, and preferences amongst sub-goals. EaGLe[8] has been designed with the purpose to overcome these limitations of CTL and to pro-vide a language for temporally extended planning goals in non-deterministic domains.EaGLe constructs permit to express goals of different strength (e.g. DoReach requiresachieving while TryReach requires the controller to do its best to achieve but ad-mits not reaching it); they handle failure, and sub-goal preferences (namely, in Failgoal is considered first, and only if its achievement or maintenance fails, then goalis used as a recovery or second-choice goal). The combination of these concepts is verypowerful, and allows expressing goals such as e.g. TryReach Fail DoReach here,the sub-goal TryReach requires to find a plan that tries to reach condition Duringthe execution of the plan, a state may be reached from which it is not possible to reach

Planning and Monitoring Web Service Composition 111
When such a state is reached, goal TryReach fails and the recovery goal DoReachis considered. A formal semantics and a planning algorithm for EaGLe goals in fullyobservable domains appears in [8].
4 Planning for Web-Service Composition
In this section we describe how the techniques provided by the planning as modelchecking framework can be applied to solve the problem of planning and monitoring ofweb-service composition.
The first step to model the domain, and to put ourselves in a position to synthesizea combined web service, is to model each of the protocols of the external partners as aplanning domain. The states of the domain are used to codify the states of the protocol,the current values of the variables, and the contents of the input and output channels.
The modeling of the state of the protocol and of its variables is straightforward. Themodeling of channels is more complex; each channel features a channel state (empty orfull), and in case it is full, auxiliary variables are used to store the values carried by thechannel. For instance, in the case of the shipper, the input channel REQUEST conveys theitem size and the location as data, and is hence modeled with variables REQUEST.STATUS,
REQUEST.SIZE, and REQUEST.LOC.
The only actions in the model correspond to channel read/write operations, sincethese are the only operations available to an external agent for controlling the evolutionof the protocol. A receive action can only be executed on an output channel of theprotocol which is full; its execution empties the channel and updates the protocol state.A send action, on the other hand, is possible only on an empty input channel of theprotocol; if the input channel carries values, the action also specifies the actual valuestransmitted on the channel; when this action is executed, the channel is marked as full,and the transmitted values are stored in the appropriate channel variables.
The transitions in the model capture different aspects of the evolution of the system.From one side, they describe the update of the channel variables due to send/receiveactions executed by the agent interacting with the protocol. From the other side, theymodel the internal evolution of the protocol. This internal evolution may correspond to thereceive/send operations complementary to the send/receive actions executed externally.Also, it may correspond to updates in the internal variables, when assignment steps of theprotocols are executed. Finally, no-op transitions are introduced to model the possibilityof protocols being idle.
The observations of the protocol are limited to the status of the input and outputchannels and to the values contained in a channel when it is read.
This construction defines the ground domain for each of the external partners. Givenone of these ground domains, we can perform the power-set construction to obtain theassociated knowledge level domain, which is used as a run-time monitor to check whetherthe behaviors of the external partners conform to the protocol, and trigger an appropriatehandling of failures. (It is easy to extend it with a time-out mechanism to also trap theundesired condition where a portion of some protocol is stuck.)
The goal of the planning task is to synthesize the process that interacts with the threeexternal processes in order to provide the purchase & delivery service to the users. The
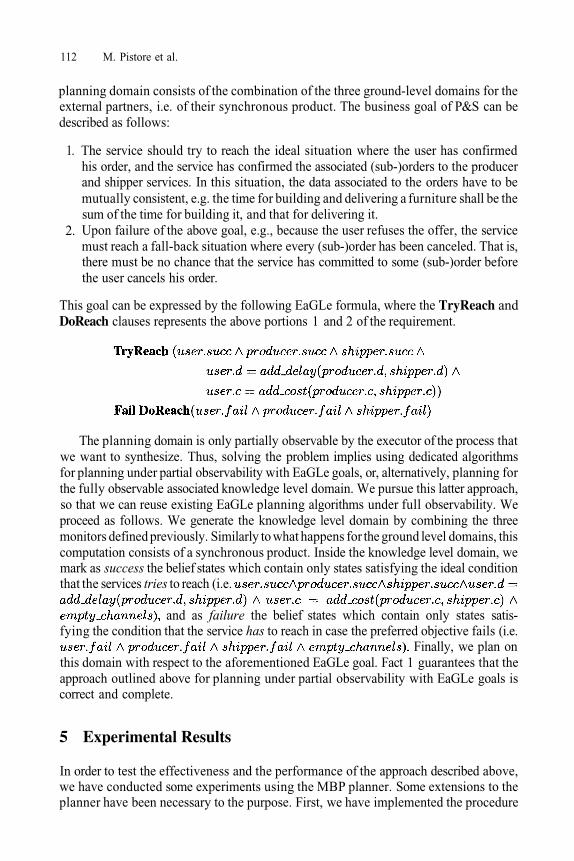
112 M. Pistore et al.
planning domain consists of the combination of the three ground-level domains for theexternal partners, i.e. of their synchronous product. The business goal of P&S can bedescribed as follows:
1.
2.
The service should try to reach the ideal situation where the user has confirmedhis order, and the service has confirmed the associated (sub-)orders to the producerand shipper services. In this situation, the data associated to the orders have to bemutually consistent, e.g. the time for building and delivering a furniture shall be thesum of the time for building it, and that for delivering it.Upon failure of the above goal, e.g., because the user refuses the offer, the servicemust reach a fall-back situation where every (sub-)order has been canceled. That is,there must be no chance that the service has committed to some (sub-)order beforethe user cancels his order.
This goal can be expressed by the following EaGLe formula, where the TryReach andDoReach clauses represents the above portions 1 and 2 of the requirement.
The planning domain is only partially observable by the executor of the process thatwe want to synthesize. Thus, solving the problem implies using dedicated algorithmsfor planning under partial observability with EaGLe goals, or, alternatively, planning forthe fully observable associated knowledge level domain. We pursue this latter approach,so that we can reuse existing EaGLe planning algorithms under full observability. Weproceed as follows. We generate the knowledge level domain by combining the threemonitors defined previously. Similarly to what happens for the ground level domains, thiscomputation consists of a synchronous product. Inside the knowledge level domain, wemark as success the belief states which contain only states satisfying the ideal conditionthat the services tries to reach (i.e.
and as failure the belief states which contain only states satis-fying the condition that the service has to reach in case the preferred objective fails (i.e.
Finally, we plan onthis domain with respect to the aforementioned EaGLe goal. Fact 1 guarantees that theapproach outlined above for planning under partial observability with EaGLe goals iscorrect and complete.
5 Experimental Results
In order to test the effectiveness and the performance of the approach described above,we have conducted some experiments using the MBP planner. Some extensions to theplanner have been necessary to the purpose. First, we have implemented the procedure
Planning and Monitoring Web Service Composition 113
for translating protocols similar to the ones described in Fig. 1 into the ground-level plan-ning domains represented in the input language of MBP. Second, we have implementeda routine that performs the power-set domain construction, building the monitors corre-sponding to the three external protocols. MBP already provides algorithms for planningwith EaGLe goals, which we have exploited in the last step of the planning algorithm.
We have run MBP on four variants of the case study considered in this paper, ofdifferent degrees of complexity. In the easiest case, CASE 1, we considered a reduceddomain with only the user and the shipper, and with only one possible value for each typeof objects in the domain (item, location, delay, cost, size). In CASE 2 we have consideredall three protocols, but again only one possible value for each type of object. In CASE3 we have considered the three protocols, with two objects for each type, but removingthe parts of the shipper and producer protocols concerning the size of the product. InCASE 4, finally, is the complete protocol. We remark that CASE 1 and CASE 2 are usedto test our algorithms, even if they are admittedly unrealistic, since the process knows,already before the interaction starts, the item that the user will ask and the cost will becharged to the user. In CASE 3 and CASE 4, a real composition of services is necessaryto satisfy the goal.
In all four cases we have experimented also with a variant of the shipper protocol,which does not allow for action nack.
The experiments have been executed on an Intel Pentium 4, 1.8 GHz, 512 MBmemory, running Linux 2.4.18. The results, in Fig. 2, report the following information:
Generate: the time necessary to generate the MBP description of knowledge domainsfrom their description of the three external protocols.BuildMonitor: the time necessary to parse and build the three internal MBP modelscorresponding to the monitors of the three external protocols; after the models havebeen built, it is possible to monitor in real-time the evolution of the protocols.BuildDomain: the time necessary to parse and build the internal MBP model of thecombination of the three knowledge level domains.Planning: the time required to find a plan (or to check that no plan exists) startingfrom the planning domain built in the previous step.Result: whether a plan is found or not.
The last two results are reported both in the original domains and in the domains without“nack” being handled by the shipper.
The experiments show that the planning algorithm correctly detects that it is notpossible to satisfy the goal if we remove the nack action handling in the shipper,since we cannot unroll the contract with the shipper and to satisfy the recovery goalDoReach failure in case of failure of the main goal. Moreover, MBP has been ableto complete all the planning and monitor construction tasks with a very good perfor-mance, even for the most complex protocol descriptions. Indeed, in the worse case, MBPtakes around two minutes to complete the task; as a reference, we asked an experienceddesigner to develop the protocol combination, and this took him more than one hour.

114 M. Pistore et al.
Fig. 2. Results of the experiments.
6 Related Work and Conclusions
In this paper, we define, implement and experiment with a framework for planning thecomposition and monitoring of BPEL4WS web services. As far as we know, there is noprevious attempt to automatically plan for the composition and monitoring of serviceoriented processes that takes into account nondeterminism, partial observability, andextended goals.
The problem of simulation, verification, and automated composition of web serviceshas been tackled in the semantic web framework, mainly based on the DAML-S on-tology for describing the capabilities of web services [2]. In [12], the authors proposean approach to the simulation, verification, and automated composition of web servicesbased a translation of DAML-S to situation calculus and Petri Nets, so that it is possibleto reason about, analyze, prove properties of, and automatically compose web services.However, as far as we understand, in this framework, the automated composition islimited to sequential composition of atomic services for reachability goals, and do notconsider the general case of possible interleavings among processes and of extendedbusiness goals. Moreover, Petri Nets are a rather expressive framework, but algorithmsthat analyze them have less chances to scale up to complex problems compared to sym-bolic model checking techniques.
Different planning approaches have been proposed for composing web services,from HTNs [16] to regression planning based on extensions of PDDL [9], but how todeal with nondeterminism, partial observability, and how to generate conditional anditerative behaviors (in the style of BPEL4WS) in these frameworks are still open issues.
Other planning techniques have been applied to related but somehow orthogonalproblems in the field of web services. The interactive composition of information gath-ering services has been tackled in [15] by using CSP techniques. In [11] an interleavedapproach of planning and execution is used; planning technique are exploited to provideviable plans for the execution of the composition, given a specific query of the user; ifthese plans turn out to violate some user constraints at run time, then a re planning taskis started. Finally, works in the field of Data and Computational Grids is more and moremoving toward the problem of composing complex workflows by means of planningand scheduling techniques [6].
While the results in this paper are extremely promising, there is a wide space forimproving. In particular, the computationally complex power-set construction of theknowledge level domain can be avoided altogether by providing algorithms for nativelyplanning with extended goals under partial observability. This is a is a main goal in ourresearch line; a preliminary result appears in [3], focusing on the CTL goal language.

Planning and Monitoring Web Service Composition 115
The extension of this work to the EaGLe language, and the exploitation of symbolicrepresentation techniques for this problem, is far from trivial.
Finally, we intend to extend our experimentation on a set of realistic case studiesexpressed using the BPEL4WS language; this will require an extension of MBP tonativelyhandle the language.
References
[1]
[2]
[3]
[4]
[5]
[6]
[7]
[8]
[9]
[10]
[11]
[12]
[13]
[14]
[15]
[16]
Andrews, T.; Curbera, F.; Dolakia, H.; Goland, J.; Klein, J.; Leymann, F.; Liu, K.; Roller,D.; Smith, D.; Thatte, S.; Trickovic, I.; and Weeravarana, S. 2003. Business ProcessExecution Language for Web Services, Version 1.1.Ankolekar, A. 2002. DAML-S: Web Service Description for the Semantic Web. In Proc.of the 1st International Semantic Web Conference (ISWC 02).Bertoli, P., and Pistore, M. 2004. Planning with Extended Goals and Partial Observability.In Proc. of ICAPS’04.Bertoli, P.; Cimatti, A.; Roveri, M.; and Traverso, P. 2001. Planning in NondeterministicDomains under Partial Observability via Symbolic Model Checking. In Nebel, B., ed.,Proc. of IJCAI 2001.Bertoli, P.; Cimatti, A.; Pistore, M.; and Traverso, P. 2003. A Framework for Planningwith Extended Goals under Partial Observability. In Proc. ICAPS’03.Blythe, J.; Deelman, E.; and Gil, Y. 2003. Planning for Workflow Construction andMaintenance on the Grid. In Proc. of ICAPS’03 Workshop on Planning for Web Services.Bonet, B., and Geffner, H. 2000. Planning with Incomplete Information as HeuristicSearch in Belief Space. In Proc. AIPS 2000.Dal Lago, U.; Pistore, M.; and Traverso, P. 2002. Planning with a Language for ExtendedGoals. In Proc. AAAI’02.McDermott, D. 1998. The Planning Domain Definition Language Manual. TechnicalReport 1165, Yale Computer Science University. CVC Report 98-003.Emerson, E. A. 1990. Temporal and modal logic. In van Leeuwen, J., ed., Handbook ofTheoretical Computer Science, Volume B: Formal Models and Semantics. Elsevier.Lazovik A.; Aiello M.; and Papazoglou M. 2003. Planning and Monitoring the Executionof Web Service Requests. In Proc. of ICSOC’03.Narayanan, S., and McIlraith, S. 2002. Simulation, Verification and Automated Compo-sition of Web Services. In Proc. of WWW-11.Pistore, M., and Traverso, P. 2001. Planning as Model Checking for Extended Goals inNon-deterministic Domains. In Proc. IJCAI’01.Pistore, M.; Bettin, R.; and Traverso, P. 2001. Symbolic Techniques for Planning withExtended Goals in Non-Deterministic Domains. In Proc. ECP’01.Thakkar, S.; Knoblock, C.; and Ambite, J. L. 2003. A View Integration Approach toDynamic Composition of Web Services. In Proc. of ICAPS’03 Workshop on Planning forWeb Services.Wu, D.; Parsia, B.; Sirin, E.; Hendler, J.; and Nau, D. 2003. Automating DAML-S WebServices Composition using SHOP2. In Proc. of ISWC2003.

A Logic of Inequalities
Nikolai G. Nikolov
CLBME-Bulgarian Academy of SciencesBl. 105, Acad. G. Bontchev Str., Sofia 1113, Bulgaria
Abstract. A logical system is presented that tolerates partial or total contradic-tions or incomplete information. Every set of formulas in such a system has amodel. Other theoretical properties were also investigated concerning the gen-eralization of the notion of contradiction from classical logic. Applications toknowledge representation were considered and a way was proposed to representgeneric and explicit information while providing monotonic inference.
1 Introduction
This section presents the motivation behind the logical system we are going to developas concerns implication, negation, and deduction.
1.1 Implication
First-order logic (FOL) has the choice of defining implication in a number of equiva-lent ways: (1) by a truth table; (2) by other connectives, as in or (3) by statingthat iff where I is a valuation function mapping formulas to theset of truth values {0,1}. The third way seems most intuitively appropriate with re-spect to deduction by Modus Ponens.
Consider a lattice L of logical values, and a valuation function mapping into it.While formulas like ¬a, can be interpreted with values from L - as long astheir constituents can - the case with is different. It expresses the fact that
and this, no matter what L is chosen, is always a crisp statement - it can beeither true or false.
We therefore generalize FOL to a L-valued logic where, instead of representingthe ‘derivative’ definitions of (1), (2), we use the ‘original definition (3). It shouldbe noted that when L = {0,1}, the definitions coincide.
We will use instead of in order to emphasize the intended reading of theimplication.
C. Bussler and D. Fensel (Eds.): AIMSA 2004, LNAI 3192, pp. 116–125, 2004.© Springer-Verlag Berlin Heidelberg 2004

A Logic of Inequalities 117
1.2 Negation
The idea of having a separate valuation function for the falsity of a proposition hasappeared occasionally in the AI and logic literature (cf. [3], p. 178). This allows forsimultaneous valuation of a proposition as true and false, and this way contradictionscan be represented.
Other approaches do with a single valuation function, but make it map into a spe-cial truth-value lattice which include values for truth, falsity, lack of knowledge andcontradiction [4,9] or other values in-between these [8].
While FOL and fuzzy logic (FL) do not provide room for incomplete informationor contradiction, intuitionistic fuzzy logic (IFL) [1] is designed especially for model-ing uncertainty (incompleteness). In it, a proposition p is valuated independently by
degree of truth of p, and degree of falsity. Both are real numbers from[0,1], with the condition that for all p,
In the present work, we adopt the view that a proposition is interpreted by a pair ofdegrees - a truth and a falsity degree. While this is no new idea, in our system thisfeature is going to have significant modeling power, as will be shown in the secondpart of the paper.
Another reading of the two degrees is that they represent the established degrees ofproof and refutation, respectively. Thus, the interpetation of the negation of a proposi-tion should be the same pair of values as the proposition’s interpretation but in reverseorder - the degree of refutation of a proposition is the degree of proof of its negation.
Yet another function of the two degrees will be to represent the distinction be-tween specific (explicit) and generic (default) knowledge, so that deduction is madepossible even in the presence of conflict between such items of knowledge.
1.3 Information Persistence
The degrees of truth and falsity of a formula are meant to represent the truth or falsityestablished on the basis of the given knowledge. Thanks to the separate representationof the two, we can claim monotonicity in both degrees - given a formula, if a truthdegree can be established on the basis of a set of formulas S, then at least the sametruth degree should be established from any The same holds of the degree offalsity. However, since the degree of falsity of a formula is the degree of truth of itsnegation, with the accumulation of counter-evidence a formula can be refuted to agreater extent. Although the latter is a feature of non-monotonic logics, we will seehow our system exhibits this by virtue of being monotonic in both degrees.
2 Basic Formal Model
In this paragraph we propose a formal model of the principles discussed so far. Webegin with a propositional inequality logic (PInL). A PInL setting P = <A,L> consistsof a set of propositional symbols A and a lattice L with an involution We

118 N.G. Nikolov
will use L as the range of our valuation function - for example, we can take L = [0,1]and
We assume the notation 1 for and 0 forDefinition 1. We will call formulas of P the following:
for all p is a formula.if p is a formula, then ¬p is a formula.if p and q are formulas, then and are formulas.
Note that we do not include any versions of implication in the definition, nor dowe plan to define it by other connectives. We choose to do so because no implicationshould be valuated with elements of L, but rather with {0,1}, as we discussed in theprevious section.
Definition 2. Valuation is a function defined on the set of formulas of P ranging toFor all formulas p, q, if and then
1.2.3.
Now we turn to the important issue of deduction. In first-order logic, semanticconsequence is usually defined through the notion of deductive closure of a set offormulas. Starting with some initial axioms (the initial set of formulas), its deductiveclosure is the smallest set that contains all formulas true whenever the initial ones aretrue.
The formulas in the initial set can be regarded as statements each claiming thetruth of the corresponding formula. The generalization of this to the many-valued case(and it is done so in fuzzy logic) would be to have a set of statements (or two-valuedformulas) claiming that a given formula is true to some degree.
To this end, we define a notion which combines the properties of a truth-claimingstatement and an implication formula.
Definition 3. By inequality we will mean an expression of either of these kinds:or where and are formulas and for a formula p, is either
or An inequality will be called atomic if the participating formulas are atomic.Inequalities of the first kind will be called ground.
The following definition relates a set of inequalities to valuations.Definition 4. We will say that a valuation V satisfies a set of inequalities W
iff all of the inequalities in W hold for the component functions of V.Proposition 1. For all sets W of atomic inequalities, there exists a valuation V that
satisfies W.Proof. Clearly the valuation that assigns to all p, and satisfies W,
since ground inequalities are satisfied by 1’s, and non-ground inequalities reduce to
Of course, the trivial valuation is far from useful for needs such as deduction.Therefore, we would need to formalize the intuitive notion of valuation that suits besta given set of inequalities.
The reason the trivial valuation is not useful is that it is, in a sense, maximal - it as-signs the maximum possible value to each degree. We are interested in whether thereis a minimal - and thus most useful - valuation for a given set of inequalities.

A Logic of Inequalities 119
Definition 5. We will define a partial order between valuations as follows:iff for all p, and where
Definition 6. A valuation V will be called minimal for a set of inequalities W ifand there exists no other valuation such that
Proposition 2. For every set of atomic inequalities W, there exists a unique mini-mal valuation
We postpone the proof of this proposition until we introduce several necessary no-tions.
Definition 7. A set of inequalities W will be called transitively if for allFor every set of inequalities W we construct its
to be the intersection of all transitively sets that contain W; thatintersection is also transitively
Proof of Proposition 2. We will construct a valuation that is minimal for andthen prove it to be what is needed. For all formulas let
Satisfaction. Clearly satisfies all ground inequalities of and therefore of W.Consider an arbitrary non-ground inequality For all ground inequalities
there is a ground inequality by the transitivity ofTherefore,
soMinimality and uniqueness. Assume Since every valuation satis-
fying W also satisfies by the transitivity of in L), and by definition is theminimal valuation satisfying then
An important property of InL is that, given a valuation V, we can introduce meas-ure of contradiction, a number which will gradually vary from 0 (a given set of for-mulas is consistent in the classical sense) to 1 (the set of formulas is inconsistent in theclassical sense), the in-between values showing the presence of partial evidence bothfor and against a formula. We can also have a measure of uncertainty, a number whichwill gradually vary from 0 (V is certain both about a formula and its negation) to 1(there is no evidence neither about the formula nor about its negation), the in-betweenvalues showing again the presence of partial evidence. Moreover, it turns out thatthese two notions can be formalized by a single expression.
Assume (until the end of this section) that we have a norm on the elements of
Definition 8. The information content of a formula p according to a valuationV is the value The minimal information content of a set of formulas Saccording to a valuation V will be the maximal information content will be
respectively.

120 N.G. Nikolov
It must be noted that is a generalization of the notion of degree of uncertaintyfrom intuitionistic fuzzy logic for the case L=[0,1] and (actually, itscomplement to 1).
Proposition 3. A set of formulas is contradictory (in the classical sense) iff itsmaximum information content according to the valuation is greater than 1.
The notion of information content leads to another noteworthy property of propo-sitional InL - a result we can call Locality theorem. Recall that the Compactness theo-rem for classical propositional logic states that a set of formulas S is consistent iffevery finite subset of S is consistent. In propositional InL it is senseless to speak aboutconsistent sets of formulas, as every set of formulas has a model. However, we cangeneralize the notion of consistency using the concept of information content. Wehave the notion of maximum information content of a set of formulas, which is just themeet of the information contents of all formulas in it. Now, whatever the maximumvalue, there must be a formula whose information content is arbitrarily close to it.
Proposition 4. (Locality theorem). For any set of formulas S and a real number r,if then there exists a formula such that
It is easily seen that if we restrict L to {0,1}, the above result reduces to the Com-pactness theorem. In InL, we have the stronger claim that the property of being con-tradictory is a local one - namely, that there always is at least one formula that repre-sents the level of contradiction or information incompleteness of the whole set.
For the rest of this section we will outline a version of predicate inequality logic(InPL). This simple version will be needed solely for presenting a knowledge repre-sentation approach (based on inequality logic) in the next section. We show how thisapproach motivates a specific extension of predicate inequality logic which will bedeveloped in the subsequent section.
An InPL language K = < P, C, V, r, L > consists of a set of predicate symbols P,constant symbols C, variable symbols V, arity function and a lattice L withan involution Again, we denote by 1 and by 0.
Definition 9. By a simple term we will mean a constant symbol or a variable sym-bol.
Definition 10. We will call formulas of K the following:if is a formula.for all is a formula, where are simple terms,if and are formulas, then and are formulas.
The set of formulas of K will be denoted byThe notion of statement is similar to that in the propositional case but with the ad-
ditional option for quantifiers.Definition 11. We will call a quantifier block any expression of the kind
where is or for some variable symbol x.Definition 12. Where and are formulas of K and we will call state-
ments of K the following: (in the lastthree statements Q is a quantifier block).
Definition 13. Algebraic system (cf. [11]) for K is a couple <A,I> where A is a setand I is a function whose domain is If c is a constant or variable, then
for a formula so that

A Logic of Inequalities 121
Definition 14. By inequality we will mean an expression of any of the followingtwo kinds: or where and are formulas, and Q is a quan-tifier block; also, for each p, can be either or We will call an inequalityatomic, if only atomic formulas participate in it. Inequalities of the first kind will becalled ground. We will call an inequality closed if all of its variables are quantified.
If not explicitly mentioned, below we will use closed inequalities.The following definition relates sets of inequalities to algebraic systems.Definition 15. We will say that an algebraic system M = <A,I> is a model of a set
of inequalities iff all inequalities in W hold for the component functionsof I, and the range of quantified variables is A.
Proposition 5. For all sets W of atomic inequalities there exists an algebraic sys-tem M that satisfies W.
Proof. The trivial interpretation assigning 1 to all formulas is a model of all sets ofatomic inequalities (similarly to the case with PInL).
Definition 16. Let for two algebraic systems, iff forany variable-free formula p, and where
Definition 17. We will call an algebraic system M minimal for a set of inequalitiesW, if and for no other set of inequalities
The problem of existence of a minimal algebraic system for a fixed object universeis easily solved and reduces to the corresponding propositional InL theorem.
Proposition 6. For every set of atomic inequalities W and object set A there existsa unique (up to renaming of the constants) minimal algebraic system
Proof outline. We construct a set of inequalities as follows:we replace every formula with a set of formulas (where x is re-
placed by an element of A)we replace every formula with a formula (where X is replaced
by a newThe set can be treated as a set of propositional inequalities. By Theorem 2 there
exists a unique minimal valuation that satisfies it. We assign over thecorresponding formulas.
3 Knowledge Representation by Inequality Logic
Let us consider an example:The age of a human being is between 0 and 130 years.C is a person.D’s age is 135 years.We would expect the following answers from a system equipped with this knowl-
edge:Problem 1. What is the age of C? Answer: 0..130 yearsProblem 2. Is D a human being? Answer: No.

122 N.G. Nikolov
Other problems with the representation of the above knowledge are:Problem 3. Representation of unsharp boundaries (in the above example a person
is allowed to be 130 but not 131 years old).Problem 4. The rule stating the possible age to be 0..130 years should not prevent
the system to use explicit information about a person who is 135 (i. e. default knowl-edge should be overridden if necessary).
First-order logic presents a solution only to the second of the above problems.Various aspects of the problems are treated by fuzzy, intuitionistic fuzzy, and defaultlogics [12]. In the present section we will propose a systematic way to address theseproblems using inequality predicate logic.
We will first propose a way to represent explicit and generic knowledge in InL.We interpret or as degree of proof or refutation, respectively. Thus, the mini-
mal interpretation of any formula for which no information is available is <0,0> - thereare no evidence either for or against it. The degree of non-plausibility can be used torepresent inherited (generic) knowledge - to state that a person’s age is from 0 to 130years (assuming this is the human lifespan), we may use the InPL inequality
(in this example, think of the set of truth values as just {‘false’,‘true’}). So, if x is aperson, it is not plausible that his age be above 130 years. Conversely, we will use thedegree of proof to represent specific, explicitly stated knowledge - if a person a isreported to be y years old, then is true. The two types of knowledge canco-exist without conflicts - inherited knowledge, represented throught the degree ofnon-plausibility of the reverse statement, serves as a default rule. Facts about a 135years old person (or the biblical Methusaleh) will not block the work of a InPL-basedsystem, but such a system will note the elevated non-plausibility of such a case.
Here is an example of how InPL inferences can be drawn using the degree of non-plausibility:
If this rule is used to make deduction by Modus Ponens, the degree of non-plausibility of and increases to
Conversely, here is how to use the same rule to make deduction by Modus Tollens:
and the degree of non-plausibility of man(x) increases to
Let us now consider, for the sake of explanation, a different way of representingthe intervals - by adding a fact for each individual point value in each interval. Ofcourse, these new facts will be uncountable, so such a representation is only of theo-retical importance:

A Logic of Inequalities 123
However this clarifies the inference mechanism better: during a Modus Tollensdeduction, the exact rule is fired that corresponds to the explicitly stated knowledge ofage of x.
We demonstrated how InPL can solve P2 (the two-way inference with InPL state-ments) and P4 (work with the degrees of proof and non-plausibility). We will nowconsider an approach to P3.
Since the set of truth values in InPL can be any lattice L, we can specify differentdegrees of non-plausibility of age(x,...) depending on the constant. Years in the mid-dle of the 0..130 interval will increase the degree of non-plausibility less; the maxi-mum increase, 1, will be reached outside of the interval, while in the ends the degreeof non-plausibility will take intermediate values. Such rules are naturally representedby InPL inequalities:
where for example (the degree of non-plausibility for a person to be at that age). The above rules look unusual by syntax, butthey convey the following information: if x is a man then it is impossible for him to bei years old, and this statement has a degree of plausibility
Rules for contraposition deduction by Modus Tollens can also be formulated.Thus, representation of information of this kind now includes another possibility
for a more flexible inference:(an InPL statement claiming age(d,135) with a degree of proof 1).
?- man(d). Proof: 0; Non-plausibility: 1
?- man(h). Proof: 0; Non-plausibility: 0.8
4 Inequality Logic Compared to Other Approaches
An interesting parallel between InL and possibilistic logic (PL). is that inequalityvaluation can be regarded as a necessity measure from PL. However, the essentialproperties of these two logics differ in the following:
inequality logic does not rely on first-order interpretations. In contrast, PL usesnecessity/possibility measure as a means for describing the possibility of first-orderinterpretations, which are then subject to preference.PL uses first-order inference (and resolution)PL does not distinguish explicitly between generic and factual knowledge. This isdue to the representation of both types of knowledge through first-order formulas.In contrast, with CL generic/factual items of knowledge are naturally representedby the degrees of plausibility and non-plausibility.InL is clearly a case of multivalued logic, and in particular, it can be a version of
fuzzy logic. However, the systematic treatment of implication seems to solve issues ofimplication definition and Modus Ponens inference present in some of these logic [1].

124 N.G. Nikolov
InL does not have a dedicated mechanism for defaults as is present in Default rea-soning [12]. However, an important feature of InL is that it is bi-monotonic (mono-tonic in both truth degrees) and therefore inference is always monotonic.
When this work was nearly finished, the author learned about a formalism calledevidence logic (EL) [7]1. Evidence logic deals with items of proof evidence and refu-tatory evidence of assertions, each to a certain (discrete) degree. While InL has asimilar feature, it seems that it differs from EL in all other crucial aspects, namely themotivation for treating implication as order-relation even in the multi-valued case, andtherefore introducing the notion of a statement to generalize both the concepts of animplication formula and the concept of a piece of evidence. Consequently, other im-portant notions (sets of statements as generalizations of the sets of formulas fromclassical logic, satisfiability of a set of statements, measure of contradiction) are spe-cific to inequality logic.
The same arguments hold when InL is compared to intuitionistic fuzzy logic [1]and other independently arised similar systems (vague sets theory, neutrosophiclogic [13] - a difference of the latter from intuitionistic fuzzy logic is the lack of re-striction on the sum truth + falsity + indeterminacy) that also estimate separately thetruth and the falsity of a proposition. Moreover, it is often pointed out as a difficultythat models based on these logics should have a source of the actual degrees of truthand falsity for each fact. In InL, a solution to this would be the interpretation of thedegree of non-plausibility as a means to represent generic knowledge, as discussed inthe previous section - in this case, the necessary values would come from known pos-sibilistic distributions of the corresponding variable (e.g. human lifespan in our exam-ple).
It is interesting to compare InL with description logic with symbolic number re-strictions (DL-SNR, [2]) which, although quite different theoretically, addressesproblems of numeric knowledge representation discussed here. DL-SNR augments theclassic DL with means to add requirements on the numbers (ranges) of the describedobjects. For example, lifespan can be represented as a restriction on the possible val-ues of the objects’ age. Far from having studied thoroughly the specifics of our ap-proach compared to DL-SNR (a much more developed theory), we envisage two pos-sible directions where InL may have some advantage. First, InL is tolerant to partial ortotal contradictions, including contradictory numerical data: thus, it can representknowledge about a 969-year old person while still maintaining the rule that humanlifespan is between 0 and 130 years (at the expense of having only a local contradic-tion). Second, it can represent this gradually, not falling into total contradiction butdistinguishing between the degrees of contradiction of reported facts about a 131- anda thousand-years-old human being.
5 Conclusion and Future Work
In this paper we have presented a logical system that generalizes the treatment ofimplication as order relation. The system is also featured by supporting independent
1 The full text of [7] is not available to the author presently

A Logic of Inequalities 125
estimations of the truth and the falsity of a proposition. Interesting theoretical proper-ties were investigated concerning satisfiability of a set of formulas and the generaliza-tion of the notion of contradiction from classical logic. Applications to knowledgerepresentation were considered and a way was proposed to represent generic and ex-plicit information that can be in partial or total contradiction or under-specified.Monotonicity of inference is maintained in each degree (of proof and non-plausibility).
In a subsequent research, the author plans to focus on representation of distributednumerical data as InL terms, proof theory and complexity issues.
Acknowledgment. This work was supported by the National Scientific Fund ofBulgaria under contract I-1303/2003.
References
Atanassov, K., Intuitionistic Fuzzy Sets, Springer-Verlag, 1999.Baader, F., Sattler, U., Description Logics with Symbolic Number Restrictions, Proceed-ings of the 12th European Conference on Artificial Intelligence, 1996, Budapest, Hungary.Barwise, J., Moss, L. S., Vicious Circles: On the Mathematics of Non-Wellfounded Phe-nomena, CSLI Lecture Notes, CSLI Publications, Stanford University, 1996.Belnap, N., A useful four-valued logic, in: Modern Uses of Multiple-Valued Logic, G.Epstein and J. M. Dunn, Eds., Reidel Publishing Company, ·1977, pp. 7-37.Cercone, N., The ECO Family, in: Semantic Networks, Fritz Lehmann, Ed., 1993.Dubois, D., Lang, J., Prade, H., Possibilistic Logic, in D. M. Gabbay et al., Eds., Hand-book of Logic in Artificial Intelligence and Logic Programming, Vol. 3, 439-513, OxfordUniversity Press, 1994.Faust, D., The Concept of Evidence, Int. Journal of Intelligent Systems, 15 (2000), 477-493.Fortemps, P., Slowinski, R.,, A graded quadrivalent logic for ordinal preference model-ling: Loyola-like approach, Fuzzy Optimization and Decision Making 1 (2002), 93-111.Ginsberg, M., Bilattices and Modal Operators, Journal of Logic and Computation,1(1):41-69, July 1990.Iwanska, L., Shapiro, S., Eds., Language for Knowledge and Knowledge for language,AAAI Press/The MIT Press, 2000.Rasiowa, H., Sikorski, R., The mathematics of metamathematics, Polish Academic Pub-lisher, 1963.Reiter, R. A logic for default reasoning, Artificial Intelligence, 13(1,2):81-132, 1980Smarandache, F., Neutrosophy, American Research Press, 1998.Zadeh, L., A new direction in AI: Towards a computational theory of perceptions, AImagazine, vol. 22, pp. 73-84, 2001.
1.2.
3.
4.
5.6.
7.
8.
9.
10.
11.
12.13.14.

Exploiting the Constrainedness in ConstraintSatisfaction Problems
Miguel A. Salido1 and Federico Barber2
1 Dpto. Ciencias de la Computación e Inteligencia Artificial, Universidad de AlicanteCampus de San Vicente, Ap. de Correos: 99, E-03080, Alicante, Spain
[email protected] Dpto. Sistemas Informáticos y Computación, Universidad Politécnica de Valencia
Camino de Vera s/n, 46071, Valencia, [email protected]
Abstract. Nowadays, many real problem in Artificial Intelligence canbe modeled as constraint satisfaction problems (CSPs). A general rule inconstraint satisfaction is to tackle the hardest part of a search problemfirst. In this paper, we introduce a parameter that measures theconstrainedness of a search problem. This parameter represents theprobability of the problem being feasible. A value of correspondsto an over-constrained problem and no states are expected to besolutions. A value of corresponds to an under-constrained problemwhich every state is a solution. This parameter can also be used in aheuristic to guide search. To achieve this parameter, a sample in finitepopulation is carried out to compute the tightnesses of each constraint.We take advantage of this tightnesses to classify the constraints fromthe tightest constraint to the loosest constraint. This heuristic mayaccelerate the search due to inconsistencies can be found earlier and thenumber of constraint checks can significantly be reduced.
Keywords: Constraint Satisfaction Problems, complexity, heuristicsearch.
1 Introduction
Many real problems in Artificial Intelligence (AI) as well as in other areas ofcomputer science and engineering can be efficiently modeled as Constraint Sat-isfaction Problems (CSPs) and solved using constraint programming techniques.Some examples of such problems include: spatial and temporal planning, quali-tative and symbolic reasoning, diagnosis, decision support, scheduling, hardwaredesign and verification, real-time systems and robot planning.
These problems may be soluble or insoluble, they may be hard or easy. Howto solve these problems have been the subject of intensive study in recent years.
Some works are focused on the constrainedness of search. Heuristics of mak-ing a choice that minimises the constrainedness can reduce search [3].The con-strainedness “knife-edge” that measures the constrainedness of a problem duringsearch [10].
C. Bussler and D. Fensel (Eds.): AIMSA 2004, LNAI 3192, pp. 126–136, 2004.© Springer-Verlag Berlin Heidelberg 2004

Exploiting the Constrainedness in Constraint Satisfaction Problems 127
Most of the work are focused on general methods for solving CSPs. Theyinclude backtracking-based search algorithms. While the worst-case complexityof backtrack search is exponential, several heuristics to reduce its average-casecomplexity have been proposed in the literature [2]. For instance, some algo-rithms incorporate features such as variable ordering which have a substantiallybetter performance than a simpler algorithm without this feature [5].
Many works have investigated various ways of improving the backtracking-based search algorithms. To avoid thrashing [6] in backtracking, consistency tech-niques, such as arc-consistency and have been developed by manyresearchers. Other ways of increasing the efficiency of backtracking include theuse of search order for variables and values. Thus, some heuristics based on vari-able ordering and value ordering [7] have been developed, due to the additivity ofthe variables and values. However, constraints are also considered to be additive,that is, the order of imposition of constraints does not matter; all that mattersis that the conjunction of constraints be satisfied [1]. In spite of the additivityof constraints, only some works have be done on constraint ordering heuristicmainly for arc-consistency algorithms [9,4].
Here, we introduce a parameter that measures the “ constrainedness” of theproblem. This parameter called represents the probability of the problem beingfeasible and identify the tightnesses of constraints. This parameter can also beapplied in a heuristic to guide search. To achieve this parameter, we computethe tightnesses of each constraint. Using this tightnesses, we have developed aheuristic to accelerate the search. This heuristic performs a constraint orderingand can easily be applied to any backtracking-based search algorithm. It classifiesthe constraints by means of the tightnesses, so that the tightest constraints arestudied first. This is based on the principle that, in goods ordering, domainvalues are removed as quickly as possible. This idea was first stated by Waltz[11] “ The base heuristic for speeding up the program is to eliminate as manypossibilities as early as possible” (p. 60).
An appropriate ordering is straightforward if the constrainedness is known inadvance. However in the general case, an good classification is suitable to tacklethe hardest part of the search problem first.
In the following section, we formally define a CSP and summarize some or-dering heuristics and an example of soluble and insoluble problem. In section 3,we define a well-known definition of constrainedness of search problems. A newparameter to measure the constrainedness of a problem is developed in section 4.In section 5, we present our constraint ordering heuristic. Section 6 summarizesthe conclusions and future work.
2 Definitions and Algorithms
In this section, we review some basic definitions as well as basic heuristics forCSPs.

128 M.A. Salido and F. Barber
Briefly, a constraint satisfaction problem (CSP) consists of:
a set of variableseach variable has a set of possible values (its domain)a finite collection of constraints restricting the values thatthe variables can simultaneously take.
A solution to a CSP is an assignment of values to all the variables so thatall constraints are satisfied.
2.1 Constraint Ordering Algorithms
The experiments and analyses by several researchers have shown that the or-dering in which variables and values are assigned during the search may havesubstantial impact on the complexity of the search space explored. In spite of theadditivity of constraints, only some works have be done on constraint ordering.Heuristics of making a choice that minimises the constrainedness of the resultingsubproblem can reduce search over standards heuristics [3].
Wallace and Freuder initiated a systematic study to identify factors thatdetermine the efficiency of constraint propagation that achieve arc-consistency[9]. Gent et al. proposed a new constraint ordering heuristic in AC3, wherethe set of choices is composed by the arcs in the current set maintained byAC3 [4]. They considered the remaining subproblem to have the same set ofvariables as the original problem, but with only those arcs still remaining in theset. Walsh studied the constrainedness “knife-edge” in which he measured theconstrainedness of a problem during search in several different domains [10]. Heobserved a constrainedness “knife-edge” in which critically constrained problemstend to remain critically constrained. This knife-edge is predicted by a theoreticallower-bound calculation.
Many of these algorithms focus their approximate theories on just two factors:the size of the problems and the expected number of solutions. However, thislast factor is not easy to estimate.
2.2 Solubility and Insolubility
Will a problem be soluble or insoluble? Will it be hard or easy to solve? Howcan we develop heuristics for new problem domains? All these questions havebeen studied by researchers in the last decades in a large number of problemsdomains. Consider the example presented in [3] of colouring a graph with a fixednumber of colours so that neighboring nodes have different colours. If the nodesin the graph are loosely connected, then problems tend to be soluble and it isusually easy to obtain one of the many solutions. If nodes are highly connected,then problems tend to be insoluble and it is not easy to find a solution. Atintermediate levels of connectivity, problems can be hard to solve since they areneither obviously soluble nor insoluble.

Exploiting the Constrainedness in Constraint Satisfaction Problems 129
Figure 1 shows colouring graphs with four nodes using three colours: red, blueand green. Nodes connected by an edge must have different colours. The connec-tivity of a node is the number of edges connected to the node. The connectivityof a graph is the average connectivity of its nodes. (A) is an under-constrainedand soluble problem due to 18 states are solutions. (B) is a problem which isjust soluble and 6 states are solutions but there is only an unique solution upto symmetry. (C) is an over-constrained and insoluble problem consisting of aclique of four nodes.
Fig. 1. Colouring Graph with four nodes using three colours [3].
We can use connectivity to develop a simple but effective heuristic for graphcolouring that colours the most constrained nodes first. Consider colouring thenodes in Figure 1B without such a heuristic, using instead their numerical order.We might colour node 1 red, then node 2 green, and node 3 blue. We wouldthen be unable to colour node 4 without giving it the same colour as one ofits neighbors. Instead, suppose we seek to colour the most constrained nodesfirst. Both informally, the constrainedness of the graph is directly related to itsconnectivity. This then suggest the heuristic of colouring the nodes in decreasingorder of their connectivity. As node 2 and 4 have the highest connectivity, theyare coloured first. If we colour node 2 red and node 4 green, then nodes 1 and3 can be coloured blue. Ordering the nodes by their connectivity focuses on thehardest part of the problem, leaving the less constrained and easier parts tilllast.
This example shows that some parts of the problem are hardest than othersand a variable ordering may accelerate the search. However many real problemsmaintains thousand of variables and constraints and remains difficult to identifywhich variables and constraints are tightest. So a sample in finite populationsmay be useful to identify the constrainedness of the problem and perform aconstraint ordering to take advantage of the problem topology. It may be usefulto carry out domain filtering over the tightest constraints and even analysethe loosest constraints because many of them may be redundant and thereforeremoved.

130 M.A. Salido and F. Barber
3 Constrainedness
Given a new search problem, it is appropriate to identify parameters to measurethe constrainedness of the problem and to develop heuristics for finding a solutionmore efficiently.
In [3], Gent et al. present a parameter that measures the constrainedness ofan ensemble of combinatorial problems. They assume that each problem in anensemble has a state space S with elements and a number, Sol of these statesare solutions. Any point in the state space can be represented by a N-bit binaryvector where Let be the expected number of solutionsaveraged over the ensemble. They defined constrainedness, of an ensemble by,
Gent et al. proposed a straightforward way to compute and therefore[3]. Consider constraint satisfaction problems, each variable has a
domain of values of size Each constraint of arity restricts a tupleof variables and rules out some proportion of possible values fromthe cartesian product Without loss of generality we can define thetightnesses of a constraint as or its complementary Problems may havevariables with many different domain sizes, and constraints of different aritiesand tightnesses.
portion of these states, so the number of solution is
Substituting this into (1) gives
lies in the range A value of corresponds to an under-constrained problem. A value of corresponds to an over-constrainedproblem.
However, this parameter defines the constrainedness of constraint satisfactionproblems in general, but not of an individual problem.
As we can observe, constrainedness in constraint satisfaction problem isclosely related to probability. Unfortunately, it is difficult to compute this prob-ability directly [3], mainly in a particular problem.
So, the main contribution of this papers focuses on computing this probability(or its complementary) for each constraint of the problem. These probabilitiesare computed by a sampling from finite populations. This sampling may be asimple random or systematic sampling, where there is a population, and a sampleis chosen to represent this population. That is, the population is composed of the
The state space has size Each constraint rules out a pro-

Exploiting the Constrainedness in Constraint Satisfaction Problems 131
states lying within the convex hull of all initial states generated by means of theCartesian product of variable domain bounds. The sample is composed by a setof random and well distributed states in order to represent the entire population.In case of continuous variables, they are discretized in base on an appropriategranularity. Each constraint is checked with the states of the sample and thisgives us the probability that constraint satisfies the problem. Thus, weassume the tightnesses of the constraint In this way, we canobtain the parameter or the parameter developed in the following section.
4 Computing the Constrainedness
In this section, we introduce a parameter called that measures the constrained-ness of the problem. This parameter represents the probability of the problembeing feasible. This parameter lies in the range [0, 1]. A value of cor-responds to an over-constrained and no states are expected to be a solution
A value of corresponds to an under-constrained and everystate is expected to be a solution This parameter can alsobe used in a heuristic to guide search. To this end, we take advantage of thetightnesses of each constraint to classifying them from the tightest constraint tothe loosest constraint. Thus, a search algorithm can tackle the hardest part ofthe problem first.
To compute a sample from a finite population is performed, where thereis a population (states), and a sample is chosen to represent this population.The sample is composed by random and well distributed states where isa polynomial function.
Fig. 2. From non-ordered constraint to ordered constraint
As in statistic, the user selects the size of the sample We study howmany states satisfy each constraint (see Figure 2). Thus, each

132 M.A. Salido and F. Barber
constraint is labeled with where represents theproportion of possible states, that is, the tightnesses of the constraint.
In this way, given the set of probabilities the number of solutionscan be computed as:
This equation is equivalent to the obtained in [3]. However, our definition ofconstrainedness is given by the following equation:
is a parameter that measures the probability that a randomly selected stateis a solution, that is, the probability this state satisfies the first constraintthe second constraint and so forth, the last constraint In this way,we guarantee that a random state satisfies all constraints. This parameter liesin the range [0, 1] that represent the constrainedness of the problem.
We present the pseudo-code of computing
For example, let’s see the random problem presented in Table 1. There arethree variables, each variable lies in the range [1,10], and there are three con-straints The first constraint satisfies 944 states, the second constraintsatisfies 960 states and the third constraint satisfies 30 constraints. Thus theprobability a random state satisfies the first constraint isSimilarly, and So, the probability a random state satisfiesall constraints is 0.027. However, only 29 states satisfy these three constraints,so the above probability that a random state satisfies all constraint is 0.029.
4.1 A Heuristic Using
To compute it is necessary to obtain the tightnesses of each constraint, rep-resented by the following set of probabilities We take advantage ofthis information to classifying the constraint so that a search algorithm can

Exploiting the Constrainedness in Constraint Satisfaction Problems 133
manage the hardest part of a problem first. Figure 3 shows the constraintsin the natural order and classified by tightnesses. If the tightest constraintsis very constrained the problem will be over-constrained. However, ifthis tightest constraints is under-constrained then, the problem will beunder-constrained.
Fig. 3. From non-ordered constraints to ordered constraints: Constrainedness.
To achieve this objective, we classify the constraints in ascending order of thelabels so that the tightest constraints are classified first(see Figure 3). Thus, a backtracking-based search algorithm can tackle the hard-est part of a search problem first and inconsistencies can be found earlier andthe number of constraint checks can significantly be reduced.
5 Evaluation of and the Resultant Heuristic
In this section, we evaluate our parameter and our heuristic. To estimate theConstrainedness of random problems we compare with the actual constrained-ness by obtaining all solutions of random problems. Furthermore, we study theperformance of some well-known CSP solvers that incorporate our heuristic:Chronological Backtracking (BT), Generate&Test (GT), Forward Checking (FC)and Real Full Look Ahead (RFLA)1, because they are the most appropriate1 Backtracking, Generate&Test, Forward Checking and Real Full Look Ahead were
obtained from CON’FLEX. It can be found in: http://www-bia.inra.fr/T/conflex/Logiciels/ adressesConflex.html.

134 M.A. Salido and F. Barber
techniques for observing the number of constraint checks. This evaluation willbe carried out on the classical problem.
5.1 Evaluating
In our empirical evaluation, each random CSP was defined by the 3-tuplewhere was the number of variables, the number of constraints and
the domain size. The problems were randomly generated by modifying theseparameters. We evaluated 100 test cases for each type of problem. We presentthe average actual constrainedness by obtaining all solutions, our estimatorchoosing a sample of states, the number of possible states, the averagenumber of possible solutions, the average number of estimate solutions usingand the error percentage.
Table 2 shows some types of random problems. For example in problems with5 variables, each with 5 possible values and 5 constraints < 5, 5, 5 >, the numberof possible states is the average number of solutions is 125,so the actual constrainedness is 0.04. With a sample of states, weobtain an average number of 6.64 solutions. Thus, our parameter andthe number of estimate solutions of the entire problem is 118.7. In this way, theerror percentage is only 0.2%.
5.2 Evaluating Our Heuristic
The problem is a classical search problem to analyse the behaviour ofalgorithms. Table 3 shows the amount of constraint check saving in theproblem.
We incorporated our constraint ordering (CO) to well-known CSP solver:GT+CO, BT+CO, FC+CO and RFLA+CO. Here, the objective is to find allsolutions. The results show that the amount of constraint check saving wassignificant in GT+CO and BT+CO and lower but significant in FC+CO andRFLA+CO. This is due to these techniques are more powerful than BT and GT.

6 Conclusion and Future Work
In this paper, we introduce a parameter that measures the “constrainedness”of a search problem. represents the probability of the problem being feasible.A value of corresponds to an over-constrained problem. correspondsto an under-constrained problem. This parameter can also be used in a heuristicto guide search. To achieve this parameter, we compute the tightnesses of eachconstraint. We can take advantage of this tightnesses to classify the constraintsfrom the tightest constraint to the loosest constraint. Using this ordering heuris-tic, the search can be accelerated due to inconsistencies can be found earlier andthe number of constraint checks can significantly be reduced.
Furthermore, this heuristic technique is appropriate to solve problems as adistributed CSPs [8] in which agents are committed to solve their subproblems.
For future work, we are working on exploiting this constraint ordering toremove redundant constraints in large problems.
References
R. Bartak, ‘Constraint programming: In pursuit of the holy grail’, in Proceedingsof WDS99 (invited lecture), Prague, June, (1999).R. Dechter and J. Pearl, ‘Network-based heuristics for constraint satisfaction prob-lems’, Artificial Intelligence, 34, 1–38, (1988).I.P. Gent, E. MacIntyre, P. Prosser, and T Walsh, ‘The constrainedness of search’,In Proceedings of AAAI-96, 246–252, (1996).I.P. Gent, E. MacIntyre, P. Prosser, and T Walsh, ‘The constrainedness of arcconsistency’, Principles and Practice of Constraint Programming, 327–340, (1997).R. Haralick and Elliot G., ‘Increasing tree efficiency for constraint satisfactionproblems’, Artificial Intelligence, 14, 263–314, (1980).V. Kumar, ‘Algorithms for constraint satisfaction problems: a survey’, ArtificialIntelligence Magazine, 1, 32–44, (1992).N. Sadeh and M.S. Fox, ‘Variable and value ordering heuristics for activity-basedjobshop scheduling’, In proc. of Fourth International Conference on Expert Systemsin Production and Operations Management, 134–144, (1990).
1.
2.
3.
4.
5.
6.
7.
Exploting the Constrainedness in Constraint Satisfaction Problems 135

136 M.A. Salido and F. Barber
M.A. Salido, A. Giret, and F. Barber, ‘Distributing Constraints by Sampling inNon-Binary CSPs’, In IJCAI Workshop on Distributing Constraint Reasoning, 79–87, (2003).R. Wallace and E. Freuder, ‘Ordering heuristics for arc consistency algorithms’, InProc. of Ninth Canad. Conf. on A.I., 163–169, (1992).T. Walsh, ‘The constrainedness knife-edge’, In Proceedings of the 15th NationalConference on AI (AAAI-98), 406–411, (1998).D.L. Waltz, ‘Understanding line drawings of scenes with shadows’, The Psychologyof Computer Vision, 19–91, (1975).
8.
9.
10.
11.

Orthogonal Operators for User-DefinedSymbolic Periodicities
Lavinia Egidi and Paolo Terenziani
Dipartimento di Informatica - Università del Piemonte OrientaleSpalto Marengo, 33, 15100 Alessandria - Italy
{lavinia.egidi,paolo.terenziani}@mfn.unipmn.it
Abstract. We identify a set of orthogonal properties characterizingperiodicities; based on these we define a lattice of classes (of periodic-ities). For each property, we introduce a language operator and, thisway, we propose a family of symbolic languages, one for each subsetof operators, one for each point in the lattice. So, the expressivenessand meaning of each operator, and thus of each language in the family,are clearly defined, and a user can select the language that exactlycovers the properties of her domain. To the best of our knowledge, ourlanguage covering the top of the lattice (i.e., all of the properties) is moreexpressive than any other symbolic language in the AI and DB literature.
Keywords: user-defined periodicities, symbolic languages, orthogonaloperators.
1 Introduction
Calendars and periodicity play a fundamental role in the human modeling ofthe world, and are extremely relevant in many applications, spanning from fi-nancial trading to scheduling, from manufacturing and process control to officeautomation and data broadcasting. In most practical applications, supportinga “standard” calendar (i.e., the Gregorian calendric system) does not suffice,since user-defined periodicities need to be used (see, e.g., [13]). Thus, many dif-ferent AI and DB approaches have been devised to deal with periodicity andits related notions of granularity and calendric systems [2,13] (see, e.g., the sur-vey in [15]). Besides logical approaches ([4] and approaches in classical temporallogics) and mathematical ones (e.g., Kabanza’s linear repeating points [9]), sym-bolic approaches to user-defined periodicities are gaining an increasing relevance(consider, e.g., [11,12,3,14]). The latter provide a set of operators which can becombined in order to define complex periodicities in an incremental and compo-sitional way.1
For instance, in [11], “the first day of each month” can be modeled by first applyinga basic operator in order to define “day” and “month”, then applying a dicingoperators, to split months into sets of days, and finally a slicing operator, to selectthe first day in each set.
1
C. Bussler and D. Fensel (Eds.): AIMSA 2004, LNAI 3192, pp. 137–147, 2004.© Springer-Verlag Berlin Heidelberg 2004

138 L. Egidi and P. Terenziani
In this paper, we propose a family of new symbolic languages, that we de-signed according to the following intuitions:
the expressiveness of (symbolic) languages for periodicities can be charater-ized on the basis of a set of orthogonal properties;the less (symbolic) language operators are interdependent, the clearer istheir underlying semantics: operators should correspond as much as possibleto specific properties, without affecting each other;there is no “best language” per se: the goodness of a language depends onthe domain of application; the most suitable language is the one that meetsmore precisely the expressiveness requirements.
1.
2.
3.
With this in mind,
we identified (Sect. 2) five orthogonal properties that characterize user-defined periodicity. The definitional process was driven by considerationson the significance and usefulness of the structures that must be allowed, onhomogeneity arguments and on orthogonality requirements (cf. Item 1 and2 above);we defined, for any subset of these properties, a class of periodicities. Theclasses, ordered by set inclusion, form a lattice (Sect. 2). In [6] this latticewas used in order to classify different (symbolic) languages in the literature;we defined two basic (symbolic language) operators to express periodicitiesfor which none of the five properties hold; and five additional operators,one for each property (Sect. 3). Any subset of the five operators, togetherwith the basic ones, defines a language. Languages, ordered by set inclusion,define a lattice;we proved that the lattice of languages matches the lattice of periodicities,in that each node of the former has enough expressive power in order todefine exactly the omologous node in the latter (Sect. 4).
Our symbolic approach makes easier the task of choosing a priori a lan-guage, since the choice only depends on the properties of interest in the givendomain/application (see Issue 3 above). At a later stage, when the user needs todefine a new periodicity, the choice of the operators required is easier because itdepends on the properties of that periodicity.
To the best of our knowledge, our top language (i.e., the one that can dealwith all of the properties) is more expressive than any other symbolic languagein the AI and DB literature (see the comparison in [6]).
Moreover, the modularity of our approach can be exploited by language de-signers and implementers, since in order to operate on the whole family of lan-guages, one can simply focus on the seven operators. For instance:
the semantics of all the languages in the family can be provided on thebasis of the semantics of the seven operators. In [7], a semantics in terms ofPresburger Arithmetic is given;interpreters/compilers for each one of the languages can be built in a modularway.
In Sect. 5 we briefly compare our approach to others in the literature.

Orthogonal Operators 139
2 Properties
Intuitively, periodicities are events that repeat in a regular way in time. As inmany approaches in the literature, we choose to focus only on the temporalaspects of periodic events, disregarding other properties (e.g., agent, location).We adopt discrete, linearly ordered and unbounded time; time points are the basictemporal primitives. The basic structures on time points are time intervals i.e.,non empty sets of points. A convex time interval is the set of all points betweentwo endpoints.
We take calendars as the basis of our construction, as in most symbolicapproaches in the literature (e.g., [11,12,3,14]). Calendars (“minutes”, “days”,“months”) model the discrete time axis, partitioning it into a regularly repeatingpattern of adjacent intervals [11]. In particular, a chronon calendar defines thetick of the given (temporal) system. We call Cal the set of all calendars.
Approaches in the literature witness that the need for more complex struc-tures has been felt. An analysis of the various proposals led us to identify fivecrucial properties. We propose here definitions filtered through our intuition andour demand for orthogonality.
Operators to select some portions of the time line, dropping others, have beenprovided in, e.g., [11,12,3,14]. The resulting periodicities have the non-adjacencyproperty. We give a preliminary definition of the property, that captures theabove:NA - (prelim). A periodicity P has the non-adjacency property, if it has aninterval I, that is not P’s rightmost interval, such that for no Meet(I, J),where (see [1]).
For instance, “Mondays” has the non-adjacency property, as well as (ex.1)“Mondays from 8 to 18”.
In some cases, one may want to capture the fact that a periodic event occursover time intervals with gaps (i.e., holes) in them (see, e.g. [3]). For instance,(ex.2) “Working hours on Mondays, from 8 to 12 and from 14 to 18”, may berepresented using a gap interval for each Monday.G - A periodicity P has Gaps if it contains gap intervals.
Notice that the property of having gaps is orthogonal with respect to non-adjacency, since the former is about inner holes in intervals, and the latter aboutouter gaps between intervals. For instance, (ex.2) has both the NA and the Gproperty, while (ex.1) has only NA, and “each day, with the lunch-break gap(from 12 to 14)” has only G.
Intervals may overlap [5] (exact overlaps, i.e., multiple occurrences of thesame interval, are special cases). For instance, (ex.3) “Tom’s and Mary’s workinghours on Mondays” may be a case of (exact) overlap—consider e.g., the sameperiodicity (ex.2) for both Tom and Mary.
In order to disambiguate the relationship between gaps and overlaps, weintroduce the notion of extent. We define the extent of an interval (or sets thereof)as the interval whose endpoints are the minimum and maximum points belongingto the interval (or sets thereof).

140 L. Egidi and P. Terenziani
O - A periodicity P has Overlaps if the extents of some of the intervals havenon-empty intersection.
So, O is a property of interval extents, and therefore totally independentfrom G.
In order to preserve our intuition of non-adjacency, and to keep O and NAorthogonal, we settle on a more articulate version of NA-(prelim):NA - A periodicity has the non-adjacency property if it can’t be split in a finitenumber of periodicities that don’t satisfy NA-(prelim),(i.e., if it can’t be split in a finite number of periodicities that have adjacentintervals).
Other approaches pointed out the importance of dealing with bounded peri-odicities (consider, e.g., [2]) or with periodicities consisting of a finite aperiodicset of intervals plus a periodic part [10]. We introduce the property of beingeventually periodic (terminology taken from [8]) to model both (notice that abounded periodicity can be seen as a degenerate eventually periodic one with anempty periodic part).EP - A periodicity P is Eventually Periodic if it can’t be expressed giving arepeating pattern and a positive period.
Consider, e.g., (ex.4) “Tuesday January 13, 2004 plus Tom’s and Mary’sworking hours on Mondays (defined as in ex.3), starting from January 14, 2004”.
EP does not interact with G and NA, since EP is a property of the sequenceof intervals as a whole, whereas the other two are local properties. Also, EP andO are orthogonal, since the periodic and/or aperiodic parts may have overlapsor not.
Finally, Leban et al. [11] pointed out the importance of grouping intervalsinto structured collections. For instance, the periodicity in (ex.4) may be struc-tured by grouping intervals into collections, one for each month (ex.5). Nestedgroupings (e.g., into months and years) are also allowed.
To cope with structure, collections are introduced by Leban et al.We extend the definition to deal with multiple occurrences, by definingcollections as multisets:
Definition 1 (Collections). For each an collection is a multisetof collections. A time interval is an order-0 collection.
It is customary to use the set notation (with braces) for collections with
S - A periodicity has Structure if it is an collection, withSo, non-structured periodicities are order-1 collections, while collec-
tions with are needed for structured periodicities. S is orthogonal to NA,G, O and EP, since it operates at a different level.
So far, we defined five orthogonal properties. Even though the definitions aretailored in order to meet user needs, and obtain only meaningful structures, wemust place further constraints on the combinations of the five properties thatwe wish to allow, based on homogeneity observations.

Orthogonal Operators 141
Remark 1 (Homogeneity). In collections, braces are not annotated, i.e.no semantics can be attached to them. Therefore, to preserve a clean semantics,we only admit homogeneous structures, i.e. structures in which all data has beengrouped according to the same calendars.
A consequence of this choice is that overlaps between collectionsare not possible.
Based on the properties above, we build richer classes from Cal:
Definition 2 (Classes of periodicity). Let Cal denote the class of calendars,together with the null event. is the class of calendars together withall periodicities that may satisfy only properties in
3 Orthogonal Operators
We define two basic operators, that can be applied only initially and never afterthe other operators:
Chronon_Cal:No input;Output: an order-1 collection right and left infinite, containing adjacent one-element no-gap intervals.Cal_Def:Input: a calendar C in Cal, an ‘anchor’ time point which is the start pointof an interval in C, and a list of positive natural numbersOutput: a calendar, built by grouping cyclically intervals of Cstarting from (both directions), i.e. the set of all intervals
defined as follows: considering C as a set of intervals orderedaccording to the natural ordering, let and ap be theindex of the interval starting at the anchoring point, then
the starting point of is the starting point of the interval of positionin calendar C;
the ending point of is the ending point of the interval of positionin calendar C.
In the following we need two relational operators on intervals:
Definition 3 ( NSDur, SDur). Let E(J), be the extents of intervalsJ, J is non strictly during (J NSDur if contains E(J); Jis strictly during (J SDur if contains E(J) and the endpoints ofE(J) are both different from the endpoints of
Then we can introduce the five operators, paired with the five orthogonalproperties. We place constraints on the inputs that they can take, based on thefollowing remarks: (a) in the cases of Select and Drop, the structure of the secondargument is explicitly disregarded, therefore we prescribe an unstructured input;(b) for homogeneity reasons (see Remark 1) unions make sense only over order-1

142 L. Egidi and P. Terenziani
collections, which reflects on the definitions of Union and Replace; (c) operatorsmust either modify intervals or treat them as black boxes, for orthogonality (thisreflects on the definitions of Replace and Group_ by); (d) intuition suggests thata user first collects raw data and then organizes it logically, therefore Group_bycan only be applied last (all other operators have unstructured inputs); noticethat this is consistent also with (a) and (b) above.
Select (for non adjacency)Input: order-1 collections andOutput: An order-1 collection (or the empty set) containing for alland intervals defined as follows:
where selects the interval in the collection C. if it exists, itis the empty set otherwise.
See Remarks (a) and (b), above.Drop (for gaps)Input: order-1 collections andOutput: An order-1 collection containing for each the intervalobtained dropping from for the points belonging to theinterval
See Remarks (a) and (b) above.Union (for overlaps)Input: two order-1 collections andOutput: the order-1 collection containing all intervals of and (noticethat this is a multiset union, i.e. multiple occurrences are allowed).
For the constraints on the arguments, see Remark (b) above.Replace (for eventual periodicity)Input: Left and right infinite order-1 collections and (whereand can be the empty set, but not and time points such that
and if belongs to some intervals of or it is their rightendpoint, and similarly for relative to andOutput: An order-1 collection containing all intervals of up to and includ-ing point all intervals of from to (included), and all intervalsof from point
This operator corresponds to the intuition that a complex periodicityconsists of bounded portions of basic periodicities. It is defined on order-1 collections—see Remark (b). For the constraints on see Remark (c).Group_By (for structure)Input: An collection C and a calendar such that for each interval
there is an interval such that NSDur j;Output: An collection containing for each inter-val the collection that, for eachsubcollection of C whose extent has nonempty intersection with (i.e.
contains the subcollection obtained drop-ping from the intervals that are not contained in

Orthogonal Operators 143
The constraint on the second input stems from orthogonality—See remark(c) above. See also Remark (d).
We define the periodicities in the examples from Sec. 2 (we choose hours asthe chronon calendar, and the first hour of Jan 1st, 2004, as the origin; we don’tdetail the obvious definitions of days, months and weeks):
(ex.1) Mon8-18= Select(2, Days8-18, weeks) whereDays8-18= Select(2, C, days) and C = Cal_Def(hours, 0,(ex.2) WH = Drop Mon8-18, hours)(ex.3) M+T=Union(WH,WH)(ex.4) 288, days, 312, M+T),(ex.5) Group_by(P, months).
We prove that each operator affects a single property:
Theorem 1 (Orthogonality). {Select, Drop, Union, Group_By, Replace} isan orthogonal set of operators.
Proof (Sketch). We defined an operator introducing each property. We now show,for each property, that no other operator can introduce it.NA. The definition of NA itself is tailored so that Union can’t introduce it. Theuse of SDur ensures that Drop doesn’t introduce it. The same holds for Replace,because of the constraints on The constraints on the definition of Group_Byguarantee that the latter doesn’t affect the underlying sequence of intervals.G. The only operators that affect intervals are Cal_Def and Drop. Only Dropcan introduce gaps, since Cal_Def compounds adjacent intervals.O. Select and Drop can’t introduce overlaps by their nature. Replace can’t be-cause disjoint portions of periodicities are used to obtain the new one. Group_Bydoesn’t affect the underlying sequence of intervals.EP. Select, Drop and Group_By work periodically, and the period of their out-put is the least common multiple (lcm) of the periods of the inputs, if thosewere unbounded and with no aperiodic part. Similarly, Union doesn’t add EP,since if periodicities and are not bounded and have no aperiodic part,
is a pure unbounded periodicity with periodand repeating pattern the multiset union of adjacent occurrencesof and repetitions of over the same extent—where (resp. is the period (resp. repeating pattern) ofS. By definition, Select, Drop, Union and Replace output order-1 collections.Therefore, only Group_By can add structure.
4 Expressiveness
The operators we defined can be combined to obtain a family of languages. Letbe the basic language {Chronon_Cal, Cal_Def}. We prove that it defines
exactly the class Cal. Adding any combination of the other operators to it, we

144 L. Egidi and P. Terenziani
define a lattice of languages, ordered by set inclusion. We prove that the lattice oflanguages matches exactly the lattice of classes of periodicities, in the sense thatlanguage defines all and only the periodicities in(where is the operator that introduces property
The first part of this result is proven by Thm. 1. The converse (that thelanguages are expressive enough to define the corresponding classes) is provenby induction. In order to simplify the proof, it is convenient to fix an order inwhich operators are applied. This is not restrictive for our goals: in the lattice,all classes corresponing to all the combinations of properties are present, andtherefore it is not relevant in which order the properties are added or removed.Lemma 1 proves the induction steps:
The language defines at leastIf defines at least Cal (resp. then
defines at least (resp.If defines at least withthen Union} defines at leastIf the language defines at least with
then Replace} defines at least
If the language defines at least withthen Group_By} defines at
least
Lemma 1. 1. defines at least Cal.2.3.
4.
5.
6.
Proof. Let RP(C) be the repeating pattern of C and its period.
Let C be a generic calendar, whose repeating pattern consists of intervalsof widths Let ap be the starting point of one occurrence of therepeating pattern. Then
1.
Let If then the thesis follows from Item 1.Otherwise, define so that is obtained adding to RP(C) all convexintervals necessary to have adjacent intervals, and adjacent occurrences ofthe repeating pattern; Let be a periodicity with theextent of and Both and belong toCal and are definable inLet be the positions of the intervals of C in Then,
as required.Let (resp. If it doesn’t have property G, then the thesisfollows from Item 1 (resp. Item 2).So, let us assume that it has gap intervals. Then let be the intervalclosure of C, i.e. the periodicity consisting of the extents of all intervalsin C. Of course, the interval closure has the same properties as the originalperiodicity, except for gaps. Thus (resp. and can be definedin by hypothesis.
2.
3.

Orthogonal Operators 145
We add gaps appropriately one interval at a time in the repeating pattern ofusing suitable periodicities is identical to except for the interval
I that we need to modify. That one is replaced in by the subintervals thatmust be removed, and all the other, adjacent ones, to make sure that if Chas adjacent intervals, so has N is set to to identify theintervals in that must be removed from I. Then yieldsa new periodicity with the same gaps as C in all occurrences of I. The otherintervals are unchanged.With a finite number of applications of Drop as above, C is obtained. (Afterthe first application, will have, legitimately, gaps.)Let C be any periodicity in If it has no overlaps, it can bedefined in by hypothesis.Otherwise, it can be split in a finite number of periodicities with no overlaps.This introduces no gaps and no structure. It doesn’t need introduce EP sinceif C is purely periodic, then overlaps must repeat periodically. It doesn’t needto introduce NA either, by the definition of NA. Therefore we obtain a finitenumber of periodicities belonging to by hypothesis definable in
By a finite number of applications of Union we obtain Cas required.Let If it doesn’t have the property EP, it can be definedin by hypothesis.Otherwise, in the most general case, split it in two infinite periodicities anda finite one. Define by removing the right bound to the left infinite pe-riodicity obtained (call that bound and similarly (defining as theleft bound that has been removed); define by extending the aperiodicpart A to a periodicity with and the width of the extentof (If the periodicity C is finite to the left (resp. right), then(resp. is empty. Notice that it is always possible to choose or sothat is not empty.) These extensions don’t introduce G, nor NA, nor O,but simply reproduce them periodically if they appear in C.Therefore and by hypothesis are definable in
AndLet If it has no structure, it can be defined in
by hypothesis.So, let C have structure. First assume that it is an order-2 collection. Re-move its order-1 braces (i.e. the inner braces), transforming it to an order-1collection Define as a periodicity whose intervals are the extents ofthe order-1 subcollections of C. Notice that has no EP, by the definitionof S. It has no gaps, no overlaps, and no structure by definition, and hasNA only if C has NA. Therefore and can be defined in
Moreover,If C is an collection, the same construction can be appliedtimes, adding braces from the inside out, to the order-1 collection obtainedremoving all structure from C.
4.
5.
6.

146 L. Egidi and P. Terenziani
Let be the operator introducing property (thusetc.). We prove that is the minimal closure of Cal, with respect to
using Theorem 1 and Lemma 1:
Theorem 2. defines exactly
Proof. By Theorem 1, defines at mostThe converse is proven by induction on For the basis of the induction
is Lemma 1, Item 1. For positive the inductive step is proven using Lemma 1as follows: if by Item 6; otherwise, if (but notS), by Item 5; otherwise, if S and EP are not in but O is, by Item 4;otherwise, if by Item 3; if only NA holds, by Item 2.
5 Conclusions
We presented a family of symbolic languages for user-defined periodicity, thathas significant features and solves some drawbacks of languages in the literature.
The modularity of our approach allows for a clear management of proper-ties characterizing periodicities. We explicitly avoid side-effects, that impair theclarity of semantics elsewhere. Consider, for instance, in the language of [11],the definition of “the first Monday of each month”: group Mondays into months,using Dice, then select the first Monday in each group, with the Slice operator“[1]\”. Counterintuitively, this defines a collection of collections each containinga Monday.
Moreover, modularity allows to obtain the desired expressiveness for an ap-plication without the burden of unnecessary features. This is not obvious. Forintance, consider [3], in which it is explicitly stated that all the structure carriedover from [11] is of no use, but is there as an unavoidable heritage. The effortto get rid of the structure was then done in [14], and results in rather complexoperators.
Our top language is more expressive than any other symbolic language in theliterature, to the best of our knowledge, since it allows to deal with all the fiveproperties we defined, including the special case of exact overlaps, not treatedby any other symbolic approach.
But the expressiveness is enhanced not only in a quantitative way, but alsoqualitatively. Indeed, our design of the languages is based on an analysis of thestructures that it makes sense to define, in view of usage, homogeneity constraintsand our aim at modularity. Overlaps are a notable example—for instance, in[11] collections can overlap, resulting in structures of no clearmeaning (cf. Remark 1).
References
1. J.F. Allen, Maintaining Knowledge about Temporal Intervals, Communications ofthe ACM 26(11):832-843, 1983.

Orthogonal Operators 147
C. Bettini, C. Dyreson, W. Evans, R. Snodgrass, X. Wang, A Glossary of TimeGranularity Concepts, in Temporal Databases: Research and Practice, SpringerVerlag, 1998.C. Bettini, R. De Sibi, Symbolic Representation of User-defined Time Granulari-ties, Proc. TIME’99, IEEE Computer Society, 17-28, 1999.J. Chomicki, and T. Imielinsky, Finite Representation of Infinite Query Answers,ACM ToDS 18(2), 181-223, 1993.D. Cukierman, and J. Delgrande, Expressing Time Intervals and Repetition withina Formalization of Calendars, Computational Intelligence 14(4), 563-597, 1998.L. Egidi and P. Terenziani, A lattice of classes of user-defined symbolic periodicities,TIME’04, 2004.L. Egidi and P. Terenziani, A mathematical framework for the semantics of sym-bolic languages representing periodic time, TIME’04.Enderton, A Mathematical Introduction to Logic, Academic Press, New York, 1972.F. Kabanza, J.-M. Stevenne, and P. Wolper, Handling Infinite Temporal Data,Journal of Computer and System Sciences 51, 3-17, 1995.A. Kurt, M. Ozsoyoglu, Modelling and Querying Periodic Temporal Databases,Procs. DEXA’95, 124-133, 1995.B. Leban, D.D. McDonald, and D.R. Forster, A representation for collections oftemporal intervals, AAAI’86, 367-371, 1986.M. Niezette, and J.-M. Stevenne, An Efficient Symbolic Representation of PeriodicTime, Proc. CIKM, 1992.M. Soo, and R. Snodgrass, Multiple Calendar Support for Conventional DatabaseManagement Systems, Proc. ITD, 1993.P. Terenziani, Symbolic User-defined Periodicity in Temporal RelationalDatabases, IEEE TKDE 15(2), 489-509, 2003.A. Tuzhilin and J. Clifford, On Periodicity in Temporal Databases, InformationSystems 20(8), 619-639, 1995.
2.
3.
4.
5.
6.
7.
8.9.
10.
11.
12.
13.
14.
15.

Solving Constraints Between Lines in EuclideanGeometry
Philippe Balbiani and Khalil Challita
Irit-CNRS, Université Paul Sabatier118 route de Narbonne, 31062 Toulouse Cedex 4, France
{balbiani,challita}@irit.fr
Abstract. We consider constraints satisfaction problems between lines inEuclidean geometry. Our language of constraints is based on the binary relationof parallelism. Our main results state that (1) solving constraints between linesin dimension 2 can be done in polynomial time whereas (2) solving constraintsbetween lines in dimension 3 is NP-hard.
Keywords: Spatial reasoning - Constraint satisfaction problems - Euclidean ge-ometry.
1 Introduction
The growing field of qualitative spatial reasoning finds its application in a variety ofareas, such as Geographic Information Systems [8,9], Databases [17], Multimedia [21],Computer Vision and Artificial Intelligence. Most researchers have dealt with three mainclasses of spatial information. Topological relations describe how the interiors, the exte-riors and the boundaries of two regions relate [5,8,19,20]. Directional relations describethe relative position of two regions to one another [10,13,22]. For instance, Ligozat [13]studies the algebra of cardinal relations between points in dimension 2. Distance relationsdescribe the relative distance of two regions [9,24]. In artificial intelligence, variablesusually denote points [4] or regions [6,19]. The latter alternative is more often preferredbecause a region takes into account the space that might be occupied by an object, andthus enables us to study a wider class of common problems. Affine geometry, one ofthe most prominent mathematical models of space, arises from the study of points, linesand planes by means of properties stated in terms of incidence. In coordinate geometry,lines are sets of points satisfying linear equations. Completely determined by two oftheir points, they can also be considered as abstract entities. They have certain mutualrelations like, for instance, parallelism. Lines are to be found in many axiomatizationsof affine geometry. However, we had great difficulty finding any examples of qualitativeforms of spatial reasoning based solely on them. To confirm this claim, we have not beenable to find any explicit reference to a qualitative spatial reasoning framework devotedto the study of lines in Euclidean geometry.In this paper, we consider constraints satisfaction problems between lines in Euclideangeometry. Our language of constraints is based on the binary relation of parallelism.Our main results state that solving constraints between lines in dimension 2 can be
C. Bussler and D. Fensel (Eds.): AIMSA 2004, LNAI 3192, pp. 148–157, 2004.© Springer- Verlag Berlin Heidelberg 2004

Solving Constraints Between Lines in Euclidean Geometry 149
done in polynomial time whereas solving constraints between lines in dimension 3 isNP-hard. The article is organized as follows. In section 2, we introduce relevant notionsconcerning constraint networks in general, and state some results about the consistencyproblem of constraints between lines in the Euclidean plane. Sections 3 and 4 generalizethese results to a language enabling us to express ordering constraints or quantitativeconstraints between lines in dimension 2. In section 5, we establish that the complexityproblem of networks of constraints between lines in dimension 3 is NP-hard, even foratomic ones.
2 Lines in Dimension 2
From now on, by PO, EQ, DC we respectively mean: “having one point in com-mon”, “equal”, “parallel and distinct”. Two lines in the plane, denoted by andare exactly in one of the following relations: LetE = {PO, EQ, DC} be the set of the jointly exhaustive and pairwise disjoint rela-tions that compare the position of any couple of lines in a plane.The definitions needed for describing a constraint satisfaction problem (CSP), are definedby Montanari [16]. A network of linear constraints is a couple (I, C), whereis a finite set of variables, and C is a mapping from to the set of the subsets of E (i.e.
The network is atomic if for all if thenWe say that is path-consistent if for all Thecomposition table of the relations considered is given in figure 1, where the symbols< and > account for the relation {DC}. A scenario (or an assignment) is a functionV that maps I to a set of lines, in the Euclidean plane. A scenario is consistent if forall the relation that holds between the lines and is in
A relation is feasible if there exists a consistent scenario such thatthe lines and are in the relation A network of constraints is minimal if everyrelation in it is feasible. The notion of adapted from Freuder [11],leads naturally to strong k-consistency, as defined by Vilain and Kautz [23]. We saythat is k-consistent if, given any consistent assignment of of its variables tolines in the Euclidean plane, there exists a consistent assignment ofany variable ofthe network. It is strongly k-consistent if it is j-consistent for all A network issaid to be globally consistent if it is strongly n-consistent, for Given anetwork of constraints, the question that arises is whether or not there is a consistentscenario for it. The algorithm of path consistency is explored and analyzed in [14,15].The constraints propagation algorithm due to Allen [1], that replaces each constraint
by transforms in polynomial time each networkinto a path-consistent one, whose set of consistent scenarios is the same as for
Example 1. Path-consistent but not globally consistent network of linear constraints:I = {1, 2, 3, 4, 5} and C(1, 2) = C(1, 5) = C(3, 4) = C(3, 5) = {PO, EQ},C(1, 3) = C(1, 4) = C(2, 3) = C(2, 4) = {PO, DC}, C(2, 5) = {PO, DC, EQ},C(4, 5) = {DC, EQ}. Indeed, if we consider its subnetwork where C(1, 2) =C(3, 4) = {EQ} and C(1, 3) = C(1, 4) = C(2, 3) = C(2, 4) = {DC}, we findit impossible to consistently assign the fifth variable. We can easily check that the abovenetwork is minimal.

150 P. Balbiani and K. Challita
The following result is an immediate corollary of proposition 2 (see below).
Proposition 1. The consistency problem of networks of linear constraints is decidablein polynomial time, by means ofa deterministic algorithm.
Consider a network (I, C) of constraints between lines in the Euclidean plane. If thisnetwork is consistent then, obviously, we can find a consistent scenario V such that forall in I, is a nonvertical line. Indeed, as the constraint networks we consider arefinite, we take care during the construction of a scenario V not to assign to a variable
a line parallel to the the vertical axis, in order to avoid having equations of the formwhere
3 Oriented Parallelism
From now on in this section, we only consider nonvertical lines in the Euclidean plane. Itis a well-known fact that such lines are defined by a linear equation of the formwhere and are real numbers. Given two parallel lines in the Euclidean plane, we givean orientation to their respective positions. Informally, for a line we wish to be ableto distinguish the parallel lines that lie to its left from those that are to its right.
Fig. 1. Composition table of oriented 2D relations.
Definition 1. For any two lines and of the Euclidean plane with equationsand
An oriented 2D network is a linear constraint network of lines in a Euclidean plane,where the relations are taken from the set E = {PO, EQ, <, >}.
The binary relations < and > are the inverse of each other (i.e. iffWe have the equivalence The composition
iffiff
iffiff

Solving Constraints Between Lines in Euclidean Geometry 151
table of these relations is given in figure 1. We used the consistency-based compositionof relations [3] to compute it: if then contains all the relations suchthat there exists lines of the plane satisfying and
Example 2. Oriented 2D network which is not minimal: I = {1, 2, 3, 4} and C(2, 1) =C(3, 1) = C(4, 1) = C(4, 2) = C(4, 3) = {>, EQ}, C(2, 3) = {<, >}. Indeed, therelation between the first and the fourth variables cannot be reduced to {EQ}.
The most important question about networks of constraints concerns the tractabilityof the consistency problem. The following proposition states that solving networks ofconstraints with oriented 2D relations can be done in deterministic polynomial time.
Proposition 2. The consistency problem of oriented 2D networks is decidable in poly-nomial time, by means of a deterministic algorithm.
Proof. In his work [13], and in order to compare the different positions of points withcartesian coordiantes and in the Euclidean plane, Ligozat defined thefollowing nine relations: (<, <), (<, =), (<, >), (=, <),(=, =), (=, >), (>, <), (>, =), (>, >). To each set of oriented 2D relations we can associate a set of cardinalrelations such that an oriented 2D relation satisfied by the lines (with equation
and (with equation is in iff the cardinal relation satisfiedby the points and is in
By construction, the consistency problem of an oriented 2D network is polynomiallyreducible to the consistency problem of a network of cardinal constraints. Moreover, weeasily check that the sets of cardinal relations defined above are preconvex. We concludeour proof by recalling that the consistency problem of networks of preconvex cardinalconstraints is decidable in polynomial time [13].

152 P. Balbiani and K. Challita
4 Metric Constraints in Dimension 2
Our aim in this section is to define quantitative relations that allow us to compare thedistance that separates two parallel lines of the Euclidean plane. We will first considerrelations that enable us to tell if, for two parallel lines and the distance betweenthem (denoted later on by is less or equal to a certain value. The latter relationwill then be augmented by another one, allowing us to tell whether or not the distancefrom to is superior to a real number.
Definition 2. Let For any couple of lines in the Euclidean plane:
A metric 2D network is a linear constraint network of lines in a Euclidean plane, wherethe relations are of the form {PO}, and
Remarks. For consider two parallel lines in the Euclidean plane distantof which equations are and These lines are identical iff
Moreover, where the realsatisfies the equation Symmetrically,
Hence, the constraints and are strictly equivalent to the constraintsand Thus we can invariably switch between
and (the same reasoning applies to Forthe composition of relations of the form and (showed in figure 2), we use thedefinition of its counterpart, given in [7]: for any two intervals T and S, the composition
admits only values for which there exist and such thatRecall a result concerning TCSP networks, established by Dechter et al. [7]: the path-consistency algorithm terminates when applied to an integral TCSP, where the extremepoints of all its intervals are rational numbers. Later on, when looking for a consistentscenario of a metric 2D network, we can take the distances between all of its linesto be integers. Thus, the path-consistency of such a network can be established usingMontanari’s proof [16].
Fig. 2. Composition of metric 2D networks’ relations.
is parallel to andis parallel to and

Solving Constraints Between Lines in Euclidean Geometry 153
Let For any line of the Euclidean plane the set of lines such thatrepresents by convention all the parallel lines that are equal or parallel to In thatcase, the relation will be denoted by Let us consider the inner difficulty ofproving the consistency of a given metric 2D network of constraints.
Proposition 3. The consistency problem of metric 2D networks is NP-complete.
Proof. Given a metric 2D network for all letand be the sets of all corresponding parallel constraints appear-ing in It is clear that the disjunction of constraints (resp. can equiv-alently be reduced to (resp. where
(resp. Let be the constraint networkobtained in the following way: replace by and by Then,
by replacing in by {DC}, by {DC, EQ} and by {DC, EQ},we can polynomially check if the resulting network of linear constraints is consistentor not (due to proposition 1). If it is consistent, let be a ! solution,which is an atomic linear constraint network. We then switch back to a subnetwork
of where every relation is replaced by the originalparallel one (i.e. or/and Thus, for all either
or Checking the consistency of leads us to find a consistent
scenario for the variables where Knowing that theconsistency problem of a TCSP is NP-complete [7], our proposition is proven.
Corollary 1. The consistency problem of metric 2D networks, where the only allowedparallel constraints are of the form is in P.
This result stems directly from the fact that the consistency problem of an STP (whichis by definition an atomic TCSP) is in P [7].
5 Lines in Dimension 3
To compare the different positions of lines in the space, we add a fourth relation repre-senting the non-coplanarity (NC) between two lines. The set E = {PO, EQ, DC, NC}contains relations that are jointly exhaustive and pairwise disjoint, where each one isequal to its inverse. We already know from the decidability of elementary geometry [12]that the consistency problem of networks of linear constraints in the Euclidean spaceis decidable. We next show that this problem is NP-hard, by polynomially reducing theproblem “Not-all-equal SAT” to the problem of lines in the space. The decision problem“Not-all-equal SAT” comes from classical propositional logic. Given a conjunction ofclauses containing exactly 3 literals, the issue at stake is to determine whether thereexists a valuation satisfying it and such that in no clause are all 3 literals equal in truthvalue. See [18] for details.
Definition 3. A spatial network is a linear constraint network of lines in a Euclideanspace.

154 P. Balbiani and K. Challita
As in section 3, we use the consistency-based composition of relations to compute thetable in figure 3: if then contains all the relations such that thereexist lines in the space satisfying and
Fig. 3. Composition table of spatial relations.
Example 3. Here are some examples of spatial networks, containing four elements.
1. Non-consistent and path-consistent atomic spatial network: C(1, 2) = {DC},C(1, 3) = C(1, 4) = C(2, 3) = C(2, 4) = {PO}, C(3, 4) = {NC}. Indeed,we cannot consistently assign the fourth variable. This shows that the polynomialmethod of path consistency (Allen’s triangulation) doesn’t provide a complete de-cision procedure for the consistency problem of spatial networks.Non-globally consistent and path-consistent spatial network: C(1, 2) = C(1, 3) =C(2, 3) = {DC}, C(1, 4) = C(2, 4) = {PO}, C(3, 4) = {NC}. If we assign tothe third variable a line included in the plane defined by the parallel lines and
we find it impossible to consistently assign the fourth one.
2.
Proposition 4. The consistency problem of spatial networks is NP-hard.
Proof. Let be a conjunction of clauses having exactly 3 literals.We next associate to a spatial network For our purpose,will designate the set of atoms appearing in and their associatedlines in In the network the lines that constitute our basicstructure must satisfy the conditions:
For all and for all atoms appearing in the clausewe associate the lines and These lines must satisfy the conditions:
The intuitive interpretation of the literals in is: for each literal is true if the lineis included in the plane (P), defined by the lines otherwise is false.Notice that all lines are either parallel to and are included in (P), or they intersect
and We easily check that for each atom appearing in a clause the constructionof the lines and is mutually exclusive, in the sense that one of them is includedin (P), whereas the other passes through it.

Solving Constraints Between Lines in Euclidean Geometry 155
To successfully complete our reduction, for each clause at leastone line must be included in (P), and another one must pass through it, where
To achieve our aim, for all the lines and must satisfythe following condition: For each clause we represent the lines
in such a way that for every distinct there exists satisfyingand This condition ensures that at most two
lines are either parallel to or intersect it.
This proves that a formula is satisfiable iff is consistent. As the reduction madeabove is done in polynomial time in the length of the formula the proposition isestablished. Hence, determining consistency of networks of constraints between linesin the Euclidean space is untractable. The following proposition implies that it is stilluntractable if one considers networks of atomic constraints.
Proposition 5. Any spatial network is polynomially reducible to an atomic one.
Proof. Let (I, C) be a spatial network. In order to prove this result, we need to checkthat for each such that is a disjunction of constraints of the set E ={PO, EQ, DC, NC}, the variables and the constraint can be equivalentlyreplaced by an atomic spatial network. For all cases stated below, we replace by{PO, EQ, DC, NC} and then add some relevant variables.
1.
2.
3.
4.
5.
6.
7.
8.
we add the variables together with the following constraints
we add the variables together with the followingconstraints
we add the variables together with the followingconstraints
we add the variables together with the followingconstraints
we add the variables that respectively satisfy
of proposition 4. Moreover, we impose the following conditionsthe same constraints as those satisfied by defined during the proof
we add the variables together with the followingconstraints
we add the variables together with the follow-ing constraints
we add the variables together with the follow-ing constraints

156 P. Balbiani and K. Challita
9. we add the variables together with the follow-ing constraints
10. we add the variables together with the follow-ing constraints
The path consistency property enables us to check that the resulting network has thesame set of consistent scenarios as (I, C). Also note that for a spatial network ofelements, there are at most constraints. We conclude that our reduction is polynomialin the size of the network (I, C), and is done in time
Corollary 2. The consistency problem of atomic spatial networks is NP-hard.
In the proof of proposition 4, it suffices to transform the relations {PO, NC} and{PO, DC} into atomic ones.
6 Conclusion and Perspectives
In this paper we studied several path-consistent constraint networks of lines in the Eu-clidean plane and space. Our main goal was to determine the complexity of the consis-tency problem of a network of linear lines. We have already shown that for a networkof linear lines, this problem is in P. Considering some special relations between twoparallel lines in a plane, we established that the complexity problem of an oriented 2Dlinear network (i.e. when the orientation of parallel lines is taken into account) is still inP, whereas the one concerning a metric 2D network (i.e. when the distance separatingtwo parallel lines is considered) is NP-complete. We then showed that the consistencyproblem of atomic networks of lines in the Euclidean space is NP-hard, by polynomiallyreducing the problem “Not-all-equal SAT” to the problem of lines in the space.Our next step is to determine the complexity of oriented and metric networks in theEuclidean space. But first, an important question that arises is whether the consistencyproblem of spatial networks is in NP. Given such a network we need to exhibit a nondeterministic program running in polynomial time in the length of the spatial network’svariables, that computes a consistent scenario for
Acknowledgements. Khalil Challita benefits from grants, allowed by the LebaneseNational Council for Scientific Research and by the Paul Sabatier University.
References
1.
2.
Allen, J., Maintaining knowledge about temporal intervals, Communications of the Associ-ation for Computing Machinery, 26, pp. 832–843, 1983.Balbiani, P., Raisonner à propos des droites et des cercles: réseaux de contraintes et systèmesdéductifs, Reconnaissance des Formes et Intelligence Artificielle (RFIA), 2004.

Solving Constraints Between Lines in Euclidean Geometry 157
3.
4.5.
6.
7.
8.
9.
Bennett, B., Isli, A., Cohn, A.G. When does a composition table provide a complete andtractable proof procedure for a relational constraint language?, in: Proceedings of Interna-tional Joint Conference on Artificial Intelligence (IJCAI), 1997.Clarke, B. Individuals and points, Notre Dame Journal of Formal Logic, 26, pp. 61–75,1985.Cui, Z., Cohn, A., Randell, D. Qualitative and topological relationships in spatial databasesin: Proceedings of SSD-93, pp. 296–315, 1993.Jean-François Condotta Problèmes de satisfaction de contraintes spatiales : algorithmes etcomplexité, Thèse de 1’université Paul Sabatier, 2000.Dechter, R., Meiri, I., Pearl, J. Temporal constraint networks, Artificial Intelligence, pp. 61–95, 1991.Egenhofer, M.J. Reasoning about binary topological relationships, in: proceedings of SSD-91, pp. 143–160, 1991.Frank, A.U. Qualitative spatial reasoning about distances and directions in geographic space,Languages and Computing, pp. 343–371, 1992.Freska, C. Using orientation information for qualitative spatial reasoning, in: Proceedingsof COSIT-92, Lecture Notes in Computer Science, Springer, pp. 162–178, 1992.Freuder, E. A Sufficient condition for backtrack-free search, Journal of the ACM, pp. 24–32,1982.Henkin, L., Suppes, P., Tarski, A. The axiomatic method, North Holland, 1959.Ligozat, G. Reasoning about cardinal directions, Journal of Visual Languages and Computing,9, pp. 23–44, 1998.Mackworth, A. Consistency in networks of relations, Artificial Intelligence, pp. 99–118, 1977.Mackworth, A., Freuder, E. The complexity of some polynomial network consistency algo-rithms for constraint satisfaction problems, Artificial Intelligence, pp. 65–74, 1985.Montanari, U. Networks of constraints: Fundamental properties and application to pictureprocessing, Information Sciences, pp. 95–132, 1974.Papadias, D., Theodoridis, T., Sellis, T., Egenhofer, M.J. Topological relations in the world ofminimum bounding rectangles: a study with R-trees, in: Proceedings in ACM SIGMOD-95,pp. 92–103, 1995.Papadimitriou, C. Computational complexity, Addison Wesley, USA, 1994.Randell, D., Cui, Z., Cohn, A. A spatial logic based on regions and connection, in Nebel,B., Rich, C., Swartout, W. (editors): Proceedings of the Third International Conference onPrinciples of Knowledge Representation and Reasoning. Morgan Kaufman, pp. 165–176,1992.Renz, J., Nebel, B. On the complexity of qualitative spatial reasoning: a maximal tractablefragment of the region connection calculus, Proceedings IJCAI-97, Nagoya, Japan, pp. 522–527, 1997.Sistla, A.P., Yu, C., Haddad, R. Reasoning about Spatial Relations in Picture Retrieval Systems,in: Proceedings in VLDB-94, pp. 570–581, 1994.Skiadopoulos, S., Koubarakis, M. Composing cardinal directions relations, in: Proceedingsof the Seventh International Symposium on Spatial and Temporal Databases (SSTD’01),Lecture Notes in Computer Science, Springer, pp. 299–317, 2001.Vilain, M., Kautz, H. Constraint propagation algorithms for temporal reasoning, Proceedingsof the Fifth National Conference on Artificial Intelligence. American Association for ArtificialIntelligence, pp. 377–382, 1986.Zimmermann, K. Enhancing qualitative spatial reasoning- Combining orientation and dis-tance, in: Proceedings of COSIT-93, Lecture Notes in Computer Science, Springer, pp. 69–76,1993.
10.
11.
12.13.
14.15.
16.
17.
18.19.
20.
21.
22.
23.
24.

An Oracle Based Meta-learner for FunctionDecomposition
R. Shyam Sundar Yadav and Deepak Khemani
Dept. of Computer Science and Engineering,Indian Institute of Technology Madras,
Chennai 600036, [email protected], [email protected]
Abstract. Function decomposition is a machine learning algorithmthat induces the target concept in the form of a hierarchy of intermediateconcepts and their definitions. Though it is effective in discoveringthe concept structure hidden in the training data, it suffers muchfrom under sampling. In this paper, we propose an oracle based metalearning method that generates new examples with the help of a baggedensemble to induce accurate classifiers when the training data setsare small. Here the values of new examples to be generated and thenumber of such examples required are automatically determined bythe algorithm. Previous work in this area deals with the generationof fixed number of random examples irrespective of the size of thetraining set’s attribute space. Experimental analysis on different sizeddata sets shows that our algorithm significantly improves accuracy offunction decomposition and is superior to existing meta-learning method.
Keywords: Machine learning, Function decomposition, Bagging, Meta-learning.
1 Introduction
Function decomposition is a machine learning and data mining algorithm pro-posed by Zupan et. al. [12] that discovers hierarchical structure of the targetconcept hidden in the training data. As opposed to other symbolic learning al-gorithms which represent the classifier in terms of rules or decision trees, functiondecomposition induces the classifier in the form of a set of intermediate function(or concept) definitions and associations among them. Given a set of trainingexamples described by a set of input attributes and a class label, function decom-position first divides this data set into two by partitioning the input attributeset. These two are then recursively divided resulting in a hierarchy of concepts.Generalization also occurs in this discovery of hierarchical structure.
It is empirically shown that function decomposition is effective in finding thecorrect concept structure underlying the training data and accurate in predictingthe class values of unseen examples. However, it is more sensitive to training dataand suffers much from under sampling [12]. When training set is small, it does
C. Bussler and D. Fensel (Eds.): AIMSA 2004, LNAI 3192, pp. 158–167, 2004.© Springer-Verlag Berlin Heidelberg 2004

An Oracle Based Meta-learner for Function Decomposition 159
not guarantee the discovery of correct intermediate concepts and thus tends tobe less accurate. Thus it becomes inapplicable to find accurate classifiers from asparse training data.
In this paper, we present an oracle based meta-learning method called oracleHINT that generates additional examples with the help of a bagged ensemble,adds them to the training data and then induces a classifier from this newtraining data. This method is inspired from combined multiple models (CMM)approach to induce accurate classifiers [3]. The main idea behind this approachcan be summarized as follows. In general, when the training data is sparse, thelearning algorithm’s heuristics may not allow it to find the accurate classifier.So, the learning algorithm’s heuristics may benefit if the algorithm is given someadditional examples. The class values of additional examples can be found froman ensemble constructed from the same training data, as ensemble is shown tobe more accurate than a single classifier [2].
However, the proposed method differs from CMM in two important ways: (1)the new examples that have to be generated are automatically determined bythe method (2) the number of new examples generated changes from one dataset to another and is found by the method, where as in CMM the values for thenew examples are generated randomly following the distribution inherent in theclassifier produced by bagged ensemble and the number of new examples is setto 1000 irrespective of the size of the training data set. These two modificationsare necessary in order to properly guide the heuristics of learning algorithm byproviding the right examples and to vary the number of new examples accordingto training set’s domain size, as generating too many examples may misleadthe meta-learning algorithm in the case of small attribute spaces. The proposedmethod is experimentally evaluated to verify its accuracy gains as well as itssuperiority to CMM approach.
The rest of the paper is organized as follows. Section 2 reviews the relatedwork. Section 3 first describes the function decomposition algorithm and thenpresents our method, oracleHINT. Empirical evaluation of our method is pre-sented in Section 4. Finally Section 5 concludes by specifying directions to futurework.
2 Related Work
Asenhurst [1] first proposed decomposition method for the design of switchingcircuits. His decomposition method was used to decompose a truth table of a spe-cific boolean function to be then realized with standard binary gates. Recently,his method was improved to allow incompletely specified switching functions [7].Luba [4] presented a method for the decomposition of multi-valued switchingfunctions in which each multi-valued variable is encoded by a set of Booleanvariables. The authors also identified the usefulness of function decompositionfor machine learning.
Within the machine learning framework, there are approaches that are basedon problem decomposition but where the problem is decomposed by an expert

160 R. Shyam Sundar Yadav and D. Khemani
and not automatically discovered by machine. A well-known example is struc-tured induction applied by Shapiro [9]. This approach is based on a manualdecomposition of the problem and an expert assisted selection of examples toconstruct rules for the concepts in the hierarchy.
Recently Zupan et. al. [11] proposed a new method for function decomposi-tion in the context of machine learning. The main objectives of this method areto automatically derive the hierarchical structure hidden in the training set andto induce classifiers that generalize from training data. The current paper triesto improve the accuracy of this function decomposition method in the case ofsmall training sets with the help of an ensemble. One such approach where anensemble is used to improve the quality of classifier can be found in [3]. The mainidea of this method is to generate 1000 new examples following the distributionpresent in the classifier produced by an ensemble, find the class values of thesenew examples using that ensemble and then induce a classifier from the originaltraining examples and these new examples.
3 An Oracle Based Function Decomposition
In this section, we first briefly describe the function decomposition method, thenanalyze the reasons for its inaccuracy when the training data is sparse, and finallypresent our method.
3.1 Function Decomposition
Given a set of training examples that partially describes the functionand a partition of input attributes such that and
the goal of the core part of the algorithm is to find two new intermediateconcepts and by constructing two new example sets
and respectively. This process is called single step decomposition or basicdecomposition step.
The two examples sets are discovered in the following way. Given an exampleset and a disjoint partition of X to single step decomposition step firstconstructs a partition matrix, which is a tabular representation of exampleset with all combinations of values of attributes in A as row labels and ofB as column labels. Each example has its corresponding entry inwith a row index and a column index Those entries which do nothave corresponding examples in are unspecified. An example data set and apartition matrix are shown in the Figure 1 for illustrative purpose.
Each column in the partition matrix denotes the behaviour of F when theattributes in B are constant. The columns which have the same entries for allrows are said to be compatible to one another. All columns of partition matrixare given numeric values that describe the intermediate function such thatcompatible columns get the same value. This numbering of columns is found bycoloring the column incompatibility graph, a graph whose vertices are columnsof partition matrix and whose edges connect two vertices if the columns they

An Oracle Based Meta-learner for Function Decomposition 161
Fig. 1. An example data set that partially specifies and a Partitionmatrix for the partition
represent are incompatible. The intermediate concept values are shown in thelast line of the partition matrix of Figure 1.
Now, the column labels along with these numeric values constitute the ex-ample set for the concept The second example set is alsoderived from partition matrix in the following way. For any value of and com-bination of values of attributes in A, is determined by lookingfor an example in row and in any column labeled with the value ofIf such example exists, an example with the attribute set and class
is added to Decomposition generalizes every unspecified entry ofin a row and a column if a corresponding example with
and column with the same label as is found.This basic decomposition step is recursively applied to the two intermediate
functions until the overall complexity of decomposed function is less than thecomplexity of original function or the original function contains fewer than thantwo attributes.
Note that the basic decomposition step requires the partition of input at-tribute set along with the example set that has to be decomposed. This correctpartition of input attributes is also found with the help of basic decompositionstep. Every possible partition of input attribute set is evaluated by basic decom-position step and the one that requires minimum number of values to encodethe intermediate function is chosen as the best partition of input attributes. Thesize of second partition (B) is limited by an upper bound, similar to [11].
3.2 Problems Due to Sparseness of Data
When the training data set is small, most of the entries of partition matrixare unspecified. In such a scenario, the basic decomposition step may not haveenough support (number of entries that match) to make two columns compatible.Moreover, there is a chance of making two columns compatible even though the

162 R. Shyam Sundar Yadav and D. Khemani
two columns may not have same entries, because of unspecified entries whichmatch with any value. This affects the discovery of both the number of labelsrequired to encode intermediate function and value of intermediate concept foreach column. Thus, the function decomposition algorithm may not have enoughinformation to find the correct definitions of intermediate concepts.
3.3 The OracleHINT Meta-learning Algorithm
In this sub section, we present our oracle based function decomposition method,called oracleHINT. The method mainly consists of three modules: Partition se-lector, Training set expander and Oracle. Training set expander finds the inputvalues of new examples whereas the class values of these additional examplesare determined with the help of a bagged ensemble (called Oracle) constructedusing function decomposition as the base algorithm. The main purpose of parti-tion selector is to evaluate all the partitions and choose the best partition. Thealgorithm is shown in the Figure 2. The details of three modules are given in thefollowing.
Oracle. At every level of decomposition, the example set that needs tobe decomposed into and is passed to oracle which then constructs abagged ensemble from it. The next role of oracle is to find the class values ofnew examples. The new examples presented to oracle are complete in the sensethat values are specified for all input attributes.
Training set expander. The main role of training set expander is to populatethe partition matrix such that basic decomposition step possesses sufficient in-formation to find the correct intermediate concept definition. Given a partitionmatrix and intermediate concept labels for all columns, training set expanderfirst groups the columns according to their labels. Then for each group, it findsthe input attribute values of the unspecified entries. Note that these can be ob-tained by looking at the row and column indices of unspecified entries. Theseunspecified entries constitute the new example set. The main idea here is tore-evaluate the correctness of concept labels of partition matrix columns (andhence the intermediate concept definition) by providing additional informationfor each group. This procedure is illustrated in the Figure 3 for the partitionmatrix of Figure 1.
Note that all the unspecified entries are added to additional example set here.However, it is not the case in general, as there is an upper bound on the numberof examples added to each partition matrix. The reason behind this upper boundis this: since bagged ensemble is only slightly accurate than the base algorithm,generation of too many examples may mislead the meta learning algorithm. Ingeneral, for every group the algorithm adds at most unspecified entriesof each row. Moreover, there is an upper bound, N (= 1500), on the total numberof examples added to the best partition at all levels.
For efficient implementation, we followed similar approach of [11]. The algo-rithm first sorts the examples based on the values of attributes in A and

An Oracle Based Meta-learner for Function Decomposition 163
Fig. 2. The oracleHINT meta-learning algorithm
vales of The examples with the same constitute groups that correspondto rows in partition matrix Within each group, examples with the samevalue of constitute subgroups. We further sort each subgroup according totheir class label to obtain sub-subgroup. Note that it does not imply that twocolumns that are in the same subgroup have the same class label. The input val-ues of new examples can easily be obtained in the following way. First arrangethe columns of partition matrix according to their class label in a temporarylist called gpColumnsByColor. Then for each sub-subgroup, find the class valueof first column and then use gpColumnsByColor to find the remaining columnsthat are absent in that particular sub-subgroup and have the same class value.These form the B part of new examples. The A part is obtained by the valuesof the group (or row) in which this sub-subgroup exists.

164 R. Shyam Sundar Yadav and D. Khemani
Fig. 3. Rearranged partition matrix and input values of Additional examples
Partition selector. Given a training set partition selector chooses all par-titions which result in intermediate concepts that have the same minimum sizewith the help of basic decomposition step. Our experiments with function de-composition revealed that many partitions result in the same sized intermediateconcepts because of sparseness of data. It then passes these partition matricesalong with the concept labels to training set expander which adds new exam-ples. The next role of partition selector is to re-evaluate these partition matrices(after addition of examples) and choose the best partition.
4 Empirical Evaluation
This section presents the empirical evaluation of the proposed method. Apartfrom verifying oracleHINT meta-learning method, we also evaluate combinedmultiple model approach to HINT in order to asses that guided generation ofadditional examples and varying the number of additional examples accordingto the size of the domain will indeed result in more accurate classifiers. Thusthe issues that are addressed in the empirical study include (1) the accuracygains provided by oracleHINT to HINT (2) superiority of oracleHINT overCMMHINT in improving accuracy.
The function decomposition method, HINT, we implemented was the oneproposed in [11]. This does not deal with the noise data and continuous classes.We also implemented CMMHINT, CMM with function decomposition as thebase learner. The number of additional examples (N) generated in this case isexperimentally calculated by varying the number from 1000 to 2000 in stepsof 500. N = 1500 yielded better results and hence this number is chosen forCMMHINT as well as the upper bound for oracleHINT. The number of modelsgenerated for bagged ensemble and CMMHINT is set to 10.
The experiments are carried out on 8 data sets taken from UCI Machinelearning repository [10]. The characteristics of these datasets are shown in theTable 1. There are basically two kinds of datasets: full training sets taken fromlarge domains and a small portion of available training data taken from smalldomains. The datasets Wisconsin breast cancer, Vote, Breast cancer and Lym-

An Oracle Based Meta-learner for Function Decomposition 165
phography fall in the first category while Monk1, Monk2, Car and Balance comeunder second category. 1 The proportion of training data taken for second cate-gory is also included in the Table 1 and shown next to the data set name. Thesetwo kinds of data sets are taken in order to analyze the effects of input domain’ssize on the number of additional examples generated.
Classification accuracies are measured using 10-fold stratified cross valida-tion. The average and the standard deviation of the accuracies for all the methodsare shown in the Table 2. From the table, it is evident that oracleHINT improvesthe accuracy of HINT on all the datasets. Moreover, it outperforms CMMHINTin all but two data sets where the accuracy is slightly lower (0.36% and 0.67%).The average gain of accuracy provided by oracleHINT and CMMHINT are8.59% and 2.55% respectively. OracleHINT is more accurate than HINT andCMMHINT with a confidence of 99% and 98% respectively, according to apaired The number additional of examples generated by oracleHINT foreach of the data set is shown in the Table 3. From the table it is clear thatoracleHINT generates new examples according to the size of the training set’sdomain. Note that at every level, additional examples are added for severalcandidate parttitions. The number indicated here is the sum of the number ofexamples added for the best selected partition found after re-evaluation at alllevels.
For the Wisconsin breast cancer data set, oracleHINT and CMMHINT im-proved the accuracy of HINT by 3.14% and 0.44% respectively. Note that thenumber of new examples generated by oracleHINT in this case is only 1375as compared to 1500 generated by CMMHINT. This means that with a fewernumber of appropriate new examples, oracleHINT is able to produce a clas-sifer that is 2.7% more accurate than CMMHINT. In the case of Vote data set,oracleHINT generated 1528 new examples and is able to produce a classifier thatis 6.59% and 1.55% more accurate than HINT and CMMHINT respectively.That is with only 28 additional examples, when comparaed to CMMHINT,oracleHINT produced a more accurate classifier which is a clear evidence of our1 Lymphography and Breast Cancer data sets were obtained from the University Med-
ical Centre, Institute of Oncology, Ljubljana, Yugoslavia. Thanks go to M. Zwitterand M. Soklic for providing the data.

166 R. Shyam Sundar Yadav and D. Khemani
claim that producing suitable new examples in stead of random examples wouldgreatly benifit the meta-learning algorithm to induce accurate classifiers.
However, in the two data sets, the accuracy of oracleHINT falls just belowthat of CMMHINT. For the Breast cancer domain, the accuracy gain pro-vided by CMMHINT is 3.22% where as oracleHINT gained 2.86%. However,the oracleHINT algorithm generated only 1059 new examples as contrast to1500 generated by CMMHINT. Thus oracleHINT used a fewer number of newexamples to produce a classifier that is closely equivalent (in terms of accuracy)to that of CMMHINT which means that all new examples would have beenhelpful to the heuristics of the meta-learner.
In the case of small domains, both meta-learning algorithms, as expected,perform uniformly better than HINT and oracleHINT outperforms CMMHINTon all data sets. The accuracy gains provided by oracleHINT are very highaveraging over 9.54% while that of CMMHINT average over 4.12%. Note thatthe number of additional exmaples generated oracleHINT for these data sets isapproximately 200. However, they are able to produce classifiers that are 5%more accurate than that of CMMHINT on the average. Since no domain’s totalsize is more than 1500, we can imply that many examples generated in the caseof CMMHINT caused it to induce less accurate classifiers.

An Oracle Based Meta-learner for Function Decomposition 167
5 Conclusions
In this paper we presented a novel meta-learning approach for function decom-position to induce accurate classifiers. The existing work [3] in this area dealswith the generation of some fixed number of random examples. The main con-tribution of the proposed method is the generation of suitable examples andthe automatic discovery of the number of examples required. The advantages ofthese two modifications to the existing work are experimentally verified.
In the case of large domains, many partitions result in the same sized interme-diate concepts thus making all of them candidates to be further investigated. Insuch case generating examples for each partition may increase the time complex-ity of the meta-learner drastically. So, possible future direction includes findinga new measure that can distinguish and rank the candidate partitions. We arecurrently working on one such measure related to compatibility ratio which mea-sures the confidence with which a particular partition defines the intermediatefunction.
References
1.
2.3.
4.
5.
6.
7.
8.
9.
10.
11.
12.
Asenhurst, L.: The decomposition of switching functions. Technical Report, Belllaboratories. pages 541-602, 1952.Breiman, L.: Bagging predictors. Machine Learning, pages 123-140, 1996.Domingos, P.: Knowledge acquisition from examples via multiple models. Proc.of the Fourteenth International Conference on Machine Learning, pages 148-156,1997.Luba T.: Decomposition of multiple-valued functions. 25th Intl. Symposium onMultiple-Valued Logic, pages 255-261, 1995.Michie, D.: Problem decomposition and the learning of skill. Machine Learning:ECML-95, Notes in Artificial Intelligence, pages 17-31, 1995.Michalski, R.S.: Understanding the nature of learning: issues and research direc-tions. Machine Learning: An Artificial Intelligence Approach, pages 3-25, 1986.Morgan Kaufmann.Perkowski, M.A. et. al.: Unified approach to functional decomposition of switch-ing functions. Technical report, Warsaw University of Technology and EindhovenUniversity of Technology. 1995.Pfahringer,B.: Controlling constructive induction in CiPF. Machine Learning:ECML-94, pages 242-256, 1994. Springer-Verlag.Shapiro, A.D.: Structured induction in expert systems. Turing Institute Press inassociation with Addison-Wesley Publishing Company. 1987.Merz, C.J., Murphy. P.M. and Aha, D.W.: UCI repository of machine learningdatabases. Department of Information and Computer Science, University of Cali-fornia at Irvine, Irvine, CA. 1997.Zupan, B., Bohanec, M., Demsar, J. and Bratko, I: Machine Learning by func-tion decomposition. Proc. of the Fourteenth International Conference on MachineLearning, pages 421-429, 1997.Zupan, B., Bohanec, M., Demsar, J. and Bratko, I.: Learning by discovering concepthierarchies. Artificial Intelligence, 109:211-242, 1999.

Bagged Voting Ensembles
S.B. Kotsiantis and P.E. Pintelas
Educational Software Development LaboratoryDepartment of MathematicsUniversity of Patras, Hellas
Abstract. Bayesian and decision tree classifiers are among the most popularclassifiers used in the data mining community and recently numerous research-ers have examined their sufficiency in ensembles. Although, many methods ofensemble creation have been proposed, there is as yet no clear picture of whichmethod is best. In this work, we propose Bagged Voting using different subsetsof the same training dataset with the concurrent usage of a voting methodologythat combines a Bayesian and a decision tree algorithm. In our algorithm, votersexpress the degree of their preference using as confidence score the probabili-ties of classifiers’ prediction. Next all confidence values are added for eachcandidate and the candidate with the highest sum wins the election. We per-formed a comparison of the presented ensemble with other ensembles that useeither the Bayesian or the decision tree classifier as base learner and we tookbetter accuracy in most cases.
1 Introduction
In contrast to statistics where prior knowledge is expressed in the form of probabilitydistributions over the observations and over the assumed dependencies data miningtechniques make their prior knowledge explicit by restricting the space of assumeddependencies without making any distributional assumptions. Recently, the concept ofcombining data mining algorithms is proposed as a new direction for the improvementof the performance of individual algorithms. An ensemble of classifiers is a set ofclassifiers whose individual decisions are combined in some way to classify new in-stances. In [5] is provided an accessible and informal reasoning, from statistical, com-putational and representational viewpoints, of why ensembles can improve results.The main reason may be that the training data can not provide sufficient informationfor selecting a single best classifier from the set of hypotheses, because the amount oftraining data available is too small compared to the size of the hypothesis space.
Several methods have been recommended for the design of ensemble of classifiers[5]. Mechanisms that are used to make ensemble of classifiers include: i) Using differ-ent subset of training data with a single data mining method, ii) Using different train-ing parameters with a single training method, iii) Using different data mining methods.Even though, many methods of ensemble design have been proposed, there is as yetno clear picture of which method is best. This is in part because only a limited numberof comparisons have been attempted and several of those have aggregated on com
C. Bussler and D. Fensel (Eds.): AIMSA 2004, LNAI 3192, pp. 168–177, 2004.© Springer-Verlag Berlin Heidelberg 2004

Bagged Voting Ensembles 169
paring boosting to bagging [1, 4, 25]. Both boosting and bagging are generic tech-niques that can be employed with any base data mining technique. They operate byselectively re-sampling from the training data to generate derived training sets towhich the base learner is applied.
This paper explores an alternative method for constructing good ensembles thatdoes not rely on a single data mining algorithm. The idea is very simple: use differentsubsets of the same training dataset with the concurrently usage of a voting methodol-ogy that combines a Bayesian and a decision tree algorithm. Using voting methodol-ogy, we expect to obtain better results based on the belief that the majority of expertsare more likely to be correct in their decision when they agree in their opinion. In fact,the comparison with other ensembles that use either the Bayesian or decision treealgorithm on 30 standard benchmark datasets showed that the proposed ensemble hadbetter accuracy on the average.
Section 2 presents the most well- known methods for building ensembles, whilesection 3 discusses the proposed ensemble method. Experiment results and compari-sons of the presented combining method in a number of datasets with other ensemblesthat also use as base learner either the decision tree or the Bayesian classifier are pre-sented in section 4. We conclude in Section 5 with summary and further researchtopics.
2 Ensembles of Classifiers
As we have already mentioned the concept of combining classifiers is proposed as anew direction for the improvement of the performance of individual classifiers. Thegoal of classification result integration algorithms is to generate more certain, preciseand accurate system results. This section provides a brief survey of methods for con-structing ensembles.
Bagging [4] is a “bootstrap” ensemble method that creates individuals for its en-semble by training each classifier on a random redistribution of the training set. Eachclassifier’s training set is generated by randomly drawing, with replacement, N exam-ples - where N is the size of the original training set; many of the original examplesmay be repeated in the resulting training set while others may be left out. After theconstruction of several classifiers, taking a vote of the predictions of each classifierperforms the final prediction.
In [4], it was made the important observation that instability (responsiveness tochanges in the training data) is a prerequisite for bagging to be effective. A committeeof classifiers that all agree in all circumstances will give identical performance to anyof its members in isolation. Bagging decision trees has been proved to be very suc-cessful for many data mining problems [1, 4, 25].
Another method that uses different subset of training data with a single data miningmethod is the boosting approach [7]. Boosting is similar in overall structure to bag-ging, except that keeps track of the performance of the data mining algorithm andconcentrates on instances that have not been correctly learned. Instead of choosing thet training instances randomly using a uniform distribution, it chooses the training in-

170 S.B. Kotsiantis and P.E. Pintelas
stances in such a manner as to favor the instances that have not been accuratelylearned. After several cycles, the prediction is performed by taking a weighted vote ofthe predictions of each classifier, with the weights being proportional to each classi-fier’s accuracy on its training set.
AdaBoost is a practical version of the boosting approach [7]. There are two waysthat Adaboost can use these weights to construct a new training set to give to the basedata mining algorithm. In boosting by sampling, examples are drawn with replacementwith probability proportional to their weights. The second method, boosting byweighting, can be used with base data mining algorithms that can accept a weightedtraining set directly. With such algorithms, the entire training set (with associatedweights) is given to the base data mining algorithm. Adaboost requires less instabilitythan bagging, because Adaboost can make much larger changes in the training set.
MultiBoosting [21] is another method of the same category that can be consideredas wagging committees formed by AdaBoost. Wagging is a variant of bagging; bag-ging uses re-sampling to get the datasets for training and producing a weak hypothesis,whereas wagging uses re-weighting for each training example, pursuing the effect ofbagging in a different way. A number of experiments showed that MultiBoostachieves greater mean error reductions than any of AdaBoost or bagging decisiontrees at both committee sizes that were investigated (10 and 100) [21].
Another approach for building ensembles of classifiers is to use a variety of datamining algorithms on all of the training data and combine their predictions. Whenmultiple classifiers are combined using voting methodology, we expect to obtain goodresults based on the belief that the majority of experts are more likely to be correct intheir decision when they agree in their opinion [9].
Another method for combining classifiers - called Grading- trains a meta-levelclassifier for each base-level classifier [19]. The meta-level classifier predicts whetherthe base-level classifier is to be trusted (i.e., whether its prediction will be correct).The base-level attributes are used also as meta-level attributes, while the meta-levelclass values are + (correct) and – (incorrect). Only the base-level classifiers that arepredicted to be correct are taken and their predictions combined by summing up thepredicted probability distributions. Stacked generalization [20], or Stacking, is anothersophisticated approach for combining predictions of different data mining algorithms.Stacking combines multiple classifiers to induce a higher-level classifier with im-proved performance. In detail, the original data set constitutes the level zero data andall the base classifiers run at this level. The level one data are the outputs of the baseclassifiers. A data mining algorithm is then used to determine how the outputs of thebase classifiers should be combined, using as input the level one data. It has beenshown that successful stacked generalization requires the use of output class distribu-tions rather than class predictions [20].
3 Presented Methodology
The combination of two methods that agree everywhere cannot lead to any accuracyimprovement no matter how ingenious a combination method is employed. Naïve

Bagged Voting Ensembles 171
Bayes (NB) [6] and C4.5 [15] differ a lot in their predictions since it was proved aftera number of comparisons, that the methodology of selecting the best classifier of NBand C4.5 according to 3-cross validation gives better accuracy in most cases thanbagging or boosting or multiboost NB and C4.5 [10].
Bagging uses a voting technique which is unable to take into account the heteroge-neity of the instance space. When majority of the base classifiers give a wrong predic-tion for a new instance then the majority vote will result in a wrong prediction. Theproblem may consist in discarding base classifiers (by assigning small weights) thatare highly accurate in a restricted region of the instance space because this accuracy isswamped by their inaccuracy outside the restricted area. It may also consist in the useof classifiers that are accurate in most of the space but still unnecessarily confuse thewhole classification committee in some restricted areas of the space. To overcome thisproblem we have suggested the bagged sum rule voting using two data mining algo-rithms. When the sum rule is used each voter has to give a confidence value for eachcandidate. In our algorithm, voters express the degree of their preference using asconfidence score the probabilities of classifiers prediction [20]. Next all confidencevalues are added for each candidate and the candidate with the highest sum wins theelection. The algorithm is briefly described in Figure 1.
Fig. 1. The proposed ensemble
The time complexity increases to twice that of bagging. This time increase is, how-ever, compensated for by the empirical fact that the Bagged Voting provides bettergeneralization performance with much smaller ensemble size than bagging,
In [12] is showed that the generalization error, E, of the ensemble can be expressedas where and are the mean error and diversity of the ensemble re-spectively. This result implies that increasing ensemble diversity while maintaining theaverage error of ensemble members, should lead to a decrease in ensemble error.Bagged voting leads to larger diversity among member classifiers even though indi-vidual classifiers may not achieve an optimal generalization performance. For exam-
ple, if the increase in diversity is larger than the increase in average error ofindividual classifier, we have a decrease in the generalization error of an ensemble.For this reason, the Bagged Voting scheme is useful in terms of ensemble diversity.

172 S.B. Kotsiantis and P.E. Pintelas
It has been observed that for bagging, an increase in committee size (sub-classifiers) usually leads to a decrease in prediction error, but the relative impact ofeach successive addition to a committee is ever diminishing. Most of the effect of eachtechnique is obtained by the first few committee members [1, 4, 9, 23]. For this rea-son, we used 10 sub-classifiers for the proposed algorithm.
It must be also mentioned that the proposed ensemble can be easily parallelized.The computations required to obtain the classifiers in each bootstrap sample are inde-pendent of each other. Therefore we can assign tasks to each processor in a balancedmanner. By the end each processor has obtained a part of the Bagged Voting ensem-ble. In the case we use the master-slave parallel programming technique, the methodstarts with the master splitting the work to be done in small tasks and assigning themto each slave (C4.5 and NB classifiers). Then the master performs an iteration inwhich if a slave returns a result (this means it finished its work) then the master as-signs it another task if there are still tasks to be executed. Once all the tasks have beencarried out the master process obtains the results and orders the slaves to finish sincethere are not more tasks to be carried out. This parallel execution of the presentedensemble can achieve almost linear speedup.
4 Comparisons and Results
For the comparisons of our study, we used 30 well-known datasets mainly from do-mains from the UCI repository [2]. We have also used data from language morpho-logical analysis (dimin) [3], agricultural domains (eucalyptus, white-colar) [13] andprediction of student dropout (student) [11].
In order to calculate the classifiers’ accuracy, the whole training set was dividedinto ten mutually exclusive and equal-sized subsets and for each subset the classifierwas trained on the union of all of the other subsets. Then, cross validation was run 10times for each algorithm and the median value of the 10-cross validations was calcu-lated (10x10 cross-validation). It must be mentioned that we used the free availablesource code for algorithms by [22].
In the following tables, we represent with “vv” that the proposed ensemble (BaggedVoting) looses from the specific ensemble. That is, the specific algorithm performedstatistically better than the proposed according to t-test with p<0.001. In addition, inTables, we represent with “v” that the proposed ensemble looses from the specificensemble according to t-test with p<0.05. Furthermore, in Tables, indicates thatBagged Voting performed statistically better than the specific ensemble according to t-test with p<0.001 while according to p<0.05. In all the other cases, there is nosignificant statistical difference between the results (Draws). It must be mentioned thatthe conclusions are mainly based on the resulting differences for p<0.001 because a p-value of 0.05 is not strict enough, if many classifiers are compared in numerous da-tasets [17]. However, as one can easily observe the conclusions remain the same withp<0.05. In the last rows in all Tables one can see the aggregated results in the form(a/b/c). In this notation “a” means that the proposed ensemble is significantly moreaccurate than the compared algorithm in a out of 30 datasets, “c” means that the pro-

Bagged Voting Ensembles 173
posed ensemble is significantly less accurate than the compared algorithm in c out of30 datasets, while in the remaining cases (b), there is no significant statistical differ-ence between the results. In the following Tables, we also present the average errorrate of all tested dataset for each ensemble.
The decision on limiting the number of sub-classifiers is important for practical ap-plications. For both Bagging and Boosting, much of the reduction in error appears tohave occurred after ten to fifteen classifiers. But Adaboost continues to measurablyimprove their test-set error until around 25 classifiers for decision trees [14]. For thisreason, we used 25 sub-classifiers for our experiments. Firstly, we compare the pre-sented methodology with bagging, boosting and MultiBoost version of NB (using 25sub-classifiers). Secondly, we compare the presented methodology with bagging,boosting and MultiBoost version of C4.5 (using 25 sub-classifiers). In the last rows ofthe Table 1 one can see the aggregated results. The presented ensemble is significantlymore accurate than bagging NB in seven out of the 30 datasets, while it has signifi-cantly higher error rate in none dataset. At this point, it must be also mentioned thatthe proposed ensemble and the bagging version of NB with 25 sub-classifiers needsimilar training times. In addition, the presented ensemble is significantly more accu-rate than boosting NB in 3 out of the 30 datasets, whilst it has significantly highererror rate in one dataset. The presented ensemble has also significantly lower errorrates in four out of the 30 datasets than Multiboost NB, whereas it is significantly lessaccurate in one dataset. What is more, the presented ensemble needed much less timefor training than boosting and multi-boosting version of NB algorithm.
The presented ensemble is significantly more accurate than bagging C4.5 in threeout of the 30 datasets, while it has significantly higher error rates in none dataset. Inaddition, the presented ensemble is significantly more accurate than boosting C4.5 inthree out of the 30 datasets whilst it has significantly higher error rates in one dataset.Furthermore, the presented ensemble has significantly lower error rates in two out ofthe 30 datasets than Multiboost C4.5, whereas it is significantly less accurate in onedataset. It must be also mentioned that the resulting statistical differences for p<0.05are even better for the presented ensemble.
To sum up, on the average the performance of the presented ensemble is more ac-curate than the other well-known ensembles that use only the NB algorithm from 5.5%to 13.5%. Moreover, on the average the performance of the presented ensemble ismore accurate than the other well-known ensembles that use only the C4.5 algorithmfrom 4% to 7%. What is more, the presented ensemble needed much less time fortraining than bagging, boosting and multi-boosting version of C4.5 algorithm.
Subsequently, we compare the presented methodology with other well-known en-sembles that use either C4.5 or NB as base classifiers. We compare the proposedmethodology with:
Stacking methodology that constructs the meta-data set by the entire predictedclass probability distributions [20]. We used NB, C4.5 as base classifiers andMLR [20] as meta-level classifier.Voting methodology using NB, C4.5 as base classifiers [5]Grading methodology using the instance based classifier IBk with ten nearestneighbors as the meta level classifier [19] and NB, C4.5 as base classifiers.

174 S.B. Kotsiantis and P.E. Pintelas
In the last rows of the Table 2 one can see the aggregated results. The presented en-semble is significantly more accurate than voting in two out of the 30 datasets, whilstit has significantly higher error rate in none dataset. The resulting statistical differ-ences for p<0.05 are even better for the presented ensemble. It must be also mentionedthat on the average the performance of the presented ensemble is more accurate thanvoting about 9.5%.

Bagged Voting Ensembles 175
Similarly, the proposed ensemble is significantly more accurate than Stacking in twoout of the 30 datasets, while it is significantly less accurate in one dataset. The averagerelative accuracy improvement of the proposed ensemble is about 2% better in relationto Stacking. Furthermore, the presented ensemble has significantly lower error rates inone out of the 30 datasets than Grading, whereas it is significantly less accurate innone dataset. Besides, the presented ensemble needed much less time for training thanGrading while the average relative accuracy improvement is about 3%.
To sum up, the presented methodology of combining NB and C4.5 algorithmscould be an off-the self method-of- choice for a data mining task where there is no apriori knowledge available about the domain and the primary goal of data mining is todevelop a classifier with lowest possible classification error.

176 S.B. Kotsiantis and P.E. Pintelas
5 Conclusions
It is known that if we are only concerned for the best possible classification accuracy,it might be difficult or impossible to find a single classifier that performs as well as agood ensemble of classifiers. In this study, we built an ensemble of classifiers usingtwo different data mining methods: the Naive Bayes and the C4.5 algorithm.
Our approach answers to some extend such questions as generating uncorrelatedclassifiers and control the number of classifiers needed to improve accuracy in theensemble of classifiers. While ensembles provide very accurate classifiers, too manyclassifiers in an ensemble may limit their practical application. To be feasible andcompetitive, it is important that the data mining algorithms run in reasonable time. Inour method, we limit the number of sub-classifiers to 10. It was proved after a numberof comparisons with other ensembles, which use either C4.5 or NB as base classifiers,that the Bagged Voting methodology gives better accuracy in most cases. It must bealso mentioned that the proposed ensemble can be easily parallelized achieving almostlinear speedup.
In spite of these results, no general method will work always. In a future work, itwould be interesting to study the impact of the number of base classifiers on the nec-essary data partitions required to keep a certain level of performance of the proposedensemble
Instability of the base data mining algorithms is a major factor in the ability to gen-erate diversity in the form of anti-correlations between the various base-classifiers inthe pool, which is the key for variance reduction. Therefore, one can expect that therelative advantage of our technique will be increased more if we added another oneunstable base-classifier such as neural networks. We plan to investigate this direction.Moreover, there is no reason to restrict this approach to combining classifiers. Com-bining different regressions is another important problem which could be handled bythis approach replacing voting with averaging.
Finally, there are some other open problems in ensemble of classifiers, such as howto understand and interpret the decision made by an ensemble of classifiers because anensemble provides little insight into how it makes its decision. For data mining appli-cations, comprehensibility is crucial, voting methods normally result in incomprehen-sible classifier that cannot be easily understood by end-users. These are the researchtopics we are currently working on and hope to report our findings in the near future.
References
1.
2.
3.
Bauer, E. & Kohavi, R., “An empirical comparison of voting classification algorithms:Bagging, boosting, and variants”. Machine Learning, 36 (1999), 105–139.Blake, C.L. & Merz, C.J., UCI Repository of machine learning databases. Irvine, CA:University of California, Department of Information and Computer Science (1998).[http://www.ics.uci.edu/~mlearn/MLRepository.html]Van den Bosch, A. and W. Daelemans., Memory-based morphological analysis. Proc. ofthe 37th Annual Meeting of the ACL (1999), University of Maryland, pp. 285-292(http://ilk.kub.nl/~antalb/ltuia/week10.html).

Bagged Voting Ensembles 177
4.
5.
6.
7.
8.
9.
10.
11.
12.
13.
14.
15.
16.
17.
18.
19.
20.
21.
22.
Breiman L., “Bagging Predictors”. Machine Learning, 24(3), (1996) 123-140. KluwerAcademic Publishers.Dietterich, T.G., Ensemble methods in machine learning. In Kittler, J., Roli, F., eds.:Multiple Classifier Systems. LNCS Vol. 1857, Springer (2001) 1–15Domingos P. & Pazzani M., “On the optimality of the simple Bayesian classifier underzero-one loss”. Machine Learning, 29, (1997) 103-130.Freund Y. and Schapire R. E., Experiments with a New Boosting Algorithm, Proceedings:ICML’96, p. 148-156.Hall L.O., Bowyer K.W., Kegelmeyer W.P., Moore T.E. and Chao C., Distributed learningon very large datasets. In ACM SIGKDD Workshop on Distributed and Parallel Knowl-edge Discovery (2000).Chuanyi J. & Sheng M., “Combinations of weak classifiers”. IEEE Trans. Neural Net-works, 8(1):32–42, 1997.Kotsiantis S., Pintelas P., On combining classifiers, Proceedings of HERCMA 2003 oncomputer mathematics and its applications, Athens, Sept. 25-27, 2003.Kotsiantis S., Pierrakeas C. and Pintelas P., Preventing student dropout in distance learn-ing systems using machine learning techniques, Proceedings of 7th International Confer-ence on Knowledge-Based Intelligent Information and Engineering Systems (KES), Ox-ford, Sept. 3-5, 2003, Lecture notes series, Springer-Verlag Vol 2774, pp 267-274.Krogh, A., & Vedelsby, J., “Neural network ensembles, cross validation and active learn-ing”. In Advances in Neural Information Processing Systems (1995) 7.McQueen, R.J., Garner, S.R., Nevill-Manning, C.G., and Witten, I.H., “Applying machinelearning to agricultural data”. Journal of Computing and Electronics in Agriculture (1994).Opitz D. & Maclin R., “Popular Ensemble Methods: An Empirical Study”, ArtificialIntelligence Research, 11 (1999): 169-198, Morgan Kaufmann.Quinlan J.R., C4.5: Programs for machine learning. Morgan Kaufmann, San Francisco,1993.Quinlan, J. R., Bagging, boosting, and C4.5. In Proceedings of the Thirteenth NationalConference on Artificial Intelligence (1996), pp. 725–730, AAAI/MIT Press.Salzberg, S., “On Comparing Classifiers: Pitfalls to Avoid and a Recommended Ap-proach”, Data Mining and Knowledge Discovery, Vol. 1, (1997) pp. 317–328.Schapire, R. E., Freund, Y., Bartlett, P., & Lee, W. S., “Boosting the margin: A new ex-planation for the effectiveness of voting methods”. The Annals of Statistics, 26, (1998)1651–1686.Seewald, A. K., Furnkranz, J., An evaluation of grading classifiers. In Advances in Intelli-gent Data Analysis: Proceedings of the Fourth International Symposium IDA (2001),pages 221–232, Berlin, Springer.Ting K. and Witten I., “Issues in Stacked Generalization”, Artificial Intelligence Research10, (1999) 271-289.Webb G. I., “MultiBoosting: A Technique for Combining Boosting and Wagging”, Ma-chine Learning, 40, (2000) 159–196, Kluwer Academic Publishers.Witten I. & Frank E., Data Mining: Practical Machine Learning Tools and Techniqueswith Java Implementations, Morgan Kaufmann, San Mateo, 2000.

Cluster Validation for High-Dimensional Datasets
Minho Kim, Hyunjin Yoo, and R.S. Ramakrishna
Department of Information and Communications, GIST1 Oryong-dong, Buk-gu, Gwangju, 500-712, Republic of Korea
{mhkim, hjyoo, rsr}@gist.ac.kr
Abstract. Cluster validation is the process of evaluating performance of cluster-ing algorithms under varying input conditions. This paper presents a new solu-tion to the problem of cluster validation in high-dimensional applications. Weexamine the applicability of conventional cluster validity indices in evaluatingthe results of high-dimensional clustering and propose new indices that can beapplied to high-dimensional datasets. We also propose an algorithm for auto-matically determining cluster dimension. By utilizing the proposed indices andthe algorithm, we can discard the input parameters that PROCLUS needs. Ex-perimental studies show that the proposed cluster validity indices yield bettercluster validation performance than is possible with conventional indices.
Keywords: high-dimensional clustering, cluster validity index, unsupervisedlearning
1 Introduction
Clustering operation attempts to partition a set of objects into several subsets. Theidea is that the objects in each subset are indistinguishable under some criterion ofsimilarity. It is one of the most important tasks in data analysis. It finds application inbioinformatics, web data analysis, information retrieval, CRM (Customer RelationshipManagements), text mining, and scientific data exploration, to name only a few majorareas [11], [13].
Clustering refers to unsupervised learning as opposed to classification. That is, itdoes not make use of class information about each data object during learning. How-ever, most clustering algorithms require that input parameters be appropriately tunedfor optimal results. For example, algorithms such as K-means require k, the number ofclusters, as input. As is well known, the quality of their clustering results dependsrather significantly on the parameter. In order to suitably adjust (tune) the input pa-rameters, clustering algorithms have to utilize class information. But this contradictsthe very spirit of pure clustering. In recent times cluster validity indices (CVIs) haveattracted attention as a means to resolve this dilemma [6], [7], [9], [10], [14], [15],[16], [17]. CVIs can signal perfect tuning of input parameters by assuming the mini-mum (or maximum) value for optimal clustering result. The latter can be definedthrough the number of clusters and purity. That is, the clustering result is optimal ifthe number of clusters is the same as that which best fits a dataset while at the same
C. Bussler and D. Fensel (Eds.): AIMSA 2004, LNAI 3192, pp. 178–187, 2004.© Springer- Verlag Berlin Heidelberg 2004

Cluster Validation for High-Dimensional Datasets 179
time, purity is as high as possible. Here, purity is the sum of data objects in the major-ity class in each cluster.
Most of the existing CVIs address clustering results in low-dimensional datasets.These CVIs are based on distances between data objects. The distance utilizes thefeature (attribute) vector of data objects for its definition.
In [5], however, it has been shown that when the feature vector of each data objectbelongs to a high-dimensional space, distances between pairs of data objects in a data-set are almost the same for a wide spectrum of data distributions and distance func-tions. This is tantamount to a loss in the ability of distance functions to measure thedissimilarity (or similarity) between data objects, especially in high-dimensional data-sets. This is the curse of high-dimensionality. It follows that acceptable clusteringresults are beyond the reach of conventional clustering algorithms.
The research community is understandably seized of the matter [1], [2], [3], [12].However, the clustering algorithms for high-dimensional applications require ‘opti-mized’ input parameters. To address this issue, one can naively utilize conventionalCVIs. The CVIs, as noted above are based on distance functions which are ineffectivein high-dimensional datasets; and hence, it is clear that conventional CVIs may fail toidentify optimal clustering.
This paper makes use of PROCLUS [2], a well-known high-dimensional clusteringalgorithm, as the clustering algorithm for high-dimensional datasets. PROCLUS alsorequires input parameters just like other clustering algorithms. It requires two parame-ters: the number of clusters and the average number of cluster dimensions of eachcluster. Here, a dimension is defined as a cluster dimension if data objects in a clusterare more highly correlated in that dimension than in any other dimension. With a viewto compute the average number of cluster dimensions, we propose an algorithm forautomatically determining the cluster dimensions. As for the other parameter, thenumber of clusters, we propose new CVIs. The new CVIs will be used for evaluatingthe performance of PROCLUS obtained by varying the number of clusters and choos-ing the best from among them. Finally, we also experimentally evaluate the perform-ance of the proposed algorithm in automatic cluster dimension determination. Theproposed CVIs will also come under experimental scrutiny.
The rest of the paper is organized as follows. Section 2 discusses clustering high-dimensional datasets and briefly reviews PROCLUS. The proposed algorithm forautomatically determining cluster dimensions is provided in section 3. In section 4,designing of new cluster validity indices are described. Experimental results andconclusions are given in sections 5 and 6, respectively.
2 Clustering in High-Dimensional Datasets and PROCLUS
As for high-dimensional datasets, it is unlikely that all the dimensions are stronglycorrelated with a cluster. The dimensions along which there is only a weak correlationor, more often than not, no correlation at all, interfere with the clustering process.Actually, this inference follows from the fact that under specific conditions and distri-

180 M. Kim, H. Yoo, and R.S. Ramakrishna
bution of high-dimensional datasets, distances between pairs of data objects are almostidentical [5].
The feature (dimension) selection step is invariably the first step in many of theknown clustering algorithms. This step excludes all the “extraneous” dimensions,thereby removing the noise emanating from them. However, since this step precedesclustering, there is a risk of losing vital information. Practical high-dimensional data-sets are usually endowed with the property that a group of data objects are closelyclustered in a dimension set while a different group of data objects are closely clus-tered in a different dimension set. Also, the sizes of these dimension sets for a particu-lar cluster may be different. Therefore, it is almost impossible to determine a singledimension set that is acceptable for all the clusters [2].
These two problems can be addressed by exploiting the fact that different groups ofdata objects are correlated along different sets of dimensions in high-dimensionaldatasets. This was first observed and subsequently discussed in detail by Agrawal et.al. [1] and Aggarwal et. al. [2], [3], respectively. This is described below. Let be aset of data objects in a d-dimensional space. A subset C (of is said to be a pro-jected cluster along if the objects in C are closely related with respect todimensions in D. The PROjected CLUStering algorithm is based upon this notion [2].PROCLUS requires the number of clusters nc and the average number of cluster di-mensions l as two input parameters.
Here is a brief on the notations and definitions which will be used in the sequel.is a set of data objects, i.e., and it represents a cluster. The centroid
of is defined by The medoid is a real data object that repre-
sents a cluster It is usually close to The radius of a cluster centered at a
medoid is defined by: In PROCLUS, Manhattan segmental
distance function, a variant of the Manhattan distance function, is defined in order toevaluate the distance in a projected cluster. Let D be a subset of a d-dimensional set
Then, the Manhattan segmental distance function with respect to the dimen-sion set D for two d-dimensional data objects and is defined by:
Now, we can pose the problem of projected clustering as follows:
where is the average projected cluster radius, N is the total number of
data objects, and This means that the problem of projected
clustering is equivalent to finding a set of clusters along with a set of their corre-sponding dimension sets that minimizes the average projected cluster radius.

Cluster Validation for High-Dimensional Datasets 181
3 Automatic Determination of Cluster Dimensions
The scheme for finding cluster dimensions in PROCLUS requires l, the averagenumber of cluster dimensions, as an input parameter. The clustering result is stronglydependent on the value of l. If an inappropriate value of l, (for instance, larger valuethan the optimal one) were used, dimensions unrelated with data objects in a local areawould be included in the corresponding cluster dimension set. This leads to incorrectassignment of data objects and finally results in unacceptable clustering. However,this problem can be solved through reasonable assumptions complying with projectedclustering and intuitive heuristics.
Let be the average distance between data objects in the local area along thedimension, where is the area within the distance from a medoid of a clusterand Since data objects in a cluster are highly correlated in clus-
ter dimensions while they are uncorrelated in the other dimensions, there is a valley inthe graph of sorted values. Here, the valley refers to the location at which (inthe sorted graph) changes rapidly. From this analysis, one is naturally led to the fol-lowing definition of cluster dimension: if some value in the sorted graph is be-low the valley, then its corresponding dimension is the cluster dimension. This intui-tive definition relies on the reasonable assumption that the sorted graph does in-deed have a valley.
This is similar to the approach adopted for finding the neighborhood radius £ inDBSCAN [8]. Our algorithm for effectively locating the valley in the sorted graphis given in Fig. 1.
Fig. 1. Algorithm of automatic cluster dimension selection
A few words on the algorithm are in order. First, we generate by sortingin line (1) of Fig. 1. is a new index used while sorting Thus, the “original
order of in line (4) refers to its corresponding original index j in In order toeffectively find the valley, we perform high-pass filtering. We can use any filter thatcan find the minimum value in the valley. In the experiments, we utilize a variant of asimple, well-known 2-dimensional high-pass filter, with (-1, 2, -1) as its kernel. In line(3), we find the location of the minimum value of which corresponds to a valley.Finally, all the dimensions whose associated values are below or equal to the valleyare taken to be cluster dimensions. The performance of the proposed algorithm isevaluated in section 5.

182 M. Kim, H. Yoo, and R.S. Ramakrishna
4 New CVIs for Validating High-Dimensional Clustering
The performance of many clustering algorithms is critically dependent on the charac-teristics of the dataset and input parameters. Improper input parameters for a specificdataset may lead to clusters which deviate from those in the dataset. In order to deter-mine the input parameters that lead to clusters that best fit a given dataset, we needtechniques for evaluating the clusters themselves. Popular techniques employ clustervalidity indices (CVI).
A very important factor in defining CVIs is the distance function. All the functionsin conventional CVIs make use of all the dimensions. However, in the context of high-dimensional datasets, most distance functions are not very useful due to the curse ofdimensionality. Since the function used in some conventional CVIs, such as SDand S_Dbw, is also a kind of distance function, the same problem lurks in the back-ground. This leads to the reasonable inference that CVIs based on these distance func-tions cannot properly evaluate results of the clustering algorithms for high-dimensional datasets. Experimental results tend to support this observation (please seesection 5).
Therefore, we have to define new CVIs which can measure how well a clusteringresult fits a given dataset in high-dimensional applications. For this purpose, newCVIs for high-dimensional clustering have to be capable of expressing the meaning ofcompactness of a cluster and separability among clusters with respect to high-dimensional datasets as in [4]. As compactness and separability are also based ondistance functions, we should start by redesigning distance functions in order to de-velop new CVIs for validating high-dimensional clustering.
A hint on how to proceed may be gleaned from of PROCLUS (section 2).
According to [4], data objects in a good cluster should be close to one another. Thisfunction comes in handy because any new compactness measure has to, in essence,incorporate this feature in high-dimensional clustering applications. The reason is thata dimension set is composed of dimensions in which data objects in a cluster arecorrelated and is a distance function reflecting only these dimensions. is
also effective for a new definition of separability. This is explained below:
First, if there exist two clusters whose data objects are very close to each other,has relatively small value since they have the same or very similar di-
mension sets. And this can indicate that the two clusters need to be merged. Here,and are centroids of clusters and respectively.
Second, if two clusters are well separated, has relatively high value
since two clusters have different cluster dimensions. Even though the two clustersshare the same cluster dimension set, also has relatively high value be-
cause they should be well separated in the space defined by the common clusterdimension set.
SD and S_Dbw among CVIs make use of This also can be redefined asSince we have prepared new distance functions and

Cluster Validation for High-Dimensional Datasets 183
we can now define various new CVIs by replacing and with these
new functions. Newly designed CVIs are given in eqn. (2) ~ (6) (Since some of exist-ing CVIs, viz., Dunn and S_Dbw, are computationally very expensive and thus im-practical, we do not define their corresponding CVIs for high-dimensional clustering.)

184 M. Kim, H. Yoo, and R.S. Ramakrishna
5 Experimental Results
In this section, we first evaluate the performance of the algorithm for automaticallydetermining the cluster dimension proposed in section 3 and then, we evaluate theperformance of conventional and newly proposed CVIs for high-dimensional datasets.The quality of a clustering result is generally evaluated under the following criteria:
The number of clusters (nc) found by the clustering algorithmCluster purity: This is computed by summing the number of data objects of amajority class in each cluster.
That is, a clustering result is said to be of “good quality” if it has the same numberof clusters as does a given dataset and at the same time has as high a cluster purity aspossible. The number of clusters is related to cluster purity. This can be inferred fromthe frequently observed phenomenon that cluster purity deteriorates noticeably if theestimated number of clusters is different from that of a given dataset. In this paper, wewill not evaluate cluster purity because that has already been done in [2] and our re-sults are almost the same as those in [2]. PROCLUS shows very high cluster purityprovided that we make use of the exact number of clusters nc as well the averagenumber of cluster dimensions l. Because our modified PROCLUS utilizes the algo-rithm for automatic cluster dimension determination, the input parameter l is not re-quired. Therefore, in this section, we experiment with the modified PROCLUS byvarying the input parameter nc (the number of resulting clusters). We also evaluate theperformance of CVIs by comparing the estimated number of clusters with that of agiven dataset.
Datasets used in the experiments were generated through the method given in [2].They represent various situations and are divided into two categories. One categoryconsists of those datasets whose cluster dimension sets for different clusters are dis-joint, i.e., Datasets in this category are t1, t3, t5, and t7. Theother category includes the clusters that may share cluster dimensions among them,i.e., Datasets t2, t4, t6, and t8 belong to this category. The lattercategory is more common in real world applications. In order to create truly represen-tative datasets, we allow more than two clusters to be contained in the same subspace.All the datasets except t1 and t2 are of this kind. t5 and t6 are generated by increasingthe number of clusters sharing the same subspace. Finally, t7 and t8 are generated bydecreasing distances among clusters using the same subspace from datasets t3 and t4,respectively.
Table 2 summarizes lists of cluster dimensions estimated through the proposed al-gorithm for automatically determining cluster dimensions for various datasets. In thetable, each line for each dataset lists cluster dimensions of the respective cluster. Clus-ter dimensions are sorted in ascending order with respect to their values. It can beseen that the sizes of the cluster dimension set (of each dataset) turn out to be the sameas those of the given datasets and they are listed in the “size” column of the table.Also, the cluster dimensions are the same as those of the given datasets. The proposedalgorithm is seen to be quite effective in automatically determining cluster dimensionsunder various circumstances.

Cluster Validation for High-Dimensional Datasets 185
Now, performance of CVIs is evaluated. The first experiment makes use of thesimplest datasets t1 and t2. All the conventional CVIs, viz., I, XB, and DB (exceptSD for t1 and for t2) indicate different number of clusters from that of given data-sets. In other words, they fail to estimate the actual number of clusters. It can also beseen that SD and succeed to some extent. But, they fail to find the exact number ofclusters for almost all other test datasets (we have omitted other results due to thelimitation of space). This means that finding exact number of clusters in t1 and t2 bySD and is just a coincidence and that it does not indicate their true performance. Inthe long run, conventional CVIs fail to find the number of clusters in high-dimensionaldatasets. Undoubtedly, the reason is the curse of dimensionality as already discussed.Since conventional CVIs fail on the simplest datasets in this experiment and, more-over, we will use more complex datasets in subsequent experiments, we no longerpersist with them.
Results for new CVIs proposed in section 4 are summarized in table 2. In this ex-periment, we also use t1 and t2. All the new CVIs have their optimal values at thecorrect number of clusters. This implies that and incorporated into the new
CVIs are very effective for measuring the distance between data objects in high-dimensional spaces.
In the second experiment, we use more complex datasets than in the first experi-ment. The objective of this experiment is to evaluate the performance of the proposedCVIs under various situations. Table 2 shows the results for dataset t3 and t4 in whichtwo clusters are in the same subspace. As for this dataset, and return in-

186 M. Kim, H. Yoo, and R.S. Ramakrishna
correct results. As for dataset t6 generated by having more clusters than t4 sharing thesame subspace(s), and yield wrong results as shown in table 2.Finally, clusters sharing a subspace in dataset t7 are located more closely than those inthe previous datasets. All the proposed CVIs except fail to estimate the correctnumber of clusters.
Here, we observe that and fail on all the (somewhat) complex datasetst3 ~ t7. The reason why the two CVIs fail is because their intra-cluster distances are
not properly defined. In can be seen as
the intra-cluster distance. Here, is defined in the same way as is the Euclidean dis-tance function. However, [2] states that there is no appropriate normalized variant ofthe Euclidean distance function for high-dimensional applications. But, we simplydefined this variant by: This amounts to em-
pirically verifying the claim made in [2]. As for its intra-cluster distance can be
defined as Here the sum of distances of data objects from
respective centroids is divided by the total number of data objects, N. This averagingmay smooth out steep deviations caused by data objects in some clusters generated byunnecessary merging. That is, in case the number of data objects in a needlesslymerged cluster is relatively small, the deviations caused by this cluster may be maskedby averaging.
As summarized in table 2, shows the best performance among various CVIsproposed in this paper. The performance of is the second best and those ofand are the worst.
6 Conclusions
In this paper, we have discussed the problem of cluster validation for high-dimensional datasets and presented a solution. The key to the solution lies in chalkingout a path to counter the curse of dimensionality. We reviewed the PROCLUS algo-rithm with a view to shed light on this problem. The influence of this curse on conven-tional CVIs was also discussed. We followed this up with five new CVIs for clustervalidation in high-dimensional applications. Experimental studies revealed that con-ventional CVIs fail to test validity of results returned by PROCLUS even for datasetswhose clusters are well separated. More specifically, they could not estimate the exactnumber of clusters in given datasets, thereby failing a vital performance test. The newCVIs proposed in this paper succeeded in finding the exact number of clusters. Wealso carried out experiments on complex datasets representing multifarious situations.
and turned out to be the worst and the best in performance. We havealso proposed a new algorithm for automatically determining cluster dimensions. Thisdispenses with an important input parameter which PROCLUS needs (i.e., the averagesize of the set of cluster dimensions). The proposed CVIs are expected to be useful in

Cluster Validation for High-Dimensional Datasets 187
evaluating results of various high-dimensional clustering algorithms besidesPROCLUS.
References
[1] Agrawal, R., Gehrke, J., Gunopulos, D., Raghavan, P.: Automatic Subspace Clustering ofHigh Dimensional Data for Data Mining Applications. Proc. ACM-SIGMOD Int’l Conf.Management of Data (1998) 94-105
[2] Aggarwal, C.C., Procopiuc, C., Wolf, J.L., Yu, P.S., Park, J.S.: Fast Algorithms forProjected Clustering. Proc. ACM SIGMOD Int’l Conf. Management of Data (1999)61-72
[3] Aggarwal, C.C., Yu, P.S.: Redefining Clustering for High-Dimensional Applications. IEEETrans. Knowledge and Data Engineering 14(2) (2002) 210-225
[4] Berry, M.J.A., Linoff, G.: Data Mining Techniques: For Marketing, Sales, and CustomerSupport. John Wiley & Sons (1997)
[5] Beyer, K.S., Goldstein, J., Ramakrishnan, R., Shaft, U.: When Is ‘NearestNeighbor’ Meaningful?. Proc. Int’l Conf. Database Theory (ICDT), (1999) 217-235
[6] Davies, D.L. Bouldin, D.W.: A Cluster Separation Measure. IEEE Trans. Pattern Analysisand Machine Intelligence (PAMI) 1(2) (1979) 224-227
[7] Dunn, J.C.: A Fuzzy Relative of the ISODATA Process and its Use in Detecting CompactWell-Separated Clusters. J. Cybernetics 3 (1973) 32-57
[8] Ester, M., Kriegel, H.-P., Sander, J., Xu, X.: A Density-based Algorithm for DiscoveringClusters in Large Spatial Databases. Proc. Int’l Conf. Knowledge Discovery and Data Min-ing (KDD) (1996) 226-231
[9] Halkidi, M., Vazirgiannis, M.: Quality Scheme Assessment in the Clustering Process. Proc.Principles and Practice of Knowledge Discovery in Databases (PKDD). Lecture Notes inArtificial Intelligence Vol. 1910 (2000) 265-276
[10] Halkidi, M., Vazirgiannis, M.: Clustering Validity Assessment: Finding the Optimal Parti-tioning of a Dataset. Proc. Int’l Conf. Data Mining (ICDM) (2001) 187-194
[11] Han, J., Kamber, M.: Data Mining: Concepts and Techniques. Morgan Kaufmann (2001)[12] Hinneburg, A., Keim, D. A.: An Optimal Grid-Clustering: Towards Breaking the Curse of
Dimensionality in High-Dimensional Clustering. Proc. Int’l Conf. Very Large DataBases(VLDB) (1999) 506-517
[13] Jain, A.K., Murty, M.N., Flynn, P.J.: Data Clustering: A Review. ACM Computing Sur-veys 31(3) (1999) 264-323
[14] Kim, D.-J., Park, Y.-W., Park, D.J.: A Novel Validity Index for Determination of theOptimal Number of Clusters. IEICE Trans. Inf. & Syst., E84-D(2) (2001) 281-285
[15] Maulik, U., Bandyopadhyay, S.: Performance Evaluation of Some Clustering Algorithmsand Validity Indices. IEEE Trans. Pattern Analysis and Machine Intelligence (PAMI)24(12) (2002) 1650-1654
[16] Schwarz, G.: Estimating the Dimension of a Model. Annals of Statistics 6(2) (1978) 461-464
[17] Xie, X.L., Beni, G.A.: A Validity Measure for Fuzzy Clustering. IEEE Trans. PatternAnalysis and Machine Intelligence (PAMI) 3(8) (1991) 841-846

Emergent Behaviours Based on Episodic Encoding andFamiliarity Driven Retrieval
Emilia I. Barakova
RIKEN BSI, 2-1, Hirosawa, Wako-shi, Saitama, 351-0198 [email protected]
Abstract. In analogy to animal research, where behavioural and internal neu-ral dynamics are simultaneously analysed, this paper suggests a method foremergent behaviours arising in interaction with the underlying neural mech-anism. This way an attempt to go beyond the indeterministic nature of theemergent behaviours of robots is made. The neural dynamics is representedas an interaction of memories of experienced episodes, the current environ-mental input and the feedback of previous motor actions. The emergent prop-erties can be observed in a two staged process: exploratory (latent) learningand goal oriented learning. Correspondingly, the learning is dominated to adifferent extent by two factors: novelty and reward. While the reward learn-ing is used to show the relevance of the method, the novelty/familiarity is abasis for forming the emergent properties. The method is strongly inspired bythe state of the art understanding of the hippocampal functioning and espe-cially its role in novelty detection and episodic memory formation in relationto spatial context.
1 Introduction
Emergence of behaviour in biological organisms can be understood by simultaneousstudy of at least two different scales of organization: neural and behavioural. The termemergence may suggest that the intelligent behaviour is merely a consequence of un-known and uncontrolled internal dynamics of a system of connected simple elements.In this paper the emergence of behaviour is understood as a consequence of assumedneural dynamics that closely models the functionality of the hippocampal formation.The functionality is assigned to the neural structures as much as supported by behav-ioural experiments. Yet, this paper aims at a computational model oriented towards arobot implementation.The choice of the hippocampal formation as the brain structure where the dynamicscausing an emergent behaviour takes place is made due to several reasons. Amongthem, the involvement of the hippocampus in episodic memory formation [1][2][3] andits role in familiarity discrimination, are considered, and illustrated through emergentbehaviours within a navigation task.Many biologically inspired robotic systems are built by simulating insect-like behav-iours, for a review see [4]. Such a setting supposes a reactive nature of behaviour - it isdetermined mainly by sensing. The simulations following the functionality of the mam-malian brain that include memory or motivational features are seldom implemented intoa robot without a severe simplifications. The theoretical models of the hippocampus andbasal ganglia, however, suggest neural solutions that incorporate those features, and
C. Bussler and D. Fensel (Eds.): AIMSA 2004, LNAI 3192, pp. 188–197, 2004.
© Springer-Verlag Berlin Heidelberg 2004

Emergent Behaviours Based on Episodic Encoding 189
produce results on a behavioural scale, often not in the range of the computational ex-pense, affordable for a realistic robotics task [5][6][7].This paper puts forward memory driven behaviour. In particular, memories of experi-enced episodes are considered as carriers of contextual information, and therefore as asubstratum for emergence of complex behaviours: the animat continuously gathers in-formation about the surrounding world through experiencing sequences of events.Higher organisms can encode such subjectively experienced episodes, so their furtheractions are determined to a big extent of these remembered episodes. Episodic memoryformation is generally associated with the encoding in the hippocampus.While the emergent phenomena are modelled through the hippocampal system, the be-haviour manifests itself through a motor system. To rightfully describe the organism-environmental interaction the third, sensory system needs to be modelled. The overallmodel has to satisfy requirements coming from the behavioural setup as well as require-ments that concern memory formation and reuse. The specificity of the model is that itattempts navigation, determined mainly by the experienced memories of connectedevents (episodes). In doing that we expect to observe manifestation of novel behaviourthat has emerged on the basis of encoding different memories about similar situations.Therefore, every individual event has to be seen in context. For a realistic task this ispossible only if memorizing is flexible in both encoding and retrieval. Flexibility, as op-posed to exact storage puts forward the need to selectively store the incoming percep-tual information, judging which is new, or very similar to the experienced one. The cri-teria of familiarity facilitates the ability to infer appropriate behaviour in a novel envi-ronment or for performing a novel task. The efficient encoding trough the familiarityjudgement is a basis for life-long learning.The paper is organized as follows: In Section 2 suggests a hypothesis and the corre-sponding working model for novelty gated hippocampal encoding; In Section 3 theframework and the scheme from the last two chapters is bridged to the computations,derived by theoretical findings to lay a computational ground for further modelling. Theconnection between the two levels of the emergency scheme is shown in short in Sec-tion 4. The results that show the efficacy of the novelty encoding are not shown in thisstudy. Instead, some results from the functionality of the overall scheme are shown inSection 5. Section 6 offers a discussion of the state and the perspectives of this research.
2 The Model
Approaching the novelty and familiarity discrimination problem from the perspectiveof an embodied agent has the following meaning: first, novelty has to be considered inrelation to behaviour; and second, the information that has to be judged for novel or fa-miliar is derived by the experienced episodes of events. The episode paradigm will beelaborated on first.Episodic and autobiographical memories have intrinsic relation to sensory and percep-tual events (Conway [8]). The term “episodic memory” is used differently by the re-searchers. In definition, given in [8], which extends the widely accepted definition ofTulving [9], the episodic memory has event specific, sensory-perceptual details of re-cent experiences that lasted for comparatively short periods of time (minutes to hours).

190 E.I. Barakova
To make these definitions more transparent for the purposes of our model, let us clarifythat perception includes sensing, as well as memory, anticipation behavioural goals, etc.[10][11]. Further in this text sensing and perception will be distinguished, so that sens-ing implies the external (sensory-bound) patterns, while the perception is the combinedrepresentation, formed by the sensory, memory and eventually top-down behaviouralor attentional influence.The encoding of episodes takes place in CA3 area, while the representation that guidesthe goal-oriented behaviour is formed in CA1 area. The overall processing, naturally in-cludes the contextual temporal information and accounts for novelty, and efficient en-coding.The computation in proposed model accentuates on the representation of CA1 area, asa physical component with comparative function. The relation between the incoming inand outgoing from CA1 area signals is as follows. The information from the learned ep-isode from CA3 and the sensory-bound information coming directly from EC forms thepattern in CA1 that controls the up coming behaviour and signals for novelty.This functionality has been confirmed by experimental studies to a large extent. Ouraim is a model that closely resembles the actual computations in the hippocampus andis applicable for a robotic implementation. Therefore we hypothesize the exact mecha-nism of novelty detection and context transfer between the two representations. We as-sume that the two representations - in CA1 and in CA3 area act together for the noveltydetection and future action choice. The CA1 representation determines the actionchoice and signals for novelty, while CA3 supplies it with contextual information.The computational scheme that illustrates the hypothesized functionality is as follows.Two simultaneously active neural networks, corresponding to CA3 and CA1 area per-form the major computations. The neurons in CA3 area account for temporal aspect andthe formation of episodes, the representation in CA1 area is prone to detect novelty.The third structure, EC provides the input patterns to both areas. The same patterns, asformed in EC area are projected simultaneously to CA1 area trough the direct pathway,and to CA3 area (trough DG, which is not modelled here) to further reach CA1 area.The projection to CA3 area is mainly topological. In the itinerary of the indirect path-way, in the CA3 area the broad lateral connectivity promotes formation of episodes,where the temporal characteristics of the formed episodes are taken into consideration.The representation, projected to CA1 area is not assumed topological, i.e. the connec-tivity between EC and CA1 is full. The pattern that reaches CA1 area via the direct path-way is organized on pattern similarity. Since the same projected pattern from EC areareaches within a small time interval the areas in CA1 and CA3, the connection betweenthe currently most active neurons in this two areas is also strenghtened.Let the representation that is formed in CA1 area is denoted by E. It evolves under theaction of the following competing influences: sensory S , memory M and behaviouralB. For a robotic framework it is feasible to consider discrete processing. Therefore for-mally an episode E is a set of n discrete events e , defined by a considerable differencein the event representations. A single event e that is expressed by a specific firing pat-tern in CA1 area is defined by s , m and b ,

Emergent Behaviours Based on Episodic Encoding 191
where the sensory component s introduces the current influence from the externalworld and constitutes by feedforward connections; memory component m representsthe temporal impact of the sensory patterns, and is constituted by the lateral connec-tions; the behavioural component b represents the influence that the previous action hasbrought on the current even. All three components are multidimensional vectors. Thechange from one to another event requires a change in at least one component that isbigger than an internal threshold, indicating the detection of a novel event.The memory component consists of encoded episodes of events (memory with a tem-poral reference) M as formed in CA3 area. M is a set of n discrete events occurring ina temporal order defined by a considerable difference in the eventrepresentations.
Learning of an episode means that associations can rapidly be formed among items pre-sented in temporal proximity. This is especially valid for events, or routes, where thetemporal order is of importance. Therefore by episode learning the order or the temporalassociation has appeared important rather than or along with another common feature,and this has influenced the encoding. So, the events that have been learned as an episodewill tend to be recalled together and after each other, even if presentation order ischanged. To summarize, the proposed model, as shown in , is as follows. Three struc-tures, resembling EC, CA1 and CA3 areas form the representation that is further usedfor navigation. The computations are performed in the superficial CA1 and CA3 areas.The representation, which is denoted by E describes the activation pattern in CA1 area.It contains set of elements, which are not necessarily in the order of their temporal ap-pearance. In contrast, M is a set of temporally related patterns. It refers to the activationpattern of CA3 area. The two representations are physically and computational connect-ed.
Fig. 1. Schematic representation of the proposed model. The CA3 and CA1 areas respond dif-ferently to the same patterns. The CA3 area provides temporal context to the CA1 representation.

192 E.I. Barakova
3 Biological Learning
This section outlines the biologically plausible representational and learning mecha-nisms within and between the different neural structures. Some of the formulas areadopted from the related work (like place cells definition, the specific Hebbian andTemporal Hebbian learning schemes). These are the preliminary elements that will sup-port the choice of the model and justify the simplifications that are made for the roboticsimplementation.It is widely known that the cells in the rat hippocampus fire when therat is at particular location of the environment [12]. Because of that property, these cellsare called also place cells. If the rat moves through the environment, at every particularposition a number of place cells fire. Cells that code for places in nearest vicinity firemost strongly, while the cells that code for more distant locations fire less. The activityof the place cell firing can be modelled by a Gaussian for the open environments, whereplace cells show non-directional firing. Therefore, the movement of a simulated rat atevery position of the environment is characterized by a particular pattern of firing, con-taining of the active place cells in its vicinity. The activity of each cell can be represent-ed in the following way:
where is the location in the space of the centre of the cell i’s place field, r is the po-sition of the simulated rat, and represents the width of the place field. s correspondsto the sensory representation within a single event.The sensory as well as behavioural signals are encoded into constellations of the activeplace cells. The unique pattern of activity corresponds to a certain position r in the en-vironment. The level of activity of every place cell depends on the distance between therat position and the place fields centres. Fig. 2.a) shows two single activation patternsfrom the rat route, which represent the pattern of activation of the simulated EC area.These patterns are dependant on the external-world and are further transmitted throughthe direct pathway.The learning mechanism of the feed-fortward connections from a EC area, to both CA1and CA3 area is the modified Hebbian rule as shown in Eq. (4).
where is learning rate, notation CA-EC shows the starting and destination layer ofthe connection (coming from EC, reaching CA layer) the indices i and j denote neuronson the input and output layer, correspondingly. The CA layer is not denoted as CA1 orCA3, because the learning rule is used for EC-CA1 as well as EC-CA3 learning. Theterm of Eq. (4) is needed due to internal instability of the Hebbian rule.The difference in the feedforward learning in EC-CA1 and EC-CA3 stems from the dif-ferent connectivity. In EC-CA3 area the predominant are the topological connections -the simulation is done as the neurons from the first (EC) layer project to a topologicallycorrespondent area, in a way that every input neuron is connected to 20% of the outputneurons. Differently, the learning between EC and CA1 area is done on the self-organ-

Emergent Behaviours Based on Episodic Encoding 193
izing principle, since the connectivity between those two layers is full. The lateral inhi-bition connections, denoted as LI have a sharpening effect on the transmitted to the CAareas activations.
where are learning rates, and g is a gating factor.The biological and computational plausibility of the learning process as described inEq. (4),(5) have been shown previously in [13] where the learning parameters choicesis explained in detail.By far, the representation made within the layer denoted as CA3 does not have the in-trinsic capacity for temporal association. This quality is obtained by applying a Hebbianrule with asymmetric time window over the lateral connections only. The asymmetrictime window has been simulated to correspond to the experimental measurements asfound by [14], see also [15]. The lateral learning rule is adapted from the one suggestedin [16], so that it overcomes the computational constrains of the asymmetric time win-dow function. Due to the so introduced temporal aspect, the learning in CA3 results inepisode learning. A plot of a sample learned episode performed by the set of equations(4-5) and the adapted learning rule by [16] is shown in Fig. 3.
4 Connection Between the Neural and BehaviouralRepresentations
The actor-critic model [18] most closely resembles the behavioural part of the or-ganism-environmental interaction, in the following sense: At any moment t, the embod-ied animat is able to choose an action on the environment, as well as environment pro-vides it with a feedback. In the case considered here the simulated animat can choosefrom 8 possible actions - or more exactly from 8 directions of movement.By a physical robot they are to be restricted to 3. The critic is the feedback influencethat reaches CA1 area in this model. The actor-critic mechanism regards the actions ofthe animat that are directed in finding a particular goal. The familiarity gating is entirelyperformed in the feed-forward track. The goal oriented behaviour will be used only forillustration of the animat behaviour, and not to optimize its performance. The mecha-nism of actor-critic optimization, based on place cells representation is suggested in[17].However, the two studies have completely different objective - in [17] the reinforce-ment algorithm causes improved behaviour, while in our case the learned episodes area substratum of the emergent behaviour, i.e. the first paper models dopamine like ef-fects, while we work on episodic memory based behaviour.The actor-critic mechanism used for the simulations is modified from the original[18] [17] in a way that it accounts for a more realistic movement of both rat and robot.To be consistent with the text above and with the previous notation, the critic is denotedwith b . The value of b when the animat is at a position r as represented in CA1 area,has the following form:

194 E.I. Barakova
Fig. 2. Samples of sensory patterns provided by a) the simulation of the place cells formationprocess, and b) the omnidirectional range sensor of a robot.
where is the weight between the output cell and the i-th place cell as formed in CA1area. At the made experiments, the actor makes use of 8 action cells Atposition r, the activity of the each action cell is:
where stays for the j-th action cell, and v is the adaptive weight between the actioncell and the i-th place cell. The first step for the movement direction is taken randomlywith a probability However, the next movement direction is chosen in a randomway, but the possibilities are restricted according to the choices made in the previousmovements , so there is not a random walk like trajectory, butsmoother orbits with eventual sudden turns.The actor weights are adapted according to:
where if action j was chosen at the moment t, otherwise.

Emergent Behaviours Based on Episodic Encoding 195
Fig. 3. Episodes, formed after Hebbian learning with lateral inhibition and novelty gating. Everyinput pattern activates multiple neurons. The actual path corresponds to the neurons, activated athighest.
5 Emergent Behaviours and Robotic Implications
Emergent properties arise at a particular level of system description by interaction ofrelatively simple lower level components - between themselves and with the environ-ment. In this paper as the lower level of organization is considered the functional sim-ulation of the hippocampal formation, and as the higher level the resulting behaviour.At the lower level, the sensory bound representation of the direct pathway, and the ep-isodic representation of the indirect pathway, come together in CA1 area, where thecomparison (novelty/familiarity judgements) takes place. Note that at the same time,the CA1 area gets input from the current pattern of EC area and a pattern from CA3 areathat does not have incorporated the pattern that EC area currently projects.In Fig. 2.b) are shown the omnidirectional views taken by range sensors, when a robotis at a specific position of the environment. The similarity between the nature and theshapes of both types of signals, the one obtained by distance dependant superpositionof place cell firing with respect to the rat positioning (Fig. 2.a, the inner contour) andthe range sensor readings of a robot with respect to the robots current position, Fig. 2.b),justifies the use of patterns as illustrated in Fig. 2.b) for a robot simulation. For the nov-elty detection, the network build on the basis of the proposed computational scheme issimplified. The Hebbian learning followed by a lateral inhibition is replaced by a mod-ification of the competitive Hebbian learning algorithm [19][20], which makes a singleneuron to represent an input pattern. It is necessary to organize the map which has finerepresentation for frequently visited places but coarse representation for others. Thisproblem is elegantly solved by the proposed algorithm.The connections between eventswithin an episode are formed as an internal property of the learning process that is aprinciple difference from existing models with temporal history encoding [21]. An on-line comparison of the incoming sensory-bound patterns with those encoded into epi-sodes is made. Once a recognition of the similarity between an experienced episode and

196 E.I. Barakova
the current sequence of events is encountered, the behaviour is entirely guided by theencoded memories. When memory of a similar situation is not available, the behaviouris random goal-searching. In Fig. 4. are illustrated two groups of behaviours: merelyrandom, when no related memory episode have been encountered, and two memorybased behaviours that are initiated when the similarity between the upcoming environ-mental sequence appears familiar with already experienced episodes of memories.
Fig. 4. Behaviour of the simulated rat. a) random goal-searching behaviour; b) and c) familiaritydriven behaviours, emerging after a period of exploration.
6 Discussion
This paper features episodic memory encoding as a substratum for emergence of behav-iours and goal oriented navigation, performed solely on the recollected episodes. Theepisode formation and behavioural choices are based on novelty/familiarity discrimina-tion. The impact of novelty is two-fold: it allows an efficient encoding (explorationphase) and it is a basis for flexible reuse of memories in the recall (exploitation phase).The same computational paradigm is used in both cases, which makes an on-line imple-mentation feasible.Mimicking an animal by a robot simulation has its roots in the many parallels that canbe found between them. The most obvious parallels stem from the embodied nature ofan animal and a robot: both have a physical body, gather external information and be-have accordingly. Going beyond this coarse comparison, we search for a simulation thataims exactness at the level of internal representation, the hippocampal representation inparticular.The functional efficiency of the hippocampal encoding, while performing both tasks -episodic encoding and novelty detection, suggests an optimal computational scheme,which may be beneficial for a robotics task. A detailed hippocampal simulation on itsturn is a substratum for realistic emergent behaviours and can benefit the experimentalsciences.A new concept for hippocampal model underlying behaviour simulation that has beenpresented incorporates the novelty/familiarity gated learning and builds a functionalconnection between novelty detection and episode formation. A different approach hasbeen taken to the sensory input. The functional and structural resemblance between sen-

Emergent Behaviours Based on Episodic Encoding 197
sory patterns of a robotic range sensors and place cells representation was observed, sothe robotics simulation is based on so derived patterns.
References
[1]
[2]
[3]
[4]
[5]
[6]
[7]
[8]
[9]
[10]
[11]
[12]
[13]
[14]
[15]
[16]
[17]
[18]
[19]
[20]
[21]
Bunsey, M. , Eichenbaum, H. B.: Conservation of hippocampal memory function in ratsand humans. Nature (London), 379, (1996), 255-257.
Eichenbaum, H., Dudchenko, P., Wood, E., Shapiro, M., Tanila, H.: The Hippocampus,Memory, and Place Cells: Is It Spatial Memory or a Memory Space? Neuron. Cell Press,Vol.23, (1999) 209-226.
Stark, C.E., Squire, L.R.: Simple and associative recognition memory in the hippocampalregion. Learn. Mem. 8, (1998) 190-197.
Franz, M.O., Mallot, H.A.: Biomimetic robot navigation. Robotics and AutonomousSystems 30, (2000) 133-153.
Arleo, A., Gerstner, W.: Spatial cognition and neuro-mimetic navigation: A model ofhip-pocampal place cell activity. Biological Cybernetics, 83,(2000) 287-299.
Burgess, N., Recce, M., O’Keefe, J.: A model ofhippocampal function. Neural Networks,7, (1994) 1065-1081.
Touretzky, D. S., Redish, A. D.: Theory of rodent navigation based on interacting repre-sentations of space. Hippocampus, 6, (1996) 247-270
Conway, M. A.: Sensory-perceptual episodic memory and its context: autobiographicalmemory. Phil. Trans. R. Soc. Lond. B 356, (2001) 1375-1384.
Tulving, E., Donaldson, W.: Organization of memory. New York: Acad. Press, (1972).
Barakova, E., Lourens, T.: Prediction ofrapidly changing environmental dynamics for realtime behaviour adaptation. Dynamic Perception, IOS press, (2002) 147-152.
Pfeifer, R., Scheier, C.: Understanding Intelligence, The MIT Press, (1999).
O’Keefe, J., Nadel, L.: The Hippocampus as a Cognitive Map, Oxford Press, (1971).
Schweighofer N., Doya K. and Lay F.: Unsupervised learning of granule cell sparse codesenhances cerebellar adaptive control, Neuro science 103, (2002) 35-50.
Zhang, L., Tao, H., Holt, C., Harris, W., Poo, M.: A critical window for cooperation andcompetition among developing retinotectal synapses. Nature, 395, (1998).
Markram, H., Lubke, H., Frotscher, M., Sakmann, B.: Regulation of synaptic efficacy bycoincidence of postsynaptic aps and epsps. Science, 275, (1997) 213-215.
Dayan, P., Abbott, L.F.: Theoretical Neuroscience: Computational and MathematicalModeling of Neural Systems, MIT Press, Cambridge MA (2001).
Foster, D.J., Morris, R.G.M., Dayan P.: A model of hippocampally dependent navigation,using the temporal difference learning rule. Hippocampus 10, (2000) 1-16.
Sutton, R.S. and Barto, A.G.: Reinforcement Learning: An Introduction MIT Press, Cam-bridge, MA, (1998).Fritzke B.: Growing cell structures- a selforganizing network for unsupervised and super-vised learning, Neural Networks, vol.7 (1995). 1441-1460.
Martinetz T., Schulten, K.: Topology representing networks, Neural Networks, v.7 n.3,(1994) 507-522.
Barakova, E., Zimmer, U.: Dynamic Situation and Trajectory Discrimination by Means ofClustering and Summation ofRaw Range Data, AISTA, Australia, (2000).

Increasing the Classification Accuracy of SimpleBayesian Classifier
S.B. Kotsiantis and P.E. Pintelas
Educational Software Development LaboratoryDepartment of MathematicsUniversity of Patras, Hellas
Abstract. Simple Bayes algorithm captures the assumption that every feature isindependent from the rest of the features, given the state of the class feature.The fact that the assumption of independence is clearly almost always wronghas led to a general rejection of the crude independence model in favor of morecomplicated alternatives, at least by researchers knowledgeable about theoreti-cal issues. In this study, we attempted to increase the prediction accuracy of thesimple Bayes model. Because the concept of combining classifiers is proposedas a new direction for the improvement of the performance of individual classi-fiers, we made use of Adaboost, with the difference that in each iteration ofAdaboost, we used a discretization method and we removed redundant featuresusing a filter feature selection method. Finally, we performed a large-scalecomparison with other attempts that have tried to improve the accuracy of thesimple Bayes algorithm as well as other state-of-the-art algorithms and ensem-bles on 26 standard benchmark datasets and we took better accuracy in mostcases using less time for training, too.
1 Introduction
Probabilistic classifiers and, in particular, the simple Bayes classifier, are among themost popular classifiers used in the machine learning community and increasingly inmany applications. The study of probabilistic classification is the study of approxi-mating a joint distribution with a product distribution. Probabilistic classifiers operateon data sets where each example x consists of feature values and thetarget function y can take on any value from a pre-defined finite setClassifying unseen examples involves calculating the most probable target valueand is defined as: Using Bayes theorem can be
rewritten as:
Bayes rule is used to estimate the conditional probability of a class label y, and thenassumptions are made on the model, to decompose this probability into a product ofconditional probabilities. Under the assumption that features values are conditionallyindependent given the target value, the formula used by the simple Bayes classifier is:
C. Bussler and D. Fensel (Eds.): AIMSA 2004, LNAI 3192, pp. 198–207, 2004.© Springer-Verlag Berlin Heidelberg 2004

Increasing the Classification Accuracy of Simple Bayesian Classifier 199
where V is the target output of the classifier and
and can be calculated based on their frequency in the training data.The application of previous formula is straightforward for the categorical features.
For numerical features, one can model the component marginal distributions in a widevariety of ways. The simplest would be to adopt some parametric form e.g. marginalGaussian estimators [5]. Another problem with this formula is the zero counts. Zerocounts are obtained when a given class and feature value never occur together in thetraining set, and is problematic because the resulting zero probabilities will wipe outthe information in all the other probabilities when they are multiplied. A solution tothis problem is to incorporate a small-sample correction into all probabilities, such asthe Laplace correction [5]. If a feature value does not occur given some class, itsprobability is set to 1/N, where N is the number of examples in the training set.
The assumption of independence is clearly almost always wrong. However, a large-scale comparison of simple Bayesian classifier with state-of-the-art algorithms fordecision tree induction and instance-based learning on standard benchmark datasetsfound that simple Bayesian classifier sometimes is superior to each of the other learn-ing schemes even on datasets with substantial feature dependencies [5]. An explana-tion why simple Bayes method remains competitive, even though it provides very poorestimates of the true underlying probabilities can be found in [9].
However, there are comparisons where the accuracy of the simple Bayes algorithmis near the bottom as for instance in the experiment of [14]. Nevertheless, in that casetoo, this algorithm had the best accuracy per needed training time. It predicts the classfeature in a very short time. Another advantage of simple Bayesian classifier is thatduring classification can use as inputs, data with missing values, whereas in decisiontree and neural network cannot.
In this study, we increase the training time of the simple Bayes algorithm so as totake better results. We use the simple Bayes along with the usage of discretization,feature selection and boosting. We performed a large-scale comparison with otherattempts that have tried to improve the accuracy of the simple Bayes algorithm as wellas other state-of-the-art algorithms and ensembles on 26 standard benchmark datasetsand we actually took better accuracy in most cases using less time for training, too.
Description of some of the attempts that have been tried to improve the perform-ance of simple Bayesian classifier is given in section 2. Section 3 discusses the pro-posed algorithm for improving the performance of simple Bayesian classifier. Ex-periment results in a number of data sets are presented in section 4, while brief sum-mary with further research topics are given in Section 5.
2 Previous Attempts for Improving the Performance of SimpleBayes Classifier
The most well known attempt for improving the performance of the simple Bayesalgorithm is the discretization of the continuous features into intervals, instead ofusing the default option to utilize the normal distribution to calculate probabilities.Numerous discretization methods have been examined such as the partition of the

200 S.B. Kotsiantis and P.E. Pintelas
range of the features into k equal sized intervals and the partition of the range intointervals containing the same number of instances. A brief survey of these attemptsand an empirical study comparing the performance of the most well-known discretiza-tion methods is given in [6], concluding that all the tested discretization methods canoutperform the version of the simple Bayesian classifier that assumes normal distribu-tions for continuous features. The same authors also concluded that the entropy-basedmethod [7] performed somewhat better than the others. Entropy-based discretization isa supervised incremental top down method which recursively selects the cut-pointsminimizing entropy until a stopping criterion based on the MDL criterion ends therecursion.
The performance of the simple Bayesian Classifier on domains with redundantfeatures can be also improved by removing redundant features [13]. The ‘selectiveBayesian classifier’, has been explored by numerous researchers such as [13], [16]. Awell-known filter that computes the empirical mutual information between featuresand the class, and discards low-valued features was used by [23]. Other researchershave explored the possibility of using a decision tree algorithm as a pre-processor todiscover useful feature subsets for simple Bayes classifier. A simple method that usesC4.5 decision trees [18] to select features has been described by [20].
On the other hand, a wrapping forward search strategy to select features for usewith simple Bayes was used in [13]. In [16], the author uses constructive inductionand feature deletion (BSEJ algorithm) to alleviate the feature inter-dependence prob-lem of the simple Bayesian classifier. BSEJ uses the wrapper model to join and deletefeatures. A greedy search, at each step, either deletes one feature or creates a new onethrough joining (generating the Cartesian product of) two features. BSEJ starts fromthe set of all the original features, and stops when neither joining nor deleting canimprove upon the accuracy of the simple Bayesian classifier. In [12] the researchersused the best first backward selection method as search method for applying the wrap-per approach. They showed that this combination has very good results with simpleBayes algorithm.
More elaborate attempts to overcome the assumption of independence betweenfeatures are based on including extra terms describing the relationship between thefeatures [10]. Of course, this means that the simple form of the simple Bayes model issacrificed. In fact, these particular authors approached things from the opposite di-rection, identifying weaknesses of the approach based on constructing an overallmodel of the joint distribution, and restricting themselves to models which included allthe two way marginals of which had the class label as one component.
Recently, an iterative approach of simple Bayes is presented in [11]. The iterativeBayes begins with the distribution tables built by the simple Bayes and then the algo-rithm iteratively cycles through all the training examples using a hill-climbing tech-nique. Experimental evaluation of iterative Bayes showed minor but consistent gain inaccuracy in relation to simple Bayes [11]. However, the contingency tables are incre-mentally updated each time a training example is seen, which implies that the order ofthe examples could influence the final decision.
Another attempt for improving the simple Bayes model was the Bayesian trees[27]. A Bayesian tree-learning algorithm builds a decision tree, and generates a localsimple Bayesian classifier at each leaf. The tests, leading to a leaf, can alleviate fea-

Increasing the Classification Accuracy of Simple Bayesian Classifier 201
ture inter-dependencies for the local simple Bayesian classifier. In [27], the authorsalso proposed the application of lazy learning techniques to Bayesian tree inductionand presented the resulting lazy Bayesian rule-learning algorithm, called LBR. Foreach test example, it builds a most appropriate rule with a local simple Bayesian clas-sifier as its consequent.
Lately in the area of ML the concept of combining classifiers is proposed as a newdirection for the improvement of the performance of individual classifiers. In [2], theresearchers built an ensemble of simple Bayes classifiers using bagging [4] andboosting procedures [8]. Another way that has been examined for generation of en-semble of simple Bayesian classifiers is by using different feature subsets randomlyand taking a vote of the predictions of each classifier that uses different feature subset[25].
3 Presented Algorithm
As we have already mentioned, comparing the performance of the most well knowndiscretization methods, in [6], the authors concluded that the entropy-based method[7] performed slightly better. For this reason, we use the entropy-based method asdiscretization method in our algorithm. Full description of the discretization method isbeyond the scope of this paper since it can be found in [7].
Feature wrappers selection techniques often achieve better results than filters due tothe fact that they are tuned to the specific interaction between the induction algorithmand its training data [6]. However, they tend to be much slower than feature filtersbecause they must repeatedly call the induction algorithm. In the authors’ opinion, theadvantage of filter approach outweighs its disadvantage. In general, filters executemany times faster than wrappers, and therefore stand a much better chance of scalingto databases with a large number of features than wrappers do. Thus, we have selectedto use the filter approach embedded to our algorithm. The well-known filter that com-putes the empirical mutual information between features and the class [23], and dis-cards low-valued features was modified for our algorithm. The mutual informationgain criterion has a strong bias in favor of features with many different values, thus werectify this bias by a kind of normalization – gain ratio that sometimes is used fromdecision tree algorithms [18] was used by the proposed algorithm. Features are se-lected by keeping those for which gain ratio exceeds a fixed threshold e. In order tohave a robust selection, we set e to 0.02 of the gain ratio filter, in an attempt to discardonly features with negligible impact on predictions. However, such a low thresholdcan discard many features.
The ensembles of simple Bayesian classifiers have traditionally not been a focus ofresearch. The reason is that simple Bayes is an extremely stable learning algorithm,and bagging is mainly variance reduction technique, thus not being able to benefitfrom its integration. However, simple Bayes can be effectively used in ensemble tech-niques, which perform also bias reduction, such as boosting [2]. The authors of [2]also report that there is a problem with boosting which is the robustness to noise. Thisis expected because noisy examples tend to be misclassified, and the weight will beincreased for these examples. For this reason, we have chosen to use Adaboost with

202 S.B. Kotsiantis and P.E. Pintelas
only 10 classifiers. Thus, the proposed algorithm (BoostFSNB) is summarized in(Figure 1). It makes use of Adaboost, with the difference that in each iteration ofAdaboost, it uses the entropy discretization method and it removes redundant featuresusing the gain ratio filter feature selection method.
Fig. 1. The proposed algorithm
Because the proposed algorithm is a combination of models, the produced classifieris less easily interpretable than the simple Bayes model. However, BoostFSNB as aweighted sum of simple Bayes models, remains much more easily interpretable thanNeural Networks and Support Vector Classifiers [21]. In [24], the authors showed thatboosting improves the accuracy of the simple Bayesian classifier in 9 out of the tested14 data sets. However, they concluded that the mean relative error reduction ofboosting over the simple Bayesian classifier in the 14 data sets was only 1%, indicat-ing very marginal improvement due to boosting. On the contrary, the proposed algo-rithm has mean relative error reduction about 20% over the simple Bayesian classifierin the tested data sets. The main reason is that the embedding feature selection tech-nique makes the simple Bayes slightly unstable and as a result more suitable forAdaboost.
In the following section, we present the experiments. It must be mentioned that thecomparisons of the proposed algorithm are separated in three phases: a) with the otherattempts that have tried to improve the accuracy of the simple Bayes algorithm, b)with other state-of-the-art algorithms and c) with other well-known ensembles.

Increasing the Classification Accuracy of Simple Bayesian Classifier 203
4 Comparisons and Results
For the purpose of our study, we used 26 well-known datasets from many domainsfrom the UCI repository [3]. These data sets were hand selected so as to come fromreal-world problems and to vary in characteristics. In order to calculate the classifiers’accuracy, the whole training set was divided into ten mutually exclusive and equal-sized subsets and for each subset the classifier was trained on the union of all of theother subsets. Then, cross validation was run 10 times for each algorithm and themedian value of the 10-cross validations was calculated. In Table 1, one can see thecomparisons of the proposed algorithm with the other attempts that have tried to im-prove the classification accuracy of the simple Bayes algorithm. Four well-knownalgorithms were used for the comparison: discretize simple Bayes [6], selective simpleBayes with forward selection [13], Tree Augmented Naïve Bayes [10] and lazy Baye-sian rule-learning algorithm [27]. It must be mentioned that we also present the accu-racy of the simple Bayes algorithm as borderline. In addition, a representative algo-rithm for each of the other sophisticated machine learning techniques was tested. Themost well known learning algorithm to estimate the values of the weights of a neuralnetwork - the Back Propagation (BP) algorithm [15] - was the representative of theANNs. SMO algorithm was the representative of the Support Vector Machines [17].We also used the 3-NN algorithm as a representative of kNN[1].
In Table 1, we represent with “vv” that the proposed BoostFSNB algorithm loosesfrom the specific algorithm. That is, the specific algorithm performed statisticallybetter than BoostFSNB according to t-test with p<0.001. In addition, in Table 1, werepresent with “v” that the proposed BoostFSNB algorithm looses from the specificalgorithm according to t-test with p<0.05. Furthermore, in Table 1, indicates thatBoostFSNB performed statistically better than the specific classifier according to t-testwith p<0.00l while according to p<0.05. In all the other cases, there is no signifi-cant statistical difference between the results (Draws). It must be mentioned that theconclusions are mainly based on the resulting differences for p<0.001 because a p-value of 0.05 is not strict enough, if many classifiers are compared in numerous datasets [22]. However, as one can easily observe the conclusions remain the same withp<0.05. In the last rows of the Table 1 one can see the aggregated results in the form(a/b/c). In this notation “a” means that the proposed algorithm is significantly moreaccurate than the compared algorithm in a out of 26 data sets, “c” means that the pro-posed algorithm is significantly less accurate than the compared algorithm in c out of26 data sets, while in the remaining cases (b), there is no significant statistical differ-ence between the results. Thus, the proposed algorithm is significantly more accuratethan simple Bayes (NB) in 12 out of the 26 data sets, while it has significantly highererror rates than simple Bayes in three data sets. The average error rate of our algo-rithm is also about 20% less than that of simple Bayes algorithm.
In addition, the proposed algorithm has significantly lower error rates in 11 out ofthe 26 data sets than the simple discretize version of simple Bayes (DiscNB), while itis significantly less accurate in three data sets. Furthermore, the proposed algorithm issignificantly more accurate than the wrapping feature selection version of simpleBayes (WrapperNB) in 11 out of the 26 data sets using less time for training, too. Inonly one data set, the proposed algorithm has significantly higher error rate. Moreo-

204 S.B. Kotsiantis and P.E. Pintelas
ver, the proposed algorithm is significantly more accurate than LBR algorithm in 6 outof the 26 data sets and even though, the proposed algorithm has significantly highererror rates in other six data sets it uses much less time for training and classification.Additionally, the average error rate of the proposed algorithm is 2.5% less than LBR.Finally, the proposed algorithm is significantly more accurate than Tree AugmentedNaïve Bayes (TAN) algorithm in 4 out of the 26 data sets, while it is significantly lessaccurate in two data sets.
The proposed algorithm is also significantly more precise than BP algorithm withone hidden layer in 8 out of the 26 data sets, whilst it has significantly higher errorrates in six data sets. In addition, the proposed algorithm is significantly more accuratethan SMO algorithm in 7 out of the 26 data sets, whereas it has significantly highererror rates in four data sets. The proposed algorithm is significantly more precise than3NN algorithm in 10 out of the 26 data sets, while it has significantly higher error

Increasing the Classification Accuracy of Simple Bayesian Classifier 205
rates in four data sets. In brief, we managed to improve the performance of the simpleBayes Classifier obtaining better accuracy than other well known methods that havetried to improve the performance of the simple Bayes algorithm. The proposed algo-rithm also gave better accuracy than other sophisticated state-of-the-art algorithms onmost of the 26 standard benchmark datasets. Moreover, BoostFSNB needed 31 timesless time for training (on the average) in the tested data-sets than BP and 2.5 timesthan SMO.
Subsequently, we compare the performance of BoostFSNB with bagging decisiontrees and boosting decision trees that have been proved to be very successful for manymachine-learning problems [19]. Similarly with the proposed algorithm, Quinlan(1996) used 10 classifiers for bagging and boosting C4.5 algorithm. In Table 2, wepresent the accuracy of the simple Bayes algorithm after applying the bagging andboosting procedures (with 25 classifiers) as [2] used in their experiments. In the lastrows of the Table 2 one can see the aggregated results.
The proposed algorithm is significantly more accurate than boosting C4.5 algo-rithm with 10 classifiers in 9 out of the 26 data sets. In only four data sets, the pro-posed algorithm has significantly higher error rates. In addition, the proposed algo-rithm is significantly more accurate than bagging C4.5 algorithm with 10 classifiers in6 out of the 26 data sets, while on other six data sets, the proposed algorithm has sig-nificantly higher error rates using in any case less than half time for training. Addi-tionally, the average error rate of the proposed algorithm is 2% less than bagging C4.5algorithm. In brief, we took better accuracy than boosting and bagging decision treeson the most of the 26 standard benchmark datasets, using less time for training, too. In

206 S.B. Kotsiantis and P.E. Pintelas
addition, the proposed algorithm is significantly more accurate than single boostingsimple Bayes (AdaBoostNB) algorithm (using 25 classifiers) in 8 out of the 26 datasets, while in four data sets, the proposed algorithm has significantly higher errorrates. Moreover, the proposed algorithm is significantly more accurate than singlebagging simple Bayes algorithm (using 25 ensembles) in 12 out of the 26 data sets,whereas it has significantly higher error rates in only four data sets.
5 Conclusions
Ideally, we would like to be able to identify or design the single best learning algo-rithm to be used in all situations. However, both experimental results [14] and theo-retical work [15] indicate that this is not possible. The simple Bayes classifier hasmuch broader applicability than previously thought. Besides its high classificationaccuracy, it also has advantages in terms of simplicity, learning speed, classificationspeed and storage space.
To sum up, we managed to improve the performance of the simple Bayesian Classi-fier combining the usage of discretization, feature selection and boosting procedures.We performed a large-scale comparison with other attempts that have tried to improvethe accuracy of the simple Bayes algorithm as well as other state-of-the-art algorithmsand ensembles on 26 standard benchmark datasets and we took better accuracy inmost cases using less time for training, too. Using less time for training the proposedalgorithm stands a much better chance of scaling to data mining applications.
In future research it would be interesting to examine the performance of the pre-sented algorithm in extremely imbalanced data sets. We believe that the embeddedboosting process of the presented algorithm enables it to operate comparatively well insuch difficult data sets, too.
References
1.2.
3.
4.5.
6.
7.
D. Aha, Lazy Learning, Dordrecht: Kluwer Academic Publishers, 1997.E. Bauer, and R. Kohavi. An empirical comparison of voting classification algorithms:Bagging, boosting, and variants, Machine Learning, 36 (1999): 105–139.C.L. Blake and C.J. Merz, UCI Repository of machine learning databases[http://www.ics.uci.edu/~mlearn/MLRepository.html]. Irvine, CA: University of Califor-nia, Department of Information and Computer Science (1998).L. Breiman, Bagging Predictors. Machine Learning, 24 (1996): 123-140.P. Domingos and M. Pazzani, On the optimality of the simple Bayesian classifier underzero-one loss, Machine Learning, 29(1997): 103-130.J. Dougherty, R. Kohavi and M. Shami. Supervised and unsupervised discretization ofcontinuous features. In Proceedings of the twelfth International Conference of MachineLearning. Morgan kaufmann (1995).U. Fayyad and K. Irani, Multi-interval discretization of continuous-valued attributes forclassification learning. In Proceedings of the Thirteenth International Joint Conference onArtificial Intelligence, Morgan Kaufmann (1993): 1022-1027.

Increasing the Classification Accuracy of Simple Bayesian Classifier 207
8.
9.
10.
11.12.
13.
14.
15.16.
17.
18.19.
20.
21.
22.
23.
24.
25.
26.
27.
Y. Freund and R. E. Schapire, Experiments with a New Boosting Algorithm, In Proceed-ings of ICML’96, 148-156.J. H. Friedman, On bias, variance, 0/1-loss and curse-of-dimensionality. Data Mining andKnowledge Discovery, 1(1997): 55-77.N. Friedman, D. Geiger and M. Goldszmidt, Bayesian network classifiers. MachineLearning, 29(1997): 131-163.J. Gama, Iterative Bayes. Intelligent Data Analysis, 6(2000): 463 – 473.R. Kohavi and G. John, Wrappers for feature subset selection, Artificial Intelligence,2(1997): 273-324.P. Langley and S. Sage, Induction of selective Bayesian classifiers. In Proc. of the 10thConference on Uncertainty in Artificial Intelligence, Seattle, (1994): 399-406.D. Michie, D. Spiegelhalter and C. Taylor, Machine Learning, Neural and StatisticalClassification, Ellis Horwood, 1994.T. Mitchell, Machine Learning, McGraw Hill, 1997.M. Pazzani, Searching for dependencies in Bayesian classifiers. Artificial Intelligence andStatistics IV, Lecture Notes in Statistics, Springer-Verlag: New York, 1997.J. Platt, Using sparseness and analytic QP to speed training of support vector machines. InM. S. Kearns, S. A. Solla, and D. A. Cohn (Eds.), Advances in neural information proc-essing systems 11, MA: MIT Press, 1999.J.Quinlan, C4.5: Programs for machine learning. Morgan Kaufrnann, San Francisco, 1993.J. R. Quinlan, Bagging, boosting, and C4.5. In Proceedings of the Thirteenth NationalConference on Artificial Intelligence (1996), 725–730.C. Ratanamahatana and D. Gunopulos, Feature Selection for the Naive Bayesian Classifierusing Decision Trees, Applied Artificial Intelligence, 17 (2003): 475–87.G. Ridgeway, D. Madigan and T. Richardson,. Interpretable boosted Naive Bayes classifi-cation. In Proceedings of the Fourth International Conference on Knowledge Discoveryand Data Mining, Menlo Park (1998): 101-104.S. Salzberg, On Comparing Classifiers: Pitfalls to Avoid and a Recommended Approach,Data Mining and Knowledge Discovery, 1(1997): 317–328.M. Singh, and G. Provan, Efficient learning of selective Bayesian network classifiers. InProc of the 13th International Conference on Machine Learning (1996): 453-461, Bari.K. Ting and Z. Zheng,. Improving the Performance of Boosting for Naive Bayesian Clas-sification, N. Zhong and L. Zhou (Eds.): PAKDD’99, LNAI 1574, pp. 296-305, 1999.Tsymbal, S. Puuronen and D. Patterson, Feature Selection for Ensembles of Simple Baye-sian Classifiers, In Proceedings of ISMIS (2002): 592-600, Lyon, June 27-29.Witten and E. Frank, Data Mining: Practical Machine Learning Tools and Techniqueswith Java Implementations. Morgan Kaufrnann, San Mateo, 2000.Z. Zheng, and G.I. Webb, Lazy learning of Bayesian rules. Machine Learning, 41 (2000):53-84

Outlier Detecting in Fuzzy Switching RegressionModels
Hong-bin Shen 1, Jie Yang 1, and Shi-tong Wang 2
1 Institute of Image Processing & Pattern Recognition, Shanghai Jiaotong University,Shanghai, China, 200030
[email protected] (H-b. Shen)[email protected] (J.Yang)
2 Dept. of Information, Southern Yangtse University, Jiangsu, China, 214036
Abstract. Fuzzy switching regression models have been extensively used ineconomics and data mining research. We present a new algorithm namedFCWRM (Fuzzy C Weighted Regression Model) to detect the outliers in fuzzyswitching regression models while preserving the merits of FCRM algorithmproposed by Hathaway. The theoretic analysis shows that FCWRM can con-verge to a local minimum of the object function. Several numeric examplesdemonstrate the effectiveness of algorithm FCWRM.
Keywords: fuzzy switch regression, outlier, fuzzy clustering
1 Introduction
Switching regression models have been extensively used in economics [1 ~ 3] anddata mining research fields. Many scholars discussed switching regression models invarious details [4 ~ 6]. In [4], the authors proposed FCRM algorithm to solve theswitching regression problems based on the famous FCM clustering algorithm. InFCRM, the distance between the data vectors and cluster centers is represented by thedifference between the output of different models and the expected output. WhenFCRM finally converges, it will produce estimates of the parameters of differentmodels and at the same time assign a fuzzy label to each datum in the dataset.
Outliers are data values that lie away from the general regression models andidentifying outlying observation is an important aspect of the regression model-building process. For outliers often imply some important features or rules, how tolocate outliers have attracted more and more attention and several different methodshave been proposed to attain this goal[6]. Some of the methods can only work wellfor the regression model containing only one single outlier point, such as Cook’sDistance, and others can find multi-outliers in the linear regression models. The pur-pose of this paper is to present a new approach for identifying the outliers in bothlinear and nonlinear regression models or the mixture of them while keeping the ad-vantages of Hathaway’s approach FCRM [4], that is, the approach proposed in thispaper will also produce estimates of the parameters accurately and at the same time
C. Bussler and D. Fensel (Eds.): AIMSA 2004, LNAI 3192, pp. 208–215, 2004.© Springer-Verlag Berlin Heidelberg 2004

Outlier Detecting in Fuzzy Switching Regression Models 209
assign a fuzzy label to each datum in the regression dataset. For this purpose, we willassign a weight factor to each data vector in the dataset and this weight factor can beinterpreted as the importance of the datum. According to the information theory, theinformation with lower frequency is more important than those happened frequently,that is to say, the outliers will have much larger weight factors than those normal datapoints in the models, which will be demonstrated by algorithm FCWRM. With theweight obtained, we can detect the outliers in the switch regression models easily andquickly.
2 Fuzzy Switching Regression Models with Outliers
2.1 Outlier in the Switching Regression Models
Data points that lie away from other observations are called outliers. Each outlierneeds to be examined carefully to determine if it represents a possible value from thepopulation being studied, in which case it should be retained, or if it is an error inwhich case it can be excluded. It may be that an outlier is the most important featureof a dataset. Fig. 1 illustrates such a switching regression model including 2 outlierpoints in the dataset.
Fig. 1. A sample of fuzzy C regression model with outliers
In this paper, we assign a weight factor to each datum in the dataset and then wecan construct a new algorithm of FCWRM (Fuzzy C Weighted Regression Model).By iterative function of the weight factor derived from the new objective function,every datum vector will obtain a weight factor when the algorithm finally converges,which can be used as a new criteria for finding the outlier information in the dataset.Furthermore, it can also produce estimates of and at the same timeassign a fuzzy label to each datum in the regression dataset.
2.2 FCWRM Algorithm
By assigning a weight factor to each datum of the dataset, we can obtain a new objec-tive function of FCWRM as follows:

210 H.-b. Shen, J. Yang, and S.-t. Wang
Where N is the number of the datum in the dataset and and w is total
weight of the points in the dataset. The aim of FCWRM is to add a small weighting
value (large value for to the datum that belongs to at least one of the
switching regression models. Generally speaking, outliers are far away from all themodels, in this case, we will assign a large value to each outlier (small value for
The parameter q plays an important role in the clustering process. When q is
large enough, then the weight value of each datum is almost equal to in other
words, the weight plays the same influence on all the data samples; and ifthen the influence of the weight will reach the maximum.
Considering this constraint of we have the following Lagrange func-
tion without constraints:
Where is the Lagrange coefficient. Differentiating (2) with respect to we ob-tain the following partial differentiation equation:
with
Resolving (4) for
with
we will obtain:

Outlier Detecting in Fuzzy Switching Regression Models 211
so
(9) is the iterative function of the weight factor.
Now we present the following FCWRM algorithm:
According to ( 4 ), (8):

212 H.-b. Shen, J. Yang, and S.-t. Wang
2.3 Convergence of FCWRM
Now, let us investigate the convergence properties of this new FCWRM algorithm:Theorem 1: Let where is fixed, and
for all then U is a local minimum of if andonly if is computed via (10).
Proof: The only-if part has been proved according to the derivation of To
show the sufficiency, we examine the CN × CN Hessian of the Lagrangian of
evaluated at the U given by (10). Using Lagrange multiplier method, we findthat the problem is equivalent to minimizing
From (11), we have

Outlier Detecting in Fuzzy Switching Regression Models 213
Where is computed from (10). Thus, is a diagonal matrix.
Since m>1 , and 0 for all we know from the
above formula that Hessian H(U) is positive definite and consequently, (10) is also asufficient condition for minimizing
Theorem 2: Let where is fixed, and for allm > 1. Then is a local minimum of if
and only if is computed via (9).Proof: The necessity was proved based on the derivation of Toshow the sufficiency, we have from (2) that
i.e. the Hessian is positive definite and consequently (9) is a sufficient condition forminimizing
With Theorem 1 and 2, similar to Bezdek’s proof in [4], we can prove that
In other words, is a decreasing function with t. So, the FCWRM algorithmwill finally converge.
3 Simulations
In this section, we use the numerical simulation results to illustrate the effectivenessof algorithm FCWRM. Set m = 2, w = 250, q =1.Example 1— In this example, we test FCWRM on the nonlinear system with C = 2which is also used by Hathaway in [4] as the benchmark sample. The dataset is gener-ated with the following nonlinear system with the same parameter of [4]:
Fig. 2 shows the datasets of 4 cases used in this example named A, B, C, D.
Fig. 2. The nonlinear system with outliers of 4 cases used in this example

214 H.-b. Shen, J. Yang, and S.-t. Wang
We test FCWRM on these 4 cases 10 times and Table 1 illustrates the meanweight factors of normal datum vectors and that of the outliers in the datasets.
Where and denote the mean weight factor of normal datum and outlier pointsrespectively. From Table 1, we can detect the outlier information of the 4 datasetseasily with the weight factor obtained.
Example 2—In this example, we deal with mining mixture structure involving curveand line in the same model while trying to find the outliers in the dataset which isshown in Fig. 3. The dataset is generated from the following mixture system withparameters.
Fig. 3. A mixture of curve and line dataset Fig. 4. Mining results with outliers
Fig. 4 shows the first two data vectors when we sort all the observations accordingto their weight factors in descent order, which are considered as the outliers in thispaper and the result is somehow satisfactory. Obviously, if we want to selectn observations from the dataset as the outlier candidate, the first n observations of thesorted datums in accordance with their weights in descent order are the answer. Wecan demonstrate again that FCWRM algorithm is an effective algorithm that can alsomine the outliers from the mixture structure.
4 Conclusions
This paper proposed a new algorithm FCWRM to find the outlier information in theregression models. The best advantage of FCWRM is that we can detect the outliers

Outlier Detecting in Fuzzy Switching Regression Models 215
in the dataset easily by the weight obtained while producing the accurate estimate ofthe parameters of the regression models. Our theoretic analysis shows that FCWRMcan converge to a local minimum of the objective function. Simulations are done toshow the validity and effectiveness of FCWRM.
References
1.
2.
3.
4.
5.
6.
D. S .Hamermesh, “Wage bargains, threshold effects, and the Phillips curve,” Quart. J.Econ. 84(1970)501—517R. E. Quandt, “A new approach to estimating switching regressions,” J. Amer. Statist.Assoc. 67(1972)306—310R. E. Quandt and J. B. Ramsey, “Estimating mixtures of normal distributions and switch-ing regressions,” J. Amer. Statist. Assoc. 73 (1978) 730—752.R. Hathaway and J. Bezdek, “Switching regression models and fuzzy clustering,” IEEETrans. Fuzzy Syst. 1,3 (1993) 195—204.S. B. Caudill and R. N. Acharyal, “Maximum-likelihood estimation of a mixture of normalregressions: starting values and singularities,” Commun. Stat.-Simul. 27, 3 (1998) 667—674.David.M.Sebert, Douglas C. Montgomery, Dwayne A. Rollier, “A Clustering Algorithmfor identifying multiple outliers in linear regression”, Computational Statistics and DataAnalysis, 27(1998) 461—484.

PubMiner: Machine Learning-Based Text MiningSystem for Biomedical Information Mining
Jae-Hong Eom and Byoung-Tak Zhang
Biointelligence Lab., School of Computer Science and Engineering,Seoul National University,
Seoul 151-744, South Korea{jheom, btzhang}@bi.snu.ac.kr
Abstract. PubMiner, an intelligent machine learning based text mining systemfor mining biological information from the literature is introduced. PubMinerutilize natural language processing and machine learning based data miningtechniques for mining useful biological information such as protein-protein in-teraction from the massive literature data. The system recognizes biologicalterms such as gene, protein, and enzymes and extracts their interactions de-scribed in the document through natural language analysis. The extracted inter-actions are further analyzed with a set of features of each entity which wereconstructed from the related public databases to infer more interactions fromthe original interactions. An inferred interaction from the interaction analysisand native interaction are provided to the user with the link of literaturesources. The evaluation of system performance proceeded with the protein in-teraction data of S.cerevisiae (bakers yeast) from MIPS and SGD.
Keywords: Natural Language Processing, Data Mining, Machine Learning,Bioinformatics, and Software Application
1 Introduction
New scientific discoveries are founded on the existing knowledge which has to beeasy to get to and thus usable by the scientific community. Electronic storage allowsthe customized extraction of information from the literature and its combination withother data resources such as heterogeneous databases. The scientific community isgrowing so that even for a rather specialized field it becomes impossible to stay up-to-date just through personal contacts in that particular community. The growing amountof knowledge also increases the chance for new ideas based on combining solutionsfrom different fields. And there is a necessity of accessing and integrating all scientificinformation to be able to judge the own progress and to get inspired by new questionsand answers [1].
Since the human genome sequences have been decoded, especially in biology andbioinformatics, there are more and more people devoted to this research domain andhundreds of on-line databases characterizing biological information such as se-quences, structures, molecular interactions, and expression patterns [2]. Even though
C. Bussler and D. Fensel (Eds.): AIMSA 2004, LNAI 3192, pp. 216–225, 2004.© Springer-Verlag Berlin Heidelberg 2004

PubMiner: Machine Learning-Based Text Mining System 217
the widespread topics of research, the end result of all biological experiments is apublication in the form of text. Information in text form such as MEDLINE1, however,is a greatly underutilized source of biological information to the biological research-ers. It takes lots of time to obtain the important and precise information from hugedatabases with daily increase. Thus knowledge discovery from a large collection ofscientific papers is very important for efficient biological and biomedical research.Until now, a number of tools and approaches have been developed to resolve suchneeds. There are many systems analyzing abstracts in MEDLINE to offer bio-relatedinformation services. For example, Suiseki [3] and BioBiblioMetrics [4] focus on theprotein-protein interaction extraction and visualization. MedMiner [5] utilizes externaldata sources such as GeneCard [6] and MEDLINE for offering structured informationabout specific keywords provided by the user. AbXtract [7] labels the protein functionin the input text and XplorMed [8] presents the user specified information through theinteraction with user. GENIES [9] discovers more complicated information such aspathways from journal abstracts. Recently, MedScan [10] employed full-sentenceparsing technique for the extraction of human protein interactions from MEDLINE.And there a number of approaches related to text mining for biology and other fields[11].
Generally, these conventional systems rely on basic natural language processing(NLP) techniques when analyzing literature data. And the efficacy of such systemsgreatly depends on the rules for processing unrefined information. Such rules have tobe refined by human experts, entailing the possibility of lack of clarity and coverage.In order to overcome this problem, we used machine learning techniques in combina-tion with conventional NLP techniques. Our method also incorporated several datamining techniques for the extensive discovery, i.e., detection of the interactions whichare not explicitly described in the text.
We have developed PubMiner (Publication Text Mining system) which performsefficient mining of gene and protein interactions. For the evaluation, the budding yeast(S. cerevisiae) was used as a model organism. The goal of our text mining system is todesign and develop an information system that can efficiently retrieve the biologicalentity-related information from the MEDLINE, where the biological entity-relatedinformation includes biological function of entities (e.g., gene, protein, and enzymes),related gene or protein, and relation of gene or proteins. Especially we focus on inter-actions between entities.
The paper is organized as follows. In Section 2, the overall architecture of Pub-Miner is described. In Section 3, we describe the methodology of the relation infer-ence module of PubMiner. In Section 4, performance evaluation of each component isgiven. Finally, concluding remarks and future works are given in Section 5.
2 System Description
The system, PubMiner, consists of three key components: natural language process-ing, machine learning-based inference, and visualization module.
1 http://www.pubmed.gov

218 J.-H. Eom and B.-T. Zhang
2.1 Interaction Extraction
The interaction extraction module is based on the NLP techniques adapted to take intoaccount the properties of biomedical literature. It includes a part-of-speech (POS)tagger, a named-entity tagger, a syntactic analyzer, and an event extractor. The POStagger based on hidden Markov models (HMMs) was adopted for tagging biologicalwords as well as general ones. The named-entity tagger, based on support vector ma-chines (SVMs), recognizes the region of an entity and assigns a proper class to it. Thesyntactic analyzer recognizes base phrases and detects the dependency represented inthem. Finally, the event extractor finds the binary relation using the syntactic informa-tion of a given sentence, co-occurrence statistics between two named entities, andpattern information of an event verb. General medical term was trained with UMLSmeta-thesaurus [12] and the biological entity and its interaction was trained withGENIA [13] corpus. The underlying NLP approaches for named entity recognition arebased on the system of Hwang et al. [14] and Lee et al. [15] with collaborations. Moredetailed descriptions of language processing are elucidated in [16]. Figure 1 shows theschematic architecture of the interaction extraction module.
Fig. 1. The schematic architecture of the interaction extraction module (left) and the example ofsentence parsing (right). The resulting event DB contains interactions between entities. Eventpattern database was constructed from the GENIA corpus and tuned to yeast domain withmanually tagged documents.
2.2 Inference
The relation inference module, which finds common features and group relations, isbased on data mining and machine learning techniques. A set of features of each com-ponent of the interaction are collected from public databases such as SaccharomycesGenome Database (SGD) [17] and database of Munich Information Center for ProteinSequences (MIPS) [18] and represented as a binary feature vector. An association rulediscovery algorithm, Apriori [19] was used to extract the appropriate common featureset of interacting biological entities. In addition, a distribution-based clustering algo-rithm [20] was adopted to analyze group relations. This clustering method collectsgroup relation from the collection of document which contains various biologicalentities. And the clustering procedure discovers common characteristics among mem-bers of the same cluster. It also finds the features describing inter-cluster (betweenclusters) relations. PubMiner also provides graphical user interface to select variousoptions for the clustering and mining. Finally, the hypothetical interactions are gener-ated for the construction of interaction network. The hypotheses correspond to theinferred generalized association rules and the procedure of association discovery is

PubMiner: Machine Learning-Based Text Mining System 219
described in Section 3. The inferred relations as well as the original relations arestored in the local database in a systematic way for efficient management of informa-tion. Figure 2 describes the schematic architecture of relation inference module.
Fig. 2. The schematic architecture of relation inference module. For feature encoding, featuredefinition of public database such as SGD and MIPS are used. The event list represents the setof interactions which was constructed from previous interaction extraction module. The ex-tended interactions include inferred interaction through the feature association mining.
Fig. 3. The workflow diagram of the visualization module (left) and its interface (right). Thedashed lines in the resulting interaction graph represent the inferred interactions.
2.3 Visualization
The visualization module shows interactions among the biological entities as a net-work format. It also shows the documents from which the relations were extracted andinferred. In addition, diverse additional information, such as the weight of associationbetween biological entities could be represented. Thus the user can easily examine thereliability of relations inferred by the system. Moreover, this module shows interactionnetworks with minimized complexity for comprehensibility and can be utilized as anindependent interaction network viewer with predefined input format. Figure 3 showsthe overall architecture of visualization module and its interface.
3 Methods
In this section we describe the methodology of the relation inference module of Pub-Miner. Basically, the relation inference is based on the machine learning theory to findthe optimal feature sets. Additionally, association rule discovery method which iswidely used in data mining field is used to find general association among the selectedoptimal features.

220 J.-H. Eom and B.-T. Zhang
3.1 Feature Selection
In our application, each interaction event is represented by their feature association.Thus the selection of optimal feature subset is important to achieve the efficiency ofsystem and to eliminate non-informative association information. Therefore, Pub-Miner uses feature dimension reduction filter which was earlier introduced by Yu etal. [21], named fast correlation-based filter (FCBF), to achieve these objectives. Here,we call this FCBC procedure as feature dimension reduction filter (FDRF) for ourapplication.
Each feature of data can be considered as a random variable and the entropy is usedas a measure of the uncertainty of the random variable. The entropy of a variable X isdefined as:
And the entropy of X after observing values of another variable Y is defined as:
where is the prior probability of the value of Y, and is the posteriorprobability of X being given the values of Y. The amount by which the entropy of Xdecreases reflects additional information about X provided by Y and is called informa-tion gain [22], given by
According to this measure, a feature Y is considered to be more correlated to fea-ture X than feature Z, if Symmetry is a desired property for ameasure of correlation between features and information gain. However, informationgain is biased in favor of features with more values and the values have to be normal-ized to ensure they are comparable and have the same affect. Therefore, here we usethe symmetrical uncertainty as a measure of feature correlation [23], defined as:
With symmetrical uncertainty (SU) as feature association measure, we use the fea-ture selection procedure of Yu et al. [21] to reduce the computational complexity ofassociation mining. To decide whether a feature is relevant to the protein interaction(interaction class) or not, we use two measures, c–correlation and f–correlation whichuse the threshold SU value decided by user. The class C in Figure 4 is divided intotwo classes, conditional protein class and result protein class of interaction.Definition 1. Assume that dataset S contains
features and a class C or Let denote the SU value thatmeasures the correlation between a feature and the class C (called c–correlation),then a subset S ' of relevant features can be decided by a threshold SU value suchthat And the pair-wise correlation between all features

PubMiner: Machine Learning-Based Text Mining System 221
(called f–correlation) can be defined in same manner of c–correlation with a thresholdvalue The value of f–correlation is used to decide whether relevant feature is redun-dant or not when considering it with other relevant features.
Fig. 4. The procedures of feature dimension reduction filter (FDRF).
3.2 Mining Feature Association
Association Mining
To predict protein–protein interaction with feature association, we adopt the associa-tion rule discovery data mining algorithm (so-called Apriori algorithm) proposed byAgrawal et al. [19]. Generally, an association rule has two values, supportand confidence, representing the characteristics of the association rule. Support (SP)represents the frequency of co-occurrence of all the items appearing in the rule. Andconfidence (CF) is the accuracy of the rule, which is calculated by dividing the SPvalue by the frequency of the item in conditional part of the rule.
where represents association rule for two items (set of features) A and B in thatorder. Association rule can be discovered by detecting all the possible rules whosesupports and confidences are larger than the user-defined threshold value called mini-mal support and minimal confidence respectively. Rules that satisfyboth minimum support and minimum confidence threshold are taken as to be strong.Here we consider these strong association rules as interesting ones.

222 J.-H. Eom and B.-T. Zhang
In this work, we use the same association rule mining and the scoring approach ofOyama et al. [24] for performance comparison with respect to the execution time.
Fig. 5. Representation of protein interaction by feature vectors. Each interaction is representedwith binary feature vector (whether the feature exists or not) and their associations. The FDRFsets those features as “don’t care” (D/K) which have SU value less than given SU thresholdThis is intended to consider in association mining only those features that have greater SUvalue than a given threshold. The features marked D/K are regarded as D/K also in associationrule mining (i.e., these features are not counted in the calculation of support and confidence).These features are not shown in the vector representation of right side of Figure 5.
Entity Interaction with Feature Association
An interaction is represented as a pair of two proteins that directly bind to each other.To analyze protein–protein interactions with feature association, we consider eachinteracting protein pair as a transaction of data mining. These transactions with binaryvector representation are described in Figure 5. Using association rule mining, then,we extract association of features which generalize the interactions.
4 Experimental Results
Performance of Entity Extraction
In order to test our entity recognition and interaction extraction module, we built acorpus from 1,000 randomly selected scientific abstracts from PubMed identified tocontain biological entity names and interactions through manual searches. The corpuswas manually analyzed for biological entities such as protein, gene, and small mole-cule names in addition to any interaction relationships present in each abstract withinthe corpus by biologist within our laboratory. Analysis of the corpus revealed 5,928distinct references to biological entities and a total of 3,182 distinct references tointeraction relationships. Performance evaluation was conducted over the same set of1,000 articles, by capturing the set of entities and interactions recognized by the sys-tem and comparing this output against the manually analyzed results previously de-scribed. Table 1 shows the statistics of abstract document collection for extractionperformance evaluation.

PubMiner: Machine Learning-Based Text Mining System 223
We measured the recall and the precision for both the ability to recognize entitynames in text in addition to the ability of the system to extract interactions based onthe following calculations:
where, TP (true positive) is the number of biological entities or interactions that werecorrectly identified by the system and were found in the corpus. FN (false negative) isthe number of biological entities or interactions that the system failed to recognize inthe corpus and FP (false positive) is the number of biological entities or interactionsthat were recognized by the system but were not found in the corpus. Performance testresults of the extraction module in the PubMiner are described in Table 2.
Performance of Feature Selection and Association Mining
To test the performance of inference of PubMiner through feature selection (reduc-tions), we used protein–protein interaction as a metric of entity recognition and inter-action extraction. The major protein pairs of the interactions are obtained from thesame data source of Oyama et al. [24]. It includes MIPS, YPD and Y2H by Ito et al.and Uetz et al., respectively [18]. Additionally, we use SGD [17] to collect moreabundant feature set. Table 3 shows the statistics of interaction data for each datasource and filtering with FDRF of Figure 4.
We performed feature filtering procedure of Figure 4 as a first step of our inferencemethod after the feature encoding with the way of Figure 5. Next, we per-formed association rule mining under the condition of minimal support 9 and minimalconfidence 75% on the protein interaction data which have reduced features. And withthe mined feature association, we predicted new protein–protein interaction whichhave not used in association training setp. The accuracy of prediction is measuredwhether the predicted interaction exists in the collected dataset or not. The results aremeasured with 10 cross-validation.

224 J.-H. Eom and B.-T. Zhang
Table 4 gives the advantage of obtained by filtering non-informative (redundant)features and the inference performance of PubMiner. The accuracy of interactionprediction increased about 3.4% with FDRF. And the elapsed time of FDRF basedassociation mining, 143.27 sec, include the FDRF processing time which was 19.89sec. The elapsed time decrease obtained by using FDRF is 32.5%. Thus, it is of greatimportance to reduce number of feature of interaction data for the improvement ofboth accuracy and execution time. Thus, we can guess that the information theorybased feature filtering reduced a set of misleding or redundnt features of interactiondata and this feature reduction eleminated wrong associations and boosted the over allpocessing time. And the feature association shows the promising results for infe-rencing implicit interaction of biological entities.
5 Conclusions
In this paper, we presented a biomedical text mining system, PubMiner, which screensthe interaction data from literature abstracts through natural language analysis, per-forms inferences based on machine learning and data mining techniques, and visual-izes interaction networks with appropriate links to the evidence article. To reveal morecomprehensive interaction information, we employed both the data mining approachwith optimal feature selection method in addition to the conventional natural languageprocessing techniques. The proposed method achieved the improvement of both accu-racy and processing time. From the result of Table 4, it is also suggested that withsmaller granularity of interaction (i.e., not protein, but a set of features of proteins) wecould achieve further detailed investigation of the protein–protein interaction. Thuswe can say that the proposed method is suitable for an efficient analysis of interactiveentity pair which has many features and this approach is also suitable as a back-endmodule of general literature mining.
But, current public interaction data produced by high-throughput methods (e.g.,Y2H) have many false positives. And several interactions of these false positives arecorrected by recent researches through reinvestigation with new experimental ap-proaches. Thus, study on the new method for resolving these problems related to falsepositive screening with respect to literature mining further remain as future works.
Acknowledgements. This research was supported by the Korean Ministry of Scienceand Technology under the NRL Program and the Systems Biology Program.

PubMiner: Machine Learning-Based Text Mining System 225
References
1.
2.
3.
4.5.
6.
7.
8.
9.
10.
11.
12.
13.
14.
15.
16.
17.
18.
19.
20.
21.
22.23.24.
Andrade, M.,A., and Borka, P.: automated extraction of information in molecular biology.FEBS Letters 476 (2000) 12–17Chiang, J.,H., et al.:: GIS: a biomedical text–mining system for gene information discov-ery. Bioinformatics 20(1) (2004) 120–121Blaschke, C., et al.: Automatic extraction of biological information from scientific text:protein–protein interactions. In Proc. of ISMB–1999, Heidelberg, Germany (1999) 60–67BioBiblioMetrics. http://www.bmm.icnet.uk/~stapleyb/biobib/Tanabe, L., et al.: MedMiner: an internet text-mining tool for biomedical information,with application to gene expression profiling. BioTechniques 27 (1999) 1210–1217Safran, M., et al.: Human gene-centric databases at the Weizmann institute of science:GeneCards, UDB, CroW 21 and HORDE. Nucleic Acids Res. 31(1) (2003) 142–146Andrade, M.,A., Valencia, A.,: Automatic extraction of keywords from scientific text:application to the knowledge domain of protein families. Bioinformatics 14(7) (1998)600–607Perez-Iratxeta, C., et al.: XplorMed: a tool for exploring MEDLINE abstracts. TrendsBiochem. Sci. 26 (2001) 573–575Friedman, C., et al.: GENIS: a natural-language processing system for the extraction ofmolecular pathways from journal articles. Bioinformatics 17(Suppl.1) (2001) S74–S82Daraselia, N., et al.: Extracting human protein interactions from MEDLINE using a full-sentence parser. Bioinformatics 20(5) (2004) 604–611Nédellec C., et al.: Machine learning for information extraction in genomics – state of theart and perspectives. In: Sirmakessis, S. (ed.) : Text Mining and its Applications. Studiesin Fuzzi. and Soft Comp. 138. Springer–Verlag, Berlin Heidelberg New York (2004) 99–118Humphreys, B. L., et al.: The Unified Medical Language System: an informatics researchcollaboration. J. Am. Med. Inform. Assoc. 5 (1998) 1–11Kim J.D., et al.: GENIA corpus - semantically annotated corpus for bio-textmining.Bioinformatics 19(Suppl 1) (2003) i180–182Hwang, Y.S., et al.: Weighted probabilistic sum model based on decision tree decomposi-tion for text chunking. Int. J. Comp. Proc. Orient. Lang. 16(1) (2003) 1–20Lee, K.J., et al.: Two-phase biomedical NE recognition based on SVMs. In Proc. of ACL2003 Workshop on Natural Language Processing in Biomedicine (2003) 33–40Eom, J.H., et al.: PubMiner – a machine learning-based biomedical text mining system.Technical Report (BI–TR0401), Biointelligence Lab., Seoul National University (2004)Christie, K.R., et al.: Saccharomyces Genome Database (SGD) provides tools to identifyand analyze sequences from Saccharomyces cerevisiae and related sequences from otherorganisms. Nucleic Acids Res. 32(1) (2004) D311–D314Mewes, H.W., et al.: MIPS: analysis and annotation of proteins from whole genomes.Nucleic Acids Res. 32(1) (2004) D41–D44Agrawal, R., et al.: Mining association rules between sets of items in large databases. InProc. of ACM SIGMOD–1993, Washington D.C., USA (1993) 207–216Slonim, N., and Tishby, N.: Document clustering using word clusters via the informationbottleneck method. In Proc. of SIGIR–2000, Athens, Greece (2000) 208–215Yu, L. and Liu, H.: Feature selection for high dimensional data: a fast correlation-basedfilter solution. In Proc. of ICML–2003, Washington D.C., USA (2003) 856–863Quinlan, J.: C4.5: Programs for machine learning. Morgan Kaufmann. (1993)Press, W.H., et al.: Numerical recipes in C. Cambridge University Press. (1988)Oyama, T., et al.: Extraction of knowledge on protein–protein interaction by associationrule discovery. Bioinformatics 18 (2002) 705–714

Advances in Profile Assisted VoicemailManagement
Konstantinos Koumpis
Vienna Telecommunications Research Center - ftw.Tech Gate Vienna, 1 Donau City St.
1220 Vienna, [email protected]
Abstract. Spoken audio is an important source of information avail-able to knowledge extraction and management systems. Organizationof spoken messages by priority and content can facilitate knowledgecapture and decision making based on profiles of recipients as these canbe determined by physical and social conditions. This paper revisitsthe above task and addresses a related data sparseness problem. Wepropose a methodology according to which the coverage of languagemodels used to categorize message types is augmented with previouslyunobserved lexical information derived from other corpora. Such lexicalinformation is the result of combining word classes constructed by anagglomerative clustering algorithm which follows a criterion of minimumloss in average mutual information. We subsequently generate morerobust category estimators by interpolating class-based and voicemailword-based models.
Keywords: automatic categorization, speech recognition, stochastic lan-guage models, class-based clustering, voicemail.
1 Introduction
The enormous growth of available spoken audio recordings has led to a compa-rable growth in the need for methods to assist users in managing the knowledgecontained therein [1]. Standard knowledge management approaches typically or-ganize content in portals, use text search and analysis tools, and rely heavily ontext as the medium for transferring knowledge. The ongoing migration of com-puting for information access from the desktop and telephone to mobile devicessuch as personal digital assistants (PDAs) and smart phones introduces newchallenges as these devices offer limited audio playback and display capabilities.Voicemail represents a growing volume of real-world speech data that involvesa conversational interaction between a human and a machine with no feedbackfrom the machine, and for which manual organization is a time consuming task,particularly for high-volume users. There are situations in which users wouldprefer to receive messages of certain content types and leave the remaining onesto be reviewed later at a more convenient location or time. For example, imaginea user attending a business meeting abroad requiring constant information flow
C. Bussler and D. Fensel (Eds.): AIMSA 2004, LNAI 3192, pp. 226–235, 2004.© Springer-Verlag Berlin Heidelberg 2004

Advances in Profile Assisted Voicemail Management 227
from his head office but not messages from his local recreation club. On thecontrary, the same person being on holiday would most likely be interested onlyin messages related to friends and family rather than those concerning work.
As text categorization utilities are becoming central into advanced emailtools, users are likely to wish their migration into voicemail too. Voicemail re-cipients today rely almost exclusively on caller line identity, the presentationof the caller’s telephone number or name, to filter incoming messages. A fewalternative solutions have been proposed for efficient voicemail retrieval whichinclude browsing and searching of message transcriptions via a graphical userinterface [2], generation and delivery of text summaries on mobile phone displaysusing wireless protocols [3], extraction of the identity and phone number of thecaller from voicemail messages [4], and re-ordering voicemail messages based oncriteria of urgency and business relevance [5]. A profile assisted voicemail man-agement system can instead sift through a stream of arriving messages to findthose relevant to predefined categories. Each message can be in exactly one,multiple or no category at all. Unlike search queries, user profiles are persistent,yet adaptive, and tend to reflect long term information needs.
Many standard machine learning techniques have been applied to auto-mated text categorization problems, such as decision trees, naive Bayes, neuralnetworks, k-nearest neighbour classifiers and support vector machines [6,7,8].Stochastic language models are of particular interest as input features becausethey can incorporate local dependencies and thus preserve semantics, as a resultof modelling word sequences within the framework of standard Markov basedapproximations. Character level language models have been found to be effec-tive in text classification [9] and author attribution [10] tasks. This paper dealswith a corpus containing transcriptions of spoken messages. Spoken language isdifferent from written language as it is often ungrammatical, lacks punctuationand capitalization, and its textual representation almost always contains substi-tution, deletion and insertion errors. Training stochastic language models usinga small corpus, such as voicemail, carries the risk of assigning zero probabilitiesto a large number of likely events. Because some words are similar to other wordsin their meaning and syntactic function one can expect getting better estimateswith fewer parameters by grouping words into classes.
The rest of the paper is divided into five sections. Section 2 describes thevoicemail data and the categorization protocol used, respectively. Section 3 dis-cusses the methodology employed to perform message categorization, and ex-perimental results are given in section 4. Finally, we summarize our conclusionsand discuss future work in section 5.
2 Voicemail Data
We have used the LDC Voicemail Corpus-Part I [11]. This corpus contains 1801messages (14.6 hours, averaging about 90 words per message). As a trainingset for the categorization tasks we used 1789 out of 1801 available messages(151K words) of the corpus. The reason for which 12 messages had to be ex-cluded from the training set was that they did not contain enough informationto determine their category. For evaluation purposes we used the test set of the

228 K. Koumpis
corpus comprising 42 messages (2K words) as well as the test set of the Voice-mail Corpus-Part II comprising 50 messages (4K words). Apart from the humantranscriptions (denoted SR-HT), which contained some noise in the form of rep-etitions and broken words, we also used transcriptions with a word error rate(WER) of 42.5% produced by a hybrid multi-layer perceptron / hidden Markovmodel speech recognizer (denoted SR-SPRACH) [12]. Additionally, we obtainedanother set of transcriptions with a WER of 31% (denoted SR-HTK) producedby the more complex HTK Switchboard system adapted to voicemail [13].
2.1 Voicemail Categorization Protocol
Voicemail messages are typically short, conveying the reason for the call, theinformation that the caller requires from the voicemail recipient and a returntelephone number. Herein we consider two tasks, categorization by content andby priority. The categories in both tasks are mutually exclusive and exhaustive,that is, every message belongs to one, and only one, of the categories. The datalabelling is a result of subjective analysis of the message transcriptions. The at-tributes that the message recipient will perceive along with the categorizationcriteria, are determined by individual needs. These needs change over time andwith the physical and social environment. As the data is not organized per voice-mail subscriber, we assumed a general voicemail recipient profile, which mightnot be fully compatible with the criteria of each individual voicemail recipient.Finally, during the labelling process for the categorization tasks no attempt was

Advances in Profile Assisted Voicemail Management 229
made to associate the message priority or content with the identity of speakersand thus the task does not share similarities with speaker recognition [15].
Table 1 outlines the taxonomy related to the priority- and content-based cat-egorization tasks. Given the relatively small size and the nature of the corpus, wedecided to use 3 and 6 categories, respectively because in a dense category spacethere would be only few example messages in each category. The distribution ofmessages in the training and test sets for the priority- and content-based tasksare given subsequently in Table 2.
3 Categorization Using Stochastic Language Models
We approach voicemail categorization in a Bayesian learning framework. Weassume that the message transcription was generated by a parametric model(in our current implementation this is limited to a language model), and usetraining data to calculate Bayes optimal estimates of the model parameters.Then, using these estimates we classify new test messages using Bayes rule toturn the generative model around and calculate the probability that a categorywould have generated the test message in question. Categorization then becomesthe task of selecting the most probable category. Details of the above approachare given bellow.
A language model is essentially an information source which emits a sequenceof symbols from a finite alphabet, i.e., the vocabulary. The probability of anyword sequence is given by:

230 K. Koumpis
A simple yet effective approach to approximate the above is themodel [16] according to which the occurrence probability of any test word se-quence is conditioned upon the prior occurrence of other words:
language models have the advantage of being able to cover a much largervariation than would normally be derived directly from a corpus in the form ofexplicit linguistic rules, such as a formal grammar. Open vocabularies can alsobe easily supported by language models and are used in all experimentsreported in this paper.
The task of classifying a message transcription into a categorycan be expressed as the selection of the category which has the
largest posterior probability given the message transcription:
In the above expression the language model is used to estimate the likelihoodwhilst the prior is assumed to be the same with that of the train-
ing set. For computational reasons, products of probabilities in Equation 4 arereplaced by sums of negative log probabilities. Categorizing a message involvescalculating a sum of negative logs for each category, where the length of the sumequals to the number of contained in the test message. Each term inthe sum is proportional to the frequency with which the correspondingsequence has occurred in the training data. Note that if one assumes equal priorsthe above criterion becomes equivalent to perplexity [17], a measure expressingthe average number of possible branches after a word in a sequence. Comparingthe above measure across different categories for each test message allows thehighest ranked category along with a rank value to be returned. The number ofreturned categories can be specified by the user so that the categorization re-sults may be given in the form of an n-best list for further processing. Such ‘soft’decisions allow a message to appear in more than one relevant category givinggreater flexibility during retrieval. Finally, adding new messages to a trained
model only requires the recording of word occurrence statistics for thosemessages.
3.1 Class-Based Models
Training for categorization using a small corpus carries the risk of as-signing zero probabilities to a large number of likely events not present in theavailable data. The perplexity of test word sequences containing such unseenevents will increase significantly. Based on the hypothesis that some words aresimilar to other words in their meaning and syntactic function, we can derivelikely, yet unobserved, word sequences to reduce the effects of data sparseness.Further, this approach can update the probabilities of rarely observed wordsequences. For example, if the word “speech” is completely missing from the

Advances in Profile Assisted Voicemail Management 231
Fig. 1. Overview of the methodology to augment language models with word classesfor categorizing spoken messages.
training data while the words “voice” and “spoken” are included, there is stilla good chance to be able to model it using a class which contains semanticallysimilar words to the above. An overview of the methodology followed is depictedon Figure 1. Word clustering can provide useful semantically related groups,similar to an automatically generated thesaurus. Suppose that we partition avocabulary of V words into G classes using a function which maps a word,
into its class The resulting model
produces text by first generating a string of classes and then con-verting it into words with probability for Word classescan be defined either manually or automatically. Manual definition makes useof part-of-speech tags and stem information while automatic definition clusterswords as part of an optimization method. For the purposes of this study weadopted an agglomerative clustering algorithm [18]. This algorithm performs abottom-up clustering, starting with a separate cluster for each of the G mostfrequent words and at each step merge that pair for which the loss in averagemutual information is minimum. Different words in the same class are only dis-tinguished according to their relative frequencies in the training set as a wholeand therefore large and relevant sets should be used to generate accurate wordclasses.
In order to reduce the amount of computation along with the risk of generat-ing irrelevant classes, we selected subsets of various American English transcrip-tions from the publically available Broadcast News, Switchboard and CallHomecorpora. The criterion employed was low sentence perplexity (in practice, <200)over a trigram language model trained on each of the priority and content voice-mail categories described in section 2.1. We also required that sentences usedto induce word classes contained at least ten words. The corresponding vocab-ularies for the sentences selected were divided into 1000 classes. Prior to theinterpolation with the word-based voicemail language models we retained in the

232 K. Koumpis
classes those words that occurred at least ten times in the selected data and weincluded no more than the ten most frequent words of any class.
4 Experimental Results
Categorization performance in all subsequent experiments is measured in termsof overall accuracy, which is defined as:
We examined the effects of the following factors in relation to the above best-category only performance measure:
WER quantifies the mismatches between the reference category language models andthose of the test messages due to transcription errors.
order introduces a trade-off between capturing enough context and havingpoor model estimates due to data sparsity.
smoothing replaces the original counts with modified counts so as to redistribute theprobability mass from the more commonly observed events to the less frequentand unseen events. Various smoothing techniques were compared, namely linear,absolute, Good Turing and Witten Bell [19].
The results for the priority- and content-based tasks are given in Figures 2and 3, respectively. The training set is the same, whether we test on manuallytranscribed or automatically recognized data. We expect that the performancewhen testing with automatically transcribed data can be improved by usingtraining data that is automatically generated too. We used neither a stop-list norstemming as in our previous experiments [14] they were found to hurt accuracy.The larger training data set employed (approx. 80% more messages) offered con-sistent but relatively small improvements over the baseline word-based languagemodels we had previously reported. This suggests that the stochastic languagemodels employed for the categorization tasks are not too sensitive to trainingset size variations, as far as statistics for a sufficient number of havebeen calculated.
The accuracy in priority-based categorization task was significantly higherthan the content-based one due to the smaller degree of confusability (3 vs. 6target categories). The interpolated word- and class-based models (rightcolumn figures) offered improved accuracy than the word-based mod-els (left column figures). Class-based clustering from multiple corpora allowedthe models to hypothesize out-of-vocabulary words, which often hold the mostsignificance when testing with unseen data. The average absolute improvementdue to class-based clustering in categorization accuracy was 2-5%. Despite thatthe clustering algorithm employed generates pairs of words, roughly equal gainswere observed between the bigram and trigram models since all models back-off to lower order As it had been observed in previous experiments,transcription errors had a significant impact on categorization accuracy. Mov-ing from human transcriptions to automatic transcriptions with WERs of either31.0% or 42.5% reduces the accuracy by about 20% absolute.

Advances in Profile Assisted Voicemail Management 233
Fig. 2. Accuracy (%) in the priority-based categorization task using different smooth-ing techniques. The rows of subfigures correspond to transcripts of different WERs,while the order is shown on the horizontal axis.
Fig. 3. Accuracy (%) in the content-based categorization task. The subfigure layoutfollows that of Fig. 2.

234 K. Koumpis
The differences across the four smoothing techniques were small. Amongthem, linear and Witten Bell performed slightly better on average, followed byGood Turing. It is though possible to combine different language models toimprove accuracy. Methods as simple as majority voting can be employed tohelp reduce errors that individual smoothing techniques introduce.
The slight differences across the results made apparent the limitations insystem evaluation introduced by a small test set. Although the combined test setsof Voicemail Corpora I and II demonstrated the effects of transcription errors,they were not adequate to demonstrate clear patterns related to other factors.Another issue to be investigated is how to treat messages for which the level ofagreement among annotators is low. The use of Kappa statistic [20] could helpindicate in a definitive way the correct category, if any, that a message belongs to.In future experiments we also plan to use the training set of Voicemail Corpus IIas a validation and as a test set. Finally, the parametric model we employed forvoicemail categorization was based only on textual information. It remains to beinvestigated if any prosodic features can be effectively associated with particularcategories.
5 Conclusion
Voicemail data introduces several challenges to information management sys-tems, including ambiguities related to short messages, uncertainties associatedwith speech recognizers and the need for scalability and portability in new do-mains and users. We have approached voicemail management in a Bayesianlearning framework using stochastic language models to represent individualmessages and groups of messages reflecting user profiles. Although still limitedby the challenging speech recognition environment and the lack of any deep se-mantic analysis, we have reported improvements by training on a larger dataset and by augmenting the language models with class-based models derivedautomatically from other corpora.
Acknowledgments. This work is supported by a Marie Curie fellowship.
References
1.
2.
3.
4.
Moreno, P., Thong, J.M.V., Logan, B., Jones, G.J.F.: From multimedia retrievalto knowledge management. IEEE Computer 35 (2002) 58–66Hirschberg, J., Bacchiani, M., Hindle, D., Isenhour, P., Rosenberg, A., Stark, L.,Stead, L., Whittaker, S., Zamchick, G.: SCANMail: Browsing and searching speechdata by content. In: Proc. Eurospeech, Aalborg, Denmark (2001)Koumpis, K., Ladas, C., Renals, S.: An advanced integrated architecture for wire-less voicemail retrieval. In: Proc. 15th IEEE Intl. Conf. on Information Networking,Beppu, Japan (2001) 403–410Huang, J., Zweig, G., Padmanabhan, M.: Information extraction from voicemail.In: 39th Annual Meeting of Assoc. for Computational Linguistics, Toulouse, France.(2001)

Advances in Profile Assisted Voicemail Management 235
5.
6.
7.
8.
9.
10.
11.
12.
13.
14.
15.
16.
17.
18.
19.
20.
Ringel, M., Hirschberg, J.: Automated message prioritization: Making voicemailretrieval more efficient. In: Proc. Conf. on Human Factors in Computing Systems(Ext. Abstracts), Minneapolis, MN, USA (2002) 592–593Yang, Y.: An evaluation of statistical approaches to text categorization. Journalof Information Retrieval 1 (1999) 67–88Lewis, D.D., Schapire, R.E., Callan, J.P., Papka, R.: Algorithms for linear textclassifiers. In: Proc. 19th annual Intl. ACM SIGIR Conf. on Research and Devel-opment in Information Retrieval. (1996) 298–306Sebastiani, F.: Machine learning in automated text categorization. ACM Comput-ing Surveys 34 (2002) 1–47Teahan, W.J., Harper, D.J.: Using compression based language models for text cat-egorization. In: Proc. Workshop on Language Modeling and Information Retrieval,Carnegie Mellon University, USA (2001) 83–88Peng, F., Schuurmans, D., Kaselj, V., Wang, S.: Automated authorship attributionwith character level language models. In: Proc. 10th Conf. of European Chapterof Assoc. for Computational Linguistics, Budapest, Hungary (2003) 19–24Padmanabhan, M., Eide, E., Ramabhardan, G., Ramaswany, G., Bahl, L.: Speechrecognition performance on a voicemail transcription task. In: Proc. IEEE ICASSP,Seattle, WA, USA (1998) 913–916Koumpis, K., Renals, S.: The role of prosody in a voicemail summarization system.In: Proc. ISCA Workshop on Prosody in Speech Recognition and Understanding,Red Bank, NJ, USA (2001) 87–92Cordoba, R., Woodland, P.C., Gales, M.J.F.: Improving cross task performanceusing MMI training. In: Proc. IEEE ICASSP. Volume 1., Orlando, FL, USA (2002)85–88Koumpis, K.: Automatic categorization of voicemail transcripts using stochasticlanguage models. In: Proc. 7th Int. Conf. on Text, Speech and Dialogue, Brno,Czech Republic (2004)Charlet, D.: Speaker indexing for retrieval of voicemail messages. In: Proc. IEEEICASSP. Volume 1., Orlando, FL, USA (2002) 121–124Gotoh, Y., Renals, S.: Statistical language modelling. In Renals, S., Grefenstette,G., eds.: Text and Speech Triggered Information Access. Springer-Verlag (2003)78–105Jelinek, F., Mercer, R.L., Bahl, L.R., Baker, J.K.: Perplexity - a measure of dif-ficulty of speech recognition tasks. In: Proc. 94th Meeting Acoustical Society ofAmerica, Miami Beach, Florida, USA (1977)Brown, P.F., Pietra, V.J.D., deSouza, P.V., Lai, J.C., Mercer, R.L.: Class-basedn-gram models of natural language. Computational Linguistics 18 (1992) 467–479Chen, S., Goodman, J.: An empirical study of smoothing techniques for languagemodeling. Computer Speech and Language 13 (1999) 359–394Carletta, J.: Assessing agreement on classification tasks: The kappa statistic. Com-putational Linguistics 22 (1996) 249–254

Computing Speech Acts*
Gemma Bel Enguix1,2 and M. Dolores Jimenez Lopez2
1 Department of Computer Science, University of Milan-BicoccaVia Bicocca degli Arcimboldi, 8, 20126 Milan, Italy
[email protected] Research Group on Mathematical Linguistics, Universitat Rovira i Virgili
Pl. Imperial Tarraco, 1, 43005 Tarragona, [email protected]
Abstract. Human-computer interfaces require models of dialoguestructure that capture the variability and unpredictability withindialogue. In this paper we propose to use a computing paradigm–membrane systems– in order to define such a dialogue model. Weintroduce Primary Dialogue Membrane Systems (shortly, PDMS) asa biological computing model that computes pragmatic minimal units–speech acts– for constructing dialogues. We claim that PDMS provide asimple model where the passage from the real dialogue to the membranesystem model can be achieved in a highly formalized way.
Keywords: Membrane Systems, Dialogue Modelling, Speech Acts.
1 Introduction
Membrane systems –introduced in [12]– are models of computation inspired bysome basic features of biological membranes. They can be viewed as a newparadigm in the field of natural computing based on the functioning of mem-branes inside the cell. Briefly, in a membrane system multisets of objects areplaced in the compartments defined by the membrane structure –a hierarchicalarrangement of membranes, all of them placed in a main membrane called theskin membrane– that delimits the system from its environment. Each membraneidentifies a region, the space between it and all the directly inner membranes,if any exists. Objects evolve by means of reaction rules also associated with thecompartments, and applied in a maximally parallel, nondeterministic manner.Objects can pass through membranes, membranes can change their permeability,dissolve and divide. Membrane systems can be used as generative, computingor decidability devices. This new computing model seems to have several in-trinsically interesting features such as, for example, the use of multisets andthe inherent parallelism in its evolution. For a formal definition of membranesystems we refer to [13].
* This research has been supported by a Marie Curie Fellowship of the EuropeanCommunity programme Human Potential (IHP) under contract number HPMF-CT-2002-01582 and by a Marie Curie European Reintegration Grant (ERG).
C. Bussler and D. Fensel (Eds.): AIMSA 2004, LNAI 3192, pp. 236–245, 2004.© Springer- Verlag Berlin Heidelberg 2004

Computing Speech Acts 237
Membrane systems provide a powerful framework for formalizing any kindof interaction, both among agents and among agents and the environment. Animportant idea of membrane systems is that generation is made by evolution,when the configuration of membranes undergoes some modifications, given bycertain rules. Therefore, most of evolving systems can be formalized by means ofmembrane systems. Indeed, they have been already applied to linguistics in [3]and other suggestions for specific applications have been given in [13]. In linguis-tics and natural language processing, membrane systems are specially suitablefor dealing with fields where contexts, and mainly evolving contexts, are a cen-tral part of the theory. A topic where context and interaction among agents isessential is the field of dialogue modelling and its applications to the design ofeffective and user-friendly computer dialogue systems. This paper is a attemptto compute speech acts by means of membrane systems, this is, to generate bymeans of a natural-formal device the final product of interaction in human com-munication: dialogue. Theory of speech acts was introduced by Austin [2] andSearle [15], and it is now a central theory of pragmatics and human communi-cation.
In what follows, after giving a brief summary of approaches to dialogue mod-elling in section 2, we introduce some linguistic concepts related to pragmaticsand dialogue in section 3. Then, in section 4, some new concepts in membranesystems for computing with speech acts are defined and Primary Dialogue Mem-brane Systems are introduced. Section 5 gives an example of an artificial non-formal dialogue extracted from a Shakespeare’s comedy. We close the paper withsome final remarks and references.
2 Some Approaches to Dialogue Modelling
In the last fifty years or so, analysis of conversation has formed an increasinglyimportant part of language study. Philosophy, psychology, sociology, linguistics,cognitive science, artificial intelligence, human-computer interaction and soft-ware engineering have examined conversation from a variety of perspectives.Researchers of dialogue often adopt two related –and sometimes conflicting–research goals:
1.
2.
to develop a theory of dialogue that includes a theory of cooperative task-oriented dialogue in which the participants are communicating for the ac-complishment of some goal-directed task;and to develop algorithms and procedures to support a computer’s partici-pation in a cooperative dialogue.
Different approaches to modelling dialogue have been proposed both fromtheoretical and practical perspectives. In general, we can distinguish –accordingto [10]– two different approaches in dialogue management studies:
1. Structural approach, characterized by using dialogue grammars to captureregularities of dialogue in terms of exchanges and moves and with the aimof trying to identify adjacency-pairs. (cf. [9], [14]).

238 G. Bel Enguix and M.D. Jimenez Lopez
2. Intention-plan-based approach that classifies speaker’s beliefs and intentionsinto speech acts and uses planning operators to describe them. (cf. [1]).
Both approaches regard natural language as purposeful behaviour, but theydiffer in how this behaviour is to be described. The former sees dialogues asproducts and disposes participants’ beliefs and intentions into a predefined dia-logue structure. The latter, instead, focuses on participants’ goals, and stressesrelations between acts that contain appropriately sets of beliefs and intentionsas their preconditions and effects.
The approach presented in [9] for describing processing of utterances in a dis-course can be placed within the structural approach. The framework proposedstresses the role of purpose and processing in conversation. This model distin-guishes basically three interrelated and interacting components in the structureof a discourse: 1) a linguistic structure; 2) an intentional structure; 3) and anattentional structure. Those three components of discourse structure supply allthe information needed by the speaker in order to determine how an utterancefits with the rest of the discourse.
Within the same structural approach can be placed Frohlich and Luff’s work.In [7], various aspects of ‘technology of conversation’ –as have been described inconversational analysis literature– are applied to human-computer interaction inorder to generate orderly sequences of talk.
An example of the intention-plan-based approach to conversation is the modelpresented in [1]. It is argued that much of linguistic behaviour can be explainedby assuming a plan based model of language. Language is viewed as an instanceof goal-oriented behaviour. Utterances are produced by speech acts that areexecuted in order to have some effect on the hearer, effects that typically involvemodifying the hearer’s beliefs or goals.
However, structural and intention-plan-based approaches are not the onlyperspectives from which conversation has been tackled within the fields of arti-ficial intelligence and computational linguistics. A very interesting research lineis the one that applies the theory of multi-agent systems to the study of conver-sational interchanges. In [11] conversation is defined as the result of coordinatedinteractions among agents to reach a common goal: the conversational goal. In[8] we find another example of application of distributed artificial architecturesto dialogue modelling. In that paper, CARAMEL is presented as a general ar-chitecture that intends to be applied to several different matters, among themdialogue management.
Another interesting model for conversation in the area of computational lin-guistics, hard to be placed in any of the above items of classification, is Bunt’sDynamic Interpretation Theory (DIT) [4]. DIT emerges from the study of spokenhuman-human information dialogue and aims at ‘uncovering fundamental prin-ciples in dialogue both for the purpose of understanding natural dialogue phe-nomena and for designing effective, efficients and pleasant computer dialoguesystems.’. In DIT, conversations are viewed in an action perspective. Languageis considered a tool to perform context-changing actions.
What we have said in this section evidences the importance of conversationin language study and shows somehow the susceptibility of conversation to be

Computing Speech Acts 239
tackled from very different points of view. In this paper, we propose a new way offacing the modelling of conversation: a membrane computing model. In our model,the membranes are considered to be agents with specific personal background– represented by the notion of domain – which exchange and compute “speechacts”.
3 Dialogue and Speech Acts
The most classical distinction in computational dialogues is the one establishedbetween task-oriented (TO) and non task-oriented (NTO), based on the cooper-ation of participants in the consecution of conversational goals. In task-orienteddialogues (TO): a) agents collaborate, b)there exist conversational goals, andc) opening and termination can be solved with external measure elements. Innon task-oriented dialogues (NTO): a) agents coact, but they do not necessarilycollaborate, b) There are not conversational goals or at least, if they exist, theyare private, and c) opening and termination are not defined.
Besides the above classification, [6] provides an interesting gathering whichincludes, among others, the following items: a) Personal Settings: Conversationscharacterized by the free exchange of turns among the two or more participants.b) Institutional Settings: The participants engage in speech exchanges that re-semble ordinary conversation, but are limited by institutional rules.
Taking the main features of both classifications, we think it is possible todistinguish three types of dialogues, which are shown in table 1.
1.2.3.
primary: personal non-task oriented dialogues with free turn-taking,oriented: personal task oriented dialogues with free turn-takikng, andformal: institutional task oriented dialogues with non-free tarn-taking.
We have established three types of dialogue that, obviously, need differentformalizations. In this paper we concentrate on primary dialogues. We presenta formal definition of a a computing device for computation of acts in this typeof dialogues.
Now, before going on with the introduction of the computing device, we haveto introduce the main units in the system we want to define. Basic elements wedeal with in here are speech acts. An speech act can be defined as a commu-nicative event whose final meaning is not only related to syntax but also to the

240 G. Bel Enguix and M.D. Jimenez Lopez
illocutionary strength of the speaker. Speech acts has been traditionally a cen-tral topic in pragmatics, now they have an increasing importance in the so-calleddialogue games [5], an attempt to start a formal study of pragmatic situations.Combining both theories, and adapting their main concepts to a computationaldescription, we propose to distinguish the following types of acts in human com-munication: 1) Query-yn (yes, no), 2) (what), 3) (yes), 4)
(no), 5) (what), 6) Agree, 7) Reject, 8) Prescription, 9) Ex-plain, 10) Clarify, 11) Exclamation. This list includes the most usual acts andmay be modified any moment depending on the convenience and accuracy of thetheory.
Acts are usually gathered in topics during a conversation. For starting, clos-ing, or changing a topic, some special expressions are usually used. They arestructural acts, and should be added to the the above list of sequences, obtain-ing: 12) Open, 13) Close, 14) Changetopic. Structural acts have some specialfeatures which make them different. Open is the first act, or at least the firstinstruction, in every dialogue or human interaction. However, close is not alwayspresent, in the same way that, many times, topics are not closed in conversa-tions, and new ones arise without and ending for the previous. On the otherhand, changetopic is a sequence of transition which cannot be followed by everyagent. Nevertheless, these concepts have to be adapted to the diversity of real-istic situations, which may be quite unexpected. In a dialogue, not every agenthas every type of speech act. Depending on the competence of each agent, somespeech acts can be blocked. For instance, only an agent with certain power canuse the act prescription. The distribution of speech acts among the agents willbe very important in the development of the dialogue.
4 Defining PDMS
Membrane systems were formaly described in [12], whereas an adaptation tolinguistics was introduced in [3] giving rise to Linguistic membrane systems (inshort, LMS). These theoretical formalizations are the basis for Primary DialogueMembrane System (PDMS), which are defined as follows:
Definition 1
where
is the membrane system;is the set of alphabets associated to types of speech acts;
is the initial configuration of each membrane, being:the set of acts over
D, the domain of the membrane;T is any element of
is the turn-taking set;is the set of rules of every membrane of the system, where
the order in which rules are given is also a preference for using them.

Computing Speech Acts 241
In order to understand the working of the system, we have to explain the waysome parts of the system work, especially the following aspects: a) configurationof alphabets, b) domains, c) shape of the rules, d) the turn-taking protocole) halting criteria, and f) the configuration of output.
Configuration of Alphabets. Basic elements of PDMS are speech acts. Thesespeech acts are gathered in several types, following the classification given above.Every one of these types is an ordered set of elements which can be used justone time, according to the precedence.
We define a maximal set of alphabetswhere every element is a set of speech acts, as follows:
Shape of the rules. Rules are understood as the way the membranes-agentsexchange elements and interact each other. Every rule in the system has inthe left side the indication of the turn-taking. At the right side it has, a) thegeneration in reply to the explicit invitation to talk, which can include the order
introduced in [12] for dissolving membranes, and b) the agent whom the speechact is addressed to, if it exists. The turn-taking allows applying just one rule.
Domains. In PDMS, domain of a membrane is related to the competence of anagent in a dialogue, this is, what the agent knows and can say. It is defined asthe set of speech acts that every membrane is able to utter. It can include entiresets of acts defined for the system or just single acts coming from some set.Of course, just speech acts defined in this is, existing in the possible worlddescribed by can be used.
Turn-Taking Protocol. For primary dialogues, turn-taking must be free, this is,it is not given as a sequence, but as a set of active elements, at the beginning ofthe computation. Every turn is distributed by the agent that is talking. Whensomebody asks, explains, or clarifies something, in a dialogue, he/she does itto somebody among the others. Then, we establish that the addresser in eachturn can choose next speaker. It does it by means of the turn-taking rule in-cluded at the end of each rule of the system. This is denoted by means of a
speech acts of type open.speech acts of type close.
speech acts of type query-yn.speech acts of type
speech acts of typespeech acts of type
speech acts of typespeech acts of type agree.speech acts of type reject.speech acts of type prescription.speech acts of type explain.
speech acts of type clarify.speech acts of type exclamation.

242 G. Bel Enguix and M.D. Jimenez Lopez
letter depending of the speech act uttered in such rule. We establish, then, thefollowing turn-taking symbols related to every speech act: O (open), # (close,)Q’ (Query-yn), Q (Query-w), (Answer-y), (Answer-n), A (Answer-w), G(Agree), F (Reject), P (Prescription), E (Explain), L (Clarify), X (Exclamation),H (Changetopic). We include H for changetopic among these symbols, which isnot related to any set of speech acts, because any type (except answer) can bea good reply to it. If no indication of turn is given in a rule, the turn goes toevery membrane able to reply, this is, every membrane containing a rule withthe required symbol in the left. If there are several membranes able to act, thenthe turn is indicated by the number of the membrane, which also establishes anorder of precedence in the computation, this is
Halting Criteria. We establish that the system stops if one of the followingconditions is fulfilled: i)No rule can be applied in any membrane, b) just onemembrane remains in the system, c) no more acts are available.
Configuration of the Output. For PDMS there are not output membranes. Forthe configuration of the output, we define the Generation Register (GR). Thegeneration register gives account of the changes in the configuration of the systemin every step. To look at the GR is the way to know what the final result of thesystem is.
5 Example
We offer in this section a very simple example of the functioning of PDMS. Thisis taken from the Shakespeare’s play The comedy of errors act 3 scene 2. Thenumber of agents in the dialogue are three, Luciana, related to Antipholus,which is represented in and finally Dromio, One of them, Luciana,disappears after talking, generating a new membrane. Then, the others start adialogue between them.
where:
where:Why, how now, Dromio! where runn’st thou so fast?,Do you know me, sir? am I Dromio? am I your man?,What woman’s man? and how besides thyself? besidesthyself?,What claim lays she to thee?}Thou art Dromio, thou art my man, thou art thyself,Marry, sir, besides myself, I am due to a woman; onethat claims me, one that haunts me, one that will haveme.,Marry sir.}I’ll fetch my sister, to get her good will.}

Computing Speech Acts 243
I am an ass, I am a woman’s man and besides myself.}
where:
where:
For simplifying the rule of generation of membrane we give its domain inthe initial configuration. Therefore, the system starts in the first configurationwith two membranes, and after the first step one of the is deleted and anotherone is created, as we show in figure 1.
Fig. 1. Initial configuration and first step.
After the deletion creation of membranes, the dialogue becomes an exchangebetween just two agents. Finally, the system stops because the rule to be appliedis and there is not any in the set to be introduced in the system. Figure2 shows the two last configurations of the system.
Fig. 2. Transition in the last step of the system
The output of the computation must be found in the Generation Register,whose configuration is the one showed in table 2.

244 G. Bel Enguix and M.D. Jimenez Lopez
Looking at table 3 and knowing that everything generated in belongs toLuciana, what is generated in is the speech of Antipholus and refers toDromio, we have the following outcome:
Luciana I’ll fetch my sister, to get her good will.ExitEnter DROMIO of SyracuseAntipholus Why, how now, Dromio! where runn’st thou so fast?Dromio Do you know me, sir? am I Dromio? am I your man? am I myself?Antipholus Thou art Dromio, thou art my man, thou art thyself.Dromio I am an ass, I am a woman’s man and besides myself.Antipholus What woman’s man? and how besides thyself? besides thyself?Dromio Marry, sir, besides myself, I am due to a woman; one that claims me,one that haunts me, one that will have me.Antipholus What claim lays she to thee?Dromio Marry sir.
where represents the exit of a character and the creation of a membrane meansthe rule enter.
6 Final Remarks
In this paper we have introduced some elements for a formal modeling of humancommunication in the framework of pragmatics using membrane systems. Basicissues related to a membrane system approach to conversation have been devel-oped in order to test the suitability of the model. Nevertheless, since this is justan initial approximation to the possibility of describing conversation by meansof membrane systems, many important aspects remain to be approached. Any-way we think that to apply membrane systems to linguistic topics has severaladvantages, among which we stress the flexibility of the model. In this sense, wepoint out that, depending on the consideration of the membranes and domains(agents, societies, languages), several branches of linguistics can be broached.

Computing Speech Acts 245
Considering membranes as agents, and domains as a personal backgroundand linguistic competence, the application to dialogue is almost natural, andsimple from the formal point of view. Many variations can be introduced to thebasic model presented in this paper in order to account for different featuresof conversation, and this can be a good research area for the future. Perhapsmembrane systems can help to formalize different types of dialogue, introducingsmall variants in the configuration of rules, alphabets, domains or relationshipbetween membranes.
Finally, although the model is defined for formally describing human com-munication, we think that it can be applied to the generation of conversationsin the framework of human-computer or computer-computer interface.
References
1.
2.
3.
4.
5.6.7.
8.
9.
10.
11.
12.
13.14.
15.
Allen, J.F., Perrault, C.R.: Analyzing Intention in Utterances. Artificial Intelli-gence 15 (1980) 143-178.Austin, J.L.: How to Do Things With Words. Oxford University Press, New York(1962).Bel Enguix, G.: Preliminaries about Some Possible Applications of P Systemsin Linguistics. In: Rozenberg, G., Salomaa, A., Zandron, C. (eds.):Membrane Computing. LNCS 2597. Springer, Berlin (2003).Bunt, H.C.: DIT-Dynamic Interpretation in Text and Dialogue. ITK Research Re-port, no. 15. Tilburg University, The Netherlands (1990).Carlson, L.: Dialogue games. Reidel, Dordretch (1983).Clark, H.H.: Using Language. Cambridge University Press, Cambridge (1996).Frohlich, D., Luff, P.: Applying the Technology of Conversation to the Technol-ogy for Conversation. In: Luff, P., Gilbert, N., Frohlich, D. (eds.): Computers andConversation. Academic Press, London (1990) 187-220.Grau, B., Sabah, G.,Vilnat, A.: Control in Man-Machine Dialogue. Think 3 (1994)32-55.Grosz, B. J., Sidner, C.L.: Attention, Intentions and the Structure of Discourse. In:Nagao, M.: Language and Artificial Intelligence. Elsevier Science Publishers B.V.,North-Holland (1987) 3-32.Jokinen, K.: Goal Formulation Based on Communicative Principles. In: COL-ING ’96. Proceedings of the 16th International Conference on Computational Lin-guistics. Vol 2. Copenhagen (1996) 598-603.Moulin, B., Rousseau, D., Lapalme, G.: A Multi-Agent Approach for ModellingConversations. In: AI’94. Natural Language Processing. Proceedings of the Four-theenth International Avignon Conference. Vol. 3. Paris (1994) 35-50.
Computing with Membranes. Journal of Computer and System Sciences61 (2000) 108-143.
Membrane Computing. An Introduction. Springer, Berlin (2002).Reichman, R.: Getting Computers to Talk Like You and Me. Discourse Context,Focus, and Semantics (An ATN Model). MIT Press, Cambridge (1985).Searle, J.: Speech Acts: An Essay in the Philosophy of Language. Cambridge Uni-versity Press, Cambridge (1969).

High Performance Part-of-Speech Tagging ofBulgarian
Veselka Doychinova and Stoyan Mihov
Institute for Parallel ProcessingBulgarian Academy of Sciences
Abstract. This paper presents an accurate and highly efficient rule-based part-of-speech tagger for Bulgarian. All four stages – tokenization,dictionary application, unknown words guessing and contextual part-of-speech disambiguation – are implemented as a pipeline of a coupledeterministic finite state bimachines and transducers. We present a de-scription of the Bulgarian ambiguity classes and a detailed evaluationand error analysis of our tagger. The overall precision of the tagger isover 98.4% for full disambiguation and the processing speed is over 34Kwords/sec on a personal computer. The same methodology has beenapplied for English as well. The presented realization conforms to thespecific demands of the semantic web.1
1 Introduction
Part-of-speech tagging has important applications to many areas of computa-tional linguistics including syntax analysis, corpus linguistics, grammar checking,text-to-speech generation etc. The part-of-speech tagger is an essential resourcefor many semantic web applications like information extraction and knowledgeacquisition. Recent efforts for providing a semantic-based multilingual infras-tructure of the world wide web require new formal models and methods forlanguage engineering. For the specific needs of the semantic web, in addition tothe preciseness, a part-of-speech tagger has to provide the following features:
High performance – crucial in respect to the vast amount of informationpresented on the web;XML and Unicode compliance;Technology applicable to other languages.
Our solution addresses all of the above mentioned problems.For English and some other languages there are various accurate part-of-
speech taggers based on different methodologies [3–5,15]. Steven Abney gives asurvey on the main methods in [1]. Most of the known approaches do not providehigh performance.
1 This work was funded by a grant from VolkswagenStiftung.
C. Bussler and D. Fensel (Eds.): AIMSA 2004, LNAI 3192, pp. 246–255, 2004.
© Springer-Verlag Berlin Heidelberg 2004

High Performance Part-of-Speech Tagging of Bulgarian 247
Emmanuel Roche and Yves Schabes introduce in [11] a deterministic tag-ger which has significantly better performance than the other systems [2,4,5].The authors compose the contextual rules from the Brill tagger into a sequen-tial transducer. Tokenizer, dictionary and guesser are implemented using othertechniques. We extend this approach by:
providing an uniform technique for the representation and utilization of thetokenizer, dictionary, guesser and the contextual rules;application of bimachines for supporting rewriting rules with no restrictionson the length of the left and right context;support of lexical and morphological constraints in the contextual rules;processing the text without modifying it – by inserting XML tags in theoriginal.
Reports for Bulgarian part-of-speech taggers are given by Hristo Tanev andRuslan Mitkov in [14] and by Kiril Simov and Petya Osenova in [13]. The de-velopment of the first tagger was performed without relying on a large taggedcorpus. The reported resulting precision of it is 95% for 95% recall. For the de-velopment of the second tagger a corpus consisting of 2500 sentences was used.The achieved precision is 95.17%.
Our part-of-speech tagger is developed using a large manually tagged corpuskindly provided by Svetla Koeva from the Institute for Bulgarian Language.The corpus consists of 197K tokens (over 150K words) randomly extracted froman 1M words Bulgarian corpus, structured along the standards of the BrownUniversity corpus. This is a running text of edited Bulgarian prose divided into500 samples of over 2000 words each, representing a wide range of styles andvarieties of prose.
In our research initially we tried to train the Brill tagger [2] for Bulgarian. Weused a 160K tokens tagged corpus for training. The results were disappointing– although the tagger performed very well on the training corpus – 98,7%, ona unseen 40K tokens corpus it performed poorly – 95,5%. We suppose that thereason for the low accuracy on Bulgarian texts is a consequence of the inflectionalnature of the Bulgarian morphology leading to a large amount of wordforms andthe free word order in the Bulgarian sentence.
We present a rule-based approach [3,15] leading to 98.4% precision imple-mented by finite state devices [8,11,12]. The first step to solving the ambiguityis tokenizing the text. For the second step we use a 75K base forms grammati-cal dictionary [9], which assigns to each known word its most-probable tag andthe set of all possible tags (its ambiguity class). If a word is not in the dictio-nary, a guesser is consulted in the third step. Finally, 148 manually constructedcontextual rules are applied on the text to handle the ambiguities.
We present the ambiguity classes and the tagset in the next section. After-wards we proceed with the tokenizer, lexicon and guesser description. Section 4describes the contextual rules. The evaluation results are presented in Section 5.Implementation details are given in Section 6. Finally the conclusion presentssome general comments and directions for further work.

248 V. Doychinova and S. Mihov
2 Restricted Tagset and Ambiguity Classes
The problem of correct part-of-speech tagging is a consequence of the implicitambiguity of the words in respect of their morphology, syntactic function andmeaning. For example, in the sentence:
the word could be tagged as fivedifferent forms: a plural adjective, a plural noun, a present singular verb, a pastsingular verb and an imperative verb. And whereas in this case the solution isquite straightforward, for the correct tagging of the verbs andin the sentence
a more complex analysis is required.It is hard to use all 946 different morphological tags from the dictionary in
our rule-based method. Moreover, some distinctions in the given text cannot bedetermined reliably without full syntactic and semantic analysis. For examplethe dative and accusative cases of pronouns in short form are hardly distinguish-able. Hence, the tagset should be quite restricted but it should still provide thedeserved functionality. In our tagset only morphological characteristics, whichare considered essential for part-of-speech tagging are taken into account. Forexample, past singular verbs have the same tag, although only second and thirdperson forms are ambiguous. All forms, which differ in number are divided. Verbsare also classified according to whether they are in present or past tense. Pro-nouns are grouped according to gender and short forms. The final tagset has 40tags given in Table 1.

High Performance Part-of-Speech Tagging of Bulgarian 249
In respect of the tagset the words in our dictionary are divided into 259ambiguity classes. 47 of them consist of more than 100 words. As shown onTable 2 the largest class consists of present and past verbs, followed by theone of masculine and countable nouns. The first column presents the number ofentries in the class and the second one shows the occurrence frequency on 1000words derived from a 20M words untagged corpus. Statistics on the right showshow many times words from the class have appeared with a corresponding tagin our manually tagged representative corpus.
3 Tokenizer, Dictionary, and Guesser
3.1 Tokenizer
We built a sophisticated tokenizer, which marks and categorizes tokens as nu-meral expressions, dates, hours, abbreviations, URLs, items, punctuation, words,abbreviations etc. Words in Latin and Cyrillic are differently marked when cap-italized or upper case. Punctuation is classified according to the type and thefunction of the sign. Sentence boundaries are recognized as well.
The tokenizer is implemented as a composition of 53 contextual rewritingrules. Some of the rules require that the length of the right context is unlimited.All tokenization rules are composed into 4 bimachines.

250 V. Doychinova and S. Mihov
3.2 Dictionary
The dictionary assigns to each dictionary word in the text its ambiguity class andits initial tag. Usually the initial tag is the most probable tag for the ambiguityclass. For example, the class which consist of adverbs and neutral adjectives getsadverb as a most probable tag, because in the corpus these words are adverbs2122 times and adjectives 1011 times. There are exceptions from this principlein some cases. For example in the class singular present tense verb / singularpast tense verb, the perfective verbs are initially tagged as past verbs and theimperfective and dual aspect verbs are tagged as present verbs, because usuallythe perfective verbs are used in present tense with or and in this way thereis a more reliable context information to transform the past verb tag to present.In the sentences:
and arepast verbs.
and are presentverbs.
The dictionary contains about 1M wordforms. Since each wordform can occurin lower case, upper case or capitalized, the dictionary contains 3M strings.It is implemented as one (big) rewriting rule and represented by a sequentialtransducer using the construction method presented in [10].
The overall dictionary performance is given in Table 3.
3.3 Guesser
The words that are not in the dictionary are handled by the guesser. The con-structed rules are analysing the suffix for guessing the word’s morphology andfor assigning the initial part-of-speech tag and the ambiguity class. For example,the word which was found in a computer text is an english wordwith a Bulgarian suffix for plural third person verb. Hence, it will be correctlytagged by the guesser. Words with the suffix receive a tag for ambiguityclass, which allows them to be tagged as a masculine singular adjective, a pluralnoun or a singular passive participle. For some words there is only one option.Such are the words with suffix and others.

High Performance Part-of-Speech Tagging of Bulgarian 251
The capitalized words in the middle of the sentence, which in most cases areunknown proper names are tagged as singular nouns. The same applies to Latintext.
After the guesser is applied to the text the precision reaches 93.28%. Thetotal number of the words in our 100K tokens corpus that have not been foundin the dictionary is 3447. For all of them the guesser has suggested its initialtag, which is wrong in only 4.72% of the cases treated by the guesser. Table 4presents the exact numbers.
The guesser is implemented as a composition of 73 rewrite rules all compiledinto a single bimachine.
4 Contextual Disambiguation Rules
The part-of-speech ambiguity ratio for our corpus is 1.51 tags/word, which meansthat in average every second word is ambiguous. For solving the ambiguities weapply 148 contextual rules, which can utilize part-of-speech, lexical or dictionaryinformation on the context. Below some exemplary rules are given:
change ADV to Amfs if next word is Nmfschange Np to VRs if previous 1 or 2 word ischange Nmfs to VPs if word is perfective verb and previous word is"ce/MISC"
A rule is applied if and only if the context is fulfilled and the ambiguity classof the targeted word allows the new tag.
Experiments have shown that the rule order significantly influences the re-sults. Because of that the rules are applied in a certain order to handle specificambiguities. For example the rules that change a noun into past verb precedethe rules that change a past verb into present verb.
All 148 contextual rules are composed into 2 bimachines which we apply ina pipeline.

252 V. Doychinova and S. Mihov
5 Evaluation Results and Error Analysis
5.1 Preciseness Results
After all the rules are applied to the training corpus the overall accuracy reached98.44%. Totally 5610 tags were changed by the context rules. For the unseen testcorpus the result is slightly worse - the accuracy is 98.29% and the context ruleschanged 5297 tags. Table 5 presents the details.
At that point a few new rules were developed to handle specific cases thatwere found mainly in the test corpus. We have got a slight increase of the pre-ciseness after applying the additional rules:
5.2 Error Analysis
After the application of the tagger on both corpora 2900 words received a wrongtag. 2117 of them were not changed by the contextual rules and 783 cases handledby the context rules were not tagged correctly. From the 783 cases 452 times thetagger changed a correct initial tag given by the dictionary or guesser and 331times both – initial and context rules tags were wrong.
The largest group of wrong tags is adverb / neutral adjective. Most of thoseerrors were made because in many cases the syntactic context of both adverbsand adjectives is similar. For example when the following word is a neutral nounwe have no reliable context for distinguishing the two cases.
The same applies to dual aspect verbs. Our statistics showed that in mostcases the dual aspect verbs are in present so the dictionary initially gives them

High Performance Part-of-Speech Tagging of Bulgarian 253
the relevant tag. Certainly, some cases were incorrectly tagged using this statis-tic approach.
The ambiguity, which remains in the singular adjective / singular noun classis difficult in the case of proper nouns. Our context rules cannot completelysolve this ambiguity at that point. For solving it a thorough semantic analysisis necessary.
Short forms of pronouns are known to be very movable in the Bulgariansentence. Generally, they are likely to be personal pronouns in contiguity witha verb and possessive pronouns in contiguity with a noun. But there are manydifficult cases where the short form is between a noun and a verb.
Most errors were made in cases where semantic analysis is required for dis-ambiguation.
The main ambiguity classes, which are wrongly tagged are given in Table 6.
The 10 classes in Table 6 represent 43.10% of all errors. The rest of thewrongly tagged words are distributed into 110 ambiguity classes.
6 Implementation Details
As already mentioned the whole tagger is implemented as a composition of 275rewriting rules. For the construction of the rules we used the methods presented

254 V. Doychinova and S. Mihov
in [8,7,6]. The rules are then composed and represented by bimachines by thetechniques presented in [12]. For the construction of the sequential transducerfor the rewriting dictionary rule we developed a new method presented in [10]. Inthis way the tagger consists of 7 bimachines and 1 sequential transducer appliedin a pipeline.
The text is transduced by each of the finite state devices deterministically.After each step the text is enriched with additional information which is usedby the following steps. At the end only part-of-speech tags are left. The taggeris capable of processing of Unicode and the markup is down by inserting XMLtags without modifying the input text.
The size of the tagger is 82002KB including all data and the executable. Wemeasured the processing speed on a Pentium III 1GHz computer running Linux.The performance is measured for the whole process of tagging, including the diskoperations needed for reading in and writing out the text file. The performanceis 34723 words/sec.
The processing speed is proportional to the number of devices in the pipeline.Theoretically we could compose all the rules into one single bimachine. In thatcase we would have about 8 times faster processing. The problem is that the sizeof this device would be unacceptable for the current technology. Nevertheless wecould trade off speed for size if needed. For example by representing our taggerby 208 bimachines the size is 21123KB by a processing speed of 1550 words/sec.
The same technique was tested by realizing an English tagger. We constructedthe bimachine pipeline by composing the rules from the Brill system [2] trainedon the Penn Treebank Tagged Wall Street Journal Corpus. In addition to thetechnique presented in [11] we implemented the extended version of Brill’s sys-tem, which is supplemented by a guesser and the contextual rules are able tomake use of lexical relationships. All 148 guesser rules were composed into 3bimachines. The 70K words dictionary was implemented as a sequential trans-ducer. The 288 contextual rules were composed into 13 bimachines. The sizeof our implementation is 56340KB. As expected our system delivered identicalresult compared to the result of Brill’s system and performed with a processingspeed of 16223 words/sec.
7 Conclusion
We presented a Bulgarian part-of-speech tagger with 98.4% precision. The anal-ysis of the ambiguity classes showed that the problem of part-of-speech disam-biguation for Bulgarian is as complex as the one for English, but the ambiguitiesare consequences of other language phenomena. We showed that the cases wherethe tagger assigns a wrong tag require a more complex syntactic or semanticanalysis. Hence, further improvement of the tagger preciseness would requiremuch more efforts.
The methodology presented in the paper provides a very efficient, languageindependent implementation of all stages of the process. We successfully appliedthe same technique with the rules of the Brill tagger for English.

High Performance Part-of-Speech Tagging of Bulgarian 255
Further we plan to exploit the presented methodology for other languages andother applications like information extraction, grammar checking and prosodyand phonetic description generation.
Acknowledgments: We are grateful to Svetla Koeva for the valuable discus-sions during the beginning of our research.
References1.
2.
3.
4.
5.
6.
7.
8.
9.
10.
11.
12.
13.
14.
15.
Steven P. Abney, Part-of-Speech Tagging and Partial Parsing, In Ken Church andSteve Young and Gerrit Bloothooft, editor, Corpus-Based Methods in Languageand Speech Kluwer Academic Publishers, Dordrecht, 1996.Eric Brill, Some advances in rule-based part of speech tagging, Proceedings of theTwelfth National Conference on Artificial Intelligence (AAAI-94), Seattle, Wa.,1994.Jean-Pierre Chanod, Pasi Tapanainen, Tagging French - comparing a statisticaland a constraint-based method, Proceedings of Seventh Conference of the Euro-pean Chapter of the Association for Computational Linguistics, 1995.Kenneth Church, A stochastic parts program and noun phrase parser for unre-stricted texts, Proceedings of the Second Conference on Applied Natural LanguageProcessing, Austin, Texas, 1988.Doug Cutting, Julian Kupiec, Jan Pedersen, and Penelope Sibun, A practical part-of-speech tagger, Proceedings of Third Conference on Applied Natural LanguageProcessing (ANLP-92), pages 133–140, 1992.Hristo Ganchev, Stoyan Mihov and Klaus U. Schulz, One-Letter Automata: Howto Reduce k Tapes to One. CIS-Bericht, Centrum für Informations- und Sprachver-arbeitung, Universität Munchen, 2003.Dale Gerdemann and Gertjan van Noord, Transducers from Rewrite Rules withBackreferences, Proceedings of EACL 99, Bergen Norway, 1999.Ronald Kaplan and Martin Kay, Regular Models of Phonological Rule Systems,Computational Linguistics 20(3), 331-378, 1994Svetla Koeva, Grammar Dictionary of the Bulgarian Language Description of theprinciples of organization of the linguistic data, Bulgarian language magazine, book6, 1998.Stoyan Mihov and Klaus U. Schulz, Efficient Dictionary-Based Text Rewrit-ing using Sequential Transducers, CIS-Bericht, Centrum für Informations- undSprachverarbeitung, Universität Munchen, 2004. To appear.Emmanuel Roche, Yves Schabes, Deterministic Part-of-Speech Tagging withFinite-State Transducers, Computational Linguistics, Volume 21, Number 2, June1995.Emmanuel Roche and Yves Schabes, Introduction, Finite-State language process-ing, E Roche, Y Schabes (Eds), MIT Press, 1997.Kiril Simov, Petya Osenova, A Hybrid System for MorphoSyntactic Disambigua-tion in Bulgarian, Proceedings of the RANLP 2001 Conference, Tzigov Chark,Bulgaria, 5-7 September 2001.Hristo Tanev; Ruslan Mitkov, Shallow Language Processing Architecture for Bul-garian, Proceedings of COLING 2002: The 17th International Conference on Com-putational Linguistics, 2002.Atro Voutilainen, A syntax-based part-of-speech analyser , Proceedings of Sev-enth Conference of the European Chapter of the Association for ComputationalLinguistics, 1995.

The Definite Article of Bulgarian Adjectives andNumerals in DATR
Velislava Stoykova
Institute of the Bulgarian Language, Bulgarian Academy of Sciences,52, Shipchensky proh. str., bl. 17, 1113 Sofia, Bulgaria
Abstract. The paper describes the inflectional feature of definiteness inBulgarian language. It takes into account the specific morphosyntacticproperties of the adjectives and the numerals, and argues for a relatedcomputational approach of interpretation. The DATR language for lexi-cal knowledge presentation is accepted as a framework for constructinga model of Bulgarian adjectives and numerals inflectional morphology.The particular type hierarchies are defined, and the basic architecture ofthe model is explained in terms of its linguistic motivation.
1 Introduction
The most interesting grammar feature of standard Bulgarian language in whichit differs with all Slavic languages is the feature of definiteness. Taken togetherwith the fact that Bulgarian language does not use cases to express syntacticstructures, it requires a specific sequence of tasks to be resolved for naturallanguage processing applications.
It is important to note that the definite article in Bulgarian is an endingmorpheme [7]. This fact gives a priority to morphological interpretations insteadof syntactic ones. At the level of syntax, the definite article shows the subject(when it is not a proper name) since Bulgarian language uses a relatively freeword order.
So, giving a detailed formal morphological interpretation of the definite arti-cle is an essential preliminary condition for part-of-speech parsing of Bulgarian.
2 The Semantics of Definiteness in Bulgarian
According to the traditional academic descriptive grammar works [7], the se-mantics of definiteness in standard Bulgarian language is expressed in threeways: lexical, morphological, and syntactic.
The lexical way of expressing definiteness is closely connected with the lexicalsemantics of a particular lexeme, so that, it would not be of semantic value for ourformal interpretation. It is because of the fact that most of the formal grammarinterpretations are supposed to deal with one-sense lexeme, which is the simplestpossible type of lexeme.
C. Bussler and D. Fensel (Eds.): AIMSA 2004, LNAI 3192, pp. 256–266, 2004.© Springer-Verlag Berlin Heidelberg 2004

The Definite Article of Bulgarian Adjectives 257
At the syntactic level, the definiteness in Bulgarian could express varioustypes of semantic relationships like a case (to show subject), part-of-whole, deixisetc. Some authors tend to analyse this feature as a way to compensate for thelack of case declensions.
It is important to note that instead of the very many existing descriptivegrammar works devoted to the problem, the semantics of definiteness in Bulgar-ian seems still not a sufficiently well studied phenomenon.
2.1 The Formal Morphological Markers of the Definite Article
As it has been pointed, the syntactic function of definiteness in Bulgarian isexpressed by a formal morphological marker which is an ending morpheme [7].It is different for the genders, however, for the masculine gender two types ofdefinite morphemes exist – to determine a defined in a different way entities,which have two phonetic variants, respectively.
For the feminine and for the neuter gender only one definite morpheme exists,respectively. For the plural two definite morphemes are used depending on theending vocal of the main plural form.
The following part-of-speech in Bulgarian take a definite article: nouns, adjec-tives, numerals (both cardinals and ordinals), possessive pronouns, and reflexive-possessive pronoun.
The definite morphemes are the same for all part-of-speech, however, in thefurther description we are going to analyze the inflectional morphology simplyfor the adjectives and the numerals.
3 Some Preliminaries for Possible Formal Interpretation
As it has been pointed, the very complicated semantics of the feature of definite-ness in Bulgarian requires a related specific formal approach of interpretation.In fact, it should consists of two embedded in one system stages.
The first one is a formal interpretation of the inflectional morphology, andthe second should give a syntactic interpretation of the first. The first stagerequires to apply standard computational morphology approaches like a rule-based concatenation of morphemes and construction of relevant rules for theircombinations, whereas the second requires an effective syntactic processing ofvarious generated inflecting forms.
Obviously, such a semantically complicated model could hardely be foundamong the existing formal models like HPSG, for example, especially designedmostly for syntactic processing and normally producing only one type of inflect-ing forms.
We considered the DATR language for lexical knowledge presentation as asuitable formal framework for modeling the inflectional morphology of Bulgariandefinite article.

258 V. Stoykova
4 The DATR Language
The DATR language is a non-monotonic language for defining the inheritancenetworks through path/value equations [6]. It has both an explicit declarativesemantics and an explicit theory of inference allowing efficient implementation,and at the same time, it has the necessary expressive power to encode the lexicalentries presupposed by the work in the unification grammar tradition [3,4,5].
In DATR information is organized as a network of nodes, where a node isa collection of related information. Each node has associated with it a set ofequations that define partial functions from paths to values where paths andvalues are both sequences of atoms. Atoms in paths are sometimes referred toas attributes.
DATR is functional, it defines a mapping which assigns unique values tonode attribute-path pair, and the recovery of this values is deterministic. It canaccount for such language phenomena like regularity, irregularity, and subregu-larity, and allows the use of deterministic parsing.
The DATR language has a lot of implementations, however, our applicationwas made by using QDATR 2.0 (consult URL http://www.cogs.susx.ac.uk/lab/nlp/datr/datrnode49.html for a related file bul_det.dtr). This PRO-LOG encoding uses Sussex DATR notation [10].
DATR allows construction of various types of language models (languagetheories), however, our model is presented as a rule-based formal grammar anda lexical database. The particular query to be evaluated is a related inflectingword form, and the implementation allows to process words in Cyrillic alphabet.
5 The Principles of DATR Encoding of BulgarianAdjectives Inflectional Morphology
We are not intended to follow any particular morphological theory, however, ourDATR analysis is linguistically motivated.
In particular, we define morphemes to be of semantic value and considerthem as a realisation of a specific morphosyntactic phenomenon (as the definitemorphemes are a morphosyntactic realization of the feature of definiteness).
We are encoding words following the traditional notion of the lexeme, andwe accept the different phonetic alternations to be of semantic value.
The approach we use is related and indebted to those of Cahill and Gazdar[1,2] used to account for German adjectives inflectional morphology, however,we do not apply their account of morphotactics.
Our model represents an inheritance network consisting of various nodeswhich allows us to account for all related inflecting forms within the frameworkof one grammar theory.
5.1 The Inheritance Hierarchy of the Adjectives
Bulgarian adjectives have four grammar feature: gender, number, definiteness,and comparison of degree (only for those of quality) [8]. According to theirsemantics, Bulgarian adjectives are divided into two types: relative and of quality.

The Definite Article of Bulgarian Adjectives 259
All grammar features of adjectives are inflectional and they depend uponagreement on the noun the adjective modifies. So, all of them should be ac-counted for in our morphological interpretation.
It is interesting to note that the above inflectional features of the adjectivesexpress an internal dependency. Thus, adjectives have three different inflectionalforms to account for the feature of gender which, at the same time, are equallymarked for the number as singular.
That means if we generate all gender inflecting forms, we will automaticallygenerate singular form. Which shows the priority of the feature of gender over thefeature of number, and suggests that the feature of gender has a wider semanticscope than that of the number.
Another interesting fact is that the rule for forming different gender wordforms and the rule for forming plural form are similar. Normally, all these formsare generated by attachment of a particular inflecting morpheme to the baseform of the adjective.
Such similarity in structure suggests that the rules generating gender in-flecting forms and the rule generating plural form would be organaised in onecommon node of the semantic network.
Also, an interesting relationship of dependency could be viewed between themorphemes expressing the feature of comparison of degree (which are prefixmorphemes) and the morphemes for the feature of gender and number. Thatrelationship shows a priority of the feature of gender.
So, in our interpretation we accept the feature of gender as a specific triggerto change the values of number, comparison of degree, and definiteness wordforms.
Following these preliminary assumptions, we generate first the gender in-flectional forms, than the plural form, the defined inflectional form, and thecompared inflectional form.
We are going to use the notation accepted in Stoykova [9] for the encodingsof the discussed above grammar features. Particularly for the feature of thedefinite article, we accept the identical node DET defined also in Stoykova [9].The Bulgarian adjectives type hierarchy is given in Figure 1.
Our DATR analysis of adjectives starts with the node DET which definesinflecting morphemes for the definite article as follows:1
DET:<sing undef> ==<sing def_2 masc> == _ja<sing def_2 masc_1> == _a<sing def_1 masc> == _jat<sing def_1 masc_1> == _ut<sing def_1 femn> == _ta<sing def_1 neut> == _to
1 Here and elsewhere in the description we use Latin alphabet to present morphemesinstead of Cyrillic used normally. Because of the mismatching between both some ofthe typically Bulgarian phonological alternations are assigned by two letters, whereasin Cyrillic alphabet they are marked by one.

260 V. Stoykova
Fig. 1. The adjectives type hierarchy.
<plur undef> ==<plur def_1> == _te.
Node AdjG is a basic node in our DATR account of the adjectives. It definesgrammar rules for generating all inflectional word forms for the feature of gender,number, and definiteness. It is constructed according to the discussed abovepreliminaries.
AdjG:<sing undef masc> == “<root>”<sing undef femn> == “<root gend>” _a<sing undef neut> == “<root gend>” _o<sing def_2 masc> == “<plur undef masc>” DET<sing def_1 masc> == “<plur undef masc>” DET<sing def_1> == “<sing undef>” DET<plur undef> == “<root gend>” _i<plur def_1> == “<plur undef>” DET.
Node Adj inherits all grammar rules of node AdjG but it employs also thegrammar rules for generating the word forms for the feature of comparison ofdegree. It is constructed according to the analysed above assumptions about thesequence of the process of the generation of inflecting forms, and defines theadjectives of quality.

The Definite Article of Bulgarian Adjectives 261
Adj:<> == AdjG<compar> == po_ “<>”<superl> == naj_ “<>”.
Node Adj_1 inherits the grammar rules of node Adj but changes the rules forgenerating singular forms for feminine and for neuter gender to use the palatalgender morphemes.
Adj_1:<> == Adj<sing undef femn> == “<root gend>” _ja<sing undef neut> == “<root gend>” _jo.
Node Adj_2 defines the inflectional morphology of those adjectives whichrealise two types of phonetic alternation during the process of inflection. At thisnode an additional word inflectional base form <root plur> is used to accountfor the specific phonetic alternations of the base form in forming plural.
Adj_2:<> == Adj<plur undef> == “<root plur>” _i.
Node Adj_3 defines the inflection of a type of adjectives which are of commongender. They take only a feminine gender value, which in fact is optional, andare considered as a gender-neutral but have all other grammar features of theadjectives.
Adj_3:<> == Adj_1<sing undef masc> == “<sing undef femn>”<sing undef neut> == “<sing undef femn>”<sing def_2 masc> == “<sing def_1 femn>”<sing def_1 masc> == “<sing def_1 femn>”<sing def_1 neut> == “<sing def_1 femn>”.
Node Adj_4 inherits all grammar rules of node Adj. The new employed gram-mar rule changes the inflectional morpheme for neuter gender into -e.
Adj_4:<> == Adj<sing undef neut> == “<root gend>” _e.

262 V. Stoykova
6 The Principles of DATR Encoding of BulgarianNumerals Inflectional Morphology
For our interpretation of definiteness of the numerals we are going to followlinguistic motivation. The underlying semantic principles of the encodings aresimilar to those described for the adjectives. An additional principle we are goingto follow is the use of word-formation morphemes as a condition to define thenumerals type hierarchy.
6.1 The Inheritance Hierarchy of the Numerals
All grammar features that the numerals in Bulgarian express are connected withtheir specific semantics, which share both the features of the nouns and those ofthe adjectives.
The semantics of the numerals express either a quantity or a sequence. Con-cerning their grammar features, the numerals are similar to the adjectives be-cause they use the agreement. At the same time, if they are used independently,they are similar in their grammar feature to the nouns.
With respect to their semantics, the numerals are divided into two types:cardinals and ordinals. With respect to their word formation they are dividedinto simple and compound.
This duality in the semantics of the numerals is going to be the importantpoint in our encoding. The Bulgarian numerals type hierarchy is given in Fig-ure 2.
Fig. 2. The numerals type hierarchy.
We start our encoding of the numerals with assigning the definite morphemes,and we employ the node DET as it is defined for the adjectives.

The Definite Article of Bulgarian Adjectives 263
DET:<sing undef> ==<sing def_2 masc> == _ja<sing def_2 masc_1> == _a<sing def_1 masc> == _jat<sing def_1 masc_1> == _ut<sing def_1 femn> == _ta<sing def_1 neut> == _to<plur undef> ==<plur def_1> == _te.
The definition of the node NumCard1 is given to be exactly the same asthose employed for the interpretation of the nouns in Stoykova [9]. NumCard1describes the cardinal numerals which use the inflectional rules of the nouns.
NumCard1:<> == Noun.
Node NumCard2 describes the cardinal numerals, which end in -a, -ta, anduse word formation suffixes -ma, -mina, -ina, -tina, -ka.
NumCard2:<sing undef> == “<root>”<sing def_1> == “<root>” DET: <sing def_1 femn>.
Node NumCard3 defines the cardinal numerals, which end in -e, -i, -o, anduse word formation suffixes -nki, -ki.
NumCard3:<sing undef> == “<root>”<sing def_1> == “<root>” DET: <plur def_1>.
Node NumCard4 describes the inflectional morphology of ‘one’, and is definedas follows:
NumCard4:<> == Num0rdi<sing def_1 masc> == “<root>” _i DET<sing def_2 masc> == “<root>” _i DET.
Node NumCard5 describes the inflectional morphology of ‘two’.

264 V. Stoykova
NumCard5:<sing undef masc> == “<root>”<sing undef femn> == “<root gend>” _e<sing undef neut> == “<sing undef femn>”<sing def_1 masc> == <sing undef masc> DET: <sing def_1 femn><sing def_1 femn> == <sing undef femn> DET: <plur def_1><sing def_1 neut> == “<sing def_1 femn>”.
Node NumOrdi defines the ordinal numerals to inherit all grammar featuresof the adjectives.
NumOrdi:<> == AdjG.
7 Evaluating Different Inflecting Forms
The proposed encoding gives a detailed morphological account of the feature ofdefiniteness of all possible inflectional types of Bulgarian adjectives and numer-als. According to the defined grammar rules, it is possible to generate all theinflecting forms.
The lexemes, themselves, are defined as different nodes, and are attached torelated word inflectional ones inheriting in this way the particular inflectionalgrammar rules. The lexical information is given by the paths <root>, <rootgend>, and <root plur> so, to account for the different types of roots phoneticalternations. The above distribution of the lexical knowledge is given because ourmodel does not account for the morphotactics. Such account of morphotacticsis rather difficult to be done for Bulgarian because of the fact that the syllableis not identical to the morpheme.
The example lexemes for the Bulgarian words for ‘smooth’ (gladuk) and‘seven’ (sedem) are evaluated for their inflecting forms in the Appendix.
8 Conclusions
The proposed DATR-theories of the inflectional morphology of Bulgarian adjec-tives and numerals use traditional linguistic notions for encoding the feature ofdefiniteness. Further, it would be possible to extend the application to accountfor the syntactic interpretations of definiteness.
References
1.
2.
Cahill L. and Gazdar G. 1997. The inflectional phonology of German adjectives,determiners and pronouns. Linguistics, 35(2):211–245.Cahill L. and Gazdar G. 1999. The Polylex architecture: multilingual lexicons forrelated languages. Traitment automatique des langues, 40.

The Definite Article of Bulgarian Adjectives 265
3.
4.
5.
6.
7.8.
9.
10.
Evans R. and Gazdar G. 1989a. Inference in DATR. Fourth Conference of theEuropean Chapter of the Association for Computational Linguistics, 66–71.Evans R. and Gazdar G. 1989b. The semantics of DATR. In Anthony G. Cohn,ed. Proceedings of the Seventh Conference of the Society for the Study of ArtificialIntelligence and Simulation of Behaviour, London: Pitman/Morgan Kaufmann,79–87.Evans R. and Gazdar G. 1990. The DATR papers. CSRP 139, Research Report,vol. 1, University of Sussex, Brighton.Evans R. and Gazdar G. 1996. DATR: A language for lexical knowledge represen-tation. Computational Linguistics, 22(2):167–216.Gramatika na suvremennia bulgarski knizoven ezik. 1983. Morphologia, tom. 2.Stojanov S. 1963. Emploi et signification de l’article defini dans la langue Bulgarelitteraire moderne. II partie - Les adjectifs, les numeraux, les pronoms et les par-ticipes. Annuaire de l’Universite de Sofia, Faculte philologique, LVII(1):625–712.Stoykova V. 2002. Bulgarian noun – definite article in DATR. In Donia Scott, ed.Artificial Intelligence: Methodology, Systems, and Applications. Lecture Notes inArtificial Intelligence 2443, Springer-Verlag, 152–161.The DATR Web Pages at Sussex. 1997. http://www.cogs.susx.ac.uk/lab/nlp/datr/
Appendix
Gladuk: <> == Adj<root> == gladuk<root plur> == gladk.
Gladuk: <sing undef masc> == gladuk.Gladuk: <sing undef femn> == gladka.Gladuk: <sing undef neut> == gladko.Gladuk: <plur undef> == gladki.Gladuk: <compar sing undef masc> == po-gladuk.Gladuk: <compar sing undef femn> == po-gladka.Gladuk: <compar sing undef neut> == po-gladko.Gladuk: <compar plur undef> == po-gladki.Gladuk: <superl sing undef masc> == naj-gladuk.Gladuk: <superl sing undef femn> == naj-gladka.Gladuk: <superl sing undef neut> == naj-gladko.Gladuk: <superl plur undef> == naj-gladki.Gladuk: <sing def_1 masc> == gladkijat.Gladuk: <sing def_2 masc> == gladkija.Gladuk: <sing def_1 femn> == gladkata.Gladuk: <sing def_1 neut> == gladkoto.Gladuk: <plur def_1> == gladkite.Gladuk: <compar sing def_1 masc> == po-gladkijat.Gladuk: <compar sing def_2 masc> == po-gladkija.Gladuk: <compar sing def_1 femn> == po-gladkata.Gladuk: <compar sing def_1 neut> == po-gladkoto.Gladuk: <compar plur def_1> == po-gladkite.

266 V. Stoykova
Gladuk: <superl sing def_1 masc> == naj-gladkijat.Gladuk: <superl sing def_2 masc> == naj-gladkija.Gladuk: <superl sing def_1 femn> == naj-gladkata.Gladuk: <superl sing def_1 neut> == naj-gladkoto.Gladuk: <superl plur def_1> == naj-gladkite.
Sedem: <> == NumCard3<root> == sedem.
Sedem: <sing undef> == sedem.Sedem: <sing def_1> == sedemte.

Towards a Better Understanding of the LanguageContent in the Semantic Web
Pavlin Dobrev1, Albena Strupchanska2, and Galia Angelova2
1 ProSyst Bulgaria Ltd., 48 Vladaiska Str., Sofia, Bulgaria, [email protected] Bulgarian Academy of Sciences, Institute for Parallel Information Processing,
25A Acad. G. Bonchev Str., 1113 Sofia, Bulgaria, {albena, galia}@lml.bas.bg
Abstract. Internet content today is about 80% text-based. No matter static ordynamic, the information is encoded and presented as multilingual, unstructurednatural language text pages. As the Semantic Web aims at turning Internet intoa machine-understandable resource, it becomes important to consider thenatural language content and to assess the feasibility and the innovation of thesemantic-based approaches related to unstructured texts. This paper reportsabout work in progress, an experiment in semantic based annotation andexplores scenarios for application of Semantic Web techniques to the textualpages in Internet.
1 Introduction and State of the Art
The ultimate aim of the Semantic Web is to make the web resources more meaningfulto computers by augmenting the presentation markup with semantic markup, i.e.meta-data annotations that describe the content. It is widely expected that theinnovation will be provided by agents and applications dealing with ontologyacquisition, merging and alignment, annotation of www-pages towards the underlyingontologies as well as intelligent, semantic-based text search and intuitivevisualisation. However, the current progress in all these directions is not veryencouraging despite the number of running activities. Isolated results and tools areavailable for e.g. automatic and semi-automatic annotation of web pages, forknowledge-based information retrieval, for ontology learning and so on but it is stilldifficult to grasp a coherent picture of how the Semantic Web will drastically changethe information age by offering quite new kinds of services. Another discouragingobstacle is that the ontologies in the Semantic Web are not clearly seen at the horizon.Due to these reasons, it makes sense to develop and evaluate experimental settingswhich might provide on-hand experience with semantic based systems and show thedesired benefits as well as the potential gaps in the current research efforts.
A summary of the relevant state of the art should sketch the status in several coreSemantic Web directions. One of them is ontology availability, development andevolution which is considered as the first challenge for the Semantic Web [1].Isolated ontologies are available in a number of fields and initiatives like the
C. Bussler and D. Fensel (Eds.): AIMSA 2004, LNAI 3192, pp. 267–276, 2004.© Springer-Verlag Berlin Heidelberg 2004

268 P. Dobrev, A. Strupchanska, and G. Angelova
„standard upper ontology“ aim at the design and building of certain acceptabledomain-independent ontologies intended to be reused and extended for particulardomain. There is a number of public taxonomies (even very large, in the medicaldomain for instance) but the most elaborated semantically-based resources like CyCor LinkBase® are not publicly accessible. In fact, the availability of underlyingontologies is an issue at the core of the Semantic Web enterprise. Many tools forbuilding ontologies and reusing existing ones have been developed. Environmentslike Protégé [2] or Chimaera [3] offer sophisticated support for ontology engineeringand merging. Protégé is an integrated software tool used by system developers anddomain experts to develop knowledge-based systems. It offers an editing environmentwith several third party plug-ins. Protégé allows to export the created ontology in anumber of formats and has also a flexible plug-in structure that provides modularextension of the functionalities. OntoEdit [4] is another sophisticated ontology editorthat supports methodology-based ontology construction and that takes comprehensiveadvantage of Ontobroker inference capabilities.
Because of the numerous isolated conceptual resources, ontology mapping is alsoa hot area of research. Today matching between ontologies and schema is still largelydone manually in a labor-intensive and error-prone process. As a consequence,semantic integration issues have now become a serious bottleneck in a wide variety ofapplications. The high costs of overcoming this bottleneck have triggered numerousresearch activities on how to describe mappings, manipulate them, and generate themsemi-automatically but unfortunately there has been little cross-fertilization betweenthe results. There are, most generally, two approaches to ontology mappings: based onheuristics that identify structural and naming similarities between models [5] andusing machine learning techniques in order to learn mappings betweenmodels/ontologies [6]. In both cases, the systems require feedback from the users torefine the proposed mappings. US activities in ontology alignment and merging [7]face the fact that different domain-dependent ontologies are organized along differentprinciples for acquisition of concepts and their natural language labels; choosing 42sample terms from EIA Glossary of Energy terms, it turned out that only 22 of themmatched one or more SIMS domain model terms fully or partially, and no singlealgorithm for automatic label alignment was found [8].
Another important issue is the (automatic or semi-automatic) annotation ofpages in the Semantic Web. Annotation is considered as one of the most effort-consuming tasks that has to be performed by especially developed tools. Recentannotation tools support manual and non ambiguous pages annotation according topredefined typology of events, locations, names, and non ambiguous domain terms(see for instance [9]). Selecting manually text fragments as concept labels is not veryefficient, moreover different annotators may tend to build the semantic indices in theirown way and will need precisely formulated standardization rules how to anchorpieces of terms to the ontological concepts. Please note that many technical terms aremade up of multiple words (e.g. delta doped resonant tunneling diodes) and the onlyway to accurately distinguish them is the analysis of qualified noun phrases ratherthan individual words, which is problematic for automatic recognition and processingby language technologies and even for human beings. So at present it remains unclearhow the different annotation practices could be standardized to produce pagesannotated in a similar manner.

Towards a Better Understanding of the Language Content in the Semantic Web 269
Another open question is how many semantic anchors are appropriate perpage: should all possible semantic indices be inserted (even against differentontologies) or only the domain-specific concepts should be anchored to one chosenontology? . The realistic scenarios are well-defined domain-specific tasks in compactareas - e.g SPIRIT [10] uses a multilingual ontology for mapping geographicalconcepts and target only annotation of named entities and geographic objects.
At last, the present language technologies still did not prove their feasibility forautomatic collection of the necessary Semantic Web data; as a result, the majority ofrunning projects in the field still rely on manually-acquired demonstration ontologiesin narrow domains. There is still no evidence that knowledge-intensive informationretrieval provides much better results [11]. To conclude, in our view the developmentof the Semantic Web is at certain initial phase of data collection, elaboration of designscenarios, development of prototypical applications that may become success stories,and their evaluation and market assessment.
Concerning the visualisation in Semantic Web, Kimani et al. [12] classifiesexisting approaches, where our approach would be sorted as generated rendering withdirect manipulation interaction style. Our experimental tool provides visualisation andnavigation support. Magpie [13] shows an approach for semantic-based assistance inuser’s web page navigation. It is a framework supporting the interpretation of webpages that is integrated in the standard web browser. The user chooses particulardomain ontology from which ontology-based lexicon is automatically extracted. Thenthe ontology dependent entities in the web pages are annotated automatically usingthe ontology-based lexicon approach. The user chooses the classes of entities to behighlighted in the web page s/he browses. By right-clicking on a highlighted entity acontext dependent menu is shown. The choices in the menu depend on the class of theselected entity within the selected ontology. Magpie services act as an auxiliaryknowledge resource, which is at the disposal of users.
In this paper we report about on-going research work addressing the text of thewww-pages in the future Semantic Web. We discuss in Section 2 existing semanticstructures and annotation according to them, which is called indexing in theinformation science. In fact, while indexing, the present terminological collections -domain nomenclatures, classifications, and ontologies - are applied as semanticbackbones in (multilingual) text archives. To know more about automatic annotationis of crucial importance for the appearance of the next generation technologies, sincetheir proper semantic resources are not available yet with the necessary volume,content and format and it still remains an open question when and how they will arise.In Section 3 we present an experiment in manual semantic annotation of real www-pages against a financial ontology in English that is considered as a semanticbackbone when building the semantic index. The experiment allowed us to get an ideaabout the potential difficulties in the annotation process, which include on-the-flyresolution of several kinds of ambiguities like manual choice of the anchored phrasesfrom the natural language pages, choice of ontology node and so on. Theseambiguities are embedded elements of the Semantic Web due to the fact that thecomplexity of the whole enterprise implies multiple choices in many tasks and therewill be no (most probably there cannot be) standard solutions for all users. We presentas well an experimental visualisation tool, which we develop at present to assist thesemantic-based search of annotated web pages. The tool is implemented at concept

270 P. Dobrev, A. Strupchanska, and G. Angelova
demonstration level and allows for browsing of semantically-related pages from theperspective of a single underlying ontology. Section 4 discusses applications that maybenefit from the availability of semantic-based search and its visualisation. Section 5contains the conclusion.
2 Annotation of Pages and Conceptual Resources
As we said, the task of linking a free text fragment (a word or a phrase) to a term fromcertain terminological collection is well known in the computational linguistics andthe information science. This is the so-called indexing. The most successful indexingapplications deal with the medical domain where indexing according to medicalclassifications is systematically performed in practical settings by software tools andthousands of health professionals who at least have to edit the indexed text. Theannotation traditions and standards for specialised texts (patient records) areestablished since decades, moreover some very large terminological collections areespecially designed to spin the indexing process – for instance SNOMED, whichamong others helps calculating the price of the medical treatments. The moreadvanced the system is, the more automatic the indexing procedures are, providinghigh precision of terms recognition. The world leader in indexing software is thecompany Language and Computing (Belgium) which develops the medical ontologyLinkBase® and indexing software against different medical classifications [14].Annotation with 100% precision is impossible [15]; however, the benefit is that thesame document becomes accessible via the synonyms of the annotated terms [14]. Sowe believe that the annotation task as defined in the Semantic Web could use theindexing experience gathered in medical informatics. There should be domain-dependent conventions how to recognise the ontology terms in the free text to beindexed; please note that the concept and relation labels can be verbalised in a freetext in a variety of ways. Another lesson learnt from the medical indexing, which weapply in our current experiment, is to annotate in the text all occurrences of allontology labels, which we are able to recognise (or the software we develop is able torecognise). However, annotation is not elementary from semantic point of view, evenagainst medical terms that are relatively well-defined collections. Let us illustratesome key semantic problems, which are not frequently discussed.
Consider Figure 1 and the free text uploaded in the leftmost scrolling window. Itcontains the two subsequent words investment portfolio. In the ontology uploaded inthe second scrolling window, there are two separate concepts with labelsINVESTMENT and PORTFOLIO (they are not visible in Figure 1). Only domainexpert who reads and interprets correctly the text will be able to decide how to definethe semantic indices from the phrase investment portfolio to the concepts investmentand portfolio. As natural language is rather vague and the individual reader interpretsthe meaning, another domain expert could link the phrase and the two conceptsdifferently. In other words, even the manual annotation is a task to be performed withcertain (small) percentage of disagreement by highly specialised automaticannotation. Due to this reason, running projects in this field target automaticannotation of some kind of entities only, e.g. named entities.

Towards a Better Understanding of the Language Content in the Semantic Web 271
Fig. 1. Visualisation of semantically annotated text and its semantic indices
Regarding automation of annotation in the Semantic Web, a lot of (even commercial)annotation tools have been developed to support manual annotation in the relevantcontext. Annotea [16] allows annotations in RDF and provides mechanism forpublishing annotations on the web. It uses XPointer for locating the annotations in theannotated document and a bookmark schema, which describes the bookmark andtopic metadata. Other annotation tools include an ontology browser for theexploration of the ontology and instances and a HTML browser that will display theannotated parts of the text. OntoMat-Annotizer [17] allows the annotator to highlightrelevant parts of the web page and create new instances via drag‘n’drop interactions. Itsupports the user with the task of creating and maintaining ontology-basedDAML+OIL markups. OntoMat is based on the S-CREAM framework [18], whichcomprises inference services, crawler, document management system, ontologyguidance and document viewers. OntMat supports semi-automatic annotation of webpages based on the information extraction component Amilcare [19]. It provides aplug-in interface for extensions. Another annotation tool that integrates Amilcare isMnM [20]. It can handle multiple ontologies at the same time. MnM makes it possibleto access ontology servers through APIs, such as OKBC, and also to access ontologiesspecified in a markup format, such as RDF and DAML+OIL. The extraction ofknowledge structures from web pages is through the use of simple user-definedknowledge extraction patterns.

272 P. Dobrev, A. Strupchanska, and G. Angelova
Regarding the available conceptual resources, the overview of existing publicconstructions displays primarily the multiple perspectives to classification of realityobjects, relations and their attributes and features. The reader may consider as anexample three taxonomies in computer science: (i) the ACM taxonomy of keywords,designed by the IEEE Computer Society [21], (ii) a taxonomy in Computer GraphicsInterfaces, developed within a NSF-funded project as a searchable database index fora large part of the ASEC Digital Library [22] and (iii) the SeSDL Taxonomy ofEducational Technology, which gives links to the British Educational Thesaurus BET[23]. These three hierarchies are built for different purposes and a careful study oftheir concepts shows that less of 5% of the nodes are common. As a rule, even forthese “intersecting” concepts the classification into subconcepts is different. Similarvariety exists concerning the emerging ontologies.
We considered in depth the public financial “branch” of the MILO ontology [24]which contains all concepts mentioned at least three times in the Brown corpus andadditionally, is relatively easy for people to understand and practical forcomputational use. MILO is integrated under SUMO [25] and its financial part covers246 basic entities (terms). In Teknowledge’s ontologies, terms belong to one of fivebasic types: class, relation, function, attribute, or individual. Terms are the vocabularyof the ontology and MILO adopted some naming conventions to differentiate types ofterms at sight, which were useful in the annotation process. We mapped MILO to afinancial ontology we developed earlier for educational purposes in the LARFLASTproject [26]. Three quarters of the terms coincide, however the design decisions aredifferent. For instance, in MILO dividend is a relation while for us it is a concept. Itlooks difficult even for knowledge engineers to formulate precise rules how to alignthe meaning of concepts to relations. Mapping of such ontologies will requirecomplex semantic resources, which define better the meanings, and in-depthinference. Most probably, as it happens today with the indexing software, it will beimpossible to achieve 100% correctness of mappings and alignment.
3 The Experiment
We annotated manually the text of 132 real www-pages using the LARFLASTontology that has 280 concepts and relations. While selecting the pages we noticedthe following. There are millions of Web pages with financial information in Internetbut the majority of them refer to few ontology terms only. This is due to the well-known fact that in general, text meaning IS NOT verbalisation of domain knowledge.The pages we found (via Google and searching for keywords) discuss for instancebanking and stock exchange information, deals, company descriptions; thousands(newspaper) articles concern financial matters in general and therefore, words likestock and bond appear here and there in the texts. On the other hand, the ontology is acompact formal encoding of domain knowledge. Only textbooks, manuals, surveyscontain very frequently the ontology terms as - by default- these kinds of texts aredescriptions of domain knowledge. In other words, the annotation of the static webcontent at present would face the serious problem that the stories presented in webpages refer to many domain ontologies by addressing only few concepts from several

Towards a Better Understanding of the Language Content in the Semantic Web 273
ontologies. For instance, a document discussing stocks and bonds for investments incomputer and aircraft industry could concern three domain ontologies. In this way thedecision of how to annotate (against which ontology) is rather difficult and werestricted our experiment to strictly specialised texts that belong to the financialdomain although these kinds of texts are relatively rare in Internet.
We implemented the ViSem tool supporting the visualisation of semantic indicesand providing some kinds of semantic-based text search. ViSem works over anarchive of html-pages annotated according to an ontology encoded inDAML+OIL/OWL-format. Figure 1 shows the tool interface in “Visualisation” mode.Texts are loaded by the button “Load text” and appear in the leftmost text window.The ontology is open by the “Load ontology” button, in the second scrolling window.After loading a www-page and its ontology, ViSem analyses the semantic index anddisplays the list in the rightmost side of its main window: in the order of appearance,the text phrases from the leftmost window which are semantically anchored to termsfrom the chosen ontology (please note the list can be empty). In “Visualisation” mode,after selecting an item from the list in column 3, ViSem shows (colours) in theleftmost text all words and phrases linked to the highlighted term. The same colour isused for colouring the ontology label too. Originally our idea was to link the text andontology term by a line, as we believe the visualisation by straight line will be the bestintuitive illustration. However, supporting a second presentation layer over the textlayer would require too much implementation efforts worth to be invested in a biggerproject only. Please note that the visualisation of links by colouring is the most oftenapproach at present and almost all annotation tools work in this way.
ViSem is implemented in Java using Swing graphical library. In ViSem we reuseideas and code from our tool CGWorld which supports the graphical acquisition ofconceptual graphs in Internet [27]. Ontology processing is built on top of Jena’s API.Jena is a Java framework for building Semantic Web applications. It provides aprogrammatic environment for RDF, RDFS and OWL [28].
4 Application Scenarios
If the Semantic Web makes the web resources more meaningful to computers, thenwhat is the benefit for human users, given the fact that humans develop ontologiesand annotate (millions of) web-pages? In the context of our small experiment we tryto answer this questions by exploring different application scenarios where thesemantically indexed archive and its ontology improve the information services.
The first useful application is the semantic-based text search. It is illustrated inFigure 2. The user selects a concept from the ontology and clicks the button Showsemantically close pages. Then the most relevant page, which is semantically linkedto the highlighted concept, is loaded in the leftmost window. Belonging to the samedomain and annotated against the same ontology, this page obligatory contains manyterms from the ontology. Please note that in this case, the present information retrievaltechniques will not distinguish between the pages shown in Figure 1 and Figure 2.They are 100% similar, as they practically contain the same words, and ranking themin a list would depend on the algorithms of the searching engine. So the only way of

274 P. Dobrev, A. Strupchanska, and G. Angelova
finer ranking is to have semantic-based indices as they are suggested today in theSemantc Web.
The second application scenario we envisage is support of comprehension whilereading www-pages which could be useful for domain novices or for foreigners whoread a page in unknown language and do not grasp the meaning of all specific terms.ViSem supports at the moment the following services: (i) after highlighting a phrasein the left-most window, via the right button menu, the user can view properties andattributes, relations, and multiple inheritance. This may help understanding themeaning of the semantically-anchored phrase (in a earlier project, which investigatedknowledge-based machine-aided translation, we integrated for similar purposes amodule for natural language generation to provide more readable explanations fornon-professionals [29]).
Fig. 2. The most relevant corpus page, which is semantically linked to bond
Another useful application of semantically-indexed archives of www-pages is theemerging “educational Semantic Web”. Current eLearning systems need increasedabilities in quality, quantity, and interaction and the Semantic Web agents (i.e.content, that is aware of itself) will play crucial role in the next generation learningmanagement systems which take content from various sources and aggregate it. In ourprevious project [26] we implemented personalised information retrieval as the

Towards a Better Understanding of the Language Content in the Semantic Web 275
system was offering to the learner dynamically retrieved readings, which are “mostrelevant” to the concept he/she does not know well or know wrongly. Unfortunately,information retrieval by keywords does not work well for educational purposes as itdoes not recognise the text genre and the majority of the “relevant” pages containmuch technical data (e.g. banking information) which is not a good teaching source.Semantic indexing, however, works via the ontology thus proposing content tostudents who need it. In this way the Semantic Web can be used as a technology forrealising sophisticated eLearning scenarios for all actors involved in the learningprocess, including teachers in collaborative courseware generating system.
5 Conclusion
In this paper we report about on-going experiment designed after a careful study ofthe recent developments in the Semantic Web. As our focus is on the text of theInternet pages, we explore scenarios for annotation and semantic-based search withcompact ontologies. It seems the annotation as such will be problematic, as theindexing is problematic even in the well-defined domains. It also looks likely that inthe foreseeable future, we will have numerous non-coherent ontologies, as they existtoday in the domain of medicine, developed by different organisations and in differentnatural languages, with manual alignment defined by explicit correspondences. Onthe other hand we believe that the semantic-based text processing is feasible at least innarrower, well-defined domains. So we plan to continue our experiment by annotatingfinancial pages against MILO as well and exploring the semantic search with severalontologies.
References
[1]
[2][3]
[4]
[5]
[6]
[7]
[8]
Benjamins R., and Jesús Contreras, The six challenges for the Semantic Web. Whitepaper 2002, http://www.isoco.com/isococom/whitepapers/files/SemanticWeb-whitepaper-137.pdfPROTEGE, http://protege.stanford.edu/McGuinness D., Fikes R., Rice J., and S. Wilder. An environment for merging and testinglarge ontologies. In Proceedings of KR 2000, pp. 483–493. Morgan Kaufmann, 2000.Sure Y., Angele J.and S. Staab OntoEdit: Guiding Ontology Development byMethodology and Inferencing. In Proc. of the International Conference on Ontologies,Databases and Applications of SEmantics ODBASE 2002Noy N, and Musen M. PROMPT:Algorithm and Tool for Automated Ont. Merging andAlignment. In Proc. Of the 17th National Conference on Artificial Intelligence (AAAI-2000),Austin, TX, 450-455.Doan A, Madhavan J. Domingos P., and Halevy A. Learing to Map between Ontologieson the Semantic Web. In Proc. 11th Int. World Wide Web Conf. (WWW2002)The Energy Data Collection (EDC) project: deep focus on hydra-headed metadata.www. digitalgovernment.org/news/stories/2002/images/metadatafinal.pdfHovy E., and J. Clavans. Comparison of Manual and Automatic Inter-OntologyAlignment, 2002, http://altamira.isi.edu/alignment

276 P. Dobrev, A. Strupchanska, and G. Angelova
[10]
[11]
[12]
[13]
[14]
[15]
[16][17][18]
[19]
[20]
[21][22][23][24]
[25]
[26]
[27]
[28][29]
[9] Vargas-Vera M., Motta E., Domingue J., Shum S. B. and M. Lanzoni. KnowledgeExtraction by using an Ontology-based Annotation Tool. Proc. 1st Int. Conf. onKnowledge Capture, (K-CAP’01), Workshop on Knowledge Markup & SemanticAnnotation, Victoria, B.C., Canada, 2001SPIRIT, Spatially-Aware Information Retrieval on the Internet, IST FP5 project inSemantic Web, http://www.geo-spirit.org/Sparck-Jones, Karen, “What is the Role of NLP in Text Retrieval?,” in TomekStrzalkowski (ed.), Natural Language Information Retrieval, Kluwer, 1999, pp. 1-24.Kimani St., Catarci T., and I. Cruz. Web Rendering Systems: Techniques, ClassificationCriteria and Challenges. In Vizualizing the Semantic Web Geroimenko, V.Chen Ch.(Eds.), Berlin: Springer 2002, pp. 63 – 89.John Domingue, Martin Dzbor, Enrico Motta: Semantic Layering with Magpie.Handbook on Ontologies 2004, pp.533-554TeSSI®: Get more out of your unstructured medical documents. Language & Computing,White paper April 2004, see www.landc.beNatural Language Processing in Medical Coding. Language & Computing, White PaperApril 2004, www.landc.behttp://www.w3.org/2001/Annotea/http://sourceforge.net/projects/ontomatHandschuh, S., Staab, S. and F. Ciravegna, ,,S-CREAM - Semi-Automatic Creation ofMetadata,“ Semantic Authoring, Annotation and Markup Workshop, 15th EuropeanConference on Artificial Intelligence, (ECAI’02), Lyon, France, 2002, pp. 27-33.Ciravegna F., Dingli A., Petrelli D. and Yorick Wilks: “Document Annotation viaAdaptive Information Extraction” Poster at the 25th Annual International ACM SIGIRConference on Research and Development in Information Retrieval August 11-15, 2002,in Tampere, FinlandVargas-Vera M., Motta E., Domingue J., Lanzoni M., Stutt A. and Fabio Ciravegna.MnM: Ontology Driven Semi-Automatic and Automatic Support for Semantic Markup”,In Proc. of the 13th International Conference on Knowledge Engineering andManagement (EKAW 2002), ed Gomez-Perez, A., Springer Verlag, 2002.ACM Computing Classification System, www.computer.org/mc/keywords/keywords.htmCGI Taxonomy, http://www.siggraph.org/education/curriculum/projects/Taxonomy2001.htmSeSDL Taxonomy, www.sesdl.scotcit.ac.uk/taxonomy/ed_tech.htmlNichols D. and A. Terry. User’s Guide to Teknowledge Ontologies. Teknowledge Corp.,December 2003, ontology.teknowledge.com/Ontology_User_Guide.docPease A., Niles I., and J. Li, 2002. The Suggested Upper Merged Ontology: A LargeOntology for the Semantic Web and its Applications. In Working Notes of the AAAI-2002 Workshop on Ontologies and the Semantic Web, Edmonton, Canada, July 28-August 1, 2002. http://projects.teknowledge.com/AAAI-2002/Pease.psAngelova G., Boytcheva S., Kalaydjiev O., Trausan-Matu S., Nakov P. and AlbenaStrupchanska. Adaptivity in Web-Based CALL, In Proc. ECAI-2002, July 2002, Lyon,France, pp. 445-449. (see the LARFLAST ontology at http://www.larflast.bas.bg)Dobrev P. and K. Toutanova, CGWorld - Architecture and Features, In Proc. of the 10thInternational Conference on Conceptual Structures: Integration and Interfaces, pp. 261 –270; http://www.larflast.bas.bg:8080/CGWorldJENA, http://jena.sourceforge.netProjects DB-MAT and DBR-MAT, 1992-1998 : knowledge-based machine aidedtranslation, see http://nats-www.informatik.uni-hamburg.de/~dbrmat andhttp://www.lml.bas.bg/projects/dbr-mat.

A Study on Neural Networks and Fuzzy InferenceSystems for Transient Data
Fevzullah Temurtas
Sakarya University, Department of Computer Engineering, Adapazari, Turkey
Abstract. In this study, a Neural Network (NN) structure with tapped timedelays and Mamdani’s fuzzy inference system (FIS) are used for theconcentration estimation of the Acetone and Chloroform gases inside the sensorresponse time by using the transient sensor response. The Coated QuartzCrystal Microbalance (QCM) type sensor is used as gas sensors. The estimationresults of Mamdani’s FIS are very closer to estimation results of ANN for thetransient sensor response. Acceptable good performances are obtained for bothsystems and the appropriateness of the NN and FIS for the gas concentrationdetermination inside the sensor response time is observed.
1 Introduction
The volatile organic vapours in ambient air are known to be reactive photo-chemically, and can have harmful effects upon long-term exposure at moderate levels.These type organic compounds are widely used as a solvent in a large number of thechemical industry and in the printing plants [1,2].
Two of the applied concentration estimation methods are using of neural networks(NNs) and fuzzy inference systems (FISs) [2-7]. Usually, the steady state responses ofthe sensors are used for concentration estimations of the gases in the estimation usingNNs and FISs [2-7]. Steady state response means no signals varying in time. But, forrealizing the determination of the concentrations before the response times anddecreasing the estimation time, the transient responses of the sensors must be used.Transient response means varying signals in time. The response values change veryfast at the beginning of the measurement in the transient responses of the sensors.That is, slope is bigger at the beginning and decrease with time. So, a NN structurewith tapped time delays [2,4] and Mamdan’s [8] FIS using the response and slope ofresponse is used for realizing the estimation of Acetone and Chloroform gasconcentrations before the response times and decreasing the estimation time. TheQCM type sensor, which shows good performance regardless of the ambienttemperature- humidity variations as well as the concentration changes was used as gassensors. The performance and the suitability of the proposed method are discussedbased on the experimental results.
C. Bussler and D. Fensel (Eds.): AIMSA 2004, LNAI 3192, pp. 277–284, 2004.© Springer-Verlag Berlin Heidelberg 2004
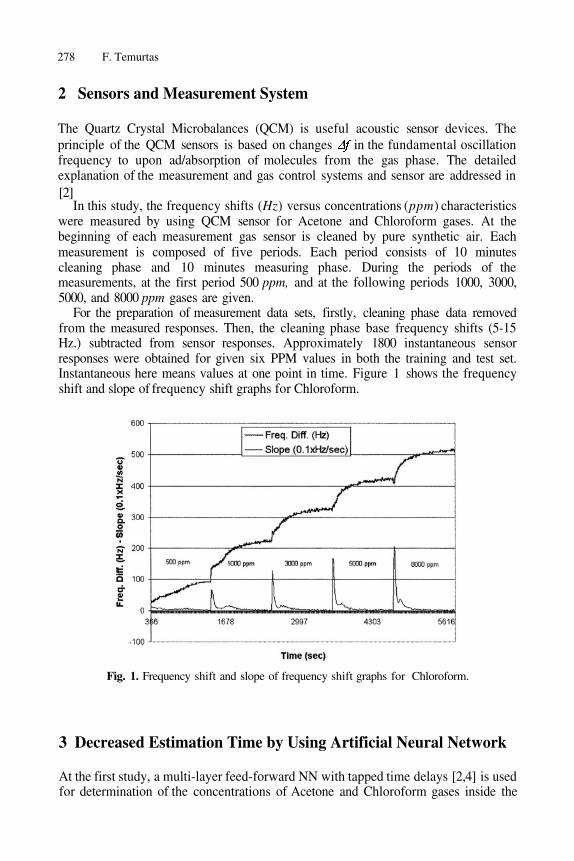
278 F. Temurtas
2 Sensors and Measurement System
The Quartz Crystal Microbalances (QCM) is useful acoustic sensor devices. Theprinciple of the QCM sensors is based on changes in the fundamental oscillationfrequency to upon ad/absorption of molecules from the gas phase. The detailedexplanation of the measurement and gas control systems and sensor are addressed in[2]
In this study, the frequency shifts (Hz) versus concentrations (ppm) characteristicswere measured by using QCM sensor for Acetone and Chloroform gases. At thebeginning of each measurement gas sensor is cleaned by pure synthetic air. Eachmeasurement is composed of five periods. Each period consists of 10 minutescleaning phase and 10 minutes measuring phase. During the periods of themeasurements, at the first period 500 ppm, and at the following periods 1000, 3000,5000, and 8000 ppm gases are given.
For the preparation of measurement data sets, firstly, cleaning phase data removedfrom the measured responses. Then, the cleaning phase base frequency shifts (5-15Hz.) subtracted from sensor responses. Approximately 1800 instantaneous sensorresponses were obtained for given six PPM values in both the training and test set.Instantaneous here means values at one point in time. Figure 1 shows the frequencyshift and slope of frequency shift graphs for Chloroform.
Fig. 1. Frequency shift and slope of frequency shift graphs for Chloroform.
3 Decreased Estimation Time by Using Artificial Neural Network
At the first study, a multi-layer feed-forward NN with tapped time delays [2,4] is usedfor determination of the concentrations of Acetone and Chloroform gases inside the

A Study on Neural Networks and Fuzzy Inference Systems for Transient Data 279
sensor response time. The network structure is shown in Figure 2. The input, is thesensor frequency shift value, is data sampling time equal to 2 sec and the output,PPM is the estimated concentration. The inputs to the networks are the frequencyshift and the past values of the frequency shift. The networks have a single hiddenlayer and a single output node. The activation functions for the hidden layer nodesand the output node are sigmoid transfer function.
Fig. 2. Multi-layer feed-forward neural network model with a time delayed structure
The information about the trend of the transient sensor responses can be increasedby increasing the numbers of data. This requires additional neural network inputs. Forillustrating the effect of the numbers of inputs, four different numbers of inputs to thenetworks are used. These are,
the frequency shift and the two past values of the frequency shift (n = 3),the frequency shift and the four past values of the frequency shift (n = 5),the frequency shift and the seven past values of the frequency shift (n = 8),the frequency shift and the nine past values of the frequency shift (n = 10).
The back propagation (BP) method is widely used as a teaching method for an ANN.[11]. The BP algorithm with momentum gives the change in the weight of theconnection between neurons i and j at iteration k as
where is called the learning coefficient, the momentum coefficient, E the sum ofsquared differences error function, and the weight change in theimmediately preceding iteration.
The performance of the BP algorithm is improved if the learning rate is allowed tochange during the training process in response to the complexity of the local surfaceerror. Training time can also be decreased by the use of an adaptive learning rate,which attempts to keep the learning rate step size as large as possible while keepinglearning stable. This algorithm is commonly known as the gradient descent withmomentum and adaptive learning rate (GDX) [9]. GDX is one of the highperformance BP training algorithms which used in this paper.

280 F. Temurtas
Other high performance BP training algorithm which used in this study is ResilientBP (RP) [9-11]. RP was developed by Riedmiller and Braun [11]. In contrast to othergradient algorithms, this algorithm does not use the magnitute of the gradient. It is adirect adaptation of the weight step based local gradient sign. The RP algorithmgenerally provides faster convergence than most other algorithms [10,11]. Localinformation for each weight’s individual update value, on the error function Eis obtained according to [9-11].
When the update value for each weight is adapted, the delta weights are changed asfollows:
More details about RP algorithm can be found in [10-12].
The measured transient sensors responses were used for the training and testprocesses. Two measurements were made using same QCM sensor for this purpose.One measurement was used as training set and other measurement was used as testset. The measured data is normalized between 0 and 1. Table 1 shows a replicate dataset of Chloroform presented to ANN structures for the training process.

A Study on Neural Networks and Fuzzy Inference Systems for Transient Data 281
4 Decreased Estimation Time by Using Fuzzy Inference System
At the second study, a fuzzy logic based algorithm which includes Mamdani’s fuzzyinference method [7,8] was proposed for realizing the estimation of Acetone andChloroform gas concentrations before the response times. In this system, two inputs,frequency change of the sensor and slope of (Figure 1) and one output,concentration of the introduced gas PPM are used.
Fig. 3. (a), (b) and PPM (c) membership functions for chloroform gas with n = 8.
From the relations of the inputs and output, extracted fuzzy rules andcorresponding defuzzification equation are as follows:

282 F. Temurtas
where, i= l,2,...,11, j = 1,2,...,9 and k= 1,2,...,5.Equations which used for the calculation of is given in (5).
where, is the frequency change of the sensor at time t, is past valueof the and is data sampling time equal to 2 sec. In this study, four different nvalues 3, 5, 8, 10 were used.
Figure 3 shows the sample and PPM membership functions for Chloroformgas with n = 8 and Figure 4 illustrates an example of Mamdani’s fuzzy inference,aggregation and defuzzification for the concentration estimation.
Fig. 4. An example of Mamdani’s fuzzy inference, aggregation and defuzzification.
5 Performance Evaluation
For the performance evaluation, we have used the mean relative absolute error,E(RAE) [2]:
where, is estimated concentration, is real concentration and
is number of test set data.

A Study on Neural Networks and Fuzzy Inference Systems for Transient Data 283
6 Results and Discussions
The ability of the fuzzy logic and neural network structures to estimation of theAcetone and Chloroform gas concentrations related to the n values is given in table 2.Acceptable good [2-7] estimation values are obtained from the both FIS and NNstructures and the results of the FIS structure are very closer to the results of the NNstructure using GDX algorithm for both Acetone and Chloroform gases. As seen inthis table, estimation times are generally at the level of seconds while sensor responsetimes are at the level of minutes for both systems. This means that the determinationof the concentrations of the Acetone and Chloroform gases inside the sensor responsetime is achieved by using the both FIS and NN structures. This table shows also thatRP training algorithm provides faster convergence than GDX algorithms in theconcentration estimation of Acetone and Chloroform gases for this study.
From the same table, it can be seen easily that, accuracy of the estimation can beimproved by increasing the n values. This means that the optimum estimation resultscan be adjusted and achieved by using suitable number of data sampling range.
In this study, it is seen that acceptable good estimation results can be achieved forthe estimation of the Acetone and Chloroform gas concentrations before the steadystate response of the QCM sensor using both FIS and NN systems and FIS structure issimple applicable to the transient sensor data.
The NN structure with tapped time delays is useful for realizing the determinationof the concentrations inside the response times and optimum estimation results can beachieved by using enough number of NN inputs and suitable training algorithm.
Unlike the NN structure whose adaptation to the handle systems including cheapmicrocontrollers is not easy [13], the fuzzy logic can be easily adapted to the handlesystems for detection of gas concentration inside the sensor response time because ofthe simplicity of the fuzzy structure. The results of the fuzzy logic are comparablegood and closer to those of the NN structure for estimation of the Acetone andChloroform gas concentrations. And the optimum estimation time can be selectedaccording to the desired acceptable error by using suitable number of data samplingrange.

284 F. Temurtas
References
1.
2.
3.
4.
5.
6.
7.
8.
9.
10.
11.
12.
13.
Ho, M.H., Gullbault, G.G., Rietz, B.: Continuos Detection of Toluene in Ambient Air witha Coated Piezoelectric Crystal, Anal. Chem., 52(9), (1980)Temurtas, F., Tasaltin, C., Temurta , H., Yumusak, N., Ozturk, Z.Z.: Fuzzy Logic andNeural Network Applications on the Gas Sensor Data : Concentration Estimation,ISCIS03, Lecture Notes in Computer Science, Vol. 2869, (2003), 178-185Temurtas, F., Gulbag, A., Yumusak, N.: A Study on Neural Networks using Taylor SeriesExpansion of Sigmoid Activation Function, ICCSA’04, Lecture Notes in ComputerScience, Vol. 3046, (2004), 386-394Temurtas, F., Tasaltin, C., Temurta , H., Yumusak, N., Ozturk, Z.Z.: A Study onNeural Networks with Tapped Time Delays: Gas Concentration Estimation, ICCSA04,Lecture Notes in Computer Science, Vol. 3046, (2004), 395-402Yea, B., Osaki, T., Sugahara, K., Konishi, R.: The concentration estimation ofinflammable gases with a semiconductor gas sensor utilizing neural networks and fuzzyinference, Sensors and Actuators-B, 41 (1997) 121-129Pardo, M., Faglia, G., Sberveglieri, G., Corte, M., Masulli, F., Riani, M.: A time delayneural network for estimation of gas concentrations in a mixture, Sensors and Actuators B,65 (2000) 267–269Caliskan, E., Temurtas, F., Yumusak, N.: Gas Concentration Estimation using FuzzyInference Systems, SAU FBE Dergisi, Vol. 8 (1 )(2004)Mamdani, E.H., and Assilian, S.: An experiment in linguistic synthesis with a fuzzy logiccontroller, International Journal of Man-Machine Studies, 7 (1), (1975) 1-13Hagan, M. T., Demuth, H. B., Beale, M. H.: Neural Network Design, Boston, MA: PWSPublishing, (1996)Riedmiller, M.: Advanced supervised learning in multilayer perceptrons frombackpropagation to adaptive learning algorithms, Int. J. of Computer Standards andInterfaces, Special Issue on Neural Networks, 5 (1994)Riedmiller, M, and Braun, H.: A Direct Adaptive Method for Faster backpropagationlearning: The RPROP Algorithm, Proceedings of the IEEE Int. Conf. On NeuralNetworks, San Francisco, CA, March 28, 1993.Sagiroglu, S., Besdok, E., Erler, M.: Control Chart Pattern Recognition Using ArtificialNeural Networks, Turk J Elec Engin, 8(2) (2000).Avci, M., Yildirim, T.: Generation of Tangent Hyperbolic Sigmoid Function ForMicrocontroller Based Digital Implementations Of Neural Networks, TAINN 2003,Canakkale, Turkey (2003)

Automatic Design of Hierarchical TS-FS Model UsingAnt Programming and PSO Algorithm
Yuehui Chen, Jiwen Dong, and Bo Yang
School of Information Science and Engineering, Jinan University,Jinan 250022,P.R.China
{yhchen,csmaster , yangbo}@ujn.edu.cn
Abstract. This paper presents an approach for designing of hierarchical Takagi-Sugeno fuzzy system (TS-FS) automatically. The hierarchical structure isevolved using Ant Programming (AP) with specific instructions. The fine tun-ing of the rule’s parameters encoded in the structure is accomplished using Par-ticle Swarm Optimization (PSO) algorithm. The proposed method interleavesboth optimizations. Starting with random structures and rules’ parameters, itfirst tries to improve the hierarchical structure and then as soon as an improvedstructure is found, it fine tunes its rules’ parameters. It then goes back to im-proving the structure again and, provided it finds a better structure, it again finetunes the rules’ parameters. This loop continues until a satisfactory solution (hi-erarchical Takagi-Sugeno fuzzy model) is found or a time limit is reached. Theperformance and effectiveness of the proposed method are evaluated using timeseries prediction problem and compared with the related methods.
1 Introduction
Fuzzy logic system [1] has been successfully applied to a number of scientific andengineering problems in recent years. The problems in designing of fuzzy logic systeminclude: (1) how to automatically partition the input-output space for each input-output variable; (2) how many fuzzy rules are really needed for properly approximat-ing an unknown nonlinear systems; (3) how to determine the fuzzy rule base automati-cally. As it is well known the curse-of-dimensionality is an unsolved problem in thefields of fuzzy and neurofuzzy systems.
The problems mentioned above can be partially solved by the recent developmentsof hierarchical fuzzy systems. As a way to overcome the curse-of dimensionality, itwas suggested in [2] that to arrange several low-dimensional rule base in a hierarchi-cal structure, i.e. a tree, causing the number of possible rules to grow in a linear waywith a number of inputs. But no method was given on how the rules base could bedetermined automatically. In [3] the author described a new algorithm which derivesthe rules for hierarchical fuzzy associative memories that were structured as a binarytree. In [4-6], a specific hierarchical fuzzy system is proposed and its universal ap-proximation property was proved. But the main problems in fact lies that this is aspecific hierarchical fuzzy systems which lack of flexibility in the structure adaptation,
C. Bussler and D. Fensel (Eds.): AIMSA 2004, LNAI 3192, pp. 285–294, 2004.© Springer-Verlag Berlin Heidelberg 2004

286 Y. Chen, J. Dong, and B. Yang
and it is difficult to arrange the input variables for each sub-model. In [7] a geneticalgorithm-based approach was proposed to optimize the hierarchical structure and theparameters of 5-inputs hierarchical fuzzy controller for the low-speed control prob-lem. Based on the analysis of importance of each input variable and the coupling be-tween any two input variables, the problem of how to distribute the input variables todifferent (levels of) relational modules for incremental and aggregated hierarchicalfuzzy relational systems was addressed [8].
This paper presents an approach to design hierarchical TS-FS model. The hierarchi-cal structure is evolved using AP [9] with specific instructions. The fine tuning of therule’s parameters encoded in the structure is accomplished using PSO algorithm. Theproposed method interleaves both optimizations. Starting with random structures andrules’ parameters, it first tries to improve the hierarchical structure and then as soon asan improved structure is found, it fine tunes its rules’ parameters. It then goes back toimproving the structure again and, provided it finds a better structure, it again finetunes the rules’ parameters. This loop continues until a satisfactory solution (hierarchi-cal TS-FS model) is found or a time limit is reached.
The paper is organized as follows: Section 2 introduces a simple TS-FS model. Thenew encoding method and evaluation of the hierarchical TS-FS are presented in Sec-tion 3. A hybrid learning algorithm for evolving the hierarchical TS-FS model is givenin Section 4. Section 5 presents some simulation results for the time series forecastingproblem. Finally in section 6 and 7 we present some concluding remarks.
2 Takagi-Sugeno Fuzzy Systems (TS-FS)
Fuzzy inference systems are composed of a set of if-then rules. A Sugeno-Takagifuzzy model has the following form of fuzzy rules [1]:
where is a crisp function of The overall output of the fuzzy model can be ob-tained by:
where the number of input variables that appear in the rule premise, N is thenumber of fuzzy rules, n is the number of inputs, is the membership function forfuzzy set and T is a t-norm for fuzzy conjunction.
A number of researches have been devoted to identify the TS-FS model. The pa-rameters to be determined are the division of input space, the shapes of membershipfunctions in the antecedent parts and the linear weights in the consequent parts.

Automatic Design of Hierarchical TS-FS Model Using Ant Programming 287
Fig. 1. Left: an example of possible hierarchical TS-FS model with 4 inputs and 3 hierarchicallayers, Right: the tree structural representation of the corresponding hierarchical TS-FS model,where the used instruction set is
3 Hierarchical TS-FS: Encoding and Evaluation
A hierarchical fuzzy logic system not only provide a more complex and flexible ar-chitecture for modeling nonlinear systems, but can also reduce the size of rule base tosome extend. But there is no systematic method for designing of the hierarchical TS-FS model yet. The problems in designing of hierarchical fuzzy logic system include:
Selecting a proper hierarchical structure;Selecting the inputs for each TS fuzzy sub-model;Determining the rule base for each TS fuzzy sub-model;Optimizing the parameters in the antecedent parts and the linear weights in theconsequent parts of the TS fuzzy sub-model.
In this sense, finding a proper hierarchical TS-FS model can be posed as a searchproblem in the structure and parameter space. Fig. 1 (left) shows an example of possi-ble hierarchical TS-FS models with 4 input variables and 3 hierarchical layers.
3.1 Encoding
A tree-structural based encoding method with specific instruction set is selected forrepresenting a hierarchical TS-FS in this research. The reasons for choosing this rep-resentation are that (1)the trees have a natural and typical hierarchical layer; (2)withpre-defined instruction sets, the tree can be created and evolved using the existingtree-structure-based approaches, i.e., AP, Genetic Programming (GP) and PIPE algo-rithms [13].Assume that the used instruction set is where and de-note non-leaf nodes’ instructions and taking 2 and 3 arguments, respectively.
are leaf nodes’ instructions and taking zero argument each. In addition, the outputof each non-leaf node is calculated as a single T-S fuzzy sub-model (Section 2). Forthis reason the non-leaf node is also called a 2-inputs T-S fuzzy instruc-tion/operator. Fig.1 (right) shows tree structural representation of the hierarchical TS-FS model shown in Fig.1 (left).
It should be noted that in order to calculate the output of each TS-FS sub-model(non-leaf node), parameters in the antecedent parts and consequent parts of the TS-FSsub-model should be encoded into the tree.

288 Y. Chen, J. Dong, and B. Yang
3.2 Calculation of the Hierarchical TS-FS Tree
The output of a hierarchical TS-FS tree can be calculated in a recursive way. For sim-plicity, the calculation process of the tree (Fig. 1 (right)) is given for displaying themethod.
Assume that each input variable is divided into two fuzzy sets and the used fuzzymembership function is
Firstly we calculate the output of the T-S fuzzy sub-model (node Assume thatthe used fuzzy sets for variables are and respectively. There-fore, the corresponding fuzzy rules of node can be formed as follows [12]:
The output of node can be calculated based on the T-S fuzzy model:
where
Secondly, we calculate the overall output of the hierarchical T-S fuzzy model. It hasthree inputs, and y, the output of the T-S fuzzy sub-model (node Assumethat, the used fuzzy sets for variables and y are: andrespectively. The overall output of tree in Fig.1 (right) can be calculated based on thefollowing fuzzy rules:

Automatic Design of Hierarchical TS-FS Model Using Ant Programming 289
The overall output of the tree is
where
Where all the parameters and the shape parameters used infuzzy sets and are encoded in the node The parameter
and the shape parameters used in fuzzy setsand are attached to the node of the tree. All these parameters are randomlygenerated alone with the creation of the tree at initial step, and will be optimized bythe PSO algorithm.
3.3 Objective Function
In this work, the fitness function used for AP and PSO is given by Root Mean SquareError (RMSE):
where P is the total number of training samples, and are the actual and modeloutputs of j-th sample. Fit(i) denotes the fitness value of i-th individual.
4 An Approach for Evolving the Hierarchical TS-FS
4.1 Ant Programming for Evolving the Architecture of the Hierarchical TS-FS
Ant programming is a new method which applies the principle of the ant systems toautomated program synthesis [9]. In the AP algorithm, each ant will build and modifythe trees according to the quantity of pheromone at each node. The pheromone tableappears as a tree. Each node owns a table in which it memorizes the rate of pheromoneto various possible instructions (Fig.2).

290 Y. Chen, J. Dong, and B. Yang
Fig. 2. Pheromone tree, in each node a pheromone table holds the quantity of pheromone asso-ciated with all possible instructions.
First, a population of programs is generated randomly. The table of pheromone ateach node is initialized at 0.5. This means that the probability of choosing each termi-nal and function is equal initially. The higher the rate of pheromone is, the higher theprobability to be chosen. Each program (individual) is then evaluated using a prede-fined objective function. The table of pheromone is update by two mechanisms:
(1) Evaporation decreases the rate of pheromone table for every instruction on everynode according to following formula:
where denotes the pheromone value at the generation g, is a constant(2) For each tree, the components of the tree will be reinforced according to the fit-
ness of the tree. The formula is:
where s is a solution (tree), Fit(s) its fitness, the function or the terminal set at node iin this individual, is a constant is the value of the pheromone for the
instruction in the node i.A brief description of AP algorithm for structure optimization of the hierarchical
TS-FS is as follows:1) Set the elitist tree as NULL and its fitness value as a biggest positive real number
of the computer at hand. Every component of the pheromone tree is set to an averagevalue;
2) Random generation of ants (trees) based on the pheromone tree and correspond-ing parameters encoded in the hierarchical TS-FS;
3) Evaluation of ants using Eqn. (5);4) Update of the pheromone table according to Eqn. (6) and Eqn. (7);5) Go to step 1) unless a better tree is found. The criterion concerning with the better
tree found is distinguished as follows: if the fitness value of the best tree is smallerthan the fitness value of the elitist tree, or the fitness values of two trees are equal butthe nodes of the former is lower than the later, then we say that the better tree is found.The best and elitist trees are the best tree of the current generation and the one foundso far, respectively.

Automatic Design of Hierarchical TS-FS Model Using Ant Programming 291
4.2 Parameter Optimization with PSO
For the parameters optimization of the hierarchical TS-FS, a number of global andlocal search algorithms, i.e., GA, EP, gradient based learning method can be em-ployed. The basic PSO algorithm is selected for parameter optimization due to its fastconvergence and ease to implementation.
The PSO [10] conducts searches using a population of particles which correspond toindividuals in evolutionary algorithm (EA). A population of particles is randomlygenerated initially. Each particle represents a potential solution and has a positionrepresented by a position vector A swarm of particles moves through the problemspace, with the moving velocity of each particle represented by a velocity vector Ateach time step, a function Fit(i) (Eqn. (5) in this study) representing a quality measureis calculated by using as input. Each particle keeps track of its own best position,which is associated with the best fitness it has achieved so far in a vector Further-more, the best position among all the particles obtained so far in the population is kepttrack of as In addition to this global version, another version of PSO keeps track ofthe best position among all the topological neighbors of a particle.
At each time step t, by using the individual best position, and the global bestposition, a new velocity for particle i is updated by
where and are positive constant and and are uniformly distributed randomnumber in [0,1]. The term is limited to the range of If the velocity violatesthis limit, it is set to its proper limit. Changing velocity this way enables the particle ito search around its individual best position, and global best position, Based onthe updated velocities, each particle changes its position according to the followingequation:
4.3 The Proposed Learning Algorithm
The general learning procedure for the optimal design of the hierarchical TS-FSmodel can be described as follows.1) Create the initial population randomly (hierarchical TS-FS and their correspond-
ing parameters);2) Structure optimization by AP algorithm.3) If the better structure is found, then go to step 4), otherwise go to step 2);4) Parameter optimization by PSO algorithm. In this stage, the tree structure is fixed,
and it is the best tree taken from the end of run of the structure search. All of theparameters encoded in the best tree formulated a parameter vector to be opti-mized by PSO;
5) If the maximum number of PSO search is reached, or no better parameter vectoris found for a significantly long time (say 100 steps for maximum 2000 steps)then go to step 6); otherwise go to step 4);
6) If satisfied solution is found, then stop; otherwise go to step 2).

292 Y. Chen, J. Dong, and B. Yang
5 Experiments
The proposed approach has been evaluated in the Mackey-Glass chaotic time-seriesprediction problem. The chaotic Mackey-Glass differential delay equation is recog-nized as a benchmark problem that has been used and reported by a number of re-searchers for comparing the learning and generalization ability of different models.The Mackey-Glass chaotic time series is generated from the following equation:
where a=0.2 and b=0.1, the equation shows chaotic behavior. In our simula-tions, has been adopted. To make the comparison with earlier work fair [8], wepredict the x(t+6) using the input variables x(t-30), x(t-24), x(t-18), x(t-12), x(t-6) andx(t), where t=130 to t=1329. It corresponds to a 6-inputs, 1-output mapping.
1000 sample points used in our study. The first 500 data pairs of the series wereused as training data, while the remaining 500 were used to validate the model identi-fied. The used instruction set is where
denote x(t-30), x(t-24), x(t-18), x(t-12), x(t-6) and x(t), respectively.
Fig. 3. The structure of the evolved hierarchical TS-FS model for predicting of Mackey-Glasstime-series with RMSE 0.0167
The results are obtained from training of hierarchical TS-FS with 20 different ex-periments. The average RMSE value for training and test data sets are 0.0179 and0.0167, respectively. The structure of the evolved hierarchical TS-FS model wasshown in Fig.3. Based on [8], the importance degree of each input variables is evalu-ated and listed in Table 1. It can be seen that the most important variables are ar-ranged into the first layer of the hierarchical TS-FS models by AP algorithm automati-cally.
A comparison has been made to show the actual time-series, the hierarchical TS-FSmodel output and the prediction error (Fig.4). A comparison result of different meth-ods for forecasting Mackey-Glass data is shown in Table 2.

Automatic Design of Hierarchical TS-FS Model Using Ant Programming 293
Fig. 4. Actual time-series, model output and prediction error for training and test data sets.
6 Discussion
One major advantage of using a hierarchical TS-FS or a multilevel fuzzy system otherthan a single-level one is that the number of fuzzy rules and fuzzy operations involvedin modeling process can be reduced significantly as compared with those required bythe single-level counterparts. Due to the limitations to solve the hierarchical TS-FSanalytically, we choose to identify the hierarchical TS-FS via an evolutionary optimi-zation approach.
Firstly, the hierarchical structure and the rules’ parameters can be flexibly encodedinto a TS-FS tree. And then, the AP and the PSO algorithms are employed to evolvethe hierarchical structure and parameters alternatively. In the methods of IFRS andAPRS [8], the hierarchical structure and input selection are assigned based on: (1)analysis of the importance of each input variables; (2) analysis of the coupling be-tween input variables. In contrast to the IFRS and AFRS, the hierarchical structure andinput selection in this research are accomplished using an evolutionary procedureautomatically.
The effectiveness of the proposed methods has been demonstrated in time-seriesprediction problem. Compared to the IFRS and AFRS the generated hierarchical TS-FS model has some advantages in terms of the approximation accuracy, the number ofrules and the number of free parameters.
This paper provides a method, alternatively searches between the tree structurespace and parameter space by using the AP and PSO algorithms. But other tree-

294 Y. Chen, J. Dong, and B. Yang
structure based evolutionary algorithms, i.e., Genetic Programming, ProbabilisticIncremental Program Evolution and parameter learning algorithms, i.e., Genetic Algo-rithm, Evolutionary Strategy, can also be used to solve the problem.
7 Conclusions
Based on a novel representation and calculation of the hierarchical TS-FS models, anapproach for evolving the hierarchical TS-FS is proposed in this paper. The hierarchi-cal architecture and inputs selection of the hierarchical TS-FS were accomplishedusing AP algorithm, and the rules’ parameters embedded in the hierarchical TS-FSmodel are optimized using a PSO algorithm. Simulation result shown that the evolvedhierarchical TS-FS models were effective for predicting of chaotic time-series. Thesimulation is constructed under the assumption of that the hierarchical layer is threeand each input variable is divided into two fuzzy sets. It is direct to generalize theproposed method to the complex cases. The preliminary results are encouraging. Ourfuture works will concentrate on improving the convergence speed of the proposedmethod and apply it to the complex control problems.
References
1.
2.
3.
4.
5.
6.
7.
8.
9.
10.
11.
12.
13.
Takagi, T. and Sugeno, M: Fuzzy identification of systems and its application to model-ing and control. IEEE Trans. Syst. Man, Cybern., 15, (1985) 116-132Brown, M., Bossley K.M., Mills D.J. and Harris C.J.: High dimensional neurofuzzy sys-tems: overcoming the curse of dimensionality. Proc. 4th Int. Conf. on Fuzzy Systems.(1995) 2139-2146Rainer, H.: Rule generation for hierarchical fuzzy systems. Proc. of the annual conf. of theNorth America Fuzzy Information Processing. (1997) 444-449Wang, L.-X.: Analysis and design of hierarchical fuzzy systems. IEEE Trans. Fuzzy Sys-tems, 7, (1999) 617-624Wang, L.-X. : Universal approximation by hierarchical fuzzy systems. Fuzzy Sets andSystems, 93, (1998) 223-230Wei, C. and Wang, L.-X. : A note on universal approximation by hierarchical fuzzy sys-tems. Information Science, 123, (2000) 241-248Lin, L. C. and Lee, G.-Y. : Hierarchical fuzzy control for C-axis of CNC tuning centersusing genetic algorithms. Journal of Intelligent and Robotic Systems, 25, (1999) 255-275Duan, J.-C. and Chung, F.-L. : Multilevel fuzzy relational systems: structure and identifi-cation. Soft Computing 6 (2002) 71-86Birattari, M., Di Caro, G., and Dorigo M.: Toward the formal foundation of Ant Pro-gramming. In Third International workshop, ANTS2002. LNCS 2463, 2002 188-201Kennedy, J. et al.,: Particle Swarm Optimization. Proc. of IEEE International Conferenceon Neural Networks. IV (1995) 1942-1948Kasabov, K. et al.,: FuNN/2 - A fuzzy neural network architecture for adaptive learningand knowledge acquisition. Information Science 101 (1997) 155-175Ying, H.: Theory and application of a novel fuzzy PID controller using a simplifiedTakagi-Sugeno rule scheme. Information Science, 123 (2000) 281-293Chen, Y. et al.,: Nonlinear System Modeling via Optimal Design of Neural Trees, Inter-national Journal of Neural Systems, 14 (2004) 125-137

Forecasting Stock Price by SVMs Regression
Yukun Bao1, Yansheng Lu2, and Jinlong Zhang3
1Department of Management Scince & information System, School of Management,Huazhong University of Science and Technology, Wuhan 430074, China
[email protected] College of Computer Science, Huazhong University of Science and Technology, Wuhan
430074, [email protected]
3Department of Management Scince & information System, School of Management,Huazhong University of Science and Technology, Wuhan 430074, China
Abstract. Forecasting stock price is one of the fascinating issues of stockmarket research. Accurately forecasting stock price, which forms the basisfor the decision making of financial investment, is probably the biggestchallenge for capital investment industry, which leads it a widelyresearched area. Time series forecasting and neural network are oncecommonly used for prediction on stock price. This paper deals with theapplication of a novel neural network technique, support vector machines(SVMs) regression, in forecasting stock price. The objective of this paper is toexamine the feasibility of SVMs regression in forecasting stock price. A dataset from shanghai stock market in China is used for the experiment to test thevalidity of SVMs regression. The experiment shows SVMs regression avaluable method in forecasting the stock price.
Keywords: Stock price forecasts; SVMs regression; Machine learning
1 Introduction
Stock price forecasts are valuable for investors, which tell out the investmentopportunities. Toward the fascinating goal, research efforts have been made to findsuperior forecasting methods. Financial time series forecasting is regarded as one ofthe most challenging applications of modern time series forecasting. But numerousstudies have found that univariate time series, such as Box-Jenkins ARIMA modelsare as accurate as more expensive linear regression or vector autoregressive models[1,2,3]. The success of linear models, however, is conditional upon the underlyingdata generating process being linear and not being random. One view in financialeconomics is that market prices are random and that past prices cannot be used as aguide for the price behavior in the future. Chaos theory, however, suggests that aseemingly random process may in fact have been generated by a deterministicfunction that is not random [4,5]. In such a case, ARIMA methods are no longer a
C. Bussler and D. Fensel (Eds.): AIMSA 2004, LNAI 3192, pp. 295–303, 2004.© Springer-Verlag Berlin Heidelberg 2004

296 Y. Bao, Y. Lu, and J. Zhang
useful tool for estimation and forecasting. Research efforts turn to new methods. Oneof them is the study of neural networks.Neural networks have been successfully used for modeling financial time series [6,7].Especially, several researchers report modest, positive results with the prediction ofmarket prices using neural networks [8,9,10], but not by using price and volumehistories alone, and no one uses technical analysis pattern heuristics. Neural networksare universal function approximations that can map any non-linear function without apriori assumptions about the properties of the data [11]. Unlike traditional statisticalmodels, neural networks are data-driven, non-parametric weak models, and they let“the data speak for themselves”.Consequently, neural networks are less susceptible tothe problem of model misspecification as compared to most of the parametric models.Neural networks are also more noise tolerant, having the ability to learn complexsystems with incomplete and corrupted data. In addition, they are more flexible,having the capability to learn dynamic systems through a retraining process using newdata patterns. So neural networks are more powerful in describing the dynamics offinancial time series in comparison to traditional statistical models [12,13,14,15].Recently, a novel neural network algorithm, called support vector machines (SVMs),was developed by Vapnik and his co-workers [16]. Unlike most of the traditionalneural network models that implement the empirical risk minimization principle,SVMs implement the structural risk minimization principle which seeks to minimizean upper bound of the generalization error rather than minimize the training error.This induction principle is based on the fact that the generalization error is boundedby the sum of the training error and a confidence interval term that depends on theVapnik–Chervonenkis (VC) dimension. Based on this principle, SVMs achieve anoptimum network structure by striking a right balance between the empirical error andthe VC-confidence interval. This eventually results in better generalizationperformance than other neural network models. Another merit of SVMs is that thetraining of SVMs is equivalent to solving a linearly constrained quadraticprogramming. This means that the solution of SVMs is unique, optimal and absentfrom local minima, unlike other networks’ training which requires non-linearoptimization thus running the danger of getting stuck in a local minima. Originally,SVMs have been developed for pattern recognition problems [17]. However, with theintroduction of Vapnik’s loss function, SVMs have been extended tosolve non-linear regression estimation problems and they have been shown to exhibitexcellent performance [18,19].This paper consists of five sections. Section 2 presents the principles of SVMsregression and the general procedures of applying it. By raising an example fromstock market in China, the detailed procedures involving data set selection, datapreprocessing and scaling, kernel function selection and so on are presented inSection 3. Section 4 discusses the experimental results followed by the conclusionsdrawn from this study and further research hints in the last section.

Forecasting Stock Price by SVMs Regression 297
2 SVMs Regression Theory
Given a set of data points is the input vector, is the desired
value and n is the total number of data patterns), SVMs approximate the functionusing the following:
where is the high dimensional feature space which is non-linearly mapped from
the input space x. The coefficients w and b are estimated by minimizing
In the regularized risk function given by Eq. (2), the first term is
the empirical error (risk). They are measured by the loss function givenby Eq. (3). This loss function provides the advantage of enabling one to use sparsedata points to represent the decision function given by Eq. (1). The second term
on the other hand, is the regularization term. C is referred to as the regularized
constant and it determines the trade-off between the empirical risk and theregularization term. Increasing the value of C will result in the relative importance ofthe empirical risk with respect to the regularization term to grow. is called the tubesize and it is equivalent to the approximation accuracy placed on the training datapoints. Both C and are user-prescribed parameters.To obtain the estimations of w and b , Eq. (2) is transformed to the primal function
given by Eq. (4) by introducing the positive slack variables and as follows:
Finally, by introducing Lagrange multipliers and exploiting the optimality constraints,the decision function given by Eq. (1) has the following explicit form [18]:
In Eq. (5), and are the so-called Lagrange multipliers. They satisfy the
equalities and where i = 1,2,...,n and are obtained bymaximizing the dual function of Eq. (4) which has the following form:

298 Y. Bao, Y. Lu, and J. Zhang
with the constraints
Based on the Karush–Kuhn–Tucker (KKT) conditions of quadratic programming,only a certain number of coefficients in Eq. (5) will assume non-zero values.The data points associated with them have approximation errors equal to or largerthan and are referred to as support vectors. These are the data points lying on oroutside the of the decision function. According to Eq. (5), it is evident thatsupport vectors are the only elements of the data points that are used in determiningthe decision function as the coefficients of other data points are all equal tozero. Generally, the larger the the fewer the number of support vectors and thusthe sparser the representation of the solution. However, a larger can also depreciatethe approximation accuracy placed on the training points. In this sense, is a trade-off between the sparseness of the representation and closeness to the data.
is defined as the kernel function. The value of the kernel is equal to the
inner product of two vectors and in the feature space and that is,
The elegance of using the kernel function is that one can deal
with feature spaces of arbitrary dimensionality without having to compute the mapexplicitly. Any function satisfying Mercer’s condition [16] can be used as the
kernel function. The typical examples of kernel function are as follows:Linear:
Polynomial:
Radial basis function (RBF):
Sigmoid:
Here, r and d are kernel parameters. The kernel parameter should be carefullychosen as it implicitly defines the structure of the high dimensional feature space
and thus controls the complexity of the final solution.From the implementation point of view, training SVMs is equivalent to solving alinearly constrained quadratic programming (QP) with the number of variables twiceas that of the training data points.

Forecasting Stock Price by SVMs Regression 299
Generally speaking, SVMs regression for forecasting follows the procedures:1.Transform data to the format of an SVM and conduct simple scaling on the data;2.Choose the kernel functions;3.Use cross-validation to find the best parameter C and4. Use the best parameter C and to train the whole training set;5.Test.
3 Forecasting Stock Price
3.1 Data Sets
We select daily closing prices of Haier (a famous corporation in China) of shanghaistock exchange between April.15, 2003 and Nov. 25, 2003. Haier is a famouselectrical appliance manufacturer in China and electrical appliance market in China isin stable situation. This is to say, there is no great fluctuation in market volume,market competition is fair and market profit rate is at a reasonable level. During thattime, the stock market in China is calm and no special political events affected thestock except the SARS. But it didn’t affect the electrical appliance market. So wechoose it as the sample of our experiment. There are totally 140 data points fromwww.stockstar.com. We used 100 data points in front of the data series as trainingdata sets and the rest 40 data points as testing data.
3.2 Data Preprocessing and Scaling
In order to enhance the forecasting ability of model, we transform the original closingprices into relative difference in percentage of price (RDP)[20]. As mentioned byThomason [20], there are four advantages in applying this transformation. The mostprominent advantage is that the distribution of the transformed data will become moresymmetrical and will follow more closely a normal distribution. This modification tothe data distribution will improve the predictive power of the neural network.The input variables are determined from four lagged RDP values based on 5-dayperiods (RDP-5, RDP-10, RDP-15 and RDP-20) and one transformed closing price(EMA15) which is obtained by subtracting a 15-day exponential moving averagefrom the closing price. The optimal length of the moving day is not critical but itshould be longer than the forecasting horizon of 5 days [20]. EMA15 is used tomaintain as much information as contained in the original closing price as possible,since the application of the RDP transform to the original closing price may removesome useful information. The output variable RDP+5 is obtained by first smoothingthe closing price with a 3-day exponential moving average because the application ofa smoothing transform to the dependent variable generally enhances the predictionperformance of the SVMs. The calculations for all the indicators are showed intable 1.

300 Y. Bao, Y. Lu, and J. Zhang
3.3 Performance Criteria
The prediction performance is evaluated using the following statistical metrics,namely, the normalized mean squared error (NMSE), mean absolute error (MAE),directional symmetry (DS) and weighted directional symmetry (WDS). NMSE andMAE are the measures of the deviation between the actual and predicted values. Thesmaller the values of NMSE and MAE, the closer are the predicted time series valuesto the actual values. DS provides an indication of the correctness of the predicteddirection of RDP+5 given in the form of percentages (a large value suggests a betterpredictor). The weighted directional symmetry measures both the magnitude of theprediction error and the direction. It penalizes the errors related to incorrectlypredicted direction and rewards those associated with correctly predicted direction.The smaller the value of WDS, the better is the forecasting performance in terms ofboth the magnitude and direction.
3.4 Kernel Function Selection
We use general RBF as the kernel function. The RBF kernel nonlinearly mapssamples into a higher dimensional space, so it, unlike the linear kernel, can handle thecase when the relation between class labels and attributes is nonlinear. Furthermore,the linear kernel is a special case of RBF as (Ref. [13]) shows that the linear kernelwith a penalty parameter has the same performance as the RBF kernel with someparameters In addition, the sigmoid kernel behaves like RBF for certainparameters [14].The second reason is the number of hyper-parameters which influences thecomplexity of model selection. The polynomial kernel has more hyper-parametersthan the RBF kernel.

Forecasting Stock Price by SVMs Regression 301
Finally, the RBF kernel has less numerical difficulties. One key point is in
contrast to polynomial kernels of which kernel values may go to infinity
or zero while the degree is large.
3.5 Cross-Validation and Grid-Search
There are two parameters while using RBF kernels: C and It is not knownbeforehand which C and are the best for one problem; consequently some kind ofmodel selection (parameter search) must be done. The goal is to identify goodso that the classifier can accurately predict unknown data (i.e., testing data). Note thatit may not be useful to achieve high training accuracy (i.e., classifiers accuratelypredict training data whose class labels are indeed known). Therefore, a common wayis to separate training data to two parts of which one is considered unknown intraining the classifier. Then the prediction accuracy on this set can more preciselyreflect the performance on classifying unknown data. An improved version of thisprocedure is cross-validation.We use a grid-search on C and using cross-validation. Basically pairs of aretried and the one with the best cross-validation accuracy is picked. We found thattrying exponentially growing sequences of C and is a practical method to identify
good parameters (for example,
4 Results and Discuss
In Fig. 1 the horizontal axis is the trading days of the test set and the vertical axis isstock price. It could be found that actual stock price run down from above thepredicted one to below it at the 2nd trading day; in the following four trading days theactual stock price goes down further; it tells that it is a timing for selling at 2nd day.Actual stock price run up from below the predicted stock price to above it at the 6thtrading day; in the following two trading days actual stock price stays above theclosing price of the 6th trading day; it tells that it is timing for buying at 6th day. Onthe following days, it could be done like this. The timing area for buying and sellingderived from Fig. 1 tells the investment values.
5 Conclusion
The use of SVMs in forecasting stock price is studied in this paper. The studyconcluded that SVMs provide a promising alternative to the financial time seriesforecasting. And the strengths of SVMs regression are coming from following points:1) usage of SRM; 2) few controlling parameters; 3) global unique solution derivedfrom a quadratic programming.

302 Y. Bao, Y. Lu, and J. Zhang
But further research toward an extremely changing stock market should be done,which means the data fluctuation may affect the performance of this method. Anotherfurther research hint is the knowledge priority used in training the sample anddetermining the function parameters.
Fig. 1. Comparison between actual and predicted Haier’s stock price
References
[1]
[2]
[3]
[4]
[5]
[6]
[7]
D.A. Bessler and J.A. Brandt. Forecasting livestock prices with individual and compositemethods. Applied Economics, 13, 513-522, 1981.K.S. harris and R.M. Leuthold. A comparison of alternative forecasting techniques forlive stock prices: A case study. North Central J. Agricultural Economics, 7, 40-50, 1985.J.H. Dorfman and C.S. Mcintosh. Results of a price forecasting competition. American J.Agricultural Economics, 72, 804-808, 1990.S.C. Blank. Chaos in future markets? A nonlinear dynamic analysis. J. Futures Markets,11,711-728,1991.J. Chavas and M.T. Holt. Market instability and nonlinear dynamics. American J.Agricultural Economics, 75, 113-120, 1993.Hall JW. Adaptive selection of U.S. stocks with neural nets. In: GJ Deboeck (Ed.),Trading on the edge: neural, genetic, and fuzzy systems for chaotic financial markets.New York:Wiley, 1994.Yaser SAM, Atiya AF. Introduction to financial forecasting. Applied Intelligence, 6, 205-213, 1996.

Forecasting Stock Price by SVMs Regression 303
[8]
[9]
[10]
[11]
[12]
[13]
[14]
[15]
[16][17]
[18]
[19]
[20]
[21]
[22]
G. Grudnitski, L. Osburn, Forecasting S&P and gold futures prices: an application ofneural networks, The Journal of Futures Markets, 13 (6) 631–643, 1993.S. Kim, S. Chun, Graded forecasting using an array of bipolar predictions: application ofprobabilistic neural networks to a stock market index, International Journal of Forecasting14 (3), 323–337, 1998.E. Saad, D. Prokhorov, D. Wunsch, Comparative study of stock trend prediction usingtime delay, recurrent and probabilistic neural networks, IEEE Transactions on NeuralNetworks, 9 (6), 1456-1470,1998.Cheng W, Wanger L, Lin CH. Forecasting the 30-year US treasury bond witha system ofneural networks. Journal of Computational Intelligence in Finance 1996;4:10–6.Sharda R, Patil RB. A connectionist approach to time series prediction: an empirical test.In: Trippi, RR, Turban, E, (Eds.), Neural Networks in Finance and Investing, Chicago:Probus Publishing Co., 1994, 451–64.Haykin S. Neural networks: a comprehensive foundation. Englewood CliKs, NJ: PrenticeHall, 1999.Zhang GQ, Michael YH. Neural network forecasting of the British Pound=US Dollarexchange rate. Omega 1998;26(4):495–506.Kaastra I, Milton SB. Forecasting futures trading volume using neural networks. TheJournal of Futures Markets 1995;15(8):853–970.Vapnik VN. The nature of statistical learning theory. New York: Springer, 1995.Schmidt M. Identifying speaker with support vector networks. Interface ’96 Proceedings,Sydney, 1996.Muller KR, Smola A, Scholkopf B. Prediction time series with support vector machines.Proceedings of International Conference on Artificial Neural Networks, Lausanne,Switzerland, 1997, p 999Vapnik VN, GolowichSE, Smola AJ. Support vector method for function approximation,regression estimation, and signal processing. Advances in Neural Information ProcessingSystems 1996;9:281-287.Thomason M. The practitioner methods and tool. Journal of Computational Intelligencein Finance 1999;7(3):36–45.Keerthi, S. S. and C-.J. Lin. Asymptotic behaviors of support vector machines withGaussian kernel. Neural Computation 15 (7), 1667–1689.Lin, H.-T. and C.-J. Lin. A study on sigmoid kernels for SVM and the training of non-PSD kernels by SMO-type methods. Technical report, Department of Computer Scienceand Information Engineering, National Taiwan University. Available athttp://www.csie.ntu.edu.tw/~cjlin/papers

Harmonic Detection Using Neural Networks withConjugate Gradient Algorithm
Nejat Yumusak1, Fevzullah Temurtas1, and Rustu Gunturkun2
1 Sakarya University, Department of Computer Engineering, Adapazari, Turkey2 Dumlupinar University, Technical Education Faculty, Kutahya, Turkey
Abstract. In this study, the Elman’s recurrent neural networks using conjugategradient algorithm is used for harmonic detection. The feed forward neuralnetworks are also used for comparison. The conjugate gradient algorithm iscompared with back propagation (BP) and resilient BP (RP) for training of theneural networks. The distorted wave including harmonics weresimulated and used for training of the neural networks. The distorted waveincluding up to harmonics were prepared for testing of the neural networks.The Elman’s recurrent and feed forward neural networks were used torecognize each harmonic. The results of the Elman’s recurrent neural networksare better than those of the feed forward neural networks. The conjugategradient algorithm provides faster convergence than BP and RP algorithms inthe harmonics detection.
1 Introduction
AC power systems have a substantial number of large harmonic generating devices,e.g. adjustable speed drives for motor control and switch-mode power supplies usedin a variety of electronic devices such as computers, copiers, fax machines, etc. Thesedevices draw non-sinusoidal load currents consisting primarily of lower-order
and harmonics that distort the system power quality. [1]. Harmonicstandards (e.g. IEEE 519 and IEC 555) have been developed to address limits inallowable harmonics [2,3].
An effective way for harmonic elimination is the harmonic compensation by usingactive power filter. Active power filter detect harmonic current from distorted wave inpower line, then generates negative phase current as same as detected harmonic tocancel out the harmonic in power system. Using of the artificial neural networks isone of the methods for harmonic detection. [4-8].
The back propagation (BP) algorithm is widely recognized as a powerful tool fortraining neural networks (NNs). But since it applies the steepest descent method toupdate the weights, it suffers from a slow convergence rate and often yieldssuboptimal solutions. A variety of related algorithms have been introduced to addressthat problem. A number of researchers have carried out comparative studies oftraining algorithms [9-12]. The resilient BP (RP) and Fletcher-Reeves conjugategradient (CGF) algorithms [9-12] used in this study is one of these type algorithms.
C. Bussler and D. Fensel (Eds.): AIMSA 2004, LNAI 3192, pp. 304–311, 2004.© Springer-Verlag Berlin Heidelberg 2004

Harmonic Detection Using Neural Networks with Conjugate Gradient Algorithm 305
In this study, the method to apply the Elman’s recurrent neural networks [6,7] forharmonic detection process in active filter is described. The feed forward neuralnetworks were also used for comparison. The distorted wave includingand harmonics are used to be input signals for these neural networks at thetraining state. The output layer of network is consisted of 4 units in according to eachorder of harmonic. By effect of learning representative data, each component ofharmonic is detected to each according unit. That means neural network structures candecompose each order of harmonic and detect only harmonic without fundamentalwave in the same time.
2 Elman’s Recurrent Neural Network for Harmonic Detection
Because of non-sinusoidal load currents consisting primarily of lower-orderand harmonics that distort the system power quality, we consider about
and harmonics detection. At the first step we used the feed forwardneural network [6,7]. This network was a multilayer network (input layer, hiddenlayer, and output layer). The hidden layer neurons and the output layer neurons usenonlinear sigmoid activation functions.
At the second step, because of the time series nature of the distorted wave, we usedElman’s recurrent neural network (RNN) [6,7] for harmonic detection as seen inFigure 1. This network is also a multilayer network (input layer, recurrent hiddenlayer, and output layer). The hidden layer neurons and the output layer neurons usenonlinear sigmoid activation functions.
Fig. 1. Elman’s recurrent neural network structures for harmonics detection
In this study, 20 hidden layer neurons and 4 output layer neurons were used forboth FNN and Elman’s RNN and the number of the inputs were 4 for both networkstructures.

306 N. Yumusak, F. Temurtas, and R. Gunturkun
3 Training of the Networks
The back propagation (BP) method is widely used as a teaching method for an ANN[12]. The BP algorithm with momentum gives the change in the weight of the
connection between neurons i and j at iteration k as
where is called the learning coefficient, the momentum coefficient, E is the sumof squared differences error function, and the weight change in the
immediately preceding iteration. The performance of the BP algorithm is improved ifthe learning rate is allowed to change during the training process in response to thecomplexity of the local surface error.
The high performance BP training algorithm used in this study is Fletcher-Reevesconjugate gradient algorithm (CGF). The BP algorithm with momentum and ResilientBP (RP) [10] are also used [8] for comparison.
In contrast to other gradient algorithms, the RP algorithm does not use themagnitude of the gradient. It is a direct adaptation of the weight step based localgradient sign [9,10,12]. Local information for each weight's individual update value,
on the error function E is obtained according to [10,12].When the update value for each weight is adapted, the delta weights are changed as
follows:
More details about RP algorithm can be found in [9,10,12].In conjugate gradient algorithm a search is carried out along conjugate directions.
The first iteration of all the conjugate gradient algorithms starts out by searching inthe steepest descent direction, i.e., the negative of the gradient.
A line search is performed to determine the optimal distance to move along thecurrent search direction:

Harmonic Detection Using Neural Networks with Conjugate Gradient Algorithm 307
Then the next search is performed so that it is conjugate to the previous directions.The new search is determined by combining the new steepest descent direction withthe previous search direction:
CGF implements the Fletcher-Reeves update of the conjugate gradient algorithmwhere the constant is computed as
which is the ratio of the norm squared of the current gradient to the norm squared ofthe previous gradient. More details about CGF algorithm can be found in [12,13].
In order to make neural network enable to detect harmonics from distorted wave, itis necessary to use some representative distorted waves for learning. These distortedwaves are made by mixing the component of the and harmonics infundamental wave. For this purpose, harmonic up to 70%, harmonic up to 40%,
harmonic up to 10% and harmonic up to 5% were used and approximately2500 representative distorted waves were generated for training process.
During the training process, the distorted waves were used for recognition. As theresult of recognition, output signal from each output unit gives the coefficient of eachharmonic included in the input distorted wave and these harmonics are eliminatedfrom the distorted wave (see Figure 2). Equations [6-8] used in the eliminationprocess are shown in (6), and (7).
where, If(t) is the active filtered wave, is the distorted wave, h = 5,7,11,13, arecoefficients of lower-order and harmonics, f = 50 Hz, is phaseangle and equal to zero in this study.
4 The Quality of Power System Waves
The common index used to determine the quality of power system currents andvoltages are total harmonic distortion (THD) [6-8], which is defined as

308 N. Yumusak, F. Temurtas, and R. Gunturkun
where represents the individual harmonics and is the fundamental component ofthe load wave.
Fig. 2. Process for restoring wave
5 Results and Conclusions
The non sinusoidal load currents consist also that the higher order harmonics such asetc., but they do not carry any significant current [14]. So, for the
performance evaluation of the neural network structures, harmonic up to 70%,harmonic up to 40%, harmonic up to 10% and harmonic up to 5%,harmonic up to 5%, harmonic up to 2.5%, harmonic up to 2.5%,harmonic up to 2% were used [15] and approximately 250 representative distortedwaves were generated as a test set.
For the training and test processes, input signals of the neural networks are theamplitudes of one period of distorted wave. The amplitudes are taken 128 point atregular interval of time axis. The amplitudes are used to be input signals of the neuralnetworks without any pre processing. At the training phase, the higher orderharmonics such as etc., are ignored for THD calculations.
Figure 3 shows the training results of the feed forward neural networks. As seen inthis figure, the results of the RP training algorithm are better then that of the standardback propagation algorithm. From the same figure, it can be seen easily that CGFtraining algorithm provides faster convergence than other algorithms in the harmonicsdetection.
Figure 4 shows the training results of Elman’s recurrent neural networks. As seenin this figure, the results of the RP training algorithm is better then that of the standardback propagation algorithm and the CGF training algorithm provides fasterconvergence than others.

Harmonic Detection Using Neural Networks with Conjugate Gradient Algorithm 309
Fig. 3. Training results of feed forward neural network
Fig. 4. Training results of Elman’s recurrent neural networks
After the training process is completed, the general distorted waves (test set) wereused for recognition. As the result of recognition, output signal from each output unitmeans the coefficient of each harmonic which is including in the input distorted waveand these harmonics are eliminated from the distorted wave.
Table 1 shows the average THD values of restored waves obtained by using thefeed forward and Elman’s recurrent neural networks for training and the test set. Thesample source wave and the restored waves are shown in Figure 5.
The recommendation IEEE 519 allows a total harmonic distortion (THD) of 5% inlow-voltage grids [16]. As seen in the table, average THD value is 46.36% beforecompensation and obtained average THD values are less then 5% after compensationfor all networks. These THD values are suitable to the recommendation IEEE 519.
Because the higher order harmonics are ignored for THD calculations at thetraining phase, training THD values are smaller than test THD values as seen in thetable. The 3.65% of training THD values come from the higher order harmonics such

310 N. Yumusak, F. Temurtas, and R. Gunturkun
as etc which are not used in the training. This means that there is animprovement potential. The THD values obtained by using Elman’s recurrent neuralnetworks are better than the THD values obtained by using the feed forward neuralnetworks. This can be because of that the feedback structures of the Elman’s RNN aremore appropriate for the time series nature of the waves.
Fig. 5. Sample source and restored waves (by Elman’s RCNN)
As the result, the possibility of the feed forward and Elman’s recurrent neuralnetworks to detect harmonics is confirmed by compensating the distorted waves and itcan be said that the feed forward and Elman’s recurrent neural networks are effectiveto use for active filter. And it is also confirmed that the CGF training algorithmprovides faster convergence than the BP and RP training algorithms in the harmonicsdetection.

Harmonic Detection Using Neural Networks with Conjugate Gradient Algorithm 311
References
1.
2.
3.
4.
5.
6.
7.
8.
9.
10.
11.
12.
13.
14.
15.
16.
Unsal, A., Von Jouanne, A.R., Stonic, V.L.: A DSP controlled resonant active filter forpower conditioning in three phase industrial power system, Signal Processing, Vol. 82(2001) 1743-1752IEEE Standarts 519-1992, IEEE Recommended Practice and Requirements for HarmonicsControl in Electric Power Systems, Piscataway, NJ, (1992)IEEE Recommended Practices for Power System Analysis, IEEE Inc., New York, NY(1992)Pecharanin, N., Sone, M., Mitsui, H.: An application of neural network for harmonicdetection in active filter, ICNN (1994) 3756-3760Rukonuzzaman, M., Nakaoka, M.: Adaptive neural network based harmonic detection foractive power filter, IEICE Transactions On Communications, E86B (5) (2003) 1721-1725Temurtas, F., Gunturkun, R., Yumusak, N., Temurtas, H., Unsal, A.: An application ofElman’s Recurrent Neural Networks to Harmonic Detection, IEA-AIE 04, Lecture Notesin Artificial Intelligence, 3029 (2004) 1043-1052Temurtas, F., Gunturkun, R., Yumusak, N., Temurtas, H.: Harmonic Detection using FeedForward and Recurrent Neural Networks for Active Filters, Electric Power SystemsResearch, in press (2004)Temurtas, F., Gunturkun, R., Yumusak, N., Temurtas, H., Cerezci, O.: Elman’s RecurrentNeural Networks using Resilient Back Propagation for Harmonic Detection, PRICA 04,Lecture Notes in Artificial Intelligence, in press (2004)Sagiroglu, S., Besdok, E., Erler, M.: Control Chart Pattern Recognition Using ArtificialNeural Networks, Turk J Elec Engin, 8(2) (2000).Riedmiller, M, and Braun, H.: A Direct Adaptive Method for Faster backpropagationlearning: The RPROP Algorithm, Proceedings of the IEEE Int. Conf. On NeuralNetworks, San Francisco, CA, March 28, 1993.Brent, R.P.: Fast Training Algorithms for Multi-layer Neural Nets, IEEE Transactions onNeural Networks 2 (1991) 346–354Hagan, M. T., Demuth, H. B., Beale, M. H.: Neural Network Design, Boston, MA: PWSPublishing, (1996)Fletcher, R., Reeves, C.M.: Function minimization by conjugate gradients, ComputerJournal 7, (1964) 149-154Ryckaert, W.R.A., Ghijselen, J.A.L., Melkebeek, J.A.A.: Harmonic mitigation potential ofshunt harmonic impedances, Electric Power Systems Research, Vol. 65 (2003) 63-69Reid, W.E.: Power quality issues – standards and guidelines, IEEE Trans. on Ind. App.,Vol. 32(3) (1996) 625-632Nunez-Zuniga, T.E., Pomilio, J.A.: Shunt active power filter synthesizing resistive loads,Vol. 17(2) (2002) 273-278

Neural Model of Osmotic Dehydration Kinetics ofFruits Cubes
Ieroham Baruch1, Próspero Genina-Soto2, Boyka Nenkova3,and Josefina Barrera-Cortés2
1 CINVESTAV-IPN, Department of Automatic Control, av. IPN no 2508, A.P. 14-740,07360 Mexico D.F., Mexico
[email protected] CINVESTAV-IPN, Department of Biotechnology and Bioengineering,
av. IPN no 2508, A.P. 14-740,07360 Mexico D.F., Mexico
{genina, jbarrera}@mail.cinvestav.mx3IIT-BAS, Geo Milev, BAS b1. 2,
1113 Sofia, [email protected]
Abstract. The paper proposed to use a Recurrent Neural Network model(RNN) for process prediction of the osmotic dehydration kinetics of natureproduct cubes (apple, sweet potatoes and potatoes) at different operational con-ditions of temperature and concentration of the osmotic solution. The proposedRNN model has five inputs, three outputs and eight neurons in the hidden layer,with global and local feedbacks. The learning algorithm is a modified version ofthe dynamic backpropagation one. The learning and generalization meansquared errors are below 2%. The learning was performed in 701 epochs, 40 it-erations each one. The statistical analysis confirms the good quality of the pro-posed RNN model.
1 Introduction
The Osmotic Dehydration (OD) is a mass transfer operation of increasing interest infood preservation technologies. It is done by immersion of a natural product into ahypertonic solution for achieving a flow of water outwards the solid, as well as acountercurrent flow of solution into the product. For developing food treatment tech-nology based on the OD process, it is necessary to know the OD kinetics for fixing thedesired dehydration and impregnation levels involved in such process, [1].
For modeling the mass transfer phenomena during the OD process, analytical andempirical models have been reported. Some empirical models are those, developed byLenart and Flink, [2] and Azuara, et al., [3]. Analytical models have been developedby Beristain et al., [4], who proposed a phenomenological model based on the Fick’ssecond law. Raoult-Wack et al., [5], have developed a compartment model andToupin et al. (1989), [6], stated a complex mathematical model based on transport
C. Bussler and D. Fensel (Eds.): AIMSA 2004, LNAI 3192, pp. 312–320, 2004.© Springer-Verlag Berlin Heidelberg 2004

Neural Model of Osmotic Dehydration Kinetics of Fruits Cubes 313
phenomena. An inconvenient of most of these models is that they involved some em-pirical constants that ought to be known previously, in order to be used.
Artificial Neural Networks (ANN) models seemed suitable for modeling the os-motic dehydration process, [7]. They have been applied in various fields since 1985and are beneficial for modeling complicated and atypical experimental conditionswithout having to put forward hypotheses on the underlying physical and/or chemicalmechanisms, [8]. These models also take nonlinearities and interactions between inputvariables of the model into account with very few parameters, [9].
This study was designed to test and validate the efficiency of the Recurrent NeuralNetwork (RNN) model for predicting profiles kinetics of water loss in fruits such assweet potato roots, potatoes and apples. The profile kinetics is determined at twotemperatures (26°C and 50°C) and three concentrations of the osmotic solution(30:100, 50:100 and 70:100), [10].
2 Description of the Osmotic Dehydration Process Experiment
The nature products (sweet potato roots, potatoes and apple) were obtained from alocal market. The osmotic solutions were prepared using distilled water and commer-cial refined sucrose as osmotic agent.
The Osmotic dehydration (OD) process experiment requires following a sequenceof operation. The nature product cubes of 3.5 cm are put in a container of 4L contain-ing osmotic solutions at fixed concentration and temperature. The homogenization ofthe osmotic solution is obtained by a mild agitation of 100 rpm, [10]. The osmoticdehydration process is treated with osmotic solutions of different sucrose concentra-tions (30:100, 50:100 and 70:100 w/w) and temperature (26°C and 50°C). The os-motic dehydration process is carried out during an exposition time of 168 hours. Dur-ing this time, the nature cubes are tested at 8, 24, 72 and 168 hours.
The global OD kinetics is obtained by the weight evolution of the cubes. The cubesare withdrawn from the solution. Immediately, they are blotted with a tissue paper andweighted on tarred receptacles prior to returning them to the reactor.
The water lost is determined by weight difference of dried and osmosis cubes.
3 Input-Output Pattern of Learning
The input-output pattern of learning is shown on the Fig. 1. The variables determiningthe OD process are the temperature (T) and the osmotic solution concentration (OSC).The RNN model included these variables in the input pattern of learning as well as thedimensional lost of water (C/Co) for the three fruits studied: sweet potato roots (SPR),potatoes (P) and apples (A).

314 I. Baruch et al.
Fig. 1. Input-Output Pattern of Learning.
The output pattern of learning is conformed only by the dimensional lost of water(C/Co) of the three fruits mentioned below and corresponding at a next time of the ODprocess.
4 Recurrent Neural Network Topology and Learning
In the present paper, a two layer completely parallel RNN model it is proposed to beused as a neural predictive model of the OD process. The RNN two-layer architecturecontains one hidden and one output layer, both recurrent – with local and global feed-backs. The proposed RNN model is inspired from the RNN model given in [11], buthere it is extended by a global feedback and by a local feedback in the output layer, soit takes the form:
Where, Y, X and U are output, state and input vectors, respectively, with dimensions l,n, m, respectively; are (nxn) and (lxl)- local feedback block-diagonal weightmatrices respectively; are diagonal blocks of with (1x1) or (2x2)dimensions; B and C are (nxm) and (lxn)- weight matrices; D is a (nxl)- global outputclosed loop matrix; S[.] is a vector-valued sigmoid activation function. The equation(3) represents the local stability conditions, imposed on all diagonal blocks of thefeedback matrices The saturation function could be used as approximation ofthe sigmoid function so to improve the RNN architecture, facilitating its realization,[11]. The stability of the RNN model is assured by the activation functions S and bythe local stability conditions (3). The global feedback has been introduced so to re-duce the measurement data noise during the RNN learning. For training the RNN it isused a modified dynamic backpropagation algorithm, which has the form:
Where: is a general weight, denoting the ij-th weight element of each weight ma-trix in the RTNN model to be updated;

Neural Model of Osmotic Dehydration Kinetics of Fruits Cubes 315
and is the weight correction of finally, and are the learning rate pa-rameters. The stability of this learning algorithm has been proved in [11]. In the dis-crete-time RNN model, the weight corrections of the updated matrices described byequations (1), (2), are given as follows:
For the output layer:
Where: are weight corrections of the ij-th elements of the (lxn) learnedmatrix C and (lxl) learning matrix is a j-th element of the target vector; is a j-th element of the output vector; is an i-th element of the output vector of the hiddenlayer, is an auxiliary variable.
For the hidden layer:
Where: are weight corrections of the ij-th elements of the (nxm)learned matrix B and the (nxl) learned matrix D; is a row vector of dimension (1x1),taken from the transposed matrix C’; [T-Y] is a (lx1) output error vector, throughwhich the error is back-propagated to the hidden layer; is an i-th element of theinput vector is an i-th element of the vector is the weight correction ofthe ij-th elements of the (nxn) block-diagonal matrix is an auxiliary variable.
5 Experimental Results
The graphical results for the last epoch of RNN learning with experimental data, aregiven on Fig. 2. The RNN used for modeling and identification of the OD processhas five inputs, eight neurons in the hidden layer and three outputs (5, 8, 3). Thenumber of neurons in the hidden layer is determined in an experimental way, ac-cording to the Mean Square Error (MSE%) of learning. The learning algorithm is aversion of the dynamic backpropagation one, specially designed for this RNN topol-ogy. The described above learning algorithm is applied simultaneously to 5 degrada-tion kinetic data sets (patterns), containing 40 points each one. The 5 data sets areconsidered as an epoch of learning. After each epoch of learning, the 5 pattern setsare interchanged in an arbitrary manner from one epoch to another. An unknown ki-netic data set, repeated 5 times, is used as a generalization data set. The learning isstopped when the MSE of learning becomes below of a prescribed error limit(MSE%<2%). So it is done for the generalization, where MSE%<2%. An additional

316 I. Baruch et al.
measure of weight convergence was also applied, which is the relationshipfor all updated parameters. This error was obtained
after 701 epochs of learning.The graphical results, shown on Fig. 2, compare the experimental data for the 5
OD kinetics studied. The variables compared are the relative residual water contentof each fruit tested and the mean square error for the 701 epochs of learning. Thegeneralization of the RNN was carried out reproducing the OD kinetics, which is notincluded in the training process. This OD process was carried out at 20°C and an os-motic solution concentration of 30:100. The graphical generalization results obtainedare shown on Fig. 3. The graphics compare the experimental data with the outputdata, generated by the RNN during the last epoch of generalization. The MSE% ofgeneralization, given on the end of the last graphic is below 2%.
Fig. 2. Graphical results of learning. Experimental data (continuous line) vs. RNN outputs(dashed line) are plotted subsequently for the last epoch of learning, corresponding to the 5OD kinetics used in the learning process of the RNN model. The variables shown are relativeresidual water content of the natural fruits: sweet potatos roots, potatoes and apple, as well asthe mean square error of learning during 701 epochs of learning. The learning rate is of 1.2and the momentum rate is of 0.2.
The MSE% corresponding to 20 runs of the program at the end of the 701-th ep-och of learning/generalization is given on Table 1. The operational conditions of thisOD process are in the range of operational conditions studied.
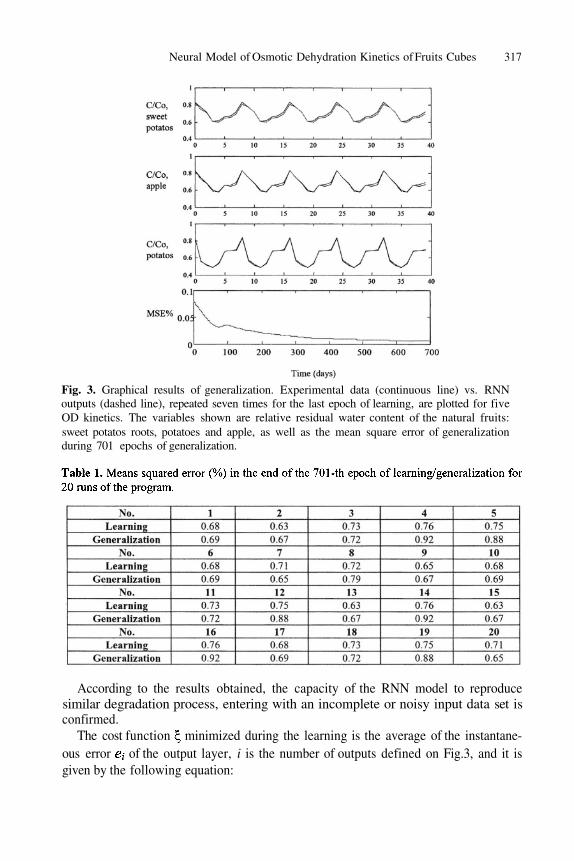
Neural Model of Osmotic Dehydration Kinetics of Fruits Cubes 317
Fig. 3. Graphical results of generalization. Experimental data (continuous line) vs. RNNoutputs (dashed line), repeated seven times for the last epoch of learning, are plotted for fiveOD kinetics. The variables shown are relative residual water content of the natural fruits:sweet potatos roots, potatoes and apple, as well as the mean square error of generalizationduring 701 epochs of generalization.
According to the results obtained, the capacity of the RNN model to reproducesimilar degradation process, entering with an incomplete or noisy input data set isconfirmed.
The cost function minimized during the learning is the average of the instantane-ous error of the output layer, i is the number of outputs defined on Fig.3, and it isgiven by the following equation:

318 I. Baruch et al.
Where: the number of outputs is three. The average cost for one epoch of learningis:
Where j is the number iterations for one epoch, and N is equal to 40. The average costfor all epochs of learning is:
Where j is the epoch number and Nep is equal to 701. The mean average cost for allruns of learning is:
Where k is the run number and n is equal to 20. The standard deviation with respectto the mean value is:
Where the deviation is:
The graphical results of the given in Table 1 statistical data are depicted on Fig. 4 - forthe RNN learning and on Fig. 5 - for the RNN generalization. The mean and the stan-dard deviation values are respectively:
For learning:
For generalization:
In Fig. 4 and Fig. 5, it is seen that about two or three run data are outside the stan-dard deviation which is due to the different initial weights values, chosen in arbitrarymanner as equiprobable numbers over small range.

Neural Model of Osmotic Dehydration Kinetics of Fruits Cubes 319
Fig. 4. Graphical representation of the Mean squared error (%) in the end of the 701-th epochof learning for 20 runs of the program, together with the mean value and the standard devia-tion.
Fig. 5. Graphical representation of the Mean squared error (%) in the end of the 701-th epochof generalization for 20 runs of the program, together with the mean value and the standarddeviation.
It is important to say that the experimental data in the OD process have an averagestandard deviation of ± 2-10%. According the mean square error of approximationobtained during RNN model learning, it could be said that the RNN model could beused successively to predict the OD process.

320 I. Baruch et al.
6 Conclusions
The paper proposed to use a Recurrent Neural Network model to predict the OD proc-ess. The multi-input multi-output RNN proposed, have five inputs, three outputs andeight neurons in the hidden layer, as well as global and local feedbacks. The weightupdate learning algorithm is a version of the well-known dynamic backpropagationalgorithm, directed to the RNN learning. The obtained approximation and generaliza-tion error at the end of the 701-th epoch is below 2%. The learning process is appliedsimultaneously for five OD kinetics data of different temperature, osmotic solutionconcentration and different relative residual water content of the natural fruits: sweetpotatos roots, potatoes and apples, where good convergent results, including statistics,have been obtained. After training and generalization, the RNN model is capable toevolve the relative residual water content of the natural fruits: sweet potatos roots,potatoes and apple, entering with an incomplete or noisy input data set. The last sta-tistical results confirm the good work of the learning and generalization program,which gives similar results in various runs.
References
1.
2.
3.
4.
5.
6.
7.
8.
9.
10.
11.
Raoult-Wack, A.L.: Recent advances in the osmotic dehydration of foods. Trends in FoodScience and Technology 5 (1994) 255-260.Lenart, A., Flink, J.M.: Osmotic Concentration of Potatoes. II. Spatial Distribution of theOsmotic Effect. Journal of Food Technology 19 (1984) 65-89.Azuara, E., Beristain, C.I., Gutiérrez, G.F.: A Method for Continuous Kinetic Evaluationof Osmotic Dehydration. Lebensmittel-Wissenschast & Technologie 31 (1998) 317-321.Beristain, C.I., Azuara, E., García, H.S.: Development of A Mathematical Model to Pre-dict Kinetics of Osmotic Dehydration. Journal of Food Science and Technology 29, no 4(1992) 239-242.Raoult-Wack, A.L., Petitdemange, F., Giroux, F., Guilbert, S, Ríos, G., Lebert, A.: Si-multaneous Water and Solute Transport in Shrinking Media. Part 2. A CompartmentalModel for Dewatering and Impregnation Soaking Process, Drying Technology 9, no 3(1991) 613-630.Toupin, C.J., Marcotte, M., Le Maguer, M.: Osmotically-Induced Mass Transfer in PlantStorage Tissues, A Mathematical Model. Part I. Journal of Food Engineering, no 10(1989) 13-38.Bichop, C: Neural Networks and Their Applications. Review of Scientific Instruments 65,no 5 (1994) 1803-1832.Baughman, D.R., Liu, Y.A.: Neural Networks in Bioprocessing and Chemical Engineer-ing. Ed. Academic Press, New York (1995) 1-17.Valdez-Castro, L., Baruch, I., Barrera-Cortés, J.: Neural Networks Applied to the Predic-tion of Fed-Batch Fermentation Kinetics of Bacillus Thuringiensis. Bioprocess and Bio-systems Engineering 25 (2003) 229-233.Genina-Soto, P., Barrera-Cortés, J., Gutiérrez-López, G., Nieto, E. A.: Temperature andConcentration Effects of Osmotic Media on OD Profiles of Sweet Potato Cubes. I. J.Drying Technology 19, no. 3 (2001) 547-558.Baruch, I., Flores, J. M., Nava, F., Ramirez, I. R., Nenkova, B.: An Advanced NeuralNetwork Topology and Learning, Applied for Identification and Control of a D.C. Motor.Proc. of the First International IEEE Symposium on Intelligent Systems, IS’02, Varna,Bulgaria, Vol. I (2002) 289-295.

Robust and Adaptive Load Frequency Control ofMulti-area Power Networks with System ParametricUncertainties Using Temporal Difference Based MLP
Neural Networks
Farzan Rashidi and Mehran Rashidi
Control Research Department, Engineering Research Institute, TehranP.O.Box: 13445-754, Iran
[email protected] and [email protected]
Abstract. In this paper a robust and adaptive Temporal Difference learningbased MLP (TDMLP) neural network for power system Load FrequencyControl (LFC) is presented. Power systems, such as other industrial processes,are nonlinear and have parametric uncertainties that for controller design had totake the uncertainties into account. For this reason, in the design of LFCcontroller the idea of TDMLP neural network is being used. Some simulationswith two interconnections are given to illustrate proposed method. Results oninterconnected power system show that the proposed method not only is robustto increasing of load perturbations and operating point variations, but also itgives good dynamic response compared with traditional controllers. Itguarantees the stability of the overall system even in the presence of generationrate constraint (GRC). To evaluate the usefulness of proposed method wecompare the response of this method with RBF neural network and PIDcontroller. Simulation results show the TDMLP has the better controlperformance than RBF neural network and PID controller.
1 Introduction
In power systems, one of the most important issues is the load frequency control(LFC), which deals with the problem of how to deliver the demanded power of thedesired frequency with minimum transient oscillations [1]. Whenever any suddenlysmall load perturbations resulted from the demands of customers occur in any areas ofthe power system, the changes of tie-line power exchanges and the frequencydeviations will occur. Thus, to improve the stability and performance of the powersystem, generator frequency should be setup under different loading conditions. Forthis reason, many control approaches have been developed for the load frequencycontrol. Among them, PID controllers [2], optimal [3], nonlinear [4] and robust [5]control strategies, and neural and/or fuzzy [6-7] approaches are to be mentioned. Anindustrial plant, such as a power system, always contains parametric uncertainties. Asthe operating point of a power system and its parameter changes continuously, a fixedcontroller may no longer be suitable in all operating conditions. In this paper, because
C. Bussler and D. Fensel (Eds.): AIMSA 2004, LNAI 3192, pp. 321–330, 2004.© Springer-Verlag Berlin Heidelberg 2004

322 F. Rashidi and M. Rashidi
of the inherent nonlinearity of power system a new artificial neural network basedintelligent controller, which has the advance adaptive control configuration, isdesigned. The proposed controller uses the capability of the MLP neural networkbased on Temporal Difference (TD) learning for the design of LFC controller. In thiswork, for the design of MLP neural network the idea of TD learning and applying it tononlinear power system is being used. The motivation of using the TD learning fortraining of the MLP neural network is to take the large parametric uncertainties intoaccount so that both stability of the overall system and good performance have beenachieved for all admissible uncertainties. Moreover, the proposed controller alsomakes use of a piece of information which is not used in conventional controllers (anestimate of the electric load perturbation, i.e. an estimate of the change in electric loadwhen such a change occurs on the bus). The load perturbation estimate could beobtained either by a linear estimator, or by a nonlinear neural network estimator incertain situations. It could also be measured directly from the bus. We will show bysimulation that when a load estimator is available, the neural network controller canachieve extremely dynamic response. In this study, the TDMLP neural network isconsidered for control interconnected power system with two areas with power tie-lines to supply different consumers. The simulation results obtained are shown thatthe proposed controller not only has good performance in the presence of thegeneration rate constraint (GRC), but also gives good dynamic response compare toRBF neural network and PID controller. This paper is organized as follows: Section 2describes the power system and its mathematical model. In section 3, the wholestructure of the proposed TDMLP neural network is shown. Section 4 describes theapplication of TDMLP in LFC. Section 5 shows the simulation results that have beencompared with RBF neural network and PID controller. Some conclusion remarks arediscussed in section 6.
2 Mathematical Model of Power System
The power networks are usually large-scale systems with complex nonlineardynamics. However, for the design of LFC, the linearized model around operatingpoint is sufficient to represent the power system dynamics [1]. Fig.1 shows the blockdiagram of ith area power system. Each area including steam turbines containsgovernor and reheater stage of the steam turbine. According to Fig. 1, time-constantsof the and are considered for the reheater, turbine and governor of the
thermal unit, respectively. Wherever the actual model consists of the generation rateconstraints (GRC) and it would influence the performance of power systemssignificantly, the GRC is taken into account by adding a limiter to the turbine and alsoto the integral control part all of areas to prevent excessive control action.The GRC of the thermal unit is considered to be 0.3 p.u. per minute Allareas have governors with dead-band effects which are important for speed controlunder small disturbances. The governor dead-band is also assumed to be 0.06%.Based on the suitable state variable chosen in Fig. 1, the state space model of thissystem can be obtained as follows:

Robust and Adaptive Load Frequency Control of Multi-area Power Networks 323
Fig. 1. Block-Diagram of the ith area power system [8]
Where x is a 12 by 1 state vector and The outputs aredefined to be the frequency deviations and the deviation of transmission power
line The values of A,B and C matrices has been described in [8].

324 F. Rashidi and M. Rashidi
As the important characteristics of power systems such as: changing of the generation,loading conditions and system configuration are. Therefore, parameters of the linearmodel described previously, depend on the operating points. In this paper the range ofthe parameter variations are obtained by change of simultaneously by 50%
and all other parameters by 20% of their typical values. Denoting the ith parameter bythe parameter uncertainty is formulated as:
Where and stand for the maximum and minimum value, respectively. Table 1
shows the system uncertainties with their nominal, maximum and minimum values.
3 Temporal Difference Learning Based MLP Neural Networks
3.1 Temporal Difference Learning
Most of new learning algorithms like reinforcement learning, Q-learning and themethod of temporal differences are characterized by their fast computation and insome cases lower error in comparison with the classical learning methods. Fasttraining is a notable consideration in some control applications. In reinforcementlearning, there is no teacher available to give the correct output for each trainingexample, which is called unsupervised Learning. The output produced by the learningagent is fed to the environment and a scalar reinforcement value (reward) is returned.The learning agent tries to adjust itself to maximize the reward [9-10]. Often theactions taken by the learning agent to produce an output will affect not only theimmediate reward but also the subsequent ones. In this case, the immediate rewardonly reflects partial information about the action. This is called delayed-reward [11].Temporal difference (TD) learning is a type of reinforcement learning for solvingdelayed-reward prediction problems. Unlike supervised learning, which measureserror between each prediction and target, TD uses the difference of two successivepredictions to learn that is Multi Step Prediction. The advantage of TD learning is thatit can update weights incrementally and converge to a solution faster [12-13]. In adelay-reward prediction problem, the observation-outcome sequence has the form
where each is an observation vector available at time
and z is the outcome of the sequence. For each observation, the learningagent makes a prediction of z, forming a sequence: Assuming the
learning agent is an artificial neural network, update for a weight w of the networkwith the classical gradient descent update rule for supervised learning is:
Where is the learning rate, E is a cost function and is the gradient vector. A
simple form of E can be

Robust and Adaptive Load Frequency Control of Multi-area Power Networks 325
Where and z have been described at above. From equations (2) and (3), will
be calculated as follows:
In [14] Sutton derived the incremental updating rule for equation (4) as:
To emphasize more recent predictions, an exponential factor is multiplied to thegradient term:
Where This results in a family of learning rules, with constantvalues of But there are two special cases:First, when equation (6) falls back to equation (5), which produces the sametraining result as the supervised learning in Equation (4).Second, when equation (6) becomes
Which has a similar form as equation (4). So the same training algorithm forsupervised learning can be used for TD(0).
3.2 TDMLP Neural Network
Multilayer perseptrons are an important class of neural networks that have beenapplied successfully to solve some difficult and diverse problems by training them ina supervised manner with some learning algorithms such as error correction learningrule, delta rule and etc. The classical generalized delta rule for multi-layerfeedforward network is [15]:
Where is a m × n weight matrix connecting layer l – 1 and l, m is the size of
layer l – 1 and n is the size of layer l, is the learning rate (a scalar), is
transpose of the column vector which is the output in layer l – 1, is a column
vector of error propagated from layer l to l – 1, l = 0 for the input layer. For output

326 F. Rashidi and M. Rashidi
layer and for hidden layer the vector of backpropagated error, is deferent and
defined as:
Where is the derivative of transfer function, in layer l, is the weighted
sum in layer l, is the delta value backpropagated from the upper layer of layer l, denotes the element-wise vector multiplication, T is the target vector, Z is the output
vector. To applying TD learning to the multi-layer feedforward network, we extractthe term (T – Z) from the original and obtain the as a new delta rule. So we
define as:
Where diag is the diagonal matrix and 1 is the output layer. If l is a hidden layer,
equation (11) can be written as:
With the new delta, equation for change of each weight is rewritten as:
Where is the jth element in vector and is the ith element in vector
Unlike the original delta which is a vector backpropagated from an upper to a
lower layer, now the new delta, is a m × n matrix where m is the size of output
layer and n is the size of layer l. The error term (T – Z) is needed for calculation ofevery weight increment. Comparing gradient decent in supervised learning inequation (5) and the backpropagation with new delta in equation (11) the
gradient term at time t for weight is:
Where is the ijth element in the weight matrix at the time t. By
substituting this result to the formula of learning in equation (7), we have:
Where is the matrix of increment of weight connecting layer l and l – 1 for
prediction The term inside summation is called the history vector, denoted

Robust and Adaptive Load Frequency Control of Multi-area Power Networks 327
We now obtain updating rules of TD learning by backpropagation. The
weight update is performed by equation (15) with the new delta.
3.3 Training Procedure
Compared to the original backpropagation algorithm, the new procedures forlearning requires some more storage for keeping the following values:A. The previous output vector, at time t, which is used in computing every
weight change.B. The history vector, for each weight-
connecting ith node in layer l – 1 to jth node in layer l. It has the same size as theoutput vector. Each weight shall have its own history vector. The training procedureinvolves 3 stages (at time t):
1. Feedforward: calculation of new prediction
2. Weight update: calculation of weight increments by equation (15) using thehistory terms at time t – 1.
3. Backprop: calculation of the new deltas at time t + 1;, for each layer l, startingfrom the output layer. The history term is updated by:
4 Design of TDMLP Neural Network for Power System LFC
The objective of the controller design in interconnected power system is damping ofthe frequency and tie-line power deviations oscillations, stability of the overall systemfor all admissible uncertainties and load disturbances. Fig.2 shows the block diagramof the closed-loop system, consists of TDMLP controller. The simulation results on asingle machine power system show that the performance of MLP neural network ismuch better than conventional PID controllers. Therefore, for the design of thenonlinear LFC controller in two areas power systems the MLP neural network isbeing used. Since the objective of LFC controller design in interconnected powersystem are damping the frequency and tie-line power deviations with minimizingtransient oscillation under the different load conditions. Thus, frequency deviations,tie-line power deviations and the load perturbation are chosen as MLP neural networkinputs. Moreover, in order to evaluate the control signal (u), the MLP neural networkcontroller makes use of a piece of information which is not used in the conventionaland modern controller (an estimate of the load perturbation
In general, the load perturbation of the large system is not directly measurable.Therefore, it must be estimated by a linear estimator or by a nonlinear neural networkestimator, if the nonlinearities in the system justify it. Such an estimator takes as

328 F. Rashidi and M. Rashidi
inputs a series of k samples of the frequency fluctuations at the output of the generatorand estimates the instantaneous value of
the load perturbation based on this input vector. The implementation of such anestimator is beyond the scope of this paper. Here, we assume that the load estimate
is available, i.e. Thus, frequency deviations, tie-line power
deviations and the load perturbation are chosen as the MLP neural network inputs.The outputs of the neural network are the control signals, which are applied to thegovernors. The data required for the MLP neural network training is obtained fromthe TDL design in different operating conditions and under various load disturbances.
5 Simulation Results
For small sampling time, it can be shown that the discrete-time model is almost thesame as the continuous-time model. Hence, the simulations have been carried out inMATLAB software using continuous-time domain functions. In this study, theapplication of TDMLP neural controller for LFC in two areas power system isinvestigated. The performance of this method is compared with the RBF neuralcontroller and PID controller, which has been widely used in power system.
Fig. 2. Block-Diagram of the TDMLP neuralnetwork applied to LFC
Fig. 3. The performance of controllers withnominal parameters
Fig. 3 to 5 depicts performances of the TDMLP, RBF and PID controllers whendifferent load step disturbances in two areas are applied to the system. Fig.3 showsthe tie-line power deviations when a 2% and 0.5% load step disturbances are appliedin areas 1 and 2, respectively. Fig.4 shows the performances of controllers withapplying a 0.5% and 1.5% load step disturbances to 1 and 2 areas, respectively,whereas the parameters are decreased from their nominal values to the minimumvalues. Fig.5 shows the responses of the controllers when the parameters areincreased from their nominal values to their maximum values and a 2% and 0.8% loadstep disturbance are applied to 1 and 2 areas, respectively.

Robust and Adaptive Load Frequency Control of Multi-area Power Networks 329
To show the performance of the proposed controller, we run several tests, not shownhere. The obtained simulation results show that the proposed TDMLP neural networkis very effective and not only has good performance, even in the presence of the GRC,but also ensures the stability of the overall system, especially when the parametersand the operating conditions of the system are changed.
Fig. 4. The performance of the controllers for frequency deviations with minimum parameters
Fig. 5. The performance of the controllers for frequency deviations with maximum parameters
From these figures, it is seen that the proposed method is superior compared to othercontrollers against to increasing of the step load disturbances in the areas of powersystems, especially when the system parameters are changing.
6 Conclusion
This paper showed an application of the neural network to automatic generationcontrol in the power system. In this paper, a TDMLP neural network load frequencycontrol was proposed to improve the performance and stability of the power system.This control strategy was chosen because the power systems involve many parametricuncertainties with varying operating conditions. In this work, transient behavior of thefrequency of each area and tie-line power deviations in the power system with two

330 F. Rashidi and M. Rashidi
areas is considered under any load perturbations in any area. The simulation resultsshowed that proposed controller is effective and can ensure that the overall systemwill be stable for all admissible uncertainties and load disturbances, also The TDMLPcontroller can achieve good performance even in the presence of GRC, especiallywhen the system parameters are changing. And the performance of the proposedcontroller is better than RBF neural network and PID controller to the loaddisturbances at any area in the iaterconnected power system.
References
[1]
[2]
[3]
[4]
[5]
[6]
[7]
[8]
[9]
Tetsuo Sasaki; Toshihisa Kadoya; Kazuhiro Enomoto, “Study on Load Frequency ControlUsing Redox Flow Batteries”, IEEE Trans. on Power Systems, pp. 1-8, 2003Young-Hyun Moon; Heon-Su Ryu; Jong-Gi Lee; Seogjoo Kim;” Power system loadfrequency control using noise-tolerable PID feedback”, IEEE International Symposium onIndustrial Electronics, Volume: 3, pp. 1714-1718, 2001el-din Azzam, M.;“An optimal approach to robust controller design for load-frequencycontrol”, Transmission and Distribution Conference and Exhibition, Vol. 1, pp. 180-183,2002Jafari-Harandi M. and S. M. T. Bathee, “Decentralized variable-structure and fuzzy logicload frequency control of multi-area power systems”, Fuzzy Logic Symposium, Malaysia,1997.Wang, Y.; Zhou, R.; Wen, C.;“ Robust controller design for power system load frequencycontrol”, First IEEE Conference on Control Application, Vol. 2, pp. 642-646, 1992Talaq, J.; Al-Basri, F.; “ Adaptive fuzzy gain scheduling for load frequency control”, IEEETransactions on Power Systems, Vol. 14, Issu 1, pp. 145-150, 1999Beaufays F. et al, “Application of neural networks to load frequency control in powersystem”, Neural Networks, Vol. 7, No.l, PP. 183-194, 1994.Shayeghi, H. A. Shayanfar, “Application of ANN Technique for Interconnected PowerSystem Load Frequency Control”, Internationa Power System Conference, PSC04,Tehran, pp. 33-40, 2003P. Dayan, “Temporal Differences: for General Machine Learning, in press,
1991R. P. Lippmann, “An Introduction to Computing with Neural Nets”, IEEE ASSPMagazine, 4-22, 1987R. S. Sutton, “Temporal Credit Assignment in Reinforcement Learning”, DoctoralDissertation, Department of Computer and Information Science, University ofMassachusetts, Amherst, 1984R. S. Sutton and A. G. Barto, “A Temporal Difference Model of Classical Conditioning”,Proceedings of the Ninth Annual Conference of the Cognitive Science Society, 355-378,Seattle, WA: Lawrence Erlbaum, 1987Perlovsky L.I., “Emotions, Learning and control,” proc. of IEEE Int. symp. On Intelligentcontrol/Intelligent systems and semiotics, Cambridge MA, pp. 132-137, 1999R.S.Sutton, “Learning to Predict by the Methods of Temporal Differences,” MachineLearning, 3: 9-44, 1988D.E.Rumelhart, G.E.Hinton, and R.J.Williams, “Learning Internal Representations byError Propagation,” Parallel Distributed Processing (PDP): Exploration in Microstructureof Recognition (Vol. 1), Chapter 8, MIT Press, Cambridge, Massachusetts, 1986
[10]
[11]
[12]
[13]
[14]
[15]

Rule Based Neural Networks Construction forHandwritten Arabic City-Names Recognition
Labiba Souici, Nadir Farah, Toufik Sari, and Mokhtar Sellami
Departement d’informatique, Laboratoire LRIUniversity Badji Mokhtar BP 12 Annaba
Abstract. A recent innovation in artificial intelligence research has been theintegration of multiple techniques into hybrid systems. These systems seek toovercome the deficiencies of traditional artificial techniques by combiningtechniques with complementary capabilities. At the crossroads of symbolic andneural processing, researchers have been actively investigating the synergiesthat might be obtained from combining the strengths of these two paradigms. Inthis article, we deal with a knowledge based artificial neural network forhandwritten Arabic city-names recognition. We start with words perceptualfeatures analysis in order to construct a hierarchical knowledge base reflectingwords description. A translation algorithm then converts the symbolicrepresentation into a neural network, which is empirically trained to overcomethe handwriting variability.
1 Introduction
Nowadays, artificial neural networks (ANNs) are widely used in different fieldsespecially to find a response to the challenge of automatic pattern recognition [4] buteven today’s most powerful computers are unable to reach human performance.Neural networks have been heavily researched and many architectures and trainingtechniques have been proposed. ANNs can be basically categorized into two types:
Those where each neuron corresponds to a specific concept, working mode is fullyexplainable and with no learning phase. They thus fall into the category of trans-parent systems or networks with local representation [5].Those where a concept is distributed over several neurons, working mode isopaque and learning is done by adaptively updating weights of their connections.They are thus called black box systems with distributed representation [5].
Most of the networks used for pattern recognition are distributed ones [4]. They showadvantages for gradual analog plausibility, learning, robust fault-tolerant processingand generalization. However, there is not yet a problem independent way to choose agood network topology. Learning phase is intensive, time consuming and needs a
C. Bussler and D. Fensel (Eds.): AIMSA 2004, LNAI 3192, pp. 331–340, 2004.© Springer-Verlag Berlin Heidelberg 2004

332 L. Souici et al.
large database. Moreover, it is difficult to explain the networks behavior and toanalyze the origin of their errors.On the other side of modeling a mind by ANNs, making a mind can be achieved bysymbolic approaches. Their representations have advantages of easy interpretation,explicit control, fast initial coding, dynamic variable binding and knowledgeabstraction. This approach is not adapted to the approximate or incompleteinformation processing so the theoretical knowledge must be at a time correct andcomplete and its processing is sequential.Both symbolic and neural paradigms have their own advantages and deficiencies.Most importantly, the virtues of one approach could compensate the deficiencies ofthe other.In recent years, the research area of symbolic and neural hybridization has seen aremarkably active development. Furthermore, there has been an enormous increase inthe successful use of hybrid intelligent systems in many diverse areas [7, 20].Our research addresses Arabic handwriting recognition, in previous works we haveused neural nets with distributed representation for character recognition [13] andlocal representation for word recognition [15].In this paper, we deal with the combination of both approaches (symbolic andconnectionist) in building a knowledge based artificial neural network (KBANN)system for Arabic handwriting city-names recognition.The following sections introduce a general state of the art on mail sorting then anoverview on the proposed system architecture is presented. A focus is done on featureextraction and recognition steps in sections 4 and 5. At the end of the paper,experimental results are discussed and future directions are highlighted.
2 State of the Art of Mail Sorting
The postal address reading is considered as the most successful applications of patternrecognition [12, 17]. They are writer independent, off-line systems processing largevocabularies (several thousands of words). However, the redundancy existingbetween the city name and the zip code can be exploited to improve theirperformance. A great amount of mail is processed every day by the postal services inthe world. As an example, in 1997 the US Postal Service processed about 630millions of letters per day [16]. With this large quantity of mail the use of automaticsystems for postal addresses sorting is therefore primordial. The text to extract caninvolve: zip code, city name, street number and name, postal box, etc. These data canbe in printed, isolated handwritten or cursive forms. Components of mail sortingsystem are: image acquisition, address field localization, text reading and finally thedetermination of the mail destination. The localization of the address field includes,[2, 3, 6, 16], a pre-processing step : thresholding and binarization, segmentation inlines and in bounding boxes [9] and a segmentation-detection step of the way numberand name, apartment number, postal box, city and country names, etc. The addressdetermination, i.e. final customer or local delivery point, consist in recognizinglocalized units such as characters, words, punctuations, etc. and to interpret therecognized symbols according to the data base of valid addresses. For character and

Rule Based Neural Networks Construction 333
word recognition, all known techniques of pattern recognition can be applied.Nevertheless, the more investigated seems to be statistical methods such as K nearestneighbours (KNN), Hidden markov models (HMM), artificial neural nets (ANN) etc.Srihari in [16], implemented several classifiers: a structural, a hierarchical, a neuronaland a template matching based recognizers individually and in combination forcharacter recognition, then he developed an HMM module for word recognition. In[3], HMM letters are combined in HMM words for the recognition of way names inFrench postal addresses.All the above techniques and many others are operational in commercialized systemsall around the world but they are generally dedicated to roman or Asian scriptprocessing. Nevertheless, no such system exists for Arabic script, in spite of the factthat more than 20 countries use it.
3 General Architecture of Our System
In this paper, we propose a KBANN based system for handwritten city-namesrecognition in Algerian postal addresses (fig. 1).
Fig. 1. General architecture of the system.
3.1 Acquisition and Preprocessing
Addresses are acquired in gray levels at 200DPI (dots per inch) resolution. We applyon each image a median filter with 3x3 window as structuring element in order toeliminate the background and reduce the noise. A mean local thresholding operationtransforms the image to a binary matrix (1 for the text and 0 for the background) [2, 6,10].
3.2 City Name Localization and Extraction
We extract the writing of the line which containing the city name and the zip code (itis generally the line before the last one). To localize the city name, we use a techniquebased on word gap statistics [6]. We compute gaps between connected componentsextracted by vertical projections of the whole address. The gap mean value is used assegmentation threshold. Gaps greater than the threshold represent word-gaps. Themore closely connected component to the left corresponds to the zip code while theright ones correspond to the city name, heart of our concern. Arabic text is written andread from right to left and a city name can be composed of several words. Thismodule generates a lit of words corresponding to the city name for the featureextraction module.

334 L. Souici et al.
4 Feature Extraction
Among the 28 basic arabic letters, 6 are not connectable with the succeeding letter,thus, an Arabic word may be decomposed into sub-words, High or low secondarycomponents exist for 15 letters which have one to three dots. Some of these charactershave the same primary component and differ only by the position and/or the numberof dots. We can also find loops, ascenders and descenders in arabic writing [1] (seefigure 2).Evidence from psychological studies of reading indicates that humans use perceptualfeatures such as ascenders, descenders loops and word length in fluent reading [8].Algorithms based on word shape features are often said to be holistic approach, asopposed to analytical ones that determines the identity of the word from itscharacters.
Fig. 2. Features in the word
Our previous experiments with holistic arabic literal amounts recognition [14, 15]proved the usefulness of perceptual features and diacritical dots.In this work, the same set of features is retained and extracted by contour tracing andFreeman chain coding [11]. The features used to describe the 55 words of Algeriancity names lexicon are shown in table 1, with their number of possible occurrences.
Ideally, the considered lexicon is described by a set of features (see table 2) orderedas in table 1.

Rule Based Neural Networks Construction 335
For example, the description of the word (Table 2, word N :20) is 2-110-11100,this means that this words has: 2SW-1A, 1L, 0D, 1SHD, 0SLD, 1DHD, 0DLD, 0TPH(see table 1 for the used abbreviations).
5 Design of KBANN Classifier
The designed classifier is inspired by the KBANN approach (Knowledge BasedArtificial Neural Network) developed by Towell in 1991 and tested in the fields ofmolecular biology, DNA sequence analysis and process control. Towell presentedtheoretical and experimental validations of his approach. KBANN results were betterthan eight other empirical and hybrid approaches [18, 19].Theoretical knowledge expressed by rules is used to determine the initial topology ofthe neural network. The network is then refined using standard neural learningalgorithm and a set of training examples.

336 L. Souici et al.
Fig. 3. Knowledge base and neural network integration
In our approach, we have used the KBAN integration depicted in fig 3. It is thereforenecessary to:1. Construct a knowledge base describing the words with their features. The rule sets
must be hierarchically structured.2. Translate the rules into a neural network with a translation algorithm.3. Refine the neural network with an empirical learning process (back-propagation
algorithm).
5.1 Knowledge Base Construction
Study of the extracted features (section 4) is used to create a hierarchical classificationfor words in the considered lexicon and to deduce (from table 2) a set of rules havingthe following form:
To illustrate each rules level, we only give an example concerning the word shown infig 2. (see table 1 for the used abbreviations).Level 1 rules : contains 5 rules defining word classes Ci according to their sub-wordsnumber (the sub-words separation is generally done by writers).
Level 2 rules: contains 41 rules defining word sub-classes according to theirascenders, loops and descenders numbers.
Level 3 rules : contains 55 rules defining word sub-sub-classes according to theirdiacritical dots numbers.
5.2 Rules to Network Translation
A translation algorithm transfer’s theoretical knowledge (symbolic rules) towards anANN. Fig 4 shows relations between a set of rules and an ANN. This way of definingnetworks avoids some of the problems inherent to ANNs and empirical learning. Theinitial architecture of the network is obtained in an automatic way and we don’t haveany more worries to determine the number of layers, neurons and interconnections.Besides this, rules give to the network an initial knowledge and represent dependencyrelations between the input attributes and the desired answers.

Rule Based Neural Networks Construction 337
Fig. 4. Correspondences between knowledge base and neural network [19]
Table 3 briefly describes the four steps of the used translation algorithm.
The obtained initial architecture of the network is probably more close to the final onethan any random configuration of weights. Thus, the random initialization of weightsand its negative consequences on the training phase can be controlled and minimized.Towell showed in his research [18, 19] that this type of approach reduces the trainingtime and the number of examples to really learn.

338 L. Souici et al.
5.3 Neural Network Architecture and Training
The obtained network has the following architecture:An input layer with 34 neurons representing the set of chosen features with theirpossible occurrences (see Table 1).Two hidden layers: the first contains 5 neurons and the second 41 neurons (seesection 5.1).An output layer with 54 neurons corresponding to the 55 words of the city-namelexicon. Note that there is a feature discrimination problem between words n°:7and 8 (in table 2). We assume that they correspond to the same output neuron. Thisambiguity can be solved later by zip code confrontation.
The network obtained from symbolic rules can be trained on classified examples torefine the knowledge previously introduced in the network, using back-propagationalgorithm.
6 Results and Discussion
In addition to the application of KBANN approach for the considered problem, wehave also implemented a standard multilayer perceptron (MLP). The latter has thesame inputs and outputs as the former but it has only one hidden layer which size isheuristically determined and experimentally adjusted. KBANN and MLP classifiersproperties and results are summarized in table 4.

Rule Based Neural Networks Construction 339
Table 4 highlights the strengths of the KBANN compared to classical MLP forhandwritten Arabic city-names recognition. It shows that KBANN training isaccelerated and needs fewer examples. During testing phase, KBANN generalizesbetter than MLP on the same test set.
7 Conclusion and Future Work
In this article, we proposed a hybrid neuro-symbolic (KBANN) system for therecognition of handwritten city-names in Algerian postal addresses. The perceptualfeatures analysis led to the construction of a hierarchical knowledge base reflectingwords description. A translation algorithm converted the symbolic representation intoa neural network then, an empirical learning phase was necessary to overcome thevariability of writing and ill-detected features.
Neuro-symbolic integration supports the thesis that a system which learns from boththeory and data can outperform a system that learns from theory or data alone. Theobtained results for our application verify this hypothesis.The knowledge insertion (rules) into the network solves the problems related toarchitecture specification and weights initialization in neural networks. It acceleratessignificantly the training process by setting initial connection weights on the basis ofthe domain theory rather than at random, thus the convergence is guaranteed in duetime. We experimentally verified this assumption and we noticed that training takesabout 10 times less than randomly initialized multilayer neural network.
The network structure given by the rule-to-network translation has a directcorrespondence with the original set of rules. The intermediate concepts arepreserved.The network training can be achieved on a smaller set of examples since the initialnetwork can code theoretical knowledge. In addition, the rules are clearly presented inthe network and they explain its behavior versus the MLP black box.Some future directions are suggested below to further improve our work:
The insertion of fuzzy concepts within the rules may be interesting due to thehandwriting fuzzy nature.The combination of KBANN with other kinds of simple and hybrid classifiers forthe same application in order to improve recognition accuracy.The implementation of a complete multilingual (Arabic, Latin) addressesinterpretation system including the script identification and the processing of alladdress components.
References
1. Amin A: Off-line arabic character recognition: The state of the art. Pattern Recognition,Vol 31, N°5 (1998) 517-530

340 L. Souici et al.
2.
3.
4.5.
6.
7.
8.
9.
10.
11.
12.
13.
14.
15.
16.
17.
18.
19.
20.
Bennasri A., Zahour A., Taconet B.: Arabic script preprocessing and application to postaladdresses. ACIDCA’2000, Vision & Pattern Recognition, Monastir, Tunisia (2000) 74-79Bertille J.M., Gilloux M., El Yacoubi A. : Localisation et reconnaissance conjointes denoms de voies dans les lignes distribution des adresses postales. SRTP/RD/Traitementautomatique ligne distribution, Transition n°7 (1994) 16-25Bishop C. M.: Neural networks for pattern recognition. Clarendon Press, Oxford (1995)Côté M., Lecolinet E., Suen C.Y.: Automatic reading of cursive scripts using a readingmodel and perceptual concepts: The percepto system. IJDAR: International Journal onDocument Analysis and Recognition, Vol 1 (1998) 3-17Dowton A.C., Leedham C.G.: Preprocessing and presorting of envelope images forautomatic sorting using OCR. Pattern Recognition, Vol. 23, n°. 3/4 (1990) 347-362Hilario M.: An overview of strategies for neurosymbolic integration. In: Sun R. &Alexandre F. (Eds.). Connectionist-Symbolic Integration: From Unified to HybridApproaches, Chapter 2., Lawrence Erlbaum Associates (1997)Madhvanath S., Govindaraju V.: The role of holistic paradigms in handwritten wordrecognition. IEEE Transactions on Pattern Analysis and Machine Intelligence, Vol 23,N°:2, February (2001)Mahadevan U., Srihari S.N.: Parsing and recognition of city, state and ZIPcodes inhandwritten addresses. ICDAR’99 (1999) 325-328.Otsu N.: A threshold selection method from gray-level histogram. IEEE Transaction onimage processing (1979) 62-66Pavlidis T.: Algorithms for Graphic and Image Processing”, Rockville, MD : Computerscience press (1982)Plamondon R. and Srihari S.N.: On-line and off-line handwritten recognition: acomprehensive survey. IEEE Trans. on PAMI, Vol. 22, n°. 22 (2000) 63-84.Sari T., Souici L., Sellami M.: Off-line Handwritten Arabic Character Segmentation andRecognition System: ACSA-RECAM. IWFHR’2002, 8th International Workshop onFrontiers in Handwriting Recognition, Niagara-on-the-Lake, Ontario, Canada, August(2002)Souici L., Aoun A., Sellami M.: Global recognition system for Arabic literal amounts.International Conference on Computer Technologies and Applications, ICCTA’99,Alexandria, Egypt, August (1999)Souici-Meslati L., Rahim H., Zemehri M. C Sellami M. Système Connexionniste àReprésentation Locale pour la Reconnaissance de Montants Littéraux Arabes.CIFED’2002, Conférence Internationale Francophone sur l’Ecrit et le Document,Hammamet, Tunisie, Octobre (2002)Srihari S. N.: Recognition of handwritten and machine printed text for postal addressinterpretation. Pattern Recognition Letters: Special issue on postal processing andcharacter recognition, Vol 14, N°: 4, April (1993) 291-302Srihari S.: Handwritten address interpretation: a task of many pattern recognitionproblems. Int. Journal of Pattern Recognition and Artificial Intelligence, 14 (2000) 663–674Towell G. G., Shavlic J. W.: Knowledge-based artificial neural networks. ArtificialIntelligence, Vol 70 (1994) 119-165Towell G. G.: Symbolic knowledge and neural networks : insertion, refinement andextraction. PhD thesis, University of Wisconsin, Madison, WI (1991)Wermter S., Sun R.: Hybrid neural systems. Springer (2000)

A Generic E-learning Engineering FrameworkEmbracing the Semantic Web
Johannes Lischka and Dimitris Karagiannis
University of Vienna, Inst. for Computer Science and Business Informatics, Dept. ofKnowledge Engineering
A-1210 Vienna, Bruenner Strasse 72, [email protected], [email protected]
Abstract. E-Learning has become a serious discipline in IT supportedmanagement with the aim of enabling life-long learning. Unfortunately, E-Learning is a bottom-up based technical approach and the vision of life-longlearning is not yet reached, because it demands the existence of resource poolsas a basis enabling cross referencing of topics, skills and all other resourceswithin an organizational memory. Fortunately, new technologies coming fromthe Semantic Web and Web-Services communities will be able to overcomesome of the hindering technical obstacles providing interoperability betweendifferent platforms and programming paradigms so that resources can bepersonalized and presented on arbitrary clients. This paper embraces thesetechnologies and presents a generic E-Learning Engineering approach that fitsthem into a top-down IT-supported management framework so that businessgoals may be transformed into a technical environment. Furthermore, thisapproach also sets grounds for closing the gap to E-Business (e.g. PerformanceManagement like the Balanced Scorecard).
1 Introduction and Motivation – The “Technical” Dilemma
E-Learning is one of the many E-technologies that emerged on the verge of thecentury promising life-long learning for everyone with perfect integration into anorganizational or global memory. “Learn wherever and whenever you want” seems tobe the slogan.
But like many other Information Technology (IT) related disciplines, E-Learningapplications lack the ability to bridge the gap between organizational and technicalrequirements which one may call a “technical” Dilemma. Hence, strategic demandsfor integrated methodologies with support for organizational and technicalmanagement methods are neglected. Unfortunately, isolated and non-standardsequipped applications are created that bear the tendency to get monolithic legacyapplications.
This paper gives a comprehensive overview of the existing E-Learning landscapetrying to assemble an engineering stack (layered approach) for E-Business integratedE-Learning with Semantic Web technologies. The approach is three-fold and resultsin a holistic E-Learning Engineering Framework. First, existing E-Learning standards
C. Bussler and D. Fensel (Eds.): AIMSA 2004, LNAI 3192, pp. 341–350, 2004.© Springer-Verlag Berlin Heidelberg 2004

342 J. Lischka and D. Karagiannis
and specifications are surveyed and are fitted into a broader Engineering stackincluding Business Orchestration and Web-Services execution. Second, this technicalE-Learning Engineering Framework needs to be linked into a Business Methodology.These two issues will be scrutinized in Chapter 2. Third, Chapter 3 takes the theoryinto action and presents a conceptual E-Learning Engineering Framework based onthe ADVISOR Modeling Framework. Finally, Chapter 4 looks into the future of E-Learning and especially points out the requirements posed by the EuropeanCommission on federal governments within the E-Learning Action Plan.
The aim of this paper therefore is to reverse the “technical” Dilemma in E-Learning by introducing an organizational-driven top-down discipline that issupported by IT with the help of an engineering approach [1]. The so called E-Learning Engineering Framework takes most of its wit from existing BusinessEngineering [2] ideas transferring it into the domain of E-Learning. With the help ofE-Learning Engineering it should be possible to fit learning management into anorganizational framework. Like many disciplines in the usual business – procurement,supply-chain management, accounting, etc. – E-Learning also needs to fit into aglobal strategy in order to measure and increase general efficiency [3].
2 Proposed Solution to the “Technical” Dilemma
As already pointed out, the solution to solving the dilemma in E-Learning is theintroduction of a top-down engineering approach called E-Learning Engineering. E-Learning Engineering can be defined as applying Software Engineering toinstructional design [4] or as “methods and techniques that deal with the creation ofE-Learning applications”[5].
It also is responsible for managing and engineering the organizational ResourcePool that is the foundation for E-Learning Engineering.
2.1 Description of the E-learning Environment: E-learning Modeling Methods
Modeling Methods on a technical level in terms of reuse and interoperability may berepresented in two different ways syntactically: in XML [6] or in the syntax of theResource Description Framework (RDF) [7].
The motivation to use (Semantic Web) ontologies based on RDF syntax (andrelated ontology languages like OWL [8]) is simple: RDF is a network-basedrepresentation formalism based on Subject-Predicate-Object triples (statements) thatembraces the ideas of object-orientation and resource sharing and therefore is muchmore powerful than hierarchic XML. Furthermore, RDF identifies resources withUniform Resource Identifiers (URI) and is not restricted to documents like XML [9].The most highly developed Modeling Method in E-Learning is the RDF-binding ofthe Learning Objects Metadata (LOM) information model [10].
Another striking argument to choose RDF as underlying syntactical model is thelevel of acceptance within the Semantic Web community and the fact that alsosemantic standards seem to emerge bringing LOM and the Dublin Core MetadataElement Set (RDF-binding) [11] closer [12].

A Generic E-learning Engineering Framework Embracing the Semantic Web 343
2.1.1 Existing E-learning OntologiesSo far, E-Learning ontologies have also been developed with a bottom-up approachdeciding first about technical aspects of how to map information models to a technicalbinding. Concrete examples are complex and rare [12, 13]. Modeling Methods fordescribing other resources taking part in E-Learning are only poorly developed at thispoint of time. The Dublin Core Metadata Element Set or the vCard RDF-binding [14]are possibilities to express other relationships. But specific RDF-bindings for LearnerProfiles (e.g. Reusable Competency Definitions [15]) do not exist1.
2.1.2 Querying Ontologies and the Connection to Web-ServicesWith the use of RDF a Semantic Web for E-Learning is in the near grasp and alsoembraces the concept for a Service-oriented Architecture (SOA) and currentlyevolving Web-Services. This new architecture moves away from classical monolithicand proprietary Client-Server applications to interoperable Peer-to-Peer services usingglobally distributed Resource Pools.
The only drawback to realizing such a scenario is the immaturity of thedevelopment of RDF query interfaces. In order to answer simple questions like“Which is the best Learning Object for a set of arbitrary restrictions?” or “WhichLearning Objects fit a Learner’s Profile?” or more complex questions like “What aremy tasks to fulfill the curriculum this term?” or “Is the University doing wellaccording to the strategy” powerful Application Programming Interfaces (API) needto be provided in order to exchange knowledge coming from different ontologies.
2.1.3 Overview of Existing E-learning Modeling MethodsDespite of XML related drawbacks – efforts already exist to implement RDF-bindings[16, 17] – the information models of existing standards and specifications should besufficient to create a framework of layers that shows the different levels of abstractionin E-Learning.
The so-called E-Learning Framework is depicted in Figure 1 and is input to themore global E-Learning Engineering Framework characterized in Chapter 3 (theLearning Resources Sequencing Layer is part of the proposed E-LearningEngineering Framework, see Figure 3).
2.2 Integration of E-learning into the Business Strategy and Methodology
Chapter 1 already pointed out the tight coupling of a layered framework approachwith a methodology, i.e. “a systematic approach that yields into a predefined target”[18].
Methodologies for the procedures in E-Learning already exist, e.g. the Plato-Cookbook [19], E-Learning Strategy by Rosenberg [20], Six Steps [21], ADVISOR[22] and Courseware Engineering [23].
1 The question remains, whether other Modeling Methods (e.g. Competency Definitions) needto be taken from specific E-Learning standards, especially in the context of the SemanticWeb that per se enables interoperability among existing ontologies through RDF (or de-factostandards like LDAP).

344 J. Lischka and D. Karagiannis
Fig. 1. E-Learning Framework.
But especially in a complex context, an adequate methodology has yet to bedefined. Furthermore it is of vital importance to align E-Learning according to globalbusiness targets and Knowledge Management methodologies [24].
One of the main tasks in the future of the proposed E-Learning EngineeringFramework will cover exactly this alignment of several domain-specificmethodologies.
3 Service-Oriented E-learning Engineering Framework
The proposed E-Learning Engineering Framework has the aim of resolving theshortcomings described in Chapter 2.2. This is done primarily by introducing a top-down approach accompanied by a corresponding methodology. The use of ontologiesand Web-Services to process the modeled resources is only a technical aspect of theproblem2 – the execution of domain requirements into a technical implementation. Asthe Semantic Web and RDF seem to stand on solid grounds it was the obvious choice.
The encapsulation of different representations residing in different layers3 has gotseveral advantages: on the one hand the visualizations (models) created by ModelingMethods contain a great deal of information in a simple way so that bothorganizational and IT-expert have common grounds to talk about. On the other hand,domain experts are able to design their learning landscape independent of otherdomains. This concept of abstraction and encapsulation of domain-specific
2
3
The power of the generic E-Learning Engineering Framework lies in the openness towardscustomizable Modeling Methods that are able to cover any level of detail of an E-Learningscenario. Depending on a specific implementation, the output can be transformed into anyUnicode text-format.E.g. a Learning Process comprises higher level information than a simple learning resource.

A Generic E-learning Engineering Framework Embracing the Semantic Web 345
information was greatly successful in the Model-View-Controller concept in SoftwareEngineering. The E-Learning Engineering Framework takes these findings intoaccount, treating the rendering of information supposed for different platforms(View), the ontological resource description (Model) and the execution via Web-Services (Controller). With this conceptual approach, openness, interoperability,extensibility and the possibility to measure details residing in any layer areguaranteed.
In order to depict a holistic view for E-Leaning, the E-Learning Modeling Methodsdescribed in Chapter 2.1.3 have to be augmented with Modeling Methods (ontologies)that describe business flows and interrelations as well as technical workflows viaWeb-Services4.
The following Chapter 3.1 discusses the need for Process-orientation as conceptualbasis for describing information- and data-flows before Chapter 3.2 is dedicated to theactual E-Learning Engineering Framework.
3.1 Process-Orientation and Service-Orientation: Motivation
Process-orientation and Service-orientation are two mutual concepts. Coming fromBusiness Process Management, process flows were the organizational answer todepicting ad-hoc or standard processes over several departments of an organization.This set the foundation for automation of technical IT-services activities viaWorkflow Management Systems and created highly flexible organizational structuresthat are able to react quickly to new requirements.
The concept of messaging between peers of IT-systems that provide tiny bits ofimplementations called services is mirrored in the SOA paradigm (in contrast toClient-Server Architecture). The goal is to describe information- or data-flowsaccording to the organizational requirements that are executed with Web-Services,today’s SOA leveraging internet protocols.
A process-oriented representation Modeling Method therefore is the perfect matchto depict a chain of activities over heterogeneous resources executed withinteroperable services along a value chain. Hence, it also allows the mapping ofactivity costs for activity-based costing and evaluation (i.e. process cycle times,process costs, etc.).
The same ideas of Process-orientation can be adopted for E-Learning5.Conceptually speaking, Learning or Teaching Processes implement the organizationalflows of Business Processes and therefore depict the information- and data-flow forlearners and teachers as a top-level concept. Heterogeneous skills (Learner Profiles)and document resources (Learning Objects) can be distributed around the worldconnected by internet technologies (XML, RDF, URI, etc.) that have to be put into thecorrect context by these Learning and Teaching Processes6. An example of a LearningProcess in ADVISOR Modeling Method (see Chapter 3.2) is depicted in Figure 2.
4
5
6
The implementation of Web-Services workflows is still work in progress. A modeledexample of future implementations is depicted in Figure 2.For other approaches consider [31, 32].Both Learner Profiles and Learning Objects can be modeled as RDF resources in theADVISOR modeling tool [27].

346 J. Lischka and D. Karagiannis
Fig. 2. Process-oriented E-Learning Modeling Method.
Similar to Business Processes, Learning and Teaching Processes can be evaluatedin terms of times and costs. These quantitative measures define the interface forfurther evaluation in E-Business scenarios [28] (e.g. Performance Management withthe Balanced Scorecard).
3.2 The Service-Oriented E-learning Engineering Framework in Detail
In order to fit the E-Learning Framework into a SOA, additional layers have to beconsidered. According to [25] the following layers exist: Discovery, Contracts,Business Process/Workflow, Transactions, Choreography, Conversations, Non-functional description, XML-based messaging and Network.
The Competency and Learning Resource Pool layers from the E-LearningFramework (Figure 1) both describe static relationships and therefore reside outside aSOA. The Learning Resources Sequencing layer can be incorporated into the SOA onthe Business Process/Workflow layer. The Learning Architecture is not necessarily ofany use anymore, because architectural issues are treated by SOA itself.
Figure 3 therefore depicts the resulting E-Learning Engineering Framework.
3.3 ADVISOR’s Modeling Methods According to the E-learning EngineeringFramework
As a conclusion to the E-Learning Engineering Framework being the conceptualinput, the ADVISOR platform [22, 26] as Ontology Engineering Tool has beencustomized to visualize all of the required information via generic Modeling Methods.All relevant information ranging from Business Processes, Web-Services Workflows,Organizational Responsibilities, Learning and Teaching Processes and LearningResources can be modeled (Figure 2 is an example of a Learning Process).

A Generic E-learning Engineering Framework Embracing the Semantic Web 347
Fig. 3. The E-Learning Engineering Framework (extension of [25]).
As a test-bed to show the technical feasibility of the approach to execute theADVISOR models with Web-Services, Figure 4 [27] shows the Service-orientedapproach for handling RDF resources with arbitrary SOAP-speaking clients.
The Service Provider is the heart of the execution environment. Two entities areembedded within the provider, a Web-Services container and the learning ResourcesPool which in this case is represented by the learning resources that were modeledwith ADVISOR’s RDF Modeling Methods. The Service Requestor is able tocommunicate with the Service Provider and its linked learning resources by means ofSOAP messages.
The approach has to be extended to handle all ADVISOR models. Currently, Web-Services include simple computation of suitable Learning Objects for a given LearnerProfile.
The modular E-Learning Engineering Framework presents an open interface forexchanging measures for Performance Management techniques like the BalancedScorecard. Evaluation measures can be created for the whole model pool (e.g. ClassStatistics, Usage of Learning Objects and Conformance to Business Targets).
4 Conclusion and Future Perspectives in E-learning
E-Learning gradually matures from a monolithic technical solution to enhancelearning with IT to be a technology integrated into E-Business value chains. To reachthis goal, an open and interoperable architecture has to be introduced. Especially inthe context of complex scenarios (see Chapter 4.1) this implies the usage of SemanticWeb technologies like RDF to meta-tag Learning Resources and to provide Process-oriented models of information- and data-flow.

348 J. Lischka and D. Karagiannis
Fig. 4. Test-bed for the E-Learning Engineering Framework.
This paper suggests a so-called E-Learning Engineering Framework that satisfiesall these requirements by providing a modular and layered approach. The toolADVISOR implements the E-Learning Engineering Framework by providing relevantModeling Methods for treating RDF Learning Resources.
Finally, a test-bed showed the feasibility of this approach.
4.1 E-europe
Modular structures and Learning Resource Pools are a major demand for E-Learningas a strategic governmental issue. The European Commission forces federal Europeangovernments and solution providers into implementing the guidelines of the E-Learning Action Plan.
One clear implication is the need for an open and interoperable framework to treatthese requirements especially when thinking of the European Masters Programs [29].With the help of the E-Learning Engineering Framework, a partial solution has beenprovided already and can be seen as a platform for open discussion to fit the needs ofsuch a complex scenario.
4.2 E-business-Integrated Semantic E-learning
Technologically speaking, the main efforts for the future will be the development ofinterfaces between ADVISOR and Run-Time Environments. ADVISOR has to satisfythe interfaces existing Learning Management Systems (LMS) – at the moment theIMS Content Package format is supported – and future environments based on openLearning Resource Pools and Web-Services Workflow Engines and Intelligent Agentsfor fully automated model-driven E-Learning. The test-bed showing the results ofRDF Web-Services on different client platforms is only one dimension of ongoingdevelopments.

A Generic E-learning Engineering Framework Embracing the Semantic Web 349
Another critical issue is the integration of E-Learning into E-Business andPerformance Management. The integration of E-Learning into Enterprise ResourcePlanning (ERP) systems like SAP R/3 has to be dealt with. ADVISOR enables aProcess-oriented view on E-Learning and could manage measures for any kind of itsmodels.
4.3 Concluding Statement
The paper proposed the convergence of E-Learning, the Semantic Web and E-Business by introducing a generic Engineering approach with RDF tagged LearningObjects for a Semantic E-Learning and sets the foundation for closing the gap to E-Business and performance management by using a process-oriented paradigm.
Future work in the area of E-Learning embracing Semantic Web technologies andits use will boil down life-long learning without any borders of time or place. That isrealizing person-centered communication scenarios where researchers and studentscan work together according to their Profiles and their corresponding interestsidentified by referenced (Learning) Resources and calendar information based onSemantic Web ontologies [30].
References
1.
2.
3.
4.
5.
6.
7.
8.
8.
10.
11.
Donovan, J. J.: Business Re-Engineering with Information Technology, Prentice Hall,Englewood Cliffs, New Jersey, 1994Giaglis, G. M.: Integrated Design and Evaluation of Business Processes and InformationSystems, In: Communications of AIS Volume 2, Article 5, 1999Affeld, D.: Mit Best Practice im Supply Chain Management (SCM) zur Optimierung derWertschöpfungskette, In: Voegele, A. R., Zeuch, M. P. (Eds.), Supply NetworkManagement, Gabler Verlag, 2002Engineering E-Learning: Engineering E-Learning, http://www.elearning-engineering.com/learning/e-learning/engineering-elearning.htm, accessUniversität Oldenburg: E-Learning Engineering,http://www-is.informatik.uni-oldenburg.de/forschung/forschung_elearning_inhalt.htm,accessW3C: Extensible Markup Language (XML),http://www.w3.org/XML/, accessW3C: Resource Description Framework (RDF),http://www.w3.org/RDF/, accessW3C: Web-Ontology (WebOnt) Working Group, http://www.w3.org/2001/sw/WebOnt/,accessNilsson, Mikael, Palmer, Matthias, Brase, Jan: The LOM RDF binding - principles andimplementation, http://rubens.cs.kuleuven.ac.be:8989/ariadne/CONF2003/papers/MIK2003.pdf, accessIEEE: IEEE LTSC WG12 PAR 1484.12.4, http://ltsc.ieee.org/wg12/par1484-12-4.html,accessDCMI: Expressing Simple Dublin Core in RDF/XML,http://www.dublincore.org/documents/2002/07/31/dcmes-xml/, access

350 J. Lischka and D. Karagiannis
12.
13.
14.
15.
16.
17.
18.19.
20.
21.
22.
23.
24.
25.
26.27.
28.
29.
30.
31.
32.
Brase, Jan, Nejdl, Wolfgang: Ontologies and Metadata for eLearning, In Staab, S., Studer,R. (Eds.): Handbook on Ontologies, Springer-Verlag, 2003KMR: RDF binding of LOM metadata, http://kmr.nada.kth.se/el/ims/metadata.html,accessW3C: Representing vCard Objects in RDF/XML, http://www.w3.org/TR/2001/NOTE-vcard-rdf-20010222/, accessIEEE: WG20: Reusable Competency Definitions, http://ltsc.ieee.org/wg20/index.html,accessIMS: IMS Resource Description Framework(RDF) Bindings,http://www.imsglobal.org/rdf/index.cfm, accessIMS: IMS Content Packaging Specification,http://www.imsglobal.org/content/packaging/index.cfm, accessZschocke, D.: Modellbildung in der Ökonomie, Verlag Franz Vahlen, München, 1995Seufert, Sabine, Back Andreas, Häusler, Martin: E-Learning: Weiterbildung im Internet -Das Plato-Cookbook für internetbasiertes Lernen, SmartBooks Publishing, 2001Rosenberg, Marc J.: E-Learning: Strategies for delivering Knowledge in the Digital Age,McGraw-Hill, 2001Hall, Brandon: Six Steps to Developing a Successful E-Learning Initiative: Excerpts fromthe E-Learning Guidebook, McGraw-Hill, 2002Lischka, H., Bajnai, J., Karagiannis, D., Chalaris, G.: The Virtual Global University - TheRealization of a fully Virtual University - Concept and Experiences, In Auer, M. E., Auer,U. (Eds.): Proceedings of the workshop ICL, 2002Klein, Müge, Stucky, Wolffried: Ein Vorgehensmodell zur Erstellung virtuellerBildungsinhalte, vieweg, Wiesbaden, 2001Karagiannis, D; Stefanidis, G., Woitsch, R.: The PROMOTE approach - ModellingKnowledge Management Processes to describe organisational knowledge systems, Inproceedings of OKLC 2002 Athens, 2002Turner, Mark, Budgen, David, Brereton, Pearl: Turning Software into a Service, InComputer.org, IEEE Computer Society, October 2003BOC: ADVISOR, http://www.boc-eu.com/advisor/start.html, accessLischka, J., Karagiannis, D.: Modeling and Execution of E-Learning Resources, inConference Proceedings of the ACM SAC 2004Bajnai, J., Lischka, J.: Planning and Simulation in an E-Learning Engineering Framework,in Proceedings of the AACE EDMEDIA 2004EU Commission: The ERASMUS University Charter,http://www3.socleoyouth.be/static/en/overview/overview_erasmus_ic_reform/erasmus_university_charter_info.htm, accessLischka J. et al.: Roadmap for Reaching Semantic E-Learning - Test Cases; to appear inProceedings of ICL 2004Kraemer, W., Zimmermann, V.: Learning Life Cycle Management - Integration vonLernen in die Geschäftsprozesse,http://www.im-c.de/homepage/pdf/m_wolfgang_kraemer_volker_zimmermann.pdf,accessIMS: IMS Learning Design Information Model,http://www.imsglobal.org/learningdesign/ldv1p0/imsld_infov1p0.html, access

An Integrated Environment for Building DistributedMulti-agent Educational Applications
Tasos Triantis and Panayiotis Pintelas
Educational Software Development Laboratory,Department Mathematics, University of Patras, Greece{triantis, pintelas}@math.upatras.grhttp://www.math.upatras.gr/esdlab/
Abstract. In this paper, we present an integrated graphical environment, calledX-Genitor, which supports the design and the development of educational ap-plications for distance learning based on the multi-agent technology. The agentsthat participate in the educational system interact with each other in order to ac-complish the common goal of educating the trainees to a particular educationalsubject. The X-Genitor allows the author to describe, specify and design thebehavior of the produced educational application as well as to design and de-velop the appropriate learning units that will be presented to the trainee duringan educational process. An innovation of the X-Genitor architecture is that theproduced educational applications support the individualized and distancelearning through the attachment of a mobile user interface agent to each trainee.
1 Introduction
In our days distance learning tends to become one of the basic means of human edu-cation for all the ages and without upper limit on the number of students. Internet, dueto its nature, provides the base for the evolution of the distance learning if the suitablesoftware exists. So far, the traditional learning management systems (LMS) do notprovide an efficient way for the distinction of the different levels of student’s intelli-gence as well as they do not emerge adaptive abilities to the students. Being generaltools they only pay attention to the presentation technologies and not to the educa-tional method, they present static information, which is unable to be renewed and theyare based on a non-adaptable and extensible instructional strategy.
In contrast with such traditional LMS, a wide variety of academic and commercialagent construction tools (environments) have been developed such as Zeus [12] andJADE [11]. A large number of such environments can also be found in portals such as[9] and in network of excellence such as [10]. After a careful research and study of theexisting agent construction environments, we decided to implement another integratedMAS (Multi Agent System) construction tool based on the following perspectives.
Firstly, from author’s point of view, most of the existing construction environmentsare developing MAS for general purposes and none for educational applications.
C. Bussler and D. Fensel (Eds.): AIMSA 2004, LNAI 3192, pp. 351–360, 2004.© Springer-Verlag Berlin Heidelberg 2004

352 T. Triantis and P. Pintelas
Secondly, these environments provide a variety of tools in order to easy the agentconstruction for users that have already some or more knowledge of agent technology.Our goal is to provide authors with an easy to use authoring tool that supports thelifecycle of an educational application (such as managing instructional strategy, man-aging educational content, publishing educational application), and requires noknowledge of agent technology which is achieved via a graphical formal model thatencapsulate well known agent theory such as BDI [1].
Thirdly, from the software engineering point of view, in contrast with the existingenvironments, X-GENITOR’s goals and features is the support of all main phases ofsoftware development (such as design, validation, documentation and applicationproduction), which is achieved via an Intermediate Design Representation (IDR) thatis produced during the design and it is used along to the implementation of the educa-tional application.
Thus, X-GENITOR, which is an evolution of GENITOR [3] an authoring systemfor constructing Intelligent Tutoring Systems (ITSs), gives the capability to the authorto design, specify, describe and produce a distributed educational application based onmulti-agent system (MAS) technology.
X-GENITOR involves both the technologies of intelligent agents and the distrib-uted networked applications. Multi-agent approach is suitable for educational applica-tions due to its ability of managing a very complex, dynamic, continually growing anddistributed amount of information as well as due to its confrontation of education as aset of distributed expertise’s.
The implementation of the X-GENITOR involves the production of a graphicalformal method for specifying the intelligent agents and describing their behavior,which is the mechanism that allows the agent to attend, understand the events of itsenvironment and reason about how to act. In addition, X-GENITOR uses an organiza-tional framework, which defines the interaction, the roles and authority redactionsamong agents. Finally, X-GENITOR provides the production of the intelligent agentsthrough the translation of their specifications, an inter-agent communication languageand a communication protocol.
X-GENITOR’s architecture is presented in section 2 while its functional view isgiven in section 3. Section 4 presents a use case of designing an application. In section5 an application developed with X-GENITOR are shortly presented and finally, con-clusions and future work are discussed in section 6.
2 X-Genitor Architecture
X-GENITOR is a software system, which allows the production of distributed educa-tional multi-agent applications (EMAS) using a formal specification model. X-GENITOR’s main goal is to allow a author having no knowledge of the agent technol-ogy to design the educational multi-agent application as well as to, produce the appro-priate Learning Units. A Learning Unit (LU) is considered to be the smallest educa-tional material, which will be displayed by the educational software to the trainee. Thedesign phase of the application involves the specification of (a) the instructional strat-

An Integrated Environment 353
egy that the educational system should adopt during teaching procedure; (b) the rolesand capabilities of each agent that populate the multi-agent system; (c) the inter-relations among the agents. Based on author’s design, the authoring system producesand deploys automatically the educational multi-agent system to the student.
The formal specifications model that the author uses is called AOMFG (Agent Ori-ented Multi Flow Graphs) [8], which in general is a graphical model for the formalspecification of multi agent systems, which combines strict formalism (such as inten-tional logics, modal logic etc.) and practical use by reflecting several modalities andmental notions in its structure. The model functions as a bridge between agent theoryand real agent systems. It is based on the widely used Belief-Desire-Intention (BDI)formalism. The BDI architecture constitutes the theoretical background of the modeland according to this, an agent in a multi agent system is viewed as having the threemental attitudes of belief, desire and intention.
In addition, it employs the most commonly used principles of state-based machines,programming languages, Cognitive Engineering and interaction specification models.The graphical nature of the model, which is based on the well-known High Level PetriNets, provides a friendly way for multi agent systems specification by hiding fromusers the underlying use of mathematical formalism, which may be hard to use by non-specialists.
X-GENITOR provides the ability to the author to design his/her EMAS graphicallybased on the syntax and semantics of the AOMFG. An EMAS design consists of a setof graphs ordered in a forest of tree structures. This forest of trees composes theintermediate representation of the application design (IDR – Intermediate DesignRepresentation), which is used by X-GENITOR system during the overall process ofEMAS production.
X-GENITOR’s architecture consists of the following modules as shown in Figure 1.The Graphical Agent Plans Editor takes as input the AOMFG structure and is re-
sponsible for:1.
2.3.4.
Providing the author with the appropriate graphical tools according to the selectedmodel structure,Depicting the graphical design,Checking the design’s syntax,And interpreting the set of graphs of the design into the IDR.The Validation module takes as input the IDR and provides the author with the
ability of the graphical validation of his/her design. Given an initial mark as well asrules that either are defined by the author or the AOMFG semantics, validation mod-ule depicts the control flow of the agent behavior over the graphs. During validation,author participation is needed by simulating either agent’s internal or environment’sevents that may be occurring during EMAS’s execution. Application’s environmentconsists of other applications and system resources as well as the end-user that uses it.Validation procedure may be applied to each agent separately.
The Documentation module takes as input the IDR and produces the documenta-tion of the design. The documentation consists of the graphs and the added by theauthor descriptions for each graph.
The Translator module takes as input the IDR and translates the intermediate de-sign representation into a specific programming language. The production of the

354 T. Triantis and P. Pintelas
translation is programming code, which is compiled into a self-executable file. Trans-lator module’s architecture consists of following sub-modules:
Fig. 1. X-Genitor Architecture
Programming Language translator: takes as input the IDR and produce as outputeach agent’s plans translated into a programming language. In X-GENITOR, thelanguage that was adopted is Prolog.Programming Language Compiler: takes as input the agent’s plans in the form ofprogramming code and compiles them.The Agent Deployment module is responsible for the deployment of each agent to
its physical distributed location, over the network as well as for the start up of thewhole MAS application Starting-up a distributed MAS application requires the ini-tialization of each agent separately despite of the its physical location.
The LU Editor allows the author to design and produce the appropriate LUs basedon HTML technology. A LU is a hypermedia construct of multimedia material. Inaddition, each LU is described by attributes that represent both static information usedto identify the unit (i.e. title, type, location, size, etc.) and dynamic information thatdescribes the behaviour of the unit (i.e. pedagogical prerequisites and objectives,display constraints etc.).
2.1 Agent Architecture
The translation module produces an executable agent whose architecture consists ofthe following sub-modules:
User Interface (UI): is the listener of end user’s events on agent. Depending on theinteraction between the agent and the end user (the Agent-User Interaction has beendefined by the author) the UI can either be simple or complex. In any case, during the

An Integrated Environment 355
design time, the author selects the appropriate, for the agent, UI from precompiled UILibrary.
Integration Module: is responsible for transferring environment’s events (eitheruser events or communication events) to the Compiled Agent Design module for fur-ther processing. The integration module is the Amzi Prolog’s Logic Server [14].
Communication Mechanism: is responsible for sending and receiving agents’messages. The adopted technology for the implementation of this module is CORBA[13].
Compiled Agent Design: comprises the knowledge base and the reason-aboutmechanisms of each agent. Its structure is based on the well-known BDI logicalframework where each agent is viewed as having the three mental attitudes of belief,desire and intention (BDI). In addition the three mental attitudes of BDI architecture,every agent contains a plan library. Its agent’s plans were designed by the author.
Having the first three modules pre-implemented as a separate executable applica-tion, it is possible, due to the integration module, to add different compiled (in prolog)Compiled Agent Designs and produce different ready-to-run agent applications
3 The Multi Agent Tutoring Architecture
Currently, most of the multi-agent educational systems (e.g. [4], [5]) implement (someor all) the modules of a traditional ITS as separate autonomous agents and the wholetutoring system is delivered to the learner through either a web-based user interface ora mobile agent. X-GENITOR’s developed applications comprise a tutoring architec-ture [6] on the basis of distributing both domain knowledge and expertise into severalagents, which allows the efficient management of distributed information resourcesand the dynamic synthesis of the information that is presented to the learner.
In X-GENITOR each educational application may consist of one instructionalagent and many domain expert agents, the configuration of which dynamicallychanges during the teaching process
The instructional agent undertakes the responsibility to control the information thatis presented to the trainee based on a specific instructional strategy, which is embod-ied to instructional agent’s knowledge base. This instructional strategy is implementedas a set of teaching plans; each plan is a sequence of teaching steps, each of which canbe carried out by a team of expert agents. Note that the instructional agent is onlyaware of the specialty of the domain expert agents required per plan step; it then dy-namically configures agent teams, based on the set of agents that are active within thesystem at a particular instance of time.
A domain expert agent is responsible for providing information and educationalmaterial to the trainee about its particular domain of knowledge. A domain expertcontains a set of plans for recalling and presenting information modules (LearningUnits) to the instructional agent. To this end, it is aware of the information resources,which are associated with a specific domain of the educational subject that the tutoringsystem deals with. In general, each domain expert agent can contribute a part ofknowledge or an approach in different parts or cases of the subject; then a team of

356 T. Triantis and P. Pintelas
agents can collectively teach a subject that is beyond the individual capabilities andknowledge of each of the domain expert agents. The synthesis and the management ofthe distributed expert knowledge are the responsibility of the instructional agent.
Fig. 2. The Multi Agent Tutoring Architecture
A pool of search agents undertakes the responsibility of searching for educationalmaterial through local or remote information resources on behalf of each domain ex-pert agent, who filters the results of the search according to its domain knowledge.
During each step of the teaching process, based on the instructional strategy, the in-structional agent forms a team of domain expert agents (based on the specialty andavailability of each). Vertical communication between the instructional agent and theexpert agents includes:
The request from the instructional agent to each expert agent to execute one of itsplans,The acceptance or rejection of the request by the expert agentThe response of the expert agent to the instructional agent with the informationmodules that, according to the expert agent, provide a better match to the request ofthe instructional agentMoreover, the members of each team communicate horizontally by exchanging
messages in order to best meet the tutoring objectives. Such communication may in-volve:
One expert agent requesting another expert agent to execute one of its plansOne expert agent requesting another expert agent to act as its replacement for theexecution of a planThe acceptance or rejection of the request by the expert agentThe response of an expert agent to the request of another expert agent with theinformation modules that, according to the called expert agent, provide a bettermatch to the request of the calling expert agent

An Integrated Environment 357
Then, each domain expert agent serves as a source of information (possibly synthe-sizing and) providing the appropriate educational material. In order to implement thisteaching practice, two fundamental issues have to be resolved:
Subject experts are available. They are capable of working independently, of sens-ing the educational context and of co-operating with the teacher and provide theknowledge bits he/she asks from each of themThe teaching material is structured in a way that it can be efficiently communicated.Moreover, it includes a description of its content that can be used by the teacher tosynthesize a broader courseIn order to achieve modular, open and dynamically changing behavior of the sys-
tem, the communication channel of the above architecture is an agent called Facilitator[2]. Facilitator is not involved in the teaching procedure. This is the reason why Fa-cilitator is not shown in the architecture of the educational system. The role of Facili-tator is to provide “yellow pages” services to other agents. In other words, Facilitatoris responsible for maintaining an accurate, complete and timely list of the services thata registered agent can provide. When each agent is started, his first responsibility is toregister himself and his services to Facilitator.
Each trainee accesses the application remotely through a mobile agent. The mobileagent technology was adopted in the described architecture in order to meet the fol-lowing features:1.
2.
3.
4.
5.
Distance learning: Each Mobile User Interface Agent moves through the network totrainee’s place and interacts with him/her.Individualized education: Each Mobile User Interface Agent is personalized toeach trainee in order to track his/her actions and informs the instructional agent.Reduction of network traffic. The information transmitted over the network isminimized, which has strong cost implications for devices connected by publicwireless networks.Support for disconnected operation. The mobile agent is still operational eventhough the client that it is situated on is disconnected from the network. The learn-ing procedure is partially available to the trainee through mobile agent’s cachingmechanism.Security: the mobile-agent adequately protects the tutoring system itself and LUs’copyrights through the use of encryption algorithm.
4 Designing an Application – A Use Case
The production procedure of an educational application via X-Genitor is as follows.During the design process, the author should define the number of the agents thatpopulate the applications as well as the role of each one. According to the architecturedescribed in section 3, X-Genitor supports two types of roles: the instructional roleand the domain expert role. An instructional agent is aware of the overall educationalsubject as well as of the appropriate instructional strategy that will be adopted duringteaching procedure. A domain expert agent provides knowledge, information, andeducational material about its particular domain of knowledge.

358 T. Triantis and P. Pintelas
Fig. 3. X-GENITOR’s Graphical Agent Plans Editor
Considering that each agent is constructed according to BDI architecture, via thespecification editor and the graphical formal model, the author should design eachagent’s knowledge base (beliefs, desires, Intentions) and capabilities (plans). Theinstructional strategy should be embodied into instructional agent’s plan library.
During design, author has also the ability to (1) re-use parts of plans of agents thathave already been designed previously (these plans are already been saved into X-Genitor’s plan library); (2) validate the design of each agent separately. Validationprocedure depicts the control flow of the agent behavior over the graphs. During vali-dation, author’s participation is necessary by simulating either agent’s internal orenvironment’s events that may be occurring during application’s execution. Applica-tion’s environment consists of other applications and system resources as well as thestudent that uses it.
As soon as, the author is convinced that the specification he/she gave meet to appli-cation’s scope, he/she may produce the executable multi-agent application through thetranslator.
So far, the author has specified the plans of the agents and the next step is to insertthe agents’ knowledge. With a specific editor one is able to write in a simple way theLU, which will be in an “html” form and may include apart from text, pictures andsound, video etc. In order to make the recall of information from the domain expertagents possible, the author must give apart from the LUs a meta-information in whichkey-words about what the LUs include will be mentioned.
Given that the application’s construction procedure ended, through the deliverymodule, the author may deploy either the application on a selected server machine orthe constructed LUs over local or remote LUs libraries.From trainee’s point of view, each trainee accesses the application remotely through amobile agent. As long as the trainee register himself once, through a web interface, amobile user interface agent will follow him/her wherever he/she wants tostart/continue the educational process. The mobile agent’s responsibilities are to dis-play the LUs to the student as well as to track student’s actions and to inform instruc-tional agent about them.

An Integrated Environment 359
5 Constructed Applications
X-GENITOR has been used to develop three tutoring applications in the medicaleducation field, Dermatology Tutor, CT-Scan Tutor and Orthopaedics Tutor [7]. Tra-ditional Medical Education adopts a system-oriented approach: each system of thehuman body is examined from several perspectives of medical interest. On the otherhand, any computer based medical education (CBME) software would deal not onlywith distributed, and dynamically changing knowledge, but also with the challenge ofdeploying educational services over the infrastructure of the organization. Here weshortly describe the first one.
Dermatology Tutor [7] is an educational multi agent system that teach psoriasis.Each medical discipline of the subject (e.g. physiology, anatomy, immunology, micro-biology etc.) is taught by a specialized domain expert agent. In particular, the tutoringsociety for teaching psoriasis consists of the following agents: Dermatology Agent,Histology, Physiology, Biology, Biochemistry, Microbiology, Radiology and Immu-nology agent. Each of them specializes on the corresponding medical domain and canprovide knowledge and information about the domain matters. In addition, Dermatol-ogy Agent is the instructor agent of the tutoring system and is responsible for com-posing this information by designing and applying an overall tutoring strategy which iscontained in its plans.
6 Conclusions
The construction of previous discussed applications was made by people who had noknowledge of agent technology and were experts in the medical subjects that the ap-plications deal with. During the evaluation of the X-Genitor and its applications thefollowing conclusions were emerged.1.
2.
The AOMFG graphical formal model is the key for allowing an author (non famil-iar with agent technology) to design an educational application, which will presentto the trainee educational material based on a specific instructional strategy. Thedesired strategy is embodied into the capabilities and the roles of each agent.The IDR allows the same author to validate and produce the desired application byjust pressing the appropriate button.After designing and implementing educational systems for medical education, we
are now in the process of applying the described architecture to alternative educationalsubjects. Currently, the research team is designing an application for teaching aspectsof educational software evaluation. Evaluating educational multimedia software is adifficult subject matter, since it ought to cover an extensive range of topics. It shouldbe based on a predefined set of specifications and predictable results arising from theuse of the evaluated product. This application deals with the process of evaluatingeducational multimedia software and in particular it considers the subjects of theevaluation factors and the guidelines needed for selecting and evaluating educationalsoftware.
Finally, there are two improvements/extensions that used be made to the X-GENITOR in the near future. The first one is the embodiment of a visual simulation

360 T. Triantis and P. Pintelas
tool, which will allow the author to evaluate his/her application before publishing it.The second one is based on the issue that AOMFG is a formal model for designinggeneral purposes agent application. Thus the main point that X-GENITOR should beadjusted/improved is allowing the author not only to choose but also to create his/herown roles for its agent in the application
References
1.
2.
3.
4.
5.
6.
7.
8.
9.
10.
11.
12.
13.
14.
M. Georgeff, B. Pell, M. Pollack, M. Tambe, and M. Wooldridge. The Belief-Desire-Intention Model of Agency. In J. P. Muller, M. Singh, and A. Rao, editors IntelligentAgents V Springer-Verlag Lecture Notes in AI Volume 1365, March 1999Genesereth M. R. and Ketcpel S. P. (1994). Software Agents. Communications of ACM,37(7): 48-53.A. Kameas and P. Pintelas, “The functional architecture and interacion model of a GEN-erator of Intelligent TutORing applications”, Journal of Systems and Software (JSS),36(3), 1997, pp 233-245.L Y. Deng, T. K. Shih, T. Huang, Y. Liao, Y. Wang and H. Hsu, “A Distributed MobileAgent Framework for Maintaining Persistent Distance Education”, Journal Of InformationScience And Engineering Vol.18 No.4, July 2002, pp489-506R. Silveira and R. Vicari, “Developing Distributed Intelligent Learning Environment withJADE – Java Agents for Distance Education Framework”, Proceedings of 6th Interna-tional Conference, Intelligent Tutoring Systems, Springer-Verlag Heidelberg, LNCS 2363,June 2002, pp. 105–118.A. Triantis and P. Pintelas. “A Mobile Multi Agent Architecture for Web Based Learn-ing”, In proceedings of International Conference in Advanced Learning Technologies2004, 30 August – 1 September 2004, Finland (To be appeared)A. Triantis, A. D. Kameas, I. D. Zacharakis, G. Kagadis, G. Sakellaropoulos, G. Niki-firidis and P. Pintelas, “Towards a Generic Multi-agent Architecture of Computer BasedMedical Education Applications”, proceedings 2d Panhellenic Conference “Informationand Communication Technologies in Education”, Patra, October 2000, pp. 255-264Zaharakis I. (1999). About Intelligent Agents’ Formal Specifications. Ph.D. Thesis. De-partment of Mathematics, Univ. Of Patras.UMBC AgentWeb: A Portal Related to Agents. Edited by Tim Finin & Yannis Labrou ofUMBC Cogito (http://agents.umbc.edu//)AgentLink is the European Commission’s IST-funded Coordination Action for Agent-Based Computing and is coordinated by the University of Liverpool and University ofSouthampton (http://www.agentlink.org/)F. Bellifemine, A. Poggi, G. Rimassa. Developing multiagent systems with a FIPA-compliant agent framework. In Software - Practice & Experience, John Wiley & Sons,Ltd. vol no. 31, 2001, pp. 103-128ZEUS: A Tool-Kit for Building Distributed Multi-Agent Systems Hyacinth Nwana, Di-vine Ndumu, Lyndon Lee and Jaron Collis In Applied Artifical Intelligence Journal, Vol13 (1), 1999, p129-186.OMG, Object Management Group, Agent Technology Green Paper Agent WorkingGroup, OMG Document (2000) ,Version 0.91.Steiner, T. Prolog Goes Middleware: Java-based Embedding of Logic Servers, PC AIJournal, 2001, Vol. 15 (4), pp 25-29.

A Tutoring System Supporting Experimentation withVirtual Macroeconomic Environments*
Manuel Núñez, Ismael Rodríguez, and Fernando Rubio
Dept. Sistemas Informáticos y Programación.Universidad Complutense de Madrid, E-28040 Madrid. Spain.
{mn, isrodrig, fernando}@sip.ucm.es
Abstract. In this paper we present the capabilities and behavior of thetutoring system MAS, a system to experiment with (simulations of) complexmacroeconomic environments. The users of the system may assume either therole of the State or the role of a company belonging to a specific productivesector. In fact, our system allows students to interact and modify the behavior,both in the short and long-term, of a real scale economy.
1 Introduction
One of the main disadvantages that students of Social Sciences confront is thedisability to practice with systems close enough to what they will find during theirprofessional lives. For the purpose of this paper let us consider the case of Economics.More specifically, let us take the topic of economic theory. A student will be usuallyconfronted with exercises and assignments where he has to show his command on thetheoretical models that he has learnt. A typical advanced exercise in microeconomicsconsists in calculating a general equilibrium for an economy with one producer, oneconsumer, and two goods. If we consider the macroeconomic side, students mayexpect to compute the GDP (Gross Domestic Product) according to some given data,or to discuss whether a given differential equation (with at most half a dozenparameters) adequately reflects reality. Obviously, the gap between these assignmentsand the real world is huge. In fact, students often miss to have something close to ahands on experience. Even though there exist tools to support some of the topics(most notably to analyze econometric data) they are usually very biased to numericalcalculations.
Actually, the empirical study of new political, demographic, and social systemshas been confronted with the difficulty of managing, with enough precision,environments containing a huge amount of relevant variables. Thus, the definition ofnew models has been sometimes lessened because it was difficult to verify theirvalidity. The main problem consisted, on the one hand, in the impossibility of
* Research partially supported by the Spanish MCYT project TIC2003-07848-C02-01 and theJunta de Castilla-La Mancha project PAC-03-001.
C. Bussler and D. Fensel (Eds.): AIMSA 2004, LNAI 3192, pp. 361–370, 2004.© Springer-Verlag Berlin Heidelberg 2004

362 M. Núñez, I. Rodríguez, and F. Rubio
manipulating the real environment and, on the other hand, in the disability to generaterealistic artificial environments. Hence, these fields have been favored with thecombination of powerful computers and complex simulators. This is speciallyimportant in the case of simulating the behavior of systems that cannot bemanipulated, as the economic behavior of a society. Thus, the validity of a new theorycan be contrasted by simulating the environment and by comparing the obtained andexpected results. Afterwards, by using different test values, one can estimate thebehavior of the real system in conditions that could never be applied to the realenvironment. Examples of such systems can be found in [16, 4]. In fact, together withverbal argumentation and mathematics, computer simulation is becoming the thirdsymbol system available to social scientists [12].
The development of simulators is turning Social Sciences in general, andEconomics in particular, into more inductive sciences [5]. Let us remark that thiscurrent trend is useful not only for research but also for didactic purposes. In fact,students may profit from the ability to manipulate environments that without theseprograms could not been studied. Besides, they can observe the relation among lowlevel factors (that is, the value of the corresponding variables) and high level factors(that is, the global behavior of the system). Thus, by using these simulators, studentscan have an overall vision of the considered system. In addition, they can even definenew models and contrast their utility. A good candidate to be simulated is theeconomic behavior of a society. In fact, there are already some experimentalsimulators and algorithms taking into account partial views of the economy (e.g. [3] atthe microeconomic level).
In this paper we present a new tutoring system that we call MAS (acronym forMAcroeconomic Simulator). MAS is built on top of CEES [14], which represents thecore of the tutoring system. CEES was a toy simulator in the sense that users couldinteract with an economy but were not guided out of their mistakes. However, thecomplex computations and algorithms underlying the implementation of CEES havebeen reused in the creation of MAS, which presents, in particular, new tutoringcapabilities. The main technical characteristic of MAS is that the underlyingeconomic model (i.e. the algorithm computing how the economy evolves, and that isbased on classical text books like [15]) generates a simulation that adequately reflectsthe majority of relevant macroeconomic aspects. In our tutoring system high levelbehavior (at the macroeconomic level) appears as a consequence of the interrelationbetween the different economic agents (providers of goods and providers of work)when they try to increase their own profit (microeconomic level). Actually, traditionaleconomic theory was always separating macroeconomics from microeconomics.However, it is nowadays recognized that macroeconomic phenomena cannot becorrectly explained without taking into account the microeconomic side (see e.g.[15]). Let us remark that the economic models that we consider are much morecomplex than most macroeconomics models in use. So, our system is able to explainhow the economy of a society works in a more adequate way than models found inthe literature usually focussing on one particular characteristic. As a measure of thecomplexity of the underlying economic models, MAS controls more than onethousand heterogenous variables in order to compute the current state of the economy,

A Tutoring System Supporting Experimentation 363
while most theoretical economic models control, in the most involved cases, a coupleof tens.
It is worth to point out that the current version of MAS is more than a merepassive simulator where a user observes the behavior of the economy withoutinteracting with it. On the contrary, it is an interactive system that allows a user toplay the role of the most important economic institutions (i.e. the State or a privatecompany), so that the effect of different decisions on the global economy can bechecked. Thus, adequate interfaces are provided where the relevant parameters can bemodified. For instance, if the user plays the role of an entrepreneur then he canregulate both the demanded amount of work and of raw materials, the price of hisproducts, the salaries of the workers, etc. Besides, as State, the player regulatesparameters as the progressiveness of income taxes, the indirect taxes rate, andunemployment benefits. Actually, MAS allows various users to play the role ofdifferent institutions in the same simulation (e.g. one user is the State, and severalusers represent private companies), so that the decisions of each player affect theothers. Finally, MAS provides several views of the economic behavior, by means ofgraphical representations, according to the different parameters to be considered (e.g.prices, employment levels, stocks, etc).
The rest of the paper is structured as follows. In Section 2, we describe the mainfeatures of the tutoring system MAS. We will also briefly introduce the idea ofbusiness cycle. This notion is essential to our system. For example, a student playingthe role of the state might be assigned to ease the length of the waves, while anotherplaying the role of an entrepreneur might try to take advantage of the peak of thecycle. Next, in Section 3, we comment on the algorithm underlying the behavior ofMAS. In Section 4 we give some examples of typical assignments and how they aredeveloped in MAS. In Section 5 we give some details concerning the implementationof the system. Finally, in Section 6 we present our conclusions and some lines forfuture work.
2 Main Features of MAS
In this section we explain the main functionalities of our system. The main aim ofMAS consists in providing students with an easy-to-use tool where they can practicethe knowledge previously gained in the classroom. So, students will be able to checkwhether they have fully assimilated the concepts they were supposed to. We havedesigned MAS to help undergraduate students having another (main) source oflearning (i.e. a teacher, or even a good book). However, the current system containsfeatures to provide students with some independence. Actually, taking as startingpoint the help subsystem developed for our tutoring system WHAT [6, 7], theconcepts covered by an intermediate course on macroeconomics can be documentedby means of a friendly navigation interface. Topics can be accessed in three differentways: by using an index of topics, by incremental searches, or by an alphabetic list ofkeywords.

364 M. Núñez, I. Rodríguez, and F. Rubio
In order to ensure a personalized treatment, students login into the system bygiving their ID-number and password. This allows the system to recover the data fromprevious sessions. This mechanism tries to avoid attacks to previous sessions ofstudents. For example, an attacker could ask the system for either previous or partiallysolved assignments and provide wrong answers. Then, when the real student logs in,he will find out that his economies are in a different (for worst) point.
Exercises and assignments are temporally and thematically classified according tothe underlying curriculum model. MAS offers three different categories of exercises.1
In the first category we consider exercises where students are confronted with a givensituation and they have to deduce properties such as how the situation was produced,or how it can be repaired. Since most (families of) exercises do not have a uniquecorrect answer, these exercises are solved by filling successive multiple-choice forms.Depending on the previous answers (e.g. there is big demand of raw materials) thenext form will be generated. In the second category we find exercises where thestudent gets a running economy and is asked to modify some of the parameters underhis control (e.g. if he plays the role of the state then he can modify the tax rate) tochange, in a given way, the behavior of the economy. Finally, in the last categorystudents are asked not only to modify the values of the parameters but to change theproposed economic model to vary the behavior of an economy. For example, astudent may be required to change the way in which aggregate demand is formed.
2.1 An Introduction to Business Cycles
Next we briefly present the struggling forces which provoke business cycles in realeconomies. Business cycles are patterns of growth/decrease of the economy whichrepeat themselves cyclicly. These theories are nowadays well-established in theeconomic theory literature. In order to avoid technical details we give a naïve, butintuitive, view of this concept, by considering only supply and demand. Actually,current theories of business cycles fit into this explanation (including the so-calledreal business-cycle and new Keynesian approaches) because they explain cycles byshocks in the supply and/or the demand sides (see for example [9, 1, 2] for additionalexplanations on these models).
Let us consider an economy where the demand of goods surpasses the supply. Inthis situation prices rise, so profit expectations increase. In order to boost production,entrepreneurs hire new employees. Thus, unemployment decreases, so entrepreneursare forced to rise salaries to attract new man-power. Salaries, in general, are higherand unemployed workers who found a job have a new additional purchasing power.This situation induces an increase of the aggregate demand which surpasses again therecently boosted supply. The unsatisfied demand makes prices to grow up. So, onceagain, predictions suggest an increment of profit. Entrepreneurs boost againproduction and the whole process repeats. The chain reaction is based on this viciouscircle which makes the wealth of an economy to grow constantly. We have anexpansion stage.
1 In Section 4 we present some concrete examples of typical assignments in MAS.

A Tutoring System Supporting Experimentation 365
But this process does not last forever. Economic growth lies in the fact thataggregate demand and production costs rise coupled, so that profit margins stay moreor less stable. Thus, an unbalance in this tradeoff can break the chain reaction. Ifproduction costs increase with respect to the demand then the profit of theentrepreneur is reduced. This unbalance will eventually happen in the long termmainly due to two reasons. First, good sources of natural resources will be all underexploitation. So, in order to boost production, companies will be forced to look forsome other cultivation lands or deposits which actually are not so productive. Second,the decrease of unemployment will induce an increment of salaries. These tworeasons will force entrepreneurs either to give up their business or to attempt tobalance income and costs by rising prices. In the former case, fired employees losetheir purchasing power. In the latter case, employees would reject to buy expensivegoods. In both cases we have that the aggregate demand retracts. Thus, theaccumulated stock will not be sold and employees will be fired. The rise ofunemployment will induce a decrease of salaries. Besides, unemployed people haveno more money to spend. So, the aggregate demand deteriorates even more. Thissituation forces entrepreneurs to reduce again the production and to fire more people.This process is repeated in a new chain reaction. The decreasing stage finishes whenthe retraction of aggregate demand and the reduction of production costs getunbalanced. If production costs decrease more than demand then investment willgenerate profit again. This unbalance will be induced by reasons opposed to thoseexplained above. So, the economy starts to grow and the expanding part of the cyclestarts again.
3 The Algorithm Controlling the Behavior of MAS
In this section we give some hints about the algorithm governing the economicbehavior of our simulator. As we have previously said, this algorithm was originallyintroduced in the CEES system. Thus, the interested reader is referred to [14] for adetailed explanation. Given the current state of the economy, the algorithm computesthe state of the economy in the next instant. So, time is split into steps (e.g. weeks,months, years). An iterated execution of the algorithm gives us the state of theeconomy in any arbitrary future time. We slightly depart from the usual conceptionthat economy consists of three sectors. In order to have a more precise description, wesplit the primary sector into two sectors: Alimentation and raw materials. In this case,the latter must be understood in a broad system as it contains those industries neededto assure the productive cycle of companies. That is, in addition to proper rawmaterials we consider sectors as energy, industrial machinery, industrial construction,etc. Let us remark that some of these industries are usually included in the secondarysector. Thus, we will consider four productive sectors: Alimentation, industry ofgoods, services, and raw materials. We denote the first three productive sectors bysectors of goods. The latter sector must be understood, in a broad sense, as thosematerials that are needed by companies to perform the productive process. Forinstance, it includes industries as energy, mining, heavy industry, construction, etc.
The algorithm includes 9 phases split into 20 steps. In Figure 1 we depict them.All the steps are influenced by previous ones, as all of them modify the whole state of
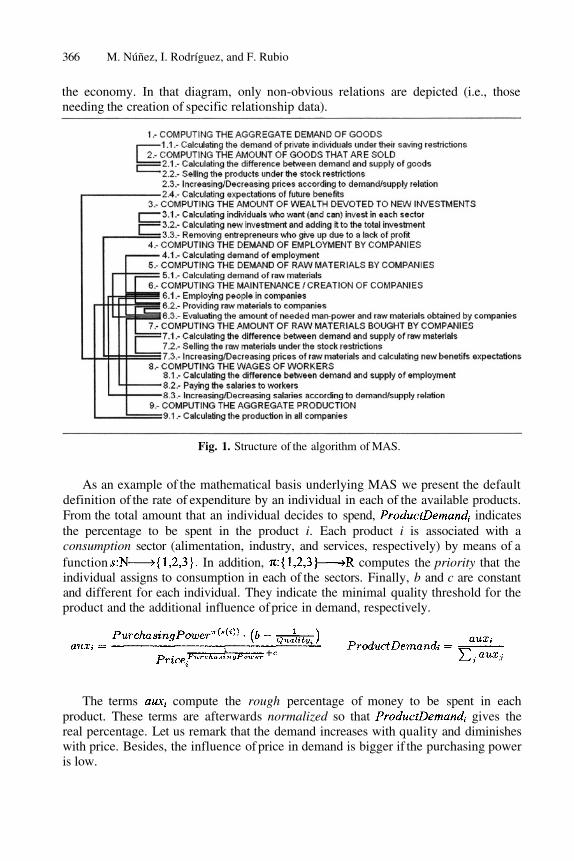
366 M. Núñez, I. Rodríguez, and F. Rubio
the economy. In that diagram, only non-obvious relations are depicted (i.e., thoseneeding the creation of specific relationship data).
Fig. 1. Structure of the algorithm of MAS.
As an example of the mathematical basis underlying MAS we present the defaultdefinition of the rate of expenditure by an individual in each of the available products.From the total amount that an individual decides to spend, indicatesthe percentage to be spent in the product i. Each product i is associated with aconsumption sector (alimentation, industry, and services, respectively) by means of afunction In addition, computes the priority that theindividual assigns to consumption in each of the sectors. Finally, b and c are constantand different for each individual. They indicate the minimal quality threshold for theproduct and the additional influence of price in demand, respectively.
The terms compute the rough percentage of money to be spent in eachproduct. These terms are afterwards normalized so that gives thereal percentage. Let us remark that the demand increases with quality and diminisheswith price. Besides, the influence of price in demand is bigger if the purchasing poweris low.

A Tutoring System Supporting Experimentation 367
4 Examples of Exercises in MAS
Even though the previous sections have described the general behavior andcharacteristics of MAS, it may not be yet clear the kind of exercises that students haveto confront. In this section we will show a couple of examples presenting typicalassignments to be solved in MAS.
The simplest assignments consists, as explained in Section 2, in trying tounderstand what is going on in a partial view of an economy. For example, let usconsider Figure 2 (left) where, in order to reduce the required space, we have deletedthe rest of the MAS graphical interface. The student has to determine which twosectors can generate such a joint behavior. First, he has to deduce that the given initialconditions were not natural enough, according to the model, so that there is a firststage of stabilization where the Economy tries to fit properly into the model (studentsknow that they have to discard the beginning of the analyzed data). Afterwards, thestable cyclic behavior begins. In order to solve the mistery, it is enough to realize thatthe sector depicted in the down part of the graphic almost follows the derivative of theother one. Thus, it easily follows (at least, we expect so! ) that the first evolutionrepresents the sector of raw materials while the second one represents the industrysector.
One of the main requirements for a good government is to soften the cyclicbehavior of the economy. Even though it will be almost impossible to avoid cycles(even undesirable) big waves produce a lot of instability and uncertainty in theeconomic agents. In fact, a very reduced form of state can help in this task. InFigure 2 (center) we show a simulation of a completely free market, while in the righthand side we present the behavior of an economy where a simple state (with no publiccompanies) collects some taxes that are used to pay low unemployment benefits.Thus, one of the assignments is to change the relevant parameters in the state (taxcollection, public expenditure, etc) so that the economy is converted from the first tothe second graphic.
We will also ask students to deal with the influence of different company tacticsin an economy. In this sense, it is worth to point out that a huge firm can stronglyinfluence the evolution of cycles. In fact, it is even possible to stop a expansion or adepression as a result of the investments of our company. Another typical assignmentregarding firm policies is to analyze the effects of price dumping. This techniqueconsists in selling products under the production costs until the competencedisappears. Once the market is controlled, the company can monopolistically act (withthe consequent increase of prices). We will give initial conditions for the firm of thestudent and we will ask him to apply this policy. He should be able to realize thatthese initial conditions are very relevant in the success of dumping. Actually, it worksonly after a minimal threshold of portion of the market was initially owned and agreat stored capital was available by the company (in order to confront the initialloses).
The last exercise that we are going to comment was created as a consequence ofour experimentation with CEES [14], the subsystem used by MAS where thealgorithm to compute the state of the economy is located. While testing the reliabilityof CEES we did not consider, by default, that strange behaviors were due to

368 M. Núñez, I. Rodríguez, and F. Rubio
conceptual errors. Actually, it is a fact that in any society almost anything can happenif the specific conditions appear simultaneously. Hence, we tried to take advantage ofthese behaviors instead of discarding them. For example, during the development ofthe simulator we found out the existence of a very rare situation where a depressionwas accompanied by an inflationary spiral. This phenomenon is called stagflation andwe were not previously aware of it. We found out that one of its possible causes isthat, due to some factors, companies are forced to increase salaries though their profitis negative. Afterwards, we compared this situation with standard behaviors, wheresalaries use to decrease in depressions. We identified the main factors provoking thisrare behavior in our model (e.g., excessive influence of the still low unemployment inthe beginning of the depression), and we corrected them. Thus, one of theassignments (at the end of the course) consists in showing an economy presentingstagflation and asking the student to take the economy out of it.
Fig. 2. Industry and Raw Materials sectors (left), completely unrestricted economy (center),and lowly restricted economy (right).
5 Implementation Details
In this section we give some details about the implementation of our tutoring systemMAS. We will also review the main characteristics of the implementation of CEESsince this subsystem is vital for the correct behavior of MAS. We would like toemphasize that the methodology that we followed to design the integrated systemMAS/CEES can be described as a symbiosis between the implementation of thesimulator and the learning of advanced macroeconomic concepts. Initially, weidentified the set of basic operators (at the human level) producing the economicprocess (e.g. purchasing, selling, work, demand of goods, etc). Next, we identified themain results giving raise to the correct interrelation among these concepts (e.g.business cycles and their control, state regulations by means of taxes andunemployment benefits, monopolies and oligopolies, etc). Afterwards, we looked foreconomic explanations to the basic forces producing the high level behavior of thesystem (e.g. if there is an excess of supply then the entrepreneur will decrease theprices).

A Tutoring System Supporting Experimentation 369
The architecture of MAS is split into different components. First, the client-sidecomponent provides a Web interface for users. This component consists of HTMLpages with embedded Javascript code that are dynamically generated by the server inresponse to queries of users. Through this environment users are confronted with theproposed assignments. The server-side component selects the questions to send toeach user, composes the HTML pages before sending them to the client, records theanswers, provides simple statistics of the system use, and computes the results ofquestions concerning complex economic behaviors by forwarding the suitable initialconditions to CEES and executing the algorithm it provides. This feature allows MASto dynamically create new questions by performing random small modifications to theinitial conditions of other already known questions. In this case, MAS obtains thecorrect answer to the new question in advance by executing the algorithm provided byCEES and considering the values returned by it. Finally, the last component of MASis the economic engine that provides such analysis, that is, CEES. MAS runs on top ofCEES, since the latter implements the algorithm governing the economic predictionsperformed by MAS. The structure of the economy model guided the decomposition ofthe design in classes (State of the Economy, Productive sector, Labor sector,Entrepreneur, Worker, etc.), the needed operations (buy, sell, consume, invest, lookfor a job, migrate of sector, etc.), and the needed attributes (salary, savings, amount ofpeople, etc.).
6 Conclusions and Future Work
We have presented MAS, a tutoring system to deal with macroeconomicenvironments. We think that MAS is indeed a very useful tool to help students in thetask of learning the main characteristic of a complex economic system. It is worth toremark that MAS is built on top of CEES, a powerful subsystem that implements thealgorithm governing the behavior of an economy.
As future work we would like to migrate the architecture of MAS/CEES to a morestandardized technology of economic simulation (e.g. Swarm [10]). This changewould allow us to easily compare simulation results and to share components in orderto study design alternatives. A second line of future work consists in including someof the main economic factors which have not been included in the current version.This is the case of the loan system, a stock exchange, and international commerce.Finally, we plan to apply some of the economical mechanisms underlying MAS to thesystems presented in [11, 8, 13]. In these works, simple microeconomic concepts areapplied to concurrent and e-commerce systems, respectively. We are confident thatrelevant high level emerging properties can be indeed found in the distributions ofresources.

370 M. Núñez, I. Rodríguez, and F. Rubio
Acknowledgments. The authors would like to thank the anonymous referees forvaluable comments on a previous version of the paper.
References
[1]
[2][3]
[4]
[5][6]
[7]
[8]
[9]
[10]
[11]
[12]
[13]
[14]
[15][16]
G.A. Akerlof and J.L. Yellen. A near-rational model of the bussiness cycle, with wageand price inertia. Quarterly Journal of Economics, 100:823–838, 1985.R. Barro, editor. Modern Business Cycle Theory. Harvard University Press, 1989.J.Q. Cheng and M.P. Wellman. The WALRAS algorithm: A convergent distributedimplementation of general equilibrium outcomes. Computational Economics, 12:1–24,1998.J. Frolova and V. Korobitsin. Simulation of gender artificial society: Multi-agent modelsof subject-object interactions. In ICCS 2002, LNCS 2329, pages 226–235. Springer, 2002.F. Hahn. The next hundred years. Economic Journal, 101:47–50, 1991.N. López, M. Núñez, I. Rodríguez, and F. Rubio. Including malicious agents into acollaborative learning environment. In 8th Int. Conf. on Intelligent Tutoring Systems,LNCS 2363, pages 51–60. Springer, 2002.N. López, M. Núñez, I. Rodríguez, and F. Rubio. WHAT: Web-based Haskell AdaptiveTutor. In 10th Artificial Intelligence: Methodologies, Systems, and Applications, LNAI2443, pages 71–80. Springer, 2002.N. López, M. Núñez, I. Rodríguez, and F. Rubio. A multi-agent system for e-barterincluding transaction and shipping costs. In 18th ACM Symposium on AppliedComputing, SAC’03, pages 587–594. ACM Press, 2003.R.E. Lucas. An equilibrium model of the bussiness cycle. Journal of Political Economy,83:1113–1144, 1975.F. Luna and B. Stefansson. Economic Simulations in Swarm: Agent-Based Modelling andObject Oriented Programming. Kluwer Academic Publishers, 2000.M. Núñez and I. Rodríguez. PAMR: A process algebra for the management of resources inconcurrent systems. In FORTE 2001, pages 169–185. Kluwer Academic Publishers,2001.T. Ostrom. Computer simulation: the third symbol system. Journal of ExperimentalSocial Psychology, 24:381–392, 1998.I. Rodríguez. Formal specification of autonomous commerce agents. In 19th ACMSymposium on Applied Computing, SAC’04, pages 774–778. ACM Press, 2004.I. Rodríguez and M. Núñez. CEES: Complex Economic Environments Simulator. InICCS 2003, LNCS 2658, pages 658–667. Springer, 2003.J.E. Stiglitz. Principles of Macroeconomics. W.W. Norton & Company, Inc, 1993.R. Suppi, P. Munt, and E. Luque. Using PDES to simulate individual-oriented models inecology: A case study. In ICCS 2002, LNCS 2329, pages 107–116. Springer, 2002.

An Agent Based Approach for Migrating Web Servicesto Semantic Web Services*
László Zsolt Varga, Ákos Hajnal, and Zsolt Werner
Computer and Automation Research Institute, Kende u. 13-17, 1111 Budapest, Hungary{laszlo.varga, ahajnal, werner}@sztaki.hu
http://www.sztaki.hu/
Abstract. Semantic web services are considered as the concept bringing theweb to its full potential by combining the best features of web services, agenttechnology, grid and the semantic web. In this paper we present an agent basedarchitecture for migrating existing web services to the semantic web service en-vironment. We developed the WSDL2Agent tool to support the migration. Thetool automatically generates a Protégé project. With human interaction semanticinformation not present in the WSDL description can be added in Protégé andthe project can be exported in OWL format. From the enhanced OWL descrip-tion we can directly derive the skeletons of the elements of the Web ServicesModeling Framework. The tool automates the most tedious tasks of the migra-tion process and the users can focus on the semantic aspects.
Keywords: multi-agent systems, web services, semantic web services
1 Introduction
Nowadays computers are networked into the Internet and if an organization is notconnected, then it has serious competitive drawback. In this environment individualsoftware products must change from isolated applications into interoperating compo-nents in a world wide network of information and business transactions. These re-quirements do not allow the application of individual solutions and the focus turns tostandardized data, information and knowledge exchange. Providing solutions to theseneeds are among the goals of several technologies including the web services technol-ogy [1], the semantic web technology [2], the grid [3] and agent based computing [4].The grid is going to provide access to information and computing resources as perva-sive as access to electricity is today. Currently the grid turns towards web services asunderlying technology. Web services increase the web’s potential by providing a wayof automated discovery and invocation of software services using web protocols anddata representation. Although web service protocols and data are machine readable,they do not provide the necessary level of “understanding” of the web content. Se-mantic web provides description techniques for describing content on the necessary
* This work was partly supported by the “Multiagent systems and applications” joint researchproject between the Hungarian and the Bulgarian Academy of Sciences.
C. Bussler and D. Fensel (Eds.): AIMSA 2004, LNAI 3192, pp. 371–380, 2004.© Springer-Verlag Berlin Heidelberg 2004

372 L.Z. Varga, Á. Hajnal, and Z. Werner
semantic level. Semantic web services extend web services with semantic web capa-bilities [5, 6]. Semantic description techniques are part of agent based computing,therefore it seems reasonable to investigate how agent technology could help migrateweb services and the web service technology to the semantic web services environ-ment. Agent technology also offers autonomous and proactive behaviors which maybe necessary for semantic web services to adapt to unforeseen changes and require-ments in dynamic service discovery and composition.
The research contribution of this paper is the description of an agent based archi-tecture and a method for the migration of web services to the semantic web serviceenvironment. The technology contribution of this work is the implementation of theWSDL2Agent tool and the application of the tool to the Google web service.
In section 2 first we summarize the main concepts of web services and semanticweb services. In section 3 we introduce a novel agent based architecture for migratingweb services to the semantic web service environment. Section 4 presents theWSDL2Agent tool which automates mechanic steps of the migration process. The tooland its usage are demonstrated through the Google web service in section 5. In the endwe compare our results with similar work and outline possible continuations.
2 Web Services and Semantic Web Services
The purpose of web services is to provide document- or procedure-oriented function-ality over the network enhancing static web information towards interacting services.The web service is an abstract notion of certain functionality, the concrete piece ofsoftware implementing the web service is called provider agent [1], while other sys-tems that wish to make use of the web services are called requester agents. Requesteragents can interact with the provider agent via message exchange using SOAP (SimpleObject Access Protocol) messages typically conveyed over HTTP.
The interface of the web service is described in machine-readable format by aWSDL (Web Services Description Language [7]) document. It defines the service as aset of abstract network end-points called ports and a set of operations representingabstract actions available at these ports. For each operation the possible input andoutput messages are defined and decomposed into parts. The data types of parts aredescribed using the XSD (XML Schema Definition [8]) type system, which may beeither built-in XML data types or custom, even nested structures e.g. complex types orarrays. The abstract definitions of ports, operations, and messages are then bound totheir concrete network deployment via extensibility elements: internet location, trans-port protocol, and transport serialization formats. At present, WSDL is applicable todescribe the syntactic level of web service access, but it does not provide semanticinformation about web services.
The semantic web services group of the DAML program has developed aDAML+OIL as well as an OWL based web service ontology [9]. The upper ontologyfor web services contains the service profile, the service model and the servicegrounding. The service profile provides a high-level description of a service and itsprovider in a way which would typically be presented to users when browsing a serv-

An Agent Based Approach for Migrating Web Services 373
ice registry. The service model details both the control structure and the data flowstructure of the service. The grounding of a service specifies the details of how toaccess the service which is a mapping from an abstract to a concrete specification.
Semantic enabled web services [10] are an extension of the web service conceptwith semantic descriptions of data and services. Semantic web services will allow theintelligent and automatic web service discovery, selection, mediation and compositioninto complex services. The Web Services Modeling Framework (WSMF) [11] pro-vides the model for developing, describing and composing semantic web services. Themodel consists of four main elements: ontologies, goal repositories, web service de-scriptions and mediators. The ontologies provide the terminology used by the otherelements. The goal repositories contain specifications of objectives that should besolved by web services. The web services descriptions define the web services fromvarious aspects including the services offered, input/output data, failures, servicebinding, quality and price information, provenance data, reliability information, etc.Mediators bypass interoperability problems of different vocabulary and interactionstyles.
The Semantic Web Services Initiative Architecture committee (SWSA) of theDAML program is developing a reference architecture to support Semantic WebService technologies. Our work is based on WSMF, because the SWSA architecture isnot yet available, but it is known that the SWSA will take the current WSMF as astarting point.
3 Agent Based Semantic Web Service Architecture
Agents as autonomous and proactive software components can provide the glue fortightening software components together in the semantic web. The Agentcities initia-tive [12] has already created a world wide testbed with an infrastructure for experi-menting with agent services based on agent technology standards [13]. The testbedinfrastructure contains many elements needed for semantic web services: messagetransport; communication languages; ontologies; platform, agent and service directoryservices; monitoring tools; website based system for managing namespace and URLreferences to defined ontologies and other semantic definitions; several test applica-tions; composite services. Based on the experiences in the Agentcities testbed wedefine an agent based semantic web service layer above existing web services asshown in Fig. 1.
Existing web services described by WSDL files constitute the web service layer.Each web service is represented in the semantic web service layer by a proxy agentcapable of invoking the web service as well as playing the role of the mediator. Aplain proxy agent without mediator capabilities can be automatically generated withthe WSDL2Jade tool and the methods described in [14]. The proxy agent generatedwith WSDL2Jade is capable to invoke the web service. This only allows the deploy-ment of agents based on existing web services and was useful to deploy agents in theAgentcities testbed. Now we are going to discuss how the proxy agent can be ex-tended to play the role of the mediator in WSMF.

374 L.Z. Varga, Á. Hajnal, and Z. Werner
Fig. 1. Agents provide a semantic web service layer above the layer of existing web services
The WSDL description of the web service is represented with an OWL file in thesemantic web service layer (link 1 in Fig. 1). The OWL file is generated with the toolsand methods described in the next section. The OWL file is a description of the capa-bilities of the proxy agent in a semantic description language which makes easier theadditions of extensions towards semantic web services. The OWL file is the basis ofseveral components in the semantic web service layer. The goal descriptions of theproxy agent are extracted from this file and put into the goal repository (link 2 inFig. 1). The OWL file contains the description of the input and output data of the webservice and is used in the ontology of the content language of the communicationbetween the proxy agents (link 3 in Fig. 1). The ontology of the content language canalso be exported to the OWL-S file describing the semantic web services provided bythe proxy agent (link 4 in Fig. 1). Finally the skeleton of the proxy agent is generatedfrom the OWL file (link 5 in Fig. 1). If the OWL description is extended with media-tor capabilities, then the proxy agent created through link 5 provides mediator servicesas well.
4 Creating the Components of the Architecture
In order to be able to create the WSMF components of the agent based semantic webservices architecture described in the previous section, we have created theWSDL2Agent tool which is applicable to convert any WSDL file to a Protégé projectfile. The Protégé knowledge engineering tool [15] allows us to visualize and edit the

An Agent Based Approach for Migrating Web Services 375
web service description and convert it into various formats, such as RDF, OIL,DAML+OIL, and OWL. First we are going to discuss how the Protégé representationof the WSDL file can be created, then we will discuss how this Protégé representationcan be used to create the WSMF components.
For input and output messages of a web service operation the conversion assignsProtégé classes (also known as frames) with fields (called slots in Protégé) corre-sponding to message parts. In accordance with conventions used in agent technology,classes representing operation input messages are called AgentActions, and classesrepresenting output messages are called Predicates. Furthermore, class names areprefixed with a string which is the concatenation of port name and operation name inWSDL to make them unique as it is required by Protégé. To indicate web serviceinvocation faults we generate a special predicate called ErrorPredicate. Since slotnames must be globally unique as well in the knowledge domain (regardless of con-tainer classes), slot names are prefixed with the unique string of the class name theybelong to. Similarly to input and output messages complex types defined in WSDL arealso represented by Protégé classes with slots corresponding to the elements includedin the complex type. These latter classes do not need to be prefixed with port name,operation name strings, since complex type names are unique in the WSDL.
In order to be able to generate the proxy agent skeleton form the OWL file (link 5in Fig. 1) using the Ontology Bean Generator for Jade [16] the generated classes areorganized in the structure defined by the Ontology Bean Generator. Classes repre-senting complex types are child classes of a special class called Concept, agent actionclasses are successors of class AgentAction (which is also subclass of Concept), andpredicate classes must inherit from class Predicate. In addition, a so called AID classinstance must be present for successful agent code generation.
Another important aspect of WSDL to Protégé model generation is the question oftype conversion, i.e. how the XML Schema type parts and complex type fields can betranslated into Protégé slot types. Protégé supports four primitive value types: boo-lean, float, integer, and string. In addition, a value type called ‘symbol’ can representenumerations of string values, and ‘any’ value type means that the slot can take anyvalue of the above types. Since XML Schema has a much wider range of built-in datatypes than Protégé, the data type mapping may be imprecise for certain XML types.XML - Protégé type conversion rules are omitted here because of lack of space, butthey are available on the web page of WSDL2 Agent [17].
The mapping of complex types needs recursion. If there is a message part or acomplex type field with type referring to another complex type ‘B’, thenWSDL2Agent creates a class for the referred type ‘B’ and associates the referring typewith a slot having type ‘class’ with a single allowed parent class ‘B’.
One-dimensional array type fields in WSDL, such as int[], are represented by slotswith multiple cardinality and with type corresponding to the scalar case (e.g. integer).In the case of multi-dimensional arrays, intermediate wrapper classes are created.Each intermediate class contains a slot referring to a lower number dimension classwith multiple cardinality.
Using the above techniques the WSDL file is transformed into a Protégé projectfile in which XML data types are converted to Concept classes, web service opera-tions are converted to AgentAction classes, and web service operation results are

376 L.Z. Varga, Á. Hajnal, and Z. Werner
converted into Predicate classes. Concept classes are edited to add more semantics tothem. AgentAction classes are edited to add mediator fimctionality to the proxyagents. These extensions need human intervention and cannot be done automatically.Once the extensions are added, the components of the WSMF model can be derived.
The Predicate classes contain the goals that can be achieved by invoking the webservices, therefore the Predicate classes are exported to the goal repository of theWSMF model. The Concept classes describe the information exchanged between theproxy agents, therefore they are exported to the ontology describing the content lan-guage of the communication between the proxy agents. Concept and Predicate classesare also part of the OWL-S file describing the semantic web services of the proxyagent. Using the Ontology Bean Generator, the skeleton of the proxy agent is gener-ated from the created Protégé project.
5 Example: The Google Web Service
In this section the above described agent based approach for creating semantic webservices from existing web services is demonstrated on the Google web service [18].
Google Web APIs service consists of three parts which are accessible via three op-erations called doGoogleSearch, doGetCachedPage, and doSpellingSuggestion. ThedoGoogleSearch service is applicable to search in Google’s index of web pages bysubmitting the query string (and search parameters) for which Google web servicesends the set of search results back. The doGetCachedPage operation returns thecached contents of a specified URL when Google’s crawlers last visited the page.Finally, doSpellingSuggestion service can be used to obtain a suggested spell correc-tion for the submitted expression.
These operations and message formats are defined in the WSDL file downloadablefrom the Google web site along with the documentation describing the semantics ofthe messages. For simplicity we present only the search operation and how we canobtain its semantic web service representation. The WSDL file contains the followingXML description of the input and output messages of the doGoogleSearch operation:
In the input message the ‘key’ parameter corresponds to the registration code (needsto be requested at the web page of Google), parameter ‘q’ is the search string. Otherparameters are omitted here. The ‘s’ namespace prefix in part types refers to the stan-dard XML Schema namespace “http://www.w3.org/2001/XMLSchema” (declared inWSDL’s <definitions> element), therefore each part has an XML’s built-in datatype.

An Agent Based Approach for Migrating Web Services 377
The output message has a single part called ‘return’ with type referring to a localcomplex type (namespace prefix s0 refers to the target namespace) called Google-SearchResult which is defined in the <types> section in the WSDL file:
The GoogleSearchResult structure contains built-in XML type fields containingdetails about the search itself and further complex types, e.g. ResultElementArray(containing the actual list of search results) which is an array of ResultElement com-plex type representing a single search hit:
It contains a textual summary of the web page found, the URL, the snippet, the title,and other information like cached size and directory category. These fields have built-in XML type, except one complex type field which is not detailed here to save space.
A view of the model generated by WSDL2Agent is shown in Fig 2. The ontologyof the web service is exported to an OWL file using the OWL Plugin. By building anew project from the exported OWL file the web service data model can be visual-ized, edited as an OWL ontology: OWL specific metadata can be introduced, logicalclass descriptions can be added, logic reasoners can be accessed.
The GoogleSearchPortDoGoogleSearchPredicate is exported to the goal repositoryas the goal of the GoogleSearchPortDoGoogleSearchAgentAction. Its OWL repre-sentation as generated by WSDL2Agent and exported from Protégé is the following:
This is a raw representation from the WSDL file, but with human intelligence moresemantics can be added from the textual description of the web service using Protégé.

378 L.Z. Varga, Á. Hajnal, and Z. Werner
Fig. 2. The model generated from Google’s WSDL file in Protégé’s visual development envi-ronment
The GoogleSearchPortDoGoogleSearchAgentAction is exported to the ontologyfor the content language between proxy agents as well as to the OWL-S description ofthe semantic web services of the proxy agent. The OWL representation of the agentaction together with the key property is the following:
In the case of both Protégé projects and OWL projects the Ontology Bean Genera-tor plugin can be used to produce agent code from the model. The generated agentcode can then be completed and run in Jade agent platform [19] resulting in an agentwhich understands and communicates with the terms specified by the ontology.

An Agent Based Approach for Migrating Web Services 379
6 Analysis and Related Work
Using the tool and the approach presented in this paper, we can generate the basis ofthe WSMF elements for semantic web services. This helps to migrate web services tothe WSMF model, because the translation of the information in the WSDL file may betedious for even a single complex web service. An automatic tool cannot add seman-tics to a WSDL description, therefore the semantic markup of the web service must bedone with human interaction. The tool translates the WSDL description to a Protégéproject file where the semantic markup can be done easier. Once the semantic de-scription is complete, the goal repository, the ontology of the content language for thecommunication between proxy agents and mediators, as well as the skeleton of theproxy agent code and the core of the OWL-S description can be derived directly.
As it is observed in [20] in the case of Amazon Web service to DAML-S conver-sion the human syntactic translation of the grounding takes about a week, while only afew hours needed to complete the process models and profiles. The usage of auto-mated tools thus drastically reduces the effort required, and developers can focus onthe semantic information when migrating existing web services to the semantic web.
The WSDL2DAMLS tool described in [20] can directly generate a DAML-S de-scription form a WSDL file. The WSDL2DAMLS tool also needs human intervention,because the WSDL file does not contain the needed semantic information. Althoughthe WSDL2DAMLS tool produces a DAML-S file, it does not produce other elementsof the WSMF model. The DAML-S file contains the ontology of the content languagewhich can be used between mediators, but does not contain the mediators themselves.Therefore our WSDL2Agent tool is complimentary to WSDL2DAMLS, because italso contains the mediator concept.
7 Conclusion and Outlook
In this paper we have presented an agent based architecture for migrating existing webservices to the semantic web service environment. We have developed a tool [17] tosupport the migration. The tool automatically generates an OWL description of theagent providing the semantic web service. Human interaction is needed to add seman-tic information not present in the WSDL description. From the enhanced OWL de-scription we can directly derive the skeletons of the elements of the WSMF. The mosttedious tasks of the migration process are automated and the users can focus on thesemantic aspects. The WSDL2Agent tool gives a novel solution and complements theWSDL2DAMLS tool.
The work presented in this paper can be continued in the direction of providingtools to automatically extract and derive the goal repository, the ontology and theOWL-S description from the OWL file generated by WSDL2Agent. Another inter-esting possibility is to investigate how WSDL2DAMLS and WSDL2Agent can becombined in order to provide smoother transition from web services to semantic webservices. At the time of writing this paper WSDL2Agent supports WSDL1.1. Supportfor the recently published WSDL 2.0 specification is being implemented.

380 L.Z. Varga, Á. Hajnal, and Z. Werner
References
1.
2.
3.
4.
5.
6.
7.
8.
9.
10.
11.
12.
13.
14.
15.
16.
17.18.19.
20.
Web Services Architecture, W3C Working Group Note 11 February 2004,http://www.w3.org/TR/ws-arch/Berners-Lee, T., Hendler, J., & Lassila, O. (2001). The Semantic Web. Scientific Ameri-can 284(5), 34-43.Foster, I., & Kesselman, C., eds. (1999). The Grid: Blueprint for a New Computing Infra-structure. San Francisco: Morgan Kaufmann.Wooldridge, M. (2002). An Introduction to Multiagent Systems. Chichester: John Wiley& SonsMcIlraith, S. , Son, T. C. , and Zeng, H.: Semantic Web services. IEEE Intelligent Sys-tems, 16(2), pp. 46–53, 2001.Hendler, J.: Agents and the Semantic Web, IEEE Intelligent Systems, vol. 16, no. 2,Mar./Apr. 2001, pp. 30–37.Web Services Description Language (WSDL) 1.1, W3C Note 15 March 2001,http://www.w3 .org/TR/wsdlXML Schema Part 0: Primer, W3C Recommendation, 2 May 2001,http://www.w3 .org/TR/xmlschema-0/The DAML Services Coalition (alphabetically Ankolenkar, A., Burstein, M., Hobbs, J.R.,Lassila, O., Martin, D.L., McDermott, D., McIlraith, S.A., Narayanan, S., Paolucci, M.,Payne, T.R., Sycara, K.): DAML-S: Web Service Description for the Semantic Web. TheFirst International Semantic Web Conference (ISWC), Sardinia (Italy), June, 2002.Bussler, C., Maedche, A., Fensel, D.: A Conceptual Architecture for Semantic Web En-abled Web Services. ACM Special Interest Group on Management of Data: Volume 31,Number 4, Dec 2002.Fensel, D., Bussler, C., Ding, Y., Omelayenko, B.: The Web Service Modeling Frame-work WSMF. Electronic Commerce Research and Applications, 1(2), 2002.Willmott, S.N., Dale, J., Burg, B., Charlton, P., O’brien, P.: “Agentcities: A WorldwideOpen Agent Network”, Agentlink News 8 (Nov. 2001) 13-15,http://www.AgentLink.org/newsletter/8/AL-8.pdfDale, J., Mamdani, E.: Open Standards for Interoperating Agent-Based Systems. In: Soft-ware Focus, 1(2), Wiley, 2001.Varga, L.Z., Hajnal, A.: Engineering Web Service Invocations from Agent Systems, Lec-ture Notes in Computer Science Vol. 2691, Marik, V., Müller, J., Pechoucek, M. (Eds.),Multi-Agent Systems and Applications III, CEEMAS 2003, Prague, Czech Republic, June16-18, 2003, Proceedings, p. 626., ISBN-3-540-40450-3Gennari, J., Musen, M., Fergerson, R., Grosso, W., Crubézy, M., Eriksson, H., Noy, N.,Tu. S.: The evolution of Protégé-2000: An environment for knowledge-based systems de-velopment. International Journal of Human-Computer Studies, 58(1):89-123, 2003.van Aart, C.J., Pels, R.F., Giovanni C. and Bergenti F. Creating and Using Ontologies inAgent Communication. Workshop on Ontologies in Agent Systems 1st International JointConference on Autonomous Agents and Multi-Agent Systems, 2002.WSDL2Agent available online at http://sas.ilab.sztaki.hu:8080/wsdl2agent/Google Web API, http://www.google.com/apis/Bellifemine, F., Poggi, A., Rimassa, G.: “JADE - A FIPA-compliant agent framework”, InProc. of the Fourth International Conference and Exhibition on the Practical Applicationof Intelligent Agents and Multi-Agents (PAAM’99), London, UK, (1999) pp. 97-108.Paolucci, M., Srinivasan, N., Sycara, K., Nishimura, T.: Toward a Semantic Choreographyof Web Services: From WSDL to DAML-S, In Proceedings of the First InternationalConference on Web Services (ICWS’03), Las Vegas, Nevada, USA, June 2003, pp 22-26.

Constructing a BDI Agent to Deploy in an InteractiveComputer Game Environment
In-Cheol Kim
Department of Computer Science, Kyonggi UniversitySan 94-6 Yiui-dong, Paldal-gu, Suwon-si, Kyonggi-do, 442-760, Korea
Abstract. In this paper, we introduce the architecture and the path-planning be-havior of KGBot. KGBot is an intelligent character agent deploying in an inter-active computer game environment. It has been implemented as a bot client inthe Gamebots system. KGBot adopts a general BDI engine, UM-PRS, as itscentral decision-making part. Considering its limited range of view, KGBotuses an extended real-time search algorithm, RTA-RG, for planning paths.Through some experiments, we investigate the efficiency of the UM-PRS en-gine and that of the real-time search algorithm for controlling KGBot in thiscomplex virtual environment.
1 Introduction
As computer games become more complex, the need for intelligent non-player char-acters(NPC) is growing. Computer game worlds are usually dynamic and real-timeenvironments. They also include complex 3D spaces and multiple interacting charac-ters. Any agent in such an environment should have a lot of intelligent capabilitiessuch as learning a map of their 3D environment, planning paths, coordinating with itsteammates, and so on. There are a number of projects for designing and implementingsuch intelligent character agents deploying within a simulated virtual environmentsuch as interactive computer game world. The examples are the Soarbot project [5]and the Gamebots project [10]. In this paper, we introduce the architecture and thepath-planning behavior of a game agent, of which the name is KGBot. KGBot hasbeen implemented as a bot client in the Gamebots system. KGBot adopts UM-PRS [4]as its decision-making part. UM-PRS is a general-purpose reasoning system, integrat-ing traditional goal-directed reasoning and reactive behavior. We will explain thebenefits from embedding the UM-PRS engine. In order to deploy well in this gameenvironment, KGBot needs a fast on-line search algorithm which interleaves planningfor a plausible next move and executing the move. However, most of existing real-time search algorithms such as and do not consider the limitation ofagent’s view. Considering its limited range of view, KGBot uses an extended real-timesearch algorithm, RTA-RG, for planning paths. We will conduct some experiments toevaluate the efficiency of the UM-PRS engine and that of the real-time search algo-rithm for controlling KGBot in this complex virtual environment.
C. Bussler and D. Fensel (Eds.): AIMSA 2004, LNAI 3192, pp. 381–388, 2004.© Springer-Verlag Berlin Heidelberg 2004

382 I.-C. Kim
Fig. 1. Gamebots System
Fig. 2. Distributed Waypoints and an Agent’s View
2 Computer Game Environment
Our agent, KGBot, is supposed to deploy within a simulated virtual environmentwhich is made by Epic’s Unreal Tournament(UT) game [3] and ISI’s Gamebots sys-tem [10]. UT falls into a category of online video games known as first-person shoot-ers, where all real time players exist in a 3D virtual world with simulated physics. Asimplied by ‘first person’ in the genre’s name, every player’s senses are limited by theirlocation, bearings, and occlusion within the virtual world. Gamebots is a domain forresearch in multi-agent systems. It utilizes UT, which is one of the fast-paced multi-agent interactive computer games. Gamebots contains an additional module for UTthat allows characters in the game to be controlled via network sockets connected tobot clients. Fig. 1 represents the overall architecture of Gamebots system. The Game-bots server feeds sensory information for the characters over the network connections.Based on this information, the bot client can decide what actions the character shouldtake and issues commands back over the network to the game to have the charactermove, shoot, or talk.
Sensory information sent to the remote bot client is a complete list of everythingwithin the agent’s view at that moment, as well as the agent’s own state such as health

Constructing a BDI Agent to Deploy in an Interactive Computer Game Environment 383
and location. It also contains some dynamic and game critical items such as otherplayers and flying projectiles. However, due to the underlying bot implementation inUT, all vision messages simplify a world object down to a set of location and rotationcoordinates called a waypoint. All bots do not have a direct sense of the map archi-tecture, such as walls and floors. Instead, the map architecture is conveyed implicitlythrough the set of waypoints. Fig. 2 depicts the waypoints distributed over a complex3D map and the current view of the character. Only the waypoints within the currentview of the character can be recognized by the corresponding bot client. In this virtualenvironment, the bot clients, or the character agents must display intelligent behaviorsto play successfully, such as planning paths, learning a map of their 3D environment,using resources available to them, coordinating with their teammates, and engaging instrategic planning which takes their adversaries into account.
3 Agent Architecture
Our KGBot is an intelligent bot client of Gambots system, which can control its re-mote character to roam through a complex 3D world space and play a dominationgame against some opponent characters. As mentioned above, KGBot must meet somerequirements: showing real-time decision-makings and responses, building a completemap of the 3D environment, searching the hidden domination points, planning theshortest path, cooperating with teammates such as other bot players or human players,modeling opponent’s behaviors, and so on. A general Belief-Desire-Intention(BDI)engine called UM-PRS is embedded in KGBot. It plays a role of the decision maker todetermine the best action to meet the current situation. UM-PRS [4] is a general-purpose reasoning system, integrating traditional goal-directed reasoning and reactivebehavior. In contrast to most traditional deliberative planning systems, UM-PRS con-tinuously tests its decisions against its changing knowledge about the world, and canredirect the choices of actions dynamically while remaining purposeful to the extentallowed by the unexpected changes to the environment. UM-PRS consists of WorldModel, Goals, Knowledge Areas(KAs), Intention Structure, and Interpreter. Theworld model is a database of facts which are represented as relations. A goal can beeither a top-level goal or a subgoal activated by the execution of a KA body. A KA isa declarative procedure specification of how to satisfy a system goal or query. A KAconsists of name, documentation, purpose, context, body, effect, and failure section.KA purpose specifies the goal that successful execution of the KA body will satisfy.KA context specifies the situations in which the KA may be applied. The context ischecked throughout the execution of a KA, to make sure that the KA is still applicableto the intended situation. KA body specifies the execution steps required to satisfy theKA purpose in terms of primitive functions, subgoals, conditional branches, and so on.The intention structure of KGBot maintains information related to the runtime state ofprogress made toward the system’s top-level or system goals. The UM-PRS interpretercontrols the execution of the entire system.

384 I.-C. Kim
Fig. 3. Architecture of KGBot
KGBot can get some benefits from adopting UM-PRS as its central decision-making part: high reactivity, context specificity, flexibility, ease of development, reus-ability. Due to the characteristics of UM-PRS, integrating the goal-directed reasoningand reactive behavior, KGBot become more sensitive to the context, and can respondwell to dynamic changes of the environment. In most commercial computer games, aprogram-controlled character – also called non-player character(NPC) – has its allparts implemented directly in a specific programming language(C or C++). In thiscase, it is not easy to add a new behavior, delete, or update one of the existing behav-iors. As for UM-PRS, however, an agent’s behaviors can be specified and stored in-dependently of the interpreter. Moreover, most of the agent’s behaviors can be speci-fied solely in KA, which is a kind of high-level script or plan. Therefore it is easy toreuse the existing behaviors for defining a new one as well as to modify the behaviorsof KGBot without time-consuming C or C++ programming.
Fig. 3 represents the architecture of KGBot, which is a bot client in the Gamebotssystem. It consists of three major parts: the perception part, the decision-making part,and the action part. The perception part of KGBot extracts useful information about itsphysical condition(SenseBody), the state of game(GameState), and the state of acces-sory objects(UTObject) like waypoints, weapons, and other items from sensory datareceived from the Gamebots server, and then delivers them to the decision-makingpart. Based on the newly collected information, the decision-making part updates theworld model and then determines the best action to execute in consideration of thecurrent goal and plan. The action part of KGBot composes a command message corre-sponding to the determined action and then sends to the Gamebots server through thenetwork. In other words, both the perception part and the action part of KGBot con-stitute the interface with the game environment. These two parts of KGBot have beenwritten in Java programming language. On the other hand, the decision-making parthas been implemented with JAM, a Java version of UM-PRS. Each part of KGBotexecutes concurrently with its own independent thread and unique queue. MostKGBot’s high-level behaviors have been specified in KA. As a result, the knowledgebase of KGBot has included a number of KAs. For the sake of efficient execution,KGBot’s behaviors were classified hierarchically into three different layers. Threelayers are the reactive layer, the advanced skill layer, and the cooperation layer.

Constructing a BDI Agent to Deploy in an Interactive Computer Game Environment 385
Fig. 4. Two Real-Time Search Strategies
Fig. 5. A Real-Time Search Algorithm, RTA-RG
4 Path-Planning Behavior
In order to play a domination game well, KGBot have to address the problem of find-ing the shortest path to one of the hidden domination points in an unknown 3D envi-ronment in which it must travel around in the environment to explore unknown way-points. Problem spaces of path-planning problems are commonly represented asgraphs, in which each state is a node and edges represent the possibilities of movingbetween the nodes. Heuristic search is known as a fundamental method to deal withsuch graph search problems. and are the well-known off-line heuristic searchalgorithms which compute an entire solution path before executing the first step in thepath. On the other hand, on-line search algorithms such as and inter-leave planning for a plausible next move and executing the move. Since our game

386 I.-C. Kim
world is a real-time environment, KGBot has to use an on-line search algorithm for itspath-planning behavior. But most of real-time search algorithms do not consider thelimitation of agent’s sensing ability. In other words, the existing algorithms assumethat an agent standing on a certain node can recognize its all neighboring nodes atonce. However, in most first-person game environments, where a character can haveneither a complete map of the world nor the unlimited range of view, this assumptionfails.
As for its limited view, the agent can choose one of two possible real-time searchstrategies shown in Fig. 4. The first strategy shown in Fig. 4 (a), Go & Go, is to con-sider only the neighboring nodes within the agent’s view at that time. On the otherhand, the second strategy shown in Fig. 4 (b) is to find out all neighboring nodes byrotating itself on the current node before jumping to another node. This strategy isnamed Rotate & Go. Fig. 5 represents the real-time search algorithm with Rotate &Go strategy, which is denoted as RTA-RG. In a finite problem space with positiveedge costs, in which there exists a path from every node to the goal, and starting withnon-negative admissible initial heuristic values, RTA-RG is complete in the sense thatit will eventually reach the goal. KGBot uses this extended real-time search algorithmfor planning its paths within an unknown complex environment.
5 Experiments
In order to evaluate the efficiency of the RTA-RG real-time search algorithm and thatof the UM-PRS control engine, we conducted several experiments in the Gamebotsenvironment. For the purpose of investigating the efficiency of the RTA-RG algo-rithm, we compared the RTA-RG algorithm with the RTA-GG algorithm which usesthe simple Go & Go strategy. On the other hand, as a method of proving the efficiencyof the UM-PRS control engine, we compared the UM-PRS engine with a purely reac-tive engine. For these experiments, we used three 3D maps of different complexityshown in Fig. 6. While the Dom-Stalwart map shown in Fig. 6 (a) is the simplest, theDom-Leadworks map shown in Fig. 6 (c) is the most complex. In the experiments forcomparison between two search algorithms, we counted the consumed time forsearching over each map to find out all three hidden domination points. We tried theexperiment ten times with a random starting position on the same map. The limit ofsearch time was set to 600 seconds. Table 1 shows the result of the experiments. Ex-cept the case of the simplest map, Dom-Stalwart, the RTA-RG algorithm has con-sumed less time than the RTA-GG algorithm in all cases. The result says the RTA-RGalgorithm with Rotate & Go strategy is more efficient than the RTA-GG algorithmwith Go & Go strategy in the complex 3D maps. In order to compare the efficiencybetween the UM-PRS engine and a purely reactive control engine, we had the UM-PRS agent (KGBot) compete with an agent of purely reactive engine in real UT domi-nation games, and then compared their game scores. The wining score was set to 100.Table 2 shows the result of the experiments. In all cases, the UM-PRS agent defeatedthe purely reactive agent and won the game. The result illustrates the superiority of theUM-PRS control engine in this domain.

Constructing a BDI Agent to Deploy in an Interactive Computer Game Environment 387
Fig. 6. Three Different Maps
6 Conclusions
In this paper, we introduced KGBot which is an intelligent character agent deployingwithin a 3D virtual environment. It has been implemented as a bot client in the Game-bots system. KGBot adopts a general BDI engine, UM-PRS, as its central decision-making part. KGBot enjoys some benefits from embedding UM-PRS. For planning itspaths in a complex world, KGBot uses an efficient real-time search algorithm, RTA-

388 I.-C. Kim
RG. Through some experiments, we illustrated the efficiency of the UM-PRS engineand that of the RTA-RG algorithm for controlling KGBot in this complex virtual envi-ronment.
References
[1]
[2]
[3][4]
[5]
[6]
[7]
[9]
[10]
[11]
[12]
[13][14]
A. Stentz: Optimal and Efficient Path Planning for Partially Known Environments, Pro-ceedings of ICRA-94 (1994) 3310-3317.D. Shapiro: Controlling Gaming Agents via Reactive Programs, Proceedings of the AAAISpring Symposium on AI and Computer Games (1999) 73-76.J. Gerstmann: Unreal Tournament: Action Game of the Year, GameSpot, 1999.L. Jaeho, M. J. Huber, E.H. Durfee, and P.G. Kenny: UM-PRS: An Implementation ofThe Procedural Reasoning System for Multirobot Applications, Proceedings of CIRFFSS-94 (1994) 842-849.J.E. Laird, M. Lent: Human-level AI’s Killer Application: Interactive Computer Games,Proceedings of AAAI-2000 (2000).J. Funge: AI for Games and Animation: A Cognitive Modeling Approach, A.K. Peters(1999).K. Knight: Are Many Reactive Agents Better Than a Few Deliberative Ones, Proceedingsof IJCAI-93 (1993) 432-437.K. Perlin and A. Goldberg: IMPROV : A System for Scripting Interactive Actors in Vir-tual Worlds, Proceedings of SIGGRAPH-96, (1996) 205-216.R. Adobbati, et al: Gamebots: A 3D Virtual World Test-Bed for Multi-Agent Research,Proceedings of Agents-01 (2001).R. Korf: Real-Time Heuristic Search, Artificial Intelligence, Vol.42, No.3 (1990) 189-211.R. Stern: Optimal Path Search in Unknown Physical Environments, MSc thesis, CS Dept.,Bar-Ilan University, Israel (2001).S. Rabin: AI Game Programming Wisdom, Charles River Media (2002).Y. Kitamura, K. Teranishi, and S. Tatsumi: Organizational Strategies for Multiagent Real-Time Search, Proceedings of ICMAS-96 (1996) 150-156.

Learning Obstacle Avoidance Behavior UsingMulti-agent Learning with Fuzzy States
Ming Lin, Jihong Zhu, and Zengqi Sun
Department of Computer Science and TechnologyTsinghua University, Beijing, 100084, P.R.ChinaLinming99@mails .tsinghua. edu. cn
Abstract. This paper presents a proposal of learning obstacle avoidancebehavior in unknown environment. The robot learns this behavior throughseeking to collide with possible obstacles. The field of view (FOV) of the robotsensors is partitioned into five neighboring portions, and each is associated withan agent that applies Q-learning with fuzzy states codified in distance notions.The five agents recommend actions independently and a mechanism ofarbitration is employed to generate the final action. After hundreds of collision,the robot can achieve collision-free navigation with high successful ratio,through integrating the goal information and the learned obstacle avoidancebehavior. Simulation results verify the effectiveness of our proposal.
1 Introduction
The goal of mobile robotics is to build physical systems that can move purposely andwithout human intervention in known as well as unknown environments. The vitalcomponent of a mobile robot is its navigation system that enables it to autonomouslynavigate to a require destination without colliding with obstacles. The problem ofnavigating in unknown environments can be called local navigation, focusing onmethods of obstacle avoidance. These methods introduce a notion of sensor feedbackand transform the navigation into a continuous dynamic process. The robot uses itsonboard sensors to find a collision-free path to the goal configuration. An efficientlocal navigation method is artificial potential field [1]. Although it has been widelyused in obstacle avoidance cases, this method has some problems such as localminimum and difficulty of determining the appropriate force coefficients, etc.
Fuzzy logic approach seems quite promising to tackle the problem of obstacleavoidance, as it can deal with various situations without requiring to constructing ananalytical model of the environment. Another distinct advantage of this approach isthat each fuzzy rule has a physical meaning, which makes it possible to tune the rulesthrough applying expert knowledge. However, in complex environments, it is difficultto consistently construct the rules since there are enormous situations to be handled. Anumber of learning algorithms, such as evolutionary algorithm [2], supervisedlearning [3, 4], and reinforcement learning (RL) [5, 6] have been proposed toconstruct the fuzzy system automatically. Evolutionary learning itself always resultsin a very long learning process. Supervised learning methods require a substantially
C. Bussler and D. Fensel (Eds.): AIMSA 2004, LNAI 3192, pp. 389–398, 2004.© Springer-Verlag Berlin Heidelberg 2004

390 M. Lin, J. Zhu, and Z. Sun
large set of representative patterns to train the neural networks. Unfortunately, it isdifficult to obtain these training patterns that contain no contradictory information.Insufficient training data may result in an incomplete rule base, while the conflictingamong the training data may cause incorrect fuzzy rules.
RL only require a scalar reinforcement signal as a performance feedback from theenvironment, which makes it very attractive in navigation learning problems.However, due to the large dimension of the input space for learning obstacleavoidance, the search space becomes too large to allow efficient learning. Thisproblem has led some researchers to develop hierarchical RL methods that aim tomake learning more tractable through the use of varying levels of details [7, 8], andothers to use complex statistical methods to speed up learning [9]. Another approachis the use of a function approximation method to approximate the value table [10].However, this introduces the additional problem of selecting a good approximationmethod for the task, and does not retain many of the theoretical guarantees known tothe tabular reinforcement methods.
In this paper, in order to reduce the dimension of the input space, five agents aredefined to associate with the sensor readings in five directions, and Q-learning withfuzzy states is applied in these agents to directly learn obstacle avoidance behavior.The robot chooses a final action employing some kind of arbitration based on theactions recommended by the five agents. After hundreds of collision, the robot canachieve collision-free navigation based on the goal information and the learnedobstacle avoidance behavior. This paper is organized as follows. In section 2, thesensors arrangement and robot model is described. The agent design, sensor readingcodification, and the algorithm description of learning from collision are presented insection 3. The whole navigation system integrating goal information and obstacleavoidance is expatiated in section 4. The simulation results are given in section 5.And in section 6, we state our conclusions and future work.
2 Sensor Arrangement and Mobile Robot Model
As depicted in Fig. 1, the robot model used is a cylindrical mobile platform with aradius, of 10cm. The robot is equipped with a set of range sensors, such asultrasonic ones, via which it can sense the local environment. In this research, 25sensors arranged radially from the robot center are assumed to give an angular spatialresolution of 9°. Each sensor gives the distance for i=1 to 25, from the robot centerto a possible obstacle that lies within its maximum range of view (60cm).
To reduce the dimension of input space, the sensors of the robot are divided intofive sensor groups, for i=1 to 5, responsible for sensing the environment in theright, front-right, front, front-left, and left direction of the robot, respectively. Eachsensor group consists of five neighboring sensors so that its scanning angle is 45°. Thedistance to a possible obstacle measured by the i-th sensor group is defined as
The whole sensors cover an angle from –112.5° to 112.5° and the scanning angle is225°. For the j-th sensor, it angle with respect to the robot frame is

Learning Obstacle Avoidance Behavior 391
Fig. 1. Sensor arrangement of the mobile robot
We assume that the robot is driven by two active wheels. The x-axis of the robotcoordinate frame is aligned with the moving direction of the robot. And the origin ofthe frame is defined to be the midpoint of the axis linking with the centers of the twowheels. The dynamics of the robot is not considered. The kinematic model of themobile robot is
where are the translational and rotational velocities of the robot, arerotational velocities of the left and right wheel, R is the wheel radius, R=1cm, and L isthe distance between the centers of the two wheels, L=10cm
The maximum rotational velocity of the robot wheels, is 10 rad/s.According to equation (3), and ifAnd and if
3 Learning from Collision
3.1 Agent Specification
Large dimension of the input space usually leads to heavy learning phase in RL. Inour method, we specify five independent agents, for i=1 to 5, to be associatedwith the respective sensor groups, The agent’s FOV is defined to be the FOV ofits corresponding sensor group. The remarkable advantage of such a proposal is that itcan dramatically reduce the state space of each agent, which is just one portion of thewhole space. In our method, each of the five agents has three states and three actions,and the number of state-action pair is 3x3=9, while the dimension of the whole stateand state-action space is and if only one agent is employed and its states arethe concatenation of the sub-states in the five directions.

392 M. Lin, J. Zhu, and Z. Sun
3.2 State Codification
For each agent, its environment state is considered as a distance notion between therobot and possible obstacles in respective directions. One proposal is to divide theinterval from 0 to the maximum range of the sensors into several subintervals, andeach subinterval is classified as a distance notion. However, this kind of division isnot consistent with the fact of gradual change of distance. It treats equally all valuesbelonging to the same class, not differentiating the values close to the boundary andthose far away from the class boundary. To solve this problem, the notion of fuzzy isemployed in the partitioning of distances. Three fuzzy sets are defined to represent thefollowing linguistic concepts, near, medium, and far, as depicted in Fig. 2.
Fig. 2. State codification in distance notions Fig. 3. Alternative actions of the agents
3.3 Action Specification
The movement of the mobile robot is constrained by its kinematic model. The robotgets a 0 rotational and maximum translational velocity if its wheels take the velocityof And when the robot turns “100% left/right”, that is, the wheels take avelocity of the robot gets a largest positive/negative rotational velocityand its translational velocity is 0.
It is obvious that the robot would not collide with any obstacle if it turns 100% leftor right, as the position of the robot does not have any change. In order to makelearning from collision applicable, three typical actions, and are chosen forthe five agents, as depicted in Fig. 3. Action is “go ahead”, an action leading to themaximum translational velocity and 0 rotation. We get action if the wheels velocityis Action is “turn 50% left”, which means that the rotational velocityof the robot is a half of that of “turn 100% left” and the translational velocity is thelargest in this case. Let the wheels velocity be we have action In asimilar way, we get if the wheel velocity is
3.4 Q-Learning with Fuzzy States
We believe that for a robot, the experience of collision with possible obstacles is veryuseful. The valuable information exploited from collisions can be used to improve therobot navigator, so that a collision would not happen again in a next time when therobot is in a similar situation. We think the obstacle avoidance behavior could beimproved through learning the collisions that the robot experienced. So, in this paper,

Learning Obstacle Avoidance Behavior 393
the robot is programmed to seek to collide with possible obstacles and learns fromthese collisions to gradually establish the evaluation of possible collision in differentstates. RL is particularly appropriate for this kind of learning task, as an agent can useit to learn a behavior through trial-and-error interactions with the environment.
In the field of RL, Q-learning is a model-free algorithm based on stochasticdynamic programming and has received the bulks of attention by researchers, mostlikely for its simplicity and convergence proof. We choose the well-known Q-learningfor the five agents to learn from possible collisions. The Q value means the long-runreward of collision. In the point of view of an agent, the higher the Q(s, a), the higherpossibility the robot will collide with an obstacle when it is in state s and performsaction a. The Q value of the one-step Q-learning algorithm is updated as follows.
The standard Q-learning algorithm has to be modified to be applicable with fuzzystates. For an agent, the current state s is determined as the fuzzy set to whom themembership degree of the distance to an obstacle, d, is the biggest, depicted inequation (5). As the agent is in a fuzzy state s with a membership degree of thenew reward, r’, is defined in equation (6).
where for j=1, 2, 3 represents the fuzzy set near, medium, and far, respectively.To avoid local maximum, policy is used in the action choice.
3.5 Multi-agent Learning
At each time step, each agent determines its state, and recommends an action basedon the three action values of the current state. As the agents behave independently, theactions recommended by the agent may be inconsistent. We use a mechanism ofarbitration to deal with this problem, depicted in Fig. 4. The arbitrator chooses thefinal action a with the largest Q value, also employing policy. This finalaction is the actual taken action for all the five agents. This architecture is the sameas behavior-based approach in robotics. The notable point is that each agentcorresponds to a behavior and these behaviors can learn to improve themselves.
We define the immediate reward r is 1 with a collision and 0 with no collision. If acollision will happen after the robot performs the action a, then the collision area isestimated and the agents whose FOV has some overlap with that area receive areward of and other agents receive 0. If no collision will happen, thenall the agents receive a reward of 0. In Fig. 5, the robot initially is centered in O andits heading is aligned with the x-axis. The current states of the five agents are fori=1 to 5. After taking an action “turn 50% right”, the robot will move to O’ and thendetects a collision. The collision area is dark-grey-shaped. This area is located in the

394 M. Lin, J. Zhu, and Z. Sun
FOV of the and so they receive a reward of and while others
receive 0. If the robot detects a collision, then it will be reset randomly in the freespace after the action values of each agent have been updated. The whole learningalgorithm for the five agents is presented in Fig. 6.
Fig. 4. Learning and arbitration Fig. 5. Collision happens
Fig. 6. Learning algorithm
4 Collision-Free Navigation
After hundreds of collision, the robot has sufficiently learned the knowledge ofcollision. This knowledge is the long run reward of collision and larger action valuemeans more possible collision. In navigation, the robot can choose an action withrelatively low action value while considering the specified goal direction. In this way,the robot can show a behavior of obstacle avoidance while moving to the goal.
We assume the robot knows the goal direction, and its own heading by means ofsome sensor. The goal direction is the angle difference of the straight line connectingthe robot center and the goal configuration, and the current robot heading. In

Learning Obstacle Avoidance Behavior 395
navigating, plays an important role inchoosing the final action. If the goal is infront of the robot, then it is better to takeaction “go ahead”. We define goal factor,gf, as the preference of an action basedon the goal information. Each actioncorresponds to a gf. The greater the gf,the more the robot prefers the actionconsidering Fig. 7 depicts the gfs ofthe three actions.
Fig. 7. The gfs of the actions, “go ahead”,“turn 50% left”, and “turn 50% right”
Fig. 8. Action value synthesis and tradeoff between goal information and obstacle avoidance
Fig. 9. The algorithm of synthesis and tradeoff
For an agent, the action value means the evaluation of possible collision. At each timestep, each agent reports three evaluations corresponding to the three actions. As theseevaluations are local and usually inconsistent, the global evaluations of collisionassociate with the three actions have to be integrated. It has been proven that theaction value will converge if the state-action pairs are visited infinitely. As it isimpossible to trial infinitely, we just use the mean of the Q values, MQ, over the rearperiod of collisions to approximate the convergence values in our research. For an

396 M. Lin, J. Zhu, and Z. Sun
action, we simply summate the corresponding MQ values of the five agents toproduce the global evaluations of collision of this action. As the robot prefers anaction that has a relatively low global collision evaluation, considering obstacleavoidance, and it also prefers an action that is more beneficial for it to move to thegoal, so, these two factors have to be compromised to generate the most appropriateaction. The diagram and algorithm of the synthesis and the tradeoff between the goalinformation and obstacle avoidance is depicted in Fig. 8 and 9.
5 Simulation Results
To test its functionality, the proposed algorithm is applied to a simulated mobilerobot. It is assumed that the radius of the robot is 10cm and the size of theenvironment is The maximum measurement range of the sensors is60cm. The parameters used in the simulations arein learning phase, and in navigating phase.
The environment has some randomly distributed obstacles with arbitrarily shapes.In the learning phase, the robot seeks to collide with possible obstacles. At each timestep, each of the five agents independently recommends an action, and then the actionthat is most likely to lead to a collision is chosen to take. Usually the agents receive areward of 0, except when a collision happens and the corresponding agents receive areinforcement signal of Then the action values of the agents are updated based
on the rewards received. According to our empirical estimation of learningconvergence, the learning process is ended after 1000 collisions have happened.Fig. 10 shows the learning graph of the values of the three actions (“go ahead”, “turn50% left”, and “turn 50% right”), depicted as solid, dashed, and dotted lines, in thestate “near” and “far”, respectively. In (a), the value of “go ahead” is very close to 1,meaning that a collision is very likely to happen if taking this action. In (b), the threeaction values are relatively low and have no distinct difference, indicating a relativelylow possibility of collision. In (c) and (d), the action value of turning 50% right/left ishigher than that of turning 50% left/right. This is reasonable because turning 50%right/left” will of course lead to a more possible collision, when an obstacle is near inthe front-right/left direction.
The learned knowledge of collision is used in navigation in the way of choosing theaction having the least evaluation of collision. Fig. 11 illustrates the robot navigationcontrails with different starting configurations. In (a), the robot successfully navigatesto the goal from four starting positions. In (b), there are four successful navigationsand one failure, which is possibly because of the confined area near the collisionposition. Nevertheless, the ratio of successful navigation is noticeably high.
6 Conclusions and Future Work
In this paper the proposal of learning obstacle avoidance behavior is presented for amobile robot that has no prior knowledge of the environment and experience of

Learning Obstacle Avoidance Behavior 397
navigation. The FOV of the robot sensors is partitioned into five portions, right, front-right, front, front-left, and left. And five agents are defined to be associated with theseportions. First, the robot seeks to collide with obstacles and Q-learning with fuzzystates is applied in these agents to learn the knowledge of collision. Each agentindependently recommends an action and the final action is generated through amechanism of arbitration. After hundreds of collision learning, the robot can navigateto a specified goal position, with high successful ratio, based on the goal informationand the learned obstacle avoidance behavior.
Future work will primarily concern on applying this method with continuousactions and incorporating prior knowledge into these agents.
Fig. 10. The Q value of the agents in different states
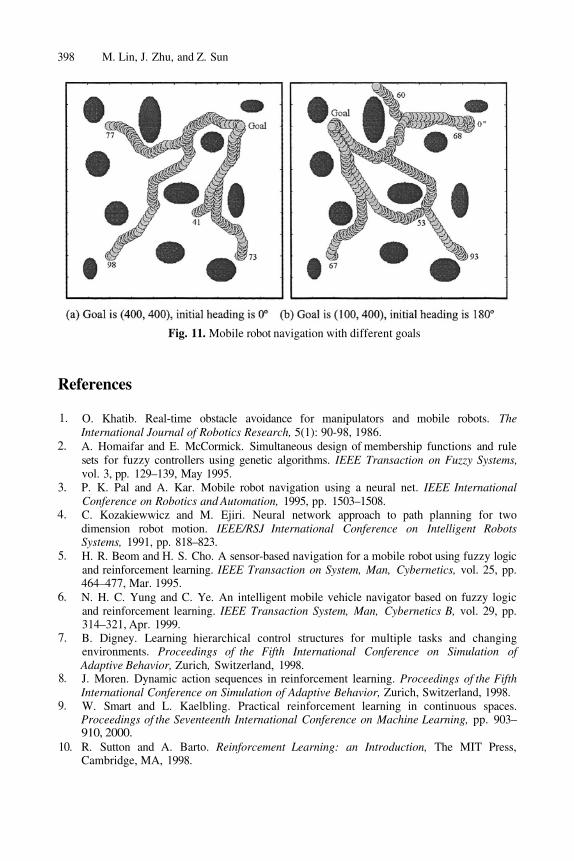
398 M. Lin, J. Zhu, and Z. Sun
Fig. 11. Mobile robot navigation with different goals
References
1.
2.
3.
4.
5.
6.
7.
8.
9.
10.
O. Khatib. Real-time obstacle avoidance for manipulators and mobile robots. TheInternational Journal of Robotics Research, 5(1): 90-98, 1986.A. Homaifar and E. McCormick. Simultaneous design of membership functions and rulesets for fuzzy controllers using genetic algorithms. IEEE Transaction on Fuzzy Systems,vol. 3, pp. 129–139, May 1995.P. K. Pal and A. Kar. Mobile robot navigation using a neural net. IEEE InternationalConference on Robotics and Automation, 1995, pp. 1503–1508.C. Kozakiewwicz and M. Ejiri. Neural network approach to path planning for twodimension robot motion. IEEE/RSJ International Conference on Intelligent RobotsSystems, 1991, pp. 818–823.H. R. Beom and H. S. Cho. A sensor-based navigation for a mobile robot using fuzzy logicand reinforcement learning. IEEE Transaction on System, Man, Cybernetics, vol. 25, pp.464–477, Mar. 1995.N. H. C. Yung and C. Ye. An intelligent mobile vehicle navigator based on fuzzy logicand reinforcement learning. IEEE Transaction System, Man, Cybernetics B, vol. 29, pp.314–321, Apr. 1999.B. Digney. Learning hierarchical control structures for multiple tasks and changingenvironments. Proceedings of the Fifth International Conference on Simulation ofAdaptive Behavior, Zurich, Switzerland, 1998.J. Moren. Dynamic action sequences in reinforcement learning. Proceedings of the FifthInternational Conference on Simulation of Adaptive Behavior, Zurich, Switzerland, 1998.W. Smart and L. Kaelbling. Practical reinforcement learning in continuous spaces.Proceedings of the Seventeenth International Conference on Machine Learning, pp. 903–910, 2000.R. Sutton and A. Barto. Reinforcement Learning: an Introduction, The MIT Press,Cambridge, MA, 1998.

Towards Well-Defined Multi-agent ReinforcementLearning*
Rinat Khoussainov
Department of Computer Science, University College DublinBelfield, Dublin 4, Ireland
Abstract. Multi-agent reinforcement learning (MARL) is an emerging area ofresearch. However, it lacks two important elements: a coherent view on MARL,and a well-defined problem objective. We demonstrate these points by introduc-ing three phenomena, social norms, teaching, and bounded rationality, which areinadequately addressed by the previous research. Based on the ideas of boundedrationality, we define a very broad class of MARL problems that are equivalent tolearning in partially observable Markov decision processes (POMDPs). We showthat this perspective on MARL accounts for the three missing phenomena, but alsoprovides a well-defined objective for a learner, since POMDPs have a well-definednotion of optimality. We illustrate the concept in an empirical study, and discussits implications for future research.
1 Introduction
Multi-agent reinforcement learning (MARL) addresses the following question: “Howcan an agent learn to act optimally in an a priori unknown dynamic environment throughtrial-and-error interaction in the presence of other self-interested and possibly adapt-ing agents?” There are numerous practical application domains for MARL, such asrobotic soccer, electronic market places, self-managing computer systems, distributedWeb search, or even military/counter-terrorism applications. While single-agent RL hasbeen an active area of research in AI for many years, MARL is a relatively new field.
We do not have sufficient space in this paper to provide a detailed survey of the priorwork in MARL, but we can point out two important issues in the current state of research:the lack of a coherent view on MARL; and the lack of a well-defined objective for aMARL algorithm. What behaviour should an agent learn in a multi-agent environment?In single-agent RL, this problem is well-defined, since the agent’s performance dependsonly on its own actions. In a MA environment, the agent’s performance may depend onsimultaneous actions of others. Thus, a given agent would need to know what to expectfrom the other agents, and the optimal behaviour may change as the other agents alsoevolve (adapt) over time.
The question of a clear research agenda has been already emphasised by severalRL researchers and is becoming a topic of much ongoing debate in the area [1]. The
* Thanks to Nicholas Kushmerick for helpful discussions and valuable comments. This researchwas supported by grant SFI/01/F.1/C015 from Science Foundation Ireland, and grant N00014-03-1-0274 from the US Office of Naval Research.
C. Bussler and D. Fensel (Eds.): AIMSA 2004, LNAI 3192, pp. 399–408, 2004.© Springer-Verlag Berlin Heidelberg 2004

400 R. Khoussainov
contributions of this paper are as follows. We demonstrate the lack of a coherent viewon MARL by introducing three phenomena inadequately addressed by the previousresearch: social norms, teaching, and bounded rationality. While these phenomena arenot new to MARL, none of the previous works attempted to systematically account forall three together, and many papers ignore all of them. Based on the ideas of boundedrationality [2], we define a very broad class of “realistic MA learners”, and show thatMARL in this case is equivalent to learning in partially observable Markov decisionprocesses (POMDPs). Such perspective on MARL accounts for the above phenomena,but also provides a well-defined objective for a learner, since POMDPs have a well-defined notion of optimality. Finally, we illustrate the proposed concept in an empiricalstudy, and discuss its implications for future research.
2 Formal Framework and Definitions
The standard RL model [3] consists of the two main components: a learning agent anda dynamic environment. The agent is connected to its environment via perception andaction signals. The interaction with the environment proceeds in steps. At each step,the agent receives as input some indication (observation) of the current state of theenvironment and then generates an output by choosing some action. The action changesthe state of the environment, and the value of this state transition is communicated backto the agent using some scalar reinforcement signal (reward, or payoff).
In a MA scenario, there may be several agents acting in the same environment,and their actions may affect not only the state transitions, but also the rewards of eachother. Formally, a MA environment is well modelled as a stochastic game (SG) [4].A stochastic game is a tuple where I is the number ofagents, also called players in the game, S is a set of the game states, is the initialstate, and is the set of actions available to player If is the action selected byplayer at some step, then is an action profile (or a joint action). A set
is the set of all possible action profiles.is a payoff function of player is a stochastic state transitionfunction, which for given state and action profile returns a probability distribution overthe possible next states. That is, gives the probability that after performingjoint action in state the next state of the game will be
Stochastic games are a generalisation of Markov decision processes (MDPs) [3]to multiple decision makers. In general, the environment can be non-deterministic, i.e.taking the same joint action in the same state may result in different state transitionsand/or reinforcements. However, it is usually assumed that the probabilities of makingstate transitions or receiving specific rewards do not change over time. A game historyin a stochastic game is a sequence of tuples where is the players’ action profile(joint action) at some step of the game and is the next state.
The goal of the agent is to find a decision rule (a policy) that maximises some long-term measure of the reinforcement. From the agent’s point of view, there are two types ofenvironments: fully observable environments and partially observable environments. Infully observable environments, the agent can reliably observe the game history at eachstep. In partially observable environments, agents have incomplete information about the

Towards Well-Defined Multi-agent Reinforcement Learning 401
game. For example, an agent may not be able to distinguish between some states of theenvironment based on his observations, or he may not be able to observe actions of otherplayers. An observation function is a mapping from a set of possible elements of thegame history to a set of possible observations for player
is the probability that player receives observation when the game statechanges to after agents realise action profile
A policy (or strategy) of a player in a stochastic game is a function that maps pos-sible sequences of observations of a player to probability distributions over the player’sactions: where is a set of possible observation sequences
of player If the mapping is deterministic thenthe strategy is called deterministic. A strategy of a player in a stochastic game is calledMarkov or reactive if it is a function only of the current observation(i.e. if the player’s action at a given step depends only on the current observation of thegame at that step).
Let be a sequence of rewards received by the agent over K steps ofinteraction with the environment. The long-term reward for a given sequence of rewardsfrom separate steps can be calculated as a discounted sumwhere is a discount factor, or as average reward:The case when the long-term performance is analysed over infinitely many steps is calledthe infinite horizon model. The long-term payoff in the infinite horizon case is evaluatedas a limit for The infinite-horizon discounted summodel has received the most attention in RL due to its mathematical tractability.
3 Optimality in Stochastic Games
Unlike in the single-agent case (MDPs), the optimal behaviour in stochastic games is ingeneral opponent-dependent. That is, the long-term payoff of a player’s strategy can onlybe evaluated given the strategies of the other players in the game. Therefore, the notionof optimality has to be replaced with the notion of best response. A player’s strategy isthe best response to a combination of strategies of other players (opponents) in a game, ifit maximises the player’s payoff for the given strategies of the opponents. Consequently,a strategy is optimal, if it is the best response to the combination of strategies used byother players in the game. A fundamental problem is that a player cannot know whatstrategies opponents will use, because he has no direct control over their behaviour (allplayers are independent in selecting their strategies). Moreover, the opponents’ strategiesmay change over time as the opponents adapt their behaviour.
Game theory attempts to resolve this uncertainty using the concept of Nash equilib-rium [5]. Nash equilibrium captures a situation in a game in which each player holdsthe correct expectations about the other players’ behaviour and acts the best response tothose expectations. Let be the expected long-term payoff of playerfor the given players’ strategies combination A strategy combinationis a Nash equilibrium, if , for anystrategy for all players That is, no player can increase its payoff by unilaterallydeviating from the equilibrium. The idea behind Nash equilibrium is that if there was amechanism that correctly predicts for a player what strategies his opponents will use, then

402 R. Khoussainov
the main requirement for such a mechanism would be that it should not be self-defeating(i.e. knowing the predictions of this mechanism players should not have incentives tocontradict it). Thus a valid prediction must be a Nash equilibrium.
However, the predictive power of the Nash equilibrium is limited by two problems.The first problem is the possible multiplicity of equilibria. When there are multipleequilibria in a game, players need to reach a coordinated equilibrium outcome to playoptimally. The second problem is the assumption that all players in the game haveequal reasoning capabilities. If one player can analyse the game to correctly predict thebehaviour of other players, then the other players also have these abilities to analysethe game. That is, we assume that all players are equally “clever” (equally rational) andpossess the same necessary information about the game to derive their expectations.Generally speaking, this assumption may not always hold in practice.
4 Previous Work
Many learning methods in SGs focused on extending traditional RL algorithms likeQ-learning [3] to MA settings. Most of results, however, are for a limited class of single-state SGs, called repeated games. Unlike in single-agent RL, the long-term payoff ofan action in a SG depends on the strategies of opponents, so the learner has to makesome assumptions about the opponents’ behaviour. In Minimax-Q [6], a player learnsto select at each step the action that maximises the reward the player can guarantee.However, this strategy works well only in zero-sum games (two-player games wherethe sum of players’ payoffs at every step is zero). Nash-Q [7] extends Minimax-Q togeneral-sum games by choosing actions that are a part of some Nash equilibrium ofthe constituent one-step game. Since there may be many Nash equilibria in a game, theanalysis is restricted to special cases of games with globally optimal points and saddlepoints, where equilibrium selection is simplified.
Opponent modellers try to model the opponents’ strategies from interaction experi-ence and construct a best-response strategy to those models. Examples of this approachare joint action learners (JALs) [8] and finite automata modellers [9]. These methods canwork well when the opponents’ strategies are fixed, but are questionable when playerslearn. PHC and WoLF-PHC [10] are two algorithms for MARL in fully observable do-mains based on apolicy search approach. PHC is essentially an extension of Q-learning tonon-deterministic Markov polices. WoLF PHC uses variable learning rate to encourageconvergence of the algorithm to a Nash equilibrium in self-play.
5 Multi-agent Learning Revisited
There are several phenomena that are addressed inadequately in MARL. We subdividethem into social norms, teaching considerations, and bounded rationality. While these is-sues are not entirely new to MARL, none of the previous approaches provides a completeand systematic coverage of them, and too frequently they are simply ignored.
Social norms. SGs have a rich structure of equilibrium behaviour that may be in-terpreted in terms of a “social norm” [5]. The idea is that players can sustain mutuallydesirable outcomes, if their strategies involve “punishing” any player whose behaviour

Towards Well-Defined Multi-agent Reinforcement Learning 403
is undesirable. This is regulated by the “folk theorems”1 originally proposed for single-state SGs, called repeated games. Two-player repeated games can be described by agame matrix that specifies the players payoffs for each possible joint action. Considerthe example of repeated Prisoner’s dilemma (RPD) [5] in Table 1. At each step of thegame, players select one of the two possible actions C or D and receive the respectivepayoffs as specified in the table. At the next step, the same game repeats.
A one-step Prisoner’s dilemma has a unique Nash equilibrium where both playerschoose C. Indeed, no matter what action the opponent selects, the player is always betteroff choosing C. In the case of RPD however, the outcome (D, D) can also be sustainedas equilibrium, if each player punishes the opponent for deviation by also switchingto C. If both players follow such strategy, then it is better for them to play (D, D)repeatedly, receiving payoff of 3 at each step, rather than getting the higher deviationpayoff of 4 in a single period, but receiving a lower payoff of 1 in all subsequent steps.The formal results below are derived for infinite-horizon average payoff games (calledlimit of means games), though similar results exist for discounted games too.
A vector is called a feasible long-term payoff profile in a limit of meansSG with initial state if there is a combination of players’ strategies suchthat whereis the expected payoff of player at stage for the given initial state and players’strategies. Let denote a strategy profile of all players except We define theminimax payoff of player in a limit of means SG with initial state as
Essentially, the strategy profile cor-responding to the minimax is the most severe punishment that other players can inflicton for the given initial state. A payoff profile is strictly enforceable in SG withinitial state if it is feasible and for all Intuitively, enforceable profilesare the outcomes where each player can be punished, and so threats of punishment cansustain the outcome as an equilibrium.
Proposition 1 (Folk theorem for limit of means stochastic games)Define the following assumptions: (A1) – the set of feasible long-term average payoff
profiles is independent of the initial state; (A2) – the long-term average minimax payoffof each player is independent of the initial state. For a given limit of means stochasticgame and assumptions (A1)–(A2), any strictly enforceable long-term average payoffprofile is a Nash equilibrium payoff profile of the game [11].
Informally, assumption (A2) tells us that the punishment is always effective for allplayers, while assumption (A1) tells that the desired payoff profile can be achieved fromany state (hence, it can be achieved after punishment as well). Since repeated games have
1 The term used in the game theory community, since their originator is apparently unknown.

404 R. Khoussainov
only a single state, and the feasible payoff profiles in a limit of means repeated gameare the same as in the constituent one-shot game, any strictly enforceable payoff profilein the constituent one-shot game is a Nash equilibrium payoff profile of the repeatedgame [12]. An example of such a punishing strategy for RPD is Tit-for-Tat [13]. Tit-for-Tat starts by playing D and then plays the same action that the opponent in the previousperiod. The optimal strategy against Tit-for-Tat is to always play D.
Folk theorems (especially for repeated games) have been known in game theoryfor a long while. However, they received very little attention in MARL. Implementingpunishing strategies requires the players to be able to condition their behaviour ona possibly long game history. At the same time, most MARL algorithms focused onlearning only reactive policies which may be inadequate for sustaining social norms.
Teaching. Learning in games has been studied extensively in game theory as well.However, in game theory learning was used as an alternative way to explain the conceptof equilibrium as a long-term outcome arising out of a process in which less than fullyrational players search for optimality over time. An important point here is that actionsof a player influence the learning and, hence, the future play of the opponents. That is,a player is learning himself and simultaneously teaching other players. Thus, in suchenvironments the players ought to consider not only how their opponents may play inthe future, but also how players’ current behaviour will affect the future play of theopponents. As a result, a player’s strategy may become to “teach” the opponents to playa best response to a particular action by playing that action over and over.
Consider an example repeated game from [14] described by Table 2. Since actiondominates for the row player, a row player who ignores considerations of the repeatedplay will choose as her strategy. Consequently, the column player will eventually learnto play because maximises his payoff for the given strategy of the row player. Hence,the learning process will converge to outcome where the row player’s payoff is2. However, if the row player is patient and knows that the column player “naively”chooses his strategy to maximise his own payoff given the history of the row player’sactions, then the row player can do better by always playing This will lead the columnplayer to choose as his strategy, yielding a payoff of 3 to the row player. Essentially,a “sophisticated” and patient player facing a naive opponent can develop a “reputation”leading the learning process to a desired outcome.
Most of game theory, however, ignores these teaching considerations, explicitly orimplicitly relying on a model in which the incentive to try to alter the future play ofopponents is negligible. One class of such models that make the teaching considerationsnegligible are large populations. In large population models, opponents for each periodare chosen from a large population of players making interaction relatively anonymous.Unlike game theory, MARL should take into account the fact that the actions of a givenagent influence the learning and, hence, the future behaviour of other agents in the sameenvironment. However, most existing MARL algorithms either ignore these teachingconsiderations, or use them only implicitly, for example to analyse convergence prop-erties of the learning process in self-play (i.e. when opponents use the same learningalgorithm). As shown in [15], teaching can actually allow an agent to exploit his oppo-nents and achieve better individual performance.
Bounded rationality. The type of rationality usually assumed in game theory isperfect, logical, deductive rationality. Such deductive rationality presumes that all deci-

Towards Well-Defined Multi-agent Reinforcement Learning 405
sion makers possess full knowledge of the game, unlimited abilities to analyse it, andcan perform the analysis without mistakes. Bounded rationality [2] explicitly assumesthat the reasoning capabilities of decision makers are limited, and therefore, they do notnecessarily behave optimally in the game-theoretic sense. Bounded rationality proposesinductive instead of deductive reasoning.
Theoretical reasons for bounded rationality can be subdivided into knowledge limi-tations (i.e. players may not have sufficient knowledge of the game to compute an equi-librium) and computational limitations. For example, there is a large body of researchon equilibrium selection in game theory using various principles and criteria [16]. How-ever, a generic assumption that players are payoff maximisers is not sufficient to selecta unique outcome. Also, it may ultimately require characterising all Nash equilibria ofa game. The task is NP-hard even for simple one-shot games and even given completeinformation about the game [17]. In real world, agents may have physical limitations aswell (e.g. faulty acting parts) preventing them from implementing certain strategies.
The main implication of bounded rationality is that even when the deductive game-theoretic reasoning gives an unambiguous answer (e.g. the game has a unique Nashequilibrium), there is still a possibility that opponents will not be able or willing torealise it, and so playing the equilibrium strategy will not be optimal. Though one couldexpect that machine learning should rely on inductive reasoning, still many MARLalgorithms specifically focus on learning some equilibria of a game, resulting in quitelimited application scenarios and unclear supporting motivation [1]. Only recently RLresearchers have started to recognise and address this issue [10].
6 Learning with Realistic Agents
The discussion in the previous section indicates the lack of two important elements inMARL: a coherent view incorporating the described phenomena, and a well-definedobjective (a problem statement) for a learner. What should an agent learn in a MAenvironment, or what behaviour is optimal? We propose here a novel perspective onMARL that gives a possible answer to these questions.
Multi-agent learning as a partially observable MDP. In general, one can view areinforcement learner as two interacting components: a behaviour policy that is respon-sible for action selection, and an update algorithm that uses the learner’s past experienceto modify the policy so as to improve its long-term performance (see Figure 1). In par-ticular, the update algorithm can use information about game observations, rewards, andactions performed by the agent, as well as the dynamics of the current policy and someprior knowledge of the game (if available).
So far, we have focused on learning a policy that yields the best performance in thegiven environment. However, Figure 1 clearly illustrates that a reinforcement learner asa whole is nothing but a decision rule mapping observations (including reward observa-tions) onto the agent’s actions. That is, learning is simply a special form of acting whereactions are conditioned on the learning history. A reinforcement learning algorithm canessentially be viewed as a strategy in a “super” game, where players’ actions are possiblelearning strategies, and payoffs are related to the outcomes of the learning process witha given combination of strategies.

406 R. Khoussainov
Fig. 1. Inside a reinforcement learner Fig. 2. Learning in the “teaching” game
What assumptions can we make about possible learning strategies? Perhaps themost generic assumption we can make is that strategies should be computable (i.e.implementable by a Turing machine). The second assumption we make is that strategiesshould be implementable by realistic agents. Realistic agents can only have a finiteamount of memory available to them (equivalently, the corresponding Turing machinescan only have finite tapes). Taking into account that a Turing machine with a finite tape isexpressively equivalent to a finite state automaton (FSA), we obtain that realistic learningstrategies should be representable by a (possibly non-deterministic) FSA.
It is easy to see that from a single agent’s point of view a Markov environmentaugmented with several FSAs remains Markov, since at each step the immediate rewardand the next state of the environment depend only on the agent’s action, and the currentcombined state of the environment and FSAs. Therefore, learning in such environment(i.e. MA learning with realistic agents) becomes equivalent to learning in a partiallyobservable MDP (POMDP). The MDP should be partially observable, because it isunlikely that an agent will be able to observe state transitions inside other learners.
Discussion. Treating MARL as learning in POMDPs allows us to systematicallyaccount for all three previously discussed phenomena. Indeed, social norms becomejust a kind of history-dependent behaviour in a POMDP, and it is well known that inPOMDPs history-dependent policies can achieve better performance [18]. Getting highrewards in MDPs requires an agent to bring the environment into “well-paying” states.Since now other learners are just a part of the environment from a given agent’s point ofview, teaching can be viewed as changing the state of other agents to get better rewards.Finally, bounded rationality served as a defining assumption for the realistic learners inour model. The proposed perspective on MARL provides a well-defined objective for aMA learner, because POMDPs have a well-defined notion of optimality
Similar considerations have been proposed in [1], where the authors put forward threeresearch agendas: distributed AI (designing an adaptive procedure for decentralised con-trol of a set of agents); equilibrium agenda (investigating whether given learning strate-gies are in equilibrium); and AI agenda (finding the best learning strategy against a fixedclass of opponents). By defining such a fixed class of opponents as “realistic learners”,we have merged these three agendas. Equilibrium strategies and optimal strategies areequivalent in POMDPs. The distributed AI agenda can be viewed as common-payoff

Towards Well-Defined Multi-agent Reinforcement Learning 407
games, where all agents have the same payoff functions, and thus it ultimately reducesto finding the best strategy in the corresponding POMDP. The proposed concept doesnot make MARL easier, but it does provide a coherent view on the previous approachesand possible future directions. From the POMDP perspective, MA learning algorithmsthat try to take into account the possibility that other agents’ strategies may changeover time, simply try to account (in somewhat specific ways) for the hidden state of theenvironment.
Empirical illustration. To illustrate the proposed concept on a concrete example,we used the teaching game in Table 2, where the column player uses the following simplelearning algorithm (also known as fictious play in game theory [14]). It assumes that therow player’s strategy is a stationary probability distribution over his actions. The learnertries to empirically estimate this distribution and plays the best response to the currentestimation. Let be the number of times the row player selected action in the past.Then the column player estimates the probability that the row player selects as
and the expected payoff for playing action as 2 Similarcalculations are done for the action. Hence, the strategy of the column player is tochoose if and otherwise.
The row player used the GAPS algorithm [19] originally developed for learningin POMDPs. GAPS belongs to the class of policy search algorithms which essentiallyperform search in a (usually restricted) space of possible policies for the one that givesthe highest long-term reward [3]. In GAPS, the learner plays a parameterised strategyrepresented by a non-deterministic FSA, where the parameters are the probabilities ofactions and state transitions. The automaton’s inputs are game observations, the outputsare the player’s actions. GAPS implements stochastic gradient ascent in the space ofpolicy parameters. After each learning trial, parameters of the policy are updated byfollowing the reward gradient. The advantage of GAPS is that it can learn history-dependent policies, since past observations can be memorised in the FSA state.
Each learning trial consisted of 300 steps, and the GAPS policy had 4 states. Theplayers’ observations consisted of the action taken by their opponent at the previousstep. We used average payoff to evaluate the long-term performance of the players. Aspointed out in Section 5, a clever player can teach the column learner that his strategyis by repeatedly playing it, and thus encourage the column player to choose Thisbehaviour yields the row player the average payoff of 3 instead of the one-shot Nashequilibrium payoff of 2 for Figure 2 shows the learning curves for both players.
As we can see, the GAPS learner managed to achieve even higher average payoffclose to 3.3. A detailed investigation of the players’ behaviour shows that the row playerfound a strategy that was following a 3-step loop, playing in two periods and inthe third one. Since for such strategy, the column player always selects
The row player receives the long-term average payoff of (3 + 3 + 4)/3 = 3.3 ….Thus, not only GAPS has taught the column player to choose but it also exploited thisbehaviour to further increase the payoff. However, unlike e.g. PHC-Exploiter in [15],GAPS knew neither the game being played, nor the learning algorithm used by theopponent or whether the opponent was learning at all. Of course, this success was onlypossible because GAPS learns stateful (non-Markov) policies that could account for thehidden state of the column learner in the resulting POMDP. While this is a very simpleexample, still it provides a good demonstration for the proposed MA learning concept.

408 R. Khoussainov
7 Conclusions
In this paper, we used the ideas of bounded rationality to define MARL as learningin a POMDP. Such perspective on MARL allows us to account for many phenomenainadequately addressed by the previous research. Most importantly, the proposed conceptgives a well-defined objective for a learner. Unfortunately, POMDPs are intractable ingeneral, so the concept in itself is not a “silver bullet” for the MARL problem. However,it provides a clear structure and direction for future efforts, which in our opinion shouldfocus on learning how to deal with the hidden environment state, rather than explicitlytrying to converge to some Nash equilibrium in self-play. For example, it emphasisesthe importance of learning history-dependent policies, or trying to infer the hiddenenvironment state, e.g. by maintaining beliefs about opponents.
One can imagine that in real world settings, learners may not only change their strate-gies, but also become more “computationally clever”, e.g. by acquiring more memory.Thus, an interesting direction for future work is to investigate such extensions to theproposed framework.
References
1.
2.3.4.5.6.
7.
8.
9.
10.
11.12.
13.14.15.
16.
17.
18.
19.
Shoham, Y., Grenager, T., Powers, R.: Multi-agent reinforcement learning: A critical survey.Tech.rep., Stanford University (2003)Simon, H.: Models of Man. Social and Rational. John Wiley and Sons (1957)Sutton, R., Barto, A.: Reinforcement Learning: An Introduction. MIT Press (1998)Filar, J., Vrieze, K.: Competitive Markov Decision Processes. Springer Verlag (1997)Osborne, M., Rubinstein, A.: A Course in Game Theory. The MIT Press (1999)Littman, M.: Markov games as a framework for multi-agent reinforcement learning. In: Proc.of the 11th Intl. Conf. on Machine Learning. (1994)Hu, J., Wellman, M.P.: Nash Q-learning for general-sum stochastic games. Journal of MachineLearning Research 4 (2003)Claus, C., Boutilier, C.: The dynamics of reinforcement learning in cooperative multiagentsystems. In: Proc. of the 15th AAAI Conf. (1998)Carmel, D., Markovitch, S.: Learning models of intelligent agents. In: Proc. of the 13th AAAIConf. (1996)Bowling, M.: Multiagent Learning in the Presence of Agents with Limitations. PhD thesis,Carnegie Mellon University (2003)Dutta, P.K.: A folk theorem for stochastic games. J. of Economic Theory 66 (1995)Rubinstein, A.: Equilibrium in supergames. In: Essays in Game Theory. Springer-Verlag(1994)Axelrod, R.: The Evolution of Cooperation. Basic Books (1984)Fudenberg, D., Levine, D.K.: The Theory of Learning in Games. The MIT Press (1998)Chang, Y., Kaelbling, L.P.: Playing is believing: The role of beliefs in multi-agent learning.In: Advances in Neural Information Processing Systems. Volume 14., The MIT Press (2001)Harsanyi, J., Selton, R.: A General Theory of Equilibrium Selection in Games. The MITPress (1988)Conitzer, V., Sandholm, T.: Complexity results about Nash equilibria. In: Proc. of the 18thIntl. Joint Conf. on AI. (2003)Singh, S., Jaakkola, T, Jordan, M.: Learning without state-estimation in partially observableMarkovian decision processes. In: Proc. of the 11th Intl. Conf. on Machine Learning. (1994)Peshkin, L., Meuleau, N., Kim, K.E., L.Kaelbling: Learning to cooperate via policy search.In: Proc. of the 16th Conf. on Uncertainty in AI. (2000)

Variant Extensions to Prove MAS Behaviours
Bruno Mermet and Dominique Fournier
LIH, Université du Havre,BP 540,
76058 Le Havre Cedex {Bruno.Mermet, Dominique.Fournier}@univ-lehavre.fr
Abstract. In this article, it is shown how the behaviour of a multi-agentsystem can be validated thanks to proof. At first, the method used isbriefly presented [10]. Then, the variant notion is presented and anextension of this notion to prove MAS is introduced. In the third part,the proof technique is illustrated for the prey-predator problem: thebehaviour of the predators can be induced from the failures in the proofprocess.
Keywords: multi-agent system, proof, variant, prey-predator
1 Introduction
For many years, many researches have dealt with software validation. On onehand, these works lead to methodologies helping to write safe systems and onthe other and, to the development of techniques and tools for validation. Atfirst, these techniques were dedicated to code validation (test, program proof bymethods like Floyd’s method). The advantage of such methods is that the targetof the validation is the real program. However, there is a major disadvantage :they can only be applied once the code as been written, that is to say at theend of the development process. That’s why program proof is nowadays oftenreplaced by specification proof. In this area, there are two kinds of proof : modelchecking and theorem proof.
the model checking method consists in an exhaustive test of all the cases.The main advantages is that the implementation of a model-checker is rathersimple and that a failure of a test clearly means that there is an error in thespecification1. However, the problem must be finite or must be able to beconverted in a finite one, and the time taken by the process may be verylong.the theorem proof is a method consisting in using the deduction rules ofthe first order logic and the sequent calculus to establish the validity of agoal with a set of hypotheses. This mechanism is hard to implement andthe undecidability of the first order logic prevents us to deduce from a prooffailure that there is a mistake in the specifications. However, with such amethod, infinite size problems may often be validated in a short time.
1 if the model-checker works well, of course
C. Bussler and D. Fensel (Eds.): AIMSA 2004, LNAI 3192, pp. 409–419, 2004.© Springer-Verlag Berlin Heidelberg 2004

410 B. Mermet and D. Fournier
For a few years, some works deal with model checking to validate multi-agentsystems. In general, these works are illustrated with small systems (less thanten agents) and with limited dynamic possibilities (the population is constant).Moreover, time dedicated to proof is often disappointing [2]. Many other workshave dealt with formal specification of multi-agents systems, for instance withthe temporal logic [8] or with Z [5], but proofs are not performed on thesespecifications.
In this article, we show how proof mechanisms allow to validate multi-agentsystems, and how a proof-oriented way of specifying helps in determining thebehaviours of the agent. In the first part, the method used is briefly reminded tothe reader [10]. In the second part, we show how the method and the principlesit relies on are extended to prove multi-agent systems. Then, an application ofthe method on a rather simple concrete problem, the prey-predator problem,is presented. In the fourth section, we show how the proof can also be used toexplain emergent phenomena. Finally, we conclude on the process and currentand future works are presented.
2 Method
2.1 Motivations
The method we use is summarised here but a full description can be found in [10].With this method, we aim to provide techniques and tools to design multi-agentsystems whose goals are to solve problems.
The method must also allow to build systems with the two following proper-ties : the system may be stopped at any time and as the time goes by, the qualityof the solution provided by the system will increase. An important characteristicsof our method is that it propose a top-down approach.
The methodology defined here must be used to solve global problems whichcan be specified by a set of local constraints (LC). A more restrictive usage con-dition presented in [10] was that this methodology was dedicated to optimisationproblems for which a trivial (but bad) solution exists. We will show in the sequelthat this restriction has been removed.
Of course, for non NP-hard and non distributed problems for which a se-quential algorithm is known, using agents (and so our methodology) is rarely agood solution because communications and synchronisations introduced by MASmake the program less efficient [11].
An example of a target problem for our methodology is the graph colouringproblem which consists in colouring a graph with a minimal number of coloursin such a way that two connected nodes do not have the same colour. Thisapplication was presented in [10].
2.2 Variant Notion
A variant is defined in a well-founded structure.A well-founded structure is a pair (S, R) where S is a set and R is an ordering
relation defined on S such that each strictly decreasing sequence of S with the

Variant Extensions to Prove MAS Behaviours 411
R ordering relation has a lower bound. An example of such a structure is the setof natural numbers with the relation <.
A variant is a strictly decreasing sequence defined on a well-founded struc-ture. So, a variant has a lower bound.
Variants are often use to prove temporal properties like liveness properties(<<something good will occur>>), for instance to prove loop termination.
2.3 Principle
The main principle of our method is to define a variant associated to the globalgoal of the system we aim to develop. The global problem is then divided intolocal sub-problems. These local problems may be re-organised in order to be asindependent as possible between each other. Finally, an agent is associated tosolve each sub-problem.
3 Variants
3.1 Global Variant and Local Variants
As it has been explained earlier, a variant, called in the sequel the global variantis associated to the global goal of the system (that is to say the problem tosolve).
Then a variant, called local variant is associated to each local sub-problem.Then, to show that the decomposition of the global problem into local sub-
problems is correct, we just have to prove that when a local variant decreases,the global variant decreases too.
However, variants that are used to prove liveness properties must decreasein a continuous way. This is satisfying to prove sequential processes, but is notwell suited to multi-agent systems, where interactions between agents sometimesleads to the impossibility to perform an action at the right time. That is whywe introduce the notion of weak variant, that weakens the constraint of thecontinuous and strict decrease of the variant.
3.2 Weak Variants
We call hard weak variant a temporal variable V defined on a well-foundedstructure (S,<) with a lower bound such that2 :
In another way, a hard weak variant does not have to continuously decrease,but must decrease infinitely often. Such a variant is more suitable to prove agentbehaviours. However, the constraint may be still too strong in some cases. Indeed,
2 in the temporal logic notation, V and are the same variable, but if V correspondsto its value at time corresponds to its value at time

412 B. Mermet and D. Fournier
an agent does not always progress to its goal : it may sometimes perform back-tracking. For instance, this can occur when an eco-agent [7] under attack has toflee.
So, we define a still softer notion, the soft weak variant. Such a variant Vdefined on a well-founded structure (S, <) must check the following property :
So the variant may sometimes increase, but must globally decrease.
4 Application to the Prey-Predator Problem
4.1 Presentation of the Problem
The prey-predator problem is a standard example of application for MAS. How-ever, there are multiple versions. That’s why we give in this introduction ourdefinition of the prey-predator problem used in the sequel.
In our case, agents are on a toric grid. Each cell can not contain more thanone agent. There is one prey agent, with a move strategy that does not mat-ter, evolving without any resource constraint. Moreover, there are four predatoragents. These agents do not communicate with a high-level language, and theirgoal is to capture the prey. They can see the whole grid. Each time an agent acts,it may move from its current cell to one of the fourth neighbour cells (north,east, south or west). The prey is captured when the four cells on which it canmove are occupied by predators, as it is shown in figure 1, where the prey isrepresented by a cross and the predators by circles.
Fig. 1. Prey capture position
Using the method [10], we aim to determine the behaviour of the predators,in order to prove that the prey is always caught.
In the first step, we will consider that the prey is static. Then, we will showhow to extend the proof to a mobile prey.
4.2 Variants of the Problem
The global Variant. The aim of the system is to have the predators to catchthe prey. In this case, the solution consists of having four predators on thecontiguous cells of the prey. On the following, we call the function

Variant Extensions to Prove MAS Behaviours 413
that give the infinite norm (also known as Manhattan distance) between thecells where are located the agents and Note that the infinite norm in atwo-dimensional space is defined by:
When and are the four predators and pr is the prey, to solvethe problem we must have:
Then, for the problem, a global variant which lower bound is zero isdefined as:
Now, we have to demonstrate that is a weak variant and when it hasreached its lower bound, the problem is solved:
First, the distance between a predator and the prey is necessarily greater orequal than 1, indeed, at the most there is one agent in a cell. Thus, the lowerbound of is 0.
When each distance between a predator and the prey equals one atmost. But we have seen that this value is at least equal to 1. Therefore, each ofthe predators is on a contiguous cell of the prey. Because there is only one agentin a cell, and there are as much predators as the number of cells contiguous tothe prey, it involves that the prey is caught and the problem is solved. Hence,
is a satisfying variant according to the goal of the problem.
Local variants: In the last section, it is shown that a solution of the prob-lem depends on the distance between each predator and the prey. Nevertheless,considering only one predator, the solution is only bound to its position (as weconsider the prey fixed). So, the problem is split into four local sub-problemswhich consist in having one predator to a contiguous cell of the prey. By the fol-lowing, such a cell is called satisfying position of a predator. As a consequence,we associate a local variant (with a lower bound equals to 1) to each localsub-problem:
We have to demonstrate that lower bound is 1 (obvious because it is adistance and there is, at most, one agent in a cell) and that its decrease involvesthe decrease of the global variant. This last point is now detailed.
According to the definition of (equation 1), It exists an such asIf it does not exist some such as then for each
hence, the decrease of the local variant involves the decrease ofthe global variant
Else, the decrease of involves the stagnation of the global variant. Thisis not conflicting with the definition of the weak variant previously seen (sec-tion 3.2), but we have to verify that the global variant will eventually decrease.

414 B. Mermet and D. Fournier
It is guaranteed if every local variants eventually decrease. Thus, there will beonly one local variant such as and this variant will decrease,involving the decrease of
If the local variant and therefore decreases, the stag-nation of the global variant is also obtained, and this case is similar to theprevious one.
Lastly, it remains to demonstrate that when every sub-problems are solved,then the global one is also solved. This is obvious, indeed, if every sub-problemsare solved:
So:and:moreover:Hence:And the global problem is now solved.
4.3 Deduction and Proof of the Agents’ Behaviour
As every sub-problems are bound to independent variables (the predator’s po-sition), an agent predator is associated to each of them (as involved by themethod [10]).
The basic behaviour of a predator agent is very simple: the agent has todecrease its local variant, so it will try to go nearer of the prey if it is not in asatisfying position.
Thus, the behaviour of a predator agent might look like this is shown onfigure 2.
Fig. 2. Behaviour of a predator, version 1
To come up to the prey involves the decrease of the variant of the problemthe agent has to solve, indeed, this variant is the distance between the agent andthe prey.
However, it is not always possible, particularly when the target cell is heldby an other predator. If the target cell is not a satisfying position, the predatorholding it will leave. Thus, the cell will be liberated; and the predator has justto wait. If the target cell is a satisfying position, the predator holding it will notleave. So, an other policy is needed.
Two policy are possible: either the agent look for another target cell, orit attacks the obstructing agent to liberate the current target. This behaviour

Variant Extensions to Prove MAS Behaviours 415
is good from the attacking agent’s point of view: its variant do not decreaseimmediately, but the liberation of the target involves that the attacking predatorshall hold it (if a third predator hold this cell before, it will also be attacked,and so on). This new behaviour is presented in figure 3.
Fig. 3. Behaviour of a predator, version 2
We have obtained an agent whose behaviour guarantees that the local variantis a weak variant. Now, we have to study how the attack is taken into account.
The attack occurs only when an agent is in a satisfying position. The fleeingagent will necessarily move away from the prey, involving its variant to increase.It has to be verified that the variant will decrease again and reach again itslower bound. Due to the agent’s behaviour, it is obvious that the variant willdecrease. Thus, we have a soft weak variant as defined in section 3.2. On theother hand, the same scenario could happen again if the fleeing agent re-attacksthe first attacking predator, involving a continuous see-saw motion between thetwo agents. To avoid this pitfall, a new behaviour is given to the predator whentheir Euclidean distance from the prey is lower than 1.5. The standard and theflee behaviour of the predators are oriented (counterclockwise): they always goon a cell on the right when they are close to the prey, as shown in the figure 4where the prey is a cross and the white arrows illustrate the fleeing moves.
The behaviour of a predator agent is now detailed in the algorithm 5.
Fig. 4. Predators’ moving in the neighbourhood of the prey
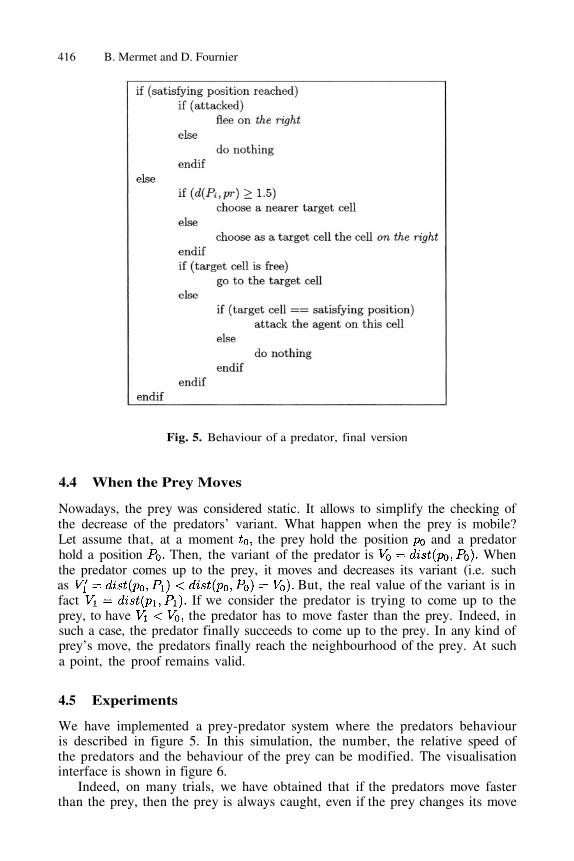
416 B. Mermet and D. Fournier
Fig. 5. Behaviour of a predator, final version
4.4 When the Prey Moves
Nowadays, the prey was considered static. It allows to simplify the checking ofthe decrease of the predators’ variant. What happen when the prey is mobile?Let assume that, at a moment the prey hold the position and a predatorhold a position Then, the variant of the predator is Whenthe predator comes up to the prey, it moves and decreases its variant (i.e. suchas But, the real value of the variant is infact If we consider the predator is trying to come up to theprey, to have the predator has to move faster than the prey. Indeed, insuch a case, the predator finally succeeds to come up to the prey. In any kind ofprey’s move, the predators finally reach the neighbourhood of the prey. At sucha point, the proof remains valid.
4.5 Experiments
We have implemented a prey-predator system where the predators behaviouris described in figure 5. In this simulation, the number, the relative speed ofthe predators and the behaviour of the prey can be modified. The visualisationinterface is shown in figure 6.
Indeed, on many trials, we have obtained that if the predators move fasterthan the prey, then the prey is always caught, even if the prey changes its move

Variant Extensions to Prove MAS Behaviours 417
Fig. 6. Simulation Interface
policy. The figure 7 shows the duration to catch the prey, given the relative speedbetween the prey and the predators.
Fig. 7. prey capture speed
5 Discussion
One of the current uses of the multi-agents systems consists in using them to solvecomplex problems by emergence of a solution [6]. There are many applicationdomains and they can be related either to the pattern recognition [4] or tothe scheduling of tasks [3]. In such systems, one seeks to solve problems (forwhich no effective algorithm is known) using a set of interacting agents. When amulti-agents system is given, this one remains particular to the studied domain.General mechanisms allowing to design such systems were already defined, suchas the attack-flee behaviour of the eco-agents [7], but without any associatedmethod. Recently, the AMAS theory [9] gives a first approach to describe multi-agents systems that solve problems by the emergence of a solution. It is based

418 B. Mermet and D. Fournier
on the resolution of non-cooperative situations (NCS). More recently, a method,ADELFE [1], has been associated to the AMAS theory Nevertheless, there isno proof of the correctness of such systems. The aim of this paper is to fill thisgap. Of course, our approach using eco-agents (that attack each others in caseof opposed goals) differs from cooperative agents used in AMAS. However, themethod gives the behaviour of the agents. There are more constraints to use itthan for AMAS because we have to define a variant for the agents’ goal, and sowe need a progress notion associated to the goal. This is not always possible.Particularly, the variant has to be defined on internal variables of the agent, thatis not possible for problems in which the constraints are strongly connected. Someworks have to be made to link our method (whose methodology aspects have tobe improved) and ADELFE (whose proof aspects are limited).
6 Conclusion and Future Works
In this paper, we have presented a way to use and extend the variant notionin the proof of multi-agents systems. This process is illustrated on the prey-predator example. We have obtained a proof of the convergence of the predators’behaviour. However, the proof is a long and difficult work, and this paper onlypresents a summary of it. To improve the effectiveness and the validation process,we have to define an automatic method. We are actually systemizing the proofmechanism. To simplify the proof, we are also working on the improve its localityto limit the number of dependencies.
Acknowledgements. We want to acknowledge Gaële Simon and MarianneFlouret for their contribution on connected researches and without which thiswork would not have been achieved.
References
1.
2.
3.
4.
5.
6.
C. Bernon, V. Camps, M.-P. Gleizes, and G. Picard. Deigning agents’behaviourswithin the framework of adelfe methodology. In Fourth International WorkshopEngineering societies in the agents world, 2003.R.H. Bordini, M. Fisher, W. Visser, and M. Wooldridge. Verifiable multi-agentprograms. In M. Dastani, J. Dix, and A. El Fallah Seghrouchni, editors, ProMAS,2004.T. Daouas, K. Ghedira, and J.-P. Müller. A distributed approach for the flowshop problem. In 3rd Interrnational conference on AI and applications, Le caire(Egypte), 1995.Y. Demazeau. La plate-forme paco et ses applications. In PRC-IA, editor, 2èmejournée nationale du PRC-IA sur les systèmes multi-agents, 1993.Mark d’Inverno, David Kinny, Michael Luck, and Michael Wooldridge. A For-mal Specification of dMARS. In Intelligent Agent IV : Proceedings of the FourthInternational Workshop on Agent Theories, Architectures and Languages, pages155–176. Springer-Verlag, LNAI 1365, 1998.A. Drogoul, N. Ferrand, and J.-P. Müller. Emergence : l’articulation du local auglobal. ARAGO, 29:105–135, 2004.

Variant Extensions to Prove MAS Behaviours 419
7.8.
9.
10.
11.
J. Ferber. Les systèmes multi-agents. InterEditions, 1995.M. Fisher. A survey of concurrent METATEM – the language and its applications.In D. M. Gabbay and H. J. Ohlbach, editors, Temporal Logic - Proceedings ofthe First Intemational Conference (LNAI Volume 827), pages 480–505. Springer-Verlag: Heidelberg, Germany, 1994.J.-P. Georgé. The amas theory for complex problem solving based on self-organisingcooperative agents. In First European Workshop on Multi-Agents Systems, 2003.Gaële Simon, Marianne Flouret, and Bruno Mermet. A methodology to solveoptimisation problems with MAS, application to the graph coloring problem. InDonia R. Scott, editor, Artificial Intelligence : Methodology, Systems, Applications,volume 2443. LNAI, 2002.Michael Wooldridge and Nicholas R. Jennings. Pitfalls of agent-oriented develop-ment. In Katia P. Sycara and Michael Wooldridge, editors, Proceedings of the 2ndInternational Conference on Autonomous Agents (Agents’98), pages 385–391, NewYork, 9–13, 1998. ACM Press.

Arabic Words Recognition with Classifiers Combination:An Application to Literal Amounts
Nadir Farah, Labiba Souici, Lotfi Farah, and Mokhtar Sellami
Laboratoire de Recherche en Informatique, Université Badji MokhtarAnnaba Algerie
{Farahnadir,Souici_labiba}@Hotmail.com
Abstract. The recognition of handwritten bank check literal amount is a prob-lem that humans can solve easily. As a problem in automatic machine readingand interpreting, it presents a challenge and an interesting field of research. Anapproach for recognizing the legal amount for handwritten Arabic bank check isdescribed in this article. The solution uses multiple information sources to rec-ognize words. The recognition step is preformed in a parallel combinationschema using holistic word structural features. The classification stage resultsare first normalized, and the combination schema is performed, after which us-ing contextual information, the final decision on the candidate words can bedone. Using this approach obtained results are more interesting than those ob-tained with individual classifiers.
Keywords: Multiclassifier system, holistic approach, combiner, syntacticanalysis.
1 Introduction
The field of handwriting recognition is a very intensive research domain that led toseveral works especially for the Latin writing [1], [2], [3]. The current systems ten-dency is oriented toward the classifiers combination [4], [5], and the integration ofmultiple information sources.
These last years, a number of papers which analyze the work done on Arabic char-acters/words recognition have appeared [6], [7], [8]. Some obstacles have played animportant role in delaying character/word recognition systems for Arabic languagecompared to other languages such as Latin and Chinese. Among these obstacles wecan find, the special morphology of Arabic writing, and the lack of communicationbetween researchers in this field.
In this article we are interested in off-line handwritten Arabic word recognition, us-ing a limited lexicon. In this direction some works moved toward markov models [9],other toward neural models [10] or toward the neuro - symbolic systems [11].
Our work leads to the realization of handwritten Arabic literal amount recognitionsystem, based on a global approach, using structural high level features (ascenders,descenders, loops, etc). The recognition is performed by a multiclassifiers system
C. Bussler and D. Fensel (Eds.): AIMSA 2004, LNAI 3192, pp. 420–429, 2004.© Springer-Verlag Berlin Heidelberg 2004

Arabic Words Recognition with Classifiers Combination 421
[12], composed of three modules, a multilayer perceptron, a K nearest neighbor classi-fier, and a fuzzy K nearest neighbor one.
A combination module is used on the outercome results by classifiers to compen-sate for individual classifier weaknesses, and a post classification step permits to vali-date the combiner propositions.
The remainder of this paper is organized as follows. In section 2 Arabic writingcharacteristics are presented, and then a brief overview of the system architecture isdone in section 3. The next sections 4 and 5 present preprocessing and features extrac-tion. The three individual classification systems are described in section 6 and theirresults in section 7. A combination approach of classifiers is introduced in section 8,then the post classification in section 9. The paper concludes with discussion of theresults and an outlook to future work.
2 Arabic Writing Characteristics
The Arabic language is very rich and difficult, by its structure and possibilities. Arabicscript is written from right to left. The Arabic alphabet consists of 28 basic characters.The shape of the character is context sensitive, depending on its location within aword. A letter can have four different shapes: isolated, at the beginning, in the middle,at the end. Some Arabic characteristics are particular, we can find for example:10 of them have one dot 03 of them have two dots 02have three dots several characters present loops
Most of the characters can be connected from both sides, the right and the left one,however there are six letters that impose a space after they can be con-nected from only the right side, it’s for this reason that Arabic language is said semicursive. This characteristic implies that each word may be composed of one unit ormore (sub-words). Some ligatures involve vertical stacking of characters, this charac-teristic complicates the problem of segmentation (known as analytic approach) [7],[8]. The considered vocabulary is composed of 48 words that can be written in anArabic literal check amount (table 1).

422 N. Farah et al.
3 Proposed System Architecture
The recognition system is constructed around a modular architecture of feature extrac-tion and word classification units.
Preprocessed word image is an input for the structural features extraction module,which transfers the extracted features toward the multiclassifier system (Figure 1). Theclassification stage is based on three parallel classifiers working on the same set ofstructural features.
The classifiers results are combined using a statistical decision system. Then the listof candidate words is analyzed by a syntactic module to accept or reject the proposi-tions done by the combiner.
Fig. 1. General diagram of the system
4 Preprocessing
The word image undergoes a set of processing before extracting the structural fea-tures. For the extraction of words from the literal amount, we use a vertical projectionmethod in addition to a heuristic (space between words is 1.5 times greater than thespaces between sub-words).Binarization. It consists in giving from a multilevel gray image, a bimodalone composed with two colors white and black [13].Smoothing. It is an operation that permits to decrease noises. In our approach wehave been inspired by the algorithm presented in [14].Baseline extraction. We adopted the method of baseline detection proposed in [14].This method consists in doing the horizontal projections of the image and to considerthe densest part as being the median one.

Arabic Words Recognition with Classifiers Combination 423
5 Features Extraction
The structural features (figure 2) used in our approach are the structural holistic ones,the number of: Descenders, ascenders, loops, one dot above, two dots above, threedots above, one dot below, two dots below, sub words.
Fig. 2. Word’s structural features (forty).
Features used in our system are the global high level ones (holistic) [1], table 2gives the considered lexicon words features.
The image contour extraction serves to describe word’s image by using Freemancode chain (figure 3), which represents the image boundaries and topology.
Fig. 3. The eight Freeman codes

424 N. Farah et al.
To solve the sub-words overlapping problem, a boundary following algorithm hasbeen used inspired of work done in [15]. For the diacritical dots extraction, we use aheuristic that consider the line thickness as it was done by Ameur & al[16]. The dia-critical dot’s is situated relatively to the baseline.
6 Structural Based Word Recognition
The achieved multiclassifiers system is composed of three different kinds of classifi-ers, which operate in parallel on the same word’s structural features. The three classi-fiers are: a neural network, a statistical K nearest neighbors system, and a fuzzy Knearest neighbors.
The Neural Network Classifier
The used neural network is a multilayered perceptron, with supervised training. Thetraining is materialized by the neurons weights values optimization; this is done withthe presentation of representative examples of the considered problem. From theseexamples, it performs a generalization for new tested words. This generalization abil-ity makes them interesting for classification and recognition problems [17].
This network has a supervised training stage; we give it two different kinds of in-formation: structural features are inputs while the output is a class among the fortyeight classes of the lexicon. The training is done by error correction of connectionweights with retro-propagation method [18].
Our Neural system parameters are:An input layer formed by 21 neurons, corresponding to 9 structural features accord-
ing to their possible occurrence numbers in the lexicon (see Figure 2): 3 for ascenders,2 for descenders, 2 for a one dot above, 2 for two dots above, 2 for three dots above, 1for one dot below, 2 for two dots below, 3 for the number of loops, 4 for sub wordsnumber.
Number of output neurons: 48 neurons (number of lexicon classes).Number of hidden neurons: it is calculated by a heuristic: the square root of (input
neurons output neurons) and then fixed experimentally to 21 neuronsThe activation function has a sigmoid form
The K Nearest Neighbors Classifier (K-NN)
The principle of the K nearest neighbors (K-NN) system consists in searching amongthe training set (prototype set or reference set), containing the individuals set and theiraffectation classes, a K number of individuals among the nearest neighbors. We searchnearest neighbors in the sense of distance between feature vectors of the tested wordand those of the training set. The closeness of a word to another is typically deter-mined by Euclidean distance. The chosen class will be the most represented among theK neighbors. The K-NN classifier conception starts by the creation of the training set,

Arabic Words Recognition with Classifiers Combination 425
which is constituted of M samples for each of the 48 words of the lexicon, every sam-ple is represented by its 21 features vector. The threshold which permits to reject or toaccept the K neighbors under test is the highest value on the representative distancesvalues inter-classes, the representative distance value of a class is the maximal dis-tance value computed between the M samples vectors of the class took by pair.
The Fuzzy K Nearest Neighbor’s Classifier (Fuzzy K-NN)
The fuzzy K-NN uses a method different from the one of the crisp K-NN. While theK-NN involves finding the hyper sphere around a word X, which contains K words(independently of their classes), and then assigning X to the class having the largestnumber of representatives inside the hyper sphere. The fuzzy K-NN method is how-ever based on computing the membership of a test word in different classes.
The introduction of imprecision and the uncertainty generated by the fuzzy notionis very well suited to the handwriting recognition problem, since there is influence ofthe variability of the manuscript, noises generated by operations on the word, thewriting style, make that borders between words classes are overlapping. We begin bysearching the K nearest neighbors of the tested word with a crisp nearest neighborclassifier, then we look for memberships (by distance calculation) of each neighbor(noted Yj) with training classes (noted i class), for every training class we have piprototypes noted Zp, this membership function [19] is given by (1):
This function permits to introduce fuzziness, which allows reclassifying Yj inclasses where it presents the highest membership value. When membership value has
been tested with the training set, we compute the membership of X noted witheach of these K nearest neighbors classes, by the formula (2):
dm represents the average distance between words of a same class in the training set.a, Fe, Fd are constants that determine the degree of fuzziness in membership space,they has been fixed experimentally to the following values : a=0,45, Fd=1, Fe=1. Wehave used a threshold S that has been fixed to 0,5.
7 Classification Results
We have used a database containing 4 800 words where 1 200 have been used fortraining the different classifier. This basis represents the 48 words of the lexicon writ-ten by 100 different writers. The test word set is composed by 3600 words.
For the neural network, we have obtained a recognition rate of 91%.

426 N. Farah et al.
For K-NN and fuzzy K-NN classifiers purpose, we have constructed four trainingbases (reference bases), in order to determine the optimal value of the K parameter,and to calculate the corresponding recognition rates. While varying the K value, andtraining bases, we get results presented in table 3.
Several remarks are noted, concerning theses results:For K=8, rates lowered distinctly in the K-NN case, it is due to the presence of a
majority number of elements from distant classes. - The parameter K value has beenfixed to 3, for these two classifiers, that is the one that gave the best results.
Recognition rates for K-NN and fuzzy K-NN are respectively 89,08% and 92,16%.
8 Decision Combination
Several strategies are possible to achieve combination, we could add or multiply theconfidence values or use maximal/minimal values [20], [21]. Furthermore, all theseapproaches assume a unique interpretation of the confidence values, for instance as aposteriori probabilities for each tested sample x.
For the K-NN classifier, is calculated for each class wi appearing in theword’s list generated by the classifier [5].
Where d(wi) is the distance between the tested word and the class Cj j=1..48.For fuzzy K-NN we have:
Where is the membership function for the tested word to class i.For the neural network, each node in the output layer is associated to one class and
its output Oi, with [zero to one] range, reflects the response of the network to thecorresponding class wi. To facilitate the combination the responses are normalizedand used as estimates of the a posteriori probability of each class [22]:
In our experiments we used a scheme called score summation [20], each classifieryields as output a list of three candidate words together with their confidence value

Arabic Words Recognition with Classifiers Combination 427
The combination consists in merging the three lists of candidates from thethree classifiers to produce a new list by confidence values summing. If a candidate ispresent in the three lists, its new confidence value is simply the sum of the three previ-ous ones. If a word exists in two lists its confidence value is equal to the sum of thetwo confidence values. Otherwise its confidence value is equal to the old one. Thislatter sorted list will be used by the syntactic analyzer to generate a syntactically cor-rect literal amount.
9 Syntax Based Post Classification
From a grammar used by the syntactic analyzer (a part is given in table 4), the postclassification phase makes a decision and generates a winner word from the set ofcandidates.
When obtaining the candidate words list by the combination stage, we distinguishtwo cases:
If there is a word which confidence value is greater than those of the other, andif this word satisfies the syntactic analysis, it is kept, and will make part of the resultedliteral amount. On the other hand if the word doesn’t satisfy the syntax, it is rejectedand we analyze the second word in the list.
If at the head of list we find different words that have the same confidencevalue, and if the words success the syntax, we retain the one given by the classifierhaving the greatest recognition rate.
10 Results and Discussion
Let’s note that the classification level generates three words lists, a combiner mergesthem to generate a single ordered list used by the post classification stage to give asyntactically correct sentence.
From errors generated by this system, we can found, the word and have somemissing features, or ill-detected, in the word diacritical dots have not been taken

428 N. Farah et al.
into account, and its first character generates a loop. According to the structural shapeof the word, we have therefore in the two cases a loop and a descender, are among theproposed solutions the two words, the analyzer takes decision according to the gram-mar.In the case where the recognition produced candidates having the same confidencevalues and are given by the same classifier, if the syntactic analysis cannot succeed toa decision, it is a syntactic ambiguity case that can be solved only with higher levelinformation. Among examples of words where the ambiguity remains we have:
andand
When analyzing the results, we find that the recognition rate is raised to 96 % andthe remaining 4% are owed to:10% : bad amounts segmentation, 20% : real mistakes on words, 30% : classificationmistakes, 40% : absence of handwritten word’s feature.
11 Conclusion and Perspectives
In this work we undertook the recognition of Arabic checks literal handwrittenamounts, what implied several processes such as: preprocessing, features extraction,classification and post processing. The obtained rate after the combination stage andpost classification one is 96 %, where the recognition rate has been increased by about4% compared to the average classification one. These results are interesting and ex-perimentally confirm the assumption that the combination of multiple classifiers deci-sion and the integration of contextual information enhance the overall accuracy of arecognition system.
As future perspective for this work, it would be interesting to integrate cooperationwith courtesy (numerical) amount recognition. This will permit to solve the majoritycases of ambiguousness signaled in the decision phase. Another way to explore is tooffer the possibility of feed back (retroaction) toward the different processing phases.
References
1.
2.
3.
Madhvanath, S. Govindaraju, V.:The Role of Holistic Paradigms in Handwritten wordRecognition. IEEE Trans. On Pattern Analysis and Machine Intelligence, vol. 23 no.2,February 2001.Steinherz, T. Rivlin, E. Intrator, N. :Off-line cursive script word recognition: A survey.International Journal on Document analysis and Recognition, IJDAR, Vol 2, pp: 90-110,1999Suen, C.Y. :Réflexions sur la reconnaissance de l’écriture cursive. Actes CIFED’98, 1erColloque International Francophone sur l’Ecrit et le Document, pp: 1-8, Québec, Canada,Mai 1998.

Arabic Words Recognition with Classifiers Combination 429
4.
5.
6.
7.
8.
9.
Zouari, H. Heutte, L. Lecourtier, Y. Alimi., A. :Un panorama des méthodes de combinai-son de classifieurs en reconnaissance de formes. RFIA2002, 11th Congrès francophoneAFRIF-AFIA de Reconnaissance des Formes et Intelligence Artificielle, pp : 499-508,Angers, Janvier 2002.Xu, L. Krzyzak, A. Suen, C. Y.:Methods of combining multiple classifiers and their appli-cations to handwriting recognition. IEEE Transactions on systems. Man, and cybernetics,vol. 22, No 3, May/June 1992.Amin, A. :Off-line Arabic character recognition: The state of the art. Pattern Recognition,vol. 31, N° 5, pp 517-530, 1998.Al Badr, B. Mahmoud, S. A. :Survey and bibliography of Arabic optical text recognition.Signal processing, Vol. 41, pp 49-77, 1995.Essoukhri Ben Amara :Sur la problématique et les orientations en reconnaissance del’écriture arabe. CIFED 2002, pp 1-8, 2002.Ben Amara, N. Belaid, A. Ellouze, N. :Utilisation des modèles markoviens en reconnais-sance de l’écriture arabe: état de l’art. CIFED’2000, France2000, pp. 181-191.Snoussi.Maddouri, S. Amiri, H. Belaid A.and Choisy, C.: Combination of Local andGlobal Vision Modeling for Arabic Handwritten Word Recognition. International Work-shop Frontier in Handwriting IWFHR’02, Canada, 2002.Souici-Meslati, L. Sellami, M.: Reconnaissance de montants littéraux arabes par uneapproche hybride neuro-symbolique. RFIA’2002, 11th Congrès francophone AFRIF-AFIA de Reconnaissance des Formes et Intelligence Artificielle, Angers, Janvier 2002.Ruta, D. Gabrys, B.: An Overview of Classifier Fusion Methods. Computing and Informa-tion Systems 7(1):1-10, University of Paisley, February 2000. http://cis.paisley.ac.uk/ruta-ci0/downloads/paper1.pdfPavlidis, T. : Algorithms for Graphic and Image Processing. Rockville, MD: Computerscience press, 1982.Belaid, A. Belaid, Y. : Reconnaissance des formes: Méthodes et applications. InterEdi-tions, 1992.Sari, T. :Un système de Reconnaissance de mots arabes manuscrits basé segmentation.Mémoire de Magister, Laboratoire LRI, Département Informatique, Université BadjiMokhtar Annaba, Algérie, Février 2000.Ameur, A. Romeo-Pakker, K. Miled, H. Cheriet, M.: Approche globale pour la recon-naissance de mots manuscrits Arabes. Actes CNED’94, 3ème Colloque National surl’Ecrit et le Document, pp: 151-156, Juillet 1994.Jain, A. K. Mao, J. Mohiuddin, K. : Artificial Neural Networks: A Tutorial. IEEE Com-puter, Special Issue on Neural computing, Marsh 1996.Jodouin, J. F.: Les réseaux de neurones: principes et définitions. Hermès, 1994.Singh, S. Amin, A. : Fuzzy Recognition of Chinese Characters. Proc. Irish Machine Vi-sion and Image Processing Conference (IMVIP’99), Dublin, 8-9 September, 1999.Duin, R.P.W. : The combining classifier: To train or Not to train?. Proceedings 16thInternational Conference on Pattern Recognition, Quebec City, Canada, August 11-15,2002.Anil, J. K. Duin, R.P.W Mao, J. : Statistical pattern recognition: A review’, IEEE transac-tions on pattern analysis and machine intelligence, vol 22, no 1, January 2000.Kittler, J. Hatef, M. Duin, R.P.W. Matas J. : On combining classifiers. IEEE transactionson pattern analysis and machine intelligence, vol 20, no 3, March 1998.
10.
11.
12.
13.
14.
15.
16.
17.
18.19.
20.
21.
22.

Curved Segmentation Path Construction forUnconstrained Handwritten Hangul Segmentation
Sungho Park1, Wontaek Seo2, and Beom-joon Cho2
1Dept. of Computer Information Communication, Namdo Provincial College, [email protected]
2Dept. of Computer Engineering, Chosun University, 375 Seosuk-dong , Dong-gu,Gwangju, Korea, [email protected], [email protected]
Abstract. Up to now, most Korean character recognition has been developed onthe assumption that it was segmented into characters perfectly. It is difficult toadapt the method that is used in English, since there are spaces in a character.Because a Korean character, which we call a syllable, is composed of two ormore graphemes on 2D plane, and also the characteristic of touch that occurredbetween character is often occurred between graphemes. In this paper, wepropose the method that uses a virtual segmentation path for segmentation ofunconstrained handwritten Korean characters. The main property of theproposed method is that not only the curved segmentation path which is usingthe space between character is used, but also the straight line segmentation pathis used. The segmentation process is divided into two steps. In the first step, astraight line segmentation path of a Korean word is determined using pre-processing and vertical projection, and words that are overlapped or touchingare passed to the next step. In the second step, feature points are extracted formaking a number of virtual curved paths, and then the most suitable path isdetermined using center of gravity which is marked between three adjacentpoints.
1 Introduction
Nowadays, we want to save the temporal and economical cost by recoding the amountof data to a computer as information. One useful technology is document recognition,and a correct segmentation has to be performed to the target words of the documentfor superior document recognition. Most Korean character recognition has beendeveloped on the assumption that it was segmented into characters perfectly, andthere has been little concern about that. In this paper, we propose a segmentationtechnique for unconstrained handwritten Korean characters.
Generally, in case of unconstrained handwritten Korean character recognition,there are some cases that use a device for artificial segmentation in order to minimizethe difficulty of segmentation, and despite the structural difference between Koreancharacters and English, they use a technique which has been developed for Englishwithout adapting to the characteristics of Korean characters. For the result, theseincrease the ambiguity of recognition units, so these become a main cause ofdeclining the system’s performance.
Previous segmentation works focused mainly on English[6,7] or digits[4,9], andthere was little concern about handwritten Korean characters[1,2,3].
C. Bussler and D. Fensel (Eds.): AIMSA 2004, LNAI 3192, pp. 430–437, 2004.© Springer-Verlag Berlin Heidelberg 2004

Curved Segmentation Path Construction 431
Berrin[5] proposed the algorithm of using a cost function to produce charactersegmentation. At the given position and angle, segmentation cost depends on localcharacteristics which are distance among positions of segment and globalcharacteristics which depend on the writting style such as average width of characterand thickness of pen.
Zhao[8] proposed a two stage algorithm for segmentation of unconstrained Chinesecharacters. In the first stage, called the Coarse stage, it produced a number of propersegment paths using backrground skeleton and vertical projection after preprocessing.In the second stage, called the Fine stage, it decided the final segment path afterevaluation for the all possible paths with the Fuzzy decision rule.
Elnagar[4] proposed a segmentation process using spatial characteristics whichused a proper template to the handwritten touched numeric characters.
Pal[9] proposed the decision method of optimal segmentation paths based on thecharacteristic which was obtained from a water reservoir concept to a touchednumber.
In studies about Korean characters, Gyeonghwan Kim[1] proposed the efficientslant correction algorithm for handwritten Hangul strings using structural propertieswhich are useful for preprocessing and segmentation for recognition units. He alsoproposed the touched point segmentation method and basic functions for finding thetouched point of character using a general writting style and characteristics of two-dimension Korean characters.
Seonhwa Jeong[2] selected the best combination for the segmentation of words byapplying the three- way classification method based on the clustering and threedistance estimation method, which were already proposed for written English words.
Soonja Hwang[3] proposed the character segmentation algorithm based on thegrapheme class recognition. It can detect the grapheme class area using structuralproperties of Hangul which are obtained from stroke by vertical projection, and it isalso based on the organization rule of Hangul and heuristic knowledge.
There are two methods for character segmentation from words, one is the methodthat produces just one result of high reliability at the segmentation process. The otheris the method that decides the final result by passing a number of candidate paths tothe recognition process. The former, also known as External Segmentation, takesadvantage of processing time regardless of the recognizer, but it has poor ability forfinding an exact touched point and can not adjust a wrong segment result. The latter,called Internal Segmentation, has a good recognition rate because it accommodatesmany segment results, but it takes more time during the recognition process.
This paper proposes a character segmentation method which produces just onesegment result of high and efficient reliability.
The main properties of this proposed method are as follows. First, instead of thestraight segment path that is used by many segmentation methods, it uses curvedpaths, which use the space of a Korean character organized by the combination ofconsonants and vowels. It enhances the reliability in the overlapped case.
Second, the total segmentation time is decreased, obviously, because it divides thesegmentation process into two stages. In the first stage, it chooses the section ofwords needed for more detailed segmentation. In the second stage, it uses minimalfeature points and searches the various virtual paths for the chosen section of theword.

432 S. Park, W. Seo, and B.-j. Cho
The rest of this paper is organized as follows. Section 2 presents the whole process,preprocess and selection process of word section need more detail segmentation usingvertical projection. Section 3 presents the process to produce virtual paths to thechosen word section. For the sake of this process, a number of feature points areextracted and virtual paths are produced, and the gravity center is used for a morecorrect segment path. Finally, it presents the experiment and future work in Section 4.
Fig. 1. Segmentation Algorithm
2 Segmentation Algorithm
The entire process of the proposed segmentation algorithm in this paper is presentedin Fig. 1, and the process is divided into two steps as follows. In the first step, theword region that needs to take more detailed segmentation is chosen from the wholeword, and that a straight line segment path is obtained by vertical projection. In thispaper, unconstrained handwritten Korean words that are connected with 2~5characters where collected from 100 writers, and then a thinning process is performedafter input images are converted to gray mode image. With the binary image, verticalprojection can find an isolated character which is not overlapped or touched. Thecharacters divided easily by vertical projection are confirmed in the first step, and theremainder is passed to the next stage. We use the average width of the character toconfirm whether the block, which is segmented by vertical projection, includes thewhole character or not. There are some cases that a block only includes one vowel,owing to the characteristics of Korean characters. In this paper, the average width is30 pixels from the data collected.
In the second step, the curved segment path, which is searching the virtual path, isobtained from the word region mainly organized with overlapped or touched

Curved Segmentation Path Construction 433
characters. When the target block is decided by vertical projection, feature points,called nodes, in the case of a network, are considered to make a virtual segment path.We use the delaunay triangle method to make virtual paths. Further, the gravity centerof each triangle is also used for a more useful path, and virtual paths are linked fromfeature point to the gravity center. Finally, using searches from the feature point andthe gravity center, the best segment path is obtained so that there is no loss to theoriginal character.
3 Segment Path Construction
3.1 Straight Segment Path
In the first step, the process of decision that chooses the region to be passed to thesecond step from whole words for the input image is as follow. <Fig. 2(a)> shows thesample word images that consisted of 5 characters. <Fig. 2(b)> shows that and
are easily segmented by vertical projection, because they are apart from eachother.
This can be easily observed from the result <Fig. 3> of vertical projection. It showsthat and are divided from each other despite being one character, but sincethe width of and is smaller than average width, they are considered to be onecharacter. Because is the vowel in the structural characteristics of Korean, it isconnected to the former block. Finally, the straight line of vertical projection results in<Fig. 3> which is the segment path of the first step.
But according to the analysis of collected data, the size, height, and width variesaccording to the writer, and also varies with the same writer. It is hard to depend onvertical projection, which mainly depends on the width of character. Furthermore,because there are often overlapped and touched characters, straight segment pathscannot be segmented perfectly.
The needs to be treated in the second step because the characters areoverlapped and touching each other, so it can not make a straight segment line in thefirst step. In a way, the thinning process is performed to binary image for finding afeature point that used to make a virtual segment path later step.
Fig. 2. (a) Original, (b)binary and (c)thinning image

434 S. Park, W. Seo, and B.-j. Cho
Fig. 3. Vertical projection to Fig. 2(b)
Fig. 4. Target block to segment
3.2 Virtual Segment Path
To generate the virtual segment path, feature points of each character are extracted.The curved type segment path has to go through the space between a character fromtop to bottom and avoid the foreground image. For the sake of this, end points of eachgrapheme are considered to be the feature points. Further, the point which is end pointof the grapheme and also touching the other grapheme is considered as a featurepoint.
Next, considered feature points have to be connected to each other in order tocreate virtual paths. In this paper, the Delaunay triangulation method is used toconnect each feature point. By this method, the feature point becomes the vertex of atriangle, and links to be used as virtual paths are created. The gravity center of eachtriangle is considered as a feature point for creating more detailed virtual segmentpaths, and more detailed curved segmentation paths will be obtained. The gravitycenter of each triangle becomes the node like feature point, and the links connected tothe node from each vertex of a triangle. <Fig. 5> shows the process of creating thelinks.
Fig. 5. Feature point extract and virtual path

Curved Segmentation Path Construction 435
When the virtual paths are created between characters, virtual paths become asegmented path if the link doesn’t go through the foreground image, and this processis iterated until it arrives to the end point.
Fig. 6. Segment path searching algorithm
4 Best Segment Path Search
For the best segment path search, the virtual path which goes through the foregroundimage <Fig. 5> has to be removed from the candidate. To create a path, start and endpoints have to be considered. In this paper, the top-center point and bottom-centerpoint are used as the start point and end point.
<Fig. 6> shows the segment path search algorithm from the virtual segment path.The is the connectable feature point set from the start point without crash in theforeground image. The is the position of the feature point that connects the segmentpath from the start point to the end point. Among those virtual segment paths, the bestsegmentation paths are decided by search algorithm which produces the andsearches the paths using a top-down method from them.
<Fig. 7> shows the candidate segment path from the start point to end point and<Fig. 8> shows the best segment path from a candidate path.
Fig. 7. Candidate segment path

436 S. Park, W. Seo, and B.-j. Cho
Fig. 8. Best segment path
5 Conclusion
This paper proposes the new segmentation method using a virtual segment path forunconstrained handwritten Korean characters. The main properties of this proposedmethod are as follows. First, instead of the straight segment path that is used by manysegmentation methods, it uses a curved path which uses the space of a Koreancharacter organized by the combination of the consonant and vowel. It especiallyenhances the reliability of the overlapped case. Second, the total segmentation time isobviously decreased as it divides the segmentation process into two stages.
In the first stage, it chooses the section of the word that needs more detailedsegmentation. In the second stage, it uses minimal feature points and search thevarious virtual paths for the chosen section of the word. Third, it produces a reliablepath for touching characters, which is the most difficult problem, by converting thefeature point to the background image temporally.
Now, a comparative experiment is being performed using collected handwrittendata. Specifically, work to enhance the reliability of touching characters is going on.
Acknowledgement. This study was supported by research funds from ChosunUniversity, 2003
References
1.
2.
Gyeonghwan Kim, Jason J Yoon : An Approach to segmentation of address strings ofunconstrained handwritten Hangle using Run-length code. Korean Information ScienceJournal, Vol 28. No.11 (2001) 813-821Seonhwa Jeong, Soohyung Kim : Word segmentation in handwritten Korean text linesbased on GAP clustering. Korean Information Science Journal, Vol 27. No.6 (2000) 660-667

Curved Segmentation Path Construction 437
3.
4.
5.
6.
7.
8.
9.
Soonja Hwang, Moonhyun Kim : Consonant-vowel classification based segmentationtechnique for handwritten off-line Hangul. Korean Information Processing Journal, Vol 3.No.4 (1996) 1002-1013Ashraf Elnagar, Reda Alhajj : Segmentation of connected handwritten numeral strings.Pattern Recognition, Vol. 36 (2003) 625-634Berrin Yanikoglu, Peter A. Sandon : Segmentation of off-line cursive handwriting usinglinear programming. Pattern Recognition, Vol. 31 (1998) 1825-1833G. Kim : Architecture for handwritten text recognition systems. Proc. Sixth InternationalWorkshop on Frontiers in Handwritten Recognition (1998) 113-122G. Dzuba, A. Filatov and A. Volgunin : Handwritten ZIP code recognition. Proc. FourthInternational Conference on Document Analysis and Recognition (1997) 766-770Shuyan Zhao, Zheru Chi, Penfei Shi and Hong Yan : Two-stage segmentation ofunconstrained handwritten Chinese characters. Pattern Recognition, Vol. 36 (2001) 145-156U. Pal, A. Belaid and Ch. Choisy : Touching numeral segmentation using water reservoirconcept. Pattern Recognition Letters, Vol. 24 (2003) 261-272

Efficient Segmentation Path Generation forUnconstrained Handwritten Hangul Character
Wontaek Seo and Beom-joon Cho
Dept. of Computer Engineering, Chosun University, 375 Seosuk-dong , Dong-gu, Gwangju,Korea
[email protected], [email protected],[email protected]
Abstract. This study suggests background thinning method for segmentingcharacter unit of handwritten Hangul. Background thinning method conductsthinning processing using background information between characters andshows effective performance in segmenting for overlapped and touchedcharacters. Character segmentation method using background thinning showsrapid segmentation performance with external segmentation which needs nojudgment of recognition process. This method showed excellent performance intouched character segmentation as well as in segmentation of overlappedcharacters.
1 Introduction
One of the pattern recognition techniques frequently used in daily life is characterrecognition technique. Character recognition techniques of Hangul achieved a greatdevelopment with researchers’ efforts for over ten years. In particular, printedcharacter recognition is part of an integral recognition rate in applying to real life. Onthe other hand, handwritten character recognition is problematic in applying to reallife. Handwritten character recognition is divided into two; on-line and off-linehandwritten recognition. While on-line recognition can obtain a lot of usefulinformation such as pressure of pen, time information of stroke, etc., off-linerecognition is difficult to recognize because it is done with just spatial information oninput character. Therefore, many researchers perform the research on off-linehandwritten recognition [1][2][3]. An important preprocessing procedures inrecognizing characters is character segmentation to character unit data from word unitdata [4][5][6]. However, research on most character recognitions have beenperformed under the assumption that subject characters are segmented perfectly, as aresult, research on character segmentation is imperfect. Although printed charactersegmentation can be easily progressed due to uniform shape, size and gap of theprinted characters [5], handwritten character segmentation has a lot of difficulties dueto variety of writing styles and characteristic [6]. In addition, since existing researchon segmentation have not reflected composition principles of Hangul but focused onEnglish and numerals, research on handwritten character segmentation of Hangul wasinsufficient.
C. Bussler and D. Fensel (Eds.): AIMSA 2004, LNAI 3192, pp. 438–446, 2004.© Springer-Verlag Berlin Heidelberg 2004

Efficient Segmentation Path Generation 439
According to related research, Kim Gyeong-Hwan [7] suggested slantcompensation algorithm reflecting structural properties of Hangul, reflectedcharacteristics of writers’ general writing habit and the two-dimensional structure ofHangul and a presented basic function and a classification method searching fortouched point of characters.
Choi Soon-Man [8] segmented touched numbers with segmentation-free methodand suggested how to recognize it with neural network. This method can be applied tonumbers with recognition of touched numbers as a whole without segmentingindividual number, but it cannot be used for character recognition of Hangul withstructural complexity. Yoo Dae-Geun [9] presented slant compensation method ofhandwritten characters based on statistical distribution of strokes reflecting structuralproperties of Hangul. These methods classified slant distribution of extracted strokesinto two groups of vertical and diagonal strokes with the application of K-averagegrouping and conducted slant compensation with vertical stroke except diagonalstroke through modeling based on the Gaussian distribution.
Segmentation methods can be divided into two types. The first is externalsegmentation which presents segmentation results of high reliability without help ofrecognition in the segmentation process. The second is internal segmentation and itselects some candidates in the segmentation process, holds back judgement torecognition process and decides final segmentation in the process. The first methodreduces a calculation burden, but is difficult to ensure reliability exactly. The secondone increases a calculation burden, but has higher reliability than the first one.
This study suggests the external segmentation method of off-line handwrittenHangul using properties of background composed on outside of character. Chapter 2explains segmentation process, Chapter 3 states background thinning, Chapter 4 is onexperiment and considerations, and lastly chapter 5 is the conclusion.
2 Character Segmentation of Hangul
Most of the research on segmentation of Hangul have not solved touched oroverlapped problems frequently found in handwritten Hangul and adopted methods ofsearching for segmentation point in recognition process under the assumption that theregions follow the six types of Hangul (Fig. 1) uniformed. And recognition has beenconducted with candidates of graphemes (Table 1) fixed in each position.
However, there are some cases that are not to be secured in regards to the positionof each grapheme group in the case of Hangul without restriction unlike generalassumptions. In addition, periodically appeared characters and their gaps are notsecured. So forced segmentation with vertical projection may be major causes ofproducing an incomplete recognition units, increasing the recognition and loweringrecognition performance.The following are factors used for segmenting characters in general.
Character Width : Horizontal length of characterCharacter Height : Vertical length of characterCharacter Gap : Length of blank between characters

440 W. Seo and B.-j. Cho
Top Base Line : Top base line of region occupied by characterBottom Base Line : Bottom base line of region occupied by characterLexicon : Gathering of words, used in segmentation by recognitionVertical and Horizontal Projection : Values counting number of valid pixels invertical and horizontal directions
Fig. 1. The Combining Structure of Graphemes in Hangul : Six Types
What is easiest and simplest among these will be vertical and horizontalprojections. Well-written or -printed words can be segmented enough with verticaland horizontal projections. So, after first segmenting characters with verticalprojection, overlapped or touched points are processed. Overlapped region entered theregion of other characters as shown in Fig. 2 and the touched region is attached withtwo characters as shown in Fig. 2.
Although character segmentation using vertical segmentation was tried, it wasdivided into three blocks of and If was segmentedforcefully, it would have a great influence on results of recognition.In case of handwritten Hangul, it is unreasonable to use vertical projection. Therefore,this study tries to segment character using structural properties of Hangul. Hangul hasone sound in one character as phonetic symbols and there is an empty space betweenthe characters. This paper proposes how to segment the characters using this emptyspace or blank.
3 Character Segmentation Using Background Thinning
This paper employs thinning technique, usually used for recognition process, tobackground of character image in order to use background information between

Efficient Segmentation Path Generation 441
characters of Hangul. Result of background thinning connects space betweencharacter and character not to pass by character and provides how to segmentcharacter clearly as confirmed in Fig. 3.
Fig. 2. Segmentation using vertical projection (a) A case of overlapped and touchedhandwritten hangul. (b) virtical projection
In this paper, Mophology thinning method is used for thinning background[10].Mophology thinning uses the calculation as follow.
The thinning of a set A by a structuring element B, denoted can be definedin terms of the hit-or-miss transform :
A more useful expression for thinning A symmetrically is based on a sequence ofstructuring elements
where is a rotated version of Using this concept, we now define thinningby a sequence of structuring elements as
In other words, the process is to thin A by one pass with then thin the resultwith one pass of and so on, until A is thinned with one pass of The entireprocess is repeated until no further changes occur.
3.1 Segmentation of Normal Character
As shown in Fig. 2, Veritical projection is generally efficient to the characters whichis already apart each other. But, in case of Hangul, there is possibility to make errorbecause vertical projection does not reflect the structural properties of Hangul. Asshown in Fig. 4, the image which divided by only vertical projection has error

442 W. Seo and B.-j. Cho
because it uses just width of characters. To solve this problem, in this paper,background thinning is adopt to whole characters even though it is sperated well, anduses the structural property of Hangul (Fig. 1 ).
Fig. 3. Some results of background thinning. (a) results of background thinning (b)Combination of background thinning result and source image.
Fig. 4. A case of error : Segmentation using only vertical projection
First of all, Candidate region is selected by vertical projection, then, by comparinglocation of regions to composition rules of six types of Hangul , above error can berevised. Figure 5 shows the process of its performance.

Efficient Segmentation Path Generation 443
Fig. 5. Segmentation using background thinning : normal case.
3.2 Segmentation of Overlapped Character
In case of overlapped characters, there will be background space in the middle regionalthough it is overlapped between characters. Path should be generated with this spaceand this background thinning generates path passing through the middle betweencharacters.
After selecting expected segmentation region from vertical projection, we coulddecide path with results of background thinning and then the following path can beobtained.
Fig. 6. Some case of segmentation path : Overlapped characters.
3.3 Segmentation of Touched Character
Research on the segmentation of touched characters have been seldom, but there areno reliable segmentation methods for Hangul. Most of methods made a lot ofcandidate point of segmentation and passed them to recognition stage, which resultsin increasing of burden of recognition and lowering recognition performance. Thispaper proposes how to search for and segment such a connected region with externalsegmentation.

444 W. Seo and B.-j. Cho
In case of touched characters, touched regions formed by background thinning canbe easily detected because the region of touched characters has single area in bothregions unlike other regions (Fig. 7(a)) and length of the region is longer than meanwidth of character. Mean width of characters was obtained from collected data. Andanother candidate region of segmentation between characters can be assumed usingvertical projection same with general character. In this study, a decomposition methodof handwritten Hangul proposed by Park Jeong-Seon [11] was adopt to finding asegment point in target region where the two candidate region is piled up. In thismethod, interfaces of curved point or touched point based on observation centeringaround two features of Hangul pattern, T-interface and B-interface were presented.Fig. 7(b) represents candidate of segmentation point generated by above method. Butthe candidate of segmentation point which is located in target region will beconsidered.
Fig. 7. Candidate region of touched character and segment point. (a) candidate regionthroughout two regions. (b) candidate of segment point
As it passes through segment point in target region, new path is generated. Fig. 8shows this process. After generating new border area with opposite point throughcharacter region, segment path is set with the same method as overlapped characterpath.
Fig. 8. Segment path between touched character (a) candidate which fails to make path (b)candidate which can make path (c) character segment path is established

Efficient Segmentation Path Generation 445
4 Experiment and Considerations
This study collected 40 addresses related Hangul words from 150 persons. Each wordis composed of 2 ~ 5 characters with pure Hangul without symbol, mark, English ornumber. Region for writing characters is given, but it is guided to be written freelyand natural character type is recommended. Total characters are 19,950 and totalcases to be segmented are 13,072. From the collected data, there are 4,471(32%)overlapping cases, and 2,034(14.5%) of single touched cases, 296(2.1%) of multitouched cases. Experiment results of each case are shown in table 2.
As shown in table, the segmentation performance of the overlap and single touch isgood in 85.5%. But the performance of multi-touch is not so impressive.
5 Conclusion
This study suggested a new method of background thinning for charactersegmentation of handwritten Hangul. This method could generate a path at anoverlapped point between characters using background information and structuralproperties of Hangul effectively and the segmentation point could be extracted easilyfrom touched points.
Proposed method is significant in that it segmented characters effectively usingexternal segmentation without help of recognition and its performance speed was sofast.
This study can be used in preprocessing part of handwritten Hangul recognizer,and it may be possible that Background thinning method can be used to Hangulgrapheme segmentation.
Acknowledgement. This work was done as a part of Information & Communicationfundamental Technology Research Program supported by Ministry of Information &Communication in republic of Korea
References
1.
2.
3.
Luiz S. Oliveira, R. Sabourin : Automatic Recognition of Handwritten Numerical Strings :A Recognition and Verification Strategy. IEEE PAMI, Vol. 24, No. 11 (2002) 1438-1454Jaehwa Park : An Adaptive Approach to Offline Handwritten Word Recognition. IEEEPAMI, Vol. 24, No. 7 (2002) 920-931S. Zho, Z. Chi, P. Shi, H. Yan : Two-stage segmentation of unconstrained handwrittenChinese characters. Pattern Recognition, Vol. 36, No. 1 (2003) 145-156

446 W. Seo and B.-j. Cho
4.
5.
6.
7.
8.
9.
Sung-Bae cho, Jin H. Kim : A Hierarchical Organization of Neural Networks for PrintedHangul Character Recognition. Korea Information Science Journal, Vol.17, No.3 (1990)306-316Yi Lu : Machine-printed character segmentation. Pattern Recognition, Vol. 28, No. 1(1995) 67-80Yi Lu, M. Shridhar : Character segmentation in handwritten words-an overview. PatternRecognition, Vol. 29, No. 1 (1996) 77-96Gyeonghwan Kim, Jason J. Yoon : An Approach to Segmentation of Address Strings ofUnconstrained Handwritten Hangul using Run-Length Code. Korea Information ScienceJournal, Vol, 28, No. 11 (2001) 813-821Soon-Man Choi, Il-Seok Oh : Segmentation-free Recognition of Touching Numeral Pairs.Korea Information Science Journal, Vol, 27, No. 5 (2000) 563-574Daekeun You, Gyeonghwan Kim : An Efficient Slant Correction for Handwritten HangulStrings using Structural Properties. Korea Information Science Journal, Vol. 30, no. 2(2003) 93-102Rafael C. Gonzalez, Richard E. Woods : Digital Image Processing. Addison-WesleyPublishing Company (1992)Jeong-Sun Park, Ki-Chun Hong, Il-Seok Oh : Shape Decomposition of Handwritten hangulCharacters. Korea Information Science Journal, Vol. 28, no. 7 (2001) 511-523S.-W. Lee and E.-S. Kim : Efficient post processing algorithm for error eorrection inhandwritten Hangul address and human name recognition. Pattern Recognition, vol. 27, no.12 (1994) 1631-1640
10.
11.
12.

Designing Hybrid Cooperations with aComponent Language for Solving Optimisation
Problems*
Carlos Castro1 and Eric Monfroy2
1 Universidad Técnica Federico Santa María, Chile2 LINA, Université de Nantes, France
[email protected], [email protected]–nantes.fr
Abstract. In this paper, we use a simple asynchronous coordinationlanguage to design some complex hybrid cooperation schemes for solvingoptimisation problems. The language allows us to specify the interac-tion between complete and incomplete constraint solvers in a clear anduniform way. Experimental results show the benefits of such hybrid co-operations in terms of efficiency.
1 Introduction
Solving a Constraint Satisfaction Problem (CSP) consists in finding values to aset of variables in such a way that a set of constraints is satisfied [6]. A ConstraintSatisfaction Optimisation Problem (CSOP) is an extension of a CSP where weare interested in a solution to the set of constraints that optimises an objectivefunction [10]. CSOPs can be solved using a complete approach, where a globaloptimum is obtained, or an incomplete approach, obtaining just a local optimum.
The complete approach used by the Constraint Programming community isbased on solving a sequence of CSPs. The idea is to get a first solution to theset of constraints and, evaluating the objective function in that solution, set abound for the objective function. Then, after adding a new constraint using thisbound, we solve a new CSP looking for a better solution with respect to the op-timisation function. This idea is applied repeatedly and when, after adding suchconstraints, the problem becomes unsatisfiable, the last possible solution repre-sents the optimal solution [2]. CSPs are solved using general methods based onexhaustive enumeration and local consistency verification. Algorithms, such asForward Checking, Partial and Full Lookahead, have been developed incorporat-ing consistency verification techniques, that remove values of variables that donot satisfy the constraints, into a systematic exploration of the search space [11].
On the other hand, local search is an incomplete method widely used to solvehard combinatorial optimisation problems. Roughly speaking, a local search al-gorithm starts off with an initial solution and then repeatedly tries to find better* The authors have been partially supported by the Franco-Chilean INRIA-CONICYT
project Cocars.
C. Bussler and D. Fensel (Eds.): AIMSA 2004, LNAI 3192, pp. 447–458, 2004.© Springer-Verlag Berlin Heidelberg 2004

448 C. Castro and E. Monfroy
solutions by exploring neighbourhoods. A basic version of local search is itera-tive improvement or Hill-Climbing procedures. Iterative improvement starts withsome initial solution that is constructed by some other algorithm, or just gener-ated randomly. Then, it keeps on moving to better neighbours (i.e., improvingthe objective function), as long as there are some. Finally, it finishes at a locallyoptimal solution, one that does not have a better neighbour.
The advantages and drawbacks of these techniques are well-known: completetechniques allow one to get global optimum but, when dealing with hard prob-lems, they take too much time and can become useless in practice. Empirically,local search heuristics converge usually rather quickly, within low-order polyno-mial time. However, they are only able to find near-optimal solutions, i.e., ingeneral, a local optimum might not coincide with a global optimum.
Encouraging results have been obtained by integrating these approaches. Ahybrid approach, that sacrifices completeness of backtracking methods to achievethe scalability of local search, has been proposed and results outperform the bestlocal search algorithms [8]. Good results have been also obtained by a hybridtechnique where local search performs over partial assignments, instead of com-plete assignments, and constraint propagation and conflict-based heuristics areused to improve the search [5]. Recently, some schemes of sequential cooperationbetween Forward Checking and Hill-Climbing have been proposed and resultsshow that these cooperations always outperform a single solver [4].
In this work, we solve CSOPs applying more complex hybrid cooperationsthat are designed using a simple coordination language [7]. This asynchronouslanguage is composed of interaction components that control external agents(such as solvers) by managing the data flow. A formal definition of our languagein terms of concurrent rules can be found in [3]. The motivation for this work is tocontinue studying the use of control languages to specify elementary constraintsolvers as well as the collaboration of solvers in a uniform and flexible way. Thegoal is also to provide means of designing strategies that are more complex thansimple master-slave approaches. The main contribution of this paper is to showthe design of new cooperations and their results when solving CSOPs.
To test our approach, we use the Vehicle Routing Problem (VRP). Since wedon’t focus in improving reported results, but in evaluating different collabora-tion schemes, we use simplified versions of classical benchmarks. Our problemsare based on instances C101, R101, and RC101, belonging to classes C1, R1,and RC1, respectively, defined in [9]. Each class defines a different topology: inC1 the location of customers are clustered, in R1, the location of customers aregenerated randomly, and in RC1 instances are generated considering clusteredgroups of randomly generated locations of customers. Without time windowsinformation, fixing the number of vehicles, and considering 25 customers, weobtain Capacity VRP (CVRP) which we named as instances and rc1.Thus, our optimisation problems consist in minimising the total distance drivenby a set of vehicles that deliver to all the customers that are visited only once.

Designing Hybrid Cooperations with a Component Language 449
Fig. 1. Graphical description of components
In Section 2, we present our language. In Section 3, we solve a set of problemsusing both approaches independently. In Section 4, we solve the same problemsbut making cooperate both approaches. Finally, we conclude in Section 5.
2 A Component Language
Our asynchronous language is a simple coordination language (see e.g., [1]). It iscomposed of a set of interaction components that asynchronously control execu-tion of external agents, such as solvers, by managing the data flow. An externalagent is a computational entity that can be seen as a function with a local mem-ory. The data flow is composed of data messages (such as problems, optimum)and control messages (true or false). A pattern is a set of connected compo-nents and patterns. Patterns enable one to describe and re-use more complexbehaviours. In this paper, they are mainly used to design solver cooperations.
Interaction components (components in short) are entities connected to eachother to exchange data and control messages. A component can use some ex-ternal agents to perform some computations. Components are link by someone to one uni-directional channels. Channels are used as identifiers to ex-change data among components, and their name is unique. A channel belongsto two components: it is a First In First Output (FIFO) buffer; one componentwrites in it, the second one reads in it. A component is represented by a term
where the are the channels of thecomponent, and the are the external agents used by the component (whenthere is no the list can be omitted). Both and are variables that mustbe instantiated when using the component. In the following, upper-case lettersrepresent variables (channels or agents) and lower case letters instances.
A component is sleepy until it receives all the messages it is waiting for.Then, it becomes active: it reads the awaited messages, executes some agents (ifneeded), and finally sends some messages before becoming sleepy again. Com-ponents execute concurrently and cannot be interrupted.
The syntax of each component of our language is:
Graphical representations of components are given in Figure 1. A solid (resp.dashed) line represents a channel carrying data (resp. control) messages. We nowexplain informally the operational semantics of the components of our language:

450 C. Castro and E. Monfroy
Fig. 2. Switch (left) and fixed point (right) patterns: design and representation
Y-Junctions. As soon as it receives a message either on channel or aY-junction forwards the message on channel Out.
Initializers. An init component sends data (given by an external agent) onchannel Out. These components are used to initialize the data flow.
Transformers. When a trans component receives a message X on channel In,it reads it, and the result of executing the agent F on X is sent on Out.
Synchronizers. These components synchronize two components by the medi-ating of their messages: they wait for two messages, one on the channeland one on then they execute an agent F on the two messages, andfinally they put the result of F on the channel Out.
Sieve. A sieve component waits for a data message X on and for a controlmessage on If a true value is received on then the data message Xis sent on Out; otherwise, X is deleted and not forwarded.
Duplicate. A duplicate component duplicates a dataflow: when it gets a mes-sage X on In, it forwards a copy of X on both channels and
A pattern is a parameterized piece of program defined by induction: a setof components is a pattern, and a set of patterns is a pattern. Variables thatappear in the definition of a pattern are the parameters of this pattern. Weconsider a re-naming process that uniquely re-names channel names used in morethan one pattern or in several instances of the same pattern. We now presenttwo common patterns of interactions that are widely used in solver cooperation:switch and fixed point patterns. Note that a pattern can be given a new graphicalrepresentation, e.g., see the switch pattern.
Switch. A switch pattern (Figure 2-(left)) synchronizes a data message re-ceived on Id and a control message received on Ic: if is true, is forwardedon Ot, otherwise on Of. This pattern is defined by:
Fixed Point. A fixed point pattern (Figure 2-(right)) applies repeatedly apattern Coop (e.g., representing a solver cooperation) until the output of the

Designing Hybrid Cooperations with a Component Language 451
Fig. 3. Solver pattern (implementation and representation)
pattern does not change any more. More precisely, a data message is receivedon I f p (a channel of the fp pattern). is forwarded to Coop via channel I coop(an input of Coop). The result of Coop (received on Ocoop) and a copy ofare compared (using an equal agent): if the fixed point is reached and
is sent on O fp. Otherwise, the process iterates: is sent again on Icoop:
3 Complete and Incomplete Constraint Solvers
We consider bn, and start, three elementary solver agents. Given an opti-misation problem and a current best bound for the objective function, andbn try to improve the current best bound. These agents have a local memoryin which they store the optimisation problem. Thus, the solver agents have toreceive only once the optimisation problem with the current best bound in orderto improve the bound. Sending only once the problem significantly reduces thedata flow. Then, each time they receive a new current best bound, they willtry to produce a better bound using the problem they already have in memory.When they cannot improve the bound they return the last bound they received.
and bn are encapsulated into transformer components which are them-selves used inside a solver pattern (Figure 3) providing the following mechanism:the first time it is used, it combines a problem (from Pb) and a bound (from Op)using the agent; this combination is sent to the solver agent (a parameterof the pattern); the following times, only a new bound (from Op) is forwarded tothe solver agent that already stored the problem in its local memory. The boundproduced by the solver agent is sent on the Out channel.

452 C. Castro and E. Monfroy
Fig. 4. Forward Checking (left) and Hill-Climbing (right) design and representation
On Figure 3, the components in dotted lines are not part of the pattern: theyare used to illustrate a possible initialisation and bound updates.
Start solver: start is a very simple solver agent that given a problem generates arandom solution. This agent is only encapsulated into a transformer component.
Forward Checking: fc is a solver based on Forward Checking. This techniquespecially designed to solve CSP is an interleaving process between local con-sistency computation (i.e., elimination of values that the variables cannot takein any feasible solution) and variable enumeration (backtracking). This processterminates when an assignment of values to variables satisfying all constraints isfound or some variable has an empty domain (i.e., there is no feasible solutionto the problem). is similar: if it finds a solution in less than units of time,it returns this solution; otherwise, it returns the bound that it received.
We first test our fc solver to perform a full-search, i.e., exploring all the searchspace. This strategy (FC) is defined by applying fc iteratively until fc cannotimprove the bound anymore (Figure 4-(left)). FC was used to solve problems
and rc1 as defined previously. Table 1 presents our results to minimisethe objective function for each instance, we show all partial solutions foundduring the execution, the time (in milliseconds) at which the partial solutionwas found, and the rounding (computation are performed with 8 digits) of thevalue of the objective function evaluated with the partial solution. In the lastrow of columns and for the instance, we can see that 375 is the best valueobtained for the objective function after 15 instantiations in 106854 ms. Forour experiments we stopped solvers and solver cooperations after 100 minutes.Thus, incomplete methods can sometimes give better results than complete ones.
Hill-Climbing: bn, the best feasible neighbour solver works as follows: givena feasible solution, it generates a set of neighbour solutions using the 2-optheuristics proposed by Kernighan. After the generation of all neighbours, onlythe feasible one giving the best value for the objective function is returned (“bestimprovement” criteria). Repeated applications of bn until no better neighbour isfound is a Hill-Climbing algorithm. Figure 4-(right) shows this HC cooperationusing a random initial point generated by the start solver.
We can now compare strategies FC and HC (see Table 1):
When solving instance FC gives a better value for than HC; it is theopposite in instance but in instance rc1 the results are very similar.

Designing Hybrid Cooperations with a Component Language 453
FC always runs between 40 and 100 seconds for solving the three instances,but HC only takes between 3 and 5 seconds.In general, the time between two consecutive solutions found by FC increasesdramatically when approaching the best solution. However, the time betweentwo consecutive solutions found by HC is almost constant, between 300 and400 milliseconds.
These behaviours are explained by the essence of each search algorithm. FCinvolves an exhaustive enumeration when no reduction domain is possible. Forproblems in the phase transition, FC takes a lot of time in obtaining a solution.That is why FC needs more time when the problem becomes harder and has fewsolutions. HC does not consider the number of solutions to a problem, it justenumerates the neighbour solutions. Thus, between two consecutive solutions,the time remains almost constant. The time needed by HC only depends on thenumber of constraints to verify and the number of neighbour to evaluate.
4 Hybrid Collaboration of Constraint Solvers
4.1 Fixed Point of fc Followed by HC
The first hybrid cooperation (Figure 5-(left)) we have tried consists in: 1) applyfc to find a first solution, 2) then, apply bn iteratively until it cannot be appliedany more, i.e., a local optimum has been reached, 3) iteratively apply 1) and 2)until the problem becomes unsatisfiable or no more change happen.
To verify the effect of applying HC after f c , we try the same cooperationscheme but giving fc the possibility to be applied several times before tryingHC (Figure 5-(right)). The idea is to analyse the possibility of improving boundswith FC. Since fc can be too much time consuming to get a new solution, weused fc(2sec). The results of these two cooperations are presented in Table 2:
Surprisingly, when solving each instance, both cooperation schemes foundthe same best value.

454 C. Castro and E. Monfroy
Fig. 5. Fixed point of fc helping HC (left) and fixed point of fc(2) helping HC (right)
The first scheme of cooperation (left table) always takes less time than thesecond one (right table). In fact, the total time is mainly due to FC.In general, applying both cooperations schemes, the results are better interms of than applying either FC isolated or HC isolated.In Table 2-(left), when FC returns quickly results (instance the perfor-mances are better than applying HC; but when FC takes too much time(instances rc1 and HC isolated gives better results in terms of time.
4.2 Fixed Point of HC Followed by fc
This scheme of cooperation is similar to the first one presented in Section 4.1but we first start applying iteratively bn (see Figure 6). Thus, the start solver inFigure 6 replaces the op initializer that always send – inf or + inf in Figure 5.
Fig. 6. Cooperation: a fixed point of HC helping fc

Designing Hybrid Cooperations with a Component Language 455
Table 3 presents results of the cooperations presented in Figure 6-(left) andin Figure 7-(right) for which we consider a fixed point of fc(2sec):
Fig. 7. Cooperation: a fixed point of HC helping a fixed point of
Again, the results of both schemes of cooperation are the same in terms ofIn terms of time, the results are almost the same; the only difference is
that when solving instance we expend 2 seconds in solution number 12until fc(2sec) stopped because it could not get a new solution.The results of these schemes of cooperation on instances rc1 and are worsethan the results of the first schemes of cooperation (Tables 2) in terms ofonly on instance the results are the same.In Table 3-(left), we can see that FC helps HC to escape a local optimum:HC can thus continue visiting better solutions, and this cooperation is betterthan HC alone for instance When solving instances rc1 and FC isnot useful to HC and we obtain the same results as applying HC isolated.
Based on these results, we can say that fc gives good initial points to start asearch using HC, but when the problem is too hard fc does not help HC.

456 C. Castro and E. Monfroy
4.3 Hill-Climbing with Restart
Finally, we analyse the effect of giving a starting point to bn, either obtainedby fc (cooperation of Section 2) or by the start solver. We solve the problemsapplying a fixed point of bn but considering four starting points randomly gen-erated by the start solver. Note that on Figure 8-(left), the sel synchronizertakes as input a problem and an optimum, and returns only the problem: thissynchronizer enables HC to compute four times in sequence, whereas Figure 8-(right) presents a cooperation in which 4 HC computes in parallel with differentstarting points.
Fig. 8. HC with restart (left) and four HC in parallel (right)
Table 4 presents the results for instances rc1, and of applying insequence four HC with restart:
For all instances, HC with restart gives better solutions than the applicationof HC with just an initial point: the results obtained with the four differentinitial points are better than the results with the first initial point only (thatalso corresponds to the results presented in Table 1).In general, the results presented in Tables 2 are the best. fc gives good initialpoints to HC; HC improves quickly the quality of the solutions; and thenFC continues trying to improve the solution or proving optimality.In instances rc1 and the best results obtained by HC with restart arebetter than the results in Tables 3. But for all instances the results obtainedby HC with restart are worse than the ones obtained by “applying first fcand then HC”.
5 Conclusion
We have solved some optimisation problems using a cooperative approach. Wehave integrated complete and incomplete techniques in order to profit of theadvantages of each one. The cooperation between solvers has been specifiedusing a coordination language which seems to be very suitable for this task.Experimental results show that hybrid algorithms always perform better thanisolated solvers. The language used to design the algorithms allows us to specify

Designing Hybrid Cooperations with a Component Language 457
concurrent and parallel schemes of cooperations (e.g., see Figure 8-(right)). Thus,from a practical point of view, we are interested in implementing, as further work,these facilities in order to test these cooperation schemes. Concerning the designof the language, we plan to improve it by adding the concept of memories sharedby several components. This would simplify the design of cooperations and somepatterns, such as the one presented in Figure 3.
References
1.2.
3.
4.
5.
6.7.
F. Arbab. Manifold 2.0 Reference Manual. CWI, The Netherlands, May 1997.A. Bockmayr and T. Kasper. Branch-and-Infer: A unifying framework for integerand finite domain constraint programming. INFORMS J. Computing, 10(3):287–300, 1998.C. Castro, E. Monfroy, and C. Ringeissen. A Rule Language for Interaction. InRecent Advances in Constraints, volume 3010 of LNAI, pages 154–170. SpringerVerlag, 2004.C. Castro, M. Moossen, and M. C. Riff. A Cooperative Framework Based on LocalSearch and Constraint Programming for Solving Discrete Global Optimisation. InSBIA’04, LNAI. Springer Verlag, 2004. To appear.N. Jussien and O. Lhomme. Local search with constraint propagation and conflict-based heuristics. Artificial Intelligence, 139:21–45, 2002.A. Mackworth. Consistency in Networks of Relations. AI Journal, 8:99–118, 1977.E. Monfroy and C. Castro. A Component Language for Hybrid Solver Coopera-tions. In ADVIS’04, LNAI. Springer Verlag, 2004. To appear.

458 C. Castro and E. Monfroy
8.
9.
10.11.
S. Prestwich. Combining the scalability of local search with the pruning techniquesof systematic search. Annals of Operations Research, 115:51–72, 2002.M. Solomon. Algorithms for the vehicle routing and scheduling problem with timewindow constraints. Operations Research, pages 254–365, 1987.E. Tsang. Foundations of Constraint Satisfaction. Academic Press, 1993.M. Zahn and W. Hower. Backtracking along with constraint processing and theirtime complexities. J. of Exp. and Theor. AI, 8:63–74, 1996.

Multicriteria Optimization in CSPs : Foundations andDistributed Solving Approach
Inès Ben Jaâfar, Naoufel Khayati, and Khaled Ghédira
UR. SOIE, Stratégies d’Optimisation de l’ Informationet de la connaissancE, 41, rue de la Liberté – Cité Bouchoucha,
2000, Le Bardo, Tunis, Tunisia{ines.benjaafar,naoufel.khayati,khaled.ghedira}@isg.rnu.tn
Abstract. In Constraint Satisfaction and Optimization problems ranging fromdesign engineering to economics, there are often multiple design criteria or costfunction that govern the decision whereas, the user needs to be provided with aset of solutions which are the best for all the points of view. In this paper wedefine a new formalism for multicriteria optimization in constraint satisfactionproblems “CSPs” and a multi-agent model solving problems in this setting. Thisapproach separately optimizes different criteria in a distributed way byconsidering them as cooperative agents trying to reach all the non-dominatedsolutions. It exploits distributed problems solving together with nogoodexchange and negotiation to enhance the overall problem-solving effort. Theeffectiveness of the approach is discussed on randomly generated examples.
Keywords: multicriteria optimization, constraint satisfaction problem,distributed problem solving, multi-Agent systems, cooperative agents, nogoodsexchange.
1 Introduction
The Constraint Satisfaction framework is now widely used for representing andsolving various problems, related to the artificial intelligence and operations research(planning, scheduling, diagnosis, design, etc.). It appears that most problems are notpure Constraint Satisfaction Problems “CSPs”, but a combination of ConstraintSatisfaction and Optimization Problem, “CSOP” [13,14]. A CSP is defined as a triple(X, D, C), where X is a finite set of variables, D is a set of domains, one for eachvariable, and C is a set of constraints. Each constraint in C restricts the values thatone can assign to a set of variables simultaneously. The task is to assign one valueper variable, satisfying all the constraints in C[7,8]. A CSOP is a CSP with anassociated function that must be optimized.
However, in real life problems, the optimization function is not always welldefined and the user needs to optimize more than one criterion at the same time.Some tools consist in aggregating the different points of view into a unique functionwhich must subsequently be optimized[2,11,15]. Unfortunately, this is quite
C. Bussler and D. Fensel (Eds.): AIMSA 2004, LNAI 3192, pp. 459–468, 2004.© Springer-Verlag Berlin Heidelberg 2004

460 I. Ben Jaâfar, N. Khayati, and K. Ghédira
inadequate, because the criteria are generally incommensurable. They measuredifferent properties that cannot be related to each other directly and cannot becombined into a single function[2,11]. Indeed, such scheme reflects neither realoptimization nor the expected result from all criteria points of view[2, l1,15]. Hence,when several-often conflicting-criteria must be taken into account, a reasonableapproach is to pick the efficient, i.e. Pareto optimal solutions from the set ofavailable choices[15]. Eliminating choices that are not Pareto optimal is a techniquewhich avoids the formation of a scalar measure in the process of optimization andprovides the user with the set of all non-dominated points in a CSP.Since the notion of Multicriteria Optimization in CSP is logically distributed, wepropose to explore distributed artificial intelligence and more specifically the multi-agent systems that focus on cooperative and distributed problem-solving techniques[1,5,6].
The main objective of this paper is to introduce a new formalism forMulticriteria Optimization in CSPs, denoted Constraint Satisfaction and MulticriteriaOptimization Problem “CSMOP”, and a multi-agent model solving problems in thissetting. In this model, each agent is responsible for a single criterion and a subproblem from the initial CSP. Thus, the criteria are separately optimized without any“scalarization” form. The entities, called Criterion Agents, cooperate and negotiate inorder to find out all non-dominated solutions.The formalism of Constraint Satisfaction and Multicriteria Optimization Problem“CSMOP” is detailed in the following section. The multi-agent architecture and itsglobal dynamic are presented in the third and fourth sections and experimented in thefifth one. The last section contains concluding remarks and future work.
2 The CSMOP Formalism
The Multicriteria CSP underlying Optimization often involves more than oneperformance criterion and then requires a formalism more adapted and more suitablethan the classical CSOP one. That is why we propose a new formalism calledCSMOP inspired from the latter.A CSMOP is a quadruple (X, D, C, F) defined as following:
A set of n variablesA set of n domains where each variable has a finitediscrete domain of values calledA set of m constraint where each constraint isdefined by a sub-set of variables that it constrains, andhas a relation that defines values.A set of i functions, where is a performance criterionwhich maps every solution to a numerical value.
We will consider as solution of the CSMOP the set of non dominated feasibleassignments.

Multicriteria Optimization in CSPs 461
3 The Multi-agent Architecture
This approach benefits from the multi-agent techniques [l,5,6]that have opened anefficient way to solve diverse problems in terms of cooperation, conflict andconcurrence within a society of agents. Each agent is an autonomous entity that isasynchronously able to acquire information from its environment and/or from otheragents, to reason on the basis of this information and to act consequently. Within thelarge domain of multi-agent systems, our model consists of cognitive agents whosenumber is often limited ( here equal to the total number of criteria). The multi-agentarchitecture consists of Criterion agents cooperating in order to find out all the non-dominated solutions in a CSP. However, this class is not sufficient: an Interfacebetween this society of agents and the user is necessary to detect that the problem issolved. Consequently, a second and last class, called Interface, was created. Itcontains a single individual.
Each agent has a simple structure: acquaintances (the agents that it knows), a localmemory composed of its static and dynamic knowledge, a mailbox where it stores thereceived messages and a behavior. In the proposed model, agents communicate bysending messages. For the transmission between agents, we assume that messages arereceived in the order they were sent.
3.1 Criterion Agent
Each Criterion agent has its own CSP sub-problem. Its criterion to be optimizedthe domain of its variables and its associated variables ordering heuristic define its
static knowledge. Whereas, its dynamic knowledge consists of its current satisfactionlevel denoted (expressing the acceptable utility level for its ideal solutionvaluation denoted (corresponding to the best solution among the Pareto optimalones according to ) and its anti-ideal solution valuation denoted (whichcorresponds to the worst solution among the Pareto optimal ones according to ).Note that criterion acquaintances consist of the set of all the other Criterion agentsdenoted
3.2 Interface Agent
The Interface agent has as acquaintances all the Criterion agents. Its static knowledgeconsists of the whole CSP problem and the set of all the conflicting criteria, whereasits dynamic one consists of the set of Pareto optimal solutions and the final result.
4 The Multi-agent Global Dynamic
The idea of the proposed model is inspired from cooperative problem-solvingmethods which distribute the search problem and then allow the agents to workcooperatively on their local problems[l,5,6]. It consists in associating with every

462 I. Ben Jaâfar, N. Khayati, and K. Ghédira
Criterion agent a variable ordering heuristic, a criterion to optimize and a sub-problem CSP’ resulting from the decomposition of the initial CSP P (X, D, C) intoCSP P’ (X, D’, C) where the variable domains are distributed among agents. Everyagent cooperates with its acquaintances in order to generate local solutions to its CSPas soon as possible. This cooperation, is based on the nogoods exchange which theirrapid delivery helps the agents to avoid computationally expensive dead-ends[10].The challenge is in controlling this exchange so that it does not swamp the agentswith messages, and so that it efficiently results in convergence to consistent solutions.One way of ensuring systematic exchange and usefulness of the nogoods is to orderthe agents variables, such that some agents detect nogoods around which others mustwork and take into account in their future searches[10].
When all local solutions are detected, they are communicated to the Interface agentwhich will generate all the non-dominated solutions and achieves the negotiationprocess whenever the user is left with a huge number of Pareto optimal solutions tochoose from.
Before detailing these interactions and the underlying negotiation process, wepresent the distribution process of the space search and the nogoods exchange basedcooperative search.
4.1 Distribution Process of the Space Search
To reduce the space search of the agents and to make them more cooperative, wedeveloped a new distribution process for the CSP where each agent has the most ofthe variables but a subset of their domains values. This creates potential parallelismby allowing each agent to actively guess his own solutions and to discover differentnogoods simultaneously that others cannot detect or they can detect later [10].The process begins by comparing the number of all the criteria j to be optimized tothe size of all the domain variables. Three cases may occur:
such thatIn this case, the Interface creates j Criterion agents, decomposes the CSP(X,D,C)
into such that andSo each Criterion is responsible for only one criterion to optimize.
The Interface chooses the variable with the smallest domain, creates K Criterionagents K=1..j, decomposes the CSP(X,D,C) and each agent is associated with acriterion to be optimized and aand such that
The Interface chooses the variable with the biggest domain less than j,decomposes the CSP(X,D,C) into sub-problems and creates
Criterion agents. Each agent is associated with a criterion and asuch that and for k=l. .
The non associated CSP’ obtained from the previous decomposition CSP(X, D’’,C)

Multicriteria Optimization in CSPs 463
such that and and the set of theremained criterion, would be recursively distributedfollowing the three cases described previously.
4.2 Nogoods Exchange Based Cooperative Search
The cooperation is considered as the basis of our model functioning and is wellknown as a concept for improving efficiency and performance of algorithms. The goalof the cooperation is to share and exchange data between agents to speed-upcomputation. However, for realizing a cooperative system, we must,
take into account the following important points [4] :Properties such as correctness, completeness and termination are generallyestablished for a unique solver and must be preserved for a cooperativesystem.The operational semantics of the cooperation must be specified i.e. we mustfix these protocols:Should an agent sends new data as soon as they are deduced, or should itwaits until it terminates ?Should an agent integrates new data as soon as they arrived, or should itcollects them when the other agent has finished ?
In order to preserve all these properties for the cooperative system we have chosenthe NR-FC algorithm which is correct, complete and terminating[10]. Furthermore, itallows the exchange of nogoods. The operational semantics of the cooperationfollows this principle : each nogood is emitted to the other agents as early as hisdetection and is taken into account by the receiver as early as his reception.
The NR-FC is an improved version of the Nogood-Recording algorithm. Thisenhancement comes from the addition of the “Forward Checking” filteringmechanism. Its principle is as follows : every time that a partial assignment revealsinconsistent, it looks for the assignments of variables, which are responsible forfailure before to go back. For this fact, it records the set of the assignments ofvariables that makes the partial assignment inconsistent (nogood) in order to detectearlier in another branch of the tree the inconsistence of a partial assignment thatcontains this nogood.
In order to enhance the usefulness and the effectiveness of the systematic nogoodsexchange and their influence on the performances of the cooperative search, we haveselected some known variables ordering heuristics[3]. Thus, each agent will beassigned a variables ordering heuristic to diversify nogoods production and to identifyviolations of constraints earlier in the search.
4.3 Negotiation Process
Before detailing the negotiation process, let us recall some useful definitions:
Definition 1 A Multicriteria Optimization Problem is a situation in which, havingdefined a set A of solutions and a consistent family F of criteria on A, one wishes to:

464 I. Ben Jaâfar, N. Khayati, and K. Ghédira
Where A denotes the feasible set of design alternatives, or the design space[2,15].Definition 2 The vector is said to dominate another vector denoted
if and only if for all and for some j in {1,2,...n}. A point is said to be Pareto optimal or an efficient point for (MOP)if and only if there does not exist satisfying The vector isthen called non-dominated or non-inferior.Definition 3 Let a such that The vector is said to a-dominate anothervector if and only if there exist such that: for all
and for at least oneNote that is the index set of a subset of (n+1-a) criteria.Definition 4 A point is said to be a-efficient for (MOP) if and only if F(x*)is non a-dominated.a-Efficiency means that it is not possible to increase anyone’s utility withoutdecreasing at least the utility of a criterion[12].Definition 5 Let a and If õ is a-efficient and there does notexist such that U is and The point õ is then called
When receiving all the locals solutions from the Criterion agents, the Interfaceagent computes all the Pareto optimal solutions and then uses the notion of a-efficiency which provides an intermediate concept of branding some Pareto optimalpoints as being perhaps superior or more desirable than others[12]. One way tochoose the final Pareto optimal point would be to compute progressively the a-efficient points and to increase the a value at each step When the set ofk-efficient solutions is empty, the Interface stops the process and consider the subsetof the last founded solutions as the set of the solutions denoted Itis clear that provides alternatives satisfying the strongest requirementsand eliminating ones which are inferior. We show now a generic algorithm forgenerating solutions
Algorithm. 1. Generating solutions
The Interface retains the following set of solutions and communicates it to theseveral Criterion agents as a result of the CSMOP problem.
Often the process of reducing the set of solutions to retain points with the upperorder of efficiency may not yield the desired reduction in the number of options.Though a reduced set, the Criterion agent still has to process quite a large number of

Multicriteria Optimization in CSPs 465
solutions. The proposed negotiation process will allow us to further reduce the set ofsolutions in such a case.
At this level, the Interface informs the Criterion agents to start up the negotiationprocess on the bases of the set of solutions founded earlier. Next weconsider separately the properties of the Interface and the Criterion agent behavior.
4.3.1 Criterion Agent BehaviorThe Criterion agent behavior is to iteratively computes, both its ideal and anti-ideal costs as follows:
(for maximization),(for maximization), and uses these
parameters to compute its satisfaction level where isan adjustment parameter in ]0,1[ used to gradually increase and consequently toset up an order of preference among the set of solutions Inaddition to these parameters, the Criterion agent has to separate the set intosatisfied solutions SSol and unsatisfied solutions USol subsets such that
and The subset of unsatisfiedsolutions is considered as the set of solutions that the Criterion agent prefers at leastand which he would delete from the whenever most of the other agents have thesame agreements. So, he informs everyone about his unsatisfied solutions and asksthem to establish their vote. For the other Criterion agent, if any solution is belongingto their unsatisfied solutions they agree to delete it from the
As the expected answers are received, the Criterion agent sets up for every solutionin his unsatisfied subset a vote vector and removes from any solution themajority of the Criterion agents agree to delete. Then informs the Interface about thisremoval.
Under the assumption that all of the Criterion agents agree to remove the leastpreferred solutions from the Interface updates this set of solutions and arrangesthe removed solutions as the first subset of the least preferred solutions.Next, he communicates the modified to all the Criterion agents and asks them torestart a new negotiation process. The process terminates whenever the size of the
solutions is equal to one or if after two successive iterations no newsolution is removed. The last subset of solutions arranged is considered as the mostpreferred subset among the various solutions available.
5 Experimental Results
The implementation was developed with Actalk, a concurrent programming languagebased on Smalltalk 80 environment. In this language framework, an agent isimplemented as an actor having the Smalltalk object structure enriched by an abilityto send /receive message to / from its acquaintances, buffering the received messagesin its own mailbox. The Cooperative search based nogood exchange and the
4.3.2 Interface Behavior

466 I. Ben Jaâfar, N. Khayati, and K. Ghédira
negotiation process based on the distribution process of the space search, which aredescribed above, has been experimented on randomly generated binary CSPs andlinear objective functions. Classical parameters were used for generating theproblems[9]: number of variables (n), domain size (d), constraint density p (a numberbetween 0 and 100% indicating the ratio between the number of the problem effectiveconstraints to the number of all possible constraints, i.e., a complete constraint graph),constraint tightness q (a number between 0 and 100% indicating the ratio between thenumber of couples of values forbidden (not allowed) by the constraint to the size ofthe domain cross product) and the number of performance criterion (ncr).
As numerical values, we use n = 30, d = 15, p=50% and q varying from 20% to40% by steps of 3% to both keep the solutions number reasonable and to guaranteeconsistent problems. The Criterion number ncr is varying from 5 to 15.
The first experimentation aims at evaluating the impact of Multi-agentsarchitecture on the nogood exchange based cooperative search. Each Criterion agentis associated with an heuristic and thus to do them cooperate in order to speed up theresolution of the CSP. The effectiveness of the nogoods exchange based cooperativesearch is assessed through a comparison with the NR-FC algorithm associated witheach criterion agent and free of heuristic. The obtained results show a noticeableimprovement conveyed by the acceleration of the CSP resolution. This acceleration isdue to the reduction of the number of constraint checks and consequently the fallingof the CPU time. This can be explained by the fact that, an agent receives a nogoodfrom its acquaintances earlier than it can be generated thanks to the heuristics, whichdiversify the tree structure, and uses this nogood to cut its search space.
Figure.1 shows the behavior of the nogood exchange based cooperative searchcompared to the NR-FC algorithm.
Moreover, The application of the distribution process to the space search hasreduced the timing results between 36.19% and 42.09%. Figure.2 illustrates acomparison of the cooperative search with the entire CSP for each Criterion agent(MACS) to the cooperative search where the space search is distributed between allthe agents (DMACS). Note that this advantage is due to the reduction of the variablesdomain size.
The next experimentation will try to estimate the effectiveness of the optimizationto reduce the set of the final result. Table 1 shows the obtained results for n=10, d=15,p=50%, q=50%. They illustrate that the concept of a-efficiency could reduceeffectively the final decision. It should be noted that the average portion of the 2-efficient solutions (resp. 3-efficient solutions) represents 25.53% (resp. 6.87%) of thetotal number of efficient solutions.
6 Conclusion and Future Work
In this paper, we have developed a new formalism for Multicriteria optimization inCSPs and a multi-agent model solving problems in this setting. In this model each

Multicriteria Optimization in CSPs 467
agent is responsible for a single criterion. Thus the criteria are separately optimizedwithout any “scalarization” form. They cooperate and negotiate in order to find outand to reach their ‘best’ Pareto optimal solutions. Using the notion of a-efficiency andthe negotiation process in succession could help eliminate some alternatives amongthe multiple non–inferior ones. However, we shall focus on an efficient algorithm foridentifying points with a-efficiency order. As far as our future work is concerned,other experiments will be performed. In addition, we shall develop an algorithm fordealing with both CSP solving and optimizing in only one stage.
Fig. 1. The Improvements provided by the cooperative search MACS in term of CPU timecompared with the NR-FC algorithm.
Fig. 2. The effectiveness of the distribution process in term of CPU time compared with thecooperative search MACS.

468 I. Ben Jaâfar, N. Khayati, and K. Ghédira
References
[1]
[2]
[3]
[4]
[5]
[6][7]
[8]
[9]
[10]
[11]
[12]
[13][14]
[15]
S.H.Clearwater, B.A.Huberman and T.Hogg, Cooperative problem Solving, In Huberman,B., editor, Computation: The Micro and the View, 1992, p 33-70.I.Das and J.E.Dennis, Normal boundary intersection, In WCSMO-2, Proceedings of theSecond World Congress of Structural and Multidisciplinary Optimization, 1997, p 49-54.D. Frost, “Algorithms and Heuristics for CSPs”, A dissertation Submitted in PartialSatisfaction of the Requirements for the Degree Doctor of Philosophy in Information andComputer Science, University of California, Irvine, 1997.L. Granvilliers, E. Monfroy and F. Benhamou, “Cooperative Solvers in ConstraintProgramming : a Short Introduction”, Workshop on Cooperative Solvers in ConstraintProgramming at the 7th International Conference on Principles and Practice of ConstraintProgramming (CP2001), Cyprus, December 2001.T. Hogg and P.C. Williams, Solving the really hard problems with cooperative search, Inhirsh, H. et al., editors, AAAI Spring symposium on IA and NP-Hard Problems, 1993, p78-84.B.A.Huberman, The performance of cooperative process, Phisica D, 1990,p38-47.A.Mackworth, Consistency in networks of relations, Artificial Intelligence, vol.(8), 1977,p 99-118.U.Montanari, Networks of Constraints: fundamental properties and applications to pictureprocessing, Information Sciences , vol.(7), 1974.D.Sabin and G. Freuder, Contradicting conventional wisdom in Constraint Satisfaction, Inproceeding of ECAI-94, 1994, p 125-129.T.Schiex et G. Verfaillie, “Nogood Recording for Static and Dynamic ConstraintSatisfaction Problems”, International Journal of Artificial Intelligence Tools, p 187-207,1994.R.B. Statnikov and J.B. Matusov, Multicriteria Optimisation and Engineering, Chapmanand Hall, New York, 1995.I.Othmani, Optimisation Multicritère; Fondements et Concepts, PHD- Thesis , UniversitéJoseph Fourrier, Grenoble 1998.E.Tsang, Foundations of Constraint Satisfaction, Academic Press, 1993.E.Tsang and C.Voudouris, Constraint Satisfaction in Discrete Optimisation, UnicomSiminar, 1998.P.Vincke, Multicriteria Decision -Aid, JHON WILEY & SONS,1989.

Nonlinear State Feedback Control ofRigid Robot Manipulators
Mahdi Jalili-Kharaajoo
Young Researchers Club, Islamic Azad University, Tehran, IRANP.O. Box: 14395/1355, Tehran, [email protected]
Abstract. In this paper, nonlinear control strategy is applied to control of atwo-degree-of-freedom rigid robot manipulator. In order to obtain the nonlinear
control law, some inequalities so-called Hamilton–Jacobi–Isaacs (HJI)should be solved. It is so difficult, if not impossible, to find an explicit solutionfor HJI inequalities. However, there are some approximate solutions. One ofthese possible solutions is the use of Taylor Series expansion of nonlinearterms, which will be used in this paper. Using the obtained nonlinear robustcontroller, the response of the closed-loop system for tracking of fixed pointand oscillating reference signals are obtained. Simulation results show betterperformance for higher order approximated controller than that of lower orderone.
1 Introduction
The central target of nonlinear control is to internally stabilize the nonlinear plantwhile minimizing the effect of disturbances such as measurement noise, inputdisturbances and other exogenous signals, which invariably occur in most applicationsbecause of plant interactions with the environment. However, in deep contrast withlinear control methods, which are flexible, efficient and allow solving a broad class oflinear control problems, there are few practical methods in nonlinear control, whichcan handle real engineering problems with similar comfort. A prominent obstaclepreventing the use of current techniques is that most of them are based on theHamilton–Jacobi–Isaacs (HJI) equations to characterize solutions [1-3]. In order toobtain a nonlinear controller, one needs to solve the HJI equations. It is verydifficult, if not impossible, to find exact explicit solution for the HJI equations. Somesuccessive approximate solution methods are available for this problem [4-7].
Over the past decade, the problem of trajectory tracking for robot manipulatorshas attracted the attention of many researches, and various algorithms have beenproposed for the control of robot manipulators, which consists of a wide range ofstrategies, such as adaptive controllers and sliding mode control [8-11]. In this paper,nonlinear state feedback controller is designed for position control in a two-degree-of freedom rigid robot manipulator. To obtain the approximate solution of theHJI inequality, Taylor Series expansion of the nonlinear terms up to desired order isobtained that result in a nonlinear control law. Using the obtained controller, the
C. Bussler and D. Fensel (Eds.): AIMSA 2004, LNAI 3192, pp. 469-479, 2004.© Springer-Verlag Berlin Heidelberg 2004

470 M. Jalili-Kharaajoo
response of the closed-loop system for tracking of fixed point and oscillatingreference signals are obtained, which the nonlinear controller results betterperformance than the linear counter part.
2 Model of the System
We begin with a general analysis of an n-joint rigid robotic manipulator systemwhose dynamics may be described by the second-order nonlinear vector differentialequation:
where is the n × 1 vector of joint angular positions, M(q) is the n × n symmetric
positive definite inertia matrix, is the n × 1 vector containing Coriolis,centrifugal forces and gravity torques, u(t) is the n × 1 vector of applied joint torques(control inputs). The dynamic equations of the two-link robotic manipulator areexpressed in state variable form as with
The dynamics of this specific system is given by the equations [8-11]
where
3 Nonlinear Control Design
3.1 Problem Formulation
We consider a system of the form

Nonlinear State Feedback Control of Rigid Robot Manipulators 471
with x defined in a neighborhood of the origin in andIt is assumed that X, Z and Y are smooth
mapping of class k being sufficiently large. In addition to smoothness, thefollowing is assumed
A1: System (3) has an equilibrium point at (x, w, z) = (0,0,0).
A2: The matrix satisfies where is the
bound on gain of the closed-loop system.
A3: The matrix has full column rank
A4: The matrix has full row rank
A5: For any bounded trajectory of system (2) with input w = 0
The controller has to achieve two goals: it must stabilize the closed-loop systemand attenuate the influence of the exogenous input signal w on the controlled signal z,i.e., it has to bound its gain by a given value The disturbance attenuationproperty can be characterized by dissipativity [3].
3.2 State Feedback Controller
In this section, a feedback law is sought which renders the closed-loopsystem
(locally) dissipative with respect to the supply rate This
problem can be define
with which the system equations read
Then,
and the Hamiltonian function for this differential game can be found to be
In a neighborhood of

472 M. Jalili-Kharaajoo
satisfying
The Hessian of H satisfies
The matrix R may be factored as with
where the upper diagonal element of M is negative definite due to Assumption A2 andthe lower diagonal element is positive definite. Hence, the Hamiltonian function Hhas a saddle point in (w,u) for each in the neighborhood of
Define a smooth, nonnegative function V : in a neighborhood of x=0 suchthat V(0)=0 and the Hamilton-Jacobi-Isaacs inequality
holds for each x in a neighborhood of zero. Then,
yields a closed-loop system satisfying
i.e., a system which has the required dissipativity property in a neighborhood of(x,w)=(0,0), Due to Assumption A5, the feedback law (7) locally asymptoticallystabilizes the system if V(x) is positive definite. This can be seen by a Lyapunov typeof argument. For w=0, expression (8) reads
where can only be zero for asymptotically stable trajectories of x(Assumption A5). Thus, V(x) being positive definite and
being negative proves asymptotic stability of the closed-loop system.

Nonlinear State Feedback Control of Rigid Robot Manipulators 473
3.3 Approximated Controller
The HJI inequalities cannot be solved explicitly, in general. However, it is possible tocompute an approximated solution based on Taylor Series expansions, which can beused for finding an approximate control law [4,5]. The approximation of lowest order1
corresponds to the linear problem [5]. The two basic equations (5) and (6), where forthe former the equality rather than inequality is considered, may be written as
Step-by-step approximations of the solutions to these two equations are given inthe following subsections.
3.3.1 Lowest Order Approximation: The Linear ProblemFor the linearized system
the solution to the problem is well known. The storage function V(x) is given by
and the optimum by
where K is the solution to (8) as
Since this equality must hold for all x, it can be written as the Riccati equation
with
3.3.2 Higher Order ApproximationWith the linearized plant given above, the plant dynamics (4) may be rewritten as
with the supply rate –s(w,z)
1 The term “order” in connection with approximation does not refer to the dimension of the state vector butrather to the order of the Taylor approximation of each function. Sometimes, we use the expression“approximation order” to clearly distinguish this notion from the order.

474 M. Jalili-Kharaajoo
With these definitions of f and with the feedback law (10), and with
the equations (9) read
and
Solving the first of these equations for and the second for yields
Equation (12) written as a power series of terms up to order m is given by
d its term, i.e., the difference between the approximations of order m and m-1, by
Equation (13) as a power series of terms up to order k is given by
and its term

Nonlinear State Feedback Control of Rigid Robot Manipulators 475
Note that
Since f(x, v) and are power series starting with terms in (x, v) of order twoand three, respectively (for f, must be of higher order or a multiplication of x and
must occur because the linear terms with is already considered in Hence,
equation (14) is independent of its coefficient being
Thus,
where the convention
for l < k
is adopted.The right-hand side of (17) depends on the first (m-2) terms of and on the
first (m-1) terms of V(x), while the right-hand side of (15) is determined by the first(k-1) terms of and the first (k+1) terms of V(x). Therefore, V(x) and canbe approximated by consecutively computing
This computation does not have to be done in the way its feasibility is derived.Since Taylor approximations have to be computed in every step anyway, the easiestway to compute V is the following:
Similarly, for

476 M. Jalili-Kharaajoo
For both of these equations, V and on the right-hand sides stand for the sums
over all terms already computed.
4 Simulation Results
For simulation, the following parameters are considered
Using the proposed method the nonlinear optimal control law for and can beobtained. Here are the first and third order controllers.The first order optimal control laws:
The third order optimal control laws:
In this section, the MATLAB based simulations highlight the operation of themanipulator when tracking to a steady state value; and converge to 0.85 and1.25 respectively. The reference signals are
The initial state values of the system are selected as
In Fig. 1 the closed-loop system responses using the first order control law (dashedline) and the third order controller (solid line) are depicted. As it is seen, theperformance of the system with nonlinear controller is better than the linear one.

Nonlinear State Feedback Control of Rigid Robot Manipulators 477
In order to investigate further, the effect of nonlinear control action on theperformance of the system, the tracking problem of an oscillatory reference signal isconsidered. Here the desired trajectory reference signals are defined as
The initial state values of the system are selected as
As it can be seen from Fig. 2, the performance of the closed-loop system using thethird order controller (solid line) is better than that of the first order one (dashed line)and using the former the system needs less energy to track the reference signal sooner.
Fig. 1. Closed-loop system responses for tracking a fixed point reference signal using the firstorder controller (dashed line) and the third order controller (solid line)
5 Conclusions
In this paper, nonlinear controller was designed to control of rigid robotmanipulators. Because of the nonlinear nature of robot manipulators and this fact thatsome of the parameters are varying during the operation, the nonlinear controllerseems to be effective choice. In the design of the controller, we had to solve HJIinequalities but finding an explicit closed solution for these inequalities is toodifficult, if not impossible. In this work, we used an approximate solution based onTaylor Series expansion. Using this method, the nonlinear control law with desired

478 M. Jalili-Kharaajoo
order could be obtained. Simulation results showed that the performance of higherorder approximated controller is better than that of lower order one.
Fig. 2. Closed-loop system responses for tracking a oscillatory reference signal using the firstorder controller (dashed line) and the third order controller (solid line)
References
1.
2.
3.
4.
5.
6.
7.
8.
Isidori, A. and Astolfi, A., Disturbance attenuation and control via measurementsfeedback in nonlinear systems, IEEE Trans. Automatic Control, 37, pp. 1283–1293, 1992.
Van der Schaft, A. J., gain analysis of nonlinear systems and nonlinear state feedbackControl, IEEE Trans. Automatic Control, 37, pp. 770–781, 1992.
Isidori, A. and Kang, W., control via measurement feedback for general nonlinearsystems, IEEE Trans. Automatic Control, 40, pp.466-472, 1995.
Yazdanpanah, M.J., Khorasani, K. and Patel, P.V., Uncertainly compensation for a flexiblelink manipulator using nonlinear control, INT. J. Control, 6, pp.753-771, 1998.Jalili-Kharaajoo, M. and Yazdanpanah, M.J., Transient control and voltage regulation ofpower systems using approximate solution of HJB equation, In Proc. European ControlConference (ECC 2003), Oxford, England, 2-4 September, 2003.Lu, Q., et al., Decentralized nonlinear excitation control based on regulationlinearization, IEE Proc. Gener. Transm. Distri., 147(4), pp.940-946, 2000.Karlsson, N., Dahleh, M. and Hrovat, D., Nonlinear control of active suspensions, inProc. ACC’01, Arlington, VA, pp.3329-3335, 2001.Cai, D. and Dai, Y. A globally convergence robust controller for robot manipulator, Proc.IEEE Int. Conf. Control Application, Mexico City, Mexico, 2001.

Nonlinear State Feedback Control of Rigid Robot Manipulators 479
9.
10.
11.
Zhihong, M. and Yu, X. Adaptive terminal Sliding Mode Tracking Control for RigidRobotic Manipulators with Uncertain Dynamics. Journal of S. Mechanical Engineering,Series C., Vol. 40, Keleher, P.G. and Stonier, R.J. Adaptive terminal sliding mode control of a rigid robotmanipulator with uncertain dynamics incorporating constrain inequalities. J. ANZIAM,43(E),pp.E102-E157, 2002.Battoliti, S. and Lanari, L. Tracking with disturbance attenuation for rigid robots. Proc.IEEE Int. Con. Robotics and Automation, pp. 1578-1583, 1996.

Qualitative Model of Decision Making
University of Leipzig, Dept. of Computer Science,Augustus Platz 10/11, 04109 Germany
Abstract. In Classical Decision Theory, preferences and uncertainties of a deci-sion maker (DM) have the quantitative forms of a utility function and a prob-ability distribution. However, a numerical approach for decision making suffersfrom a knowledge acquisition problem. In this paper a qualitative model for de-cision making is proposed, where the DM is modeled as the agent with prefer-ences and beliefs about the world. Decision problem is represented by means ofBrewka’s logic program with ordered disjunction (LPOD) and a decision mak-ing process is a constraint satisfaction problem, where a solution is consistentwith a knowledge base and maximally consistent with the DM’s beliefs andpreferences.
Keywords: knowledge representation, logic programming, qualitative decisionmaking
1 Introduction
Classical Decision Theory, formulated by economists von Neumann and Morgensternin the 1950s [18], relies completely on a numerical representation of a decision proc-ess. Preferences of a decision maker (DM) are expressed by means of a utility functionand a probability distribution over a set of outcomes represents an uncertainty of asituation under consideration. A rational agent always selects an act which maximizesher expected utility. Savage [16], proposed an axiomatic framework of a theory ofsubjective expected utility, where acts are modeled by the functions of states and con-sequences. In this approach only a decision rule (expected utility maximization) has aquantitative nature, while preferences and uncertainties are derived from a total or-dering of acts, built by the DM.
However for real life problems, the requirements of numerical preferences and be-liefs or, of a total order of acts seem to be still to demanding for the DM. This argu-ment has motivated for various frameworks in AI, proposing partial and impreciseutility functions instead [1], nonstandard utilities and probabilities [13], and a sym-bolic constraint [12].
The approaches, which rely only on a qualitative representation of decision makingare called in AI qualitative decision theories1. Some of them, like [8], consider a no-tion of ordering by means of likelihood and preference relations. Most of them how-ever propose logical-based models of decision making [3], [17], [2], consisting on a
1 Motivations of such theories can be found in [7].
C. Bussler and D. Fensel (Eds.): AIMSA 2004, LNAI 3192, pp. 480–489, 2004.© Springer-Verlag Berlin Heidelberg 2004

Qualitative Model of Decision Making 481
symbolic representation of a decision process and considering many types of decisionrules to select the best decision. They allow formulating the problem in a less abstractway, where knowledge and preferences have a form of human-like expressions. Be-sides, in contrast to the classical frame, they often investigate a computational com-plexity of decision making process as well as an expressive power of the representa-tion language.
In the following we propose a qualitative model for decision making by means oflogic program with ordered disjunction (LPOD) [4] under answer set semantics [14].In general, answer set programming has been recognized as a very efficient and ex-pressive knowledge representation and reasoning tool for AI [10], [15]. We generalizeand extend the work of Brewka [6], where the idea of a qualitative decision makingthrough LPOD was introduced.
Decision maker is modeled as the agent having beliefs about the likelihood ofstates of the world (prioritized belief base), and having preferences over the conse-quences of acts (prioritized goal base). Decision process is a constraint satisfactionproblem, and solutions to the problem have forms of answer sets of a LPOD program,and are consistent with a background knowledge (feasible acts) and maximally con-sistent with a mental state of the Decision Maker (beliefs and preferences).
Section 2 gives some background of qualitative decision theories. In section 3 and4 a notion of answer set programming (ASP) and logic programming with ordereddisjunction (LPOD) is presented respectively, while section 5 studies a possibleframework of a qualitative decision model under the LPOD.
2 Qualitative Decision Theories
In AI there are mainly two reasons for the interest of qualitative tools in decisionmaking: knowledge acquisition problem- qualitative information is easier to obtainand computational efficiency- because of simplicity it can be made faster algorithms.
In general, all qualitative frameworks of decision making in AI consider commonnotions of a qualitative utility and a qualitative probability. For instance in [17] twosemi-qualitative rankings are proposed: k(w) ranking as an order-of-magnitude ap-proximation of a probability function P(w), and ranking as a form of a utilityfunction, being both the representation of uncertainty and preferences of a DM re-spectively. The two rankings are compared and the expected utility rule is applied.
In the approach proposed by Boutilier in [3], preferences of a DM are expressed bymeans of the conditional rules: to be read as “Ideally, if with the mean-ing: in the most preferred is the case. Probabilities are represented as thedefault rules of the form: interpreted as: in the most normal is thecase. A desirable decision is called a goal and is selected among the most preferredfrom the most normal worlds.
Both systems are referred to decision making under uncertainty (DMUU), wherethe uncertainty of a DM is modeled by way of an ordering relation over the worlds,being outcomes of possible acts. However there is another way of representation,originally formulated by Savage [16]. If is a finite set of a mutuallyexclusive and complete description of the world, and is a finite set of

482
consequences which express the outcomes of acts, then is an act, being acomplete mapping from the set of states to the set of consequences. Intuitively, a fea-sible act is represented by a vector of different outcomes contingent on the possiblestates. Uncertainty means that any of a state in S may occur but we do not have a cer-tainty, which will hold in fact.
Then, starting with a complete preorder on acts, given by a DM, Savage derived alikelihood relation representing uncertainty on events (subsets of S) in the state spaceand a preference relation on the consequences, which finally, after satisfying someaxioms, can be represented in a quantitative form of the probability distribution p andthe utility function u. Then acts can be ranked according to their expected utility:
In a recent field of AI, a work of Dubois et al. [8] considers a reformulation of Sav-age’s theory, suggesting two orderings: on the set of consequences and on the set ofevents, instead of a one weak order on acts. As a decision rule, the Likely DominanceRule of the form:
is suggested, to be interpreted: an act is more promising than an act iff the eventformed by the disjunction of states in which gives better results than is morelikely than the event formed by the disjunction of states in which gives resultsbetter than
However, the above framework relies still on too demanding requirements for DM.First, both orderings: on states and consequences, are assumed to be complete andtransitive relations. It excludes partial and cyclic (conflicting) preferences and beliefsfrom considerations2. Second, it does not investigate conditional preferences, so calledstate-dependent preferences (or utilities). Third, any procedure to handle with a com-plete ignorance of the DM about states of the world is not proposed. Besides, as soonas the theory of decision making has only a mathematical form, it does not deal with aproblem of representation and reasoning language, which could be efficiently imple-mented. In contrary, in Boutilier’s logic [3] a partial knowledge and defeasible goals3
as well as different strategies, depending on the level of certainty of the DM, are con-sidered. In [9] a framework based on possibilistic logic was introduced, where defaultknowledge and many forms of preferences are investigated. However, in first is notpossible in general to express complex conditional preferences and a priority to beliefsover preferences in the decision rule is always given4, while in latter no mechanism tohandle with ignorance of the DM is proposed.
It seems that a representation of decision making under uncertainty, proposed bySavage in economy, is too demanding and the expressive power of the language is
2
3
4
The latter appear in DMUU, when conditional and defeasible preferences are expressed.
Defeasibility of knowledge can be formally expressed as: given (consequence rela-
tion) may hold. This seems to be a feature of preferences, when by adding new
preferences or knowledge, previous desirable conclusions become not valid.Sometimes we want to express situations which are unlikely, but which have a high impact,i.e., an extremely high or low utility and it is not possible in such frameworks.

Qualitative Model of Decision Making 483
very limited. Logic-based approaches seem to be more flexible and general, thus use-ful for qualitative decision tasks, allow to incomplete and defeasible knowledge beexpressed and reasoned in a symbolic fashion.
Let us, based on the above remarks, formulate some postulates a qualitative deci-sion making system, based on the symbolic representation (logic), should meet:
different strategy, depending on levels of certainty of the DM (certainty, uncer-tainty and ignorance)incomplete (partial) preferences and beliefs of the DMdefeasible knowledge, preferences and beliefsgeneral and arbitrary form of preferences (conditional, cyclic)priority between degree of beliefs and preferences (extreme utility/likelihood)Not all of these postulates refer strictly to DMUU; some are more general and are
related to decision tasks in general (i.e. cyclic preferences). On the other hand, a fewmore concrete requirements will be investigated in the next parts of the paper.
3 Answer Set Programming
Answer set programming is a new logic programming paradigm for knowledge repre-sentation and problem solving tasks in artificial intelligence [14]. Representation of aproblem is purely declarative, suitable for many aspects of commonsense reasoning(diagnosis, configuration, planning etc.). Instead of a query technique (Prolog), itbases upon a notion of possible solution, called answer set.
Consider a propositional language L, with atomic symbols called atoms. A literal isan atom or negated atom (by classical negation ¬). Symbol not is called epistemicnegation and the expression not a is true, if there is no reason to believe, that a is thecase. A rule r is an expression of the form:
where are literals,and Head(r) = c. A rule with an empty Head is usually referred to as anintegrity constraint. A logic program is a finite set of the rules.
Let assume now, that L is a set of all ground (without variables) literals, being pres-ent in the extended logic program P and I is an interpretation of P , The Gel-fond-Lifschitz (GL) transformation of P with respect to I is a positive logic programwhich is obtained in two steps:
deletion all rules r of P, for whichdeletion the negative bodies from the remaining rulesThen, I is an answer set of the logic program P, if I is a minimal model (no proper
subset of I is a model of of the positive (without not) logic programExample 1. Consider the program L = (a, b, e,
f), and let I = {a, f}. The GL reduction of the program w. r. t. I is the programAccording to the definition, I is an answer set for the program P, if I is
a minimal model of and in fact {a, f} is a minimal model of hence I is the an-swer set of P. The second answer set of the program P is {b} and these are the onlyanswer sets for this program.

484
In general, programs under answer set semantics describe family of intended mod-els. Therefore they encode possible solutions to a problem, being constraint satisfac-tion problem, and described by the program, where each clause is interpreted as aconstraint. By that means many combinatorial, search and constraint satisfactionproblems from the field of AI can be represented (diagnosis, configuration, planningetc.) and efficiently solved in implemented systems [10], [15].
4 Logic Programs with Ordered Disjunction
In [11] a notion of disjunctive logic programming under answer set semantics wasintroduced. A disjunctive rule r is a formula:
where are ground literals and the disjunctionis a Head(r) of the rule r. Disjunctive logic program is a finite set of the rules. Intui-tively, each of answer sets is allowed to include only one literal from Head of anydisjunctive rule r, whenever Body of that rule is satisfied. Then every model representsa possible solution to the problem. However, the disjunction is not able to capture theidea of a desirable solution among answer sets of a disjunctive logic program.
Consider an extended logic program (with two negations), where the ordered dis-junction × is allowed in the Head part of a rule. A logic program with ordered dis-junction (LPOD), proposed in [4], consist of rules of the form:
where are literals and the ordered disjunctionis a Head(r) of the rule r. The rule, let call it the preference rule, is originally to beread: if possible if is not possible, then if all of are not possi-ble, then The literals are called choices of the rule.
Answer sets of LPOD are ranked according to degrees of satisfaction of ordereddisjunctive rules and they are not always minimal models5. To distinguish, whichanswer set is preferred one, a notion of a degree of satisfaction of an ordered disjunc-tive rule by answer set is introduced.
Let A be an answer set of a LPOD program P. The ordered disjunctive rule r:
is satisfied by A to degree:1, if for some j or for some
if for all j, and for all i, andNote that degrees of satisfaction are treated as penalties, as smaller degree as better
answer set is. Moreover, a priority (meta-preferences) between preference rules can beexpressed with a meaning: in case of conflict, when it is not possible to satisfy all rulesto the highest degree, rules with a higher priority are to be satisfied first.
5
6Semantics of LPOD is based on the modified split techniques (for details see [4] ).Sometimes, giving a first degree to unsatisfied preference rule leads to unintuitive results.

Qualitative Model of Decision Making 485
Each solution to a problem, represented as an answer set of a LPOD program P, isranked according to its satisfaction degree of ordered disjunctive rules and one globalorder is obtained. A following criteria to build this ranking is proposed: cardinalityoptimal criterion- maximizing the number of rules satisfied to the highest degree,inclusion optimal criterion, based on set inclusion of the rules satisfied to certain de-gree and Pareto optimal criterion, consisting on a selection of answer set, which satis-fies all ordered disjunctive rules not worse then any other answer set does7.
Example 2. Program has one cardinalityoptimal answer set: which satisfies all rules “the best” (first to degree 1and second to degree 2). Remaining answer sets: and satisfy onerule to 1, and one rule to 3 degree. Pareto and inclusion winners are both and
On one hand, it depends on the problem, which of criteria should be used. On theother hand, in case of the decision making task, a crucial is the assumption of compa-rability of satisfaction degrees of ordered disjunctive rules.
5 Qualitative Model of Decision Making
In section 2, theory of decision under uncertainty was presented, where acts are mod-eled as functions from a set of states to a set of consequences, preferences of the DMin as the total preorder of consequences and her beliefs as the total preorder of states[8]. Two crucial assumptions are made there: preferences and beliefs are representedas two total orders and they are not comparable to each other. In the light of theseassumptions and the postulates, presented at the end part of this section, let us proposea qualitative model of decision making under LPOD. The main purpose is to developand extend the idea presented in [7] to a more general framework with respect to re-sults and concepts of the classical decision theory.
Decision problem is represented as a logic program consists of three sets of literals:the set S represents possible states, the set A of decisions and the set C of conse-quences. Rules of the program determine which acts are feasible (hard constraints).
Formally, let be the set of mutually exclusive states,be the set of consequences. For every feasible act the set of rules of the form:
for all and some is present in the program. Besides, the rule to allow onlyone consequence to be a result of an act under a given state (cardinality constraintrule) and the rule represents acts literals (disjunctive rule) is added to the program.
Preferences of the DM are expressed twofold: as a prioritized base of positivegoals, so the ordered set of disjunctive consequences, which she considers as desir-able, and/or as a prioritized base of negative goals, so the ordered set of disjunctiveconsequences, which are undesirable and she wants to avoid.
For every S, C, are represented in LPOD in a disjunctive part of therule (4) and are interpreted as disjunctions of the same preferred elements. Then:
7 A prototype implementation of LPOD in Smodels system can be found in [5].

486
Positive preference rule r:
to be read: the set of consequences is the most preferred, next preferred but stillreasonable is the set the least desirable but still reasonable is the set
Negative preference rule:
to be read: the set of consequences is the most unpreferred, next unpreferred is theset the least unpreferred is the set and for the both rules:
and for every i, j; and is a state and a consequenceliteral respectively8. Elements of are interpreted as equally preferred and thus hav-ing equal degrees of satisfaction.
DM’s beliefs are represented as a prioritized (by means of likelihood’s degree),base of likely states (belief rule), which she considers to be possible to occur:
where for every i, j and is a state literal. Elements ofare treated as equally likely by means of equal degrees of satisfaction.
To every literal being an element of the ordered disjunction part of LPOD rule, adegree of satisfaction is assigned. Thus, preference and likelihood orders are related tothe order of satisfaction degrees of its elements. Answer sets of the form areranked according to the satisfaction’s degree of preference and belief rules.
When a commensurability assumption between degrees of satisfaction of answersets with respect to states and consequences orderings is not taken, two decision crite-ria can be used to select the best answer set: a counterpart of the Likely DominanceRule (LDR), where answer sets are compared by means of containing the most pre-ferred consequences in the most likely states, (priority of the belief rule over the pref-erence rule) and Preference Dominance Rule (PDR), which selects answer set con-taining an act, which execution leads with the highest degree of likelihood to the mostpreferred consequence (priority to the preference rule over the belief rule).
A solution to a decision problem is any answer set (thus an act) which is consistentwith the knowledge base (feasible acts) and satisfies “the best” the DM’s preferencesand is maximally consistent with her beliefs9.
Example 3. (Savage) A DM is in the process of making an omelet. She has alreadybroken five eggs into a bowl and must choose between breaking an egg into a saucer,breaking it into the bowl, or throwing it away. The decision maker is uncertainwhether the egg is good or rotten. The consequences of breaking the egg into the sau-cer are a five-egg omelet or a six-egg omelet and, in either case, a saucer to wash. Theconsequences of breaking the egg into the bowl are a six-egg omelet or no omelet. Theconsequences of throwing the egg away are five-egg omelet with one good egg de-stroyed or a five-egg omelet. Thus: S = {rotten, fresh}, C = {five-omelet-one-egg-
8
9When m = 1, it is a conditional preference rule, and for it is a defeasible rule.Preferences and beliefs reflect actual desires and knowledge of a DM; they are not necessaryrational, but rather should be interpreted in terms of the willingness to act in a certain way.

Qualitative Model of Decision Making 487
destroyed, five-omelet, six-omelet, zero-omelet, six-omelet-wash, five-omelet-wash}and A = {throw-away, in-omelet, in-cup}. The decision problem is the logic program:
five-omelet rotten, throw-away.
five-omelet-one-egg-destroyed fresh, throw-away.
six-omelet fresh, in-omelet.
zero-omelet rotten, in-omelet.
six-omelet-wash fresh, in-cup.
five-omelet-wash rotten, in-cup.
1{six-omelet, six-omelet-wash, five-omelet, five-omelet-wash, five-omelet-one-egg-destroyed, zero-omelet} 1.in-omelet in-cup throw-away.
Let assume now the following preferences and beliefs of the DM, where P and Bdenote the preference and the belief rule respectively:
P: six-omelet × six-omelet-wash × five-omelet.B: rotten × fresh.
The answer sets are: fresh, six-omelet, ¬ zero-omelet} satisfies Prule to degree 1, and B rule to degree 2; fresh, six-omelet-wash, ¬ zero-omelet} satisfies P to degree 2 and B to degree 2 and rotten, five-omelet, ¬ zero-omelet} satisfies P to degree 3 and B to degree 1. When the commen-surability assumption between degrees of satisfaction of both rules is taken, cardinal-ity optimal criterion: hence the act {in-omelet} is the winner. Withoutthis assumption: the LDR criterion leads to: hence {throw-away} is thewinner, and by means of the PDR criterion: is obtained and the act {in-omelet} is the winner.
The differences between results can be explained by a different attitude of the DMto the risk. In case of the LDR rule, she would rather consider first the most likelystate and looks for the act, which gives the best consequences in that state. The PDRcenters on the best consequence first and then an act which leads to it with the highestdegree of likelihood is selected.
If we consider the DM with the same preferences, but having the belief {fresh ×rotten}, only one preferred act {in-omelet} is the winner because no conflict betweenthe satisfaction of the preference rule and the satisfaction of the belief rule is present.
Let assume now the following agent is given:P: six-omelet × preference-equality.B: rotten × fresh.five-omelet six-omelet-wash preference-equality.
where the atom {preference-equality} means: {five-omelet six-omelet-wash} con-sequences are the same preferred. Then, by the use of the commensurability assump-tion (cardinality criterion): hence both acts {in-omelet} and {throw-away} are the best, while without the assumption, the LDR leads to:
¬ zero-omelet.

488
hence {throw-away} is the winner and the PDR to: and {in-omelet} isthe winner.
There are mainly two difficulties with the approach presented above: what to dowith situations, where some answer sets satisfy all preference and belief rules to thesame degree and how to handle with a certainty and an ignorance of the DM?
Decision making under certainty in LPOD can be exampled in the following way:P: six-omelet × six-omelet-wash × five-omelet.B: rotten.
where B is certain. The winner is rotten, five-omelet}, thus thedecision is {throw-away}, although it satisfies the preference rule only to 3 degree.
In case of decision under ignorance, it is not reasonable to make a decision basedonly on information about preferences. Many decision rules were proposed in theliterature, which are useful when information about likelihood of states is not pres-ent10. Consider the example, where two states are equally likely and the preferencesare the following:
P: six-omelet × six-omelet-wash × five-omelet × five-omelet-wash × five-omelet-one-egg-destroyed × zero-omeletB: fresh rotten
Maxi-max rule (optimistic DM) selects the act which leads to the best among all themost preferred consequences of each act under every state. The answer set {in-omelet,fresh, six-omelet} contains the best consequence among all of acts, so {in-omelet} isthe preferred decision. Maxi-min rule (cautious DM) selects the act which leads to thebest among the worst consequences of all acts. The answer set {in-cup, five-omelet-wash, rotten} is the best according to maxi-min rule and {in-cup} is the preferreddecision.
The second problem of breaking a tie between equally preferred answer sets can beapplied in LPOD in the following way: if some of answer sets (thus acts), satisfy goaland belief bases the same good, acts are compared by means of next preferred answersets, which encode decision scenarios of these acts under the remaining states of theworld. It can be done by adding the same preferred acts as a disjunctive rule to theprogram, and its consequences as the constraint rules. Then, the same decision rule isapplied to the modified program, until the tie is resolved.
6 Conclusions
The main contribution of the paper has been to present a qualitative model of decisionmaking, its representation structure and the reasoning mechanism. A qualitative ap-proach against to a quantitative one seems to be less demanding to the DM ipso factomore natural, allowing a representation of a problem in a more intuitive and a straight-forward way. Depending on level of uncertainty of the DM and her attitude towardsrisk, appropriate strategy to make a decision can be used. Besides, partial and incom-plete knowledge can be expressed by means of logic programming techniques. Be-cause of the space restrictions we have not exampled the advantage of LPOD in repre-senting conditional and defeasible preferences and knowledge.
10 In this case complete or specific information about preferences are required (best or worst).

Qualitative Model of Decision Making 489
In the future, problems of collective and qualitative multicriteria decision making inthe context of LPOD will be elaborated.
Acknowledgements. The author is very grateful to Gerhard Brewka, Patryk Burek,Asim Ali Shah and anonymous reviewers for useful comments and remarks.
References
1.
2.
3.
4.
5.
6.7.
8.
9.
10.11.
12.
13.
14.15.
16.
17.18.
Aumann, R.: Utility Theory Without the Complet. Axiom. Econometrica 3 (1962) 445-462Bonet, B., Geffner, H.: Arguing for decisions: a qualitative model of decision making.Proc.UAI’96, USA (1996) 98-105Boutilier, C. 1994. Towards a logic for qualitative decision theory. Proc. KR’94, Germany(1994) 75–86Brewka, G.: Logic Programs with Ordered Disjunction. Proc. AAAI, Canada (2002) 100-105Brewka, G.: Implementing Ordered Disjunction Using Answer Set Solvers for NormalPrograms. Proc. JELIA’02, Italy (2002) 444-455Brewka, G.: Answer Sets and Qualitative Decision Making, synthesis, to appear 2004Doyle, J.,Thomason,R.: Background to qualitative decision theory. AI Mag. 20 (1997) 55-68Dubois, D., Fargier, H., Prade, H., Patrice, P.: Qualitative Decision Theory: From Sav-age’s Axioms to Nonmonotonic Reasoning. Journal of the ACM 49 (2002) 455-495Dubois, D., Le Berre, D., Prade, D., Sabbadin, R.: Logical representation and computationof optimal decisions in a qualitative setting. Proc. AAAI’98, USA (1998) 588-593Eiter, T., et al.: The KR System dlv. Proc. KR’98, Italy (1998) 406-417Gelfond, M., Lifschitz, V.: Classical Negation in Logic Programs and Disjunctive Data-bases. New generation computing 9 (1991) 365-385Lang, J.: Conditional desires and utilities: an alternative logical approach to qualitativedecision theory. Proc. ECAI’96, Hungary (1996) 318–322Lehman D.: What is qualitative? A framework for quantitative and qualitative decisiontheory. AAAI Spring Symposium, USA (1997) 65-70Lifschitz, V.: Answer set programming and plan generation. AI 138 (2002) 39-54Niemelä, I., Simons, P.: Smodels-an implementation of the stable model and well-foundedsemantics for normal logic programs. Proc. LPNMR’97, Germany (1997) 420-429Savage, L.: The Foundations of Statistics. 2nd ed. John Wiley and Sons, NY: Dover(1954)Tan, S. W., Pearl, J.: Qualitative Decision Theory. Proc. AAAI’94, USA (1994) 70–75Von Neumann, J., Morgenstern, O.: Theory of Games and Economic Behavior. 2nd ed.Princeton University Press (1944)

Information Retrieval Model Based on User Profile
Rachid Arezki1, Pascal Poncelet1, Gérard Dray1, and David William Pearson2
1Centre LGI2P, école des Mines d’Alès, Site EERIEParc Scientifique Georges Besse, 30035, Cedex 01, Nîmes, France
{rachid.arezki, pascal.poncelet, gerard.dray}@ema.fr2 EURISE, Jean Monnet University of Saint-Etienne 23, rue du Docteur Michelon
42023 Saint-Etienne, [email protected]
Abstract. With the development of internet and storage devices, onlinedocument servers abound with enormous quantities of documents, so thatfinding the right and useful information becomes a very difficult task. The enduser, generally overloaded by information, can’t efficiently perceive suchinformation. It became urgent to propose new information retrieval systemsable to apprehend efficiently these enormous quantities of documents. In thispaper we present PQIR an information retrieval model based on user profile.The originality of our approach is a choice of indexing terms depending on theuser request but also on his profile. An empirical study confirms the relevanceof our approach.
1 Introduction
With the development of internet and storage devices, online document serversabound with a very large number of documents. The end user, generally overloadedby information, can’t efficiently perceive such information. Today, one of the tackledissue is thus to provide the end user with the right and useful information. Indeed, theobjective of an information retrieval system is to answer efficiently to a user requestoften expressed in natural language. Whatever the effectiveness of informationretrieval system used, relevant documents can be omitted because the user requestdoes not refer correctly to these documents. Indeed, requests only formulated by keywords express badly the user information needs. Of course, these needs depend on theformulated request but also on the knowledge acquired by the user in his searchdomain. In other words, two users can formulate the same requests for differentneeds. For example, the results awaited by an expert in Java language formulating therequest “Java course” are different from the results awaited by a non expert with thesame request. One, solution consists of taking into account the user profile in theinformation retrieval process in order to increase the relevance of the answereddocuments. In this paper, we present PQIR an information retrieval model based onuser profile. The originality of our approach is a choice of indexing terms dependingon the user request but also on his profile. That is to say that we consider the need of auser depends on his request but also on his knowledge acquired through time on the
C. Bussler and D. Fensel (Eds.): AIMSA 2004, LNAI 3192, pp. 490–499, 2004.© Springer-Verlag Berlin Heidelberg 2004

Information Retrieval Model Based on User Profile 491
thematic of his request. The article is organized as follows: Section 2 presentsinformation retrieval in the standard vector space model. Then, Section 3 presents ourinformation retrieval model. Experimental results are presented in Section 4. Section5 gives an overview of related work. Finally, Section 6 provides some concludingremarks and directions of future research.
2 Information Retrieval Based on Standard Vector Space Model
In the vector space model, each document d is represented by a n-dimensional vectorwhere is the weight of the term in the document d. A term can be a
word, a stem, a lemma, or a compound. For each pair (u, v) of vectors, a similarityfunction (or distance function) s(u,v) should be defined. For a given request vector q(a request is also just a text and can be converted into a vector), retrieval is achievedby measuring similarity between a document and request in the underlying vectorspace. Thus, the most similar documents to the request will be proposed to the user.More formally, the standard vector space model can be presented as a tuple<X, Q, T, s, f>, where X represents the set of documents (i.e. document collection), Qstands for the set of requests, T represents the term set indexing, s is a similarity ordistance function and f is the term set construction function, with T=f(X).
Term set construction. The indexing term set T is built from the collection X. Itselements are chosen to be as discriminative as possible. Thus, there are variousmethods: for example the choice of indexing term set can be based on term frequency,where terms that have both high and low frequency within a document are consideredto be function words [10][16][18].
Term Weighting. The weight of a term represents the degree of its importance in adocument. There are three main factors term weighting: term frequency factor,collection frequency factor and length normalization factor. TF-IDF weighting is onethat has been well studied in the information retrieval, where the importance of a termis proportional to the occurrence frequency of this term in each document andinversely proportional to the total number of documents to which this term occurs in agiven document collection [16]. More precisely, let be the frequency ofoccurrence of term in a document d and let be the corresponding documentfrequency. The importance of word i in document d, denoted by is expressed asfollows:
where N represents the number of documents in the collection.
Similarity Measure. They are different similarity measures, the most popular one isthe cosine coefficient. It measures the angle between a document vector and therequest vector. Let and be two documents vectors, the similarity of the cosinebetween these two documents is formulated by:

492 R. Arezki et al.
where represents the euclidean length of the vector
3 PQIR Model
PQIR is an extended vector space model, it can be presented as a tuple<X, Q, P, T, s, f>, where X represents the set of documents (i.e. documentcollection), Q stands for the set of requests, P is the set of user’s profiles, T representsthe term set indexing, s is a similarity or distance function and f is the term setconstruction function. For a given request q and a profile p we have T=f(p, q).
Our motivation is to integrate effectively the user interests in the informationretrieval process. Thus, the construction of the indexing term set T is done in adynamic way and depends both on the user profile p and on the request user q (i.e.T=f(p, q)). For each new user request q, a new term set T is rebuilt. After thedetermination of the indexing term set T, the request q and each document of thecollection X are represented by vectors. To better adapt to the user’s needs, the initialrequest vector q is transformed into The transformation of q to requires theconstruction of the profile-request matrix (Section 3.3). The algorithm belowdescribes the information retrieval process associated with a new user request q.
Algorithm 1: Retrieval AlgorithmInput q: user request, p: user profileOutput proposal of documents to the userBegin
1. construction of the indexing term set T2. calculation of the profile-request matrix3. vectorial representation of the request q and of each document of the collection X4. calculation of the new request vector5. calculation of the similarity between and the whole documents of the collection X6. propose to the user the documents most similar to the request
end
3.1 User Profile Representation
A user is defined by a tuple p=<id,G> where id stands for an unique user identifierand G is a graph representing documents consulted by this user. The general idea is toanalyze the content of the different documents and to store in the graph G the co-occurrence frequency between various terms of a document, as well as occurrencefrequency of these terms. More formally, G=<V, E> is a labelled graph such as:
1. is a set of vertices of G, where each vertex is
represented by a term and its frequency2. is a set of edges of G, where reresentsco-occurrence frequency between the terms and

Information Retrieval Model Based on User Profile 493
The co-occurrence frequency (or co-frequency) between two terms is defined as thefrequency of both terms occurring within a given textual unit. A textual unit can be kterms windows, sentences, paragraphs, sections, or whole documents [2][12]. In theframework of our user model, represents co-occurrence frequency betweenthe terms and in the set of the documents consulted by the user.Thus, the user profile is built through the set of the documents consulted by user. Foreach new consulted document d, a graph of co-occurrence associated to d is built,according to the following steps:
Identification of terms (lexical segmentation),Elimination of the stop words, that is, terms that are not interesting,Stemming, that is, the reduction of terms to their root,Construction of the graph
For each new consulted document d, a graph is built, then is added to graph G.User profile is thus represented by the graph G (see Algorithm 2).
where represents the frequency of co-occurrence between the terms
in the graph G.
3.2 Indexing Term Set Construction
The choice of the indexing terms takes into account user profile as well asinformation retrieval request. Our goal is to choose indexing terms reflecting theknowledge of the user in the domain of his search. As shown by the algorithm below,the indexing terms are selected among the terms of the user model which are in co-occurrence with the terms of the initial request.

494 R. Arezki et al.
where is a constant representing the threshold of term selection.
3.3 Profile-Request Matrix
From the indexing terms obtained previously, we extract from the user profile p, theco-occurrence frequency matrix of the indexing term set T. This matrix representssemantic bonds between the various indexing terms. Let be the set ofterms contained in the user profile p=<id,G>. We call matrix profile-request, noted
the square matrix of dimension such as where each element
of is defined by:
3.4 Request and Document Representation
The initial request q is indexed on the set of terms T. Then from the matrix profile-request and the initial request q, a new request vector is calculated in order totake into account the user profile. This request aims to reflect, as well as possible, theuser interest in his search domain.
Euclidean length of the vectorEuclidean length of the vector
threshold such that allowing a hybridation between the initial requestand the enriched one the higher is the more the user profile is considered.
The documents of a collection are represented in the traditional vector space model[16] and are indexed on the set of terms T. The information retrieval is done by thecalculation of similarity between the new request and the documents of thecollection. To measure the similarity, we use the cosine formula [16] as described inSection 2.
3.5 Example
In order to illustrate our approach, let us consider the following example. Let a userbe defined by his profile p=<id, G>. Let us consider that this user retrieves adocuments on France through the request “France”. The Figure 1 shows a part ofthe user profile graph. The indexing terms are selected among the neighbors of theterm “France” in the graph G modeling the user profile. Thus, with for example a

Information Retrieval Model Based on User Profile 495
threshold by applying the algorithm of indexing term set construction(Algorithm 3), we obtain:
Fig. 1. A part of the user profile graph
The indexing term set selected is:
The request vector indexed on the set of term T is: q=(1, 0, 0, 0, 0, 0)The profile-request matrix will be:

496 R. Arezki et al.
For example, element corresponds to the frequency of co-occurrencesbetween the terms “France” and “kitchen”.
Thus, the transformed request becomes:
with we obtain:
The information retrieval is done by the calculation of similarity between the newrequest and the documents of the collection indexed on the set of terms T. Thus,the most similar documents to will be proposed to the user.
4 Experimentation
Data. The documents used for our empirical study are press articles, collected from 5different online newspapers in different periods. Our collection contains 1200documents on different thematics (Cinema, Data Processing, Economy, Football,International policy, ..).
Comparison. We have chosen to compare PQIR model with the standard vectorspace model VS and with a model similar to the one presented in DN02 (we call itPVS). In PVS, user profile has the same structure as a request or a document in thesystem and is represented by a vector in the vector space, for a given document d, arequest q and profile p, a retrieval function f(q,p,d) is defined by:
where s is the similarity function (we use the the similarity of the cosine).By varying the value of we found that the optimal value is between 0.2 and 0.6, forthis experiment is fixed to 0.5.The mechanism for updating the user profile in PVS is based on a linear adding ofvectors (of documents consulted by the user).
Procedure. The evaluation was made on 5 users (real and simulated). We asked eachuser to formulate request corresponding to its personal interest on the three systemsand to evaluate the results provided. Starting with an empty profile, the user consultsdocuments and at each 10 consultations he formulates the same request and evaluatesthe results obtained. For this experimental study the constants and are fixedrespectively to 0.3 and 0.01.
An evaluation was made to measure the capacity of the PQIR model to personalize ina relevant way the information retrieval.
4.1 Method

Information Retrieval Model Based on User Profile 497
Results. The evaluation of the IR systems is usually done with the standard measuresof precision (P) and recall (R), where:
The table 1 shows the precision of the documents returned by each system(PQIR, PVS, VS) according to the number of documents consulted by the user. Thus,P(10), P(20) and P(30) represent successively the relevance of the 10, 20 and 30 firstreturned documents. These results show significant improvement in the precisionscore when using the PQIR model rather than VS or PVS model. We also note thatmore user consults documents more the relevance of the documents returned by PQIRincreases, and it increase more than PVS model.
Fig. 2. Precision/Recall of the different systems after 100 documents consulted
In order to illustrate further the comparison between PQIR and PVS model,Figures 2 presents the precision/recall graph. The results show that the precision ofthe PQIR model is very high (greater than 0.83) for recall values less than 0.6. Forhigh recall values (>0.7) the precision decreases (between 0.13 and 0.6) and thesevalues are however good. We note also that the precision of the PQIR model is moreimportant than PVS and VS for all values of recall.

498 R. Arezki et al.
5 Related Work
In traditional information retrieval systems, users express their needs by formulatingrequests which are often insufficient to obtain relevant documents. Blair&Maronshowed that the poor performance of IR systems is mainly due to the incapacity of theusers to formulate adequate requests [3]. Indeed, experiments have proved thatdifferent users may expect different answers for the same request. Furthermore, thesame user, for the same request, may expect different answer in different periods oftime [13]. Thus, information retrieval models taking into account user profile wereproposed [13,7,5]. Different methods for learning user interests for informationfiltering and information retrieval were proposed [15,16,4,1,6,19,9,8]. Thus, Chenmodels the user by a multiple TF-IDF vectors [4]. In [14] the authors represent aprofile as Boolean features using a Naive Bayesian classifier to determine whether aWeb page is relevant or not. In [11,17], the authors use neural networks for learninguser profiles. Contrary to the existing information retrieval models, our modelintegrates semantic information in the representation of the user profile but also in thechoice of the indexing terms.
6 Conclusion
In this paper, we proposed a new approach for a personalized information retrieval.The model proposed allows a better consideration of the user’s interests in informationretrieval process by: (1) A dynamics choice of indexing terms reflecting as well aspossible the user knowledge in his search domain, (2) An automatic enrichment of theuser request by the matrix of profile-request.
In the information retrieval models where the user is represented by vectors ofterms, an iterative process of user profile re-indexing is necessary to take into accountof new indexing terms. In our model no re-indexing of user profile is needed.Experimental results confirm the relevance of our approach. One of the prospects forresearch is the application of the indexing term set construction method in theframework of a standard information retrieval model.
References
1.
2.
3.
R. Arezki, A. Mokrane, G. Dray, P. Poncelet, and D. Pearson. LUCI : A PersonnalizationDocumentary System Based on the Analysis of the History of the User’s Actions. InProceedings of the 6th International Conference On Flexible Query Answering Systems(FQAS 2004). LNAI, Springer Verlag, Lyon, France, pages 487–498, 2004.R. Besan,con, M. Rajman, and J.-C. Chappelier. Textual Similarities based on aDistributional Approach. In Proceedings of the Tenth International Workshop on DatabaseAnd Expert Systems Applications (DEXA99), Firenze, Italy, pages 180–184, 1999.D.C. Blair and M.E. Maron. An Evaluation of Retrieval Effectivness for a Full-TextDocument Retrieval System. Communication of the ACM, 28(3):289–299, 1985.

Information Retrieval Model Based on User Profile 499
4.
5.
6.
7.
8.
9.
10.
11.
12.
13.
14.
15.
16.
17.
18.
19.
L. Chen and K. Sycara. WebMate: Personal Agent for Browsing and Searching. InProceeding of the Second International Conference on Autonomous Agents, pages 132–139, 1998.P.M. Chen and F.C. Kuo. An Information Retrieval System Based on User Profile. TheJournal of Systems and Software, 54:3–8, 2000.C. Danilowicz and H.C. Nguyen. User Profile in Information Retrieval Systems. InProceedings of the 23rd International Scientific School (ISAT 2001), pages 117–124. PWrPress, 2001.C. Danilowicz and H.C Nguyen. Using User Profiles in Intelligent Information Retrieval.In Proceedings of the 13th International Symposium on Foundations of IntelligentSystems, pages 223–231. Springer-Verlag, 2002.W. Fan, M.D. Gordon, and P. Pathak. Effective Profiling of Consumer InformationRetrieval Needs: A Unified Framework and Empirical Comparison. Decision SupportSystems, to appear, 2004.H. Lieberman. Letizia: An Agent That Assists Web Browsing. In C. S. Mellish, editor,Proceedings of the Fourteenth International Joint Conference on Artificial Intelligence(IJCAI-95), pages 924–929, Montreal, Quebec, Canada, 1995. Morgan Kaufmannpublishers Inc: San Mateo, CA, USA.H.P. Luhn. The automatic creation of literature abstracts. IBM Journal of Research andDevelopment, 2:159–165, 1958.M. McElligot and H. Sorensen. An Evolutionary Connectionist Approach to PersonnalInformation Filtering. In Proceedings of the Fourth Irish Neural Network Conference,Dublin, Ireland, pages 141–146, 1994.A. Mokrane, R. Arezki, G. Dray, and P. Poncelet. Cartographie Automatique du Contenud’un Corpus de Documents Textuels. In Proceeding of the 7th international conference onthe statistical analysis of textual data JADT, 12-15 mars 2004, Louvain-La-Neuve,Belgique, 2004.S.H. Myaeng and R.R. Korfhage. Integration of user profiles: Models and Experiements inInformation Retrieval. Information Processing & Management, 26:719–738, 1990.M. Pazzani and D. Billisus. Learning and Revising User Profiles: The Identification ofInteresting Web Sites. Machine Learning Journal, pages 313–331, 1997.J.J. Rocchio. Relevance Feedback in Information Retrieval. In G. Salton, the SMARTRetrieval System : Experiments in Automatic Document Processing, pages 313–323,1971.G. Salton and M.J Mc Gill. Introduction to Modern Information Retrieval. New York:McGraw-Hill, 1983.A. Tan and C. Teo. Learning User Profiles for Personalized Information Dissemination. InProceedings, 1998 IEEE International Joint Conference on Neural Networks, Alaska,pages 183–188, 1998.C.J. Van Rijsbergen. Information Retrieval, 2nd edition. Dept. of Computer Science,University of Glasgow, 1979.D.H. Widyantoro, T.R. Ioerger, and J. Yen. Learning User Interest Dynamics with aThree-Descriptor Representation. Journal of the American Society of Information Science,52(3):212–225, 2001.

Schema Matching in GIS
Snezhana Manoah, Omar Boucelma, and Yassine Lassoued
LSIS-CNRS Avenue Escadrille Normandie-Niemen13397 Marseille, France
{Snezhana.Manoah,Omar.Boucelma,Yassine.Lassoued}@lsis.org
Abstract. With the proliferation of spatial data on the Internet, there is an in-creasing need for flexible and powerful GIS data integration solutions. Recallthat a data integration system provides users with a uniform access to a multi-tude of (local) data sources. The user poses his query against a virtual (global)schema, which is rewritten into queries against the local sources. A key issue inthis context is to provide (semi)automatic schema mappings between schemas.In this paper we describe a machine-learning based approach for GIS schemamatching. Our approach extends existing machine-learning approaches for (tra-ditional) data mapping but departs from them due to the nature of geographicdata. Our solution reduces the complex mappings by identifying different val-ues of a determining property.
1 Introduction
A data integration system provides uniform access to multiple data sources. The userposes her query against a virtual (global, mediated) schema; the query is decomposedinto queries that are sent to the local sources. The query answer is constructed fromresponses provided by the local sources. Wrapper programs are attached to the localsources in order to provide transformations between the local data models and theglobal data model. To translate the global query into queries to be posed against localschemas, the data integration system needs to know the correspondences betweenelements of both schemas. One of the main problems in data integration consists inthe construction of semantic mappings between the source schema and the mediatedschema.
Non standard domains such as Geographic Information Systems (GIS) need agreater compatibility between the different applications and sources of information,compatibility which could easily supply the user with information of different typeand location. Semantic integration of GIS is a hard topic, especially when there is nospecial hint that helps in choosing the best formalisms and/or integration architec-tures.
In this paper we describe our approach for GIS schema mapping. Our approachextends existing machine-learning approaches for (traditional) data mapping but de-parts from them due to the nature of geographic data we are dealing with. We proposea solution which reduces complex mappings by identifying a determining property.To improve the performances our approach includes a schema matching algorithmbased on geometric criteria.
C. Bussler and D. Fensel (Eds.): AIMSA 2004, LNAI 3192, pp. 500–509, 2004.© Springer-Verlag Berlin Heidelberg 2004

Schema Matching in GIS 501
2 Motivating Example
2.1 Geographic Data Model
The schema matching problem consists in identifying semantic mappings between lo-cal source schemas and the mediated schema. In order to build a data integration sys-tem which integrates sources having different data models, we have to choose a uni-fying data model for the mediated schema. In order to preserve the advantages of thenested structure and to comply with standards advocated by the OpenGIS Consortium[1] we are using GML, the Geography Markup Language [2] as an integration datamodel.
GML is an XML encoding for geographic data. GML uses XML Schema and of-fers the possibility to describe different geographic characteristics like coordinate ref-erence systems, geometry, topology, etc. In GML, the world is modeled using con-cepts such as features and properties. A GML feature is an abstraction of real worldphenomenon that is characterized by a set of properties, where each property can bethought of as a triple {name, type, value}.
2.2 Data Sources
In our example, we will study a subset of two Canadian databases: BDTQ (Base dedonnées topographiques du Québec) and CITS (Centre d’Information Topographiquede Sherbrooke) . BDTQ [3] describes a topographic database with 25 geographic fea-tures that cover: hydrography, means of transport, buildings, equipment, vegetation,borders, etc. For sake of simplicity we will consider only features for hydrography,means of transport and buildings. BDTQ features have a property denoted Descriptionwhich indicates the geographic type that may correspond to a given feature instanceas illustrated in Table 1.

502 S. Manoah, O. Boucelma, and Y. Lassoued
Table 2 below represents CITS source schemas. CITS encompasses a bigger zoneand contains 196 features that describe the same geographic objects as BDTQ doesbut in using a different ontology (vocabulary).
Like BDTQ, CITS features contain a property called EntityName that describes thegeographic type of a feature instance.
3 Related Work Limitations
Previous research papers have proposed many techniques and prototypes to achieve apartial automation of schema matching in specific application domains. Among theseprototypes are LSD [4], [5], DIKE [6], ARTEMIS [7], SKAT [8] and CUPID [9].Existing schema matching approaches are mainly based on linguistic techniques andmost of them deal only with bijective mappings that map one local schema elementinto one mediated schema element [10]. This makes them inappropriate to the GISdomain where data has a numeric type and the data structure involves complex map-pings.
3.1 Many-to-Many Mappings
Existing schema matching approaches are not appropriate to GIS where in most ofthem, different features have a different level of classification in terms of geographictypes. For instance, suppose that the global (mediated) schema contains two featuresdenoted Road and Railway. According to BDTQ Description property, Road andRailway types have one correspondent Vcomm_L. While in CITS, we have threefeatures that correspond to Road and Railway, these are: 21E5LI_ROAL_arc_arc,21E5ROADL_arc_arc and 21E5RAILWAL_arc_arc. As a result, bijective mappingsare hard to identify when processing mappings between BDTQ schema and the medi-ated one, because of the different classification granularities that may lead to many-to-many (n:m) complex mappings.

Schema Matching in GIS 503
3.2 Nomenclature Problems
Despite of standardization efforts for a geographic nomenclature [11], [12], GIS pro-viders still use different nomenclatures, when they are not using one that may not besignificant. This is the case of CITS where names are not very suggestive, and do nothelp in leveraging of existing matching approaches, which are mostly based on namematching and use word similarities extended with synonymous and homonymousdrawn from dictionaries. Hence a non significant nomenclature affects the perform-ance of such approaches.
4 Our Approach
In this section, we briefly describe the key ideas for tackling GIS schema matching.
4.1 Reducing Complex Mappings
As we already explained, the different geographic databases can have differentgranularity of representation of the geographic objects which engenders complexmappings. When a feature represents different geographic types, in the most of thecases, it contains a determining property which indicates the geographic type of theinstances of the feature. In BDTQ such property is the property Description. The so-lution that we propose is to transform many-to-many complex mappings into many-to-one mappings (n:1) or one-to-one (1:1) with a condition on the determining prop-erty values. This property can be found in an automatic way in using name based andconstraint based matching algorithms.
4.2 Geography Based Matching
One of the most important characteristics of the geographic data resides on the geo-graphic information that they contain. The different geographic types have oftengeometric properties that can be used to distinguish them from each other. Theseproperties do not only describe the geometric measures like length, surface, diameter,etc but can include properties concerning the global view of the set of the objects(density, surface density of the objects). For example, when we take a look at thegeographic representation of roads we notice that they have relatively regular andlengthened shapes which can distinguish them from other geographic objects (build-ings, lakes, etc.). We can also distinguish a street from a highway in using the differ-ences between their lengths and their disposition in an urban zone. Buildings aremainly of regular geometric shape (right angles and a limited number of sides) andtheir area value varies in certain ranges. Within an urban zone, buildings form groupsvery close to each other.
While some of these geometric properties are difficult to describe, others may beeasily calculated: length, area, lengthening, density, etc. To alleviate name based

504 S. Manoah, O. Boucelma, and Y. Lassoued
matching insufficiencies, we suggest to include geometric information in our match-ing system i.e., to use geometric based matching. For that, we need a set of well-defined discriminating criterions and an appropriated classification algorithm. Foreach instance of the geographic feature, the matching algorithm or the learner will re-ceive parameters like length, area, lengthening, density, etc., and in using a previouslearning/training knowledge, the learner should be able to classify the instance in agiven geographic category.
5 GIS Matching Design
5.1 Overall Design
The schema matching problem can be viewed as a classification problem. Given a setof mediated schema elements our matching algorithms, based on ap-propriate classification methods, have to classify each local schema element by find-ing its corresponding element in the mediated set The architecture ofthe schema matching system that we propose is based on a multi-strategy learning ap-proach as suggested in LSD [4], [5]. We use a set of matching algorithms called baselearners, each of them is dealing with a single matching criterion. To each pair (l,m), lbeing a local instance (i.e., an object of a local schema), m being a mediated instance,the base learners assign a score that indicates the probability that l corresponds to m.A composite matching algorithm called meta-learner combines the base learner pre-dictions. The meta-learner assigns for each base learner a set of weights that indicatethe relative importance of that learner.
The base learners and the meta-learner provide an instance-based matching. Toobtain the final results we generalize the performances on an instances level to theperformance on an element level. The base learners that we currently propose are theName Matcher and the Geo Matcher. A very important characteristic of the schemamatching system architecture is its extensibility. We are considering the integration ofother kind of base learners that exploit information like, spatial objects location, datatypes [13], the nested structure of the data, etc. Work performed by the system can bedivided in two phases: the training phase and the matching phase, described in thenext sections.
5.2 Training Phase
In the training phase the learners are trained to “recognize” the mediated schema ele-ments. The training information is manually prepared using a set of local sources.
First, the system extracts data from a given local source. Second, for each localfeature, the system asks the user to specify its determining property (if any). Finally,the system starts training the Name Matcher to recognize the determining property.The training proceeds this way: the system prepares the training examples that containthe name of the determining property for each local feature; these examples may beextended by synonyms before feeding the Name Matcher.

Schema Matching in GIS 505
For each feature, the system identifies different values for the determining prop-erty. The system refines the features into sub features and asks the user to specify therules that map a refined local feature to mediated feature. For example, for featureVComm_L, the user will specify:
When the refinement level is too high, the mappings are most often of kind n: 1.For example, in BDTQ feature Building_in_construction corresponds to the mediatedBuilding; it also corresponds as well to the same Building mediated feature. In thiscase, learners are trained to classify the refined features. The base learners receive aset of training examples and create their internal classification model. For each in-stance of a local feature and each base learner, the system prepares a training examplethat best suits the learner. The Name Matcher, for example, needs the feature namesand the value of the determining property, while the Geo Matcher receives a set ofpreviously calculated geometric properties like surface, perimeter, length etc. Themeta-learner calculates weights that indicate the precision level of learner forthe mediated element
5.3 Matching Phase
In the matching phase, firstly, the system extracts the data from the new source. Next,for each feature of the schema, the system distributes to the Name Matcher the neededinformation for the recognition of the determining property of this feature. The NameMatcher makes its predictions and determines the researched property. Next, the userverifies that the obtained mappings are correct. The system refines the schema fea-tures into sub features corresponding to the different values of the determining prop-erty. Furthermore, the learners make their predictions on each instance of a given re-fined feature and then send them to the meta-learner which combines them withappropriate weights. When the system has collected all predictions about the instancesof a refined feature, it calculates the average score that generalize the results of the in-stance-based matching into schema matching. So the result of the system’s work ismappings that map the refined feature of the local schema into features of the medi-ated schema.
6 The Base Learners
Our schema matching system conception includes, for the moment, only two baselearners: the Name Matcher and the Geo Matcher. The Name Matcher exploits textualinformation. It computes the similarity between the names of the elements and theirsynonyms. The Geo Matcher treats geometric information. It exploits the geometry ofthe instances that represent concrete geographical objects.

506 S. Manoah, O. Boucelma, and Y. Lassoued
6.1 Name Matcher
The Name Matcher exploits schema elements names. The matcher that we developedis based on the Nearest Neighbour classification algorithm. The Name Matcher has atraining phase and matching phase.
In the training phase the Name Matcher receives uses predefined mappings for aset of local sources. It performs pre-treatment operations, like normalization and ex-traction of synonyms. Normalization consists in removing all characters that are notletters; in doing so we improve the quality of mappings. Extraction of synonyms isdone with the help of WordNet [14].
During the matching phase, the matcher receives data from a new local source, per-forms a pre-treatment on it and then, using the training data and the Nearest Neigh-bour algorithm, identifies the mappings between the schema of the new source andthe mediated schema.
After the pre-treatment process of the training data and the pre-treatment process ofthe classification data, an element is represented by a bag of tokens, containing theelement name, its synonyms (if any) and eventually other keywords. In order to applythe Nearest Neighbour algorithm we need to define a distance between tokens and adistance between bags of tokens. The latter is defined as follows:
where are bags of tokens, is a weight that we assign to the similarity be-tween ti and tj, if or is not an extracted synonyms and if andare synonyms.
The similarity between tokens sim(ti, tj) is calculated as a sum of the lengths ofcommon for the tokens substrings, divided by the average length of the two tokens.
The final similarity score between an element from the mediated schemaand an element from the local schema is obtained by the formula:
where is the bag of tokens corresponding to is the bag of tokens corre-sponding to and is the bag of tokens corresponding to the elementfrom the mediated schema.
6.2 Geo Matcher
The Geo Matcher is the new learner we developed a new learner. It uses geometriccriterions that can give us a notion of the basic form and size of the object.

Schema Matching in GIS 507
Design. For each instance of a geometric feature, the Geo Matcher receivespreviously calculated parameters like area, length, perimeter, etc. Then, in using anappropriate classification algorithm, it predicts the correspondences between the localinstance and the mediated one.
The criterions used by the learners are:Geometry type: Gives the geometric type of the object i.e. Point; Line, Polygon,
Multipoint, MultiLineString, MultiPolygon.Area: Gives the total area of the object.Diameter: It is the longest distance between two points of the object.Length: The sum of the lengths of all object componentsPerimeter: It is the sum of the perimeters of all object components.Lengthening: It is the ratio of the diameter and the perimeter of the object.Compacity: It measures the similarity of the object shape with a circle. It is pro-
portional to the ratio of the perimeter and the object area.Complexity_L: It is ratio of the number of vertexes and the length, for linear ob-
jects and the ratio of the number of vertexes and the surface; for the object from a sur-face type.
Complexity_P: It is the ratio of the number of vertexes and the perimeter of theobject.
Implementation, Tests and Results. We developed a Geo Matcher prototype inusing IBM’s ABLE (Agent Building and Learning Environment) [15], a Javaframework for building intelligent agents using machine learning and reasoning. Inusing ABLE, we have tested different classification algorithms (Neural Networks,Naïve Bayes, k-Nearest Neighbor) with various parameterizations in order to selectthe most appropriate algorithm for Geo Matcher. The algorithm that showed the bestresults was surprisingly the simplest i.e., the k-Nearest Neighbor (k-NN) algorithm, alazy classification algorithm. Before using the k-NN algorithm we filtered the initialdata and performed some conversion for discrete attributes.
The performance of the Geo Matcher based on the k-NN algorithm can be ex-plained by the fact that it does not consider similarities among instances of one fea-ture and the same geographic feature. More intelligent algorithms like Neural Net-works and Naïve Bayes try to generalize the characteristics of the whole set ofinstances. But objects from the same geographic type can differ in their size and form.For example, we may have small lakes with a size equal to some building size; butthere exist also big lakes with geometric properties rather different from those of thesmall lakes. When used with a big base of training examples with a variety of in-stances, k-NN should be able to find as a nearest neighbor an instance of the samegeographic type, i.e., it will map a small lake with a small lake.
We tested the Geo Matcher in using BDTQ data, and a mediated schema with 7geographic features: Street, Road, Building, WaterCourse_L (represents linear water-courses), WaterCourse_S (represents watercourses from type surface), Lake and Is-land. In order to obtain the training and testing data we divide the source BDTQ intotwo parts, using the first one for the training process and the second for the matchingphase. Splitting BDTQ does not impact the correctness of the results because the dataused by the Geo Matcher, i.e. sizes and shapes of geographic objects, is relatively in-dependent of the sources.

508 S. Manoah, O. Boucelma, and Y. Lassoued
The results of the tests show that the accuracy of the Geo Matcher is about 80 %. Ifwe generalize the results for the instances by transforming them into mappings be-tween features, we will find out that it maps 100% correctly the features of the medi-ated and the source schema. Most of incorrect mappings came from the fact that GeoMatcher was unable to make a difference between a street, a road and a watercourse.That can be easily explained because of similarities (size and in the geometric form)between the geographic types. When the geometric form is not sufficient, we can useas determining criterion the density of distribution of the object. It is clear that in anurban zone, there are more streets than roads and rivers, more buildings than lakes,etc. The density parameter can be represented by the ration n/S, where n is the numberof instances of a feature t, that are located in a delimited zone with a fixed size and Sis the area of this zone.
Fig. 1. Geo Matcher Performances.
Table 3 illustrates the results obtained with our Geo Matcher. The first column de-notes a feature of the source, the second column represents the number of correctmappings for this feature, and the third column shows the percentage of errors to-gether with the alternate features that has been selected for matching instead of theappropriate one.

Schema Matching in GIS 509
7 Conclusion
In this paper we described a machine learning approach for GIS schema matching, animportant and crucial issue for GIS data integration. Our approach extends existingschema matching approaches but departs from them due to the particularities of thegeographic data. Our approach reduces complex mappings in transforming them intomappings of type one-to-one and many-to-one. It also proposes a novel learner calledGeo Matcher that exploits the geometry of objects. The Geo Matching system de-scribed in this paper should be included in the GIS data integration platform we arecurrently developing.
References
1.2.
3.
4.
5.
6.
7.
8.
9.
OpenGIS consortium. URL : http ://www.opengis.org.Ron Lake Simon Cox, Adrian Cuthbert and Richard Martell. Geography Markup Lan-guage (GML) 2.0. URL : http ://www.opengis.net/gml/01-029/GML2.html, February 20th2001Base de données topographiques du Québec (bdtq), July 2001http//felix.geog.mcgill.ca/heeslib/bdtq_20000.htmlPedro Domingos Anhai Doan and Alon Levy. Learning Source Descriptions for Data In-tegration. In Proceedings of WebDB’2000Pedro Domingos Anhai Doan and Alon Halevy. Reconciling schemas of disparate datasources: A machine-learning approach. In Proc. of ACM SIGMOD, 2001Palopoli L, Sacca D, Terracina G, Ursino D. A unified graph-based framework for deriv-ing nominal interscheme properties, type conflicts and object cluster similarities, IEEEComput,pp. 34–45, 1999Castano S, De AntonellisV, De Capitani diVemercati S. Global viewing of heterogeneousdata sources. IEEE Transactions on Knowledge and Data Engineering 13(2):277–297,2001Mitra P, Wiederhold G, Jannink J (1999) Semi-automatic integration of knowledgesources. In: Procof Fusion ’99, Sunnyvale, USAMadhavan J, Bernstein PA, Rahm E. Generic schema matching with Cupid. In: Proc 27thInt. Conf on Very Large Data Bases, 2001, pp. 49–58
10.
11.
12.
13.
14.15.
E. Rahm and P. A. Bernstein. A survey of approaches to automatic schema matching.VLDB Journal 10(4), 2001Nomenclature d’échange du CNIG associée à la norme Edigéo.http ://www.cnig.fr/cnig/infogeo/france/-Normalisation/nomenclature.cnig. 1 .fr.html, 1995Ministère de l’Economie de Finances et de l’Industrie. Standard d’échange des objets duplan cadastral informatisé, Décembre 2001Corpus-based Schema Matching, Jayant Madhavan, Philip A. Bernstein, Kuang Chen,Alon Halevy, and Pradeep Shenoy, Workshop on Information Integration on the Web,IJCAI’2003, Acapulco, MexicoWordNet - http://www.cogsci.princeton.edu/~wn/ABLE research project. http://www.alphaworks.ibm.com/tech/able

The Web as an Autobiographical Agent
Maya Dimitrova1, Emilia Barakova2, Tino Lourens3, and Petia Radeva4
1Institute of Control and System Research, Bulgarian Academy of SciencesP.O.Box 79, 1113 Sofia, [email protected]
2Lab. for Dynamics of Emergent Intelligence, RIKEN Brain Science Institute (BSI)2-1, Hirosawa, Wako-shi, Saitama, 351-0198 Japan
[email protected] Research Institute Japan, Co., Ltd.
8-1, Honcho, Wako-shi, Saitama, 351-0114 [email protected]
4Computer Vision Center, Autonomous University Barcelona,08193 Bellaterra, [email protected]
Abstract. The reward-based autobiographical memory approach has beenapplied to the Web search agent. The approach is based on the analogy betweenthe Web and the environmental exploration by a robot and has branched offfrom a currently developed method for autonomous agent learning of novelenvironments and consolidating the learned information for efficient furtheruse. The paper describes a model of an agent with “autobiographicalmemories”, inspired by studies on neurobiology of human memory, theexperiments of search path categorisation by the model and its application toWeb agent design.
1 Introduction
Autonomous agents have traditionally been built on the grounds of detailed models,focused tasks, or common-sense heuristics, i.e. the top-down approach. Autonomousagents approach is common in Web modelling, soft computing and intelligentrobotics among other application fields [1]. In this paper we make a parallel betweena robotic and a Web autonomous agent. Intelligent robotics agents have to fulfilvarious tasks independently and to decide when and what kind of initiative toundertake. Web agents are similar to robots in that they have sensory-perceptual/logical input, the goal to achieve, and they perform within the limits of theimplemented algorithms. Recent research, however, has shown that it is technicallyjustified to build intelligent robots on the grounds of neurobiology [2], [3]. It turns outthat the neurologically plausible autonomous robots/agents achieve higherbehavioural flexibility and goal attainment and are superior to the ones that count oncomplex, but exact computational heuristics [4], [5], [6]. A higher level of“intelligence” is demonstrated when the robot can efficiently make use of thepreviously encountered events [6], [7]. This involves not just memory in the
C. Bussler and D. Fensel (Eds.): AIMSA 2004, LNAI 3192, pp. 510–519, 2004.© Springer-Verlag Berlin Heidelberg 2004

The Web as an Autobiographical Agent 511
computational sense, i.e. memory as a stack or storage, but human-like memory, thataccounts for concept change, source monitoring, novelty/familiarity detection andgoal reformulation [8]. In this paper we hypothesise, that if a Web agent incorporatesautobiographical knowledge in terms of “human-like memories” sense, it will be ableto interact with the user in a more meaningful way.
Traditionally, cognitive science has produced general models of human cognition,learning and behaviour that, however, lack the diversity of individual user dailyexperience. The semantics of the interaction of the user with the Web has to be able toconvey not just facts, statements, definitions, i.e. the so-called “cold” knowledge, butalso “hot” opinions, reviews, intentions, and nuances in user communication withinthe Web [9]. Moreover, this has to account for user previous Web experience. Intrying to build these micro-components of an intelligent Web agent we have turned tocognitive science looking for insights or “smart heuristics” to make them both simpleand efficient and perhaps brain-like in their “attitude” to the user [10]. What we havefound is abundance of approaches that need to be investigated further. We feel thatthe Web provides the perfect medium to understand those micro-aspects of cognitionand to build Web agents, which are small in size and very adapted, placed on a singleserver and accessible from any place in the world.
The paper addresses three interrelated research issues we are currently pursuing.The first one is a model of a robot based on episodic/autobiographical memories,inspired by studies on neurobiology of human memory. The second is theinterpretation of the autobiographical robot as an intelligent agent similar to Webagents, and the third is an example of a “short-term memory-like” Web agent with itsattractive interface features and difficulties in “understanding” the user. We feel theissue of building autonomous/autobiographical agents to account for user experiencewith the Web is essential to the process of building the new Semantic Web.
2 Agents with and Without Human-Like Memory
At present, intelligent robots are able to perform tasks with different degree ofautonomy. Experimental robotics has shown that autonomous systems can be built bysimulating, for example, insect-like behaviours. We aim at higher level of intelligentbehaviour, which has as a bottom line flexibility - to use its old experiences in novelsituations. At present, even higher forms of intelligence, derived from imitationlearning, is an object of robotics applications [2], [3], [4]. Since the actual processesunderlying this type of behaviour are understood on a very coarse level only, it doesnot meet our present research objectives.
Computer science and robotics exploit the characteristics of the semantic memory -memory for facts. Actually, memory for events and their relatedness is the way higherorganisms build their knowledge; moreover, episodic memory copes naturally withthe sensory, perceptual and behavioural character of learning of an embodied agent.In our study novelty is considered a gating factor for forming episodic memoriesduring learning and familiarity - a mechanism for inferential use of episodicmemories while behaving in a novel Web environment. The so stated scope putsforward memory-based behaviour, which includes remembering of past events,familiarity detection involved in episodic memory formation and the respective more

512 M. Dimitrova et al.
effective Web behaviour, corresponding to the interests/needs of the user. The basicdifficulty, as we will show, is how to reasonably infer future user interests frombrowsing behaviour. The autobiographical approach is able to predict more consistentfuture requests than the “straightforward” one.
3 Hypothesis: Episodic and Autobiographical Memory UnderlieIntelligent Action
There have been many speculations of what intelligence and intelligent behaviour is.Yet, an exact definition is not available. Instead of elaborating on the subject, we willdefine the range of intelligent behaviour that is plausible for our study. We aim at alevel of intelligence that allows transfer of the previously acquired knowledge into anew task. Therefore, memory is the intrinsic requirement for our intelligent system.
Extensive research in neuroscience [11], [12], [13] has shown that there is aspecific brain structure - the hippocampus - that encodes episodic memories (EM).The episodic memories lay the context of the studied task - sensually/perceptually/emotionally coloured, yet underlying the acquisition of new and restructuring old,declarative knowledge (knowledge for facts and events, not for learning skills). Itscharacteristic feature is the “when” question - the explicit reference to the exactmoment when a given event took place, like learning new knowledge or meeting anold friend, for example. EM has got temporary structure in terms of one-to-severalhours. Hence the main difference from the so-called autobiographical memory (AM)where the “when” aspect is often difficult to retrieve.
Fig. 1. Schematic representation of the interactions between HF and NAA, to support the EM-AM connection
Although AM in general consists of episodes and spans lifetime, the “when” notionis frequently lost and compensated with the “what” notion. And this constant re-

The Web as an Autobiographical Agent 513
categorisation and “renewal” of old memories relates and interrelates to the semanticmemory acquisition process, generally taking place in the interaction between thehippocampal and the cortical processes/areas (Fig. 1). Web search has similaritieswith exploring a new environment and finding one’s way in it, this way theenvironment is constructed of keywords and concepts as analogy to views anditineraries [14].
To connect Web modelling with the episodic memory paradigm and brain-likecomputing in general, the following hypothesis is made. Web search resembles theexploration and successful information finding processes, as experienced by anavigation activity. During the interaction of a user through a Web engine with theinformation on the net, the Web agent remembers the successful searches and themost satisfying findings of the user and serves as an optimisation tool for doing newsearch.
4 Autobiographical Web Agent Concept
The aim of the autobiographical Web agent is to learn the meaningful steps anddirections by Web explorations and use them as an optimisation criterion by the nextsearches. In analogy with a robot exploration task, finding meaningful information isequivalent, for the particular user, to either (sub-) goal or landmark encounter. As aninitial step, the encountered useful concepts (keywords) are clustered by an on-lineclustering algorithm, in which the characteristic concepts are stored asrepresentatives.
The clustering algorithm uses the following principle. Clusters that often come in asubsequent order get laterally connected, forming episodes. These connections getactive by the arrangement of the search results. Let us assume that an episode isformed by three elements: sensing, perception, and evaluation. In formula (1) episodeW is a triple,
where s, p, a are the sensory, perceptual and evaluational component, respectively. Anepisode evolves over time under these three influences:
where f denotes functional dependence.A search task consists of finding a discrete item of information. Such an item will
be further referred to as an event. A Web search episode is a set of n discrete eventsoccurring in temporal order defined by a considerable difference inthe event representations. A single event is defined by theuser input s, and p and a, that denote the feedback of the remembered searches(previous searches from the same user) and the evaluational influence. The sensorycomponent refers to the user’s current choice and and components are based onprevious experience. Here, introduces the influence from the external user andconstitutes of feed-forward connections; the perceptual component represents the

514 M. Dimitrova et al.
internal influences and is performed by lateral connections; the reward componentrepresents the influence of the previous actions as brought on the current event. Thechange from one to another event requires a change in at least one component that isbigger than an internal threshold, indicating the detection of a novel event.
The sensory as well as the reward (evaluational) signals are encoded in uniquepatterns of activity. These patterns are external-world related. The formation of theinternal representations is conceptually motivated by the Piagetian self-supervisedparadigm for learning target-oriented behaviour [15]. The essential feature forenabling brain maps to handle this rule is the capacity for topologic organisation,which allows an internal representation of the external space emerge in a coordinate-free way [16]. A good deal of work has been carried out on the ways in which simple,self-organising heuristics can produce such internal representations, from the earlywork of Kohonen [17] to the recently developed growing self-organising algorithms[18].
Instead of relying on artificial heuristics that perform topological organisation, wehave chosen Hebbian learning for episodic encoding. The Hebbian rule most closelysimulates the known brain computational mechanisms. The required self-organisationproperties can be obtained by lateral inhibition and dominating topologicalprojections between the layers, rather than by artificial computational heuristics. Thenetwork is structured as a two-layer lattice of neurons, corresponding to the majorhippocampal areas. The lateral inhibition connections enhance the self-organisingprocess.
The actor-critic model [19] most closely resembles the motivational, i.e. reward-related influence. At any discrete moment t, the user-specified keywords resultnormally in a big variety of options. A particular choice of an option is equivalent toan action on the Web environment. This corresponds to the choices of an actor. If theneeded information is not available, the exploration of the chosen link is short, andthe user does not branch off for other related links. This information is used as afeedback influence - the critic “criticises” the taken step. The actor-critic mechanismregards the actions of the user that are directed to finding particular targetedinformation.
The critic also adapts itself in correspondence with the actor. The reinforcementalgorithm leads to improved behaviour with time, caused by the learning from thecritic. The critic c at a given position l in the search space is as follows:
where is the weight between the current output from the episodic layer and the i-th location in the search space l. The critic learns the value function by updating theweights so that the prediction error that drives learning is reduced:
where is a constant discounting factor, set so that the weight between the outputof the episode layer and the i-th location is minimum. R is the reward at moment t+1.The error is reduced by so changing the weights to the active locations on the searchspace to be proportional to:

The Web as an Autobiographical Agent 515
In the experiments shown below, the actor makes use of k action cellsAt position r, the activity of the each action cell is:
where stays for the j-th action cell, and v is the adaptive weight between the actioncell and the i-th output of the previous layer. The first step for the movement directionis taken randomly with a probability The next movement direction is typicallychosen in random way. If there is a lateral connection to a related important to theuser concept, the possibilities are restricted according to the choices made in theprevious movements so that there is not a random walk, but smootherorbits with eventual sudden turns (Fig. 2).
Fig. 2. Learned Web search paths by the actor-critic model for a single goal case; a)performance in the range 1-5 trials; b) performance in the range 75-80 trials; c) performance inthe range 190-200 trials

516 M. Dimitrova et al.
The actor weights are adapted according to:
where g reflects the previous-history restrictions on the search path. Fig. 2 depicts theoptimisation of a search trajectory, which is only due to the learning of the critic.Finding a more meaningful search path is done by the learned episodes. Theoptimisation of the search path is guided by the learning of the critic (Fig. 3).
Fig. 3. Convergence rate averaged among 10 sets of 200 experiments
5 Designing Neuro-cognitive Web Interfaces
Among the many ambitious goals of the Web is to build agents/servlets/ applications/interfaces that are self-explanatory, user-friendly, perceptually salient andconceptually understandable to every individual person [20], [21]. This givesconfidence in applying the autobiographical agent approach to Web agent design, asat least in robotics, it has given promising and efficient results. In relation to this, anexample from Web design is discussed, which is a focused example of the need for“vertical” re-categorisation of the “depth” of the individual user previous-history Webexperience. Personalised Web systems [22] often employ “collaborative filtering” oruser-similarity based (“horizontal”) modelling principles, from the early works [23],

The Web as an Autobiographical Agent 517
[24] to the numerous recent studies1. The cognitive/psychological motivation behindtheir definition of user interests, however, is vague. The discussed application hasattempted to model short-term user interests. The results clearly show that beforeclustering user preferences based on most recent Web behaviour, the true “persona”has to be defined. The application in focus is called WebPersonae and is aimed toassist the user in browsing the Web [25], [26]2. The authors have designed a searchresult reorderer along with the WebPersonae system. The basic goal of the reordereris to introduce context-sensitivity to search engine results by estimating the user’scurrent Persona and re-ranking the results to a query based on this Persona. As theuser moves from page to page, the Personae recognition module identifies the currentPersona. When the user runs a search to the Web, the system uses the most similarPersona3. to re-rank the received results - the most similar pages are ranked near thetop of the list [26]. As the user browses from page to page, the system recalculatesPersonae similarities. In a sense, this system represents a “hippocampal” (pure“episodic”) memory for the previous events/searches.
The evaluation of the search result reorder system has shown the encountereddifficulties in user modelling by the autobiographical agent. The straightforwardexperiment reordered every set of results according to the similarity of each result tothe current Persona. The current Persona was itself selected based on the user’s recentbrowsing history. The second set of experiments was aimed at overcoming the‘naivete’ of the initial approach. An ‘omniscient’ version of the system was designedfor use with the test data only. This version implements an oracle or look-aheadmodule that can ‘see into the future’, i.e. it can look ahead and see which URL a userclicked on, and then select the Persona that would have given the best possible up-ranking to that result. This omniscient system is capable of producing a favourable re-ranking for approximately 95% of the search instances in the data-set. This shows thatit is possible to give favourable re-rankings most of the time, providing the correctPersona is selected [26]. Being in process of development and evaluation, theWebPersonae system allows to make some conclusions about the nature of the “user-and-the-Web” interaction process as something more sophisticated than simplycollections of sequences of events. What is required is a brain-like module, imitatingthe hippocampal-cortical relations in new knowledge acquisition, i.e. re-categorisationis needed to select the correct Persona. We propose to use our model for finer re-categorisation of user interests and “conceptual reasoning” via, for example, mappingperceptual to semantic cues [27].
The experiments with the interface have shown that the Personae appear intuitiveand are adequate for representing different domains of interest. The weak link in thesystem, according to the authors, is the identification of “when” and “who” to help.The foreseen future improvements are to introduce a thesaurus component foridentifying synonyms, and thus cluster based on concepts rather than just words, toemploy hierarchical clustering by retaining the hierarchy of interests to representbroad and narrow topics and assist the user when different levels of detail are
1
2
3
For example, Google returns 294 000 hits for “collaborative filtering”, 30.06.2004We would like to thank Dr. Nicholas Kushmerick and JP McGowan from University CollegeDublin for sharing the ideas and the realisation of the WebPersonae interfaceTF-cosine similarity

518 M. Dimitrova et al.
required. The authors emphasize the necessity to create temporary Personae when theuser’s browsing session does not imply any of their long-term Personae. Thetemporary Personae can be updated incrementally as the user browses, and used togive short-term context sensitivity. When the user enters another Persona, thesetemporary ones can be deleted, or if their use continues, they can be made permanent,i.e. long-term [26]. The main aspect of the authors’ analysis of the implementedsystem is the shift from “pure” computer science towards cognitive (neuro-) scienceapproach to personalised Web agent design.
6 Conclusions
Psychological studies show that humans integrate and interpret new experiences onthe basis of previous ones [8], [28], [29]. Autobiographical agents attempt similarbehaviour on the basis of detailed knowledge of the neuro-cognitive processingmechanisms of new and old episodes in the brain. The paper argues that thesemechanisms are needed in artificial/autonomous/intelligent agents to perform betterand proposes to set this as an aim in building Web agents. It discusses aneurologically plausible model of episodic/event memory and its application inimitation of user Web behaviour. The autobiographical Web agents are needed tosimplify the computational and time-consuming costs and to make the Web friendlierand more meaningful to the individual user.
Acknowledgement. This work is supported in part by TIC2000-1635-C04-04,TIC2000-0399-C02-01 of CICYT, Ministerio de Ciencia y Tecnologia of Spain, aReseach Grant to Maya Dimitrova by CVC-UAB, 2004, and Contract No 809/98 ofthe National Research Fund, Bulgarian Ministry of Education and Science.
References
1.
2.
3.
4.
5.
6.
7.
Petrie, C.J.: Agent-based engineering, the Web, and intelligence. IEEE Expert, Vol. 11:6,(1996), 24-29Sloman, A., Chrisley, R.: More things than are dreamt of in your biology: Informationprocessing in biologically-inspired robots. Proc. WGW’02 Workshop on Biologically-Inspired Robotics: The Legacy of W. Grey Walter, Hewlett Packard Research Labs,Bristol, August (2002), http://www.cs.bham.ac.uk/~axs/, http://www.cs.bham.ac.uk/~rlc/Sloman, A.: AI’s greatest trends and controversies. Edited by Haym Hirsh and Marti A.Hearst, IEEE Intelligent Systems and their Applications, Jan/Feb (2000) 8--17,http://www.computer.org/intelligent/ex2000/pdf/x1008.pdfTriesch, J., Wieghardt, J., von der Malsburg, C., Mae, E.: Towards imitation learning ofgrasping movements by an autonomous robot. Lect. Notes Artif. Intell, 1739, (1999), 73-84Lourens, T., Wurtz, R.P.: Extraction and matching of symbolic contour graphs,International Journal of Pattern Recognition and Artificial Intelligence, (2003)Barakova, E., Lourens, T.: Novelty gated episodic memory formation for robotexploration. Proc. 2004 IEEE International Conference on Intelligent Systems IS’2004,Varna, Bulgaria, Vol I, (2004), 116-121Verschure, P.F.M.J., Voegtlin, T., Douglas, R.J.: Environmentally mediated synergybetween perception and behaviour in mobile robots, Nature, Vol. 425, 9, (2003), 620-624

The Web as an Autobiographical Agent 519
8.
9.
Conway, M.A.: Sensory-perceptual episodic memory and its context: autobiographicalmemory. Phil. Trans. R. Soc. Lond. B 356, (2001), 1375-1384Benga, O., Miclea, M.: New trends in development and cognition. In: O. Benga, M.Miclea (eds.), Development and Cognition. Cluj University Press, Cluj-Napoca, ISBN 9738095 82 4, (2001), 11-20Dimitrova, M.: Cognitive modelling and Web search: Some heuristics and insights,Cognition, Brain, Behaviour, vol VII, 3, (2003), 251-258Wood, E., Dudchenko P., and Eichenbaum, H.: The global record of memory inhippocampal neural activity. Nature, 397, (1999), 613-616Jensen, O., Lisman, J.E.: Hippocampal CA3 region predicts memory sequences:accounting for the phase precession of place cells. Learning and Memory, 3, (1999), 279-287Eichenbaum, H., Dudchenko, P., Wood, E., Shapiro, M., and Tanila, H.: Thehippocampus, memory, and place cells: Is it spatial memory or a memory space? Neuron.Cell Press, (1999), Vol. 23, 209-226Barakova E. and Lourens T.: Prediction of rapidly changing environmental dynamics forreal time behavior adaptation using visual information. Workshop on Dynamic Perception,Bochum, Germany, Nov. (2002)Piaget, J.: The Psychology of Intelligence, Routledge, Taylor & Francis, New York,(1950)
10.
11.
12.
13.
14.
15.
16.
17.
18.
19.
20.
21.
22.
23.
24.
25.
26.
27.
28.29.
Sanger, T. D.: Theoretical considerations for the analysis of population coding in motorcortex. Neural Computation, 6, (1994), 29-37Kohonen, T.: Self-organizing formation of topologically correct feature maps. BiologicalCybernetics, 43, (1982), 59-69Friske B.: Growing cell structures- a self-organizing network for unsupervised andsupervised learning. Neural Networks, 7, (1995) 1441-1460Sutton, R.S. and Barto, A.G.: Reinforcement Learning: An Introduction MIT Press,Cambridge, MA, (1998)Lee, Tim Bernards, Fitting it all together, Invited talk at the WWW 2003 Conference,Budapest, Hungary, (2003)Kushmerick, N., Gleaning answers from the web, Proc. AAAI Spring Symposium onMining Answers from Texts and Knowledge Bases, Palo Alto, (2002), 43-45Bonett, M.: Personalization of Web services: Opportunities and challenges, Ariadne, 28,2001. [http://www.ariadne.ac.uk/issue28/personalization/]Resnick, P., Iacovou, N., Suchak, M., Bergstrom, Riedl J.: GroupLens: An openarchitecture for collaborative filtering of netnews. Proceedings of ACM 1994 Conferenceon Computer Supported Cooperative Work, Chapel Hill, NC: ACM, (1994), 175-186.Shardanand, U., Maes, P.: Social information filtering: Algorithms for automating “wordof mouth”. Proceedings of CHI’95 -- Human Factors in Computing Systems, (1995), 210-217McGowan, J. P., Kushmerick, N., Smyth, B.: Who do you want to be today? WebPersonae for personalised information access. AH 2002, (2002), 514-517McGowan, J.P.: A Multiple Model Approach to Personalised Information Access. MScthesis, University College Dublin, (2002)Binefa, J., Sánchez, M., Vitrià, J., Radeva, P.: Linking visual cues and semantic termsunder specific digital video domains, Journal of Visual Languages and Computing, Vol.11, 3, (2000), 253-271Tulving, E., Donaldson, W.: Organization of memory. New York: Academic Press, (1972)Baddeley, A.D.: Human Memory: Theory and practice. Lawrence Erlbaum Associates,Hove, UK, (1990)

This page intentionally left blank

Author Index
Agostini, Alessandro 85Angelova, Galia 267Arenas, Alvaro E. 54Arezki, Rachid 490Aswani, Niraj 65
Balbiani, Philippe 148Bao, Yukun 295Barakova, Emilia I. 188, 510Barber, Federico 126Barbon, F. 106Barrera-Cortés, Josefina 312Baruch, Ieroham 312Baziz, Mustapha 33Bel Enguix, Gemma 236Ben Jaâfar, Inès 459Bertoli, P. 106Boucelma, Omar 500Bouquet, P. 75Burek, Patryk 1
Castro, Carlos 447Challita, Khalil 148Chen, Yuehui 285Cho, Beom-joon 430, 438Cuadrado, Javier Esplugas 96Cunningham, Hamish 65
Davis, Joseph 44Dimitrova, Maya 510Dobrev, Pavlin 267Dong, Jiwen 285Doychinova, Veselka 246Dray, Gérard 490
Egidi, Lavinia 137Eom, Jae-Hong 216
Farah, Lotfi 420Farah, Nadir 331, 420Fournier, Dominique 409
Genina-Soto, Próspero 312Ghédira, Khaled 459
480Gunturkun, Rustu 304
Hajnal, Ákos 371Hernandez, Nathalie 11
Jalili-Kharaajoo, Mahdi 469Jimenez Lopez, M. Dolores 236
Karagiannis, Dimitris 341Khayati, Naoufel 459Khemani, Deepak 158Khoussainov, Rinat 399Kim, In-Cheol 381Kim, Minho 178Kotis, Konstantinos 22Kotsiantis, S.B. 168,198Koumpis, Konstantinos 226
Lassoued, Yassine 500Lin, Ming 389Lischka, Johannes 341Lourens, Tino 510Lu, Yansheng 295
Manoah, Snezhana 500Matthews, Brian M. 54Maynard, Diana 65Mermet, Bruno 409Mihov, Stoyan 246Monfroy, Eric 447Moro, Gianluca 85Mothe, Josiane 11
Nenkova, Boyka 312Nikolov, Nikolai G. 116Núñez, Manuel 361
Park, Sungho 430Pearson, David William 490Pintelas, Panayiotis E. 168, 198, 351Pistore, M. 106Poncelet, Pascal 490Preist, Chris 96
Radeva, Petia 510Ramakrishna, R.S. 178Rashidi, Farzan 321

522 Author Index
Rashidi, Mehran 321Rodríguez, Ismael 361Rubio, Fernando 361
Salido, Miguel A. 126Sari, Toufik 331Sellami, Mokhtar 331, 420Seo, Wontaek 430, 438Serafini, L. 75Shaparau, D. 106Shen, Hong-bin 208Shyam Sundar Yadav, R. 158Souici, Labiba 331, 420Souza, Kleber Xavier Sampaio de 44Stergiou, Kostas 22Stoykova, Velislava 256Strupchanska, Albena 267Sun, Zengqi 389
Temurtas, Fevzullah 277, 304Terenziani, Paolo 137
Traverso, P. 106Triantis, Tasos 351
Varga, László Zsolt 371Vouros, George A. 22
Wang, Shi-tong 208Werner, Zsolt 371Williams, Stuart 96
Yang, Bo 285Yang, Jie 208Yankova, Milena 65Yoo, Hyunjin 178Yumusak, Nejat 304
Zanobini, S. 75Zhang, Byoung-Tak 216Zhang, Jinlong 295Zhu, Jihong 389

This page intentionally left blank

This page intentionally left blank

This page intentionally left blank

This page intentionally left blank

This page intentionally left blank

This page intentionally left blank

Lecture Notes in Artificial Intelligence (LNAI)
Vol. 3194: R. Camacho, R. King, A. Srinivasan (Eds.),Inductive Logic Programming. XI, 361 pages. 2004.
Vol. 3192: C. Bussler, D. Fensel (Eds.), Artificial Intel-ligence: Methodology, Systems, and Applications. XIII,522 pages. 2004.
Vol. 3157: C. Zhang, H. W. Guesgen, W.K. Yeap (Eds.),PRICAI 2004: Trends in Artificial Intelligence. XX, 1023pages. 2004.
Vol. 3155: P. Funk, P.A. González Calero (Eds.), Advancesin Case-Based Reasoning. XIII, 822 pages. 2004.
Vol. 3139: F. Iida, R. Pfeifer, L. Steels, Y. Kuniyoshi (Eds.),Embodied Artificial Intelligence. IX, 331 pages. 2004.
Vol. 3131: V. Torra, Y. Narukawa (Eds.), Modeling Deci-sions for Artificial Intelligence. XI, 327 pages. 2004.
Vol. 3127: K.E. Wolff, H.D. Pfeiffer, H.S. Delugach (Eds.),Conceptual Structures at Work. XI, 403 pages. 2004.
Vol. 3123: A. Belz, R. Evans, P. Piwek (Eds.), NaturalLanguage Generation. X, 219 pages. 2004.
Vol. 3120: J. Shawe-Taylor, Y. Singer (Eds.), LearningTheory. X, 648 pages. 2004.
Vol. 3097: D. Basin, M. Rusinowitch (Eds.), AutomatedReasoning. XII, 493 pages. 2004.
Vol. 3071: A. Omicini, P. Petta, J. Pitt (Eds.), EngineeringSocieties in the Agents World. XIII, 409 pages. 2004.
Vol. 3070: L. Rutkowski, J. Siekmann, R. Tadeusiewicz,L.A. Zadeh (Eds.), Artificial Intelligence and Soft Com-puting - ICAISC 2004. XXV, 1208 pages. 2004.
Vol. 3068: E. André, L. Dybkjær, W. Minker, P. Heis-terkamp (Eds.), Affective Dialogue Systems. XII, 324pages. 2004.
Vol. 3067: M. Dastani, J. Dix, A. El Fallah-Seghrouchni(Eds.), Programming Multi-Agent Systems. X, 221 pages.2004.
Vol. 3066: S. Tsumoto, J. Komorowski, J.W.(Eds.), Rough Sets and Current Trends
in Computing. XX, 853 pages. 2004.
Vol. 3065: A. Lomuscio, D. Nute (Eds.), Deontic Logic inComputer Science. X, 275 pages. 2004.
Vol. 3060: A.Y. Tawfik, S.D. Goodwin (Eds.), Advancesin Artificial Intelligence. XIII, 582 pages. 2004.
Vol. 3056: H. Dai, R. Srikant, C. Zhang (Eds.),Advances inKnowledge Discovery and Data Mining. XIX, 713 pages.2004.
Vol. 3055: H. Christiansen, M.-S. Hacid, T. Andreasen,H.L. Larsen (Eds.), Flexible Query Answering Systems.X, 500 pages. 2004.
Vol. 3040: R. Conejo, M. Urretavizcaya, J.-L. Pérez-de-la-Cruz (Eds.), Current Topics in Artificial Intelligence.XIV, 689 pages. 2004.
Vol. 3035: M.A. Wimmer (Ed.), Knowledge Managementin Electronic Government. XII, 326 pages. 2004.
Vol. 3034: J. Favela, E. Menasalvas, E. Chávez (Eds.),Advances in Web Intelligence. XIII, 227 pages. 2004.
Vol. 3030: P. Giorgini, B. Henderson-Sellers, M. Winikoff(Eds.), Agent-Oriented Information Systems. XIV, 207pages. 2004.
Vol. 3029: B. Orchard, C. Yang, M. Ali (Eds.), Innovationsin Applied Artificial Intelligence. XXI, 1272 pages. 2004.
Vol. 3025: G.A. Vouros, T. Panayiotopoulos (Eds.), Meth-ods and Applications of Artificial Intelligence. XV, 546pages. 2004.
Vol. 3020: D. Polani, B. Browning, A. Bonarini, K.Yoshida (Eds.), RoboCup 2003: Robot Soccer World CupVII. XVI, 767 pages. 2004.
Vol. 3012: K. Kurumatani, S.-H. Chen, A. Ohuchi (Eds.),Multi-Agnets for Mass User Support. X, 217 pages. 2004.
Vol. 3010: K.R. Apt, F. Fages, F. Rossi, P. Szeredi, J.Váncza (Eds.), Recent Advances in Constraints. VIII, 285pages. 2004.
Vol. 2990: J. Leite, A. Omicini, L. Sterling, P. Torroni(Eds.), Declarative Agent Languages and Technologies.XII, 281 pages. 2004.
Vol. 2980: A. Blackwell, K. Marriott, A. Shimojima (Eds.),Diagrammatic Representation and Inference. XV, 448pages. 2004.
Vol. 2977: G. Di Marzo Serugendo, A. Karageorgos, O.F.Rana, F. Zambonelli (Eds.), Engineering Self-OrganisingSystems. X, 299 pages. 2004.
Vol. 2972: R. Monroy, G. Arroyo-Figue roa, L.E. Sucar, H.Sossa (Eds.), MICAI 2004: Advances in Artificial Intelli-gence. XVII, 923 pages. 2004.
Vol. 2969: M. Nickles, M. Rovatsos, G. Weiss (Eds.),Agents and Computational Autonomy. X, 275 pages.2004.
Vol. 2961: P. Eklund (Ed.), Concept Lattices. IX, 411pages. 2004.
Vol. 2953: K. Konrad, Model Generation for Natural Lan-guage Interpretation and Analysis. XIII, 166 pages. 2004.
Vol. 2934: G. Lindemann, D. Moldt, M. Paolucci (Eds.),Regulated Agent-Based Social Systems. X, 301 pages.2004.
Vol. 2930: F. Winkler (Ed.), Automated Deduction in Ge-ometry. VII, 231 pages. 2004.
Vol. 2926: L. van Elst, V. Dignum, A. Abecker (Eds.),Agent-Mediated Knowledge Management. XI, 428 pages.2004.
Vol. 2923: V. Lifschitz, I. Niemelä (Eds.), Logic Program-ming and Nonmonotonic Reasoning. IX, 365 pages. 2004.

Vol. 2915: A. Camurri, G. Volpe (Eds.), Gesture-BasedCommunication in Human-Computer Interaction. XIII,558 pages. 2004.
Vol. 2913: T.M. Pinkston, V.K. Prasanna (Eds.), High Per-formance Computing - HiPC 2003. XX, 512 pages. 2003.
Vol. 2903: T.D. Gedeon, L.C.C. Fung (Eds.), AI 2003: Ad-vances in Artificial Intelligence. XVI, 1075 pages. 2003.
Vol. 2902: F.M. Pires, S.P. Abreu (Eds.), Progress in Arti-ficial Intelligence. XV, 504 pages. 2003.
Vol. 2892: F. Dau, The Logic System of Concept Graphswith Negation. XI, 213 pages. 2003.
Vol. 2891: J. Lee, M. Barley (Eds.), Intelligent Agents andMulti-Agent Systems. X, 215 pages. 2003.
Vol. 2882: D. Veit, Matchmaking in Electronic Markets.XV, 180 pages. 2003.
Vol. 2871: N. Zhong, S. Tsumoto, E. Suzuki(Eds.), Foundations of Intelligent Systems. XV, 697 pages.2003.
Vol. 2854: J. Hoffmann, Utilizing Problem Structure inPlaning. XIII, 251 pages. 2003.
Vol. 2843: G. Grieser, Y. Tanaka, A. Yamamoto (Eds.),Discovery Science. XII, 504 pages. 2003.
Vol. 2842: R. Gavaldá, K.P. Jantke, E. Takimoto (Eds.),Algorithmic Learning Theory. XI, 313 pages. 2003.
Vol. 2838: D. Gamberger, L. Todorovski,H. Blockeel (Eds.), Knowledge Discovery in Databases:PKDD 2003. XVI, 508 pages. 2003.
Vol. 2837: D. Gamberger, L. Todorovski, H.Blockeel (Eds.), Machine Learning: ECML 2003. XVI,504 pages. 2003.
Vol. 2835: T. Horváth, A. Yamamoto (Eds.), InductiveLogic Programming. X, 401 pages. 2003.
Vol. 2821: A. Günter, R. Kruse, B. Neumann (Eds.), KI2003: Advances in Artificial Intelligence. XII, 662 pages.2003.
Vol. 2807: P. Mautner (Eds.), Text, Speechand Dialogue. XIII, 426 pages. 2003.
Vol. 2801: W. Banzhaf, J. Ziegler, T. Christaller, P. Dittrich,J.T. Kim (Eds.), Advances in Artificial Life. XVI, 905pages. 2003.
Vol. 2797: O.R. Zaïane, S.J. Simoff, C. Djeraba (Eds.),Mining Multimedia and Complex Data. XII, 281 pages.2003.
Vol. 2792: T. Rist, R.S. Aylett, D. Ballin, J. Rickel (Eds.),Intelligent Virtual Agents. XV, 364 pages. 2003.
Vol. 2782: M. Klusch, A. Omicini, S. Ossowski, H. Laa-manen (Eds.), Cooperative Information Agents VII. XI,345 pages. 2003.
Vol. 2780: M. Dojat, E. Keravnou, P. Barahona (Eds.),Artificial Intelligence in Medicine. XIII, 388 pages. 2003.
Vol. 2777: B. Schölkopf, M.K. Warmuth (Eds.), LearningTheory and Kernel Machines. XIV, 746 pages. 2003.
Vol. 2752: G.A. Kaminka, P.U. Lima, R. Rojas (Eds.),RoboCup 2002: Robot Soccer World Cup VI. XVI, 498pages. 2003.
Vol. 2741: F. Baader (Ed.), Automated Deduction –CADE-19. XII, 503 pages. 2003.
Vol. 2705: S. Renals, G. Grefenstette (Eds.), Text- andSpeech-Triggered Information Access. VII, 197 pages.2003.
Vol. 2703: O.R. Zaïane, J. Srivastava, M. Spiliopoulou, B.Masand (Eds.), WEBKDD 2002 - MiningWeb Data forDiscovering Usage Patterns and Profiles. IX, 181 pages.2003.
Vol. 2700: M.T. Pazienza (Ed.), Extraction in the Web Era.XIII, 163 pages. 2003.
Vol. 2699: M.G. Hinchey, J.L. Rash, W.F. Truszkowski,C.A. Rouff, D.F. Gordon-Spears (Eds.), Formal Ap-proaches to Agent-Based Systems. IX, 297 pages. 2002.
Vol. 2691: J.P. Müller, M. Pechoucek (Eds.),Multi-Agent Systems and Applications III. XIV, 660pages. 2003.
Vol. 2684: M. V. Butz, O. Sigaud, P. Gérard (Eds.), Antic-ipatory Behavior in Adaptive Learning Systems. X, 303pages. 2003.
Vol. 2682: R. Meo, P.L. Lanzi, M. Klemettinen (Eds.),Database Support for Data Mining Applications. XII, 325pages. 2004.
Vol. 2671: Y. Xiang, B. Chaib-draa (Eds.), Advances inArtificial Intelligence. XIV, 642 pages. 2003.
Vol. 2663: E. Menasalvas, J. Segovia, P.S. Szczepaniak(Eds.), Advances in Web Intelligence. XII, 350 pages.2003.
Vol. 2661: P.L. Lanzi, W. Stolzmann, S.W. Wilson (Eds.),Learning Classifier Systems. VII, 231 pages. 2003.
Vol. 2654: U. Schmid, Inductive Synthesis of FunctionalPrograms. XXII, 398 pages. 2003.
Vol. 2650: M.-P. Huget (Ed.), Communications in Multi-agent Systems. VIII, 323 pages. 2003.
Vol. 2645: M.A. Wimmer (Ed.), Knowledge Managementin Electronic Government. XT, 320 pages. 2003.
Vol. 2639: G. Wang, Q. Liu, Y. Yao, A. Skowron (Eds.),Rough Sets, Fuzzy Sets, Data Mining, and Granular Com-puting. XVII, 741 pages. 2003.
Vol. 2637: K.-Y. Whang, J. Jeon, K. Shim, J. Srivas-tava, Advances in Knowledge Discovery and Data Mining.XVIII, 610 pages. 2003.
Vol. 2636: E. Alonso, D. Kudenko, D. Kazakov (Eds.),Adaptive Agents and Multi-Agent Systems. XIV, 323pages. 2003.
Vol. 2627: B. O’Sullivan (Ed.), Recent Advances in Con-straints. X, 201 pages. 2003.
Vol. 2600: S. Mendelson, A.J. Smola (Eds.), AdvancedLectures on Machine Learning. IX, 259 pages. 2003.
Vol. 2592: R. Kowalczyk, J.P. Müller, H. Tianfield, R. Un-land (Eds.), Agent Technologies, Infrastructures, Tools,and Applications for E-Services. XVII, 371 pages. 2003.
Vol. 2586: M. Klusch, S. Bergamaschi, P. Edwards, P. Petta(Eds.), Intelligent Information Agents. VI, 275 pages.2003.
Vol. 2583: S. Matwin, C. Sammut (Eds.), Inductive LogicProgramming. X, 351 pages. 2003.
Vol. 2581: J.S. Sichman, F. Bousquet, P. Davidsson(Eds.),Multi-Agent-Based Simulation. X, 195 pages. 2003.