Artificial groundwater recharge studies in Sathyamangalam ... · Nirmala.R, Shankara.M, Nagaraju.D,...
17
INTERNATIONAL JOURNAL OF ENVIRONMENTAL SCIENCES Volume 1, No 7, 2011 © Copyright 2010 All rights reserved Integrated Publishing Association Research article ISSN 0976 – 4402 Received on April, 2011 Published on May 2011 1592 Artificial groundwater recharge studies in Sathyamangalam and Melur villages of Kulathur taluk, Pudukottai district, Chennai, using GIS techniques Nirmala.R, Shankara.M, Nagaraju.D, Chinnaiah Department of Studies in Earth Science, Manasagangotri, University of Mysore, Mysore, India [email protected] ABSTRACT In recent days south India in general is facing lot of water shortage both for irrigation and domestic consumption purposes. In this regard the ground water plays a vital role in overcoming this shortage. Since, the over exploitation of ground water without proper recharge mechanism and scanty rainfall, the water table of the open or dug wells in the region are being gone into deeper parts of the surface and many a times even some of them were dried up. In order to increase the level of the water table of the region it was necessary to adopt newer methods of ground water recharge. Presently the sophisticated GIS technique was a very useful tool in order to assess, monitor and plan suitable way of ground water utilization. Recharging began in Europe early in 19 th century and in United States near the end of the century, since then recharge installations have steadily increased throughout the world. As part of research work we undertook the GIS studies on the satyamangalam and melur villages of kulathur taluk, Tamilnadu as study area. Using the available geo-reference map of the region we have digitized and analyzed to create the drainage pattern, elevation model and slope pattern of the region. Based on the lithology and topography of the area we have proposed some of the suitable methods of recharge. This is in order to overcome the water shortage and to improve the storage capacity of the ground water aquifer as well as increase the level of the ground water table. Keywords: Proper recharge, GIS, Georeference, drainage, model, capacity, aquifer. 1. Introduction Geographic Information Technology (GIT) is one among the rapidly developing technologies in earth Sciences. Advances in this technology have created efficient possibilities of collecting and managing large amounts of data from earth resource processes in various forms and scales. Remote sensing and GPS [Global Positioning System] technologies are offering a great deal of potential to capture data through a variety of earth observation platforms. In recent times the artificial methods of recharging ground water has been adopted since the level of ground water is depleting in fast due to over exploitation. An earth scientist can provide a suitable method of recharging the ground water with the aid of spatial tools like Remote Sensing, GIS and GPS technology. Using these technologies, the artificial recharge methods can be adopted to a site depending upon the local topographic, geologic and soil conditions. One such attempt has been done for adopting artificial recharge methods at Sathyamangalam and Melur village of Kulathur taluk, Pudukottai district, which is comparatively a drought prone area in Tamilnadu.
Transcript of Artificial groundwater recharge studies in Sathyamangalam ... · Nirmala.R, Shankara.M, Nagaraju.D,...

INTERNATIONAL JOURNAL OF ENVIRONMENTAL SCIENCES V olume 1, No 7, 2011
© Copyright 2010 All rights reserved Integrated Publishing Association
Research article ISSN 0976 – 4402
Received on April, 2011 Published on May 2011 1592
Artificial groundwater recharge studies in Sathyamangalam and Melur villages of Kulathur taluk, Pudukottai district, Ch ennai, using GIS
techniques Nirmala.R, Shankara.M, Nagaraju.D, Chinnaiah
Department of Studies in Earth Science, Manasagangotri, University of Mysore, Mysore, India
ABSTRACT
In recent days south India in general is facing lot of water shortage both for irrigation and domestic consumption purposes. In this regard the ground water plays a vital role in overcoming this shortage. Since, the over exploitation of ground water without proper recharge mechanism and scanty rainfall, the water table of the open or dug wells in the region are being gone into deeper parts of the surface and many a times even some of them were dried up. In order to increase the level of the water table of the region it was necessary to adopt newer methods of ground water recharge. Presently the sophisticated GIS technique was a very useful tool in order to assess, monitor and plan suitable way of ground water utilization. Recharging began in Europe early in 19th century and in United States near the end of the century, since then recharge installations have steadily increased throughout the world. As part of research work we undertook the GIS studies on the satyamangalam and melur villages of kulathur taluk, Tamilnadu as study area. Using the available geo-reference map of the region we have digitized and analyzed to create the drainage pattern, elevation model and slope pattern of the region. Based on the lithology and topography of the area we have proposed some of the suitable methods of recharge. This is in order to overcome the water shortage and to improve the storage capacity of the ground water aquifer as well as increase the level of the ground water table.
Keywords: Proper recharge, GIS, Georeference, drainage, model, capacity, aquifer.
1. Introduction Geographic Information Technology (GIT) is one among the rapidly developing technologies in earth Sciences. Advances in this technology have created efficient possibilities of collecting and managing large amounts of data from earth resource processes in various forms and scales. Remote sensing and GPS [Global Positioning System] technologies are offering a great deal of potential to capture data through a variety of earth observation platforms. In recent times the artificial methods of recharging ground water has been adopted since the level of ground water is depleting in fast due to over exploitation. An earth scientist can provide a suitable method of recharging the ground water with the aid of spatial tools like Remote Sensing, GIS and GPS technology. Using these technologies, the artificial recharge methods can be adopted to a site depending upon the local topographic, geologic and soil conditions. One such attempt has been done for adopting artificial recharge methods at Sathyamangalam and Melur village of Kulathur taluk, Pudukottai district, which is comparatively a drought prone area in Tamilnadu.

Artificial groundwater recharge studies in Sathyamangalam and Melur villages of Kulathur taluk, Pudukottai district, Chennai, using GIS techniques
Nirmala.R, Shankara.M, Nagaraju.D, Chinnaiah International Journal of Environmental Sciences Volume 1 No.7, 2011
1593
1.1 Aim and Objectives Following are the objectives of the present study 1 To prepare land use/land cover pattern maps for study area such as village boundary,
survey boundary, road, water bodies, spot heights, and topographic features. 2 Preparation of Digital Elevation Model using the spot height. 3 Preparation of percentage of slope map. 4 GIS analysis was carried out to explore suitable artificial methods of groundwater
recharge for the study area. 5 Synthesis of data. 2. Study area
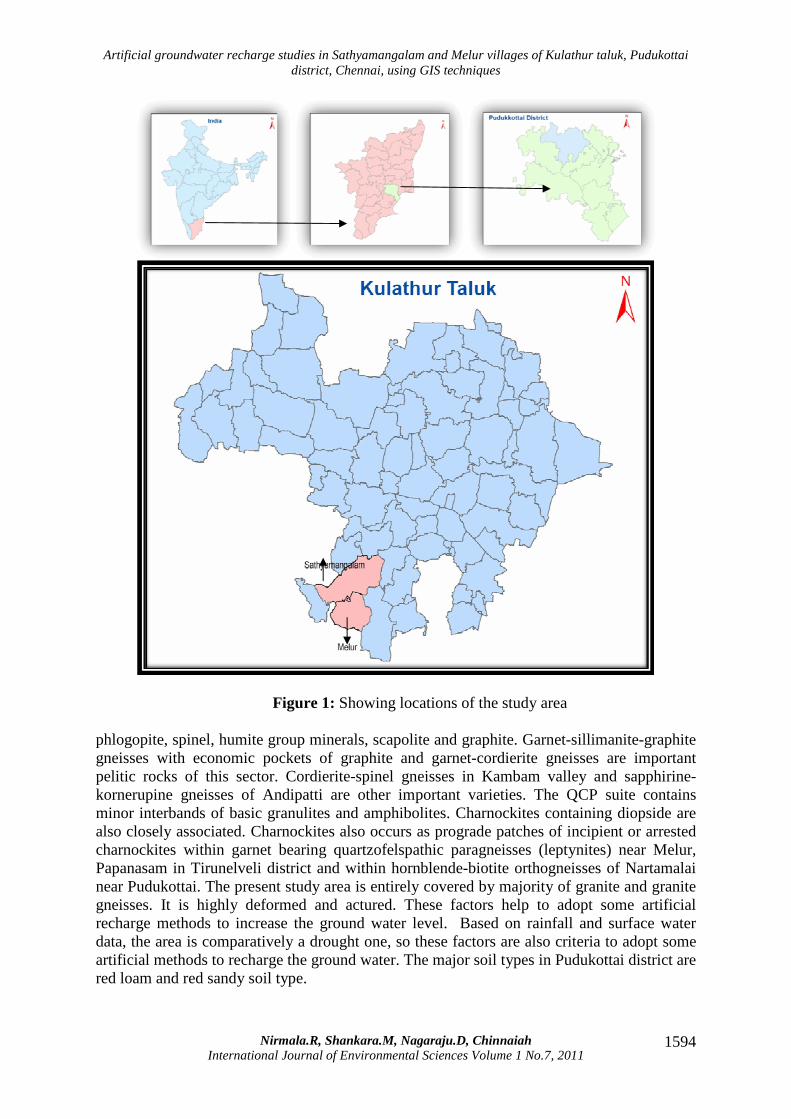
The present study area is the Sathyamangalam and Melur villages of Kulathur taluk, Pudukottai district (Figure 1 & 2). The total area of the Pudukottai district is 4,668sq.km. The district is bound on the North and northwest by tiruchirappalli district, West and southwest by sivaganga district, on the east and northeast by thanjavur district and on the Southeast by Bay of Bengal. Pudukottai district is situated in between 9050’N and 10040’N latitude and 78025’E and 79015’E longitude. It is almost a coastal district. The western portion is 600 ft above MSL, tapers towards the east and reaches the sea level. The land slope is almost gentle. The Kulathur taluk is situated on Tiruchirappalli-Pudukottai highway (NH-210). The area is 644.26sq.km. It lies longitudes. The study area Sathyamangalam and Melur lies between 78046’36.765’’E - 10026’31.744’’N and 78047’22.402’’E - 10030’ 15.097’’N respectively. The area covered by the said villages is 14.77 and 8.76sq.km respectively and the total area covered by the villages are 23.54 sq.km. 2.1 Geology of the area Madurai block is sandwiched between the palghat-cauvery shear zone in the north and the achankovil shear zone in the south. This block is divided into three different sectors, for the sake of convenience of description, as (i) Amaravathi sector (AM), (ii) Kodaikanal- Anaimalai sector (KA) and (iii) Tiruchi (Tiruchirapalli) -Tirunelveli sector (TT).Among these the Tiruchi - Tirunelveli (TT) sector is the most extensive sector in the Madurai Block, and extends across the Periyar and Achankovil lineaments in Kerala. Regional structure of this sector is highly complex with numerous domes and basins resulting from fold interference as in Sirumalai Hills to the east of Dindigul. The TT sector exposes large volumes of quartzite-Carbonate-pelite (QCP) suite (~35%) that are classified under Khoadalite Group. Although not stratigraphically equivalent of the Khondalite Group of EGMB, the entrenched terminology is continued here until a consensus emerges on new terminology. In less deformed areas, the quartzites preserve ripple marks, as in Alagar Malai. Carbonate facies is represented by crystalline limestones that support cement factories with calc-silicate rocks containing diopside, forsterite, wollastonite, tremolite,
Artificial groundwater recharge studies in Sathyamangalam and Melur villages of Kulathur taluk, Pudukottai district, Chennai, using GIS techniques
Nirmala.R, Shankara.M, Nagaraju.D, Chinnaiah International Journal of Environmental Sciences Volume 1 No.7, 2011
1594
Figure 1: Showing locations of the study area phlogopite, spinel, humite group minerals, scapolite and graphite. Garnet-sillimanite-graphite gneisses with economic pockets of graphite and garnet-cordierite gneisses are important pelitic rocks of this sector. Cordierite-spinel gneisses in Kambam valley and sapphirine-kornerupine gneisses of Andipatti are other important varieties. The QCP suite contains minor interbands of basic granulites and amphibolites. Charnockites containing diopside are also closely associated. Charnockites also occurs as prograde patches of incipient or arrested charnockites within garnet bearing quartzofelspathic paragneisses (leptynites) near Melur, Papanasam in Tirunelveli district and within hornblende-biotite orthogneisses of Nartamalai near Pudukottai. The present study area is entirely covered by majority of granite and granite gneisses. It is highly deformed and actured. These factors help to adopt some artificial recharge methods to increase the ground water level. Based on rainfall and surface water data, the area is comparatively a drought one, so these factors are also criteria to adopt some artificial methods to recharge the ground water. The major soil types in Pudukottai district are red loam and red sandy soil type.

Artificial groundwater recharge studies in Sathyamangalam and Melur villages of Kulathur taluk, Pudukottai district, Chennai, using GIS techniques
Nirmala.R, Shankara.M, Nagaraju.D, Chinnaiah International Journal of Environmental Sciences Volume 1 No.7, 2011
1595
Figure 2: Road net work
2.2 Rainfall data of the area
Month Normal rainfall (in mm)
Actual rainfall (in mm)
June-07 45.0 63.8 July 76.3 10.0
August 108.4 94.1 September 121.0 57.4 South-west Monsoon
350.7 225.3
October 170.5 203.9 November 144.3 211.1 December 103.2 26.1 North-east Monsoon
418.0 441.1
January-08 23.9 0.2 February 14.3 1.9
Winter Season 38.2 2.1 March 17.6 0.0 April 43.3 15.2 May 53.7 28.5
Hot Season 114.6 43.7 Whole Year 921.5 712.2

Artificial groundwater recharge studies in Sathyamangalam and Melur villages of Kulathur taluk, Pudukottai district, Chennai, using GIS techniques
Nirmala.R, Shankara.M, Nagaraju.D, Chinnaiah International Journal of Environmental Sciences Volume 1 No.7, 2011
1596
2.3 Sources of water supply The following table shows the sources of water supply of the district. No dam or reservoir is constructed in Pudukottai district.
Canal
Wells used for Irrigation
Purpose
Taluk
No.
Length (km)
Tube
wells
others
Wells used for domesti
c purpose
Reservoirs
Tanks in
numbers
Kulathur 7 5 95 5679 418 - 857
2.4 Methodology The following are the methods are used 1 To prepare land use/land cover pattern maps for study area such as village boundary,
survey boundary, road, water bodies, spot heights, and topographic features. 2 Preparations of Digital Elevation Model using the spot height.
3 Preparation of percentage of slope map.
4 GIS analysis was carried out to explore suitable artificial methods of groundwater recharge for the study area and synthesis of data.
The present study area is Sathyamangalam and Melur village of Kulathur taluk, Pudukottai district, Tamilnadu. The map of the study area was geo-referenced using ERDAS software. Further, the land use and land pattern maps like village boundary, survey boundary, water bodies, roads, etc. were digitized using Arc GIS software. The DEM and slope was generated using Arc GIS by taking the spot height of the area from the toposheet. Based on the geomorphology and lithology of the area, some of the artificial recharge methods suitable for the area were proposed for recharging the ground water (Figure 3). 2.5 Geo-referencing First the proposed study area Melur and Sathyamangalam village of the Kulathur taluk, Pudukottai district, Tamilnadu which was already been geo-referenced has been selected for the artificial recharge method. 2.6 Data Base Generation In GIS there are two types of data to be managed spatial data and non-spatial (attribute) data. Database Generation involves both spatial and non-spatial data. Spatial data gives information about due locations and the shapes of geographic features and the relationship between them. Non-spatial data is represents the quantity, which includes attribute fields like names, building ID’s, area covered, etc.Spatial data base involves the creation of geo-database, feature dataset, feature class, digitization and topology rules. Geo-database is a data model for representing geographic information using standard relational database technology. The geo-database supports the storage and management of geographic information in standard data base management system tables. Feature dataset includes vector features are a

Artificial groundwater recharge studies in Sathyamangalam and Melur villages of Kulathur taluk, Pudukottai district, Chennai, using GIS techniques
Nirmala.R, Shankara.M, Nagaraju.D, Chinnaiah International Journal of Environmental Sciences Volume 1 No.7, 2011
1597
versatile and frequently used geographic data type, well suited for representing features with discrete boundaries such as wells, streets, rivers, states. A feature is simply an object that has a location stored as one of its properties (or fields) in the row. Typically features are spatially represented as points, lines, polygons which are organized into feature class. 2.7 Feature Class Feature Classes are the collections of features of the same type with a common spatial representation and set of attributes. For example 1. Line feature class: roads- footpath, metal road, highways. 2. Point feature class: location- post office, hamlets 3. Polygon feature class: area- water tank, village boundary.
Figure 3: Water bodies

Artificial groundwater recharge studies in Sathyamangalam and Melur villages of Kulathur taluk, Pudukottai district, Chennai, using GIS techniques
Nirmala.R, Shankara.M, Nagaraju.D, Chinnaiah International Journal of Environmental Sciences Volume 1 No.7, 2011
1598
The data type is selected i.e. geometry which gives the field properties. Rasters are used to represent continues layers such as elevations, slope and aspect, vegetation, temperatures, rainfall. 3. Digitization
Digitization is the process in which analog images such as photographs and map may be converted into a digital format. Arc map is the central application in Arc GIS for all map based on tasks including digitization, editing, map analysis, cartography. Feature class and Raster image were added and selected features are appeared in the layer box. Start editing and snapping is activated. Task in the tool bar is selected depending upon the features which includes create task, modify task and topology tasks. 3.1 Topology Topologies are useful for maintaining high quality spatial data by ensuring that features confirm to simple rules, when geo-database is set up with a topology, specify which feature classes participate in the topology feature class are added to topology. Topologies store three sets of parameter rules, ranks and cluster tolerance. 3.2 Rules Rules define the permissible spatial relationship between features. The rules defined for a topology controls the relationships of features allowed within a feature class, between features in different feature classes or between subtypes of features. 3.2.1 (a) Polygon rules (i) Village boundary must not overlap: This rule requires that the interior of the polygon in the feature class should not overlap. The polygons can share edges or vertices. This rule is used when an area cannot belong to two or more polygon. It is useful for modeling administrative boundaries such as voting districts and mutually extensive area classifications such as land cover or landform type. (ii) Village boundary must not have gaps: This rule requires that polygon not have voids within themselves or between adjacent polygons. Polygon can share edges or vertices, or interior area. Polygons may also be completely disconnected. This rule is used when polygon or blocks of contiguous polygon should not have empty spaces within them. 3.2.2 (b) Line rules (i) Road must not overlap: This rule requires that lines not overlap with lines in the same feature class. This rule is used where line segments should not be duplicated. In a stream feature class, line can cross or intersect but cannot share segments. (ii) Road must not intersect: This rule requires that line features from the same feature cannot cross or overlap each other. Lines can share endpoints. This rule is used for contour lines that should never cross each other or in cases where the intersection of lines should only occur at end points, such as street segments and intersection.

Artificial groundwater recharge studies in Sathyamangalam and Melur villages of Kulathur taluk, Pudukottai district, Chennai, using GIS techniques
Nirmala.R, Shankara.M, Nagaraju.D, Chinnaiah International Journal of Environmental Sciences Volume 1 No.7, 2011
1599
(iii) Road must not have dangles: This rule requires that a line feature must touch lines from the same feature class at both endpoints. An endpoint that is not connected to another line is called a dangles. This rule is used when line features must form closed loops’ such as when they are defining the boundaries of polygon features. It may also be used in cases where lines typically connect to other lines, as with streets. 3.2.3 (c) Point Rules (i) Must be covered by boundary of the village: This rule requires points to fall on the boundaries of area features. This useful when the point features help support the boundary system, such as boundary markers which must be found on the edges of certain areas. (ii) Must be properly inside polygon: This rule requires that points fall within area features. This is useful when the point features are reflect to polygon, such as well, address points and parcels. 3.3 Editing and Validation There are generally two different types of errors could be anticipated from a GPS reading, viz, errors related to the position of the points, errors related to linear feature. Point positioning errors may be due to varied reasons. The errors related to points could be solved by precise positioning techniques, observing the same point at different time periods and satellite availability. Errors related to linear features all of two types, viz, over shoot and undershoot. Overshoot is the line gone beyond its target map position. While undershoot is related to the line which is felt short of some of some distance before its target snap position. In present study, GPS survey started with errors except point feature captures. The line feature captured mostly along with the overshoot with several bit of line segments due to the twisted of the receiver, which can found prominently for road network, particularly the unmetallic road, pond and tanks. Under shoots are identified with play ground. Post office, garden etc, Errors were edited with aid of editor tool in Arc GIS. Some vehicles could add and deleted in accordance with requirements. The advanced error tool was manifesting editing task. Merge option was effective to group the segment of line features that has to be considered common entity like unmetallic road, metal road etc.
3.3.1 Mapping and Map layout Map design is a visual plan to achieve a goal or the purpose of map. The purpose of map design is to enhance map communication, which is particularly important for thematic maps. A well designed is balanced, coherent, ordered and interesting to look at. Layout is the arrangement and composition or map elements on a map body, title, the legend, the scale and the North Arrow. 3.3.2 Map Elements Map body: The primary mapped area; you can display more than one image of your primary mapped area within your documents. For ex. to portray change by showing several maps that contains a locater map (a smaller scale map used to help the reader in understanding where the main area of interest is located). All are used to assist in communicating information to others. In Arc map, each of these mapped, areas is referred to a data frame.

Artificial groundwater recharge studies in Sathyamangalam and Melur villages of Kulathur taluk, Pudukottai district, Chennai, using GIS techniques
Nirmala.R, Shankara.M, Nagaraju.D, Chinnaiah International Journal of Environmental Sciences Volume 1 No.7, 2011
1600
Title: It is used to tell the reader what the map represent, this is often placed on a map layout as text, and similar style of text has followed for keeping appreciation. Legend: It lists the symbology used within the map and what it represents this can be created using the legend vizard in the layout and edited further once created. It offers to determine the items to be placed in legend. Scale: This provides readers with the information they to determine distance. A map scale is a ratio, where one unit on the map represents some multiple of that value due the real world. It can be numeric (1:10,000), graphic overbear (one inch equals 10,000 inches) Maps are often referred to as “large” or “small” scale. A larger scale map displays a small area, but more details. The present study area map scale is small scale map and covers large details as well as graphic scale has interested for easy understanding, measure if necessary. Direction: This is shown using a North arrow. A map may show true North and magnetic North. This element is interested for easy understanding, measure if necessary. Projection: projection is a mathematical formula that transform feature locations from the earth’s curve surface to map’s flat surface. Projections catalog distortions in distance, area, shape and direction; no projection can avoid some distortion. Therefore the projection type is often placed on the map to help readers determine the accuracy of the measurement information they get from the map. It is indicated left bottom corner of the area maps. 3.4 Digital elevation model (DEM) Digital elevation model is termed as a digital representation of ground surface or terrain and its also widely known as digital terrain model ( DTM). A DTM may be used as digital model of any single-valued surface like geological horizons and even air temperature or population density (Figure 4). The input data, models and algorithms required by digital models of terrain or other surfaces are quite different from those used in representing planimetric or two-dimensional data. The activity of modeling and processing digital terrain data may thus be regarded as a system component of GIS that is functionally disparate from modeling 2-D data yet needs to be closely linked to other processing functions of GIS like polygon, network and raster processing. In the present work the Digital Elevation Model is created using the spot heights. This is done in Arc Map using the Spatial Analyst Tool Bar.
4. Results and Discussions 4.1 GIS Analysis In Arc GIS, Arc Toolbox is one of the modules which is used for the analysis. Analysis is the last stage in Arc GIS.Arc Toolbox is organized toolsets. It is a collection of geo-processing tools. It is used for the solution of different tasks. It has 13 main toolbox. Arc Toolbox has 3 main levels:
• Toolbox- collection of Tool sets.
• Toolsets- collection of Tools.
• Tools- used for geo-processing.

Artificial groundwater recharge studies in Sathyamangalam and Melur villages of Kulathur taluk, Pudukottai district, Chennai, using GIS techniques
Nirmala.R, Shankara.M, Nagaraju.D, Chinnaiah International Journal of Environmental Sciences Volume 1 No.7, 2011
1601
Among these toolbox, some of the toolbox is used for analysis. They are: 1. Analysis tools
2. Data management tools
Figure 4: Digital elevation model An analysis tool is the most powerful tools for geo-processing. It contains toolsets like extract, overlay, proximity (buffer and multiple ring buffers) and statistics. Totally 16 tools are available to solve a spatial or statistical problem and data management toolbox contains a number of smaller toolsets. Totally 119 tools are available. This tool box can manage, append, join and dissolve. This toolbox is useful to modify the characteristics of a Geo-database or Table and majority of the geo-processing function falls in this tool box.

Artificial groundwater recharge studies in Sathyamangalam and Melur villages of Kulathur taluk, Pudukottai district, Chennai, using GIS techniques
Nirmala.R, Shankara.M, Nagaraju.D, Chinnaiah International Journal of Environmental Sciences Volume 1 No.7, 2011
1602
4.2 Slope Slope is used to describe the steepness, inclination, gradient, or grade of a straight line. A higher slope value indicates a steeper incline. The slope is defined as the ratio of the "rise" divided by the " run" between two points on a line, or in other words, the ratio of the altitude change to the horizontal distance between any two points on the line. It is also always the same thing as how many rise in one run. The most straight forward usage of a DEM is the generation of slope information including slope angle and aspect which are frequently used in DTM applications. Slope is a vector; it has a direction and length. In the present work, the slope is calculated in percentage. The spot height taken from the study area is digitized using the Spatial Analyst tool box in the Arc Map (Figure 5). Digital Elevation Model and slope gives us an idea about the level of inclination on the surface that is the topography and inclination of the study area. This helps to propose the different types of artificial recharge structures. Among several methods of artificial recharge techniques as discussed earlier, only a few methods could be adopted to the present study area based on the topography and lithology of the area. Further the suitable methods of artificial recharge adopted in the present study are. 4.3 Recharge dug wells In alluvial as well as hard rock areas where the dug wells have gone either dry or the water level have declined can be used as an artificial recharge structure, by diverting groundwater reservoir, tank water, canal water etc. to the dried aquifer. Existing wells of the study area were recharged by dug well method and the buffer zones for 200m for tanks and ponds, and 100m for streams were maintained. First priority is for the wells which are far away from 200m buffer area and the second priority is for the wells which are far away from 100m buffer area. The earlier condition is given first priority because of an paucity of any water source in this region and composed nearly dried wells. The later priority is because of the proximity of streams and these streams serve as the source of water for those wells (Fig 6). In the present study area there are more than 50 wells present where 30% of the wells are dried up and this dried well has given the first priority. Since these wells already exist, this method can be easily adopted without much expenditure. By this method the surface water can directly recharge the groundwater. 4.4 Flooding method This method is suitable for relatively flat topography, where the water may be diverted to spread evenly over a large area. It is desirable to form a thin sheet of water over the land which moves at a minimum velocity avoiding removal of the soil. Since the lithology of the area is favorable for the recharge of the groundwater, this method can be easily adopted. The criterion for this method is to create the buffer zone along the stream, river and pond for 100m, tank for 200m. The buffer zone is created near to the water bodies; the moisture content will be relatively more. The left out part of the area does not get any source of water. Such area can be used for flooding method by making the water to spread over the area either by stream, tank or river (Figure 7). Compared to Melur village, Sathyamangalam consists of more flat topography. Therefore, Sathyamangalam village is more suitable to adopt flooding method than the Melur for recharge of groundwater. By adopting this method the barren land which is not suitable for any purpose can be used as recharge structure.

Artificial groundwater recharge studies in Sathyamangalam and Melur villages of Kulathur taluk, Pudukottai district, Chennai, using GIS techniques
Nirmala.R, Shankara.M, Nagaraju.D, Chinnaiah International Journal of Environmental Sciences Volume 1 No.7, 2011
1603
Figure 7: Flooding type

Artificial groundwater recharge studies in Sathyamangalam and Melur villages of Kulathur taluk, Pudukottai district, Chennai, using GIS techniques
Nirmala.R, Shankara.M, Nagaraju.D, Chinnaiah International Journal of Environmental Sciences Volume 1 No.7, 2011
1604
Figure 5: Slope map

Artificial groundwater recharge studies in Sathyamangalam and Melur villages of Kulathur taluk, Pudukottai district, Chennai, using GIS techniques
Nirmala.R, Shankara.M, Nagaraju.D, Chinnaiah International Journal of Environmental Sciences Volume 1 No.7, 2011
1605
Figure 6: Dug well recharge method
4.5 Check dam type Check dams are constructed across small streams and rivers having gentle slope. The height of the check dam is normally less than 2m. This is adopted to check the velocity of the streams or rivers and to facilitate recharge of stored water within short span of time. The excess of water is allowed to flow over the abutment and it acts as a mini percolation tanks. On regional scale, series of check dams can also be constructed. The velocity of the streams

Artificial groundwater recharge studies in Sathyamangalam and Melur villages of Kulathur taluk, Pudukottai district, Chennai, using GIS techniques
Nirmala.R, Shankara.M, Nagaraju.D, Chinnaiah International Journal of Environmental Sciences Volume 1 No.7, 2011
1606
or the rivers increases near the confluence, so the check dam method is well suited in the area after the confluence of the streams or the rivers. During rainy season the velocity of the stream or the river will be more and the excess of water will flow off and some amount of water will percolate and increases the groundwater level in aquifer (Figure 9). Sathyamangalam has comparatively more rivers than Melur so, this method requires more check dam compared to Melur.
Figure 9: Check dam type
4.6 Percolation tanks/spreading basin method Percolation tanks are constructed to recharge deeper aquifers. The efficacy and feasibility of these structures is more in hard rock formation where the rocks are highly fractured and weathered. The suitable site selected for this method in the present area is the hard rock formation (rocky ground) near the mountain fronts (foothills) along with the stream. Melur is more undulated compared to Sathyamangalam and therefore the hard rock formations near the foothills of the Melur village is buffered for 100m and the streams which comes within this buffer zone is considered as the suitable area for percolation tanks. This hard rock formations acts as a wall for further flow of water which runs down from the elevated area and also the slope supports the flow of water to the tanks constructed near the

Artificial groundwater recharge studies in Sathyamangalam and Melur villages of Kulathur taluk, Pudukottai district, Chennai, using GIS techniques
Nirmala.R, Shankara.M, Nagaraju.D, Chinnaiah International Journal of Environmental Sciences Volume 1 No.7, 2011
1607
hard rock formations. But the rocky grounds which are present on the flat topography are not best suitable for this method. (Figure 10).
Figure 10: Spreading basin method 5. Conclusion
The geomorphological and hydrogeological studies, using GIS, were dealt on the selected study area Sathyamangalam and Melur villages of Kulathur Taluk, Pudukottai district, Tamilnadu. This region was selected since the area is known as drought prone area with very scanty rainfall and no proper water supply system and the wells and tanks around this area were in the verge of complete dryness. The geology of the study area indicates that it mainly consists of granites, granitic gneisses which are highly deformed and fractured. In the present study the following aspects were dealt and they are: 1.The region has gentle slope in easterly direction which was inferred based on the drainage pattern of the region. and 2.The existing water body maps were prepared, and 3.The digital elevation model and percentage of slope was prepared based on the spot heights. Based on the above observations and the digital elevation models prepared it was suggested the suitable methods of artificial recharge. They are flooding method, dug well method, check dam and percolation tanks. The above mentioned artificial recharge will helps in proper utilization of water resources and to overcome the shortage of water faced by this region.

Artificial groundwater recharge studies in Sathyamangalam and Melur villages of Kulathur taluk, Pudukottai district, Chennai, using GIS techniques
Nirmala.R, Shankara.M, Nagaraju.D, Chinnaiah International Journal of Environmental Sciences Volume 1 No.7, 2011
1608
6. References
1. Anji Reddy M., (2004), Remote Sensing and Geographical Information Systems, BS publications, Hyderabad, 2nd edition, pp 343-350.
2. Allan, R and Freez and Jhon A. Cherry (1979)., Ground water, Prentice-hall. pp 230,
367-370.
3. Raghunath, H.M., Hydrogeology, Wiley Eastern Limited, Delhi. pp. 206-208.
4. Raghunath, H.M., Ground water, Wiley Eastern limited, 2nd edition, pp. 463-473.
5. Ramkrishnan, M, Vaidyanadhan.R, (2008), Geology of India, Geological society of India, Bangalore, pp 379- 382.
6. Subramanian, K.S and T.A Selvan., Geology of Tamilnadu and Pondicherry,
published by Geological society of India, Bangalore, pp 21-30.


![Giuseppe Arcimboldo [j OO zep'pā ärchēmbôl'dō] (1527-1593)](https://static.fdocuments.us/doc/165x107/56814178550346895dad662c/giuseppe-arcimboldo-j-oo-zeppa-aerchemboldo-1527-1593.jpg)


![1593 PATRIZI [Ed. & Tr.] Magia Philosophica ...](https://static.fdocuments.us/doc/165x107/55cf9940550346d0339c68ac/1593-patrizi-ed-tr-magia-philosophica-.jpg)