ARTICLES - Mount Mercy University Gene... · ARTICLES Chelonian ... Bernstein and Black 2005)....
9
ARTICLES Chelonian Conservation and Biology, 2008, 7(1): 3–11 Ó 2008 Chelonian Research Foundation Migration, Gene Flow, and Genetic Diversity Within and Among Iowa Populations of Ornate Box Turtles (Terrapene ornata ornata) REBECCA J. RICHTSMEIER 1 ,NEIL P. BERNSTEIN 2 ,JAMES W. DEMASTES 1 , AND ROBERT W. BLACK 3 1 Department of Biology, University of Northern Iowa, Cedar Falls, Iowa 50614 USA [[email protected]; [email protected]]; 2 Department of Biology, Mount Mercy College, 1330 Elmhurst Drive NE, Cedar Rapids, Iowa 52402 USA [[email protected]; correspondnig author]; 3 Department of Biology, Cornell College, Mount Vernon, Iowa 52302 USA [[email protected]] ABSTRACT . – Like many fragmented reptile populations, the ornate box turtle (Terrapene ornata ornata) is located in isolated, often small, populations in eastern Iowa. If populations are to remain viable, genetic diversity within these populations must be maintained, which is done most efficiently by migration among populations. Population viability was accessed using 3 microsatellite loci to determine population genetic structure in 2 locally dispersed subpopulations of ornate box turtles. Although these subpopulations were determined to be 1 large population with the normal range of heterozygosity, further examination revealed evidence of genetic divergence from a once larger population that is now geographically separated into fragments. We concluded that the central population studied was genetically healthy, and with proper management that continues to promote gene flow, the population should remain viable in the near future. KEY WORDS. – Reptilia; Testudines; Emydidae; population genetics; microsatellites; Iowa The worldwide decline of amphibians is well documented (e.g., Lannoo 2005). Although declines among amphibians have received considerable media attention, reptilian declines also appear significant due to pollutants, invasive species, habitat loss, and increased predation along edges of fragmented habitats (Gibbons et al. 2000). Fragmented habitats, without regular gene flow between populations, also reduce genetic diversity within small, isolated populations, partially explained by meta- population theory (Levins 1969). Among reptiles, terrestrial turtles are limited in their dispersal abilities, which limit gene flow. Therefore, success of recolonization by terrestrial turtles after a population crash may depend on patch and/or corridor habitat quality, the distance separating subpopulations from the main population, or migration barriers such as rivers or roads (Lidicker and Koenig 1996). Turtle home ranges are often fragmented by highways and housing developments. In such fragmented conditions, marginal populations generally show reduced numbers and are expected to have lower average fitness (Weins 1997; Rubin et al. 2001). All of these conditions potentially apply to the ornate box turtle (Terrapene ornata ornata), which is protected in Indiana, threatened in Iowa, and endangered in Wisconsin (Swarth and Hagood 2005). All of these states contain isolated populations on the margins of their US range (Conant and Collins 1991). In eastern Iowa, most ornate box turtle populations are scattered and small. However, the Hawkeye Wildlife Area (HWA) of Johnson County, Iowa has a relatively large population (Fig. 1). Two intensely studied subpopulations within the HWA (Mallard Pools and Greencastle) are separated by less than 1 km with no apparent barriers to immigration (Fig. 2). However, studies by Bernstein et al. (2007) indicated that ornate box turtles have a high degree of philopatry and that turtles do not travel between the 2 sites. The HWA ornate box turtle population is one of the 2 largest in Iowa (over 600 turtles have been marked in the 75-ha area that contains the 2 subpopulations); the only other population that exceeds 100 individuals in eastern Figure 1. Map of Iowa indicating locations of the Hawkeye Wildlife Area (HWA) and Muscatine.
Transcript of ARTICLES - Mount Mercy University Gene... · ARTICLES Chelonian ... Bernstein and Black 2005)....

ARTICLES
Chelonian Conservation and Biology, 2008, 7(1): 3–11� 2008 Chelonian Research Foundation
Migration, Gene Flow, and Genetic Diversity Within and Among Iowa Populations ofOrnate Box Turtles (Terrapene ornata ornata)
REBECCA J. RICHTSMEIER1, NEIL P. BERNSTEIN
2, JAMES W. DEMASTES1, AND
ROBERT W. BLACK3
1Department of Biology, University of Northern Iowa, Cedar Falls, Iowa 50614 USA[[email protected]; [email protected]];
2Department of Biology, Mount Mercy College, 1330 Elmhurst Drive NE, Cedar Rapids, Iowa 52402 USA[[email protected]; correspondnig author];
3Department of Biology, Cornell College, Mount Vernon, Iowa 52302 USA [[email protected]]
ABSTRACT. – Like many fragmented reptile populations, the ornate box turtle (Terrapene ornataornata) is located in isolated, often small, populations in eastern Iowa. If populations are to remainviable, genetic diversity within these populations must be maintained, which is done mostefficiently by migration among populations. Population viability was accessed using 3microsatellite loci to determine population genetic structure in 2 locally dispersed subpopulationsof ornate box turtles. Although these subpopulations were determined to be 1 large populationwith the normal range of heterozygosity, further examination revealed evidence of geneticdivergence from a once larger population that is now geographically separated into fragments. Weconcluded that the central population studied was genetically healthy, and with propermanagement that continues to promote gene flow, the population should remain viable in thenear future.
KEY WORDS. – Reptilia; Testudines; Emydidae; population genetics; microsatellites; Iowa
The worldwide decline of amphibians is well
documented (e.g., Lannoo 2005). Although declines
among amphibians have received considerable media
attention, reptilian declines also appear significant due to
pollutants, invasive species, habitat loss, and increased
predation along edges of fragmented habitats (Gibbons et
al. 2000). Fragmented habitats, without regular gene flow
between populations, also reduce genetic diversity within
small, isolated populations, partially explained by meta-
population theory (Levins 1969).
Among reptiles, terrestrial turtles are limited in their
dispersal abilities, which limit gene flow. Therefore,
success of recolonization by terrestrial turtles after a
population crash may depend on patch and/or corridor
habitat quality, the distance separating subpopulations
from the main population, or migration barriers such as
rivers or roads (Lidicker and Koenig 1996). Turtle home
ranges are often fragmented by highways and housing
developments. In such fragmented conditions, marginal
populations generally show reduced numbers and are
expected to have lower average fitness (Weins 1997;
Rubin et al. 2001). All of these conditions potentially
apply to the ornate box turtle (Terrapene ornata ornata),
which is protected in Indiana, threatened in Iowa, and
endangered in Wisconsin (Swarth and Hagood 2005). All
of these states contain isolated populations on the margins
of their US range (Conant and Collins 1991).
In eastern Iowa, most ornate box turtle populations are
scattered and small. However, the Hawkeye Wildlife Area
(HWA) of Johnson County, Iowa has a relatively large
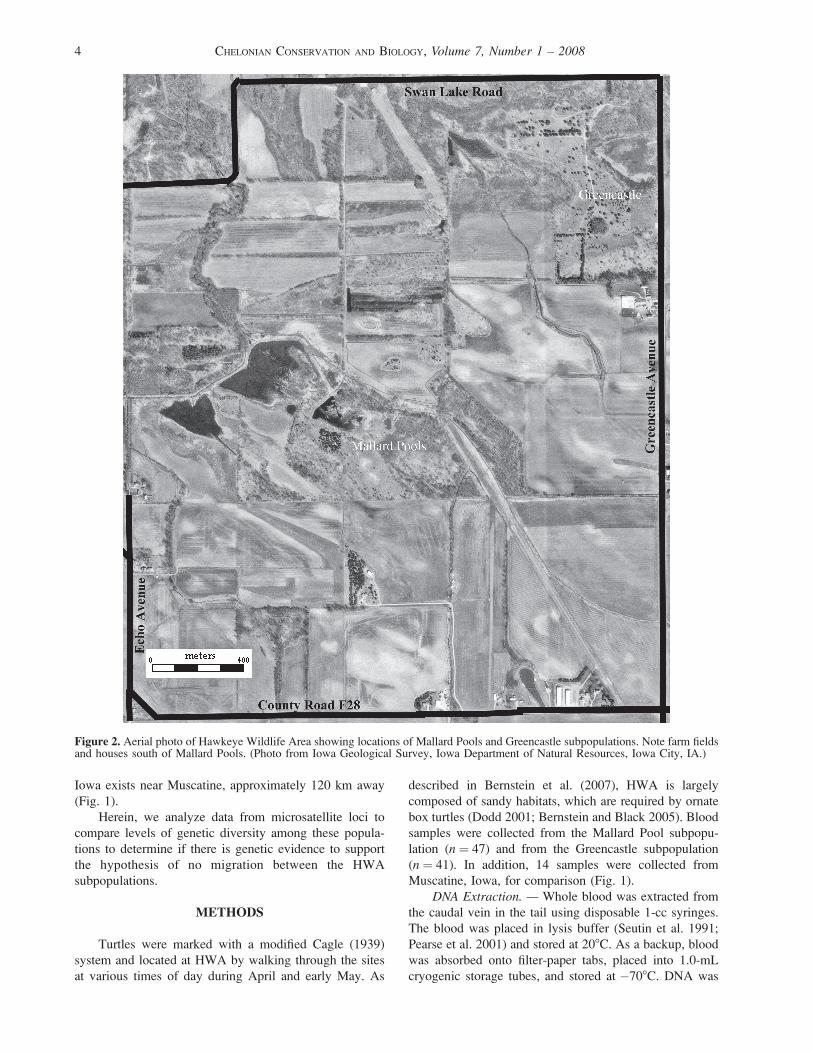
population (Fig. 1). Two intensely studied subpopulations
within the HWA (Mallard Pools and Greencastle) are
separated by less than 1 km with no apparent barriers to
immigration (Fig. 2). However, studies by Bernstein et al.
(2007) indicated that ornate box turtles have a high degree
of philopatry and that turtles do not travel between the 2
sites.
The HWA ornate box turtle population is one of the 2
largest in Iowa (over 600 turtles have been marked in the
75-ha area that contains the 2 subpopulations); the only
other population that exceeds 100 individuals in eastern
Figure 1. Map of Iowa indicating locations of the HawkeyeWildlife Area (HWA) and Muscatine.
Iowa exists near Muscatine, approximately 120 km away
(Fig. 1).
Herein, we analyze data from microsatellite loci to
compare levels of genetic diversity among these popula-
tions to determine if there is genetic evidence to support
the hypothesis of no migration between the HWA
subpopulations.
METHODS
Turtles were marked with a modified Cagle (1939)
system and located at HWA by walking through the sites
at various times of day during April and early May. As
described in Bernstein et al. (2007), HWA is largely
composed of sandy habitats, which are required by ornate
box turtles (Dodd 2001; Bernstein and Black 2005). Blood
samples were collected from the Mallard Pool subpopu-
lation (n ¼ 47) and from the Greencastle subpopulation
(n ¼ 41). In addition, 14 samples were collected from
Muscatine, Iowa, for comparison (Fig. 1).
DNA Extraction. — Whole blood was extracted from
the caudal vein in the tail using disposable 1-cc syringes.
The blood was placed in lysis buffer (Seutin et al. 1991;
Pearse et al. 2001) and stored at 208C. As a backup, blood
was absorbed onto filter-paper tabs, placed into 1.0-mL
cryogenic storage tubes, and stored at �708C. DNA was
Figure 2. Aerial photo of Hawkeye Wildlife Area showing locations of Mallard Pools and Greencastle subpopulations. Note farm fieldsand houses south of Mallard Pools. (Photo from Iowa Geological Survey, Iowa Department of Natural Resources, Iowa City, IA.)
4 CHELONIAN CONSERVATION AND BIOLOGY, Volume 7, Number 1 – 2008

extracted using standard phenol-chloroform techniques
(Hillis et al. 1990). When necessary, DNA was extracted
from frozen filter tabs using Chelex 100 (Sigma, St. Louis,
MO) following Walsh et al. (1991).
Microsatellite Analysis. — If microsatellites are
flanked by highly conservative sequences, primers may
work on multiple, closely related species (Primmer et al.
1996). Therefore, polymerase chain reaction (PCR)
primers reported by Pearse et al. (2001), who successfully
amplified microsatellites from the confamilial painted
turtle (Chrysemys picta), were chosen for this study.
Likewise, PCR conditions also followed Pearse et al.
(2001). The 3 loci examined were designated CP2, CP3,
and CP10. PCR amplifications were carried out using a
Primus thermal cycler (MWG-Biotech, High Point, NC).
Both positive and negative controls were used in each
PCR batch.
PCR products were size-fractionated at the Iowa State
University Sequencing and Synthesis Facility. The pro-
gram Genographer 1.6 (Benham 2001) was utilized for
electromorph size determination and genotype scoring of
individuals. All resulting chromatograms were also
examined by eye to ensure accuracy of scoring (e.g.,
determine presence of stutter peaks, etc.) and multiple
reference individuals were included in different runs to
standardize size determinations between batches and to
confirm reproducibility of results.
Because the nature of the tandem repeats was not
reported by Pearse et al. (2001) one individual was directly
sequenced (using the same PCR primers) for each locus
using standard cycle-sequencing procedures at the DNA
Sequencing and Synthesis Facility at Iowa State Univer-
sity. This sequencing confirmed that the microsatellites
were dinucleotide repeats with a motif of CA. We did
regenotype individuals with genotypes that fell outside the
normal range.
Statistical Analysis. — Three different population
combinations were analyzed for each statistical test. In the
first group, Mallard Pools, Greencastle, and Muscatine
were analyzed as separate populations. The second group
combined Mallard Pools with Greencastle to form the
Hawkeye population, and this was compared with
Muscatine. The third group compared Mallard Pools with
Greencastle as 2 separate populations, leaving out
Muscatine.
With the exception of calculations for RST, an FST
analog based on allele size, all analyses were performed
using Genepop version 3.3 (Raymond and Rousset 1995).
Expected and observed heterozygosities and homozygos-
ities were compared per locus and per population; an
excess of homozygosity indicated either an inbred
population or the existence of a null allele.
The Markov chain method in Genepop version 3.3
(Raymond and Rousset 1995) was used to test for
deviation from Hardy-Weinberg equilibrium (Guo and
Thompson 1992). The dememorization number was set to
1000, the number of batches was set to 500, and the
number of iterations per batch was set to 1000 to achieve a
standard error (SE) , 0.01. The result of this test was the
fixation index (Fis), a measure of heterozygote deficiency
or excess for codominant diploid alleles where Fis ¼ 0
indicates the meeting of Hardy-Weinberg expectations and
Fis ¼ 1 signals no heterozygotes.
Genotypic linkage disequilibrium, whether one locus
was independent from another, was also tested. Genepop
accomplishes this using contingency tables for all loci and
estimating the p value by the Markov chain method
(Raymond and Rousset 1995). The dememorization number
was set to 1000, the number of batches was set to 1000, and
the number of iterations per batch was set to 1000.
The genotypic distribution across populations was
also calculated using Genepop version 3.3 (Raymond and
Rousset 1995). For each locus, a contingency table was
created, and the p value was estimated for each population
or pair of populations by using the Markov chain method
(Raymond and Rousset 1995). The dememorization
number was 1000, the number of batches was 500, and
the number of iterations per batch was 1000. FST, a
measure of population differentiation, was also generated
as defined by Weir and Cockerham (1984).
RST was generated by FSTAT (Goudet 1995) and
SPAGeDI version 1.0 (Hardy and Vekemans 2002).
SPAGeDI uses spatial coordinates to analyze pairwise
comparisons. Latitude and longitude were taken directly
from locations of turtles plotted in ArcView version 3.2
(ESRI, Redlands, CA) and were converted to decimal by
the Universal Transverse Mercator conversion program
from the US Geological Survey.
RESULTS
All 3 loci were polymorphic, with 7 alleles at locus
CP3, 3 at CP2, and 10 at CP10 (Table 1). There were 2
unique alleles at Mallard Pools, allele 145 at CP3 and
allele 225 at CP10, and Muscatine did not show alleles
208, 215, 225, and 230 from CP10 (Table 1).
Expected and Observed Heterozygosities. — No
significant differences in heterozygosity were indicated
for CP2 and CP3 (Table 2). However, Fis values indicated
heterozygotic deficiency for locus CP10 for the popula-
tions at Mallard Pools (Fis ¼ 0.34) and Greencastle
(Fis ¼ 0.42). This signaled a heterozygotic deficiency,
likely the result of 1 or more null alleles at CP10.
Therefore, all subsequent tests were performed on the full
data set and also on the 2 loci, CP2 and CP3, alone, to
alleviate potential effects of a null allele.
Hardy-Weinberg Exact Tests. — CP2 and CP3 did not
deviate significantly from Hardy-Weinberg equilibrium
(Table 3). When 3 loci were examined, the highest and
lowest p values were found in Muscatine ( pCP2 ¼ 0.1114;
pCP3 ¼ 0.9403). However, the genotype frequencies for
CP10 deviated significantly from Hardy-Weinberg with
the Mallard Pools and Greencastle populations (Table 3).
Subsequently, fixation indices were low for all loci except
RICHTSMEIER ET AL. — Migration, Gene Flow, and Genetic Diversity in Terrapene ornata 5

at CP10 for Mallard Pools and Greencastle and CP2 for
Muscatine.
Genotypic Linkage Disequilibrium. — Two cases of
significant linkage were indicated by the analysis. In both
cases, the linkage involved the loci CP10 and CP2 and
occurred within the Greencastle and Mallard Pool
populations ( p ¼ 0.02 in both cases) (Table 4). Between
CP2 and CP3, the genotype frequencies did not deviate
significantly, indicating that the loci were not linked.
Because of the likelihood of the presence of a null allele
and possible linkage, CP10 was dropped from all further
analyses.
Genotype Differentiation. — Muscatine and the
pooled HWA populations showed significant differentia-
tion for CP2 (Table 5). Populations differed significantly
at CP2 between Muscatine and Mallard Pools and also for
both loci analyzed for comparisons of Muscatine and
Greencastle (Table 6).
FST and RST. — Analysis of the 2 loci indicated no
significant differences between the populations using
either FST or RST (Table 7). FST values ranged from
�0.0108 to 0.0686, and traditional RST values were also
low, ranging from�0.016 to 0.055 (Table 7). The addition
of spatial data using SPAGeDI resulted in similarly low
RST values (�0.157 to �0.0081) (Table 7).
Identical Alleles. — After comparing all sites for
identical alleles, 1 pair of turtles was found within
Muscatine, 1 pair within Mallard Pools, and 2 pairs within
Greencastle.
DISCUSSION
Both FST and RST values indicate that the 2 putative
populations at HWA share a high degree of gene flow
(where 1.0 ¼ fixation and 0.0 ¼ panmixia) and were
essentially 1 panmictic population. In their study of
Blanding’s turtles (Emydoidea blandingii), Mockford et
al. (2007) reported FST values ranging from 0.0 to 0.465
and RST values ranging from �0.016 to 0.507. Thus, our
genetic information does not support the lack of evidence
for movement between the Mallard Pools and Greenscastle
subpopulations from a decade of mark–recapture and
radiotracking data (Bernstein et al. 2007). Similarly, the
FST and RST analyses indicate that the HWA and
Muscatine populations were not differentiated. However,
the results of the genotypic distribution test, the more
sensitive test, indicated that the Muscatine population was
relatively isolated, given the significant subdivision at
Table 1. Allele summary for CP3, CP2, and CP10 within the 3study populations of Terrapene ornata ornata showing poly-morphisms, 2 unique alleles at Mallard Pools, and 4 alleles absentfrom Muscatine.a
Allele size(base pairs) Muscatine Mallard Pools Greencastle Totals
CP3 202138 3 23 21 47140 1 4 1 6145 0 1 0 1153 2 7 4 13155 14 23 21 58157 6 18 11 35159 2 18 22 42
CP2 200170 2 12 10 24174 25 63 50 138178 1 19 18 38
CP10 200194 10 4 6 20196 9 39 31 79198 1 22 10 33200 3 3 6 12208 0 4 1 5210 3 3 5 11215 0 11 15 26219 2 5 3 10225 0 2 0 2230 0 1 1 2
a CP2 and CP3 are missing 1 pair of alleles.
Table 2. Expected and observed heterozygosity for each microsatellite locus within the 3 study populations of Terrapene ornata ornatawith no significant differences.
Expected heterozygosity Observed heterozygosity Sample size Fixation index
CP3Muscatine 9.89 11 28 �0.08Hawkeye 68.83 66 172 0.06Mallard Pools 37.98 39 94 �0.03Greencastle 30.99 27 78 �0.05
CP2Muscatine 2.85 2 28 0.01Hawkeye 43.75 42 172 0.02Mallard Pools 23.45 22 94 �0.01Greencastle 20.52 20 78 0.08
CP10Muscatine 10.74 10 28 0.00Hawkeye 66.21 30 172 0.37Mallard Pools 35.65 16 94 0.34Greencastle 30.46 14 78 0.42
6 CHELONIAN CONSERVATION AND BIOLOGY, Volume 7, Number 1 – 2008

CP2. This differentiation is not surprising given the much
greater geographic separation between these 2 localities
(Fig. 1).
We suggest 3 factors that may explain the lack of
subdivision within the Hawkeye populations (Greencastle
and Mallard Pools) despite mark–recapture data to the
contrary as well as the genetic differences between the
HWA and Muscatine populations: 1) recent colonization,
2) recent population subdivision, and 3) gene flow within
HWA that has been undetected by field studies.
Recent Colonization. — What could explain why FST
and RST analyses indicated that Muscatine and HWA were
not genetically distinct populations? One potential expla-
nation is the relatively recent colonization of ornate box
turtles in Iowa following the Wisconsinan glaciation,
which likely would result in low levels of genetic
variability (Hewitt 1996).
Fossil evidence places Terrapene south and west of
Iowa prior to the Pleistocene (Milstead 1967; Moodie and
Van Devender 1978; Dodd 2001); during the Wisconsinan
glaciation, only a small portion of central Iowa was
glaciated (Prior 1991). As the ice retreated north (approx.
14,000 years ago), wetlands, sandy plains, and prairie
vegetation replaced tundra and forests. These new niches
provided opportunities for fauna (Pielou 1991), and this
was probably the time that ornate box turtles migrated into
Iowa, initially into southern Iowa.
By the early 1800s, surveys reported that nearly 70%–
80% of Iowa was prairie, suitable habitat for T. ornata
ornata (Dinsmore 1994). Brumfiel (1919) found numerous
turtles in Johnson County which he described as the ‘‘dry
land tortoise,’’ and soil characteristics suggest that ornate
box turtles potentially could have been widely distributed
throughout the county, especially the northern third where
HWA is located. In addition, small, fragmented, remnant,
extant populations in Iowa indicate a probable wider past
distribution, especially across the southern half of the state.
However, the relatively recent time frame that box turtles
have inhabited Iowa, Illinois, and Wisconsin may not have
allowed for allopatric differentiation of the turtle popula-
Table 3. Hardy-Weinberg probability test using 3 loci indicating no significant deviation from equilibrium within the 3 studypopulations of Terrapene ornata ornata.
p value 3 loci SE 3 loci p value 2 loci SE 2 lociFixation
index
Muscatine, Mallard Pools, GreencastleCP3
Muscatine 0.9403 0.0022 0.9419 0.0024 �0.117Mallard Pools 0.3410 0.0060 0.3545 0.0060 �0.027Greencastle 0.2985 0.0050 0.3001 0.0052 0.130
CP2Muscatine 0.1114 0.0019 0.1105 0.0019 0.307Mallard Pools 0.2738 0.0022 0.2756 0.0022 0.063Greencastle 0.1628 0.0017 0.1639 0.0016 0.026
CP10Muscatine 0.0682 0.0029 0.071Mallard Pools 0.0001 0.0000 0.554Greencastle 0.0001 0.0000 0.544
Muscatine, HawkeyeCP3
Muscatine 0.9447 0.0021 0.9439 0.0023 �0.117Hawkeye 0.3541 0.0070 0.3560 0.0069 0.041
CP2Muscatine 0.1089 0.0019 0.1127 0.0020 0.307Hawkeye 0.4132 0.0026 0.4127 0.0027 0.040
CP10Muscatine 0.0657 0.0027 0.071Hawkeye 0.0001 0.0000 0.548
Mallard Pools, GreencastleCP3
Mallard Pools 0.3578 0.0058 0.3414 0.0059 �0.027Greencastle 0.3024 0.0051 0.2991 0.0049 0.130
CP2Mallard Pools 0.2727 0.0021 0.2737 0.0023 0.063Greencastle 0.1593 0.0017 0.1658 0.0018 0.026
CP10Mallard Pools 0.0001 0.0000 0.554Greencastle 0.0001 0.0000 0.544
RICHTSMEIER ET AL. — Migration, Gene Flow, and Genetic Diversity in Terrapene ornata 7

tions. Detection of allopatric differentiation may be
hindered by the relative longevity, high nest predation,
and juvenile mortality of box turtles (Dodd 2001; Bowen
et al. 2004).
However, the statistical results of the more sensitive
genotypic distribution analysis between Muscatine and
HWA indicated that the Muscatine population was
significantly different in genotypic distribution and was
isolated from the HWA. This alternative could have
resulted from a recent bottleneck of either the Muscatine or
HWA populations or, alternatively, from either a greater or
an earlier isolation of the 2 populations than outlined
above.
Population Differentiation. — In contrast to recent
colonization, the populations at HWA and Muscatine were
just beginning to differentiate, possibly resulting from
fragmentation of panmictic populations in which gene
flow was recently hindered by rivers, roads, and/or farms
(e.g., Curtin 1997).
Hunting, trapping, and the destruction of habitat led to
declines, extirpation, and extinction of many species by
the end of the 19th century (Dinsmore 1994), and habitat
destruction continues to threaten ornate box turtles today
(Iowa Department of Natural Resources 2002).
Approximately 0.12% of original Iowa prairie remains
in isolated fragments (Dinsmore 1994). Although HWA
has both natural and reconstructed prairies, the area around
HWA has been farmed for most of the last 100 years, and
turtles regularly utilize nearby agricultural fields in daily
movements and during reproduction (Bernstein and Black,
unpubl. data, 2000). However, we also noted turtle
mortality from farm machinery, and long-term farming
in an area can most likely extirpate a population.
In addition to farming, mortality on roads can create
barriers to gene flow by fragmenting populations (e.g.,
Doroff and Keith 1990). Muscatine and HWA have
increasingly been separated by roads and major highways
(Iowa Department of Transportation 1999). According to
Keller and Largiader (2003), fragmentation caused by
roads reduced gene flow and genetic variability in ground
beetles (Carabus violaceus), and Gibbs (1998) observed
restricted amphibian movements because of roads in
southern Connecticut. Anderson (1956) reported a 10-
year decline in ornate box turtles in Missouri as traffic
increased on a highway, and similar to observations on
desert tortoises (Gopherus agassizii) in California (Boar-
man et al. 1997), we have observed ornate box turtles at
HWA killed by cars.
However, given the long life span of ornate box turtles
and the short period of time that farming and roads have
been in Iowa, it seems unlikely that these modern activities
alone would be the current cause of Muscatine’s isolation.
Rivers can also be boundaries or barriers to dispersal and
gene flow, and although ornate box turtles are capable of
swimming, they are poor swimmers and less likely to cross
the several large rivers between HWA and Muscatine (Fig.
1). In addition, distance may also be a limiting factor: 3.3
km is the maximum homing distance for T. ornata noted
by Metcalf and Metcalf (1970). Although Schwartz and
Schwartz (1982) noted one Terrapene carolina triunguis(transient) that traveled 10.0 km in a straight line, crossing
highways and, after much hesitation, the Moreau River in
Missouri, Bernstein et al. (2007) documented much
smaller home ranges and movements at HWA. Therefore,
rivers and distance, in conjunction with habitat fragmen-
tation and roads, are the likely causes of any genetic
isolation between Muscatine and HWA. However, neither
of the first 2 hypotheses explains gene flow within HWA.
Gene Flow Within HWA. — If HWA is a large central
population, then no genetic differences would be found
between individuals in different locations. Radiotracking
Table 4. Genotypic linkage disequilibrium for 3 loci in the 3study populations of Terrapene ornata ornata with the onlysignificant difference between CP2 and CP10 at Mallard Poolsand Greencastle.
Locus 1 Locus 2 p value SE
Muscatine, Mallard Pools, GreencastleMuscatine CP3 CP2 0.0655 0.00130Muscatine CP3 CP10 0.1953 0.00392Muscatine CP2 CP10 0.5843 0.00293Mallard Pools CP3 CP2 0.1795 0.00409Mallard Pools CP3 CP10 0.9788 0.00242Mallard Pools CP2 CP10 0.0195 0.00172Greencastle CP3 CP2 0.2464 0.00502Greencastle CP3 CP10 0.5589 0.00938Greencastle CP2 CP10 0.0199 0.00182
Muscatine, HawkeyeMuscatine CP3 CP2 0.0655 0.00130Muscatine CP3 CP10 0.1916 0.00411Muscatine CP2 CP10 0.5883 0.00297Hawkeye CP3 CP2 0.2172 0.00555Hawkeye CP3 CP10 0.9686 0.00351Hawkeye CP2 CP10 0.0739 0.00429
Mallard Pools, GreencastleMallard Pools CP3 CP2 0.1856 0.00434Mallard Pools CP3 CP10 0.9749 0.00287Mallard Pools CP2 CP10 0.0203 0.00178Greencastle CP3 CP2 0.2502 0.00516Greencastle CP3 CP10 0.5669 0.00946Greencastle CP2 CP10 0.0205 0.00199
Table 5. Genotypic differentiation for 2 loci for the 3 studypopulations of Terrapene ornata ornata indicating no significantdifferences.
Locus 1 Locus 2 p value SE
Muscatine, Mallard Pools, GreencastleMuscatine CP3 CP2 0.0645 0.00131Mallard Pools CP3 CP2 0.1936 0.00432Greencastle CP3 CP2 0.2565 0.00507
Muscatine, HawkeyeMuscatine CP3 CP2 0.0662 0.00130Hawkeye CP3 CP2 0.2087 0.00533
Mallard Pools, GreencastleMallard Pools CP3 CP2 0.1841 0.00421Greencastle CP3 CP2 0.2461 0.00500
8 CHELONIAN CONSERVATION AND BIOLOGY, Volume 7, Number 1 – 2008

and mark–recapture studies may not detect migrants and
transients between the subpopulations, and gene flow
could be maintained by matings between individuals
within the subpopulations and transients (Kiester et al.
1982) and/or consecutive matings across overlapping
home ranges between Mallard Pools and Greencastle.
The latter conclusion is supported by the knowledge of
unmarked turtles found between the 2 subpopulations
(Bernstein and Black, unpubl. data, 2000) along with
evidence of home ranges that both overlap between
individuals and span multiple habitats (Bernstein et al.
2007). These data suggest a larger, panmictic population
of ornate box turtles outside of our study areas at HWA, a
conclusion supported by observations and reports of ornate
box turtles outside of Mallard Pools and Greencastle.
Also, similarities in allelic distribution may be due to
the age of the turtles as blood was collected from 15–30-
year-old adults. Furthermore, because each area has
abundant resources as well as nesting and overwintering
sites, long-range movements between sites may not occur.
However, the distinct alleles found in the 3 turtles at
the Mallard Pools (1 turtle with allele 145 at CP3 and 2
turtles with allele 225 at CP10), may indicate only slight
contact with the Greencastle site. Newman and Squire
(2001) suggested that subtle differentiation between wood
frogs (Rana sylvatica), separated by small distances of a
few kilometers, indicated that the populations acted as a
metapopulation with only slight interactions. Thus, Mallard
Pools and Greencastle could drift to fixation for 1 of the 2
new alleles if there is only slight contact between the sites.
Extreme weather events can also affect ornate box
turtle home ranges and may bring ornate box turtles
together at HWA. In 1993, much of the Greencastle
subpopulation was isolated onto high points as floodwaters
inundated the area, a situation partially repeated in spring
2005. In contrast, we also noted extensive movements
between wetlands during a drought period, and these
atypical dispersions are similar to the hypothesis of Rowe
et al. (2000) that Natterjack toads (Bufo calamita) may
Table 6. Results of genotypic distribution analysis for the 3 studypopulations of Terrapene ornata ornata. Significant p valuesindicate population differentiation.
Population pair
2 loci
p value SE
Muscatine, Mallard Pools, GreencastleMuscatine, Mallard Pools
CP3 0.2016 0.0026CP2 0.0437 0.0001
Muscatine, GreencastleCP3 0.0474 0.0012CP2 0.0348 0.0009
Mallard Pools, GreencastleCP3 0.6340 0.0035CP2 0.9239 0.0008
Muscatine, HawkeyeCP3 0.0914 0.0021CP2 0.0244 0.0009
Mallard Pools, GreencastleCP3 0.6350 0.0035CP2 0.9249 0.0009
Table 7. FST and RST statistics for the 3 study populations of Terrapene ornata ornata indicating no significant differences. FST wasgenerated by Genepop, RST by FSTAT, and the last 2 columns of RST by SPAGeDI.
FST, RST statistics for each microsatellite locus
FST RST
3 Loci 2 Loci 3 Loci 2 Loci 3 Loci 2 Loci
Genepop Genepop FSTAT FSTAT SPAGeDI SPAGeDI
Muscatine, Mallard Pools, GreencastleCP3 0.0162 0.0162 �0.012 �0.005CP2 0.0205 0.0205 �0.004 �0.004CP10 0.0233 0.012All 2 loci 0.0178 �0.0003All 3 loci 0.0199 �0.0120
Muscatine, HawkeyeCP3 0.0469 0.0469 �0.014 �0.014CP2 0.0686 0.0686 0.005 0.006CP10 0.0618 0.055All 2 loci 0.0553 0.0036All 3 loci 0.0578 0.0167
Mallard Pools, GreencastleCP3 �0.0044 �0.0044 �0.01 �0.01 �0.0124 �0.0124CP2 �0.0108 �0.0108 �0.01 �0.01 �0.0081 �0.0081CP10 �0.0035 �0.016 �0.0157All 2 loci �0.0069 �0.0098 �0.0121All 3 loci �0.0057 �0.0127 �0.0140
RICHTSMEIER ET AL. — Migration, Gene Flow, and Genetic Diversity in Terrapene ornata 9

cross areas at low tide and maintain gene flow. However, it
is unclear if any of these weather-induced dispersal events
affected mating patterns of ornate box turtles at HWA.
Therefore, these data can possibly be explained by
using all 3 hypotheses. The recent glaciations may not
have allowed HWA and Muscatine populations to
significantly differentiate; although, the process of sepa-
ration may have begun due to natural barriers and
fragmentation of landscapes by human activity. Finally,
the high degree of gene flow within HWA was indicative
of one central panmictic population.
Future Research and Management Implications. —Analysis of more microsatellite loci might reveal a clearer
picture of gene flow because the null allele plus the nearly
monomorphic CP2 allele could have affected results, and
CP3 showed polymorphism. In addition, specific primers
for ornate box turtles might eliminate the problems of the
null allele. An alternative for future study would be to
examine mitochondrial DNA (mtDNA) markers to deter-
mine mating patterns within the HWA (Balloux et al.
2000; Johnson et al. 2003; Bouzat and Johnson 2004).
Of course, more study using microsatellites or mtDNA
may only confirm that turtles from the 2 sites at HWA are
currently part of a single panmictic population with gene
flow within a large, dispersed population. The population
at HWA appears to extend beyond the boundaries of the
studied sites, and gene flow within this large population
may promote genetic diversity and long-term stability
under current conditions (Kuo and Janzen 2004, 2007).
However, as Dodd et al. (1994) and Bowen et al. (2004)
recommended for box turtles in other locations, we
recommend that all efforts be made to provide continuous
habitat throughout the range of the ornate box turtles at
HWA to prevent edge effects and the mortality that results.
Additionally, the turtles should remain protected from
collection and other unnatural causes of mortality.
ACKNOWLEDGMENTS
D. Richtsmeier, S.L. O’Kane, Jr., T.A. Spradling, and
J.W. Tamplin provided advice, technical assistance, and
encouragement throughout the project, and an anonymous
reviewer provided helpful comments. The Monsanto
Company, MidAmerican Energy, and the Iowa Depart-
ment of Natural Resources (IDNR) allowed access to
turtles for blood collection, and the project was funded by
a GRASP award through the University of Northern Iowa.
Funding was also received by the Mount Mercy College
Department of Biology and Faculty Development Pro-
gram, the Cornell College Department of Biology, the
Associated Colleges of the Midwest, the Iowa College
Foundation of the R. J. McElroy Trust, the Iowa Wildlife
Diversity program of the IDNR, R. Rhodes II, and the
Iowa Natural History Association. We thank them all. This
research was carried out under a State of Iowa Scientific
Collector Permit, SC95, to N.P. Bernstein.
LITERATURE CITED
ANDERSON, P. 1965. The Reptiles of Missouri. Columbia, MO:
University of Missouri Press, 330 pp.
BALLOUX, F., BRUNNER, H., LUGON-MOULIN, N., HAUSSER, J., AND
GOUDET, J. 2000. Microsatellites can be misleading: an
empirical and simulation study. Evolution 54:1412–1422.
BENHAM, J.J. 2001. Genographer, version 1.6.0.http://hordeum.
oscs.montana.edu/genographer (01 November 2001).
BERNSTEIN, N.P. AND BLACK, R.W. 2005. Thermal environment of
overwintering ornate box turtles, Terrapene ornata ornata, in
Iowa. American Midland Naturalist 153:370–377.
BERNSTEIN, N.P., RICHTSMEIER, R.J, BLACK, R.W., AND MONTGOM-
ERY, B.R. 2007. Home range and philopatry in the ornate box
turtle, Terrapene ornata ornata. American Midland Naturalist
157:162–174.
BOARMAN, W.I., SAZAKI, M., AND JENNINGS, W.B. 1997. The effect
of roads, barrier fences, and culverts on desert tortoise
populations in California, USA. In: Abbema, J. Van (Ed.).
Proceedings: Conservation, Restoration, and Management of
Tortoises and Turtles—An International Conference. New
York: New York Turtle and Tortoise Society, pp. 54–58.
BOUZAT, J.L. AND JOHNSON, K. 2004. Genetic structure among
closely spaced leks in a peripheral population of lesser prairie-
chickens. Molecular Ecology 13:499–505.
BOWEN, K.D., COLBERT, P.L., AND JANZEN, F.J. 2004. Survival and
recruitment in a human-impacted population of ornate box
turtles, Terrapene ornata, with recommendations for conser-
vation and management. Journal of Herpetology 38:562–568.
BRUMFIEL, D.M. 1919. The Animal Ecology of Johnson County.
Iowa City, IA: University of Iowa Press, 37 pp.
CAGLE, F.R. 1939. A system of marking turtles for future
identification. Copeia 1939:170–173.
CONANT, R. AND COLLINS, J. 1991. Reptiles and Amphibians:
Eastern/Central North America. Boston: Houghton Mifflin Co.,
450 pp.
CURTIN, C.G. 1997. Biophysical analysis of the impact of shifting
land use on ornate box turtles, Wisconsin, USA. In: Abbema, J.
Van (Ed.). Proceedings: Conservation, Restoration, and
Management of Tortoises and Turtles—An International
Conference. New York: New York Turtle and Tortoise Society,
pp. 31–36.
DINSMORE, J.J. 1994. A Country so Full of Game: The Story of
Wildlife in Iowa. Iowa City, IA: University of Iowa Press, 261
pp.
DODD, C.K., JR. 2001. North American Box Turtles: A Natural
History. Norman, OK: University of Oklahoma Press, 231 pp.
DODD, C.K., JR., FRANZ, R, AND JOHNSON, S.A. 1994. Activity
patterns and habitat use of box turtles (Terrapene carolinabauri) on a Florida island, with recommendations for
management. Chelonian Conservation and Biology 1:97–106.
DOROFF, A.M. AND KEITH, L.B. 1990. Demography and ecology of
an ornate box turtle (Terrapene ornata) population in south-
central Wisconsin. Copeia 1990:387–399.
GIBBS, J.P. 1998. Amphibian movements in response to forest
edges, roads, and streams in southern New England. Journal of
Wildlife Management 62:584–589.
GIBBONS, J.W., SCOTT, D.E., RYAN, T.J., BUHLMANN, K.A.,
TUBERVILLE, T.D., METTS, B.S., GREENE, J.L., MILLS, T., LEIDEN,
Y., POPPY, S., AND WINNE, C. 2000. The global decline of
reptiles, deja vu amphibians. BioScience 50:653 – 666.
GOUDET, J. 1995. Fstat version 1.2: a computer program to
calculate F-statistics. Journal of Heredity 86:485 – 486.
GUO, S.W. AND THOMPSON, E.A. 1992. Performing the exact test of
10 CHELONIAN CONSERVATION AND BIOLOGY, Volume 7, Number 1 – 2008

Hardy-Weinberg proportions for multiple alleles. Biometrics48:361–372.
HARDY, O.J. AND VEKEMANS, X. 2002. SPAGeDI : a versatilecomputer program to analyze spatial genetic structure at theindividual or population levels. Molecular Ecology Notes 2:616 – 620.
HEWITT, G.M. 1996. Some genetic consequences of ice ages, a rolein divergence and speciation. Biological Journal of theLinnaean Society 58:247–276.
HILLIS, D.M., LARSON, A., DAVIS, S.K., AND ZIMMER, E.A. 1990.Nucleic acids III: sequencing. In: Hillis, D.M. and Moritz, C.(Eds.). Molecular Systematics. Sunderland, MA: SinauerAssociates, Inc., pp. 318–370.
IOWA DEPARTMENT OF NATURAL RESOURCES. 2002. Endangered andthreatened plant and animal species. Iowa Administrative Code[571] Chapter 77, p 3. www.iowadnr.com/other/files/chapter77.pdf (10 January 2006).
IOWA DEPARTMENT OF TRANSPORTATION. 1999. Discovering historicIowa transportation milestones. www.dot.state.ia.us/histbook.pdf (15 December 2004).
JOHNSON, J.A., TOEPFER, J.E., AND DUNN, P.O. 2003. Contrastingpatterns of mitochondrial and microsatellite population struc-ture in fragmented populations of greater prairie-chickens.Molecular Ecology 12:3335–3347.
KELLER, I. AND LARGIADER, C.R. 2003. Recent habitat fragmenta-tion caused by major roads leads to reduction of gene flow andloss of genetic variability in ground beetles. Proceedings of theRoyal Society of London B 270:417– 423.
KIESTER, A.R., SCHWARTZ, C.W., AND SCHWARTZ, E.R. 1982.Promotion of gene flow by transient individuals in an otherwisesedentary population of box turtles (Terrapene carolinatriunguis). Evolution 36:617– 619.
KUO, C.-H. AND JANZEN, F.J. 2004. Genetic effects of a persistentbottleneck on a natural population of ornate box turtles(Terrapene ornata). Conservation Genetics 5:425 – 437.
KUO, C.-H. AND JANZEN, F.J. 2007. Linnaeus Fund research report:longevity, overlapping generations, and conservation of turtlepopulations. Turtle and Tortoise Newsletter, Issue 11:18–23.
LANNOO, M. (ED.) 2005. Amphibian Declines. Berkeley: Univer-sity of California Press, 1094 pp.
LEVINS, R. 1969. Some demographic and genetic consequences ofenvironmental heterogeneity for biological control. Bulletin ofthe Entomological Society of America 15:237–240.
LIDICKER, W.Z., JR. AND KOENIG, W.D. 1996. Responses ofterrestrial vertebrates to habitat edges and corridors. In:McCullough, D.R. (Ed.). Metapopulation and Wildlife Con-servation. Washington, DC: Island Press, pp. 85–109.
METCALF, E. AND METCALF, A.L. 1970. Observations on ornate boxturtles (Terrapene ornata ornata Agissiz). Transactions of theKansas Academy of Science 73:96–117.
MILSTEAD, W.W. 1967. Fossil box turtles (Terrapene) from centralNorth America, and box turtles of eastern Mexico. Copeia1967:168–179.
MOCKFORD, S.W, HERMAN, T.B., SNYDER, M., AND WRIGHT, J.M.
2007. Conservation genetics of Blanding’s turtle and its
application in the identification of evolutionarily significant
units. Conservation Genetics 8:209–219.
MOODIE, K.B. AND VAN DEVENDER, T.R. 1978. Fossil box turtles
(genus Terrapene) from southern Arizona. Herpetologica 34:
172–174.
NEWMAN, R.A. AND SQUIRE, T. 2001. Microsatellite variation and
fine-scale population structure in the wood frog (Ranasylvatica). Molecular Ecology 10:1087–1100.
PEARSE, D.E., JANZEN, F. J., AND AVISE, J.C. 2001. Genetic markers
substantiate long term storage and utilization of sperm by
female painted turtles. Heredity 86:378–384.
PIELOU, E.C. 1991. After the ice age. Chicago: The University of
Chicago Press, 366 pp.
PRIMMER, C.R., MOLLER, A.P, AND ELLEGREN, H. 1996. A wide-
range survey of cross-species microsatellite amplification in
birds. Molecular Ecology 5:365–378.
PRIOR, J.C. 1991. Landforms of Iowa. Iowa City, IA: University of
Iowa Press, 153 pp.
RAYMOND, M. AND ROUSSET, F. 1995. GENEPOP (version 1.2):
population genetics software for exact tests and ecumenicism.
Journal of Heredity 86:248–249.
ROWE, G., BEEBEE, T.J.C., AND BURKE, T. 2000. A microsatellite
analysis of Natterjack toad, Bufo calamita, metapopulations.
Oikos 88:641–651.
RUBIN, C.S., WARNER, R.E., BOUZAT, J.L., AND PAIGE, K.N. 2001.
Population genetic structure of Blanding’s turtles (Emydoideablandingii) in an urban landscape. Biological Conservation 99:
323–330.
SCHWARTZ, C.W. AND SCHWARTZ, E.R. 1982. Promotion of gene
flow by transient individuals in an otherwise sedentary
population of box turtles (Terrapene carolina triunguis).
Evolution 36:617–619.
SEUTIN, G., WHITE, B.N., AND BOAG, P.T. 1991. Preservation of
avian blood and tissue samples for DNA analysis. Canadian
Journal of Zoology 69:82–90.
SWARTH, C. AND HAGOOD, S. 2005. Summary of the eastern box
turtle regional conservation workshop. Appendix B. Wash-
ington, DC: The Humane Society of the United States, 32 pp.
WALSH, P.S., METZGER, D.A., AND HIGUCHI, R. 1991. Chelex 100
as a medium for simple extraction of DNA for PCR-based
typing from forensic material. Biotechniques 10:506–513.
WEINS, J.A. 1997. The emerging role of patchiness in conservation
biology. In: Pickett, S.T.A., Ostfeld, R.S., Shachak, M., and
Likens, G.E. The Ecological Basis of Conservation. New
York: Chapman and Hall, pp. 93–107.
WEIR, B.S. AND COCKERHAM, C.C. 1984. Estimating F-statistics for
the analysis of population structure. Evolution 38:1358–1370.
Received: 11 February 2006
Revised and Accepted: 21 April 2007
RICHTSMEIER ET AL. — Migration, Gene Flow, and Genetic Diversity in Terrapene ornata 11


![In - Rockefeller Wildlife Refuge - Home€¦ · Meylan [ed.], Biology and Conservation of Florida Turtles, pp. 313-324. Chelonian Research Monographs No.3), aquatic inver-tebrates,](https://static.fdocuments.us/doc/165x107/5edac51ffa3b3a5ad21692d8/in-rockefeller-wildlife-refuge-home-meylan-ed-biology-and-conservation-of.jpg)