Articles Changes in health in England, with analysis by ... · Changes in health in England, with...
18
Articles www.thelancet.com Published online September 15, 2015 http://dx.doi.org/10.1016/S0140-6736(15)00195-6 1 Changes in health in England, with analysis by English regions and areas of deprivation, 1990–2013: a systematic analysis for the Global Burden of Disease Study 2013 John N Newton†, Adam D M Briggs, Christopher J L Murray, Daniel Dicker, Kyle J Foreman, Haidong Wang, Mohsen Naghavi, Mohammad H Forouzanfar, Summer Lockett Ohno, Ryan M Barber, Theo Vos, Jeffrey D Stanaway, Jürgen C Schmidt, Andrew J Hughes, Derek F J Fay, Russell Ecob, Charis Gresser, Martin McKee, Harry Rutter, Ibrahim Abubakar*, Raghib Ali*, H Ross Anderson*, Amitava Banerjee*, Derrick A Bennett*, Eduardo Bernabé*, Kamaldeep S Bhui*, Stanley M Biryukov*, Rupert R Bourne*, Carol E G Brayne*, Nigel G Bruce*, Traolach S Brugha*, Michael Burch*, Simon Capewell*, Daniel Casey*, Rajiv Chowdhury*, Matthew M Coates*, Cyrus Cooper*, Julia A Critchley*, Paul I Dargan*, Mukesh K Dherani*, Paul Elliott*, Majid Ezzati*, Kevin A Fenton*, Maya S Fraser*, Thomas Fürst*, Felix Greaves*, Mark A Green*, David J Gunnell*, Bernadette M Hannigan*, Roderick J Hay*, Simon I Hay*, Harry Hemingway*, Heidi J Larson*, Katharine J Looker*, Raimundas Lunevicius*, Ronan A Lyons*, Wagner Marcenes*, Amanda J Mason-Jones*, Fiona E Matthews*, Henrik Moller*, Michele E Murdoch*, Charles R Newton*, Neil Pearce*, Frédéric B Piel*, Daniel Pope*, Kazem Rahimi*, Alina Rodriguez*, Peter Scarborough*, Austin E Schumacher*, Ivy Shiue*, Liam Smeeth*, Alison Tedstone*, Jonathan Valabhji*, Hywel C Williams*, Charles D A Wolfe*, Anthony D Woolf*, Adrian C J Davis Summary Background In the Global Burden of Disease Study 2013 (GBD 2013), knowledge about health and its determinants has been integrated into a comparable framework to inform health policy. Outputs of this analysis are relevant to current policy questions in England and elsewhere, particularly on health inequalities. We use GBD 2013 data on mortality and causes of death, and disease and injury incidence and prevalence to analyse the burden of disease and injury in England as a whole, in English regions, and within each English region by deprivation quintile. We also assess disease and injury burden in England attributable to potentially preventable risk factors. England and the English regions are compared with the remaining constituent countries of the UK and with comparable countries in the European Union (EU) and beyond. Methods We extracted data from the GBD 2013 to compare mortality, causes of death, years of life lost (YLLs), years lived with a disability (YLDs), and disability-adjusted life-years (DALYs) in England, the UK, and 18 other countries (the first 15 EU members [apart from the UK] and Australia, Canada, Norway, and the USA [EU15+]). We extended elements of the analysis to English regions, and subregional areas defined by deprivation quintile (deprivation areas). We used data split by the nine English regions (corresponding to the European boundaries of the Nomenclature for Territorial Statistics level 1 [NUTS 1] regions), and by quintile groups within each English region according to deprivation, thereby making 45 regional deprivation areas. Deprivation quintiles were defined by area of residence ranked at national level by Index of Multiple Deprivation score, 2010. Burden due to various risk factors is described for England using new GBD methodology to estimate independent and overlapping attributable risk for five tiers of behavioural, metabolic, and environmental risk factors. We present results for 306 causes and 2337 sequelae, and 79 risks or risk clusters. Findings Between 1990 and 2013, life expectancy from birth in England increased by 5·4 years (95% uncertainty interval 5·0–5·8) from 75·9 years (75·9–76·0) to 81·3 years (80·9–81·7); gains were greater for men than for women. Rates of age-standardised YLLs reduced by 41·1% (38·3–43·6), whereas DALYs were reduced by 23·8% (20·9–27·1), and YLDs by 1·4% (0·1–2·8). For these measures, England ranked better than the UK and the EU15+ means. Between 1990 and 2013, the range in life expectancy among 45 regional deprivation areas remained 8·2 years for men and decreased from 7·2 years in 1990 to 6·9 years in 2013 for women. In 2013, the leading cause of YLLs was ischaemic heart disease, and the leading cause of DALYs was low back and neck pain. Known risk factors accounted for 39·6% (37·7–41·7) of DALYs; leading behavioural risk factors were suboptimal diet (10·8% [9·1–12·7]) and tobacco (10·7% [9·4–12·0]). Interpretation Health in England is improving although substantial opportunities exist for further reductions in the burden of preventable disease. The gap in mortality rates between men and women has reduced, but marked health inequalities between the least deprived and most deprived areas remain. Declines in mortality have not been matched by similar declines in morbidity, resulting in people living longer with diseases. Health policies must therefore address the causes of ill health as well as those of premature mortality. Systematic action locally and nationally is needed to reduce risk exposures, support healthy behaviours, alleviate the severity of chronic disabling disorders, and mitigate the effects of socioeconomic deprivation. Funding Bill & Melinda Gates Foundation and Public Health England. Copyright © Newton et al. Open Access article distributed under the terms of CC BY. Published Online September 15, 2015 http://dx.doi.org/10.1016/ S0140-6736(15)00195-6 See Online/Comment http://dx.doi.org/10.1016/ S0140-6736(15)00196-8 *Authors listed alphabetically †Corresponding author Public Health England, London, UK (Prof I Abubakar FRCP, Prof A C J Davis PhD, R Ecob MSc, D F J Fay MSc, K A Fenton MD, F Greaves PhD, C Gresser MSc, B M Hannigan PhD, A J Hughes MSc, Prof J N Newton FRCP, J C Schmidt Dott Med, A Tedstone PhD); London School of Economics, London, UK (Prof A C J Davis); Institute for Health Metrics and Evaluation, Seattle, WA, USA (Prof S I Hay DSc, H J Larson PhD, Prof C J L Murray DPhil, D Dicker BS, K J Foreman MPH, H Wang PhD, M Naghavi PhD, M H Forouzanfar PhD, S Lockett Ohno BA, R M Barber BS, T Vos PhD, J D Stanaway PhD, A E Schumacher BS, M S Fraser BA, M M Coates BS, S M Biryukov BS, D Casey BA); University of Manchester, Manchester, UK (Prof J N Newton); Centre for Infectious Disease Epidemiology and MRC Clinical Trials Unit, London, UK (Prof I Abubakar); INDOX Cancer Research Network, Oxford, UK (R Ali FRCP); John Radcliffe Hospital, Oxford, UK (R Ali); Green-Templeton College, University of Oxford, Oxford, UK (R Ali); Population Health
Transcript of Articles Changes in health in England, with analysis by ... · Changes in health in England, with...

Articles
www.thelancet.com Published online September 15, 2015 http://dx.doi.org/10.1016/S0140-6736(15)00195-6 1
Changes in health in England, with analysis by English regions and areas of deprivation, 1990–2013: a systematic analysis for the Global Burden of Disease Study 2013John N Newton†, Adam D M Briggs, Christopher J L Murray, Daniel Dicker, Kyle J Foreman, Haidong Wang, Mohsen Naghavi, Mohammad H Forouzanfar, Summer Lockett Ohno, Ryan M Barber, Theo Vos, Jeffrey D Stanaway, Jürgen C Schmidt, Andrew J Hughes, Derek F J Fay, Russell Ecob, Charis Gresser, Martin McKee, Harry Rutter, Ibrahim Abubakar*, Raghib Ali*, H Ross Anderson*, Amitava Banerjee*, Derrick A Bennett*, Eduardo Bernabé*, Kamaldeep S Bhui*, Stanley M Biryukov*, Rupert R Bourne*, Carol E G Brayne*, Nigel G Bruce*, Traolach S Brugha*, Michael Burch*, Simon Capewell*, Daniel Casey*, Rajiv Chowdhury*, Matthew M Coates*, Cyrus Cooper*, Julia A Critchley*, Paul I Dargan*, Mukesh K Dherani*, Paul Elliott*, Majid Ezzati*, Kevin A Fenton*, Maya S Fraser*, Thomas Fürst*, Felix Greaves*, Mark A Green*, David J Gunnell*, Bernadette M Hannigan*, Roderick J Hay*, Simon I Hay*, Harry Hemingway*, Heidi J Larson*, Katharine J Looker*, Raimundas Lunevicius*, Ronan A Lyons*, Wagner Marcenes*, Amanda J Mason-Jones*, Fiona E Matthews*, Henrik Moller*, Michele E Murdoch*, Charles R Newton*, Neil Pearce*, Frédéric B Piel*, Daniel Pope*, Kazem Rahimi*, Alina Rodriguez*, Peter Scarborough*, Austin E Schumacher*, Ivy Shiue*, Liam Smeeth*, Alison Tedstone*, Jonathan Valabhji*, Hywel C Williams*, Charles D A Wolfe*, Anthony D Woolf*, Adrian C J Davis
SummaryBackground In the Global Burden of Disease Study 2013 (GBD 2013), knowledge about health and its determinants has been integrated into a comparable framework to inform health policy. Outputs of this analysis are relevant to current policy questions in England and elsewhere, particularly on health inequalities. We use GBD 2013 data on mortality and causes of death, and disease and injury incidence and prevalence to analyse the burden of disease and injury in England as a whole, in English regions, and within each English region by deprivation quintile. We also assess disease and injury burden in England attributable to potentially preventable risk factors. England and the English regions are compared with the remaining constituent countries of the UK and with comparable countries in the European Union (EU) and beyond.
Methods We extracted data from the GBD 2013 to compare mortality, causes of death, years of life lost (YLLs), years lived with a disability (YLDs), and disability-adjusted life-years (DALYs) in England, the UK, and 18 other countries (the first 15 EU members [apart from the UK] and Australia, Canada, Norway, and the USA [EU15+]). We extended elements of the analysis to English regions, and subregional areas defined by deprivation quintile (deprivation areas). We used data split by the nine English regions (corresponding to the European boundaries of the Nomenclature for Territorial Statistics level 1 [NUTS 1] regions), and by quintile groups within each English region according to deprivation, thereby making 45 regional deprivation areas. Deprivation quintiles were defined by area of residence ranked at national level by Index of Multiple Deprivation score, 2010. Burden due to various risk factors is described for England using new GBD methodology to estimate independent and overlapping attributable risk for five tiers of behavioural, metabolic, and environmental risk factors. We present results for 306 causes and 2337 sequelae, and 79 risks or risk clusters.
Findings Between 1990 and 2013, life expectancy from birth in England increased by 5·4 years (95% uncertainty interval 5·0–5·8) from 75·9 years (75·9–76·0) to 81·3 years (80·9–81·7); gains were greater for men than for women. Rates of age-standardised YLLs reduced by 41·1% (38·3–43·6), whereas DALYs were reduced by 23·8% (20·9–27·1), and YLDs by 1·4% (0·1–2·8). For these measures, England ranked better than the UK and the EU15+ means. Between 1990 and 2013, the range in life expectancy among 45 regional deprivation areas remained 8·2 years for men and decreased from 7·2 years in 1990 to 6·9 years in 2013 for women. In 2013, the leading cause of YLLs was ischaemic heart disease, and the leading cause of DALYs was low back and neck pain. Known risk factors accounted for 39·6% (37·7–41·7) of DALYs; leading behavioural risk factors were suboptimal diet (10·8% [9·1–12·7]) and tobacco (10·7% [9·4–12·0]).
Interpretation Health in England is improving although substantial opportunities exist for further reductions in the burden of preventable disease. The gap in mortality rates between men and women has reduced, but marked health inequalities between the least deprived and most deprived areas remain. Declines in mortality have not been matched by similar declines in morbidity, resulting in people living longer with diseases. Health policies must therefore address the causes of ill health as well as those of premature mortality. Systematic action locally and nationally is needed to reduce risk exposures, support healthy behaviours, alleviate the severity of chronic disabling disorders, and mitigate the effects of socioeconomic deprivation.
Funding Bill & Melinda Gates Foundation and Public Health England.
Copyright © Newton et al. Open Access article distributed under the terms of CC BY.
Published Online September 15, 2015 http://dx.doi.org/10.1016/S0140-6736(15)00195-6
See Online/Comment http://dx.doi.org/10.1016/S0140-6736(15)00196-8
*Authors listed alphabetically
†Corresponding author
Public Health England, London, UK (Prof I Abubakar FRCP, Prof A C J Davis PhD, R Ecob MSc, D F J Fay MSc, K A Fenton MD, F Greaves PhD, C Gresser MSc, B M Hannigan PhD, A J Hughes MSc, Prof J N Newton FRCP, J C Schmidt Dott Med, A Tedstone PhD); London School of Economics, London, UK (Prof A C J Davis); Institute for Health Metrics and Evaluation, Seattle, WA, USA (Prof S I Hay DSc, H J Larson PhD, Prof C J L Murray DPhil, D Dicker BS, K J Foreman MPH, H Wang PhD, M Naghavi PhD, M H Forouzanfar PhD, S Lockett Ohno BA, R M Barber BS, T Vos PhD, J D Stanaway PhD, A E Schumacher BS, M S Fraser BA, M M Coates BS, S M Biryukov BS, D Casey BA); University of Manchester, Manchester, UK (Prof J N Newton); Centre for Infectious Disease Epidemiology and MRC Clinical Trials Unit, London, UK (Prof I Abubakar); INDOX Cancer Research Network, Oxford, UK (R Ali FRCP); John Radcliffe Hospital, Oxford, UK (R Ali); Green-Templeton College, University of Oxford, Oxford, UK (R Ali); Population Health

Articles
2 www.thelancet.com Published online September 15, 2015 http://dx.doi.org/10.1016/S0140-6736(15)00195-6
Research Institute, Hamilton, ON, Canada
(Prof H R Anderson MD); MRC-PHE Centre for
Environment and Health, London, UK (Prof H R Anderson);
St George’s, University of London, London, UK
(Prof H R Anderson, Prof J A Critchley DPhil);
University of Birmingham, Birmingham, UK
(A Banerjee DPhil); Clinical Trials Service Unit and
Epidemiological Studies Unit, Nuffield Department of
Population Health, University of Oxford, Oxford, UK
(D A Bennett PhD); King’s College London Dental
Institute, London, UK (E Bernabé PhD); Wolfson
Institute of Preventive Medicine, Barts & The London
School of Medicine, Queen Mary University of London,
London, UK (Prof K S Bhui FRCPsych); Vision
& Eye Research Unit, Anglia Ruskin University, Cambridge,
UK (Prof R R Bourne FRCOphth); Cambridge Institute of Public
Health, University of Cambridge, Cambridge, UK
(Prof C E G Brayne MD, F E Matthews PhD); University
of Oxford, Oxford, UK (A D M Briggs MRCP,
C R Newton MD, F B Piel PhD); University of Liverpool,
Liverpool, UK (N G Bruce PhD, M K Dherani PhD,
R Lunevicius MD, D Pope PhD, Prof S Capewell DSC); University
of Leicester, Leicester, UK (Prof T S Brugha MD); Great
Ormond Street Hospital for Children, London, UK
(M Burch MD); University of Cambridge, Cambridge, UK
(R Chowdhury PhD); MRC Lifecourse Epidemiology Unit,
University of Southampton, Southhampton, UK
(Prof C Cooper FMedSci); Guy’s and St Thomas’ NHS
Foundation Trust, London, UK (P I Dargan FRCP); University College London, London, UK
(Prof A C J Davis, Prof H Hemingway FRCP);
Department of Epidemiology and Biostatistics, MRC-PHE
Centre for Environment and Health, Imperial College
London, London, UK (Prof P Elliott PhD,
Prof A Rodriguez PhD); MRC-PHE Centre for Population Health, School of Public Health,
Imperial College London,
IntroductionThe Global Burden of Disease (GBD) project is a worldwide exercise to integrate the widest possible range of reliable knowledge about health and its determinants into a universal health framework. Outputs allow meaning ful comparisons between countries and over time, and quantify the contributions of different diseases and risk factors to overall burden.
Investigators of a previous GBD study1 used data from 2010 to compare the UK with a group of other countries. The new analysis reported here uses data from 1990 through 2013 and focuses on England. Responsibility for health and public health has been devolved to the constituent countries of the UK (England, Scotland, Wales, and Northern Ireland) since 1998,2 so this geographical level of analysis is most meaningful. We compare England and the English regions with the remaining constituent countries of the UK, and with comparable countries in the European Union (EU) and beyond. This study comes at a time when both national and local health-policy makers are reviewing and reassessing priorities for action in the light of financial pressures. The potential for prevention and public health to secure improved population health and reduce demand on England’s National Health Service (NHS) has also received further attention recently.3
The Global Burden of Diseases, Injuries, and Risk Factors Study 2013 (GBD 2013) provides both improve ments in data and advances in methodology compared with previous versions of the GBD.4–7 These advances include a greatly
improved approach to identification of the contribution of various risk factors and combinations of risks, as explained in the Methods and reported in detail elsewhere,6 as well as updates to many data sources.
The subnational analysis reported here, based on English regions and areas within them that have differing levels of deprivation, makes it possible to map disease burden according to socioeconomic deter minants of health. This report therefore not only uses an improved approach but also extends the scope of earlier work and increases its relevance to policy makers in several ways.
MethodsOverviewHere we use data from the GBD 2013 study of causes of death, disease, and injury incidence and prevalence as well as years lived with disability (YLDs) to analyse the burden of diseases and injuries in England by English region and, within each English region by deprivation quintile (defined nationally). The methods employed in the GBD 2013, including the systematic approach to collating cause of death from different countries, the mapping across different revisions and national variants of the International Classification of Diseases and Injuries (ICD), redistribution of deaths assigned to so-called garbage codes, and the cause of death modelling approach used for each cause, have been described in detail elsewhere.4 The GBD 2013 Collaborators5 describe the data and methods used to
Research in context
Evidence before this studyResponsibility for health and public health has been devolved to the constituent countries of the UK since 1998, but no single accessible source describing disease burden by cause in England exists. A published estimate of burden of disease for the UK, using GBD 2010 data and methodology, has been widely used by policy makers but has limitations and needs updating. Routine mortality statistics show progressive improvements in life expectancy, but inequalities persist between countries in the UK and regions within England. Routine measures of morbidity are not reported in a way that allow direct comparisons of burden between causes at a national or regional level. Attributable risks have been calculated for some causes (eg, smoking and air pollution) and for some disorders (eg, cancers) but are not available in a comprehensive framework covering multiple risks and diseases. Relevant literature reviews were undertaken to inform components of the GBD analysis in particular on the relation between risk factors and outcomes.
Added value of this studyThe GBD 2013 analysis of causes of death, disease, and injury incidence and prevalence, YLDs, and risk factors is a major update and improvement in the evidence base underlying the quantification of comparable disease and risk factor estimates compared with the most recent GBD analyses in 2010. For the
first time, GBD results for England are quantified at the national and subnational level (at the level of nine English regions) and by IMD-2010 deprivation quintile using a range of routine and published data sources.
ImplicationsQuantification of the continuing burden of preventable ill health in England more than justifies recent calls for a “radical upgrade in prevention and public health”. A huge opportunity exists for preventive public health: if levels of health in the worst performing regions in England matched the best performing ones, England would have one of the lowest burdens of disease of any advanced industrialised country. The scale of the increasing level of disability suggests the need for new, more integrated models of care spanning health and social services that respond to the specific needs and circumstances of individual patients. Inequalities in health are greater within English regions than between them and are therefore largely related to deprivation, not geography. The causes of inequalities need to be addressed wherever they occur. The importance of prevention argues for investment in robust, standardised comparative assessments of the cost-effectiveness of different public health policies to aid decision making, akin to those used in England for health technologies.

Articles
www.thelancet.com Published online September 15, 2015 http://dx.doi.org/10.1016/S0140-6736(15)00195-6 3
London, UK (Prof M Ezzati FMedSci); Department of Infectious Disease Epidemiology, Imperial College London, London, UK (T Fürst PhD); Department of Primary Care and Public Health, Imperial College London, London, UK (F Greaves); School of Health and Related Research (ScHARR), University of Sheffield, Sheffield, UK (M A Green PhD); School of Social and Community Medicine, University of Bristol, Bristol, UK (Prof D J Gunnell DSc); Ulster University, Coleraine, Northern Ireland (B M Hannigan); International Foundation for Dermatology, London, UK (Prof R J Hay DM); Wellcome Trust Centre for Human Genetics, University of Oxford, Oxford, UK (Prof S I Hay); Farr Institute of Health Informatics Research, London, UK (Prof H Hemingway, Prof L Smeeth FRCGP); Department of Infectious Disease Epidemiology (H J Larson) and Department of Health Services Research and Policy (M McKee DSc), London School of Hygiene & Tropical Medicine, London, UK; School of Social and Community Medicine, University of Bristol, Bristol, UK (K J Looker PhD); Aintree University Hospital NHS Foundation Trust, University of Liverpool, Liverpool, UK (R Lunevicius); Queen Mary University of London (Prof W Marcenes PhD); Department of Health Sciences, University of York, York, UK (A J Mason-Jones PhD); Adolescent Health Research Unit, University of Cape Town, Cape Town, South Africa (A J Mason-Jones); Institute of Health and Society, Newcastle University, Newcastle, UK (F E Matthews); Cancer Epidemiology and Population Health, King’s College London, London, UK (Prof H Moller DuMed); West Hertfordshire Hospitals NHS Trust, Hertfordshire, UK (M E Murdoch FRCP); London School of Hygiene & Tropical Medicine (Prof N Pearce PhD, H Rutter MB Mchir, Prof L Smeeth); George Institute for Global Health and Division of Cardiovascular Medicine, Oxford Martin School, University of Oxford, Oxford, UK (K Rahimi DM);
estimate incidence, prevalence, and YLDs for 306 causes and 2337 sequelae from 1990 to 2013, a substantial increase from 220 causes and 1160 sequelae in the GBD 2010 analysis.1 This GBD 2013 paper includes a description of the systematic reviews of the published literature, identification of unpublished data sources, efforts to map data to a consistent set of case definitions, and the general approach to Bayesian meta-regression using DisMod-MR 2.0, which allows the estimation of incidence, prevalence, remission, excess mortality, and cause-specific mortality rates that are internally consistent. Details of the method, the likelihood used in estimation, and the source code have been published elsewhere.8,9 The analysis of risk factor-attributable burden uses the GBD 2013 framework and results.6 Sampling and non-sampling error as well as model uncertainty is propagated by estimating all steps in the calculations 1000 times. 95% uncertainty intervals (UIs) are presented by the 2·5 and 97·5 centile values.
Another new feature of the GBD 2013 study is the systematic aggregation of the burden attributed to five tiers of risk factors: the first tier is all GBD risks combined; the second tier consists of three large categories of metabolic, behavioural, and environmental and occupational risks; the third tier contains single risks, such as high blood pressure, and risk clusters, such as child and maternal under-nutrition or air pollution; the fourth tier includes single risks within such clusters, such as vitamin A deficiency or household air pollution; and the fifth tier is for individual occupational carcinogens or the division of childhood underweight into stunting, underweight, and wasting. At each level of the hierarchy, a decision is made whether the combined effects are independent and can be added, whether they are joint effects best represented by multiplication, or whether they share common pathways for which mediation needs to be taken into account. For each aggregation, the proportion of the effect shared with another risk or combination of risks can thus be made explicit, using modified Venn diagrams that show the overlaps between metabolic, behavioural, and environ-mental and occupational risks.
Here we focus on specific issues related to the analysis of causes of death, injury incidence and prevalence, and risk factor prevalence in England, the nine English regions, and 45 subregional areas defined by deprivation quintile (deprivation areas).
Division of England into English regions and deprivation areasEstimates of disease burden have been created for the nine English regions, as defined by the former government office regions in England, and correspond to the European boundaries of the Nomenclature for Territorial Statistics level 1 (NUTS 1) regions. In a further refinement, all English lower super output areas, relatively homogeneous areas containing about
1600 people on average,10 were ranked nationally using the Index of Multiple Deprivation (IMD-2010) and allocated to quintiles. The IMD-2010 is a composite measure estimated at a small geographical area and includes seven domains: income, employment, health and disability, education, skills and training, barriers to housing and services, living environment, and crime.11 The health and disability domain of the IMD-2010 contributes 13·5% to the score and encompasses four measures: years of potential life lost, comparative illness and disability ratio, rate of emergency admissions to hospital, and proportion of adults younger than 60 years who have mood or anxiety disorders. Although inevitably partially correlated with health, exclusion of the health component from an earlier version of the IMD has been shown to make little difference to ranking of areas by deprivation in practice.12 The lower super output areas in each quintile were then reallocated to their region, thereby dividing each of the nine English regions into five deprivation groups, or 45 regional deprivation areas in total. As the lower super output areas at each level of deprivation are unevenly distributed among the English regions, there will be a greater share of the regional population living in the most deprived and least deprived (nationally) areas in each English region. Thus, the proportion of the population in the most deprived group ranges from 7·3% in South East England to 32·8% in North West England. For the least deprived group, this proportion ranges from 7·9% in Greater London to 34·8% in South East England. The complete breakdown of these proportions is provided in the appendix (p 4). Within each English region, the most deprived area is referred to as deprivation level 1, and the least deprived area as deprivation level 5.
Mortality data for England from 1990 to 2012, available from the Office for National Statistics, were split into regional and deprivation groups based on the postcode of residence. Where a postcode for the deceased had not been provided, these deaths were discarded from the analysis of England mortality because no residence in England was assumed. These records make up less than 0·3% of all mortality records. Each death was assigned to a lower super output area, deprivation group, and English region on the basis of the person’s postcode. GBD estimation of disease prevalence and incidence also makes use of social, cultural, economic, and environmental covariates; some covariate and morbidity data were available at the level of English region. The source data for England used at each level are provided in the appendix p 5; regional level covariates that have been included are listed in the appendix p 44.
Analysis of cause of death by English region and deprivation areaAs outlined in the GBD 2013 report about global mortality and cause of death,4 vital registration data covering the years 1980 to 2012 were analysed at the
Articles
4 www.thelancet.com Published online September 15, 2015 http://dx.doi.org/10.1016/S0140-6736(15)00195-6
NHS England, Leeds, UK (Prof J Valabhji MD); Imperial
College Healthcare NHS Trust, London, UK (Prof J Valabhji);
Imperial College London, London, UK (Prof J Valabhji);
University of Edinburgh, Edinburgh, Scotland
(I Shiue PhD); University of Nottingham, Nottingham, UK
(Prof H C Williams DSc); King’s College London, London, UK (Prof C D A Wolfe MD); Royal
Cornwall Hospital, Treliske, UK (Prof A D Woolf MBBS); Mid
Sweden University, Sundsvall, Sweden (Prof A Rodriguez);
British Heart Foundation Centre on Population
Approaches for NCD Prevention, University of
Oxford, Oxford, UK (P Scarborough DPhil);
Northumbria University, Newcastle upon Tyne (I Shiue);
Farr Institute, College of Medicine, Swansea University,
Swansea, UK (Prof R A Lyons MD)
Correspondence to: Prof John Newton, Public Health
England, Wellington House, London SE1 8UG, UK
For the Global Burden of Disease IHME home page see
http://www.healthdata.org/gbd
For the Eurostat NUTS classification see http://ec.
europa.eu/eurostat/web/nuts
See Online for appendix
For Cause of death data for each observation, before
redistribution, post-redistribution, and the results of modelling see http://vizhub.
healthdata.org/cod/
regional level. Registration of deaths that happen in England is a legal requirement, and because registration is necessary before disposal of the body, mortality data are assumed to be complete.1,13,14 We reclassified causes of death for deaths assigned to causes that cannot or should not be an underlying cause of death, so-called garbage codes.15,16 Standard GBD 2013 redistribution of garbage-code algorithms was applied.17 Although data were available for all years between 1980 and 2012, to deal with stochastic variation at the regional level, while following the GBD 2013 methods, we modelled causes of death using cause of death ensemble modelling (CODEm).4,18 CODEm has been used extensively to model causes of death; an ensemble model is developed by testing the performance of a wide array of models (mixed effects or space–time Gaussian process regression), different measures of mortality (rates or cause fractions) and varying combinations of covariates (drawing on a database created for GBD of more than 200 diverse characteristics for countries over time, such as gross domestic product, level of education, dietary factors, use of health-service, and environmental statistics), and by selecting the models with best out-of-sample performance. For example, GBD suicide estimates for the UK are lower than those produced by the Office for National Statistics by almost a quarter. The Office for National Statistics estimates include all deaths coded as suicide (ICD-10 X60–X84) and deaths coded as due to injury and poisoning of undetermined intent (ICD Y10–34),19 whereas GBD uses a redistribution approach, coding only a proportion of undetermined intent deaths as suicide.
The GBD places disease categories within a four-level cause hierarchy. The first level divides causes into communicable diseases, non-communicable diseases, and injuries; the second level consists of major disease or injury groups, such as cardiovascular diseases or transport injuries; the third level (at which most results are reported) further subdivides causes into disease or injury types, such as cerebrovascular disease or road injuries; and a final fourth level subdivides those disease types where appropriate. Further details can be found in the supplementary appendix of the GBD 2013 Mortality and Cause of Death report.4
Tabulations of deaths by cause were generated by deprivation area within each English region. Where the causes of deaths were identified as garbage codes, these were reclassified using the GBD 2013 algorithms. Owing to small sample size in some age–sex–cause groups, we sought to smooth stochastic variation over time. To estimate causes of death by age, sex, and year for a deprivation area within each English region, we first computed the fraction of deaths for a cause–sex–age–year in each deprivation area. To minimise the effect of stochastic fluctuations on the results, we used a 3-year moving average for age groups over 15 years, and a 5-year moving average for age groups under 15 years. We chose
a longer time period for the moving average for childhood age groups because these data are most prone to fluctuations due to small numbers of annual deaths. Moving-average deprivation-area fractions within a cause–age–sex–year group were rescaled so that the sum of cause fractions equalled 100%. These deprivation-area fractions were multiplied by the regional level final estimates of death counts for an age–sex–year group for a given cause to generate estimates of final death counts for each deprivation area. Death counts were divided by deprivation area population to generate deprivation-level cause–age–sex–year rates.
Disease and injury incidence, prevalence, and YLDs by English region and deprivation areaA list of sources used for the analysis of non-fatal health outcomes in England organised by disease is provided in the appendix (p 5). These sources include studies extracted from the published literature through the GBD systematic reviews as well as extractions from surveys, such as the Health Survey for England,20 and administrative sources, such as NHS hospital discharge data. We also used new data from the UK-based Cognitive Function and Ageing Studies.21 Most disease sequelae have been modelled in GBD 2013 using a Bayesian meta-regression method, DisMod-MR 2.0, in which each English region has been analysed as a distinct geographic unit. A prior for the Bayesian meta-regression is calculated for each English region using the data for all countries in western Europe, with random effects on countries and English regions and fixed effects that vary by the disease being modelled.
To analyse injuries, we made use of both the external cause of injury and the nature of injury. As detailed elsewhere,5 we used survey and hospital activity data to estimate incidence of injuries for which hospital admission was necessary and injuries for which hospital admission was not necessary. Hospital data dual-coded to nature of injury and external cause of injury were used to estimate the fraction of each injury with different types of disabling sequelae. Cohort studies from four countries were used to estimate the probability of long-term disability for each type of injury.6,22,23 DisMod-MR 2.0 was used to estimate the prevalence of injury in each birth cohort on the basis of long-term disability arising from past incidence. Given the absence of data on injury incidence before 1980, we assumed that age-specific incidence in cohorts before 1980 was equal to the rate in 1980.
Following the GBD 2013 methods, prevalence of individuals in each sequela was multiplied by the disability weight for the corresponding health state to calculate YLDs for the particular sequela. The sum of all the YLDs for relevant sequelae is the overall YLD for each disease. We based disability weights on the responses by the general public to questions about which health state of randomly chosen pairs represents
Articles
www.thelancet.com Published online September 15, 2015 http://dx.doi.org/10.1016/S0140-6736(15)00195-6 5
a higher state of health. GBD 2013 disability weights were based on the pooled analysis of 60 890 responses from household surveys done in a wide range of settings (USA, Peru, Tanzania, Bangladesh, Indonesia, Italy, Hungary, Sweden, and the Netherlands, and an open access internet survey) to allow them to be generalised to the global population.22 We analysed the disability weight surveys to generate 235 health state weights on a scale of 0·0 (perfect health) to 1·0 (like death). Each of the 2337 sequelae in the study are mapped to a particular health state and its associated disability weight. Results showed little variation by country of survey or level of education of respondents, justifying the use of a single set of disability weights for all countries and time periods.
YLDs for deprivation areas have been estimated from regional level results. For causes where substantial mortality exists, we have assumed that the pattern of disease prevalence mirrors the pattern of mortality in an age–sex group. For causes where there is minimal mortality and no available data, we have assumed that YLD rates for an age–sex group are constant across deprivation levels in an English region. The threshold used to define minimal mortality is if the ratio of years of life lost (YLLs) to YLDs was less than 0·15.
Age standardisation, multiple-decrement life tables, and benchmarking years of life lostThe GBD 2013 global age-standard population was used to compute age-standardised rates.4
We used multiple-decrement life tables to compute the contribution of changes in cause-specific mortality to changes in life expectancy for each English region and deprivation area from 1990 to 2013.24,25
We computed YLLs by multiplying numbers of deaths from each cause in each age group by the reference life expectancy at the average age of death for those who die in the age group, as in the GBD 2010.9,13,16,26,27 The reference life expectancy at birth is 86·02 years and is based on the lowest age-specific death rates observed in all countries with populations greater than 5 million in 2010. We compared English regions and England as a whole with 18 other comparator nations (the first 15 members of the EU [apart from the UK], Australia, Canada, Norway, and the USA; EU15+). This set of countries has been used in previous benchmarking analyses for the UK.1
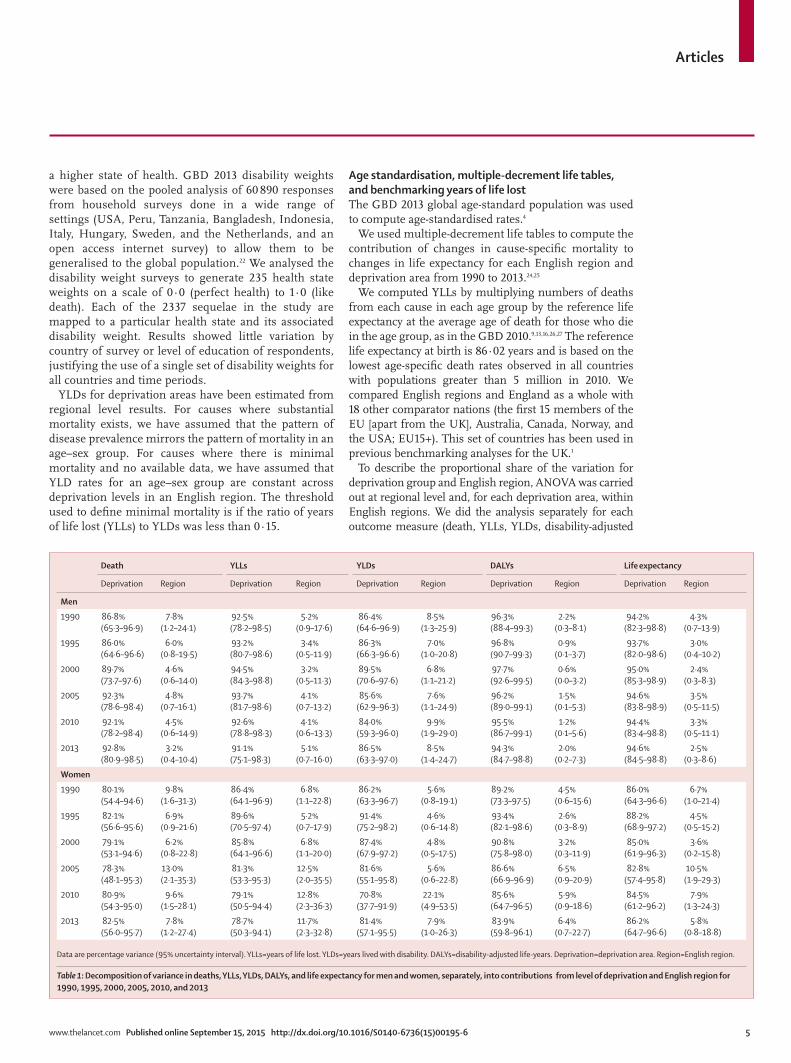
To describe the proportional share of the variation for deprivation group and English region, ANOVA was carried out at regional level and, for each deprivation area, within English regions. We did the analysis separately for each outcome measure (death, YLLs, YLDs, disability-adjusted
Death YLLs YLDs DALYs Life expectancy
Deprivation Region Deprivation Region Deprivation Region Deprivation Region Deprivation Region
Men
1990 86·8% (65·3–96·9)
7·8% (1·2–24·1)
92·5% (78·2–98·5)
5·2% (0·9–17·6)
86·4% (64·6–96·9)
8·5% (1·3–25·9)
96·3% (88·4–99·3)
2·2% (0·3–8·1)
94·2% (82·3–98·8)
4·3% (0·7–13·9)
1995 86·0% (64·6–96·6)
6·0% (0·8–19·5)
93·2% (80·7–98·6)
3·4% (0·5–11·9)
86·3% (66·3–96·6)
7·0% (1·0–20·8)
96·8% (90·7–99·3)
0·9% (0·1–3·7)
93·7% (82·0–98·6)
3·0% (0·4–10·2)
2000 89·7% (73·7–97·6)
4·6% (0·6–14·0)
94·5% (84·3–98·8)
3·2% (0·5–11·3)
89·5% (70·6–97·6)
6·8% (1·1–21·2)
97·7% (92·6–99·5)
0·6% (0·0–3·2)
95·0% (85·3–98·9)
2·4% (0·3–8·3)
2005 92·3% (78·6–98·4)
4·8% (0·7–16·1)
93·7% (81·7–98·6)
4·1% (0·7–13·2)
85·6% (62·9–96·3)
7·6% (1·1–24·9)
96·2% (89·0–99·1)
1·5% (0·1–5·3)
94·6% (83·8–98·9)
3·5% (0·5–11·5)
2010 92·1% (78·2–98·4)
4·5% (0·6–14·9)
92·6% (78·8–98·3)
4·1% (0·6–13·3)
84·0% (59·3–96·0)
9·9% (1·9–29·0)
95·5% (86·7–99·1)
1·2% (0·1–5·6)
94·4% (83·4–98·8)
3·3% (0·5–11·1)
2013 92·8% (80·9–98·5)
3·2% (0·4–10·4)
91·1% (75·1–98·3)
5·1% (0·7–16·0)
86·5% (63·3–97·0)
8·5% (1·4–24·7)
94·3% (84·7–98·8)
2·0% (0·2–7·3)
94·6% (84·5–98·8)
2·5% (0·3–8·6)
Women
1990 80·1% (54·4–94·6)
9·8% (1·6–31·3)
86·4% (64·1–96·9)
6·8% (1·1–22·8)
86·2% (63·3–96·7)
5·6% (0·8–19·1)
89·2% (73·3–97·5)
4·5% (0·6–15·6)
86·0% (64·3–96·6)
6·7% (1·0–21·4)
1995 82·1% (56·6–95·6)
6·9% (0·9–21·6)
89·6% (70·5–97·4)
5·2% (0·7–17·9)
91·4% (75·2–98·2)
4·6% (0·6–14·8)
93·4% (82·1–98·6)
2·6% (0·3–8·9)
88·2% (68·9–97·2)
4·5% (0·5–15·2)
2000 79·1% (53·1–94·6)
6·2% (0·8–22·8)
85·8% (64·1–96·6)
6·8% (1·1–20·0)
87·4% (67·9–97·2)
4·8% (0·5–17·5)
90·8% (75·8–98·0)
3·2% (0·3–11·9)
85·0% (61·9–96·3)
3·6% (0·2–15·8)
2005 78·3% (48·1–95·3)
13·0% (2·1–35·3)
81·3% (53·3–95·3)
12·5% (2·0–35·5)
81·6% (55·1–95·8)
5·6% (0·6–22·8)
86·6% (66·9–96·9)
6·5% (0·9–20·9)
82·8% (57·4–95·8)
10·5% (1·9–29·3)
2010 80·9% (54·3–95·0)
9·6% (1·5–28·1)
79·1% (50·5–94·4)
12·8% (2·3–36·3)
70·8% (37·7–91·9)
22·1% (4·9–53·5)
85·6% (64·7–96·5)
5·9% (0·9–18·6)
84·5% (61·2–96·2)
7·9% (1·3–24·3)
2013 82·5% (56·0–95·7)
7·8% (1·2–27·4)
78·7% (50·3–94·1)
11·7% (2·3–32·8)
81·4% (57·1–95·5)
7·9% (1·0–26·3)
83·9% (59·8–96·1)
6·4% (0·7–22·7)
86·2% (64·7–96·6)
5·8% (0·8–18·8)
Data are percentage variance (95% uncertainty interval). YLLs=years of life lost. YLDs=years lived with disability. DALYs=disability-adjusted life-years. Deprivation=deprivation area. Region=English region.
Table 1: Decomposition of variance in deaths, YLLs, YLDs, DALYs, and life expectancy for men and women, separately, into contributions from level of deprivation and English region for 1990, 1995, 2000, 2005, 2010, and 2013

Articles
6 www.thelancet.com Published online September 15, 2015 http://dx.doi.org/10.1016/S0140-6736(15)00195-6
life years [DALYs], life expectancy), and for specific years (1990, 1995, 2000, 2005, 2010, 2013). Models with main effects for region and deprivation, and of the interaction of English region and deprivation, were fitted to the data. Decomposition of variance was estimated using mixed-effects linear regression employing Gelman’s methods.28 UIs for the decomposition of variance were based on two steps. First, we took 1000 draws from the standard error of the random effect across English regions and the random effect across deprivation levels. Second, we computed the fraction of variance explained by English region and deprivation level based on each of these draws. Table 1 shows the proportion of the variance due to deprivation and due to English region (with 95% UIs).
Role of the funding sourceThe GBD 2013 database development, methods improve-ment, and global analysis is primarily funded by the Bill & Melinda Gates Foundation, which had no role in study design, data collection, data analysis, data interpretation, or writing of the report. Public Health England contributed to the interpretation of data, the writing of the report, and the decision to submit the paper for publication. The corresponding author had full access to all the data in the study and had final responsibility to submit the paper.
ResultsBetween 1990 and 2013, life expectancy from birth in England increased by 5·4 years (95% UI 5·0–5·8) from 75·9 years (75·9–76·0) to 81·3 years (80·9–81·7), and
age-standardised death rates were reduced by 33·6% (31·1–36·1; appendix p 21). During the same time period, the relative reduction in the rate of age-standardised YLLs was 41·1% (38·3–43·6), indicating a proportionately larger reduction in premature mortality when compared with overall mortality. In comparison, age-standardised rates of YLDs, which capture the burden of disability, decreased by only 1·4% (0·1–2·8). With DALYs, which combine mortality and disability, there was an overall reduction of 23·8% (20·9–27·1) between 1990 and 2013. Compared with the EU15+ countries, in 2013, England ranked eighth for age-standardised death rates, seventh for YLLs, seventh for YLDs, and sixth for DALYs; better than the UK as a whole on all measures. Corresponding results for the constituent countries of the UK and the English regions are provided in the appendix (p 21).
Figure appendix 1 shows the change in life expectancy from 1990 to 2013 by broad cause group for men and women separately and for both sexes combined in England, the English regions, Scotland, Northern Ireland, Wales, and the EU15+ countries. Between 1990 and 2013, England overall achieved one of the largest gains in life expectancy among men, with 6·4 gained years, less than Luxembourg but tying with Finland. All English regions except for South West England, achieved a gain of at least 6·0 years, equal to or greater than all comparator countries except Austria, Finland, Ireland, Germany, and Luxembourg. Among women, the increase in life expectancy in England overall was more modest
Figure 1: The 25 leading GBD level 3 causes of years of life lost (YLLs) in England, both sexes combined, 1990, 2005, and 2013, with age-standardised median percent changeRanks are based on the number of YLLs. 95% UIs for mean rank are from 1000 draws of YLLs. UI=uncertainty interval. COPD=chronic obstructive pulmonary disease.
1·0 (1–1)2·1 (2–3)2·9 (2–3)4·3 (4–6)5·3 (4–6)5·5 (4–6)7·0 (7–8)8·0 (7–8)9·1 (9–10)
10·6 (10–12)11·7 (10–22)12·8 (9–23)13·1 (10–17)14·6 (12–18)15·0 (13–20)15·4 (13–18)17·8 (13–25)19·2 (16–23)19·7 (14–30)19·7 (16–24)20·3 (16–26)21·4 (15–26)22·7 (19–26)23·1 (20–25)24·3 (21–29)
–22% (–26 to –17%)0% (–8 to 7%)
–14% (–19 to –9%)–5% (–12 to 2%)9% (–2 to 20%)
–15% (–20 to –6%)0% (–7 to 6%)
–12% (–19 to 0%)–13% (–24 to –3%)
8% (1 to 15%)–14% (–23 to –6%)
5% (–16 to 15%)1% (–11 to 16%)
–4% (–18 to 14%)2% (–6 to 8%)
–32% (–37 to –26%)–15% (–31 to 7%)
0% (–19 to 18%)0% (–21 to 11%)
–14% (–20 to –7%)2% (–5 to 10%)
–18% (–25 to –10%)–4% (–11 to 5%)–1% (–13 to 5%)–8% (–20 to 2%)
1 Ischaemic heart disease2 Lung cancer3 Cerebrovascular disease4 COPD5 Alzheimer's disease6 Lower respiratory infections7 Colorectal cancer8 Breast cancer9 Self-harm
10 Pancreatic cancer11 Other cardiovascular12 Prostate cancer13 Oesophageal cancer14 Congenital anomalies15 Other neoplasms16 Road injuries17 Neonatal preterm birth18 Cirrhosis hepatitis C19 Lymphoma20 Stomach cancer21 Brain cancer22 Aortic aneurysm23 Ovarian cancer24 Leukaemia25 Drug use disorders31 Cirrhosis alcohol
1 Ischaemic heart disease2 Cerebrovascular disease3 Lung cancer4 Lower respiratory infections5 COPD6 Alzheimer's disease7 Colorectal cancer8 Breast cancer9 Self-harm
10 Road injuries11 Other cardiovascular12 Pancreatic cancer13 Oesophageal cancer14 Prostate cancer15 Neonatal preterm birth16 Congenital anomalies17 Other neoplasms18 Aortic aneurysm19 Stomach cancer20 Lymphoma21 Cirrhosis hepatitis C22 Drug use disorders23 Ovarian cancer24 Brain cancer25 Cirrhosis alcohol26 Leukaemia27 Diabetes32 Bladder cancer34 Cardiomyopathy
2·9 (2–3)
4·8 (4–5)6·0 (6–7)7·1 (7–8)7·9 (6–8)9·0 (9–9)
10·4 (10–11)
12·2 (12–14)
14·2 (10–20)
17·8 (15–22)17·8 (13–22)18·0 (15–20)20·9 (16–28)
22·9 (21–25)23·4 (19–28)24·4 (20–28)
1·0 (1–1)2·1 (2–3)
4·2 (4–5)
11·1 (10–17)
14·0 (12–17)
15·1 (13–19)15·6 (13–17)
21·6 (18–27)22·5 (20–29)
–21% (–25 to –19%)
–11% (–15 to 2%)20% (8 to 34%)
–18% (–21 to –16%)–18% (–22 to –15%)–29% (–31 to –15%)–33% (–35 to –30%)
2% (–2 to 5%)
9% (–20 to 21%)
15% (–6 to 19%)–17% (–28 to –13%)–37% (–40 to –34%)23% (–16 to 27%)
–5% (–12 to –2%)3% (0 to 8%)
88% (57 to 119%)
–46% (–47 to –39%)–32% (–35 to –25%)
–1% (–19 to 3%)
26% (–32 to 31%)
20% (16 to 24%)
–26% (–41 to –20%)–34% (–39 to –31%)
125% (88 to 188%)148% (17 to 165%)
1 Ischaemic heart disease2 Cerebrovascular disease3 Lung cancer4 COPD5 Lower respiratory infections6 Colorectal cancer7 Breast cancer8 Alzheimer's disease9 Self-harm
10 Road injuries11 Congenital anomalies12 Stomach cancer13 Neonatal preterm birth14 Aortic aneurysm15 Other cardiovascular16 Pancreatic cancer17 Diabetes18 Prostate cancer19 Oesophageal cancer20 Other neoplasms21 Ovarian cancer22 Leukaemia23 Cardiomyopathy24 Brain cancer25 Bladder cancer26 Lymphoma35 Cirrhosis alcohol41 Cirrhosis hepatitis C46 Drug use disorders
1·0 (1–1)2·0 (2–2)3·0 (3–3)4·2 (4–5)4·8 (4–5)6·1 (6–7)6·9 (6–7)8·3 (8–9)8·8 (8–10)9·9 (9–10)
11·4 (11–13)12·2 (11–14)12·6 (11–14)14·7 (14–18)15·3 (12–18)15·6 (14–17)17·0 (15–18)17·8 (14–22)19·2 (18–21)20·0 (18–22)21·1 (19–23)22·3 (21–24)23·1 (19–27)24·1 (20–27)25·5 (23–28)
Mean rank (95% UI)
Mean rank (95% UI)
1990 leading causes 2005 leading causes Age-standardised median percentage change 1990–2005
Mean rank (95% UI)
2013 leading causes Age-standardised median percentage change 2005–2013
Communicable, maternal, neonatal, and nutritionalNon-communicableInjuries
Articles
www.thelancet.com Published online September 15, 2015 http://dx.doi.org/10.1016/S0140-6736(15)00195-6 7
than for men, with 4·4 years, yet still equalled or exceeded that of all countries except Finland, Germany, Ireland, Luxembourg, and Portugal.
In 1990, the life expectancy of men in England was lower than in many western countries, such as Canada, France, Norway, the Netherlands, and Spain; however, by 2013, life expectancy of men in England had surpassed that of each of these countries, reaching 79·5 years (95% UI 78·9–80·0). In three regions of England, South West England, East of England, and South East England, the life expectancy of men was 80 years or above, which is better than that in Australia and in Sweden. The main drivers for improvement in life expectancy in nearly all countries and in the English regions have been declines in cardiovascular disease and, to a lesser extent, cancer mortality. Decreases in chronic respiratory disease and road injuries have also been important contributors. Increased mortality from cirrhosis of the liver and from mental and substance use disorders (mostly attributed to alcohol use) made negative
contributions to life expectancy in all the English regions except for Greater London and South East England.
For women, life expectancy at birth across countries and the English regions in 2013 ranged from 81·0 years (95% UI 80·3–81·7) in Scotland to 84·9 years (84·4–85·4) in France. Geographical patterns, however, are somewhat different from those for men, with the highest life expectancy for women in Spain, Italy, and France. Australia and South East England reached a female life expectancy of 84·0 years (83·5–84·5 and 83·3–84·6, respectively) in 2013, whereas two English regions and four countries have a female life expectancy at or below 82 years, namely: North East England, North West England, Scotland, USA, Northern Ireland, and Denmark. As with men, the key drivers of increases in female life expectancy have been reductions in cardiovascular diseases and cancers. For most countries, sex differences in life expectancy decreased between 1990 and 2013; in England, the gap closed by 2·2 years.
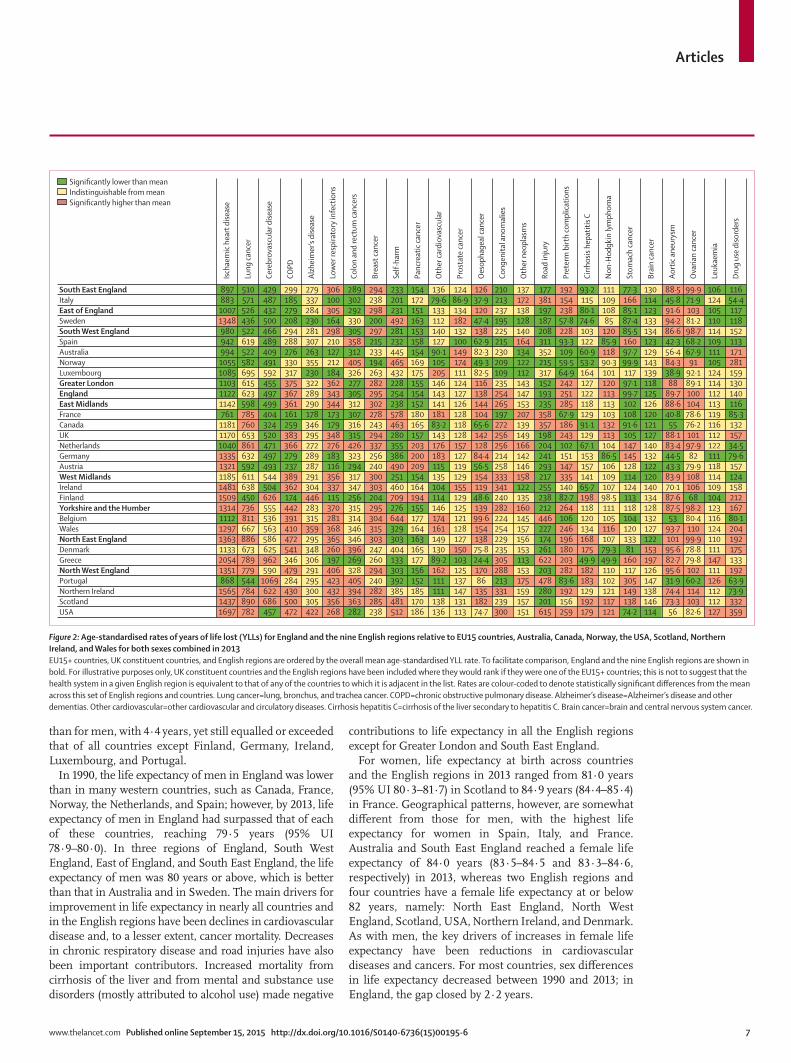
Figure 2: Age-standardised rates of years of life lost (YLLs) for England and the nine English regions relative to EU15 countries, Australia, Canada, Norway, the USA, Scotland, Northern Ireland, and Wales for both sexes combined in 2013EU15+ countries, UK constituent countries, and English regions are ordered by the overall mean age-standardised YLL rate. To facilitate comparison, England and the nine English regions are shown in bold. For illustrative purposes only, UK constituent countries and the English regions have been included where they would rank if they were one of the EU15+ countries; this is not to suggest that the health system in a given English region is equivalent to that of any of the countries to which it is adjacent in the list. Rates are colour-coded to denote statistically significant differences from the mean across this set of English regions and countries. Lung cancer=lung, bronchus, and trachea cancer. COPD=chronic obstructive pulmonary disease. Alzheimer’s disease=Alzheimer’s disease and other dementias. Other cardiovascular=other cardiovascular and circulatory diseases. Cirrhosis hepatitis C=cirrhosis of the liver secondary to hepatitis C. Brain cancer=brain and central nervous system cancer.
Significantly lower than meanIndistinguishable from meanSignificantly higher than mean
897 510 429 299 279 306 289 294 233 154 136 124 126 210 137 177 192 93·2 111 77·3 130 88·5 99·9 106 116883 571 487 185 337 100 302 238 201 172 79·6 86·9 37·9 213 172 381 154 115 109 166 114 45·8 71·9 124 54·4
1007 526 432 279 284 305 292 298 231 151 133 134 120 237 138 197 238 80·1 108 85·1 123 91·6 103 105 1171348 436 500 208 230 164 330 200 492 163 112 182 47·4 195 128 187 57·8 74·6 85 87·4 133 94·2 81·2 110 118980 522 466 294 281 298 305 297 281 153 140 132 138 225 140 208 228 103 120 85·5 134 86·6 98·7 114 152942 619 489 288 307 210 358 215 232 158 127 100 62·9 215 164 311 93·3 122 85·9 160 123 42·3 68·2 109 113994 522 409 276 263 127 312 233 445 154 90·1 149 82·3 230 134 352 109 60·9 118 97·7 129 56·4 67·9 111 1711055 582 491 330 355 212 405 194 465 169 105 174 49·3 209 122 215 59·5 53·2 90·3 99·9 143 84·3 91 105 2811085 695 592 317 230 184 326 263 432 175 205 111 82·5 109 112 317 64·9 164 101 117 139 38·9 92·1 124 1591103 615 455 375 322 362 277 282 228 155 146 124 116 235 143 152 242 127 120 97·1 118 88 89·1 114 1301122 623 497 367 289 343 305 295 254 154 143 127 138 254 147 193 251 122 113 99·7 125 89·7 100 112 1401142 598 499 361 290 344 312 302 238 152 141 126 144 265 153 235 285 118 113 102 126 88·6 104 113 116761 785 404 161 178 173 307 278 578 180 181 128 104 197 207 358 67·9 129 103 108 120 40·8 78·6 119 85·3
1181 760 324 259 346 179 316 243 463 165 83·2 118 65·6 272 139 357 186 91·1 132 91·6 121 55 76·2 116 1321170 653 520 383 295 348 315 294 280 157 143 128 142 256 149 198 243 129 113 105 127 88·1 101 112 1571040 861 471 366 272 276 426 337 355 203 176 157 128 256 166 204 102 67·1 104 147 140 83·4 97·9 122 34·51335 632 497 279 289 183 323 256 386 200 183 127 84·4 214 142 241 151 153 86·5 145 132 44·5 82 111 79·61321 592 493 237 287 116 294 240 490 209 115 119 56·5 258 146 293 147 157 106 128 122 43·3 79·9 118 1571185 611 544 389 291 356 317 300 251 154 135 129 154 333 158 217 335 141 109 114 120 83·9 108 114 1241481 638 504 362 304 337 347 303 460 164 104 155 119 341 122 255 140 65·7 107 124 140 70·1 106 109 1581509 450 626 174 446 115 256 204 709 194 114 129 48·6 240 135 238 82·7 198 98·5 113 134 87·6 68 104 2121314 736 555 442 283 370 315 295 276 155 146 125 139 282 160 212 264 118 111 118 128 87·5 98·2 123 1671112 811 536 391 315 281 314 304 644 177 174 121 99·6 224 145 446 106 120 105 104 132 53 80·4 116 80·11297 667 563 410 359 368 346 315 329 164 161 128 154 254 157 227 246 134 116 120 127 93·7 110 124 2041363 886 586 472 295 365 346 303 303 163 149 127 138 229 156 174 196 168 107 133 122 101 99·9 110 1921133 673 625 541 348 260 396 247 404 165 130 150 75·8 235 153 261 180 175 79·3 81 153 95·6 78·8 111 1752054 789 962 346 306 197 269 260 133 177 89·2 103 24·4 305 113 622 203 49·9 49·9 160 197 82·7 79·8 147 1331351 779 590 479 291 406 328 294 303 156 162 125 170 288 153 203 282 182 110 117 126 95·6 102 111 192868 544 1069 284 295 423 405 240 392 152 111 137 86 213 175 478 83·6 183 102 305 147 31·9 60·2 126 63·91565 784 622 430 300 432 394 282 385 185 111 147 135 331 159 280 192 129 121 149 138 74·4 114 112 73·91437 890 686 500 305 356 363 285 481 170 138 131 182 239 157 201 156 192 117 138 146 73·3 103 112 3321697 782 457 472 422 268 282 238 512 186 136 113 74·7 300 151 615 259 179 121 74·2 114 56 82·6 127 359
South East EnglandItalyEast of EnglandSwedenSouth West EnglandSpainAustraliaNorwayLuxembourgGreater LondonEnglandEast MidlandsFranceCanadaUKNetherlandsGermanyAustriaWest MidlandsIrelandFinlandYorkshire and the HumberBelgiumWalesNorth East EnglandDenmarkGreeceNorth West EnglandPortugalNorthern IrelandScotlandUSA
Ischa
emic
hear
t dise
ase
Lung
canc
er
Cere
brov
ascu
lar d
iseas
e
COPD
Alzh
eim
er’s
dise
ase
Low
er re
spira
tory
infe
ctio
ns
Colo
n an
d re
ctum
canc
ers
Brea
st ca
ncer
Self-
harm
Panc
reat
ic ca
ncer
Oth
er ca
rdio
vasc
ular
Pros
tate
canc
er
Oes
opha
geal
canc
er
Cong
enita
l ano
mal
ies
Oth
er n
eopl
asm
s
Road
inju
ry
Pret
erm
birt
h co
mpl
icatio
ns
Cirrh
osis
hepa
titis
C
Non
-Hod
gkin
lym
phom
a
Stom
ach
canc
er
Brai
n ca
ncer
Aort
ic an
eury
sm
Ova
rian
canc
er
Leuk
aem
ia
Drug
use
diso
rder
s

Articles
8 www.thelancet.com Published online September 15, 2015 http://dx.doi.org/10.1016/S0140-6736(15)00195-6
Figure appendix 2 shows a similar analysis of changes in life expectancy from 1990 to 2013 by cause for the 45 deprivation areas of England. For men, life expectancy in 2013 ranged from 74·9 years (95% UI 74·1–75·7) in North West England deprivation level 1 (most deprived) to 83·1 years (82·3–83·9) in East of England deprivation level 5 (least deprived; figure appendix 2). The range of 8·2 years between deprivation areas in 2013 is unchanged for men since 1990. For women, the equivalent figures in 2013 were 79·5 years (78·7–80·2) in North West England deprivation level 1 (most deprived) to 86·4 years (85·6–87·3) in East of England deprivation level 5 (least
deprived; figure appendix 2); the range has therefore decreased for women from 7·2 years to 6·9 years. Overall, there has been little if any improvement in inequality in life expectancy across regions of England: by 2013, people living in the most deprived areas have not yet reached the levels of life expectancy that less deprived groups had in 1990.
The ordering of the 45 deprivation areas largely follows deprivation level across English regions. There are a few crossovers such as Greater London deprivation level 1, which has better life expectancy than North West England deprivation level 2 (figure appendix 2). Table 1
Figure 3: Age-standardised rates of years of life lost (YLLs) for England relative to the deprivation levels in the nine English regions for both sexes combined in 2013To facilitate comparison, England is shown in bold. Lung cancer=lung, bronchus, and trachea cancer. COPD=chronic obstructive pulmonary disease. Alzheimer’s disease=Alzheimer’s disease and other dementias. Other cardiovascular=other cardiovascular and circulatory diseases. Cirrhosis hepatitis C=cirrhosis of the liver secondary to hepatitis C. Brain cancer=brain and central nervous system cancer.
771 385 355 190 237 247 255 279 182 142 105 127 97·8 177 124 156 194 45·8 101 69 119 70·6 89·4 104 59·6710 376 396 207 270 287 267 284 194 140 106 122 99·4 177 129 170 148 57·1 107 65·3 133 74·4 90·4 107 56·7782 389 395 186 257 257 277 280 215 141 113 123 114 178 125 197 155 53 127 78·1 130 75·4 90·2 112 72832 394 394 213 242 272 281 300 190 128 98 118 120 224 144 249 187 66·8 95·3 76·7 144 78·3 87·7 108 50·4882 454 421 199 196 277 262 289 150 135 103 124 103 269 153 193 168 73·5 101 99·8 130 60·5 81·9 115 72·1919 417 492 228 239 289 275 291 190 136 107 128 117 230 161 219 129 57 106 77 130 70·1 89·3 123 44·5792 363 415 202 228 248 263 307 205 146 135 114 264 160 217 177 76·7 101 88·1 151 72·1 100 117 85·4851 459 412 263 265 293 286 297 225 149 137 128 125 181 147 220 167 69·5 106 74·8 140 84·2 102 110 78·1887 435 465 221 218 319 279 266 204 126 122 124 138 224 158 203 194 75·3 107 81·3 129 76·5 95·4 99·2 73·4832 435 394 217 299 340 257 278 195 148 105 126 95 194 163 159 126 57·2 134 75·8 132 77·6 95·5 143 77·6922 460 430 234 301 298 278 301 181 138 121 141 108 250 134 232 188 55·9 108 74·8 132 90·3 97·9 101 77·8859 438 457 234 294 293 292 303 246 146 129 137 128 198 130 237 214 71·5 114 79·5 134 73 106 108 77·5926 479 416 261 289 352 270 305 154 149 127 122 110 204 128 151 174 77·4 120 83·5 147 88·2 96·6 114 67·1958 572 480 260 258 306 277 280 194 148 127 120 107 212 170 191 162 88·3 99·3 113 129 89·3 72·7 94·7 112988 472 460 277 253 318 294 304 203 144 129 129 138 260 144 235 196 79·4 112 91·6 122 76·8 112 110 63·61050 540 495 298 255 319 295 298 217 138 122 120 127 201 166 212 199 67·8 104 102 138 81·9 95·7 106 1081043 514 525 296 235 351 281 294 233 139 139 119 149 277 128 191 167 87 110 101 129 83·7 95·1 112 80968 451 546 256 289 338 309 299 217 146 117 130 142 206 152 244 244 90·7 107 93·7 121 86·6 103 116 47·81007 531 446 314 311 383 261 291 239 150 131 117 115 220 144 144 222 104 122 94·3 112 76·2 88·1 112 115982 566 469 332 301 326 296 316 243 165 151 121 144 251 133 175 209 106 116 84·6 127 95·9 107 109 1041000 503 473 292 273 299 302 305 302 152 139 133 139 264 160 221 248 102 127 81·6 133 96 107 115 1271066 567 465 300 311 326 313 298 229 162 150 137 129 254 147 212 241 89·2 105 98·2 126 98·6 125 112 1181122 623 497 367 289 343 305 295 254 154 143 127 138 254 147 193 251 122 113 99·7 125 89·7 100 112 1401260 742 488 362 265 339 317 280 277 131 140 113 135 274 136 141 107 132 105 118 117 92·9 119 103 90·81158 604 551 359 313 372 306 309 240 161 144 127 151 260 158 274 287 105 122 106 118 91·2 106 127 1031189 687 467 434 331 367 279 279 255 152 156 124 117 236 146 163 255 150 120 101 116 91·1 93·5 119 1341230 629 563 371 281 353 321 305 272 147 141 123 128 260 169 217 262 94·2 96·9 117 154 81·4 94·2 140 1031127 561 566 342 323 369 311 294 248 146 141 131 147 329 173 244 275 115 107 110 133 83·2 116 127 1341165 665 507 392 294 322 331 297 288 162 165 131 162 222 140 207 249 142 113 89·6 140 99 87·3 133 2141159 725 465 452 300 340 328 286 256 175 175 127 158 249 155 146 257 149 118 100 122 106 103 104 2041189 643 579 361 286 397 335 281 266 156 150 128 152 280 163 200 223 131 103 108 144 91·8 103 138 1211279 712 500 412 294 367 346 331 303 158 158 128 154 235 157 201 327 122 114 104 114 113 109 106 1741377 812 525 553 365 377 308 263 240 173 182 130 133 267 147 150 295 181 119 118 100 102 76·8 105 1801334 748 567 481 293 406 352 305 275 157 146 134 169 317 175 224 367 166 119 125 105 84·9 117 121 1291368 781 560 474 332 387 349 298 263 162 158 126 157 274 162 200 360 155 118 125 121 96·9 116 125 1391433 874 589 526 303 407 304 287 290 167 161 134 162 259 163 204 267 134 117 129 120 98·2 113 137 1841477 982 677 548 311 392 396 315 328 175 159 140 150 187 189 205 205 167 114 137 120 110 104 121 1811520 850 647 569 364 439 335 313 330 166 174 128 191 253 158 224 327 188 120 124 108 112 103 105 2021449 961 516 623 286 362 337 291 362 179 196 127 183 242 140 190 241 234 136 91·4 111 139 128 105 3141658 916 521 517 296 384 321 306 402 197 193 133 164 334 146 192 286 201 145 115 114 125 101 100 3011634 917 610 653 305 415 355 307 275 179 164 118 193 408 148 193 418 232 117 150 109 91 107 103 1711653 961 600 644 346 429 368 307 304 185 211 132 169 307 168 229 366 231 126 131 125 115 102 102 2301481 961 583 616 309 392 386 303 438 198 205 141 183 279 147 137 294 246 128 138 130 107 99·3 92·6 4071854 1171 638 761 333 473 375 299 346 185 189 122 160 359 150 220 335 204 129 156 113 103 99·4 115 2801818 1318 723 753 372 443 408 324 399 198 182 131 169 236 141 154 237 275 112 170 119 129 110 114 3151888
East of England, deprivation level 5South East England, deprivation level 5South West England, deprivation level 5East Midlands, deprivation level 5North East England, deprivation level 5Yorkshire and the Humber, deprivation level 5West Midlands, deprivation level 5South East England, deprivation level 4North West England, deprivation level 5Greater London, deprivation level 5East of England, deprivation level 4South West England, deprivation level 4Greater London, deprivation level 4North East England, deprivation level 4East Midlands, deprivation level 4Yorkshire and the Humber, deprivation level 4North West England, deprivation level 4West Midlands, deprivation level 4Greater London, deprivation level 3South East England, deprivation level 3South West England, deprivation level 3East of England, deprivation level 3EnglandNorth East England, deprivation level 3East Midlands, deprivation level 3Greater London, deprivation level 2Yorkshire and the Humber, deprivation level 3West Midlands, deprivation level 3South West England, deprivation level 2South East England, deprivation level 2North West England, deprivation level 3East of England, deprivation level 2Greater London, deprivation level 1West Midlands, deprivation level 2East Midlands, deprivation level 2Yorkshire and the Humber, deprivation level 2North East England, deprivation level 2North West England, deprivation level 2South East England, deprivation level 1East of England, deprivation level 1West Midlands, deprivation level 1East Midlands, deprivation level 1South West England, deprivation level 1Yorkshire and the Humber, deprivation level 1North East England, deprivation level 1North West England, deprivation level 1 1264 696 822 340 500 390 312 377 181 204 128 206 331 161 199 342 324 115 154 124 111 111 112 314
Significantly lower than meanIndistinguishable from meanSignificantly higher than mean
Ischa
emic
hear
t dise
ase
Lung
canc
er
Cere
brov
ascu
lar d
iseas
e
COPD
Alzh
eim
er’s
dise
ase
Low
er re
spira
tory
infe
ctio
ns
Colo
n an
d re
ctum
canc
ers
Brea
st ca
ncer
Self-
harm
Panc
reat
ic ca
ncer
Oth
er ca
rdio
vasc
ular
Pros
tate
canc
er
Oes
opha
geal
canc
er
Cong
enita
l ano
mal
ies
Oth
er n
eopl
asm
s
Road
inju
ry
Pret
erm
birt
h co
mpl
icatio
ns
Cirrh
osis
hepa
titis
C
Non
-Hod
gkin
lym
phom
a
Stom
ach
canc
er
Brai
n ca
ncer
Aort
ic an
eury
sm
Ova
rian
canc
er
Leuk
aem
ia
Drug
use
diso
rder
s
99·1
Articles
www.thelancet.com Published online September 15, 2015 http://dx.doi.org/10.1016/S0140-6736(15)00195-6 9
presents the results of the ANOVA analysis by year for various measures in this group. For men in 2013, at least 85% of variation was associated with IMD-2010 score, and less than 10% was associated with English region for all measures, whereas for women the values explained by level of deprivation of the area were slightly lower, especially for mortality.
Change across all deprivation areas was dominated by decreases in cardiovascular diseases and cancers. Increased death rates from cirrhosis of the liver, mental and substance use disorders, and neurological diseases, which were largest in the most deprived areas, reduced the progress that would otherwise have been achieved from reductions in other causes.
Figure 1 shows the leading causes of YLLs using broad disease categories (level 3 in the GBD cause hierarchy). The leading causes of death overall are shown in the appendix (p 1). Ranking is based on the number of YLLs from each cause, which is a function of age-specific rates and the distribution of the population by age and sex in 1990 and 2013. Changes in the number of YLLs and the age-standardised YLL rate are shown to highlight the effect of demographic change on numbers of YLLs (eg, YLLs due to Alzheimer’s disease and other dementias have increased by 31% despite a 3% decline in the age-standardised rate). The top four causes of death in 1990 (ischaemic heart disease, cerebrovascular disease, lung cancer, and chronic obstructive pulmonary disease [COPD]) remain at the top in 2013, despite substantial
declines in their age-standardised rates. Lung cancer and cerebrovascular disease switched ranks because of the large change in cerebrovascular disease age-standardised rates (−55%, 95% UI –59 to −50) between 1990 and 2013. Alzheimer’s disease and other dementias increased in rank (from eighth to fifth) even though there was a statistically non-significant decline in age-standardised rates; this needs to be considered in view of an increase in the recording of Alzheimer’s disease on death certificates.29 Lower respiratory infections, colorectal cancer, breast cancer, and self-harm all remained highly ranked but still showed reductions in age-standardised YLL rates of more than 34% and a reduction in numbers of YLLs. Large reductions in both numbers and rates of YLLs were also observed for preterm birth, road injuries, aortic aneurysm, and diabetes. By contrast, as for Alzheimer’s disease and other dementias, YLL numbers for several other cancer types increased even though age-standardised rates declined slightly. There were increases in both numbers and rates for only a small number of causes, notably cirrhosis of the liver due to hepatitis C and drug use disorders.
Figure 2 shows age-standardised YLL rates for both sexes from GBD level 3 causes in England and its nine regions relative to the EU15+ countries. Across the EU15+ countries, the absolute and relative ranges in age-standardised rates for different causes are markedly different. Within the EU15+ countries, the ratio of maximum rate to minimum rate is less than 2·0 for eight
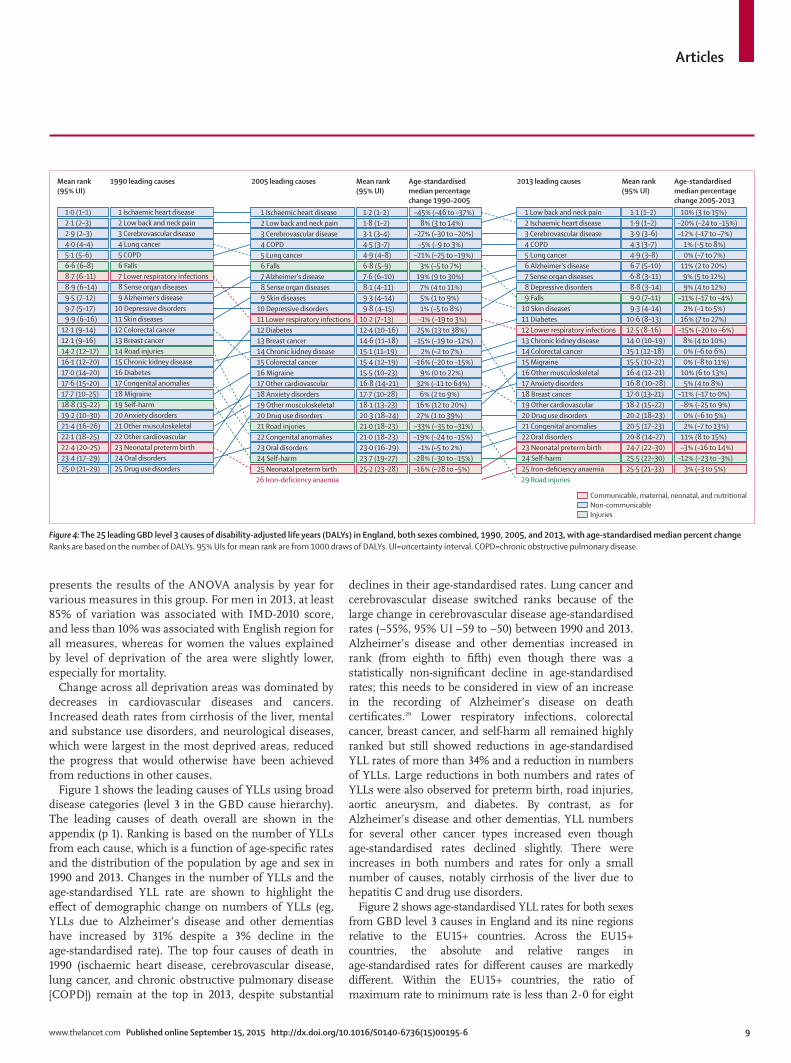
Figure 4: The 25 leading GBD level 3 causes of disability-adjusted life years (DALYs) in England, both sexes combined, 1990, 2005, and 2013, with age-standardised median percent changeRanks are based on the number of DALYs. 95% UIs for mean rank are from 1000 draws of DALYs. UI=uncertainty interval. COPD=chronic obstructive pulmonary disease.
1 Ischaemic heart disease2 Low back and neck pain3 Cerebrovascular disease4 Lung cancer5 COPD6 Falls7 Lower respiratory infections8 Sense organ diseases9 Alzheimer's disease
10 Depressive disorders11 Skin diseases12 Colorectal cancer13 Breast cancer14 Road injuries15 Chronic kidney disease16 Diabetes17 Congenital anomalies18 Migraine19 Self-harm20 Anxiety disorders21 Other musculoskeletal22 Other cardiovascular23 Neonatal preterm birth24 Oral disorders25 Drug use disorders
1·0 (1–1)2·1 (2–3)2·9 (2–3)4·0 (4–4)5·1 (5–6)6·6 (6–8)8·7 (6–11)8·9 (6–14)9·5 (7–12)9·7 (5–17)9·9 (6–16)
12·1 (9–14)12·1 (9–16)14·2 (12–17)16·1 (12–20)17·0 (14–20)17·6 (15–20)17·7 (10–25)18·8 (15–22)19·2 (10–30)21·4 (16–26)22·1 (18–25)22·4 (20–25)23·4 (17–29)25·0 (21–29)
1·1 (1–2)1·9 (1–2)3·9 (3–6)4·3 (3–7)4·9 (3–8)6·7 (5–10)6·8 (3–11)8·8 (3–14)9·0 (7–11)9·3 (4–14)
10·6 (8–13)12·5 (8–16)14·0 (10–19)15·1 (12–18)15·5 (10–22)16·4 (12–21)16·8 (10–28)17·0 (13–21)18·2 (15–22)20·2 (18–23)20·5 (17–23)20·8 (14–27)24·7 (22–30)25·5 (22–30)25·5 (21–33)
10% (3 to 15%)–20% (–24 to –15%)–12% (–17 to –7%)
1% (–5 to 8%)0% (–7 to 7%)
11% (2 to 20%)9% (5 to 12%)9% (4 to 12%)
–11% (–17 to –4%)2% (–1 to 5%)
16% (7 to 27%)–15% (–20 to –6%)
8% (4 to 10%)0% (–6 to 6%)0% (–8 to 11%)
10% (6 to 13%)5% (4 to 8%)
–11% (–17 to 0%)–8% (–25 to 9%)
0% (–6 to 5%)2% (–7 to 13%)
11% (8 to 15%)–3% (–16 to 14%)
–12% (–23 to –3%)3% (–3 to 5%)
1 Low back and neck pain2 Ischaemic heart disease3 Cerebrovascular disease4 COPD5 Lung cancer6 Alzheimer's disease7 Sense organ diseases8 Depressive disorders9 Falls
10 Skin diseases11 Diabetes12 Lower respiratory infections13 Chronic kidney disease14 Colorectal cancer15 Migraine16 Other musculoskeletal17 Anxiety disorders18 Breast cancer19 Other cardiovascular20 Drug use disorders21 Congenital anomalies22 Oral disorders23 Neonatal preterm birth24 Self-harm25 Iron-deficiency anaemia
1·2 (1–2)1·8 (1–2)3·1 (3–4)4·5 (3–7)4·9 (4–8)6·8 (5–9)7·6 (6–10)8·1 (4–11)9·3 (4–14)9·8 (4–15)
10·2 (7–13)12·4 (10–16)14·6 (11–18)
15·4 (12–19)15·5 (10–23)16·8 (14–21)17·7 (10–28)18·1 (13–23)20·3 (18–24)21·0 (18–23)21·0 (18–23)23·0 (16–29)23·7 (19–27)25·2 (23–28)
15·1 (11–19)
–45% (–46 to –37%)8% (3 to 14%)
–27% (–30 to –20%)–5% (–9 to 3%)
–21% (–25 to –19%)3% (–5 to 7%)
19% (9 to 30%)7% (4 to 11%)5% (1 to 9%)1% (–5 to 8%)
–1% (–19 to 3%)25% (13 to 38%)
–15% (–19 to –12%)
–16% (–20 to –15%)9% (0 to 22%)
32% (–11 to 64%)6% (2 to 9%)
16% (12 to 20%)27% (1 to 39%)
–33% (–35 to –31%)–19% (–24 to –15%)
–1% (–5 to 2%)–28% (–30 to –15%)–16% (–28 to –5%)
2% (–2 to 7%)
1 Ischaemic heart disease2 Low back and neck pain3 Cerebrovascular disease4 COPD5 Lung cancer6 Falls7 Alzheimer's disease8 Sense organ diseases9 Skin diseases
10 Depressive disorders11 Lower respiratory infections12 Diabetes13 Breast cancer14 Chronic kidney disease15 Colorectal cancer16 Migraine17 Other cardiovascular18 Anxiety disorders19 Other musculoskeletal20 Drug use disorders21 Road injuries22 Congenital anomalies23 Oral disorders24 Self-harm25 Neonatal preterm birth26 Iron-deficiency anaemia 29 Road injuries
Mean rank (95% UI)
Mean rank (95% UI)
1990 leading causes 2005 leading causes Age-standardised median percentage change 1990–2005
Mean rank (95% UI)
2013 leading causes Age-standardised median percentage change 2005–2013
Communicable, maternal, neonatal, and nutritionalNon-communicableInjuries

Articles
10 www.thelancet.com Published online September 15, 2015 http://dx.doi.org/10.1016/S0140-6736(15)00195-6
of the top 25 causes: leukaemia, ovarian cancer, brain cancer, other neoplasms, pancreatic cancer, breast cancer, colorectal cancer, and lung cancer. Ratios of maximum-to-minimum rate greater than 4·0 are seen for drug use disorders (10·4), oesophageal cancer (5·8), lower respiratory infections (4·2), neonatal preterm birth (4·5), self-harm (5·3), and stomach cancer (4·1). Across English regions, the only cause with a ratio of maximum-to-minimum rate greater than 2·0 is cirrhosis of the liver due to hepatitis C (2·3). Eight other disorders have a ratio between 1·5 and 2·0: ischaemic heart disease, lung cancer, COPD, congenital abnormalities, road injuries, neonatal preterm birth, stomach cancer, and drug use disorders. For some causes, such as lower respiratory infections and breast cancer, all English regions are significantly above the international mean, indicating that England is performing poorly for these disorders. For self-harm and road injuries, the opposite is true with all English regions being significantly below the mean.
Figure 3 is a comparison of age-standardised YLL rates for causes within each deprivation area with the England rate in 2013. Some causes such as ischaemic heart disease or COPD are largely ordered following the overall age-standardised YLL rate, whereas other causes have distinct patterns. Breast cancer and prostate cancer show much less variation across the deprivation areas. Other neoplasms and road injuries have variable patterns: in some regions, deprivation level 5 (least deprived) has higher rates than deprivation level 1 (most deprived) in other regions. Lymphoma, leukaemia, and brain cancer have distinctive patterns that do not follow levels of deprivation. The ratio of maximum age-standardised YLL rate to minimum age-standardised YLL rate across deprivation areas as a measure of relative inequality ranges from 1·3 (low) for prostate cancer to 9·2 (high) for drug use disorders. Other examples of high ratios include COPD (4·4), and cirrhosis from hepatitis C (7·1). In 2013, 91·1% of the variance in YLLs for men is explained by deprivation area and only 5·1% by region (table 1); for women, 78·7% of the variance is explained by deprivation area and 11·7% by region (table 1).
Levels of YLDs from 1990 to 2013 have changed much less than YLLs for England (appendix p 21). Figure 4 provides the overall assessment of trends in DALYs using level 3 of the GBD cause hierarchy from 1990 to 2013. The leading cause of DALYs in 2013 is low back and neck pain. Sense organ diseases, consisting of hearing loss and vision loss, and depressive disorders are leading causes of DALYs although they do not cause substantial YLLs. Other causes such as chronic kidney disease, migraine, and eating disorders are important causes of YLDs and DALYs. Other musculoskeletal disorders, anxiety disorders, and drug use disorders are also leading causes of DALYs. Age-standardised DALY rates by deprivation areas for the leading causes of DALYs are provided in the appendix (p 2). Some causes, such as depressive disorders, show substantial variation among deprivation areas across English regions. For many causes that predominantly lead to YLDs, UIs are large such that nearly all deprivation areas have levels that are not significantly different from the England mean.
DALY trends are a composite of trends in YLLs and YLDs; trends that in some cases, might be going in opposite directions. Examples of disorders for which YLL and YLD rates are changing in different directions, or where all measures are increasing markedly, can be seen in table 2. For instance, age-standardised YLL rates for prostate cancer significantly declined by 20·9% (95% UI 6·46–31·37), whereas YLD rates significantly increased by 42·6% (2·52–72·19). Such examples show that only summary measures combining morbidity, mortality, and disability data provide a comprehensive understanding of the effect of a disorder on a population.
Estimates for deaths, YLLs, YLD, and DALYs in England in 1990 and 2013 for all ages and age-standardised rates are provided in the appendix (pp 23–40).
Overall for England in 2013, all identified risk factors jointly explain 39·6% (95% UI 37·7–41·7) of DALYs, with the remaining 60∙4% DALYs as yet unexplained by the risk factors analysed (figure 5). Risk factors together explain 83·9% (81·6–86·2) of cardiovascular disease DALYs, 46·7% (44·5–49·3) of neoplasm DALYs, 49·7%
Deaths YLLs YLDs DALYs Total burden of DALYs 2013
Cerebrovascular disease –46·2% (–50·65 to –37·93)* –54·9% (–59·01 to –49·67)* 14·2% (7·89 to 20·12)* –49·8% (–54·40 to –44·69)* 535 900 (475 100 to 607 000)
Chronic obstructive pulmonary disease
–19·3% (–27·43 to –2·76)* –32·4% (–39·25 to –21·41)* –0·9% (–12·25 to 10·28) –21·9% (–28·42 to –15·25)* 527 200 (448 800 to 620 400)
Alzheimer’s disease and other dementias
6·9% (–6·42 to 20·11) –3·4% (–14·31 to 6·87) 0·2% (–11·40 to 10·40) –2·2% (–11·61 to 5·78) 463 400 (412 800 to 514 600)
Diabetes –50·4% (–53·89 to –46·91)* –55·8% (–58·66 to –52·73)* 75·3% (56·88 to 94·11)* 20·1% (5·51 to 34·98)* 360 200 (262 900 to 468 900)
Prostate cancer† –16·2% (–44·83 to 0·52) –20·9% (–51·37 to –6·46)* 42·6% (2·52 to 72·19)* –14·2% (–45·70 to 1·21) 138 100 (93 300 to 186 200)
Liver cancer 56·6% (11·83 to 87·65)* 41·0% (6·19 to 66·01)* 72·3% (18·86 to 126·55)* 41·4% (6·34 to 66·45)* 49 400 (37 500 to 57 200)
Cirrhosis of the liver 41·7% (31·71 to 51·08)* 50·8% (40·64 to 61·31)* 26·2% (20·17 to 32·34)* 50·0% (40·15 to 60·25)* 181 000 (169 000 to 192 500)
Drug use disorders 113·5% (6·99 to 143·31)* 107·7% (4·07 to 137·47)* –4·9% (–9·68 to 0·19) 18·2% (–1·56 to 28·47) 201 200 (157 300 to 246 500)
Data are percent change (95% UI). YLLs=years of life lost. YLDs=years lived with disability. DALYs=disability-adjusted life-years. *Statistically significant. †Men only.
Table 2: Change in age-standardised rates (per 100 000) of death, YLLs, YLDs, and DALYs for both sexes from 1990 to 2013 for select disorders in England and total DALYs in 2013
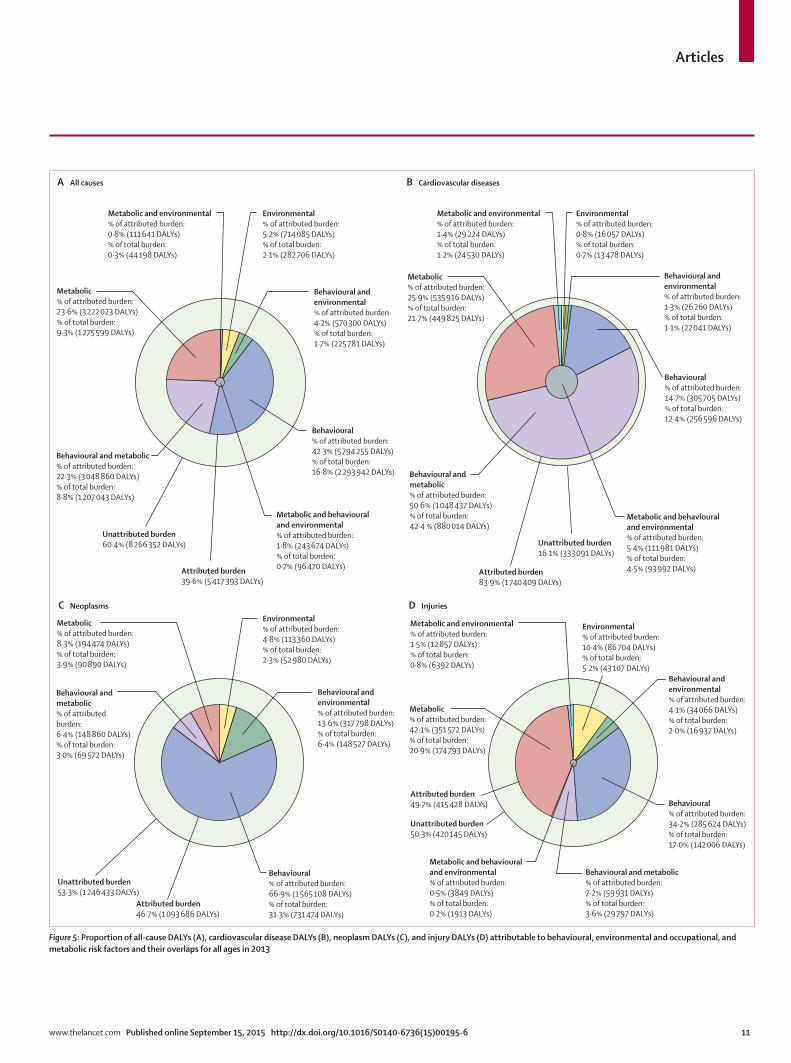
Articles
www.thelancet.com Published online September 15, 2015 http://dx.doi.org/10.1016/S0140-6736(15)00195-6 11
Metabolic and environmental % of attributed burden: 0·8% (111 641 DALYs) % of total burden: 0·3% (44 198 DALYs)
Metabolic% of attributed burden: 23·6% (3 222 023 DALYs) % of total burden: 9·3% (1 275 599 DALYs)
Behavioural and metabolic% of attributed burden: 22·3% (3 048 860 DALYs) % of total burden: 8·8% (1 207 043 DALYs)
Behavioural and metabolic% of attributed burden: 6·4% (148 860 DALYs) % of total burden: 3·0% (69 572 DALYs)
Behavioural and metabolic% of attributed burden: 7·2% (59 931 DALYs) % of total burden: 3·6% (29 797 DALYs)
Behavioural and metabolic% of attributed burden: 50·6% (1 048 437 DALYs) % of total burden: 42·4 % (880 014 DALYs)
Metabolic and environmental % of attributed burden: 1·4% (29 224 DALYs) % of total burden: 1·2% (24 530 DALYs)
Metabolic and environmental % of attributed burden: 1·5% (12 857 DALYs) % of total burden: 0·8% (6392 DALYs)
Environmental % of attributed burden: 5·2% (714 085 DALYs) % of total burden: 2·1% (282 706 DALYs)
Environmental % of attributed burden: 4·8% (113 360 DALYs) % of total burden: 2·3% (52 980 DALYs)
Environmental % of attributed burden: 0·8% (16 057 DALYs) % of total burden: 0·7% (13 478 DALYs)
Environmental % of attributed burden: 10·4% (86 704 DALYs) % of total burden: 5·2% (43 107 DALYs)
Behavioural % of attributed burden: 42·3% (5 794 255 DALYs) % of total burden: 16·8% (2 293 942 DALYs)
Behavioural % of attributed burden: 66·9% (1 565 108 DALYs) % of total burden: 31·3% (731 474 DALYs)
Behavioural % of attributed burden: 34·2% (285 624 DALYs) % of total burden: 17·0% (142 006 DALYs)
Behavioural and environmental % of attributed burden: 4·2% (570 300 DALYs) % of total burden: 1·7% (225 781 DALYs)
A All causes B Cardiovascular diseases
C Neoplasms D Injuries
Behavioural % of attributed burden: 14·7% (305 705 DALYs) % of total burden: 12·4% (256 596 DALYs)
Behavioural and environmental % of attributed burden: 1·3% (26 260 DALYs) % of total burden: 1·1% (22 041 DALYs)
Metabolic% of attributed burden: 25·9% (535 916 DALYs) % of total burden: 21·7% (449 825 DALYs)
Metabolic and behavioural and environmental % of attributed burden: 1·8% (243 674 DALYs)% of total burden: 0·7% (96 470 DALYs)
Metabolic and behavioural and environmental % of attributed burden: 5·4% (111 981 DALYs)% of total burden: 4·5% (93 992 DALYs)
Metabolic and behavioural and environmental % of attributed burden: 0·5% (3849 DALYs)% of total burden: 0·2% (1913 DALYs)
Behavioural and environmental % of attributed burden: 4·1% (34 066 DALYs)% of total burden: 2·0% (16 937 DALYs)
Unattributed burden60·4% (8 266 352 DALYs)
Attributed burden39·6% (5 417 393 DALYs)
Unattributed burden53·3% (1 246 433 DALYs)
Attributed burden46·7% (1 093 686 DALYs)
Unattributed burden16·1% (333 091 DALYs)
Attributed burden83·9% (1 740 409 DALYs)
Behavioural and environmental % of attributed burden: 13·6% (317 798 DALYs) % of total burden: 6·4% (148 527 DALYs)
Metabolic% of attributed burden: 8·3% (194 474 DALYs) % of total burden: 3·9% (90 890 DALYs)
Metabolic% of attributed burden: 42·1% (351 572 DALYs) % of total burden: 20·9% (174 793 DALYs)
Unattributed burden50·3% (420 145 DALYs)
Attributed burden49·7% (415 428 DALYs)
Figure 5: Proportion of all-cause DALYs (A), cardiovascular disease DALYs (B), neoplasm DALYs (C), and injury DALYs (D) attributable to behavioural, environmental and occupational, and metabolic risk factors and their overlaps for all ages in 2013

Articles
12 www.thelancet.com Published online September 15, 2015 http://dx.doi.org/10.1016/S0140-6736(15)00195-6
Figure 6: Disability-adjusted life-years (DALYs) attributed to level 2 risk factors in 2013 in England for both sexes combined (A), men (B), and women (C)
HIV/AIDS and tuberculosisDiarrhoea, lower respiratory, and other common infectious diseasesMaternal disordersNutritional deficienciesOther communicable, maternal, neonatal, and nutritional diseasesNeoplasmsCardiovascular diseasesChronic respiratory diseases
CirrhosisDigestive diseasesNeurological disordersMental and substance use disordersDiabetes, urogenital, blood, and endocrine diseasesMusculoskeletal disordersOther non-communicable diseasesTransport injuriesUnintentional injuriesSelf-harm and interpersonal violence
0 2·5 5·0 7·5 10·0 12·5 15·0DALYs (%)
Dietary risksTobacco smoke
High body-mass indexHigh systolic blood pressure
Alcohol and drug useHigh fasting plasma glucose
High total cholesterolLow glomerular filtration rate
Low physical activityOccupational risks
Air pollutionLow bone mineral density
Child and maternal malnutritionSexual abuse and violenceOther environmental risks
Unsafe sexUnsafe water, sanitation, and handwashing
A
Dietary risksTobacco smoke
High body-mass indexHigh systolic blood pressure
Alcohol and drug useHigh total cholesterol
High fasting plasma glucoseOccupational risks
Low glomerular filtration rateLow physical activity
Air pollutionLow bone mineral density
Child and maternal malnutritionOther environmental risksSexual abuse and violence
Unsafe sexUnsafe water, sanitation, and handwashing
B
Tobacco smokeHigh body-mass index
Dietary risksHigh systolic blood pressureHigh fasting plasma glucose
Alcohol and drug useLow glomerular filtration rate
Low physical activityHigh total cholesterol
Low bone mineral densityOccupational risks
Air pollutionChild and maternal malnutrition
Sexual abuse and violenceUnsafe sex
Other environmental risksUnsafe water, sanitation, and handwashing
C

Articles
www.thelancet.com Published online September 15, 2015 http://dx.doi.org/10.1016/S0140-6736(15)00195-6 13
(46·5–52·6) of injury DALYs, 62·0% (57·9–65·9) of chronic respiratory disease DALYs, but only 1·9% (1·4–2·4) of neurological disease DALYs (figure 5; DALYs attributable to risk factors for chronic respiratory disease and neurological disease are not presented; for DALYs attributable to all risk factors, see appendix p 41).
Behavioural risks account for 28·0% (95% UI 25·6–30·3) of DALYs, metabolic risks for 19·2% (18·0–20·5), and environmental and occupational risks for 4·7% (4·3–5·2). Almost half of DALYs due to metabolic risks overlap with behavioural risks, which is particularly large for cardiovascular disease. Behavioural risks (particularly tobacco and dietary risks) are the greatest contributor to cancer with more modest contributions from metabolic risks and environmental and occupational risks. Low bone mineral density and alcohol consumption are the dominant metabolic and behavioural risks, respectively, for injuries (figure 5).
The largest contributor to DALYs are dietary risks (10·8%, 95% UI 9·1–12·7), an aggregate in the second tier of the GBD risk hierarchy of low fruit consumption, low vegetables consumption, low whole-grains consumption, low nuts and seeds consumption, low milk consumption, high red meat consumption, high processed meat consumption, high sugar-sweetened beverages con-sumption, low fibre consumption, suboptimal calcium intake, low seafood omega-3 fatty acids consumption, low polyunsaturated fatty acids consumptions, high trans fats intake, and high sodium intake, closely followed by tobacco (10·7%, 9·4–12·0) (figure 6).
The rates of DALYs attributed to each of the three major risk categories have declined between 1990 and 2013: by 28·3% (95% UI 25·0–31·5) for metabolic risks, by 23·7% (21·5–26·0) for behavioural risks, and by 28·8% (23·7–35·0) for environmental and occupational risks (data not shown). Declines are due to reductions in DALY rates attributable to most risk factors: between 1990 and 2013, DALY rates significantly declined for 11 of the 15 largest risks at tier 3 in the risk hierarchy (tobacco, high blood pressure, cholesterol, low glomerular filtration rate, low physical activity, diet low in fruit, vegetables, nuts, and seeds, diet high in sodium and processed meat, and air pollution), but remained unchanged for high body-mass index (BMI), high fasting plasma glucose, and alcohol. Illicit drug use is the only top 15 risk for which the DALY rates increased significantly. These changes in DALY rates attributed to major risks can be caused by a change in risk exposure, a change in outcomes associated with the risk, or a combination of the two. There was a significant decline in exposure to tobacco, high blood pressure, cholesterol, and air pollution. Exposure to the top dietary risks, physical activity, alcohol use, and low glomerular filtration rate changed little. Exposure to high BMI and high fasting plasma glucose increased significantly, but large declines in cardiovascular disease outcomes are mainly responsible for the difference in trends between exposure and attributable burden. Of the
ten leading tier 2 risks, seven cause a greater proportion of total DALYs in men than in women. The exceptions are physical inactivity, fasting plasma glucose, and low glomerular filtration rate, with equal proportions of DALYs between men and women (figure 6).
The leading risk factors by deprivation level in England are shown in the appendix (p 3). There is a consistency of rank order of major risk factors: smoking, high BMI, and high blood pressure are the leading risks in all deprivation areas. Smoking is strongly socially stratified: it ranks above high BMI in deprivation level 1 (most deprived) in all English regions, but the converse is true in deprivation levels 4 and 5 across seven of those nine regions. In deprivation level 1 in six regions, alcohol use is the fourth leading risk factor, whereas it is high fasting plasma glucose for other regions. Drug use is a more highly ranked risk factor in most of the more deprived areas when compared with less deprived areas.
DiscussionEngland had better than average outcomes in 2013 when compared with EU15+ countries and other countries of the UK. Despite sharing the same health and social care system, some English regions have outcomes commensurate with, or better than, those of the best-performing nations among the EU15+ countries, whereas others have outcomes worse than any of these countries. Life expectancy has increased at all levels of deprivation within English regions, but the variation in life expectancy within regions has decreased only slightly for women and not at all for men.
Routine annual mortality statistics show a year-on-year decline in age-standardised mortality rates in England and the rest of the UK from 1983 to 2013:30 mortality rates in Scotland are known to have been higher than in England, whereas mortality rates in Wales and Northern Ireland, although higher, have generally been closer to those in England. Routine statistics show that the range in life expectancy at birth between regions has reduced for men in the past 5 years, from 2·7 years to 2·4 years, but stayed the same for women, at 2·4 years.31 Our results show a larger range in life expectancy between deprivation areas, at 8·2 years for men and 6·9 years for women in 2013, with only a small reduction since 1990 for women and none for men. Routine mortality statistics undifferentiated by deprivation thus mask substantial inequalities within English regions (figure appendix 2). Consistent with other analyses,32–35 geography accounted for only a small proportion of the variance between deprivation areas (table 1). At the district level, populations are more homogeneous, and inequalities in mortality rates more evident. District-level data reported by Bennett and colleagues36 suggest inequalities at this level are increasing. Inequality within regions is therefore greater than it is between them, and it is therefore important to address the problems caused by deprivation wherever they occur and in all regions of the country.
Articles
14 www.thelancet.com Published online September 15, 2015 http://dx.doi.org/10.1016/S0140-6736(15)00195-6
Many of the most common causes of DALYs show striking variation by deprivation area (appendix p 2); as for mortality, this inequality largely follows patterns determined by level of deprivation, not geography. For low-mortality disorders, such as musculoskeletal disease, DALYs tend to be based on incomplete data at subnational level, and the level of inequality for many disorders is likely to be underestimated.
The Greater London deprivation groups are an exception to the overall pattern of inequality because their burden of disease is less than expected for their level of deprivation (see figure appendix 2 and appendix p 2). Possible explanations include artifact due to the method of measuring deprivation, ethnic composition of the population, healthy migrant effect, and differential selective migration within England.37 London has also received more health investment than other English regions. The effect of health-care spending on the outputs from GBD would be a useful next stage of analysis.
Improvements in life expectancy in England, as elsewhere, have been driven by decreases in mortality from cardiovascular disease and cancers.38 Increasing mortality from neurological disorders and cirrhosis of the liver have partially offset these gains. In other countries, the negative effect of liver disease has been much less marked (see France, Spain, Sweden, and Italy in figure appendix 2). This rising burden of liver disease in England requires both a policy and health-care response.39 Among the other leading causes of premature death, Alzheimer’s disease and other dementias are increasingly important, although age-specific death rates have declined slightly, consistent with a decline observed in serial prevalence surveys.21,40–42
Significant differences in YLL rates by country for specific causes (figure 2) include various cancers. International and subnational differences in mortality are likely to be strongly driven by differences in incidence as well as in survival (eg, for lung cancer). Any national strategy for cancer needs to address primary prevention as well as effective care for people with cancer.
Musculoskeletal disorders are a dominant cause of YLDs, and consume a substantial amount of health-system resources. These disorders are strongly age-related and will become increasingly prevalent as the population ages.43 Another major contributor to YLDs are depressive and anxiety disorders, the rates of which have not declined. Given the epidemiological assessment of relative burden, services for these disorders rarely receive the attention they deserve. This relative neglect is beginning to change with calls for parity of esteem for mental and physical health. Opportunities to improve management of anxiety and depression in primary care exist;44–46 evidence suggests that prevention aimed at high-risk groups before depression arises is effective.47
For several disorders, although mortality rates may have reduced, the burden of ill health has either not declined by the same extent or is increasing. In England, and in other
high-income countries, a larger share of DALYs now comes from YLDs, rather than YLLs. For example, in cerebrovascular disease and diabetes, YLLs have decreased, but YLDs have increased significantly; for COPD, YLLs have decreased significantly but with almost no change in YLDs. Whereas mortality rates from cardiovascular complications of diabetes have fallen, the prevalence of people living with diabetes is rising. Data from the National Diabetes Audit show that 36·0% of people with diagnosed diabetes living in England are estimated to have had their HbA1c, blood pressure, and cholesterol values treated to target in 2012–13.48 These data together indicate a high level of unmet need for prevention of the consequences of diabetes and for the active management of long-term disorders in general.
In some cases, the increasing relative contribution of YLDs might be the effect of improved survival (eg, from stroke and some cancers), leading to higher prevalence and many people living with disorders that previously would have proved fatal. Survivors will also be at risk of developing other disorders, particularly disorders associated with ageing, leading to steadily increasing lifetime risks of some cancers and of musculoskeletal disease, for example. One consequence of the growing phenomenon of survivorship, together with the effect of population ageing, will be much higher numbers of patients with multimorbidity than in the past.
A major strength of the GBD study is the ability to estimate the contribution of different causal factors to the burden of mortality and morbidity and, by implication, the extent to which that burden could be reduced by modifying those risks. GBD 2013 was developed to increase understanding of the individual and overlapping effects of different risk factors, generating outputs that are more informative to formulate preventive strategies. The overall proportion of preventable burden reduced between 1990 and 2013 because of the decline in the incidence of the more preventable diseases (ischaemic heart disease and some cancers) and a relative increase in other diseases with an apparently lower potential for prevention (neurological disorders, and Alzheimer’s disease and other dementias).
Important metabolic risks, including high blood pressure, high fasting plasma glucose, low glomerular filtration rate, and high cholesterol, overlap significantly with modifiable behavioural risk factors, such as diet and physical activity; for example, mean systolic blood pressure in the UK has fallen by over 3 mm Hg in the last decade, mainly as a result of reduced dietary salt intake.49,50 In general, behavioural risk factors make a greater contribution to DALYs (28%) than metabolic risks (19%) or environmental and occupational risks (5%). The relative contribution of individual risks and type of risk will vary by disorder. Environmental risks, such as air pollution, albeit smaller than the other two risk categories, remain quantitatively important and require specific consideration within national and local public health policy and strategy.

Articles
www.thelancet.com Published online September 15, 2015 http://dx.doi.org/10.1016/S0140-6736(15)00195-6 15
The combination of unhealthy diets, physical inactivity, and high BMI is the biggest overall contributor to DALYs. Tobacco smoking remains a leading attributable risk factor for DALYs in England, and is notably still the leading risk factor for women. In line with this, mortality from lung cancer for men declined by 24% between 1990 and 2013 but did not change significantly for women. The peak effect of smoking in women is probably only now being reached in England.38
Alcohol consumption is the third leading behavioural risk factor overall but is the leading behavioural cause of injury. In GBD 2013, only about a third of deaths from cirrhosis could categorically be assigned to alcohol as the underlying cause (cirrhosis due to alcohol accounts for only 29·4% of DALYs due to cirrhosis; appendix p 36); however, alcohol also contributes to cirrhosis where it is not the underlying cause. In the risk factor analysis, therefore, the proportion of cirrhosis of the liver DALYs attributed to alcohol in England was 69·5% in 2013. This estimate is comparable to findings of another study39 that showed 75% of cirrhosis of the liver to be attributable to alcohol. Improved data on cirrhosis of the liver and liver cancer by aetiology are needed, including a better assessment of the role of obesity as a cause of fatty liver disease.51–55 The contributions of various aetiologies to cirrhosis of the liver will probably vary geographically across England.
Most, if not all, behavioural, metabolic, and environ-mental and occupational risks are strongly related to the socioeconomic determinants of health, which need to be addressed in any credible public health strategy.56 In future rounds of the GBD study, we plan to quantify socioeconomic determinants of health more directly.
This study has several important limitations beyond those applying more generally to GBD studies and reported elsewhere.
First, the level of aggregation of causes affects their relative ranking (eg, splitting cirrhosis of the liver by cause affects where the individual causes appear in the rankings). The online data visualisations associated with this study allow the user to interrogate the results using different levels of the GBD cause hierarchy.
Second, subnational data at the regional level are not available for the estimation of prevalence and incidence for several diseases. Estimates depend on the GBD Bayesian models, borrowing from studies in other settings while using covariates as predictors. This limitation could be improved by collecting additional data on morbidity in the English population. Possible approaches include increasing the sample size of the Health Survey for England and augmenting the inc reased sample size with additional health examinations, incorporating data from large primary care surveys, such as the Clinical Practice Research Datalink, or further use of linked primary and secondary care datasets. These estimates might be affected by supply and access factors.
Third, we assigned each lower super output area on the basis of the level of deprivation in 2010 and used this assignment for the analysis in all time periods. As some of the lower super output areas may have changed their relative level of deprivation during the period, we might have underestimated some of the inequalities related to deprivation in 1990. Any reductions in inequality would probably be underestimated because of this approach. Such errors could be assessed by reference to longitudinal studies such as the ONS Longitudinal Study. Furthermore, deprivation is measured at the time that disease outcome is recorded, whereas the contribution of deprivation is relevant across the lifecourse. The estimation of the relation between deprivation and disease does not account for this, thereby potentially underestimating its effect in some areas and overestimating it in others.
Fourth, in view of the limited data by deprivation level for some causes that do not affect mortality, inequality across deprivation levels might be substantially under-estimated in the analysis of YLDs.
Fifth, the current GBD method for risk factor attribution uses data on exposure to single risk factors and its effect on each outcome, whereas aggregated effects of risk factors are made on the basis of assumptions of additive, multiplicative, or mediated effects and not on the direct measurement of exposure to combined risk factors and the combined effect on outcomes.
Finally, in some analyses, comparisons are made between English regions and other countries. Although some English regions are similar in size to several of the countries in the EU, the potential for differential migration between English regions is greater than between countries; such comparisons are not straightforward.
Some limitations are specific to certain disorders. The comparative risk assessment, based on the criterion of convincing or probable evidence, did not identify any modifiable risk factors for Alzheimer’s disease and other dementias as suitable targets for public health action. Some studies suggest that modifiable behavioural risks do exist,57–62 but more research is needed to determine whether these findings would meet the criterion for inclusion in the GBD framework. In future rounds of GBD, we intend to make separate estimates for Alzheimer’s disease and vascular dementia and will assess the evidence for the effect of some metabolic and behavioural risk factors on vascular dementia in particular. In the GBD 2013 framework, dementia in Parkinson’s disease or in stroke is considered in the respective disease categories rather than in the Alzheimer’s and other dementias category.
We estimate that about 3600 deaths were attributable to self-harm in England in 2013. This differs from official figures released by the Office for National Statistics, which indicate 4722 suicides in England in 2013.63 This difference is due to the partial redistribution in the GBD study of ICD-10 mortality codes for injury and poisoning of undetermined intent (ICD-10 codes Y10–Y34) to
For the ONS Longitudinal Study see http://www.ons.gov.uk/ons/guide-method/user-guidance/longitudinal-study/index.html
For the IHME online data visualisations see http://vizhub.healthdata.org/gbd-compare/england

Articles
16 www.thelancet.com Published online September 15, 2015 http://dx.doi.org/10.1016/S0140-6736(15)00195-6
suicide as opposed to all these codes being counted as suicide by the Office for National Statistics; our estimates will therefore underestimate the overall suicide burden in England compared with official figures. Furthermore, when we estimated the attributable risk for mental and substance use disorders and self-harm, social risk factors (for example, divorce, low income, debt and job loss) were not included and therefore not attributed.
The contribution of diet components other than sugar-sweetened beverages to BMI has not been included in this analysis; therefore, the full consequences of diet might be greater than the effect shown in these results.
No comprehensive picture has been made of the level and distribution of the burden of disease in England, despite the fact that health policy is now devolved to individual countries within the UK. The outputs of such a framework can help test whether the effort being expended on a particular disease or risk factor is proportionate to burden or attributable risk, respectively. Our results therefore have implications for national government, local government, and health services in England.
For national government, the quantification by the GBD study of the continuing burden of preventable ill health more than justifies recent calls for a “radical upgrade in prevention and public health”.3 National government will also be concerned that improvements in premature mortality in England are diminished by increases in deaths from liver disease, by contrast with the declines seen in similar countries such as France.
For English local authorities in their new role as leaders for local population health, the most striking findings relate to inequalities, not only the size and nature of the effect of deprivation on health but also that the gap between the most deprived and least deprived areas of England shows little sign of reducing. The GBD 2013 results underline the fact that local authorities in the more disadvantaged regions of England are not the only ones that need to tackle the effects of deprivation, and to make this task a priority.
For health services, one important implication of our results is the scale of the increasing level of disability and, especially, the growth of multimorbidity. This new form of demand requires new and more integrated models of care spanning health and social services that respond to the specific needs and circumstances of individual patients. The other important implication for health services is that about 40% of their workload is potentially preventable, yet the proportion of health expenditure directed at prevention, although hard to estimate reliably, is probably closer to 4%.64
Combining GBD results with data on expected trends in population structure and risk factors could be used to anticipate future disease burden and thereby provide an important input to economic models and forecasts. This will be addressed in future GBD work. The importance of prevention argues for robust, standardised, comparative assessments of the cost-effectiveness of different public
For NICE’s 2013 guide to technology appraisal see http://
www.nice.org.uk/article/pmg9/chapter/foreword
health policies to aid decision making, akin to those used in England for health technologies. Such assessments are likely to highlight the need for more empirical evidence of the effectiveness of specific preventive approaches. Finally, there are substantial gaps in routine and survey data on the prevalence of morbidity at the subnational level that could be addressed.
If the levels of health seen in the best performing English regions could be achieved in the worst performing regions, England would have a level of overall burden of disease as low as any country with a developed post-industrial economy. This interpretation provides a strong argument for implementing policies for effective prevention and treatment, but these policies must also be designed to reduce inequalities associated with the socioeconomic determinants of health.ContributorsJNN, ADMB, CJLM, TV, JDS, SMB, DC, and MMC prepared the first and subsequent drafts and finalised the report on the basis of feedback from all other authors and reviewers. AJH, CG, and MMcK contributed to the writing of more than one draft. HR, KSB, CEGB, TSB, SC, PE, FG, MAG, DJG, HH, RAL, HM, CRN, PS, AT, JV, and ADW contributed to the writing about specific diseases, conditions, or topics. ACJD, CJLM, HW, MN, JCS, and AJH were involved in the origination and development of the concept. ACJD, CJLM, DD, KJF, HW, MN, MHF, SLO, RMB, JDS, RE, SMB, DC, MMC, MSF, and AES were involved in the development and execution of the GBD 2013 methodology. MHF, SLO, RMB, JDS, AJH, DFJF, SMB, CEGB, TSB, DC, MMC, KJL, AJM-J, and FEM provided data. AJH, DFJF, IA, MSF, FEM, KR, and AES prepared the data. DD, KJF, AJH, DFJF, MSF, FEM, and AES analysed the data. JNN, ADMB, CJLM, DD, KJF, MHF, SLO, RMB, JCS, AJH, DFJF, RE, CG, KSB, CEGB, AJM-J, and ACJD were involved in data interpretation. DD, KJF, MHF, RMB, TV, JDS, JCS, AJH, DFJF, CG, MMcK, HR, IA, HRA, AB, SMB, CEGB, NGB, DC, RC, MMC, MKD, PE, ME, KAF, MSF, TF, FG, MAG, BMH, RJH, SIH, HJL, KJL, RL, AJM-J, FEM, MEM, NP, FBP, DP, KR, AR, PS, AES, IS, LS, CDAW, ADW, and ACJD reviewed and commented extensively on several drafts. HR, RA, AB, DAB, EB, KSB, RRB, CEGB, TSB, MB, SC, RC, CC, JAC, PID, DJG, HH, RAL, AJM-J, HM, MEM, NP, AT, JV, HCW, and ADW reviewed and commented extensively on specific diseases, disorders, or topics. JCS, AJH, DFJF, RE, CG, MMcK, and HM responded extensively to peer-reviewers’ comments. JCS, AJH, DFJF, MMcK, HR, IA, HRA, EB, KSB, RRB, CEGB, NGB, TSB, RC, MKD, PE, ME, RJH, RAL, WM, MEM, CRN, DP, HCW, CDAW, ADW, and ACJD are members of the GBD England Expert or Steering Group.
Declaration of interestsJNN, JCS, AJH, DFJF, RE, CG, FG, KAF, BMH, AT, and ACJD were employed by Public Health England during the study. ADMB is a Wellcome Trust-funded Research Training Fellow. CG reports personal fees from Meteos outside the submitted work. DJG is a member of the England National Suicide Prevention Strategy Advisory Group. KJL reports personal fees from WHO during the study and personal fees from WHO outside the submitted work. LS reports grants from the Wellcome Trust during the study, grants from the Wellcome Trust, Medical Research Council, and National Institute for Health Research outside the submitted work, and personal fees from GlaxoSmithKline outside the submitted work. ADW is the Chair of the Global Alliance for Musculoskeletal Health of the Bone and Joint Decade. All other authors declare no competing interests.
AcknowledgmentsWe thank Sonya Clark for project support to the Public Health England GBD team, Kelly Bienhoff for project management for the Institute for Health Metrics and Evaluation team, and Erica Ison (Better Value Healthcare, on behalf of Public Health England) for editing and version control of the manuscript. We are grateful for the care taken by the peer reviewers and for their many helpful comments and suggestions.
Articles
www.thelancet.com Published online September 15, 2015 http://dx.doi.org/10.1016/S0140-6736(15)00195-6 17
References1 Murray CJL. Richards MA, Newton JN, et al. UK health
performance: findings of the Global Burden of Disease Study 2010. Lancet 2013; 381: 997–1020.
2 Greer SL. Devolution and divergence in UK health policies. BMJ 2008; 337: a2616.
3 England NHS. Five year forward view. 2014. http://www.england.nhs.uk/ourwork/futurenhs/ (accessed Aug 24, 2015).
4 Naghavi M, Wang H, Lozano R, and the GBD 2013 Mortality and Causes of Death Collaborators. Global, regional and national levels of age-specific mortality and 240 causes of death, 1990–2013: a systematic analysis for the Global Burden of Disease Study 2013. Lancet 2015; 385: 117–71.
5 Global Burden of Disease Study 2013 Collaborators. Global, regional, and national incidence, prevalence, and years lived with disabilities for 301 acute and chronic diseases and injuries for 188 countries, 1990–2013: a systematic analysis for the Global Burden of Disease Study 2013. Lancet 2015; 386: 743–800.
6 Global Burden of Disease Study 2013 Collaborators. Global, regional, and national comparative risk assessment of 76 behavioural, environmental, occupational, and metabolic risks or clusters of risks in 188 countries 1990–2013: a systematic analysis for the Global Burden of Disease study 2013. Lancet 2015; published online Sept 11. http://dx.doi.org/10.1016/S0140-6736(15)00128-2.
7 GBD 2013 DALYs and HALE Collaborators. Global, regional, and national disability-adjusted life years (DALYs) for 306 diseases and injuries and healthy life expectancy (HALE) for 188 countries, 1990–2013: quantifying the epidemiological transition. Lancet 2015; published online Aug 27. http://dx.doi.org/10.1016/S0140-6736(15)61340-X.
8 Vos T, Flaxman AD, Naghavi M, et al. Years lived with disability (YLDs) for 1160 sequelae of 289 diseases and injuries 1990–2010: a systematic analysis for the Global Burden of Disease Study 2010. Lancet 2012; 380: 2163–96.
9 Murray CJL, Ezzati M, Flaxman AD, et al. GBD 2010: design, definitions, and metrics. Lancet 2012; 380: 2063–66.
10 Office for National Statistics. Statistical Bulletin. Super output area population estimates, mid-2011 (census based). http://www.ons.gov.uk/ons/dcp171778_302853.pdf (accessed Aug 24, 2015).
11 Mclennan D, Barnes H, Noble M, Davies J, Garratt E. The English indices of deprivation 2010. Technical report. London: Department for Communities and Local Government, 2011. https://www.gov.uk/government/uploads/system/uploads/attachment_data/file/6320/1870718.pdf (accessed Aug 24, 2015).
12 Adams J, White M. Removing the health domain from the Index of Multiple Deprivation 2004—effect on measured inequalities in census measure of health. J Public Health (Oxf) 2006; 28: 379–83.
13 Wang H, Dwyer-Lindgren L, Lofgren KT, et al. Age-specific and sex-specific mortality in 187 countries, 1970–2010: a systematic analysis for the Global Burden of Disease Study 2010. Lancet 2012; 380: 2071–94.
14 Murray CJL, Rajaratnam JK, Marcus J, Laakso T, Lopez AD. What can we conclude from death registration? Improved methods for evaluating completeness. PLoS Med 2010; 7: e1000262.
15 Naghavi M, Makela S, Foreman K, O’Brien J, Pourmalek F, Lozano R. Algorithms for enhancing public health utility of national causes-of-death data. Popul Health Metr 2010; 8: 9.
16 Lozano R, Naghavi M, Foreman K, et al. Global and regional mortality from 235 causes of death for 20 age groups in 1990 and 2010: a systematic analysis for the Global Burden of Disease Study 2010. Lancet 2012; 380: 2095–128.
17 Ahern RM, Lozano R, Naghavi M, Foreman K, Gakidou E, Murray CJ. Improving the public health utility of global cardiovascular mortality data: the rise of ischemic heart disease. Popul Health Metr 2011; 9: 8.
18 Foreman KJ, Lozano R, Lopez AD, Murray CJ. Modeling causes of death: an integrated approach using CODEm. Popul Health Metr 2012; 10: 1.
19 Office for National Statistics. Statistical Bulletin. Suicides in the United Kingdom, 2012 registrations. 2014. http://www.ons.gov.uk/ons/dcp171778_351100.pdf (accessed Aug 24, 2015).
20 Health Survey for England—2013. Dec 10, 2014. http://www.hscic.gov.uk/catalogue/PUB16076 (accessed Feb 26, 2015).
21 Matthews FE, Arthur A, Barnes LE, et al. A two-decade comparison of prevalence of dementia in individuals aged 65 years and older from three geographical areas of England: results of the Cognitive Function and Ageing Study I and II. Lancet 2013; 382: 1405–12.
22 Salomon JA, Haagsma JA, Davis ACJ, et al. Disability weights for the Global Burden of Disease 2013 Study. Lancet Glob Health (in press).
23 Haagsma JA, de Noordhout CM, Polinder S, et al. Assessing disability weights based on the responses of 30 660 people from four European countries. Popul Health Metr 2015; 13: 10.
24 Preston S, Heuveline P, Guillot M. Demography: measuring and modeling population processes, 1st edn. Malden, MA: Wiley-Blackwell, 2000.
25 Beltrán-Sánchez H, Preston SH, Canudas-Romo V. An integrated approach to cause-of-death analysis: cause-deleted life tables and decompositions of life expectancy. Demogr Res 2008; 19: 1323–50.
26 Salomon JA, Wang H, Freeman MK, et al. Healthy life expectancy for 187 countries, 1990–2010: a systematic analysis for the Global Burden Disease Study 2010. Lancet 2012; 380: 2144–62.
27 Murray CJL, Vos T, Lozano R, et al. Disability-adjusted life years (DALYs) for 291 diseases and injuries in 21 regions, 1990–2010: a systematic analysis for the Global Burden of Disease Study 2010. Lancet 2012; 380: 2197–223.
28 Gelman A. Analysis of variance—why it is more important than ever. Ann Stat 2005; 33: 1–53.
29 National End of Life Care Intelligence Network. Deaths from Alzheimer’s disease, dementia and senility in England. 2010. http://www.endoflifecare-intelligence.org.uk/resources/publications/deaths_from_alzheimers (accessed Aug 24, 2015).
30 Office for National Statistics. Mortality in the United Kingdom, 2010. Jan 20, 2012. http://www.ons.gov.uk/ons/dcp171780_251270.pdf (accessed Aug 24, 2015).
31 Office for National Statistics. Statistical Bulletin. National life tables, United Kingdom, 2011–2013. Sept 25, 2014. http://www.ons.gov.uk/ons/rel/lifetables/national-life-tables/2011-2013/stb-uk-2011-2013.html (accessed Aug 24, 2015).
32 Green M. Death in England and Wales: using a classificatory approach for researching mortality. PhD thesis, University of Sheffield, 2013.
33 Green MA, Vickers D, Dorling D. A neighbourhood level mortality classification of England and Wales, 2006–2009. Health Place 2014; 30: 196–204.
34 Rasulo D, Bajekal M, Yar M. Inequalities in health expectancies in England and Wales—small area analysis from the 2001 census. Health Stat Q 2007; 34: 35–45.
35 Office for National Statistics. Statistical bulletin. Experimental statistics. Inequality in disability-free life expectancy by area deprivation: England, 2003–06 and 2007–10. http://www.ons.gov.uk/ons/dcp171778_319481.pdf (accessed Aug 24, 2015).
36 Bennett JE, Li G, Foreman K, et al. The future of life expectancy and life expectancy inequalities in England and Wales: Bayesian spatiotemporal forecasting. Lancet 2015; 386: 163–70.
37 Rienzo C. Migrants in the UK labour market: an overview. Aug 28, 2012. http://storage0.dms.mpinteractiv.ro/media/1/186/3927/10538667/2/briefing-migrants-the-uk-labour-market-0.pdf (accessed Aug 24, 2015).
38 Bongaart J. Trends in causes of death in low-mortality countries: implications for mortality projections. Popul Dev Rev 2014; 40: 189–212.
39 Williams R, Aspinall R, Bellis M, et al. Addressing liver disease in the UK: a blueprint for attaining excellence in health care and reducing premature mortality from lifestyle issues of excess consumption of alcohol, obesity, and viral hepatitis. Lancet 2014; 384: 1953–97.
40 Prince M, Bryce R, Albanese E, Wimo A, Ribeiro W, Ferri CP. The global prevalence of dementia: a systematic review and metaanalysis. Alzheimers Dement 2013; 9: 63–75.
41 Holland D, Desikan RS, Dale AM, McEvoy LK, and the Alzheimer’s Disease Neuroimaging Initiative. Rates of decline in Alzheimer disease decrease with age. PLoS One 2012; 7: e42325.
42 Rocca WA, Petersen RC, Knopman DS, et al. Trends in the incidence and prevalence of Alzheimer’s disease, dementia, and cognitive impairment in the United States. Alzheimers Dement 2011; 7: 80–93.

Articles
18 www.thelancet.com Published online September 15, 2015 http://dx.doi.org/10.1016/S0140-6736(15)00195-6
43 Hoy DG, Smith E, Cross M, et al. Reflecting on the global burden of musculoskeletal conditions: lessons learnt from the Global Burden of Disease 2010 Study and the next steps forward. Ann Rheum Dis 2014; 74: 4–7.
44 Kessler D, Bennewith O, Lewis G, Sharp D. Detection of depression and anxiety in primary care: follow up study. BMJ 2002; 325: 1016–17.
45 Davidson JR, Feltner DE, Dugar A. Management of generalized anxiety disorder in primary care: identifying the challenges and unmet needs. Prim Care Companion J Clin Psychiatry 2010; 12: pii PCC.09r00772.
46 Buszewicz MJ, Chew-Graham C. Improving the detection and management of anxiety disorders in primary care. Br J Gen Pract 2011; 61: 489–90.
47 van Zoonen K, Buntrock C, Ebert DD, et al. Preventing the onset of major depressive disorder: a meta-analytic review of psychological interventions. Int J Epidemiol 2014; 43: 318–29.
48 National Diabetes Audit 2012–2013. Report 1. Care processes and treatment targets. Oct 2, 2014. http://www.hscic.gov.uk/catalogue/PUB14970 (accessed Aug 28, 2015).
49 Bajekal M, Scholes S, Love H, et al. Analysing recent socioeconomic trends in coronary heart disease mortality in England, 2000–2007: a population modelling study. PLoS Med 2012; 9: e1001237.
50 He FJ, Brinsden HC, MacGregor GA. Salt reduction in the United Kingdom: a successful experiment in public health. J Hum Hypertens 2014; 28: 345–52.
51 Fleming KM, Aithal GP, Solaymani-Dodaran M, Card TR, West J. Incidence and prevalence of cirrhosis in the United Kingdom, 1992–2001: a general population-based study. J Hepatol 2008; 49: 732–38.
52 Ratib S, West J, Crooks CJ, Fleming KM. Diagnosis of liver cirrhosis in England, a cohort study, 1998-2009: a comparison with cancer. Am J Gastroenterol 2014; 109: 190–98.
53 Taylor-Robinson SD, Foster GR, Arora S, Hargreaves S, Thomas HC. Increase in primary liver cancer in the UK, 1979–94. Lancet 1997; 350: 1142–43.
54 Bosch FX, Ribes J, Díaz M, Cléries R. Primary liver cancer: worldwide incidence and trends. Gastroenterology 2004; 127 (suppl 1): S5–16.
55 Leon DA, McCambridge J. Liver cirrhosis mortality rates in Britain from 1950 to 2002: an analysis of routine data. Lancet 2006; 367: 52–56.
56 Link BG, Phelan J. Social conditions as fundamental causes of disease. J Heal Soc Behav 1995; 80–94.
57 Ritchie K, Carrière I, Ritchie CW, Berr C, Artero S, Ancelin M-L. Designing prevention programmes to reduce incidence of dementia: prospective cohort study of modifiable risk factors. BMJ 2010; 341: c3885.
58 Lee Y, Back JH, Kim J, et al. Systematic review of health behavioral risks and cognitive health in older adults. Int Psychogeriatr 2010; 22: 174–87.
59 Engelhart MJ, Geerlings MI, Ruitenberg A, et al. Dietary intake of antioxidants and risk of Alzheimer disease. JAMA 2002; 287: 3223–29.
60 Haan MN, Wallace R. Can dementia be prevented? Brain aging in a population-based context. Annu Rev Public Health 2004; 25: 1–24.
61 Dai Q, Borenstein AR, Wu Y, Jackson JC, Larson EB. Fruit and vegetable juices and Alzheimer’s disease: the Kame Project. Am J Med 2006; 119: 751–59.
62 Smith AD, Yaffe K. Dementia (including Alzheimer’s disease) can be prevented: statement supported by international experts. J Alzheimers Dis 2014; 38: 699–703.
63 Office for National Statistics. Suicides in the United Kingdom, 2013 registrations. 2015. http://www.ons.gov.uk/ons/dcp171778_395145.pdf (accessed Aug 24, 2015).
64 Butterfield R, Henderson J, Scott R. Public health and prevention, expenditure in England. Health England Report No. 4. London: Department of Health, 2009.