
Article Modulation of Global Gene Expression by Aneuploidy ...
20
Genes 2021, 12, 1606. https://doi.org/10.3390/genes12101606 www.mdpi.com/journal/genes Article Modulation of Global Gene Expression by Aneuploidy and CNV of Dosage Sensitive Regulatory Genes Shuai Zhang 1,† , Ruixue Wang 1,† , Cheng Huang 1,2,† , Ludan Zhang 1 and Lin Sun 1, * 1 Beijing Key Laboratory of Gene Resource and Molecular Development, College of Life Sciences, Beijing Normal University, Beijing 100875, China; [email protected] (S.Z.); [email protected] (R.W.); [email protected] (C.H.); [email protected] (L.Z.) 2 Institute of Animal Husbandry and Veterinary Medicine, Beijing Academy of Agriculture and Forestry Sciences, Beijing 100193, China * Correspondence: [email protected] † S.Z., R.W. and C.H. contributed equally to this work. Abstract: Aneuploidy, which disrupts the genetic balance due to partial genome dosage changes, is usually more detrimental than euploidy variation. To investigate the modulation of gene expression in aneuploidy, we analyzed the transcriptome sequencing data of autosomal and sex chromosome trisomy in Drosophila. The results showed that most genes on the varied chromosome (cis) present dosage compensation, while the remainder of the genome (trans) produce widespread inverse dos‐ age effects. Some altered functions and pathways were identified as the common characteristics of aneuploidy, and several possible regulatory genes were screened for an inverse dosage effect. Fur‐ thermore, we demonstrated that dosage changes of inverse regulator Inr‐a/pcf11 can produce a ge‐ nome‐wide inverse dosage effect. All these findings suggest that the mechanism of genomic imbal‐ ance is related to the changes in the stoichiometric relationships of macromolecular complex mem‐ bers that affect the overall function. These studies may deepen the understanding of gene expression regulatory mechanisms. Keywords: aneuploidy; dosage compensation; inverse dosage effect; transcription factors; inverse regulators 1. Introduction The regulatory systems for gene expression of the diploid genomes are quite compli‐ cated and balanced. Variations that deviate from balance, such as duplication or loss of a certain chromosome segment or the entire chromosome, known as aneuploidy, disrupt the regulation of the genome [1]. Aneuploidy variation is found to be much more detri‐ mental than euploidy variation in different biological taxa, which is called genetic imbal‐ ance [2–7]. In the early days of the development of molecular genetics, its basis was thought to be the direct gene‐dosage effect of the genes that changed their copies [8,9]. However, many subsequent studies found that quite a few genes on the varied chromo‐ somes produce a similar number of products compared with the normal diploid, that is, dosage compensation occurred [10–12]. In addition, some studies proved the expression of genes on the unvaried chromosomes in aneuploidy also have expression changes, and the dominant effect is an inverse correlation with the dosage of the varied region, which is called the inverse‐dosage effect [10,11,13–15]. According to these findings, dosage com‐ pensation is interpreted as the result of the positive dosage effect of genes located on the varied chromosomes being counteracted by the simultaneous inverse‐dosage effect of an‐ euploidy [11,14–18]. By studying the regulators of white eye color reporter genes in Drosophila, it was found that the regulatory mechanisms responsible for these dosage influences could be Citation: Zhang, S.; Wang, R.; Huang, C.; Zhang, L.; Sun, L. Modulation of Global Gene Expression by Aneuploidy and CNV of Dosage Sensitive Regulatory Genes. Genes 2021, 12, 1606. https:// doi.org/10.3390/genes12101606 Academic Editor: Darren Griffin Received: 11 August 2021 Accepted: 8 October 2021 Published: 12 October 2021 Publisher’s Note: MDPI stays neu‐ tral with regard to jurisdictional claims in published maps and institu‐ tional affiliations. Copyright: © 2021 by the authors. Li‐ censee MDPI, Basel, Switzerland. This article is an open access article distributed under the terms and con‐ ditions of the Creative Commons At‐ tribution (CC BY) license (https://cre‐ ativecommons.org/licenses/by/4.0/).
Transcript of Article Modulation of Global Gene Expression by Aneuploidy ...

Genes 2021, 12, 1606. https://doi.org/10.3390/genes12101606 www.mdpi.com/journal/genes
Article
Modulation of Global Gene Expression by Aneuploidy
and CNV of Dosage Sensitive Regulatory Genes
Shuai Zhang 1,†, Ruixue Wang 1,†, Cheng Huang 1,2,†, Ludan Zhang 1 and Lin Sun 1,*
1 Beijing Key Laboratory of Gene Resource and Molecular Development, College of Life Sciences,
Beijing Normal University, Beijing 100875, China; [email protected] (S.Z.);
[email protected] (R.W.); [email protected] (C.H.); [email protected] (L.Z.) 2 Institute of Animal Husbandry and Veterinary Medicine, Beijing Academy of Agriculture and Forestry
Sciences, Beijing 100193, China
* Correspondence: [email protected]
† S.Z., R.W. and C.H. contributed equally to this work.
Abstract: Aneuploidy, which disrupts the genetic balance due to partial genome dosage changes, is
usually more detrimental than euploidy variation. To investigate the modulation of gene expression
in aneuploidy, we analyzed the transcriptome sequencing data of autosomal and sex chromosome
trisomy in Drosophila. The results showed that most genes on the varied chromosome (cis) present
dosage compensation, while the remainder of the genome (trans) produce widespread inverse dos‐
age effects. Some altered functions and pathways were identified as the common characteristics of
aneuploidy, and several possible regulatory genes were screened for an inverse dosage effect. Fur‐
thermore, we demonstrated that dosage changes of inverse regulator Inr‐a/pcf11 can produce a ge‐
nome‐wide inverse dosage effect. All these findings suggest that the mechanism of genomic imbal‐
ance is related to the changes in the stoichiometric relationships of macromolecular complex mem‐
bers that affect the overall function. These studies may deepen the understanding of gene expression
regulatory mechanisms.
Keywords: aneuploidy; dosage compensation; inverse dosage effect; transcription factors; inverse
regulators
1. Introduction
The regulatory systems for gene expression of the diploid genomes are quite compli‐
cated and balanced. Variations that deviate from balance, such as duplication or loss of a
certain chromosome segment or the entire chromosome, known as aneuploidy, disrupt
the regulation of the genome [1]. Aneuploidy variation is found to be much more detri‐
mental than euploidy variation in different biological taxa, which is called genetic imbal‐
ance [2–7]. In the early days of the development of molecular genetics, its basis was
thought to be the direct gene‐dosage effect of the genes that changed their copies [8,9].
However, many subsequent studies found that quite a few genes on the varied chromo‐
somes produce a similar number of products compared with the normal diploid, that is,
dosage compensation occurred [10–12]. In addition, some studies proved the expression
of genes on the unvaried chromosomes in aneuploidy also have expression changes, and
the dominant effect is an inverse correlation with the dosage of the varied region, which
is called the inverse‐dosage effect [10,11,13–15]. According to these findings, dosage com‐
pensation is interpreted as the result of the positive dosage effect of genes located on the
varied chromosomes being counteracted by the simultaneous inverse‐dosage effect of an‐
euploidy [11,14–18].
By studying the regulators of white eye color reporter genes in Drosophila, it was
found that the regulatory mechanisms responsible for these dosage influences could be
Citation: Zhang, S.; Wang, R.;
Huang, C.; Zhang, L.; Sun, L.
Modulation of Global Gene
Expression by Aneuploidy and CNV
of Dosage Sensitive Regulatory
Genes. Genes 2021, 12, 1606. https://
doi.org/10.3390/genes12101606
Academic Editor: Darren Griffin
Received: 11 August 2021
Accepted: 8 October 2021
Published: 12 October 2021
Publisher’s Note: MDPI stays neu‐
tral with regard to jurisdictional
claims in published maps and institu‐
tional affiliations.
Copyright: © 2021 by the authors. Li‐
censee MDPI, Basel, Switzerland.
This article is an open access article
distributed under the terms and con‐
ditions of the Creative Commons At‐
tribution (CC BY) license (https://cre‐
ativecommons.org/licenses/by/4.0/).

Genes 2021, 12, 1606 2 of 20
reduced to the role of single genes [12,19–21]. A lengthy screening process identified 47
dosage‐dependent modifiers whose deletion or replication could mimic aneuploidy and
influence the expression of the alleles of white, of which most had a negative or inverse
effect, while a small number had a positive effect [22]. The molecular functions of these
modifiers are mainly transcription factors (TFs), signal transduction components and
chromatin proteins [22]. Among them, the earliest found and most thoroughly studied
inversely acting single gene is inverse regulator‐a (Inr‐a, synonymous with pcf11). This gene
encodes a pre‐mRNA cleavage complex II protein, which is involved in the initiation,
elongation and termination reactions of transcription, and it produces a nearly perfect in‐
verse effect on the white eye color phenotype in Drosophila [12,20,21].
The common feature of these dosage‐sensitivity modifiers is that they all act in mac‐
romolecular complexes. Similar phenomena have been found in other species, for exam‐
ple, abnormal copy number variation (CNV) of transcription factors and signal transduc‐
tion components in human are usually associated with disease [23–25]. A heterozygous
gene knockout study in yeast shows that the involvement of macromolecular complex is
negatively correlated with fitness [26]. In the aspect of evolutionary genomics, during the
deletion of duplicated genes following whole‐genome duplications (WGD), those genes
involved in macromolecular structural members and interactions tend to be retained for
a relatively longer period [27–30]. The loss of one gene in the duplicate pairs is similar to
aneuploidy effects and results in negative fitness, which is usually selected against
[3,29,30]. By contrast, in segmental duplications on a small scale, the same classes of genes
are often underrepresented [28–31]. These observations led to a synthetical hypothesis,
the Gene Balance Hypothesis (GBH), to explain the mechanism of genomic imbalance
[3,28,29].
The gene balance hypothesis suggests that changes in the stoichiometric relationships
of macromolecular complex members will affect the assembly kinetics of the complex and
ultimately influence the whole function [3,5,32]. This hypothesis has been modeled in
some simple scenarios, although the reality may be more complex [32–35]. The large num‐
ber of white regulators and the similarity to quantitative trait genetics suggest that any
individual trait may be influenced by multiple regulatory genes [3,28,36]. Similarly, the
increase or decrease of a specific chromosome segment or the changes of a key regulator
may affect a variety of biological functions and characteristics [3,28,36]. The explanation
is that these transcription factors and signaling components influence downstream regu‐
lators in a cascade of interactions, forming a complex hierarchical regulatory network
driven by dosage‐sensitive regulators [12,22,36].
Aneuploidy often seriously harms the growth and development of organisms [37,38],
especially in animals, and is fatal in some cases, so it is more difficult to study the gene
expression of aneuploidy. Due to the unique developmental characteristics and the supe‐
riority of chromosome aberration strains in Drosophila melanogaster, it opens up the possi‐
bility of studying aneuploid genomes. In this study, we analyzed two transcriptome high‐
throughput sequencing datasets of Drosophila aneuploidy (including autosomal aneu‐
ploidy and sex chromosome aneuploidy) from the GEO database [14,15], and investigated
the gene expression characteristics of aneuploidy and the main biological functions of dif‐
ferentially expressed genes. We sought to identify the regulatory genes of aneuploid in‐
verse dosage effects to uncover some key regulators in the hierarchical regulatory network
of genomic imbalance. In addition, we also investigated the regulatory role of the classical
inverse regulator Inr‐a and explored its similarity to aneuploidy effects.
2. Material and Methods
2.1. Drosophila Stocks and Culture
The wild type and Inr‐a duplication Drosophila used for RNA sequencing were cul‐
tured in our laboratory. All flies were cultured on cornmeal sucrose medium at 25 °C. The
wild type samples were the third instar larva males collected from Canton S stock. The

Genes 2021, 12, 1606 3 of 20
Inr‐a duplication samples were obtained from crosses of w[a]; Pcf11Dup/CyO GFP males
with Canton S females, and the progeny larvae without green fluorescence were selected.
The Inr‐a duplication Drosophila strain was constructed in a previous study [21].
2.2. RNA Extraction and Sequencing
There were two biological replicates in the control group and the Inr‐a duplication
group respectively, with 30 larvae in each replicate. RNA was extracted using TRIzol Re‐
agent from Invitrogen (Thermo Fisher Scientific, USA) and processed using DNase I,
RNase‐Free kit from Thermo Scientific (Thermo Fisher Scientific, USA). The RNA sequenc‐
ing was performed as described previously [39]. Briefly, quality detection and concentra‐
tion measurement were performed on RNA samples, then RNA‐Seq library was con‐
structed. The sequencing was performed using Illumina HiSeq X‐ten sequencers with the
paired‐end 150 bp protocol.
2.3. RNA Sequencing Analyses
The Inr‐a data was from the output of Illumina RNA sequencing above. The trisomy
2L and metafemale data were obtained from the GEO database (GSE46354 and GSE41679).
All raw data were trimmed and filtered using Trimmomatic (version 0.39) [40] to remove
the adaptors and low‐quality sequences. FastQC (version 0.11.9) was used to evaluate the
quality of the data. Subsequently, transcripts were quantified using Salmon (version 1.4.0)
[41]. To be specific, the Drosophila reference genome, reference transcriptome, and anno‐
tation (version 102) were downloaded from the Ensembl database (http://www.en‐
sembl.org, accessed on 4 January 2021). An augmented hybrid fasta file was created using
SalmonTools script. The quasi‐type indexes were built with the parameter k‐mers = 25 in
aneuploidy data and k‐mers = 31 in Inr‐a data, due to the shorter length of reads in aneu‐
ploidy data. The transcripts were then quantified directly.
2.4. Differential Expression Analysis
Data was consolidated using tximport (version 1.18.0) [42] and imported into DESeq2
(version 1.30.1) [43]. Low expression transcripts were filtered out and differential expres‐
sion analysis was performed using the parameter fitType = ‘local’. The differentially ex‐
pressed genes were screened using the standard of padj < 0.05 and fold change >1.25 or
<0.8 in the trisomy 2L and metafemale dataset for up‐ or down‐regulation respectively.
The density of significantly up‐regulated or down‐regulated genes along chromosomes
were drawn using the R package RIdeogram (version 0.2.2) [44]. The heatmaps were plot‐
ted using ComplexHeatmap (version 2.6.2) [45,46].
2.5. Enrichment Analysis
Gene Ontology (GO) enrichment analysis, KEGG Pathway enrichment analysis and
Gene Set Enrichment Analysis (GSEA) were performed using clusterProfiler (version
3.18.1) [47]. The GO annotations were provided by org.Dm.eg.db (version 3.12.0) and the
KEGG database were obtained from online data (https://www.kegg.jp/, accessed on 22
April 2021) [48]. GSEA analysis used empirical Bayes shrunken log2 fold changes data
with “apeglm” [49] method in DESeq2.
2.6. Protein–Protein Interaction (PPI) Network
PPI network analysis was conducted using STRING 11.0 (https://string‐db.org/, ac‐
cessed on 22 April 2021) [50]. Genes that are up‐regulated or down‐regulated in all tri‐
somy groups were submitted to the online tool STRING to generate interaction networks.
The networks were then imported into Cytoscape (version 3.7.1) [51]. The cytoHubba [52]
plugin was used to obtain the degree of each node, and the MCODE [53] plugin was used
to cluster the network with the default parameters.

Genes 2021, 12, 1606 4 of 20
2.7. Transcription Factor Analysis
Transcription factor enrichment analysis was performed using RcisTarget (version
1.10.0) [54] in R. The over‐expressed TF‐binding motifs of the upstream 5kb sequence of
the selected down‐regulated genes were analyzed using the database it provided. Then
the possible regulatory transcription factors were searched based on these enriched motifs
and screened by their expressions. The circular diagram of regulatory networks for can‐
didate transcription factors were plotted using Circos (version 0.69.8) [55].
2.8. Ratio Distribution
The data from RNA sequencing was normalized to calculate CPM (counts per mil‐
lion). The ratio of the experimental group to the control group was averaged across bio‐
logical replicates, and then the frequency distributions were plotted in bins of 0.05 using
ggplot2 (version 3.3.3) [56]. The microarray data used in the ratio distribution plots and
boxplots came from the GEO database (GSE53010 and GSE36736) without logarithm con‐
version.
2.9. Relative Quantitative PCR
The rest of the RNA produced in sequencing was used for RT‐PCR. cDNA was syn‐
thesized using the TransScript one‐step gDNA Removal and cDNA Synthesis SuperMix.
The real‐time PCR was performed using TransScript Tip Green qPCR SuperMix (+Dye II)
with the primers listed in Table S1. The housekeeping gene β‐tubulin served as an internal
control. 2−ΔΔCt method was used for relative quantitative calculation.
2.10. Data Availability
The sequencing data of Inr‐a duplication Drosophila has been deposited in the Gene
Expression Omnibus (GEO) database (https://www.ncbi.nlm.nih.gov/geo/, accession no.
GSE180089) and the Sequence Read Archive (SRA) (https://www.ncbi.nlm.nih.gov/sra,
accession no. SRP328302). The public data used in this study were downloaded from
GSE46354, GSE41679, GSE53010 and GSE36736 (accessed on 4 January 2021). The public
datasets GSE46354 and GSE41679 include the high‐throughput transcriptome sequencing
data of trisomies of the left arm of chromosome 2 (2L) and of the X chromosome in Dro‐
sophila respectively. The other two public datasets contain the expression microarray data
of the overexpression or mutation of transcription factor genes in Drosophila respectively.
3. Results
3.1. Identification of Differentially Expressed Genes and Dosage Compensation
To identify the differentially expressed genes (DEGs) in aneuploid Drosophila, we
downloaded the sequencing data from the public datasets GSE46354 and GSE41679,
which respectively includes the RNA‐seq data of trisomies of 2L and of the X chromosome
in Drosophila. After downloading the raw data, Salmon was used for transcriptome quan‐
titation, and R package DESeq2 was used for differential expression analysis. Since the
complete dosage effect in trisomy tends to upregulate the genome approximately 1.5‐fold
in theory, DEGs were defined as adjusted p‐value < 0.05 and fold change > 1.25 or < 0.8.
We found a large number of DEGs in trisomy compared with the normal diploid,
especially in trisomy 2L more than in metafemales (Figure 1A–C). By observing the dis‐
tribution of DEGs, we found that the up‐regulated and down‐regulated genes were
widely distributed on each chromosome (Figure 1D–F), suggesting that aneuploidy has a
wide range of effects on gene expression in the whole genome. Based on the density
heatmaps of the DEGs, 30% of genes located on chromosome 2L exhibit up‐regulation,
while the expression of the remaining genes is not significantly up‐regulated, indicating
that dosage compensation occurs in 2L (Figure 1D,E). Gene expression changes also occur
on autosomes other than 2L and the sex chromosomes, with both up‐regulation and
down‐regulation. More down‐regulated genes are found, indicating that aneuploidy

Genes 2021, 12, 1606 5 of 20
modulates the gene expression not only on the varied chromosomes, but also on other
chromosomes in trans. These modulations could be positively or negatively correlated
with the changed chromosome dosage, but inverse correlations are the most common,
which is an inverse dosage effect. And we found that the position distribution of DEGs in
trisomy 2L female and male is very similar, suggesting that the regulation is not random,
but specific. Furthermore, dosage compensation on the X chromosome and an inverse
dosage effect on the autosomes can also be observed in metafemales (Figure 1F).
Figure 1. Overview of the differentially expressed genes (DEGs) in three kinds of aneuploidy. (A–C) Volcano plots of
DEGs in trisomy 2L female (A), trisomy 2L male (B) and metafemale (C) compared with normal diploid of the correspond‐
ing sex. DEGs are defined as adjusted p‐value < 0.05 and fold change >1.25 or <0.8. (D–F) Density heatmaps of the distri‐
bution of DEGs along Drosophila chromosomes in trisomy 2L female (D), trisomy 2L male (E) and metafemale (F). The red
bands represent up‐regulated genes, and the blue bands represent down‐regulated genes. The darker colors show a greater
density of DEGs. The number below the chromosomes indicates the percentage of up‐ or down‐regulated genes in the
total number of genes in this chromosome. (G) Principal component analysis (PCA) plot of all aneuploidy samples and

Genes 2021, 12, 1606 6 of 20
control groups. The circles represent 95% confidence intervals. (H) Heatmap of all aneuploidy samples and control groups.
CF, wildtype female control; CM, wildtype male control; 2LF, trisomy 2L female; 2LM, trisomy 2L male; MF, metafemale.
3.2. Common Differentially Expressed Genes and Enrichment Analysis
GO function and KEGG pathway enrichment analysis were performed for DEGs in
three kinds of aneuploidy, respectively. We found that there are a large number of the
same GO terms in biological process (Figure S1A). The commonly enriched functions in‐
clude immune system progress, response to biotic stimulus, positive regulation of cell
communication, cell morphogenesis involved in differentiation, post‐embryonic animal
morphogenesis and organ development, organic acids and carbohydrate metabolic pro‐
cess and so on, indicating that the influences are involved in immune system, cellular
communication, differentiation and development, metabolic and other important pro‐
cesses, which is consistent with the phenomenon that aneuploidy affects the growth and
development of organisms [37,38]. The enrichment analysis of molecular function and cel‐
lular component showed that the DEGs in two autosomal trisomies are enriched in more
identical GO terms, while the DEGs in the triple X metafemale are enriched in different
terms (Figure S1B,C). The significantly enriched pathways in aneuploidy Drosophila in‐
clude glucose metabolism, lipid metabolism, lysosome, and so on (Figure S1D).
By obtaining the intersection of the up‐regulated or down‐regulated genes of three
kinds of aneuploidy, 379 common up‐regulated genes and 180 common down‐regulated
genes were found (Figure 2A,B). The principal component analysis (PCA) plot shows sig‐
nificant differences among each genotype, and the heatmap clearly separates the trisomy
from the normal diploid (Figure 1G,H). To analyze the functions of these genes, we found
that the up‐regulated functions and pathways in aneuploidy were mainly concentrated in
small molecule metabolism and generation of energy, supramolecular polymer, structural
constituent of cuticle, sarcomere, etc. The functions of down‐regulated genes include neg‐
ative regulation of cell signaling, cell cycle regulation, response to stress, cell fate commit‐
ment, ubiquitin protein ligase binding, Notch signaling pathway, etc. (Figure 2C,D).
Therefore, in aneuploidy, the genes affected by a dosage effect are mainly those related to
the basic life activities of the cell, while the genes affected by inverse dosage effect are
mostly those that play a crucial regulatory role in the regulation of signaling pathway, cell
proliferation and differentiation, protein degradation and so on.

Genes 2021, 12, 1606 7 of 20
Figure 2. Common up‐regulated or down‐regulated differentially expressed genes in three kinds of aneuploidy. (A,B)
Venn diagrams show the number of up‐regulated (A) or down‐regulated (B) DEGs in each comparison. CF, wildtype
female control; CM, wildtype male control; 2LF, trisomy 2L female; 2LM, trisomy 2L male; MF, metafemale. (C) Top 10
enriched GO terms and top 5 enriched pathways of common up‐regulated DEGs in all trisomies. (D) Top 10 enriched GO
terms of common down‐regulated DEGs in all trisomies.
3.3. Protein Interaction Analysis of Common Differentially Expressed Genes
Using the online website String to analyze the protein interactions of the up‐ or
down‐regulated genes in aneuploidy, we found that the protein‐protein interaction (PPI)
network of commonly up‐regulated genes contained 197 nodes and 694 edges (Figure
S2A), which is large and complex, while the relatively sparse PPI network of common
down‐regulated genes contained 94 nodes and 209 edges (Figure S2B). The top 20 genes
with the highest degrees in each network are listed, suggesting that they might play an
important role in the overall regulatory network (Figure S2C,D). Subsequently, MCODE
analysis was used to identify 10 clusters in the PPI network of common up‐regulated
genes, and the top two up‐regulated clusters with the highest scores were displayed (Fig‐
ure 3). The first and largest cluster contains 17 genes, whose functions are mainly involved
in the generation of precursor metabolites and energy, cellular respiration and mitochon‐
drial membrane. The second cluster contains 14 genes, whose functions are involved in
the development of chitin‐based cuticle development, muscle cell development and dif‐
ferentiation, and the formation of supramolecular polymers (Figure 3). The remaining
eight up‐regulated clusters functionally are similar to these top two clusters and are all

Genes 2021, 12, 1606 8 of 20
involved in metabolic or supramolecular complexes. Five clusters have been identified in
the PPI network of common down‐regulated genes, with different functions, and the top
four are displayed in Figure 3. The largest down‐regulated cluster includes 12 genes, in
charge of mitotic cell cycle process, regulation of cell cycle and microtubule cytoskeleton
organization, showing the effect of aneuploidy on normal cell division cycle. The second
down‐regulated cluster is mainly associated with Notch signaling pathway, cell fate spec‐
ification and commitment and ubiquitin protein ligase binding. The third down‐regulated
cluster is involved in a variety of developmental processes, including sex determination
and the development of central nervous system, Malpighian tubule, digestive system and
oenocyte. The fourth down‐regulated cluster mainly involves ubiquitin mediated prote‐
olysis. Therefore, down‐regulated genes in clusters 2, 3, and 4 play an important regula‐
tory role in cell life activities, and may act as hub genes to regulate the growth and devel‐
opment in aneuploidy.
Figure 3. The MCODE‐modules of protein‐protein interaction (PPI) networks of common up‐ or down‐regulated DEGs.
The top two up‐regulated modules and top four down‐regulated modules with unique functions are displayed. The num‐
ber of nodes and edges, and the significant functions for each module are listed. The purple nodes have a higher degree
of connection in the whole networks.
3.4. Transcription Factor Analysis of Inverse Dosage Effect Genes
Indeed, it has been found that the influence of aneuploidy can be reduced to the ac‐
tion of single genes in Drosophila and the genes respond to dosage effects of aneuploidy
usually include transcription factors (TFs), signal transduction components, and chroma‐
tin proteins [22]. The inverse dosage effect operates at the transcriptional level, and the
promoter region plays a key role in this effect [12,17]. Therefore, to search for regulatory
TFs in aneuploidy, we sought from the genes affected by inverse dosage effect. By enrich‐
ment analysis of TFs‐binding motifs in the upstream 5 kb sequences of the common down‐
regulated DEGs in the trisomy, regulatory transcription factors with high confidence were
Genes 2021, 12, 1606 9 of 20
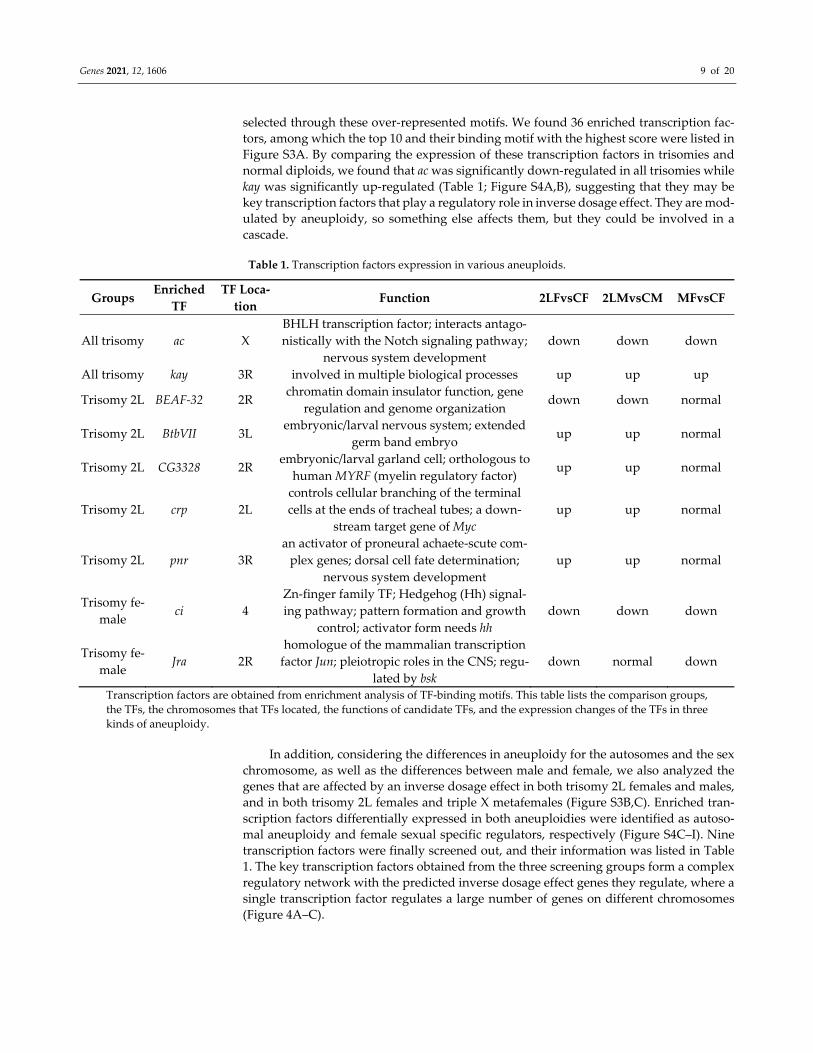
selected through these over‐represented motifs. We found 36 enriched transcription fac‐
tors, among which the top 10 and their binding motif with the highest score were listed in
Figure S3A. By comparing the expression of these transcription factors in trisomies and
normal diploids, we found that ac was significantly down‐regulated in all trisomies while
kay was significantly up‐regulated (Table 1; Figure S4A,B), suggesting that they may be
key transcription factors that play a regulatory role in inverse dosage effect. They are mod‐
ulated by aneuploidy, so something else affects them, but they could be involved in a
cascade.
Table 1. Transcription factors expression in various aneuploids.
Groups Enriched
TF
TF Loca‐
tion Function 2LFvsCF 2LMvsCM MFvsCF
All trisomy ac X
BHLH transcription factor; interacts antago‐
nistically with the Notch signaling pathway;
nervous system development
down down down
All trisomy kay 3R involved in multiple biological processes up up up
Trisomy 2L BEAF‐32 2R chromatin domain insulator function, gene
regulation and genome organization down down normal
Trisomy 2L BtbVII 3L embryonic/larval nervous system; extended
germ band embryo up up normal
Trisomy 2L CG3328 2R embryonic/larval garland cell; orthologous to
human MYRF (myelin regulatory factor) up up normal
Trisomy 2L crp 2L
controls cellular branching of the terminal
cells at the ends of tracheal tubes; a down‐
stream target gene of Myc
up up normal
Trisomy 2L pnr 3R
an activator of proneural achaete‐scute com‐
plex genes; dorsal cell fate determination;
nervous system development
up up normal
Trisomy fe‐
male ci 4
Zn‐finger family TF; Hedgehog (Hh) signal‐
ing pathway; pattern formation and growth
control; activator form needs hh
down down down
Trisomy fe‐
male Jra 2R
homologue of the mammalian transcription
factor Jun; pleiotropic roles in the CNS; regu‐
lated by bsk
down normal down
Transcription factors are obtained from enrichment analysis of TF‐binding motifs. This table lists the comparison groups,
the TFs, the chromosomes that TFs located, the functions of candidate TFs, and the expression changes of the TFs in three
kinds of aneuploidy.
In addition, considering the differences in aneuploidy for the autosomes and the sex
chromosome, as well as the differences between male and female, we also analyzed the
genes that are affected by an inverse dosage effect in both trisomy 2L females and males,
and in both trisomy 2L females and triple X metafemales (Figure S3B,C). Enriched tran‐
scription factors differentially expressed in both aneuploidies were identified as autoso‐
mal aneuploidy and female sexual specific regulators, respectively (Figure S4C–I). Nine
transcription factors were finally screened out, and their information was listed in Table
1. The key transcription factors obtained from the three screening groups form a complex
regulatory network with the predicted inverse dosage effect genes they regulate, where a
single transcription factor regulates a large number of genes on different chromosomes
(Figure 4A–C).

Genes 2021, 12, 1606 10 of 20
Figure 4. Modulation of gene expression by candidate transcription factors. (A–C) The circular plots show the target gene
networks of candidate TFs in all trisomies (A), trisomy 2L females and males (B) and trisomy females (C). The green lines
indicate that the expression of this TF is down‐regulated in trisomies, and the yellow lines indicate that the expression of
this TF is up‐regulated in trisomies. Candidate TFs are labeled with red rectangles. Target genes are partially listed on the
periphery of the chromosomes. (D,E) Ratio distributions of gene expression in TF ac overexpression Drosophila compared
with control group. (F,G) Ratio distributions in TF BEAF‐32 mutation Drosophila compared with control group. Genes are
divided into autosomes (D,F) and X chromosome (E,G) according to their positions. The X‐axis indicates the ratio of ex‐
pression, and the Y‐axis indicates the frequency of the ratios that fall into each bin of 0.05. The red solid line represents the
ratio of 1.00 which means no change in gene expression. (H,I) Boxplots of ratios in ac overexpression Drosophila compared
with control group. Genes are divided into each chromosome (H) or autosome and sex chromosome (I) according to their
positions. (J,K) Boxplots of ratios in BEAF‐32 mutation Drosophila compared with control group. Genes are divided into
each chromosome (J) or autosome and sex chromosome (K) according to their positions. The gray solid line represents the
ratio of 1.00 which means no change in gene expression. The numbers at the top of the boxplots indicate the median, blue
represents down‐regulation and red represents up‐regulation.
Genes 2021, 12, 1606 11 of 20
3.5. Validation of Candidate Transcription Factors in Public Database
To analyze whether the key transcription factors we identified act like inverse dosage
regulators, that is, whether the overexpression or mutation of a single gene causes ge‐
nome‐wide inverse dosage effect similar to aneuploidy, we explored two related datasets
from the GEO public database. The dataset GSE53010 includes expression microarray data
of the overexpressed transcription factor ac in the notum of Drosophila, and the dataset
GSE36736 includes microarray data of the mutation of BEAF‐32 gene in wing imaginal
tissue of Drosophila. The ratio distribution can provide a whole genome‐wide landscape
of changes in gene expression, especially the subtle changes close to the control group,
without being limited by the statistical power of small sample size [18]. The mean value
of gene expression of mutant or overexpressed Drosophila were compared with controls,
and these ratios were plotted with bins of 0.05. The ac gene is located on the X chromosome
and we found that the major peaks are all located at the ratio of 1.00, which was drawn
according to the autosome and sex chromosome, respectively (Figure 4D,E), suggesting
that the expression of most genes did not change significantly. However, an obvious tail‐
ing is observed on the left of the main peak, but not on the right side, suggesting that the
expression of some genes was decreased in ac overexpressed Drosophila. There is a shoul‐
der peak at the ratio of 0.7 (Figure 4D,E), similar to the inverse dosage effect found in
trisomy. And there is a minor peak at the ratio of 0.45 (Figure 4E), approaching to the
double inverse dosage effect (2/3 × 2/3), which has also been previously reported [14]. At
the same time, we also plotted the boxplots of gene expression ratio of each chromosome
(Figure 4H,I). The median of gene expression ratios on four major autosomal arms are all
lower than 1.0, while the median ratio on the X chromosome is slightly higher than 1.0,
proving that the overexpression of ac on the X chromosome produced trans inverse dos‐
age effect on the autosome. Different from other autosomes, the median ratio of chromo‐
some 4 increases significantly, potentially due to its different evolutionary pathways and
heterochromatin composition.
In the ratio distribution of mutation of BEAF‐32 on the chromosome 2R, the major
peak shifts to the right as a whole centered at the ratio of 1.05–1.10 and is stronger on the
X chromosome (Figure 4F,G), indicating that BEAF‐32 mutation leads to slight up‐regula‐
tion of the overall gene expression. There is a shoulder peak near the ratio of 1.2 and 1.5
(Figure 4F,G), which represents a different level of up‐regulation. In the boxplot, the me‐
dian of gene expression ratio on most autosomes is higher than 1.0, and the increase on
the X chromosome is even more pronounced, demonstrating the inverse dosage effect of
BEAF‐32 mutations on the autosomes (Figure 4J,K). The median ratio of chromosome 4
decreases significantly, also different from other autosomes. Thus, gene expression tends
to be down‐regulated in ac overexpressed Drosophila, while up‐regulated in BEAF‐32 mu‐
tation. It shows that the expression changes of two transcription factors we selected exert
negative effects on a subset of the genome, similar to the previously described inverse
regulators.
3.6. Inverse Regulator Inr‐a/pcf11
The first trans‐acting regulatory gene found in Drosophila was named Inverse regula‐
tor‐a (Inr‐a), synonymous with pcf11 [20,21]. The study found that the heterozygote of Inr‐
a mutation increased the expression of white approximately about twofold, while the in‐
crease to three copies of the gene reduced the expression of white by about two‐thirds
[20,21]. However, the inverse regulation of the classical inverse regulator Inr‐a has only
been studied on a few genes, rather than explored on a genome‐wide scale. Therefore, to
explore whether there is similarity between the Inr‐a mutation and trisomy, we performed
RNA‐sequencing and analyzed the transcriptome of Drosophila larvae with Inr‐a dupli‐
cates on chromosome 2R and compared this three‐copies of Inr‐a Drosophila with autoso‐
mal trisomy. Several randomly selected genes were used for RT‐qPCR to verify the se‐
quencing results (Tables S1 and S2). According to the gene expression ratio distribution
Genes 2021, 12, 1606 12 of 20
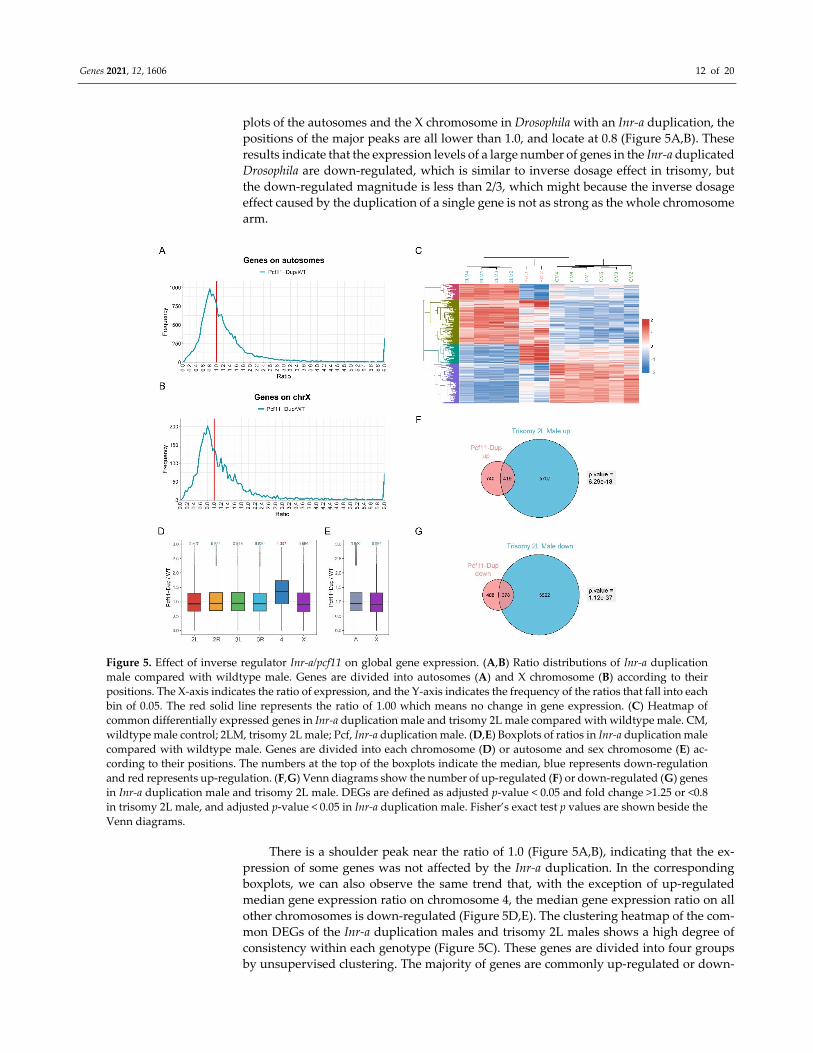
plots of the autosomes and the X chromosome in Drosophila with an Inr‐a duplication, the
positions of the major peaks are all lower than 1.0, and locate at 0.8 (Figure 5A,B). These
results indicate that the expression levels of a large number of genes in the Inr‐a duplicated
Drosophila are down‐regulated, which is similar to inverse dosage effect in trisomy, but
the down‐regulated magnitude is less than 2/3, which might because the inverse dosage
effect caused by the duplication of a single gene is not as strong as the whole chromosome
arm.
Figure 5. Effect of inverse regulator Inr‐a/pcf11 on global gene expression. (A,B) Ratio distributions of Inr‐a duplication
male compared with wildtype male. Genes are divided into autosomes (A) and X chromosome (B) according to their
positions. The X‐axis indicates the ratio of expression, and the Y‐axis indicates the frequency of the ratios that fall into each
bin of 0.05. The red solid line represents the ratio of 1.00 which means no change in gene expression. (C) Heatmap of
common differentially expressed genes in Inr‐a duplication male and trisomy 2L male compared with wildtype male. CM,
wildtype male control; 2LM, trisomy 2L male; Pcf, Inr‐a duplication male. (D,E) Boxplots of ratios in Inr‐a duplication male
compared with wildtype male. Genes are divided into each chromosome (D) or autosome and sex chromosome (E) ac‐
cording to their positions. The numbers at the top of the boxplots indicate the median, blue represents down‐regulation
and red represents up‐regulation. (F,G) Venn diagrams show the number of up‐regulated (F) or down‐regulated (G) genes
in Inr‐a duplication male and trisomy 2L male. DEGs are defined as adjusted p‐value < 0.05 and fold change >1.25 or <0.8
in trisomy 2L male, and adjusted p‐value < 0.05 in Inr‐a duplication male. Fisher’s exact test p values are shown beside the
Venn diagrams.
There is a shoulder peak near the ratio of 1.0 (Figure 5A,B), indicating that the ex‐
pression of some genes was not affected by the Inr‐a duplication. In the corresponding
boxplots, we can also observe the same trend that, with the exception of up‐regulated
median gene expression ratio on chromosome 4, the median gene expression ratio on all
other chromosomes is down‐regulated (Figure 5D,E). The clustering heatmap of the com‐
mon DEGs of the Inr‐a duplication males and trisomy 2L males shows a high degree of
consistency within each genotype (Figure 5C). These genes are divided into four groups
by unsupervised clustering. The majority of genes are commonly up‐regulated or down‐
Genes 2021, 12, 1606 13 of 20
regulated in both Inr‐a and trisomy 2L, and less than half of the genes are regulated in
different directions in Inr‐a and trisomy 2L, respectively. The genes significantly up‐reg‐
ulated in Inr‐a duplication are significantly enriched in the up‐regulated genes of trisomy
2L (Fisher’s exact test p‐value = 6.29 × 10 −18) (Figure 5F), and the genes significantly down‐
regulated in Inr‐a duplication are also significantly enriched in the down‐regulated genes
of trisomy 2L (Fisher’s exact test p‐value = 1.12 × 10 −37) (Figure 5G), demonstrating that the
regulation of gene expression caused by Inr‐a duplication is similar to the aneuploidy ef‐
fect caused by trisomy. Thus, single dosage‐sensitive regulator, Inr‐a, has an extensive
inverse dosage effect on a subset of the genome, not limited on the white locus, indicating
that the function of the trans‐acting single genes is universal.
4. Discussion
Aneuploidy variation can seriously affect the development and viability of organ‐
isms and is usually more harmful than euploidy variation. This phenomenon and its
mechanism are summarized as the Gene Balance Hypothesis [3,28,29,37,38,57]. Many
studies have found that the addition or deletion of a large chromosome segment or entire
chromosome in the karyotype can lead to genomic imbalance and affect gene expression
across the genome, not only the varied chromosome. This effect is usually inversely re‐
lated to the changes of chromosome numbers, and is known as the inverse dosage effect
[5–7]. Several recent studies have examined the inverse dosage effect of aneuploidy in a
variety of species in detail, such as maize, Arabidopsis and fruit flies [6,7,14,15,58,59].
These studies used several different transcriptome analysis methods all to avoid the arti‐
facts of normalizing the measurements of varied chromosomes to the remaining parts of
the genome [12,18], and were further validated at the phenotypic or absolute expression
levels. In our analysis of autosomal and sex chromosome aneuploidy Drosophila, inverse
dosage effect and dosage compensation are also observed through the distribution of dif‐
ferentially expressed genes on chromosomes (Figure 1D–F), which is consistent with the
analysis of ratio distributions in previous studies [14,15].
The prevalence of inverse dosage effect in aneuploidy provides a possible explana‐
tion for the mechanism of dosage compensation. As early as forty years ago, studies on
the subdivision of aneuploid chromosome found that dosage changes in a small region
surrounding structural genes would exhibit direct gene dosage effect, while dosage
changes in another large region on the same chromosome would produce inverse regula‐
tion [16,17]. The combination of these observations suggests that dosage compensation
occurs because the genes located on the varied chromosomes are regulated by both struc‐
tural gene dosage effect and inverse dosage effect, and these two reactions cancel each
other [3,5,11].
The classic case of dosage compensation is the heterogamous individuals in the or‐
ganisms whose sex determination rely on sex chromosomes. For example, the single X
chromosome in male Drosophila is over‐activated in order to balance the double dosage in
females. Early studies have suggested that there are male‐specific lethal (MSL) complexes
specifically enriched on the X chromosome in males, which mediates the two‐fold activa‐
tion of the X chromosome [12,60]. MSL2, the subunit of MSL complex, mediates the as‐
sembly of the whole complex and does not exist in females due to the inhibition by SXL
(Sex Lethal). The subunit MOF specifically acetylates histone H4K16, which is considered
to be a marker of transcriptional activation [61,62]. Evidence that the MSL complex di‐
rectly causes dosage compensation in Drosophila, such as male‐specific lethal gene muta‐
tions reduce the expression of X chromosome relative to autosomal expression, assume
that autosomal expression remains unchanged [63,64], possibly causing artifacts. How‐
ever, when the absolute expression level or phenotypes were observed later, no loss of X
chromosome dosage compensation was observed, but autosomal expression was in‐
creased [61,65,66]. In addition, targeting MOF to reporter genes in yeast resulted in an
approximately 10‐fold increase in expression that was far greater than the regulation of
dosage compensation in Drosophila [67]. In another study, acetylation levels of the MOF‐

Genes 2021, 12, 1606 14 of 20
targeted reporter genes were increased in both male and female Drosophila, but the ex‐
pression was increased only in females, but not in males with a completely assembled
MSL complex [39]. This suggests that the MSL complex may cause a constraining activity
that counteracts the effect of histone hyperacetylation on gene expression [68].
There is increasing evidence that the effective modulation magnitude of dosage com‐
pensation is not achieved through a single mechanism, but through a complicated inte‐
gration of activation and inhibition [1,36,39]. Considering the universality of inverse dos‐
age effect in aneuploidy, an explanation is proposed. The imbalance of the single X chro‐
mosome relative to the rest of the genome in male Drosophila results in extensive inverse
dosage effects to increase the expression level of the whole genome. Unlike aneuploidy
caused by chromosomal abnormalities, sex chromosome monosome is emerged over a
long period of evolution, so there must be some mechanism that inhibits the harm of ge‐
nomic imbalance caused by aneuploidy. To avoid autosomal activation in trans, the MSL
complex may have evolved the role of isolating histone modifiers such as MOF on the X
chromosome [12,14,15,36,39]. As the Y chromosome degenerated and the hemizygous re‐
gion expanded, the X chromosome accumulated more and more histone modifiers than it
needs to compensate. Therefore, an inhibitory activity associated with the MSL complex
evolved to prevent overexpression of the X chromosome and provide the appropriate
level of regulation to achieve dosage compensation [12,14,15,36,39].
In various studies, common characteristics of aneuploidy driven by genomic imbal‐
ance have been identified, such as altered metabolism, lower viability, genomic instability,
and altered proteostasis [57,69,70]. In this study, we found that a number of metabolic
processes in Drosophila are affected by aneuploidy states, such as organic acid and carbo‐
hydrate metabolic process. Most of these metabolic functions are significantly enriched in
up‐regulated DEGs (Figure 2D; Figure S1), which is consistent with previous reports that
aneuploidy requires more carbohydrates or energy [57,70]. It is suggested that metabolic
disorder may be the direct physiological cause of aneuploidy variation that harms the
survival of cells or organisms. In addition, we observed that cell cycle regulation, mitosis
and other related terms are significantly enriched in down‐regulated DEGs, and form the
largest down‐regulated cluster (Figures 2D and 3). The abnormal number of chromosomes
will affect the division and proliferation of cells, which is expected, since the normal sep‐
aration of chromosomes depends on the symmetry of two copies. This effect has also been
demonstrated in other studies, such as G1 delay in aneuploidy yeast and proliferation
defects of mammalian aneuploidy cells [57,70,71].
Aneuploidy is a common feature of cancer, with data showing that more than 90% of
solid tumors in humans contain aneuploidy [72,73]. Although the causal relationship be‐
tween aneuploidy and tumors is uncertain at present, studies have found that aneuploid
cells with genomic instability may even exhibit the ability to proliferate indefinitely, sim‐
ilar to cancerous cells [70,74,75]. A recent study found that induction of Notch signaling
in polyploid cells leads to malignant proliferation, loss of cell polarity, and further devel‐
opment into tumors with high genomic instability [76]. Interestingly, our study shows
that genes associated with the Notch signaling pathway are abnormally expressed in an‐
euploidy Drosophila (Figures 2D and 3), suggesting a close association between aneu‐
ploidy and tumor formation. We also found that aneuploidy states affect cell fate commit‐
ment and determination, and influence the development of multiple organs and systems
(Figures 2D and 3), which is consistent with the fact that aneuploidy variation usually
severely affects the growth and development of organisms [37,38]. Protein stability in an‐
euploidy cells is also affected, possibly because aneuploidy interferes with protein syn‐
thesis and alters sensitivity to protein folding, leading to protein degradation [57,69]. We
found that aberrantly expressed genes in Drosophila aneuploidy enriched the function of
protein ubiquitination (Figures 2D and 3), revealing that aneuploidy may affect protein
degradation by regulating the ubiquitination process.
Some details of the regulation of aneuploidy have also been identified. The magni‐
tude of the modulation of gene expression in aneuploidy is positively correlated with the

Genes 2021, 12, 1606 15 of 20
degree of genomic imbalance, that is, the effect of dosage is progressive [7,59]. In general,
modulation in aneuploidy is more spread than in a ploidy series [6,59]. The expression
level of cis genes usually ranges from dosage compensation to gene dosage effect, and the
most common regulation of trans genes is inverse dosage effect [7,58,59]. The regulation
mechanism of cis genes affected by dosage compensation and trans genes affected by in‐
verse dosage effect are related, and they share the same molecular basis [58,59]. Genes of
different functional classes show different responses to aneuploidy. Transcription factors,
signal transduction components, and organelle targeted protein genes are more tightly
inversely affected, and transcription factors and their targets showed considerable dis‐
cordance [6,7,59]. This suggests that altered regulatory stoichiometry is the main cause of
genetic imbalance. In addition, evidence from evolutionary genomics, gene copy number
variation, and quantitative trait similarity all indicate that stoichiometry of gene regula‐
tion plays a potential role in aneuploidy genetic balance [3,22–31].
The study of Drosophila dosage sensitive modifiers for white eye color gene pheno‐
types found that, the effect of aneuploidy on gene expression can be reduced to the action
of single genes, which are typically components of macromolecular complexes and mul‐
ticomponent interactions [12,19–22]. The first trans‐acting modifier Inr‐a was found to
have a precise inverse effect on the expression of the white gene [20,21]. In our study, we
demonstrated that the dosage changes of inverse regulator Inr‐a can mimic the effects of
aneuploidy across the whole transcriptome. The increase of Inr‐a copy number could in‐
duce a broad inverse dosage effect on gene expression throughout the whole genome, and
this effect is similar to the modulation of trisomy 2L, but the magnitude is slightly less
(Figure 5). These results indicate that the effect in aneuploidy is the result of a series of
dosage‐sensitive regulators as members of the macromolecular complexes, which to‐
gether constitute the complicated hierarchy of gene expression regulation network.
In order to find the key regulatory genes in the genomic imbalanced hierarchical reg‐
ulatory network, we focused on the typical types of macromolecular complexes and
looked for some transcription factors that might contribute to inverse dosage effect in an‐
euploidy. ac (achaete) is a basic helix‐loop‐helix (bHLH) transcription factor, usually
formed in complex with sc (scute), which controls the development of the dorsal plate and
setae in Drosophila and is thought to be involved in the development of the nervous system
and sensory organs [77,78]. In these processes, ac interacts with the Notch signaling path‐
way [79,80]. Through the analysis of gene expression microarray data of ac overexpressed
Drosophila in the public database, we found that the overexpression of ac results in down‐
regulation of many genes (Figure 4D,E), similar to the influence of inverse dosage effect,
indicating that ac may play an important regulatory role in aneuploidy as a dosage‐sensi‐
tive regulator. BEAF‐32 (boundary element‐associated factor of 32kD) is a DNA binding pro‐
tein that can bind scs boundary element of hsp70 and hundreds of other sites on Drosophila
chromosomes [81,82]. Boundary elements or chromatin insulators can isolate chromoso‐
mal regions into functionally independent parts by blocking the interactions of promiscu‐
ous promoters or enhancers [81,82]. In addition to the function of chromatin organization,
BEAF‐32 also regulates cell cycle genes by controlling H3K9 methylation [83]. In the BEAF‐
32 mutant Drosophila, we found that the gene expression level of a subset of the transcrip‐
tome is slightly up‐regulated (Figure 4F,G), suggesting that the reduced expression of
BEAF‐32 may produce inverse modulation.
Several other potential aneuploidy dosage‐sensitive regulatory genes play important
roles in a variety of biological processes. kay, also known as Fos or AP‐1, is related to Dro‐
sophila compound eye development, dendrite morphogenesis, embryo development, and
cell cycle regulation [84–88]. Jra is a homologue of the mammalian transcription factor Jun.
Both Jra and kay are basic region‐leucine zipper (bZIP) transcription factors and interact
with each other [84,89]. Jra plays a role in embryonic development, morphogenesis, neu‐
ronal development and plasticity in Drosophila [89–91]. crp, also known as AP‐4, acts on
muscle development and cellular branching of the terminal cells at the ends of tracheal
tubes [92,93]. Moreover, as a downstream target gene of Myc, crp can promote the growth

Genes 2021, 12, 1606 16 of 20
of cell and organ, affect cell cycle and survival of organisms [93,94]. The transcription fac‐
tor BtbVII is thought to play a role in embryonic and larval development of Drosophila.
CG3328, expressed in embryonic and larval garland cells, is the orthologous gene of hu‐
man gene MYRF (myelin regulatory factor), regulating myelination process [95].
Another possible inverse regulator pnr is a GATA factor, which activates the achaete‐
scute (ac‐sc) complex and plays a role in nervous system development [96–98]. It was
found that pnr‐driven neural development requires the involvement of chromatin remod‐
eling factor Iswi [98,99], and Iswi may have the activity of inhibiting gene overexpression
in Drosophila dosage compensation [12,99]. ci, homologous with Gli, is an effective tran‐
scription factor of Hedgehog (Hh) signal transduction pathway, which is necessary for the
pattern formation, morphogenetic and growth control of early development in Drosophila
[100–102]. ci can form full‐length transcription activator in the presence of hh (hedgehog)
and truncated repressor in the absence of hh [103]. It is worth noting that hh is one of the
47 trans‐acting modifiers previously identified in Drosophila [22], and thus it is speculated
that transcription factor ci may be a member of hh regulatory pathway in aneuploidy.
Besides transcription factors, two other typical macromolecular complexes, signal
transduction components and chromatin proteins, are also analyzed [22]. GSEA analysis
of the genes contained in the relevant GO terms in aneuploidy revealed that the significant
changes included the G‐protein‐related second messenger signaling pathway, Toll signal‐
ing pathway, Notch signaling pathway, etc. In addition, chromatin assembly or disassem‐
bly related genes tended to be down‐regulated in all three kinds of aneuploidy (Figure
S5).
In summary, we analyzed transcriptome sequencing data of autosomal aneuploidy
and sex chromosome aneuploidy in Drosophila and observed dosage compensation in the
varied chromosomes and a genome‐wide inverse dosage effect. Based on the characteris‐
tics of differentially expressed genes, we found that genomic imbalance affects cell prolif‐
eration and differentiation, protein stability, as well as Notch and other signaling path‐
ways, interferes with many physiological metabolic processes, and ultimately influences
the growth, development and survival of organisms. In search of the regulatory genes of
aneuploid inverse dosage effect, we analyzed the transcription factors and other macro‐
molecular complexes, and predicted nine possible regulators that may play important
roles in the regulation network of genomic imbalance. They have indispensable functions
in the early development, morphogenesis, cell cycle, and nervous system of Drosophila. In
addition, we analyzed the expression profiles of two transcription factors, ac and BEAF‐
32, mutation or overexpression Drosophila, and found that mutation of candidate regula‐
tory genes would lead to the tendency of up‐regulation across the genome, while overex‐
pression showed an opposite trend, that is to produce an inverse effect. We also studied a
classical inverse modifier, Inr‐a, whose increase in dosage produces inverse dosage effect
across the transcriptome and is similar to the trisomy of chromosome 2 left arm. Therefore,
this study highlights the existence of dosage compensation in aneuploidy, which is real‐
ized through widespread inverse dosage effects, and the mechanism is that the altered
stoichiometric relationship of multi‐subunit complex members caused by genomic imbal‐
ance ultimately affects the overall function. The candidate aneuploidy regulatory genes
and related pathways need to be further studied, and the study of dosage‐sensitive regu‐
lators will help to further understand the regulation mechanism of gene expression in
aneuploidy.
Supplementary Materials: The following are available online at www.mdpi.com/arti‐
cle/10.3390/genes12101606/s1, Figures S1: GO and KEGG enrichment analysis of differentially ex‐
pressed genes in three kinds of aneuploidy. Figures S2: Protein‐protein interaction (PPI) networks
of the common differentially expressed genes. Figures S3: Enrichment analysis of transcription fac‐
tors for down‐regulated genes in different aneuploidy groups. Figures S4: Gene expression of can‐
didate transcription factors. Figures S5: Gene set enrichment analysis (GSEA) of signal transduction
components and chromatin proteins. Table S1: Primers used in RT‐PCR. Table S2: Validation of
RNA‐sequencing using relative quantitative PCR.

Genes 2021, 12, 1606 17 of 20
Author Contributions: S.Z., R.W., C.H. and L.S. conceived the project, designed the experiments
and wrote the manuscript; S.Z., R.W., C.H. and L.Z. performed the experiments; S.Z. and C.H. ana‐
lyzed the data; S.Z., R.W. and L.S. wrote the manuscript. S.Z., R.W. and C.H. contributed equally to
this work. All authors have read and agreed to the published version of the manuscript.
Funding: This research was funded by National Natural Science Foundation of China, grant number
31871243 and 32070566.
Institutional Review Board Statement: Not applicable.
Informed Consent Statement: Not applicable.
Data Availability Statement: The sequencing data of Inr‐a duplication Drosophila has been depos‐
ited in the Gene Expression Omnibus (GEO) database (https://www.ncbi.nlm.nih.gov/geo/, acces‐
sion no. GSE180089) and the Sequence Read Archive (SRA) (https://www.ncbi.nlm.nih.gov/sra, ac‐
cession no. SRP328302). The public data used in this study were downloaded from GSE46354,
GSE41679, GSE53010 and GSE36736.
Acknowledgments: We thank James A.Birchler for revising the manuscript. High‐throughput se‐
quencing services were performed by Novogene. Research was supported by National Natural Sci‐
ence Foundation of China (Grant No. 31871243 and No. 32070566) to L.S.
Conflicts of Interest: The authors declare no conflict of interest.
References
1. Prestel, M.; Feller, C.; Becker, P.B. Dosage compensation and the global re‐balancing of aneuploid genomes. Genome Biol. 2010,
11, 216, doi:10.1186/gb‐2010‐11‐8‐216.
2. Blakeslee, A.F.; Belling, J.; Farnham, M.E. Chromosomal Duplication and Mendelian Phenomena in Datura Mutants. Science
1920, 52, 388–390, doi:10.1126/science.52.1347.388.
3. Birchler, J.A.; Veitia, R.A. Gene balance hypothesis: Connecting issues of dosage sensitivity across biological disciplines. Proc.
Natl. Acad. Sci. USA 2012, 109, 14746–14753, doi:10.1073/pnas.1207726109.
4. Ait Yahya‐Graison, E.; Aubert, J.; Dauphinot, L.; Rivals, I.; Prieur, M.; Golfier, G.; Rossier, J.; Personnaz, L.; Creau, N.; Blehaut,
H.; et al. Classification of human chromosome 21 gene‐expression variations in Down syndrome: Impact on disease phenotypes.
Am. J. Hum. Genet. 2007, 81, 475–491, doi:10.1086/520000.
5. Birchler, J.A. Aneuploidy in plants and flies: The origin of studies of genomic imbalance. Semin Cell Dev. Biol. 2013, 24, 315–319,
doi:10.1016/j.semcdb.2013.02.004.
6. Hou, J.; Shi, X.; Chen, C.; Islam, M.S.; Johnson, A.F.; Kanno, T.; Huettel, B.; Yen, M.R.; Hsu, F.M.; Ji, T.; et al. Global impacts of
chromosomal imbalance on gene expression in Arabidopsis and other taxa. Proc. Natl. Acad. Sci. USA 2018, 115, E11321–E11330,
doi:10.1073/pnas.1807796115.
7. Johnson, A.F.; Hou, J.; Yang, H.; Shi, X.; Chen, C.; Islam, M.S.; Ji, T.; Cheng, J.; Birchler, J.A. Magnitude of modulation of gene
expression in aneuploid maize depends on the extent of genomic imbalance. J Genet Genom. 2020, 47, 93–103,
doi:10.1016/j.jgg.2020.02.002.
8. Carlson, P.S. Locating genetic loci with aneuploids. Mol Gen Genet 1972, 114, 273–280, doi:10.1007/BF00267495.
9. Obrien, S.J.; Gethmann, R.C. Segmental Aneuploidy as a Probe for Structural Genes in Drosophila—Mitochondrial Membrane
Enzymes. Genetics 1973, 75, 155–167.
10. Birchler, J.A. A study of enzyme activities in a dosage series of the long arm of chromosome one in maize. Genetics 1979, 92,
1211–1229.
11. Guo, M.; Birchler, J.A. Trans‐acting dosage effects on the expression of model gene systems in maize aneuploids. Science 1994,
266, 1999–2002, doi:10.1126/science.266.5193.1999.
12. Birchler, J.A. Parallel Universes for Models of X Chromosome Dosage Compensation in Drosophila: A Review. Cytogenet. Genome
Res. 2016, 148, 52–67, doi:10.1159/000445924.
13. Birchler, J.A.; Newton, K.J. Modulation of protein levels in chromosomal dosage series of maize: The biochemical basis of an‐
euploid syndromes. Genetics 1981, 99, 247–266.
14. Sun, L.; Johnson, A.F.; Li, J.; Lambdin, A.S.; Cheng, J.; Birchler, J.A. Differential effect of aneuploidy on the X chromosome and
genes with sex‐biased expression in Drosophila. Proc. Natl. Acad. Sci. USA 2013, 110, 16514–16519, doi:10.1073/pnas.1316041110.
15. Sun, L.; Johnson, A.F.; Donohue, R.C.; Li, J.; Cheng, J.; Birchler, J.A. Dosage compensation and inverse effects in triple X meta‐
females of Drosophila. Proc. Natl. Acad. Sci. USA 2013, 110, 7383–7388, doi:10.1073/pnas.1305638110.
16. Birchler, J.A. The genetic basis of dosage compensation of alcohol dehydrogenase‐1 in maize. Genetics 1981, 97, 625–637.
17. Birchler, J.A.; Hiebert, J.C.; Paigen, K. Analysis of autosomal dosage compensation involving the alcohol dehydrogenase locus
in Drosophila melanogaster. Genetics 1990, 124, 679–686.
18. Birchler, J.A. Facts and artifacts in studies of gene expression in aneuploids and sex chromosomes. Chromosoma 2014, 123, 459–
469, doi:10.1007/s00412‐014‐0478‐5.
Genes 2021, 12, 1606 18 of 20
19. Sabl, J.F.; Birchler, J.A. Dosage dependent modifiers of white alleles in Drosophila melanogaster. Genet. Res. 1993, 62, 15–22,
doi:10.1017/s0016672300031517.
20. Rabinow, L.; Nguyen‐Huynh, A.T.; Birchler, J.A. A trans‐acting regulatory gene that inversely affects the expression of the white,
brown and scarlet loci in Drosophila. Genetics 1991, 129, 463–480.
21. Xie, W.; Birchler, J.A. Identification of Inverse Regulator‐a (Inr‐a) as Synonymous with Pre‐mRNA Cleavage Complex II Protein
(Pcf11) in Drosophila. G3 (Bethesda) 2012, 2, 701–706, doi:10.1534/g3.112.002071.
22. Birchler, J.A.; Bhadra, U.; Bhadra, M.P.; Auger, D.L. Dosage‐dependent gene regulation in multicellular eukaryotes: Implications
for dosage compensation, aneuploid syndromes, and quantitative traits. Dev. Biol. 2001, 234, 275–288, doi:10.1006/dbio.2001.0262.
23. Ionita‐Laza, I.; Rogers, A.J.; Lange, C.; Raby, B.A.; Lee, C. Genetic association analysis of copy‐number variation (CNV) in hu‐
man disease pathogenesis. Genomics 2009, 93, 22–26, doi:10.1016/j.ygeno.2008.08.012.
24. Makino, T.; McLysaght, A. Ohnologs in the human genome are dosage balanced and frequently associated with disease. Proc.
Natl. Acad. Sci. USA 2010, 107, 9270–9274, doi:10.1073/pnas.0914697107.
25. Rice, A.M.; McLysaght, A. Dosage sensitivity is a major determinant of human copy number variant pathogenicity. Nature
Communications 2017, 8, doi:ARTN 1436610.1038/ncomms14366.
26. Papp, B.; Pal, C.; Hurst, L.D. Dosage sensitivity and the evolution of gene families in yeast. Nature 2003, 424, 194–197,
doi:10.1038/nature01771.
27. Blanc, G.; Wolfe, K.H. Functional divergence of duplicated genes formed by polyploidy during Arabidopsis evolution. Plant
Cell 2004, 16, 1679–1691, doi:10.1105/tpc.021410.
28. Birchler, J.A.; Veitia, R.A. The gene balance hypothesis: From classical genetics to modern genomics. Plant Cell 2007, 19, 395–
402, doi:10.1105/tpc.106.049338.
29. Birchler, J.A.; Veitia, R.A. The gene balance hypothesis: implications for gene regulation, quantitative traits and evolution. New
Phytol. 2010, 186, 54‐62, doi:10.1111/j.1469‐8137.2009.03087.x.
30. Birchler, J.A. Genomic Balance Plays Out in Evolution. Plant Cell 2019, 31, 1186–1187, doi:10.1105/tpc.19.00329.
31. Freeling, M. Bias in plant gene content following different sorts of duplication: Tandem, whole‐genome, segmental, or by trans‐
position. Annu. Rev. Plant Biol. 2009, 60, 433–453, doi:10.1146/annurev.arplant.043008.092122.
32. Veitia, R.A.; Bottani, S.; Birchler, J.A. Cellular reactions to gene dosage imbalance: Genomic, transcriptomic and proteomic ef‐
fects. Trends Genet. 2008, 24, 390–397, doi:10.1016/j.tig.2008.05.005.
33. Veitia, R.A. Nonlinear effects in macromolecular assembly and dosage sensitivity. J. Theor. Biol. 2003, 220, 19–25,
doi:10.1006/jtbi.2003.3105.
34. Veitia, R.A. Gene dosage balance in cellular pathways: Implications for dominance and gene duplicability. Genetics 2004, 168,
569–574, doi:10.1534/genetics.104.029785.
35. Veitia, R.A.; Birchler, J.A. Models of buffering of dosage imbalances in protein complexes. Biol. Direct 2015, 10, 42,
doi:10.1186/s13062‐015‐0063‐8.
36. Birchler, J.A.; Pal‐Bhadra, M.; Bhadra, U. Dosage dependent gene regulation and the compensation of the X chromosome in
Drosophila males. Genetica 2003, 117, 179–190, doi:10.1023/a:1022935927763.
37. Jallepalli, P.V.; Pellman, D. Cell biology. Aneuploidy in the balance. Science 2007, 317, 904–905, doi:10.1126/science.1146857.
38. Torres, E.M.; Williams, B.R.; Amon, A. Aneuploidy: Cells losing their balance. Genetics 2008, 179, 737–746, doi:10.1534/genet‐
ics.108.090878.
39. Sun, L.; Fernandez, H.R.; Donohue, R.C.; Li, J.; Cheng, J.; Birchler, J.A. Male‐specific lethal complex in Drosophila counteracts
histone acetylation and does not mediate dosage compensation. Proc. Natl. Acad. Sci. USA 2013, 110, E808‐817,
doi:10.1073/pnas.1222542110.
40. Bolger, A.M.; Lohse, M.; Usadel, B. Trimmomatic: A flexible trimmer for Illumina sequence data. Bioinformatics 2014, 30, 2114–
2120, doi:10.1093/bioinformatics/btu170.
41. Patro, R.; Duggal, G.; Love, M.I.; Irizarry, R.A.; Kingsford, C. Salmon provides fast and bias‐aware quantification of transcript
expression. Nat. Methods 2017, 14, 417–419, doi:10.1038/nmeth.4197.
42. Soneson, C.; Love, M.I.; Robinson, M.D. Differential analyses for RNA‐seq: Transcript‐level estimates improve gene‐level infer‐
ences. F1000Research 2015, 4, 1521, doi:10.12688/f1000research.7563.2.
43. Love, M.I.; Huber, W.; Anders, S. Moderated estimation of fold change and dispersion for RNA‐seq data with DESeq2. Genome
Biol. 2014, 15, 550, doi:10.1186/s13059‐014‐0550‐8.
44. Hao, Z.; Lv, D.; Ge, Y.; Shi, J.; Weijers, D.; Yu, G.; Chen, J. RIdeogram: Drawing SVG graphics to visualize and map genome‐
wide data on the idiograms. PeerJ Comput. Sci. 2020, 6, e251, doi:10.7717/peerj‐cs.251.
45. Gu, Z.; Eils, R.; Schlesner, M. Complex heatmaps reveal patterns and correlations in multidimensional genomic data. Bioinfor‐
matics 2016, 32, 2847–2849, doi:10.1093/bioinformatics/btw313.
46. Gu, Z.; Gu, L.; Eils, R.; Schlesner, M.; Brors, B. circlize Implements and enhances circular visualization in R. Bioinformatics 2014,
30, 2811–2812, doi:10.1093/bioinformatics/btu393.
47. Yu, G.C.; Wang, L.G.; Han, Y.Y.; He, Q.Y. clusterProfiler: An R Package for Comparing Biological Themes Among Gene Clusters.
Omics A J. Integr. Biol. 2012, 16, 284–287, doi:10.1089/omi.2011.0118.
48. Kanehisa, M.; Goto, S. KEGG: Kyoto Encyclopedia of Genes and Genomes. Nucleic Acids Res. 2000, 28, 27–30,
doi:10.1093/nar/28.1.27.
49. Zhu, A.; Ibrahim, J.G.; Love, M.I. Heavy‐tailed prior distributions for sequence count data: Removing the noise and preserving

Genes 2021, 12, 1606 19 of 20
large differences. Bioinformatics 2019, 35, 2084–2092, doi:10.1093/bioinformatics/bty895.
50. Szklarczyk, D.; Gable, A.L.; Lyon, D.; Junge, A.; Wyder, S.; Huerta‐Cepas, J.; Simonovic, M.; Doncheva, N.T.; Morris, J.H.; Bork,
P.; et al. STRING v11: Protein‐protein association networks with increased coverage, supporting functional discovery in ge‐
nome‐wide experimental datasets. Nucleic Acids Res. 2019, 47, D607–D613, doi:10.1093/nar/gky1131.
51. Shannon, P.; Markiel, A.; Ozier, O.; Baliga, N.S.; Wang, J.T.; Ramage, D.; Amin, N.; Schwikowski, B.; Ideker, T. Cytoscape: A
software environment for integrated models of biomolecular interaction networks. Genome Res. 2003, 13, 2498–2504,
doi:10.1101/gr.1239303.
52. Chin, C.H.; Chen, S.H.; Wu, H.H.; Ho, C.W.; Ko, M.T.; Lin, C.Y. cytoHubba: Identifying hub objects and sub‐networks from
complex interactome. BMC Syst. Biol. 2014, 8 (Suppl. S4), S11, doi:10.1186/1752‐0509‐8‐S4‐S11.
53. Bader, G.D.; Hogue, C.W. An automated method for finding molecular complexes in large protein interaction networks. BMC
Bioinform. 2003, 4, 2, doi:10.1186/1471‐2105‐4‐2.
54. Aibar, S.; Gonzalez‐Blas, C.B.; Moerman, T.; Van, A.H.T.; Imrichova, H.; Hulselmans, G.; Rambow, F.; Marine, J.C.; Geurts, P.;
Aerts, J.; et al. SCENIC: Single‐cell regulatory network inference and clustering. Nat. Methods 2017, 14, 1083–1086,
doi:10.1038/Nmeth.4463.
55. Krzywinski, M.; Schein, J.; Birol, I.; Connors, J.; Gascoyne, R.; Horsman, D.; Jones, S.J.; Marra, M.A. Circos: An information
aesthetic for comparative genomics. Genome Res. 2009, 19, 1639–1645, doi:10.1101/gr.092759.109.
56. Villanueva, R.A.M.; Chen, Z.J. ggplot2: Elegant Graphics for Data Analysis, 2nd edition. Meas Interdiscip. Res. 2019, 17, 160–167,
doi:10.1080/15366367.2019.1565254.
57. Torres, E.M.; Sokolsky, T.; Tucker, C.M.; Chan, L.Y.; Boselli, M.; Dunham, M.J.; Amon, A. Effects of aneuploidy on cellular
physiology and cell division in haploid yeast. Science 2007, 317, 916–924, doi:10.1126/science.1142210.
58. Yang, H.; Shi, X.; Chen, C.; Hou, J.; Ji, T.; Cheng, J.; Birchler, J.A. Predominantly inverse modulation of gene expression in
genomically unbalanced disomic haploid maize. Plant Cell 2021, 33, 901–916, doi:10.1093/plcell/koab029.
59. Shi, X.; Yang, H.; Chen, C.; Hou, J.; Hanson, K.M.; Albert, P.S.; Ji, T.; Cheng, J.; Birchler, J.A. Genomic imbalance determines
positive and negative modulation of gene expression in diploid maize. Plant Cell 2021, 33, 917–939, doi:10.1093/plcell/koab030.
60. Birchler, J.A. X chromosome dosage compensation in Drosophila. Science 1996, 272, 1190a, doi:10.1126/science.272.5265.1190a.
61. Bhadra, U.; Pal‐Bhadra, M.; Birchler, J.A. Role of the male specific lethal (msl) genes in modifying the effects of sex chromosomal
dosage in Drosophila. Genetics 1999, 152, 249–268.
62. Hilfiker, A.; HilfikerKleiner, D.; Pannuti, A.; Lucchesi, J.C. mof, a putative acetyl transferase gene related to the Tip60 and MOZ
human genes and to the SAS genes of yeast, is required for dosage compensation in Drosophila. EMBO J. 1997, 16, 2054–2060,
doi:DOI 10.1093/emboj/16.8.2054.
63. Belote, J.M.; Lucchesi, J.C. Control of X chromosome transcription by the maleless gene in Drosophila. Nature 1980, 285, 573–575,
doi:10.1038/285573a0.
64. Hamada, F.N.; Park, P.J.; Gordadze, P.R.; Kuroda, M.I. Global regulation of X chromosomal genes by the MSL complex in
Drosophila melanogaster. Genes Dev. 2005, 19, 2289–2294, doi:10.1101/gad.1343705.
65. Hiebert, J.C.; Birchler, J.A. Effects of the maleless mutation on X and autosomal gene expression in Drosophila melanogaster. Ge‐
netics 1994, 136, 913–926.
66. Bhadra, M.P.; Bhadra, U.; Kundu, J.; Birchler, J.A. Gene expression analysis of the function of the male‐specific lethal complex
in Drosophila. Genetics 2005, 169, 2061–2074, doi:10.1534/genetics.104.036020.
67. Akhtar, A.; Becker, P.B. Activation of transcription through histone H4 acetylation by MOF, an acetyltransferase essential for
dosage compensation in Drosophila. Mol. Cell 2000, 5, 367–375.
68. Aleman, J.R.; Kuhn, T.M.; Pascual‐Garcia, P.; Gospocic, J.; Lan, Y.; Bonasio, R.; Little, S.C.; Capelson, M. Correct dosage of X
chromosome transcription is controlled by a nuclear pore component. Cell Rep. 2021, 35, 109236, doi:10.1016/j.celrep.2021.109236.
69. Hwang, S.; Cavaliere, P.; Li, R.; Zhu, L.J.; Dephoure, N.; Torres, E.M. Consequences of aneuploidy in human fibroblasts with
trisomy 21. Proc. Natl. Acad. Sci. USA 2021, 118, e2014723118, doi:10.1073/pnas.2014723118.
70. Williams, B.R.; Prabhu, V.R.; Hunter, K.E.; Glazier, C.M.; Whittaker, C.A.; Housman, D.E.; Amon, A. Aneuploidy affects prolif‐
eration and spontaneous immortalization in mammalian cells. Science 2008, 322, 703–709, doi:10.1126/science.1160058.
71. Nawata, H.; Kashino, G.; Tano, K.; Daino, K.; Shimada, Y.; Kugoh, H.; Oshimura, M.; Watanabe, M. Dysregulation of gene
expression in the artificial human trisomy cells of chromosome 8 associated with transformed cell phenotypes. PLoS ONE 2011,
6, e25319, doi:10.1371/journal.pone.0025319.
72. Williams, B.R.; Amon, A. Aneuploidy: Cancer’s fatal flaw? Cancer Res. 2009, 69, 5289–5291, doi:10.1158/0008‐5472.CAN‐09‐0944.
73. Orr, B.; Godek, K.M.; Compton, D. Aneuploidy. Curr. Biol. 2015, 25, R538–R542, doi:10.1016/j.cub.2015.05.010.
74. Sheltzer, J.M.; Blank, H.M.; Pfau, S.J.; Tange, Y.; George, B.M.; Humpton, T.J.; Brito, I.L.; Hiraoka, Y.; Niwa, O.; Amon, A. Aneu‐
ploidy drives genomic instability in yeast. Science 2011, 333, 1026–1030, doi:10.1126/science.1206412.
75. Duesberg, P.; Rausch, C.; Rasnick, D.; Hehlmann, R. Genetic instability of cancer cells is proportional to their degree of aneu‐
ploidy. Proc. Natl. Acad. Sci. USA 1998, 95, 13692–13697, doi:10.1073/pnas.95.23.13692.
76. Wang, X.F.; Yang, S.A.; Gong, S.; Chang, C.H.; Portilla, J.M.; Chatterjee, D.; Irianto, J.; Bao, H.; Huang, Y.C.; Deng, W.M. Poly‐
ploid mitosis and depolyploidization promote chromosomal instability and tumor progression in a Notch‐induced tumor
model. Dev. Cell 2021, 56, 1976–1988.e4, doi:10.1016/j.devcel.2021.05.017.
77. Calleja, M.; Renaud, O.; Usui, K.; Pistillo, D.; Morata, G.; Simpson, P. How to pattern an epithelium: Lessons from achaete‐scute
regulation on the notum of Drosophila. Gene 2002, 292, 1–12, doi:10.1016/s0378‐1119(02)00628‐5.
Genes 2021, 12, 1606 20 of 20
78. Hsiao, Y.L.; Chen, Y.J.; Chang, Y.J.; Yeh, H.F.; Huang, Y.C.; Pi, H. Proneural proteins Achaete and Scute associate with nuclear
actin to promote formation of external sensory organs. J. Cell Sci. 2014, 127, 182–190, doi:10.1242/jcs.134718.
79. Culi, J.; Martin‐Blanco, E.; Modolell, J. The EGF receptor and N signalling pathways act antagonistically in Drosophila mesotho‐
rax bristle patterning. Development 2001, 128, 299–308.
80. Johnston, L.A.; Edgar, B.A. Wingless and Notch regulate cell‐cycle arrest in the developing Drosophila wing. Nature 1998, 394,
82–84, doi:10.1038/27925.
81. Zhao, K.; Hart, C.M.; Laemmli, U.K. Visualization of chromosomal domains with boundary element‐associated factor BEAF‐32.
Cell 1995, 81, 879–889, doi:10.1016/0092‐8674(95)90008‐x.
82. Cuvier, O.; Hart, C.M.; Laemmli, U.K. Identification of a class of chromatin boundary elements. Mol. Cell Biol. 1998, 18, 7478–
7486, doi:10.1128/MCB.18.12.7478.
83. Emberly, E.; Blattes, R.; Schuettengruber, B.; Hennion, M.; Jiang, N.; Hart, C.M.; Kas, E.; Cuvier, O. BEAF Regulates Cell‐Cycle
Genes through the Controlled Deposition of H3K9 Methylation Marks into Its Conserved Dual‐Core Binding Sites. PLoS Biol.
2008, 6, 2896–2910, doi:ARTNe32710.1371/journal.pbio.0060327.
84. Cerrato, A.; Parisi, M.; Anna, S.S.; Missirlis, F.; Guru, S.; Agarwal, S.; Sturgill, D.; Talbot, T.; Spiegel, A.; Collins, F.; et al. Genetic
interactions between Drosophila melanogaster menin and Jun/Fos. Dev. Biol. 2006, 298, 59–70, doi:10.1016/j.ydbio.2006.06.013.
85. Iyer, E.; Iyer, S.; Sullivan, L.; Wang, D.; Meduri, R.; Graybeal, L.; Cox, D. Functional genomic analyses of two morphologically
distinct classes of Drosophila sensory neurons: Post‐mitotic roles of transcription factors in dendritic patterning. PLoS ONE 2013,
8, e72434, doi:10.1371/journal.pone.0072434.
86. Jemc, J.C.; Milutinovich, A.B.; Weyers, J.J.; Takeda, Y.; van Doren, M. raw Functions through JNK signaling and cadherin‐based
adhesion to regulate Drosophila gonad morphogenesis. Dev. Biol. 2012, 367, 114–125, doi:10.1016/j.ydbio.2012.04.027.
87. Perkins, K.K.; Admon, A.; Patel, N.; Tjian, R. The Drosophila Fos‐Related Ap‐1 Protein Is a Developmentally Regulated Tran‐
scription Factor. Genes Dev. 1990, 4, 822–834, doi:10.1101/gad.4.5.822.
88. Hyun, J.; Becam, I.; Yanicostas, C.; Bohmann, D. Control of G2/M transition by Drosophila Fos. Mol. Cell Biol. 2006, 26, 8293–8302,
doi:10.1128/MCB.02455‐05.
89. Franciscovich, A.L.; Mortimer, A.A.V.; Freeman, A.A.; Gu, J.; Sanyal, S. Overexpression Screen in Drosophila Identifies Neuronal
Roles of GSK‐3 beta/shaggy as a Regulator of AP‐1‐Dependent Developmental Plasticity. Genetics 2008, 180, 2057–2071,
doi:10.1534/genetics.107.085555.
90. Agnes, F.; Suzanne, M.; Noselli, S. The Drosophila JNK pathway controls the morphogenesis of imaginal discs during metamor‐
phosis. Development 1999, 126, 5453–5462.
91. Suzanne, M.; Perrimon, N.; Noselli, S. The Drosophila JNK pathway controls the morphogenesis of the egg dorsal appendages
and micropyle. Dev. Biol. 2001, 237, 282–294, doi:10.1006/dbio.2001.0384.
92. Dobi, K.C.; Halfon, M.S.; Baylies, M.K. Whole‐genome analysis of muscle founder cells implicates the chromatin regulator Sin3A
in muscle identity. Cell Rep 2014, 8, 858–870, doi:10.1016/j.celrep.2014.07.005.
93. Wong, M.M.; Liu, M.F.; Chiu, S.K. Cropped, Drosophila transcription factor AP‐4, controls tracheal terminal branching and cell
growth. BMC Dev. Biol. 2015, 15, 20, doi:10.1186/s12861‐015‐0069‐6.
94. Jung, P.; Menssen, A.; Mayr, D.; Hermeking, H. AP4 encodes a c‐MYC‐inducible repressor of p21. Proc. Natl. Acad. Sci. USA
2008, 105, 15046–15051, doi:10.1073/pnas.0801773105.
95. Chen, B.; Zhu, Y.; Ye, S.; Zhang, R. Structure of the DNA‐binding domain of human myelin‐gene regulatory factor reveals its
potential protein‐DNA recognition mode. J. Struct. Biol. 2018, 203, 170–178, doi:10.1016/j.jsb.2018.04.007.
96. Haenlin, M.; Cubadda, Y.; Blondeau, F.; Heitzler, P.; Lutz, Y.; Simpson, P.; Ramain, P. Transcriptional activity of Pannier is
regulated negatively by heterodimerization of the GATA DNA‐binding domain with a cofactor encoded by the u‐shaped gene
of Drosophila. Genes Dev. 1997, 11, 3096–3108, doi:10.1101/gad.11.22.3096.
97. Fromental‐Ramain, C.; Taquet, N.; Ramain, P. Transcriptional interactions between the pannier isoforms and the cofactor U‐
shaped during neural development in Drosophila. Mech. Dev. 2010, 127, 442–457, doi:10.1016/j.mod.2010.08.002.
98. Vanolst, L.; Fromental‐Ramain, C.; Ramain, P. Toutatis, a TIP5‐related protein, positively regulates Pannier function during
Drosophila neural development. Development 2005, 132, 4327–4338, doi:10.1242/dev.02014.
99. Corona, D.F.; Clapier, C.R.; Becker, P.B.; Tamkun, J.W. Modulation of ISWI function by site‐specific histone acetylation. EMBO
Rep 2002, 3, 242–247, doi:10.1093/embo‐reports/kvf056.
100. Croker, J.A.; Ziegenhorn, S.L.; Holmgren, R.A. Regulation of the Drosophila transcription factor, Cubitus interruptus, by two
conserved domains. Dev. Biol. 2006, 291, 368–381, doi:10.1016/j.ydbio.2005.12.020.
101. Freeland, D.E.; Kuhn, D.T. Expression patterns of developmental genes reveal segment and parasegment organization of D.
melanogaster genital discs. Mech. Dev. 1996, 56, 61–72, doi:10.1016/0925‐4773(96)00511‐4.
102. Methot, N.; Basler, K. An absolute requirement for Cubitus interruptus in Hedgehog signaling. Development 2001, 128, 733–742.
103. Methot, N.; Basler, K. Hedgehog controls limb development by regulating the activities of distinct transcriptional activator and
repressor forms of Cubitus interruptus. Cell 1999, 96, 819–831, doi:10.1016/S0092‐8674(00)80592‐9.


![Chromosomal instability, aneuploidy, and gene mutations in ...3. Aneuploidy andAPC mutations A role of APC in the origin of CIN and aneuploidy in an in vitro model was suggested [8,18].](https://static.fdocuments.us/doc/165x107/61010a198f416a48f0302824/chromosomal-instability-aneuploidy-and-gene-mutations-in-3-aneuploidy-andapc.jpg)