ARTICLE IN PRESS - unicog.org · Structural asymmetries of perisylvian regions in the preterm...
11
Structural asymmetries of perisylvian regions in the preterm newborn J. Dubois a,b, ⁎, M. Benders a,c , F. Lazeyras d , C. Borradori-Tolsa a , R. Ha-Vinh Leuchter a , J.F. Mangin e , P.S. Hüppi a,f a Geneva University Hospitals, Department of Pediatrics, Geneva, Switzerland b INSERM, U663 (Pediatric Epilepsies and Brain Plasticity), Paris, France; University Paris Descartes, Paris, France c Wilhemina Children's Hospital, Department of Neonatology, Utrecht, Netherlands d Geneva University Hospitals, Department of Radiology-CIBM, Geneva, Switzerland e CEA, LNAO (Computer-assisted Neuroimaging Laboratory), CEA/SAC/DSV/I2BM/ NeuroSpin, Saclay, France f Children's Hospital, Department of Neurology, Harvard Medical School, Boston, MA, USA abstract article info Article history: Received 7 October 2009 Revised 16 March 2010 Accepted 19 March 2010 Available online xxxx Keywords: Cortex Development Sulcation Surface Premature brain MRI Asymmetries During the last trimester of human pregnancy, the cerebral cortex of foetuses becomes greatly and quickly gyrified, and post-mortem studies have demonstrated that hemispheres are already asymmetric at the level of Heschl gyrus, planum temporale and superior temporal sulcus (STS). Recently, magnetic resonance imaging (MRI) and dedicated post-processing tools enabled the quantitative study of brain development non-invasively in the preterm newborn. However, previous investigations were conducted either over the whole brain or in specific sulci. These approaches may consequently fail to highlight most cerebral sites, where anatomical landmarks are hard to delineate among individuals. In this cross-sectional study, we aimed to blindly and automatically map early asymmetries over the immature cortex. Voxel-based analyses of cortical and white matter masks were performed over a group of 25 newborns from 26 to 36 weeks of gestational age. Inter-individual variations associated with increasing age were first detected in large cerebral regions, with a prevalence of the right hemisphere in comparison with the left. Asymmetries were further highlighted in three specific cortical regions. Confirming previous studies, we observed deeper STS on the right side and larger posterior region of the sylvian fissure on the left side, close to planum temporale. For the first time, we also detected larger anterior region of the sylvian fissure on the left side, close to Broca's region. This study demonstrated that perisylvian regions are the only regions to be asymmetric from early on, suggesting their anatomical specificity for the emergence of functional lateralization in language processing prior to language exposure. © 2010 Elsevier Inc. All rights reserved. Introduction During the last trimester of human pregnancy, the foetal brain undergoes major changes. Besides its critical and immense growth, its macroscopic morphology becomes greatly and quickly elaborated through the formation of sulci and gyri within the cortex. After a few months, the high complexity observed in the adult brain is already present, and sulcal patterns become variable across individuals (Ono et al., 1990). Additionally to its anatomical complexity, the adult cerebral hemispheres are asymmetric, notably through the “Yakovle- vian torque” related to frontal and occipital petalias, and to the posterior shift in the sylvian fissure on the left compared with the right (Toga and Thompson, 2003). Structural asymmetries were described early on in perisylvian regions. Heschl gyrus, planum temporale and superior temporal sulcus (STS) are asymmetric in the foetal and preterm brain (Chi et al., 1977b; Witelson and Pallie, 1973; Dubois et al., 2008a), and asymmetry in the sylvian fissure extent is progressively detected from adolescence to young adulthood (Sowell et al., 2002). Such asymmetrical structure is supposed to be closely related to the functional lateralization for language processing, which is already detected in the infant brain (Dehaene-Lambertz et al., 2006a). Nevertheless, direct correlations between anatomical and functional asymmetries are still lacking, since comparative in vivo measurements are then required. Actually, specific early brain changes and asymmetries have been described many years ago in post-mortem brains (Feess-Higgins and Laroche, 1987). Recent advances in magnetic resonance imaging (MRI) enabled the study of such processes non-invasively, quantitatively and in three dimensions (3D) in the neonate. But imaging and mapping the cortical development in foetuses still remain a challenge without sedation because of foetal and maternal motion (Scifo et al., 2003). Studying the preterm newborn brain with dedicated post-processing tools (Hüppi et al., 1996; Cachia et al., 2003) has recently offered the opportunity to explore the early normal mechanisms of sulcation and gyrification (Dubois et al., 2008a) as well as disturbed processes and their functional significance (Dubois et al., 2008b). In particular, the folding of NeuroImage xxx (2010) xxx–xxx ⁎ Corresponding author. CEA/SAC/DSV/DRM/NeuroSpin/Cognitive Neuroimaging Unit, Bât 145, point courrier 156, 91191 Gif-sur-Yvette, France. Fax: +33 1 69 08 79 73. E-mail address: [email protected] (J. Dubois). YNIMG-07173; No. of pages: 11; 4C: 4, 6, 8 1053-8119/$ – see front matter © 2010 Elsevier Inc. All rights reserved. doi:10.1016/j.neuroimage.2010.03.054 Contents lists available at ScienceDirect NeuroImage journal homepage: www.elsevier.com/locate/ynimg ARTICLE IN PRESS Please cite this article as: Dubois, J., et al., Structural asymmetries of perisylvian regions in the preterm newborn, NeuroImage (2010), doi:10.1016/j.neuroimage.2010.03.054
Transcript of ARTICLE IN PRESS - unicog.org · Structural asymmetries of perisylvian regions in the preterm...
NeuroImage xxx (2010) xxx–xxx
YNIMG-07173; No. of pages: 11; 4C: 4, 6, 8
Contents lists available at ScienceDirect
NeuroImage
j ourna l homepage: www.e lsev ie r.com/ locate /yn img
ARTICLE IN PRESS
Structural asymmetries of perisylvian regions in the preterm newborn
J. Dubois a,b,⁎, M. Benders a,c, F. Lazeyras d, C. Borradori-Tolsa a, R. Ha-Vinh Leuchter a,J.F. Mangin e, P.S. Hüppi a,f
a Geneva University Hospitals, Department of Pediatrics, Geneva, Switzerlandb INSERM, U663 (Pediatric Epilepsies and Brain Plasticity), Paris, France; University Paris Descartes, Paris, Francec Wilhemina Children's Hospital, Department of Neonatology, Utrecht, Netherlandsd Geneva University Hospitals, Department of Radiology-CIBM, Geneva, Switzerlande CEA, LNAO (Computer-assisted Neuroimaging Laboratory), CEA/SAC/DSV/I2BM/ NeuroSpin, Saclay, Francef Children's Hospital, Department of Neurology, Harvard Medical School, Boston, MA, USA
⁎ Corresponding author. CEA/SAC/DSV/DRM/NeuroUnit, Bât 145, point courrier 156, 91191 Gif-sur-Yvette, F
E-mail address: [email protected] (J. Du
1053-8119/$ – see front matter © 2010 Elsevier Inc. Aldoi:10.1016/j.neuroimage.2010.03.054
Please cite this article as: Dubois, J., et al.doi:10.1016/j.neuroimage.2010.03.054
a b s t r a c t
a r t i c l e i n f oArticle history:Received 7 October 2009Revised 16 March 2010Accepted 19 March 2010Available online xxxx
Keywords:CortexDevelopmentSulcationSurfacePremature brainMRIAsymmetries
During the last trimester of human pregnancy, the cerebral cortex of foetuses becomes greatly and quicklygyrified, and post-mortem studies have demonstrated that hemispheres are already asymmetric at the level ofHeschl gyrus, planum temporale and superior temporal sulcus (STS). Recently, magnetic resonance imaging(MRI) anddedicatedpost-processing tools enabled the quantitative studyofbraindevelopment non-invasively inthe pretermnewborn.However, previous investigationswere conducted either over thewholebrainor in specificsulci. These approaches may consequently fail to highlight most cerebral sites, where anatomical landmarks arehard to delineate among individuals. In this cross-sectional study, we aimed to blindly and automatically mapearly asymmetries over the immature cortex. Voxel-based analyses of cortical and white matter masks wereperformed over a group of 25 newborns from 26 to 36 weeks of gestational age. Inter-individual variationsassociated with increasing age were first detected in large cerebral regions, with a prevalence of the righthemisphere in comparison with the left. Asymmetries were further highlighted in three specific cortical regions.Confirming previous studies, we observed deeper STS on the right side and larger posterior region of the sylvianfissure on the left side, close to planum temporale. For thefirst time,we also detected larger anterior region of thesylvian fissure on the left side, close to Broca's region. This study demonstrated that perisylvian regions are theonly regions to be asymmetric from early on, suggesting their anatomical specificity for the emergence offunctional lateralization in language processing prior to language exposure.
Spin/Cognitive Neuroimagingrance. Fax: +33 1 69 08 79 73.bois).
l rights reserved.
, Structural asymmetries of perisylvian regio
© 2010 Elsevier Inc. All rights reserved.
Introduction
During the last trimester of human pregnancy, the foetal brainundergoes major changes. Besides its critical and immense growth, itsmacroscopic morphology becomes greatly and quickly elaboratedthrough the formation of sulci and gyri within the cortex. After a fewmonths, the high complexity observed in the adult brain is alreadypresent, and sulcal patterns become variable across individuals (Onoet al., 1990). Additionally to its anatomical complexity, the adultcerebral hemispheres are asymmetric, notably through the “Yakovle-vian torque” related to frontal and occipital petalias, and to theposterior shift in the sylvianfissure on the left comparedwith the right(Toga and Thompson, 2003).
Structural asymmetries were described early on in perisylvianregions. Heschl gyrus, planum temporale and superior temporal sulcus(STS) are asymmetric in the foetal and preterm brain (Chi et al., 1977b;
Witelson and Pallie, 1973; Dubois et al., 2008a), and asymmetry in thesylvian fissure extent is progressively detected from adolescence toyoung adulthood (Sowell et al., 2002). Such asymmetrical structure issupposed to be closely related to the functional lateralization forlanguage processing, which is already detected in the infant brain(Dehaene-Lambertz et al., 2006a). Nevertheless, direct correlationsbetween anatomical and functional asymmetries are still lacking, sincecomparative in vivomeasurements are then required.
Actually, specific early brain changes and asymmetries have beendescribed many years ago in post-mortem brains (Feess-Higgins andLaroche, 1987). Recent advances in magnetic resonance imaging (MRI)enabled the study of such processes non-invasively, quantitatively and inthree dimensions (3D) in the neonate. But imaging and mapping thecortical development in foetuses still remain a challenge withoutsedation because of foetal and maternal motion (Scifo et al., 2003).Studying the preterm newborn brain with dedicated post-processingtools (Hüppi et al., 1996; Cachia et al., 2003) has recently offered theopportunity to explore the early normal mechanisms of sulcation andgyrification (Dubois et al., 2008a) aswell as disturbedprocesses and theirfunctional significance (Dubois et al., 2008b). In particular, the folding of
ns in the preterm newborn, NeuroImage (2010),

2 J. Dubois et al. / NeuroImage xxx (2010) xxx–xxx
ARTICLE IN PRESS
major sulci has been quantified and time-scaled, and a rightwardasymmetry of the STS has been detected (Dubois et al., 2008a).
Despite the provided breakthroughs, these studies presented thedrawback of focusing on major identified sulci and disregarding othercortical regions, the anatomical localization of which may be hard todelineate among individuals. In this cross-sectional study, we aimed toblindly and automatically map local inter-hemispherical asymmetriesover the whole preterm brain. We implemented a voxel-basedapproach, taking no a priori hypothesis on anatomical localization, inorder to analyse cortical and white matter masks over a group oftwenty-five newborns.
Materials and methods
Subjects
Twenty-fivepretermnewbornswere included in this study (13boys,12 girls; mean gestational age – GA – at birth: 30.3±2.5 weeks, range:25.6–35.6 weeks; mean weight at birth: 1507±514 g, range: 850–2730 g). This cohort of newborns has already been presented as the“normal groups” of previous publications (Dubois et al., 2008a,b; seeTable 1 for details). The events around premature birth included risk ofinfection (maternal fever, increased white cell count and C-reactiveprotein CRP), premature rupture of membranes (PROM), placentalabruption, preeclampsia and foetal distress (tachycardia, bradycardia,pathological cardiotocography CTG). No reason was found for threenewborns. Seven newbornswere intubated at birth, and the duration ofventilation ranged between 1 and 4 days. Fifteen newborns requiredcontinuous positive airway pressure (CPAP), for a time period rangingbetween 1 and 44 days. Table 1 summarizes these clinical detailsfor all newborns.
Table 1Clinical details for the 25 preterm newborns: Are presented, for each newborn.
No. Gender GA at MRI(weeks)
GA at birth(weeks)
Delay birthMRI (weeks)
MRIsystem
Events around prematu
1 F 26.6 25.6 1.0 Intera No reasons for prematuHypotension, respirator
2 F 27.9 26.6 1.3 Intera Infectious risk (maternal3 F 28.1 27.1 1.0 Avanto Foetal suffering and ma4 M 28.6 26.7 1.9 Avanto PROM, maternal inflamm5 F 29.6 28.3 1.3 Intera Tachycardia and infectiou
cell increase). Caesarian.6 F 29.9 28.4 1.4 Intera PROM, infectious risk. F7 F 30.0 28.7 1.3 Avanto PROM, infectious risk (m8 M 30.3 30.0 0.3 Intera Placental abruption and9 F 30.4 29.9 0.6 Intera Foetal pathological CTG
Caesarian.10 F 30.6 29.6 1.0 Avanto Foetal pathological CTG11 F 30.7 29.9 0.9 Avanto Threat of premature bir12 F 31.0 29.0 2.0 Intera PROM and maternal CR13 F 31.1 30.7 0.4 Avanto Placenta abruption, pree
traces. Caesarian.14 M 31.1 30.7 0.4 Avanto Foetal suffering. Caesari15 M 32.0 29.9 2.1 Avanto Preeclampsia. Caesarian16 M 32.1 31.1 1.0 Avanto Placental abruption and17 M 32.6 30.4 2.1 Eclipse PROM, maternal inflamm18 M 33.3 31.6 1.7 Intera Placental abruption and19 M 33.6 30.6 3.0 Eclipse No reasons for prematur20 F 33.7 32.4 1.3 Eclipse PROM, maternal inflamm21 M 34.4 32.4 2.0 Intera PROM, maternal inflamm
Caesarian. Asphyxia.22 M 34.4 33.3 1.1 Intera PROM, maternal inflamm23 M 34.4 34.1 0.3 Intera No reasons for prematur24 M 35.0 34.1 0.9 Achieva Placental abruption. Cae25 M 35.7 35.6 0.1 Intera Foetal pathological CTG
Presented, for each newborn, the gender, the gestational ages (GA) at MRI and at birth, withCreactive protein, PROM: premature rupture of membranes, CTG: cardiotocography), birth wthe need for continuous positive airway pressure (CPAP in days).
Please cite this article as: Dubois, J., et al., Structural asymmetries ofdoi:10.1016/j.neuroimage.2010.03.054
All newborns were from singleton pregnancies and had a normalintra-uterinegrowth. Intra-uterinegrowthrestriction(IUGR)wasdefinedas birth weight below the 10th percentile for gestational age and genderand on criterion of placental insufficiency according to intra-uterinegrowth assessment, pre-natal ultrasound and Doppler measurementswithin the umbilical artery (see Tolsa et al., 2004; Dubois et al., 2008b).
The MRI examination (one per newborn) was performed as soon aspossible after birth (mean GA at MRI: 31.5±2.4 weeks, range: 26.6–35.7 weeks; mean time interval between birth and MRI: 1.2±0.7 weeks, range: 0.1–3 weeks). The newborns' parents gave writteninformed consent for the study and the protocol was approved by thelocal ethical committee. The collection of all MRI data was performedwithin a time period of 4.9 years.
A radiologist specialized in neuro-pediatrics reviewed all MRIexaminations acquired at birth and also at term-equivalent age. For allnewborns, no lesion or cerebral abnormalities, in respect to theirgestational ages, were detected on inversion recovery T1-weightedimages, on T2-weighted images nor on diffusion-weighted images(maps of averaged diffusion coefficient ADC).
Data acquisition
During MR imaging, no sedation was used and the newborns werespontaneously asleep. Special “mini-muffs”were appliedon their ears tominimize noise exposure. The study was conducted on a 1.5-T MRIsystem: Philips Medical Systems (Eclipse for 3 newborns, Intera for 12newborns, Achieva for 1 newborn) or SiemensMedical System (Avantofor 9 newborns). The repartition of MRI systems among newborns isdetailed in Table 1. Note that there was no relationship between thesystems used and the babies' ages: the four systems were equallydistributed with age.
re birth Birthweight (g)
Intubation Ventilation(days)
CPAP(days)
re birth. Down way.y distress syndrome.
950 No 0 42
febrile state, CRP increase). Caesarian. 850 No 0 12ternal febrile state. Caesarian. 1010 Yes 1 44atory syndrome. Down way. 990 No 0 1s risk (maternal febrile state andwhite 900 Yes 3 43
oetal suffering. Caesarian. 1140 No 0 2aternalwhite cell increase). Downway. 1280 No 0 31preeclampsia. Caesarian. 1600 No 0 0traces, maternal uterine spasms. 1630 No 0 7
traces. Caesarian. 1020 No 0 18th. Down way. 1620 No 0 3P increase. Caesarian. 1090 No 0 1clampsia and foetal pathological 1410 Yes 1 0
an. Respiratory distress syndrome. 1330 No 0 0. 1040 No 0 7preeclampsia suspicion. Caesarian. 1370 Yes 1 7atory syndrome. Caesarian 1590 No 0 0foetal bradycardia. Caesarian. 1735 Yes 2 2e birth, no foetal suffering. Downway. 1800 No 0 0atory syndrome. Down way. 1770 No 0 0atory syndrome, oligoamnios. 1980 Yes 4 0
atory syndrome. Caesarian. 2050 No 0 0e birth, no foetal suffering. Downway. 2350 No 0 0sarian. 2440 Yes 3 6traces. Down way. 2730 No 0 0
time delay (in weeks), the MRI system used, the events around premature birth (CRP:eight (in grams), the need for intubation and the duration of ventilation (in days), and
perisylvian regions in the preterm newborn, NeuroImage (2010),
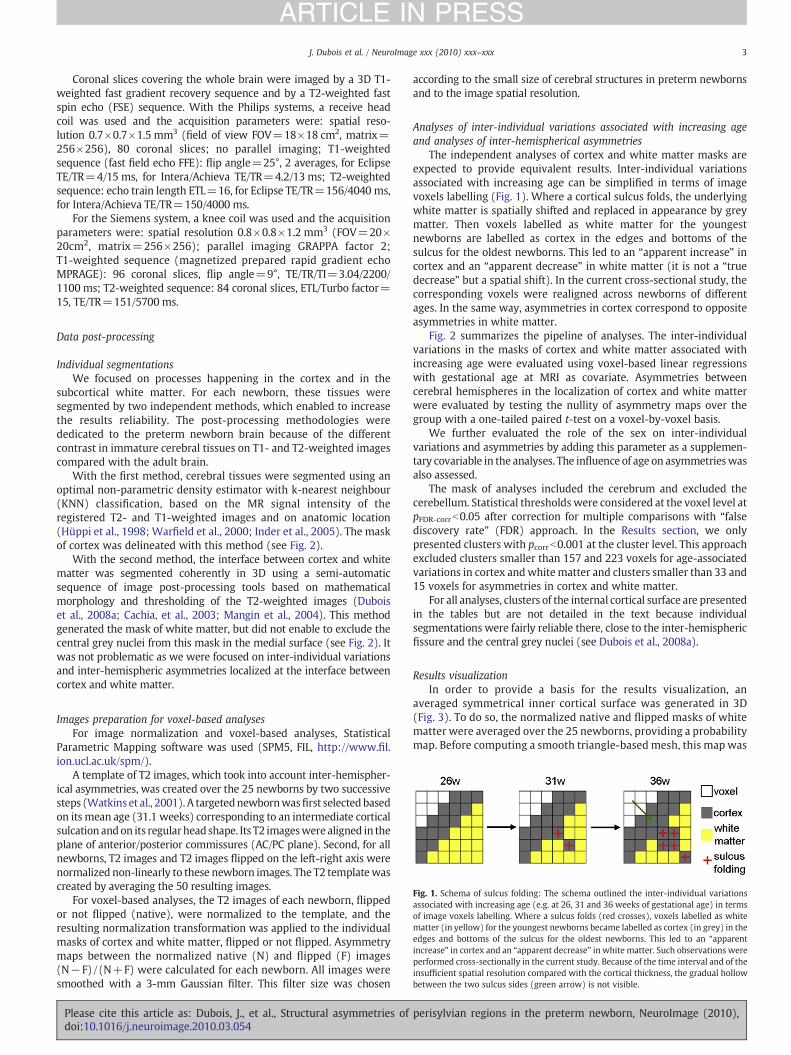
Fig. 1. Schema of sulcus folding: The schema outlined the inter-individual variationsassociated with increasing age (e.g. at 26, 31 and 36 weeks of gestational age) in termsof image voxels labelling. Where a sulcus folds (red crosses), voxels labelled as whitematter (in yellow) for the youngest newborns became labelled as cortex (in grey) in theedges and bottoms of the sulcus for the oldest newborns. This led to an “apparentincrease” in cortex and an “apparent decrease” in white matter. Such observations wereperformed cross-sectionally in the current study. Because of the time interval and of theinsufficient spatial resolution compared with the cortical thickness, the gradual hollowbetween the two sulcus sides (green arrow) is not visible.
3J. Dubois et al. / NeuroImage xxx (2010) xxx–xxx
ARTICLE IN PRESS
Coronal slices covering the whole brain were imaged by a 3D T1-weighted fast gradient recovery sequence and by a T2-weighted fastspin echo (FSE) sequence. With the Philips systems, a receive headcoil was used and the acquisition parameters were: spatial reso-lution 0.7×0.7×1.5 mm3 (field of view FOV=18×18 cm2, matrix=256×256), 80 coronal slices; no parallel imaging; T1-weightedsequence (fast field echo FFE): flip angle=25°, 2 averages, for EclipseTE/TR=4/15 ms, for Intera/Achieva TE/TR=4.2/13 ms; T2-weightedsequence: echo train length ETL=16, for Eclipse TE/TR=156/4040 ms,for Intera/Achieva TE/TR=150/4000 ms.
For the Siemens system, a knee coil was used and the acquisitionparameters were: spatial resolution 0.8×0.8×1.2 mm3 (FOV=20×20cm2, matrix=256×256); parallel imaging GRAPPA factor 2;T1-weighted sequence (magnetized prepared rapid gradient echoMPRAGE): 96 coronal slices, flip angle=9°, TE/TR/TI=3.04/2200/1100 ms; T2-weighted sequence: 84 coronal slices, ETL/Turbo factor=15, TE/TR=151/5700 ms.
Data post-processing
Individual segmentationsWe focused on processes happening in the cortex and in the
subcortical white matter. For each newborn, these tissues weresegmented by two independent methods, which enabled to increasethe results reliability. The post-processing methodologies werededicated to the preterm newborn brain because of the differentcontrast in immature cerebral tissues on T1- and T2-weighted imagescompared with the adult brain.
With the first method, cerebral tissues were segmented using anoptimal non-parametric density estimator with k-nearest neighbour(KNN) classification, based on the MR signal intensity of theregistered T2- and T1-weighted images and on anatomic location(Hüppi et al., 1998; Warfield et al., 2000; Inder et al., 2005). The maskof cortex was delineated with this method (see Fig. 2).
With the second method, the interface between cortex and whitematter was segmented coherently in 3D using a semi-automaticsequence of image post-processing tools based on mathematicalmorphology and thresholding of the T2-weighted images (Duboiset al., 2008a; Cachia, et al., 2003; Mangin et al., 2004). This methodgenerated the mask of white matter, but did not enable to exclude thecentral grey nuclei from this mask in the medial surface (see Fig. 2). Itwas not problematic as we were focused on inter-individual variationsand inter-hemispheric asymmetries localized at the interface betweencortex and white matter.
Images preparation for voxel-based analysesFor image normalization and voxel-based analyses, Statistical
Parametric Mapping software was used (SPM5, FIL, http://www.fil.ion.ucl.ac.uk/spm/).
A template of T2 images, which took into account inter-hemispher-ical asymmetries, was created over the 25 newborns by two successivesteps (Watkins et al., 2001). A targetednewbornwasfirst selected basedon its mean age (31.1 weeks) corresponding to an intermediate corticalsulcation andon its regularhead shape. Its T2 imageswere aligned in theplane of anterior/posterior commissures (AC/PC plane). Second, for allnewborns, T2 images and T2 images flipped on the left-right axis werenormalized non-linearly to these newborn images. The T2 templatewascreated by averaging the 50 resulting images.
For voxel-based analyses, the T2 images of each newborn, flippedor not flipped (native), were normalized to the template, and theresulting normalization transformation was applied to the individualmasks of cortex and white matter, flipped or not flipped. Asymmetrymaps between the normalized native (N) and flipped (F) images(N−F) / (N+F) were calculated for each newborn. All images weresmoothed with a 3-mm Gaussian filter. This filter size was chosen
Please cite this article as: Dubois, J., et al., Structural asymmetries ofdoi:10.1016/j.neuroimage.2010.03.054
according to the small size of cerebral structures in preterm newbornsand to the image spatial resolution.
Analyses of inter-individual variations associated with increasing ageand analyses of inter-hemispherical asymmetries
The independent analyses of cortex and white matter masks areexpected to provide equivalent results. Inter-individual variationsassociated with increasing age can be simplified in terms of imagevoxels labelling (Fig. 1). Where a cortical sulcus folds, the underlyingwhite matter is spatially shifted and replaced in appearance by greymatter. Then voxels labelled as white matter for the youngestnewborns are labelled as cortex in the edges and bottoms of thesulcus for the oldest newborns. This led to an “apparent increase” incortex and an “apparent decrease” in white matter (it is not a “truedecrease” but a spatial shift). In the current cross-sectional study, thecorresponding voxels were realigned across newborns of differentages. In the same way, asymmetries in cortex correspond to oppositeasymmetries in white matter.
Fig. 2 summarizes the pipeline of analyses. The inter-individualvariations in the masks of cortex and white matter associated withincreasing age were evaluated using voxel-based linear regressionswith gestational age at MRI as covariate. Asymmetries betweencerebral hemispheres in the localization of cortex and white matterwere evaluated by testing the nullity of asymmetry maps over thegroup with a one-tailed paired t-test on a voxel-by-voxel basis.
We further evaluated the role of the sex on inter-individualvariations and asymmetries by adding this parameter as a supplemen-tary covariable in the analyses. The influence of age on asymmetrieswasalso assessed.
The mask of analyses included the cerebrum and excluded thecerebellum. Statistical thresholds were considered at the voxel level atpFDR-corrb0.05 after correction for multiple comparisons with “falsediscovery rate” (FDR) approach. In the Results section, we onlypresented clusters with pcorrb0.001 at the cluster level. This approachexcluded clusters smaller than 157 and 223 voxels for age-associatedvariations in cortex andwhitematter and clusters smaller than 33 and15 voxels for asymmetries in cortex and white matter.
For all analyses, clusters of the internal cortical surface are presentedin the tables but are not detailed in the text because individualsegmentations were fairly reliable there, close to the inter-hemisphericfissure and the central grey nuclei (see Dubois et al., 2008a).
Results visualizationIn order to provide a basis for the results visualization, an
averaged symmetrical inner cortical surface was generated in 3D(Fig. 3). To do so, the normalized native and flipped masks of whitematter were averaged over the 25 newborns, providing a probabilitymap. Before computing a smooth triangle-based mesh, this map was
perisylvian regions in the preterm newborn, NeuroImage (2010),
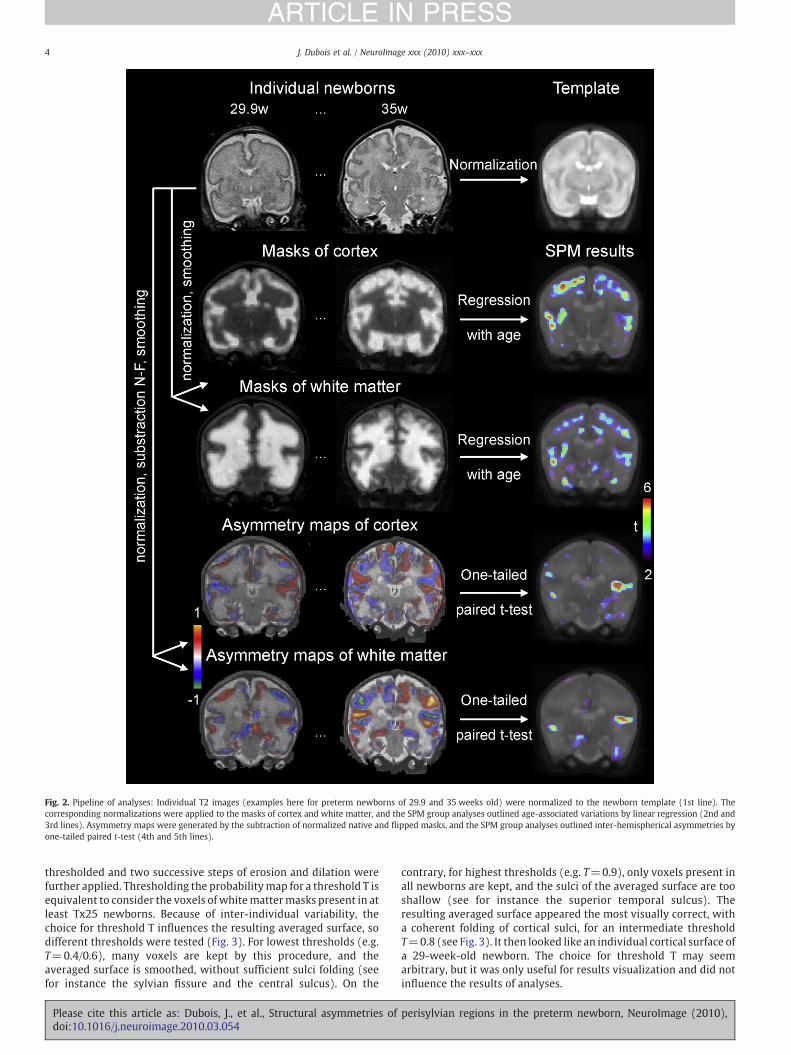
Fig. 2. Pipeline of analyses: Individual T2 images (examples here for preterm newborns of 29.9 and 35 weeks old) were normalized to the newborn template (1st line). Thecorresponding normalizations were applied to the masks of cortex and white matter, and the SPM group analyses outlined age-associated variations by linear regression (2nd and3rd lines). Asymmetry maps were generated by the subtraction of normalized native and flipped masks, and the SPM group analyses outlined inter-hemispherical asymmetries byone-tailed paired t-test (4th and 5th lines).
4 J. Dubois et al. / NeuroImage xxx (2010) xxx–xxx
ARTICLE IN PRESS
thresholded and two successive steps of erosion and dilation werefurther applied. Thresholding the probabilitymap for a threshold T isequivalent to consider the voxels of whitemattermasks present in atleast Tx25 newborns. Because of inter-individual variability, thechoice for threshold T influences the resulting averaged surface, sodifferent thresholds were tested (Fig. 3). For lowest thresholds (e.g.T=0.4/0.6), many voxels are kept by this procedure, and theaveraged surface is smoothed, without sufficient sulci folding (seefor instance the sylvian fissure and the central sulcus). On the
Please cite this article as: Dubois, J., et al., Structural asymmetries ofdoi:10.1016/j.neuroimage.2010.03.054
contrary, for highest thresholds (e.g. T=0.9), only voxels present inall newborns are kept, and the sulci of the averaged surface are tooshallow (see for instance the superior temporal sulcus). Theresulting averaged surface appeared the most visually correct, witha coherent folding of cortical sulci, for an intermediate thresholdT=0.8 (see Fig. 3). It then looked like an individual cortical surface ofa 29-week-old newborn. The choice for threshold T may seemarbitrary, but it was only useful for results visualization and did notinfluence the results of analyses.
perisylvian regions in the preterm newborn, NeuroImage (2010),

Fig. 3. Creation of the 3D averaged inner cortical surface: Individual T2 images (examples here for preterm newborns of 26.6, 30.7 and 35.7 weeks old) were normalized to thenewborn template (1st line). The corresponding normalizations were applied to the masks of white matter, and the resulting native and flipped masks were averaged to create theprobability map of white matter (2nd line). This map was thresholded, eroded and dilated to provide a mask for the 3D averaged inner cortical surface (3rd and 4th lines). Differentthresholds were tested (5th line). For small thresholds (T=0.4/0.6), the averaged surface is smoothed, without enough sulci folding (arrows at the level of the sylvian fissure andcentral sulcus). For high threshold (T=0.9), the sulci of the averaged surface are too shallow (arrow at the level of the superior temporal sulcus). An intermediate threshold (T=0.8)seemed a good compromise to provide a visually correct averaged surface, with a coherent folding of cortical sulci. This surface looked like an individual cortical surface of a 29-week-old newborn.
5J. Dubois et al. / NeuroImage xxx (2010) xxx–xxx
ARTICLE IN PRESS
Statistical results from the voxel-based analyses were projected onthis averaged inner cortical surface by considering the mean t-valuesover a sphere of 1 mm radius around each point of the surface mesh.This radius was chosen according to the image spatial resolution.Such a projection was more robust than a simple “point-to-point”projection.
For visualization purposes, the results clusters were also projectedon the individual cortical surfaces of the four oldest newborns (GA:34.4–35.7 weeks old), who presented the greatest and most sophis-ticated patterns of sulcation. These projections enabled the qualitativecomparison of the localization of individual cortical sulci, when
Please cite this article as: Dubois, J., et al., Structural asymmetries ofdoi:10.1016/j.neuroimage.2010.03.054
present, and the clusters showing inter-individual variations or inter-hemispherical asymmetries. To do so, only the linear part of thenormalization transformation was applied to the cortical surface ofeach newborn in order to keep the surface spherical topology (Duboiset al., 2008a).
Results
As previously detailed (Dubois et al., 2008a), the post-processingof high quality T1- and T2-weighted images, free from motionartifacts, enabled the segmentations of cortex and white matter in
perisylvian regions in the preterm newborn, NeuroImage (2010),
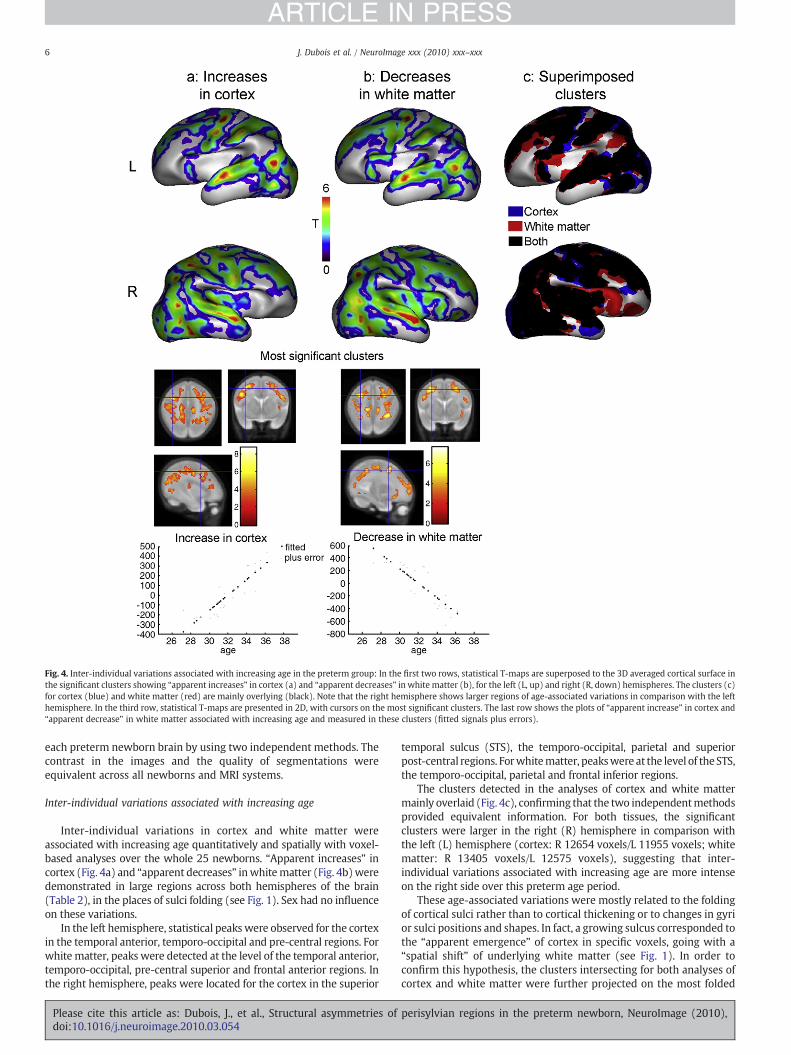
Fig. 4. Inter-individual variations associated with increasing age in the preterm group: In the first two rows, statistical T-maps are superposed to the 3D averaged cortical surface inthe significant clusters showing “apparent increases” in cortex (a) and “apparent decreases” in white matter (b), for the left (L, up) and right (R, down) hemispheres. The clusters (c)for cortex (blue) and white matter (red) are mainly overlying (black). Note that the right hemisphere shows larger regions of age-associated variations in comparison with the lefthemisphere. In the third row, statistical T-maps are presented in 2D, with cursors on the most significant clusters. The last row shows the plots of “apparent increase” in cortex and“apparent decrease” in white matter associated with increasing age and measured in these clusters (fitted signals plus errors).
6 J. Dubois et al. / NeuroImage xxx (2010) xxx–xxx
ARTICLE IN PRESS
each preterm newborn brain by using two independent methods. Thecontrast in the images and the quality of segmentations wereequivalent across all newborns and MRI systems.
Inter-individual variations associated with increasing age
Inter-individual variations in cortex and white matter wereassociated with increasing age quantitatively and spatially with voxel-based analyses over the whole 25 newborns. “Apparent increases” incortex (Fig. 4a) and “apparent decreases” inwhitematter (Fig. 4b)weredemonstrated in large regions across both hemispheres of the brain(Table 2), in the places of sulci folding (see Fig. 1). Sex had no influenceon these variations.
In the left hemisphere, statistical peaks were observed for the cortexin the temporal anterior, temporo-occipital and pre-central regions. Forwhite matter, peaks were detected at the level of the temporal anterior,temporo-occipital, pre-central superior and frontal anterior regions. Inthe right hemisphere, peaks were located for the cortex in the superior
Please cite this article as: Dubois, J., et al., Structural asymmetries ofdoi:10.1016/j.neuroimage.2010.03.054
temporal sulcus (STS), the temporo-occipital, parietal and superiorpost-central regions. Forwhitematter, peakswere at the level of theSTS,the temporo-occipital, parietal and frontal inferior regions.
The clusters detected in the analyses of cortex and white mattermainly overlaid (Fig. 4c), confirming that the two independentmethodsprovided equivalent information. For both tissues, the significantclusters were larger in the right (R) hemisphere in comparison withthe left (L) hemisphere (cortex: R 12654 voxels/L 11955 voxels; whitematter: R 13405 voxels/L 12575 voxels), suggesting that inter-individual variations associated with increasing age are more intenseon the right side over this preterm age period.
These age-associated variations were mostly related to the foldingof cortical sulci rather than to cortical thickening or to changes in gyrior sulci positions and shapes. In fact, a growing sulcus corresponded tothe “apparent emergence” of cortex in specific voxels, going with a“spatial shift” of underlying white matter (see Fig. 1). In order toconfirm this hypothesis, the clusters intersecting for both analyses ofcortex and white matter were further projected on the most folded
perisylvian regions in the preterm newborn, NeuroImage (2010),
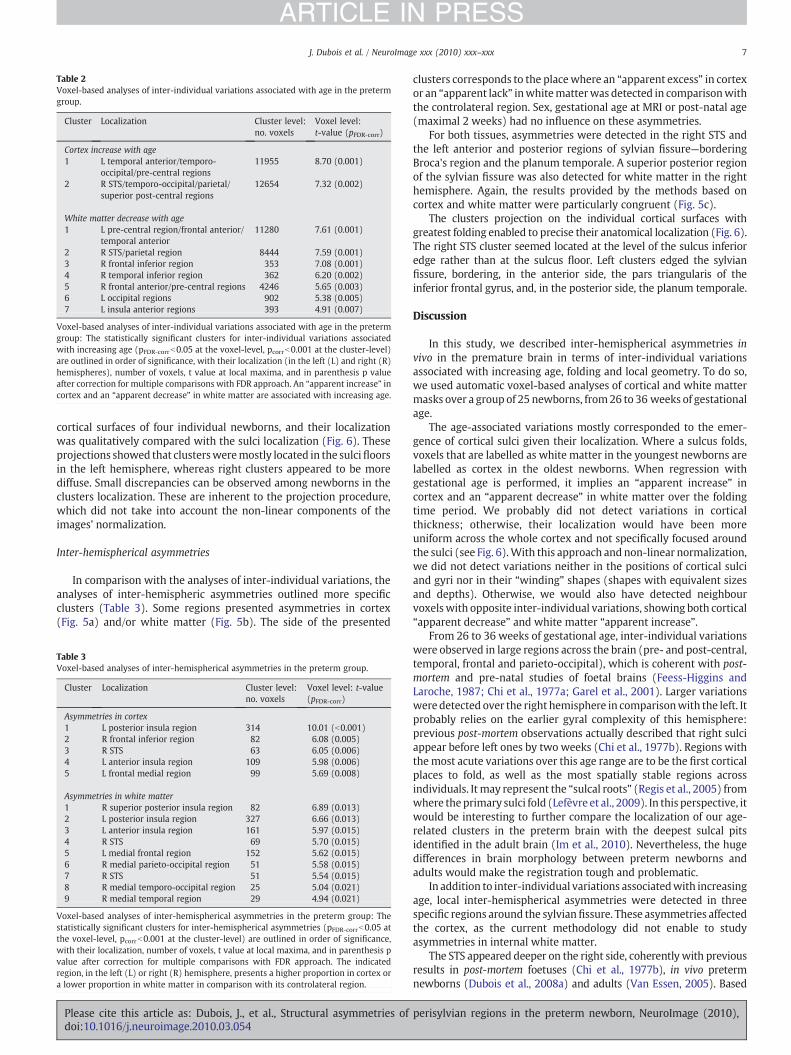
Table 2Voxel-based analyses of inter-individual variations associated with age in the pretermgroup.
Cluster Localization Cluster level:no. voxels
Voxel level:t-value (pFDR-corr)
Cortex increase with age1 L temporal anterior/temporo-
occipital/pre-central regions11955 8.70 (0.001)
2 R STS/temporo-occipital/parietal/superior post-central regions
12654 7.32 (0.002)
White matter decrease with age1 L pre-central region/frontal anterior/
temporal anterior11280 7.61 (0.001)
2 R STS/parietal region 8444 7.59 (0.001)3 R frontal inferior region 353 7.08 (0.001)4 R temporal inferior region 362 6.20 (0.002)5 R frontal anterior/pre-central regions 4246 5.65 (0.003)6 L occipital regions 902 5.38 (0.005)7 L insula anterior regions 393 4.91 (0.007)
Voxel-based analyses of inter-individual variations associated with age in the pretermgroup: The statistically significant clusters for inter-individual variations associatedwith increasing age (pFDR-corrb0.05 at the voxel-level, pcorrb0.001 at the cluster-level)are outlined in order of significance, with their localization (in the left (L) and right (R)hemispheres), number of voxels, t value at local maxima, and in parenthesis p valueafter correction for multiple comparisons with FDR approach. An “apparent increase” incortex and an “apparent decrease” in white matter are associated with increasing age.
7J. Dubois et al. / NeuroImage xxx (2010) xxx–xxx
ARTICLE IN PRESS
cortical surfaces of four individual newborns, and their localizationwas qualitatively compared with the sulci localization (Fig. 6). Theseprojections showed that clustersweremostly located in the sulcifloorsin the left hemisphere, whereas right clusters appeared to be morediffuse. Small discrepancies can be observed among newborns in theclusters localization. These are inherent to the projection procedure,which did not take into account the non-linear components of theimages' normalization.
Inter-hemispherical asymmetries
In comparison with the analyses of inter-individual variations, theanalyses of inter-hemispheric asymmetries outlined more specificclusters (Table 3). Some regions presented asymmetries in cortex(Fig. 5a) and/or white matter (Fig. 5b). The side of the presented
Table 3Voxel-based analyses of inter-hemispherical asymmetries in the preterm group.
Cluster Localization Cluster level:no. voxels
Voxel level: t-value(pFDR-corr)
Asymmetries in cortex1 L posterior insula region 314 10.01 (b0.001)2 R frontal inferior region 82 6.08 (0.005)3 R STS 63 6.05 (0.006)4 L anterior insula region 109 5.98 (0.006)5 L frontal medial region 99 5.69 (0.008)
Asymmetries in white matter1 R superior posterior insula region 82 6.89 (0.013)2 L posterior insula region 327 6.66 (0.013)3 L anterior insula region 161 5.97 (0.015)4 R STS 69 5.70 (0.015)5 L medial frontal region 152 5.62 (0.015)6 R medial parieto-occipital region 51 5.58 (0.015)7 R STS 51 5.54 (0.015)8 R medial temporo-occipital region 25 5.04 (0.021)9 R medial temporal region 29 4.94 (0.021)
Voxel-based analyses of inter-hemispherical asymmetries in the preterm group: Thestatistically significant clusters for inter-hemispherical asymmetries (pFDR-corrb0.05 atthe voxel-level, pcorrb0.001 at the cluster-level) are outlined in order of significance,with their localization, number of voxels, t value at local maxima, and in parenthesis pvalue after correction for multiple comparisons with FDR approach. The indicatedregion, in the left (L) or right (R) hemisphere, presents a higher proportion in cortex ora lower proportion in white matter in comparison with its controlateral region.
Please cite this article as: Dubois, J., et al., Structural asymmetries ofdoi:10.1016/j.neuroimage.2010.03.054
clusters corresponds to the placewhere an “apparent excess” in cortexor an “apparent lack” inwhitematterwas detected in comparisonwiththe controlateral region. Sex, gestational age at MRI or post-natal age(maximal 2 weeks) had no influence on these asymmetries.
For both tissues, asymmetries were detected in the right STS andthe left anterior and posterior regions of sylvian fissure—borderingBroca's region and the planum temporale. A superior posterior regionof the sylvian fissure was also detected for white matter in the righthemisphere. Again, the results provided by the methods based oncortex and white matter were particularly congruent (Fig. 5c).
The clusters projection on the individual cortical surfaces withgreatest folding enabled to precise their anatomical localization (Fig. 6).The right STS cluster seemed located at the level of the sulcus inferioredge rather than at the sulcus floor. Left clusters edged the sylvianfissure, bordering, in the anterior side, the pars triangularis of theinferior frontal gyrus, and, in the posterior side, the planum temporale.
Discussion
In this study, we described inter-hemispherical asymmetries invivo in the premature brain in terms of inter-individual variationsassociated with increasing age, folding and local geometry. To do so,we used automatic voxel-based analyses of cortical and white mattermasks over a group of 25 newborns, from26 to 36 weeks of gestationalage.
The age-associated variations mostly corresponded to the emer-gence of cortical sulci given their localization. Where a sulcus folds,voxels that are labelled as white matter in the youngest newborns arelabelled as cortex in the oldest newborns. When regression withgestational age is performed, it implies an “apparent increase” incortex and an “apparent decrease” in white matter over the foldingtime period. We probably did not detect variations in corticalthickness; otherwise, their localization would have been moreuniform across the whole cortex and not specifically focused aroundthe sulci (see Fig. 6).With this approach and non-linear normalization,we did not detect variations neither in the positions of cortical sulciand gyri nor in their “winding” shapes (shapes with equivalent sizesand depths). Otherwise, we would also have detected neighbourvoxelswith opposite inter-individual variations, showing both cortical“apparent decrease” and white matter “apparent increase”.
From 26 to 36 weeks of gestational age, inter-individual variationswere observed in large regions across the brain (pre- and post-central,temporal, frontal and parieto-occipital), which is coherent with post-mortem and pre-natal studies of foetal brains (Feess-Higgins andLaroche, 1987; Chi et al., 1977a; Garel et al., 2001). Larger variationswere detected over the right hemisphere in comparisonwith the left. Itprobably relies on the earlier gyral complexity of this hemisphere:previous post-mortem observations actually described that right sulciappear before left ones by two weeks (Chi et al., 1977b). Regions withthemost acute variations over this age range are to be the first corticalplaces to fold, as well as the most spatially stable regions acrossindividuals. It may represent the “sulcal roots” (Regis et al., 2005) fromwhere the primary sulci fold (Lefèvre et al., 2009). In this perspective, itwould be interesting to further compare the localization of our age-related clusters in the preterm brain with the deepest sulcal pitsidentified in the adult brain (Im et al., 2010). Nevertheless, the hugedifferences in brain morphology between preterm newborns andadults would make the registration tough and problematic.
In addition to inter-individual variations associatedwith increasingage, local inter-hemispherical asymmetries were detected in threespecific regions around the sylvianfissure. These asymmetries affectedthe cortex, as the current methodology did not enable to studyasymmetries in internal white matter.
The STS appeared deeper on the right side, coherently with previousresults in post-mortem foetuses (Chi et al., 1977b), in vivo pretermnewborns (Dubois et al., 2008a) and adults (Van Essen, 2005). Based
perisylvian regions in the preterm newborn, NeuroImage (2010),
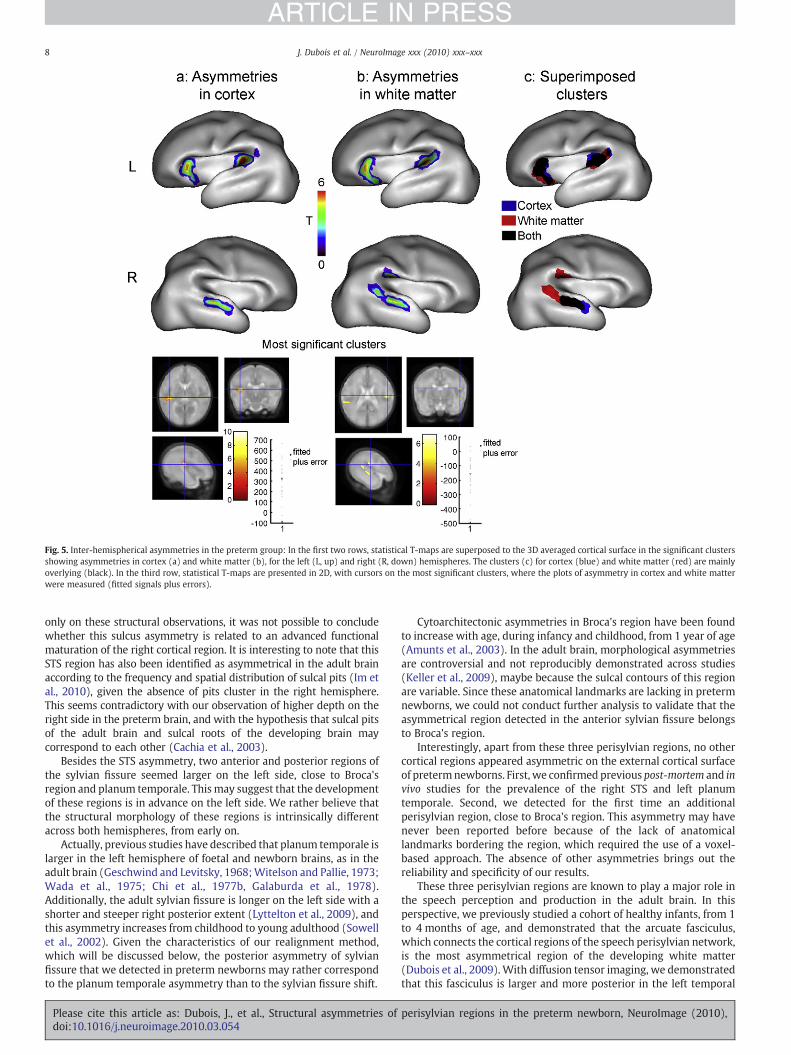
Fig. 5. Inter-hemispherical asymmetries in the preterm group: In the first two rows, statistical T-maps are superposed to the 3D averaged cortical surface in the significant clustersshowing asymmetries in cortex (a) and white matter (b), for the left (L, up) and right (R, down) hemispheres. The clusters (c) for cortex (blue) and white matter (red) are mainlyoverlying (black). In the third row, statistical T-maps are presented in 2D, with cursors on the most significant clusters, where the plots of asymmetry in cortex and white matterwere measured (fitted signals plus errors).
8 J. Dubois et al. / NeuroImage xxx (2010) xxx–xxx
ARTICLE IN PRESS
only on these structural observations, it was not possible to concludewhether this sulcus asymmetry is related to an advanced functionalmaturation of the right cortical region. It is interesting to note that thisSTS region has also been identified as asymmetrical in the adult brainaccording to the frequency and spatial distribution of sulcal pits (Im etal., 2010), given the absence of pits cluster in the right hemisphere.This seems contradictory with our observation of higher depth on theright side in the preterm brain, and with the hypothesis that sulcal pitsof the adult brain and sulcal roots of the developing brain maycorrespond to each other (Cachia et al., 2003).
Besides the STS asymmetry, two anterior and posterior regions ofthe sylvian fissure seemed larger on the left side, close to Broca'sregion and planum temporale. Thismay suggest that the developmentof these regions is in advance on the left side. We rather believe thatthe structural morphology of these regions is intrinsically differentacross both hemispheres, from early on.
Actually, previous studies have described that planum temporale islarger in the left hemisphere of foetal and newborn brains, as in theadult brain (Geschwind and Levitsky, 1968;Witelson and Pallie, 1973;Wada et al., 1975; Chi et al., 1977b, Galaburda et al., 1978).Additionally, the adult sylvian fissure is longer on the left side with ashorter and steeper right posterior extent (Lyttelton et al., 2009), andthis asymmetry increases from childhood to young adulthood (Sowellet al., 2002). Given the characteristics of our realignment method,which will be discussed below, the posterior asymmetry of sylvianfissure that we detected in preterm newborns may rather correspondto the planum temporale asymmetry than to the sylvian fissure shift.
Please cite this article as: Dubois, J., et al., Structural asymmetries ofdoi:10.1016/j.neuroimage.2010.03.054
Cytoarchitectonic asymmetries in Broca's region have been foundto increase with age, during infancy and childhood, from 1 year of age(Amunts et al., 2003). In the adult brain, morphological asymmetriesare controversial and not reproducibly demonstrated across studies(Keller et al., 2009), maybe because the sulcal contours of this regionare variable. Since these anatomical landmarks are lacking in pretermnewborns, we could not conduct further analysis to validate that theasymmetrical region detected in the anterior sylvian fissure belongsto Broca's region.
Interestingly, apart from these three perisylvian regions, no othercortical regions appeared asymmetric on the external cortical surfaceof pretermnewborns. First, we confirmed previous post-mortem and invivo studies for the prevalence of the right STS and left planumtemporale. Second, we detected for the first time an additionalperisylvian region, close to Broca's region. This asymmetry may havenever been reported before because of the lack of anatomicallandmarks bordering the region, which required the use of a voxel-based approach. The absence of other asymmetries brings out thereliability and specificity of our results.
These three perisylvian regions are known to play a major role inthe speech perception and production in the adult brain. In thisperspective, we previously studied a cohort of healthy infants, from 1to 4 months of age, and demonstrated that the arcuate fasciculus,which connects the cortical regions of the speech perisylvian network,is the most asymmetrical region of the developing white matter(Dubois et al., 2009). With diffusion tensor imaging, we demonstratedthat this fasciculus is larger and more posterior in the left temporal
perisylvian regions in the preterm newborn, NeuroImage (2010),
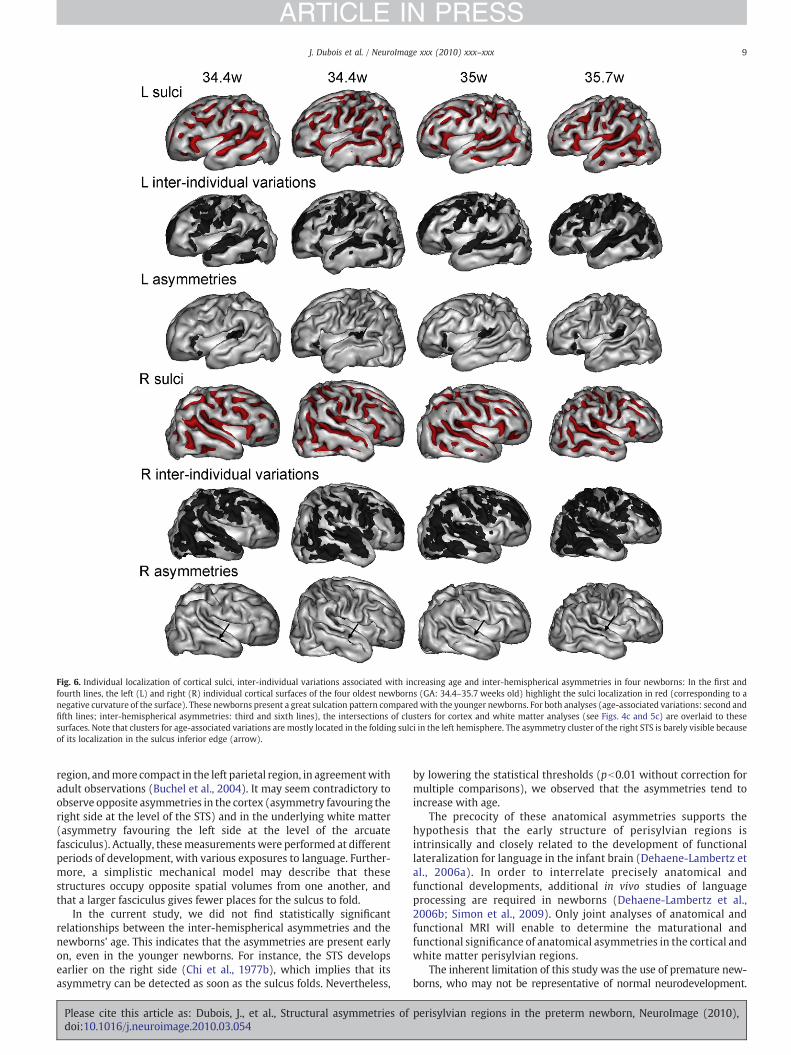
Fig. 6. Individual localization of cortical sulci, inter-individual variations associated with increasing age and inter-hemispherical asymmetries in four newborns: In the first andfourth lines, the left (L) and right (R) individual cortical surfaces of the four oldest newborns (GA: 34.4–35.7 weeks old) highlight the sulci localization in red (corresponding to anegative curvature of the surface). These newborns present a great sulcation pattern compared with the younger newborns. For both analyses (age-associated variations: second andfifth lines; inter-hemispherical asymmetries: third and sixth lines), the intersections of clusters for cortex and white matter analyses (see Figs. 4c and 5c) are overlaid to thesesurfaces. Note that clusters for age-associated variations are mostly located in the folding sulci in the left hemisphere. The asymmetry cluster of the right STS is barely visible becauseof its localization in the sulcus inferior edge (arrow).
9J. Dubois et al. / NeuroImage xxx (2010) xxx–xxx
ARTICLE IN PRESS
region, andmore compact in the left parietal region, in agreementwithadult observations (Buchel et al., 2004). It may seem contradictory toobserve opposite asymmetries in the cortex (asymmetry favouring theright side at the level of the STS) and in the underlying white matter(asymmetry favouring the left side at the level of the arcuatefasciculus). Actually, thesemeasurementswere performed at differentperiods of development, with various exposures to language. Further-more, a simplistic mechanical model may describe that thesestructures occupy opposite spatial volumes from one another, andthat a larger fasciculus gives fewer places for the sulcus to fold.
In the current study, we did not find statistically significantrelationships between the inter-hemispherical asymmetries and thenewborns' age. This indicates that the asymmetries are present earlyon, even in the younger newborns. For instance, the STS developsearlier on the right side (Chi et al., 1977b), which implies that itsasymmetry can be detected as soon as the sulcus folds. Nevertheless,
Please cite this article as: Dubois, J., et al., Structural asymmetries ofdoi:10.1016/j.neuroimage.2010.03.054
by lowering the statistical thresholds (pb0.01 without correction formultiple comparisons), we observed that the asymmetries tend toincrease with age.
The precocity of these anatomical asymmetries supports thehypothesis that the early structure of perisylvian regions isintrinsically and closely related to the development of functionallateralization for language in the infant brain (Dehaene-Lambertz etal., 2006a). In order to interrelate precisely anatomical andfunctional developments, additional in vivo studies of languageprocessing are required in newborns (Dehaene-Lambertz et al.,2006b; Simon et al., 2009). Only joint analyses of anatomical andfunctional MRI will enable to determine the maturational andfunctional significance of anatomical asymmetries in the cortical andwhite matter perisylvian regions.
The inherent limitation of this study was the use of premature new-borns, who may not be representative of normal neurodevelopment.
perisylvian regions in the preterm newborn, NeuroImage (2010),
10 J. Dubois et al. / NeuroImage xxx (2010) xxx–xxx
ARTICLE IN PRESS
Because of the pregnancy events which triggered the premature birthand the early exposure to extra-uterine stimulations, these individualsborn before term may differ in brain structure and developmentaltrajectories in comparison with normal foetuses, even if no gross MRIlesions were detected. In this perspective, extremely preterm infantsshow a decreased volume and a less complex surface of cortex at term-equivalent age (Ajayi-Obe et al., 2000; Inder et al., 2005; Kapellou et al.,2006). However, we here studied the pretermnewborns only a fewdaysafter birth, and the secondary influence of extra-uterine developmentmay be reduced. For practical reasons related to motion and acquisitiontime, studying normal foetuses with such high-resolution MRI is hardlyfeasible in utero. Nevertheless, this study might be considered thanks tonew ultra-rapid acquisition schemes, movement corrections anddedicated post-processing tools (Rousseau et al., 2006; Jiang et al.,2007; Rutherford et al., 2008).
An additional limitation of this study is the cross-sectionality of thepreterm data. For obvious ethical reasons, it was not possible toacquire longitudinal MRI data in the same newborns. Only twoexaminations were performed, soon after birth and at term-equivalent age in order to check the normality in brain development.
Given the difficulty to bring together a cohort of pretermnewborns, this study lasted over 4.9 years. Therefore, it was notpossible to guarantee the use of a single MRI system in our UniversityHospital, and imaging parameters slightly differed across newborns.Nevertheless, the spatial resolution was almost the same, thecontrasts of T1- and T2-weighted images were equivalent and thequality of segmentations was high for all subjects. Using imagesobtained with different hardware did not impact the results of inter-hemispherical differences, as within-subject analyses were per-formed. On the contrary, it might affect the results of age-associatedvariations observed across subjects, if there was any consistentrelationship between the systems used and the babies' age. Fortu-nately, this was not the case in the present study: newborns from allgestational ages were regularly included across years, and conse-quently there was an overlap between the Philips and Siemenssystems across ages (see Table 1). This supported the assumption thatour previous results were not biased by the use of images acquiredfrom different MRI systems (Dubois et al., 2008a,b).
In this report, the investigations of inter-individual variationsassociated with age and inter-hemispherical asymmetries wereconducted locally but over thewhole brain, with an automaticmethodwhich did not require the anatomical delineation of structures. Itenabled to map regions for which localization is hard to map. To ourknowledge, it is the first time that this approach is used to quantifyinter-individual and inter-hemispherical differences over this range ofages. In a recent study (Dubois et al., 2008a), we were able to evaluatesulci development by mapping them individually across pretermnewborns, but it required a precise identification and labelling a prioribefore analysis. On the contrary, group analysis on a voxel-by-voxelbasis here provided the possibility to “blindly” compare corticaldevelopment across newbornswithout focusing on a particular regionor sulcus. Thismethodology enabled to detect for the first time in vivo acoherent inter-hemispherical asymmetry, close to Broca's region.
This approach required the implementation of a specific symmet-rical MRI T2 template. The methodology was inspired from the initialstudy of Watkins et al. (2001), who detailed inter-hemisphericalasymmetries in the adult brain. A 3D averaged reconstruction ofcortical surface was further computed for results visualization.
Realigning together all preterm newborn brains was the firstmethodological issue that we encountered with the voxel-basedapproach. First, for the template implementation,we selected a targetednewborn of regular head shape and mean age corresponding to anintermediate cortical sulcation. A non-linear registration of individualT2 images to the template was used in order to deal with the differinghead shapes and cortical sulcations with age. An affine registration wasalso tested, providing very similar results for voxel-based analyses of
Please cite this article as: Dubois, J., et al., Structural asymmetries ofdoi:10.1016/j.neuroimage.2010.03.054
inter-individual variations and inter-hemispherical asymmetries(results not shown). Given the structural variability over the newborns,related to the presence or absence of secondary and tertiary sulci, onemay be sceptical on the appropriateness of this approach to realigndeveloping brains. However, one should remind that the sulcation of a36-week pretermnewborn is still farmore simplified than the sulcationof a term (40 w) infant. Then realigning globally the brains wassufficient to roughly realign the sulci. Furthermore, in the youngestnewborns (26 weeks of gestational age), only a few sulci were present(sylvian fissure and central sulcus on the external surface), whichprecluded the application of a surface registration based on sulcirealignment (Van Essen, 2005) to our newborns group. In the future,the detection of more specific changes will require to group thenewborns according to their gestational age. Unfortunately, in thepresent study, the small size of our cohort did not enable us toperform further statistical analyses in that case.
Our T2 template integrated macroscopic left-right asymmetriessince it was the average of native and flipped normalized individualimages. Such a template was necessary to detect local coherentasymmetries, and not global asymmetries related for instance tofrontal and occipital petalias (Dubois et al., 2009).
Besides, to characterize cortical development, we analysed both themasks of cortex andwhitematter, after segmenting these tissues by twoindependentmethods.We focused on the external surface of the cortex,because individual segmentations were fairly reliable at the level of theinternal cortical surface, close to the inter-hemispheric fissure and thecentral grey nuclei (Dubois et al., 2008a). Detecting similar inter-individual variations and inter-hemispherical asymmetries for bothcortex and white matter supported the reliability of our results.
For the calculation of asymmetry maps, we computed the ratio(N−F) / (N+F), and not only the difference (N−F), in order to becoherent with previous studies of asymmetries (Dubois et al., 2008a,2009). In these studies, the normalization by the sum N+F wasrequired in order to take into account the inter-individual variabilityin cortical surface or diffusion anisotropy related to the different agesof newborns or infants. Here, the normalization by the sum N+F didnot change the value of the asymmetry because the consideredmasksonly took two binary values (0 or 1).
In the future, this global approach with voxel-based analyses willbe applied for group comparisons between preterm newbornsexperimenting different pre-natal environment (Dubois et al.,2008b) or receiving various post-natal treatments (Benders et al.,2009). It may enable the automatic detection of particularities orpathologies in the developing preterm brain according to gestationalage at birth (Ajayi-Obe et al., 2000) or to functional outcome duringchildhood (Thompson et al., 2008). Finally, further correlations will beperformed between anatomical asymmetries of perisylvian regionsand functional activities in preterm and term newborns with variousexposure times to language listening (Simon et al., 2009).
Acknowledgments
This work was supported by the Center for Biomedical Imaging(CIBM) of Geneva and Lausanne, by the Swiss National Foundation(grants nos. 32-56927, 3200B0-102127; PSH), by the LeenardsFoundation (PSH), by the EU grant NEOBRAIN (www.neobrain.eu,grant no 036534; PSH) and by the French National Agency forResearch (grant EPILEPSY_DEV/ANR-05-NEUR-014-01; JD).
References
Ajayi-Obe, M., Saeed, N., Cowan, F.M., Rutherford, M.A., Edwards, A.D., 2000. Reduceddevelopment of cerebral cortex in extremely preterm infants. Lancet 356, 1162–1163.
Amunts, K., Schleicher, A., Ditterich, A., Zilles, K., 2003. Broca's region: cytoarchitectonicasymmetry and developmental changes. J. Comp. Neurol. 465, 72–89.
perisylvian regions in the preterm newborn, NeuroImage (2010),
11J. Dubois et al. / NeuroImage xxx (2010) xxx–xxx
ARTICLE IN PRESS
Benders, M.J., Groenendaal, F., van Bel, F., Ha Vinh, R., Dubois, J., Lazeyras, F., Warfield, S.K.,de Vries, L.S., 2009. Brain development of the preterm neonate after neonatalhydrocortisone treatment for chronic lung disease. Pediatr. Res. 66, 555–559.
Buchel, C., Raedler, T., Sommer, M., Sach, M., Weiller, C., Koch, M.A., 2004. White matterasymmetry in the human brain: a diffusion tensorMRI study. Cereb. Cortex 14, 945–951.
Cachia, A., Mangin, J.F., Riviere, D., Kherif, F., Boddaert, N., Andrade, A., Papadopoulos-Orfanos, D., Poline, J.B., Bloch, I., Zilbovicius,M., Sonigo, P., Brunelle, F., Regis, J., 2003.A primal sketch of the cortex mean curvature: a morphogenesis based approach tostudy the variability of the folding patterns. IEEE Trans. Med. Imaging 22, 754–765.
Chi, J.G., Dooling, E.C., Gilles, F.H., 1977a. Gyral development of the human brain. Ann.Neurol. 1, 86–93.
Chi, J.G., Dooling, E.C., Gilles, F.H., 1977b. Left–right asymmetries of the temporal speechareas of the human fetus. Arch. Neurol. 34, 346–348.
Dehaene-Lambertz, G., Hertz-Pannier, L., Dubois, J., 2006a. Nature and nurture inlanguage acquisition: anatomical and functional brain-imaging studies in infants.Trends Neurosci. 29, 367–373.
Dehaene-Lambertz, G., Hertz-Pannier, L., Dubois, J., Mériaux, S., Roche, A., Sigman, M.,Dehaene, S., 2006b. Functional organization of perisylvian activation during presenta-tion of sentences in preverbal infants. Proc. Natl. Acad. Sci. U. S. A. 103, 14240–14245.
Dubois, J., Benders, M., Cachia, A., Lazeyras, F., Ha-Vinh Leuchter, R., Sizonenko, S.V.,Borradori-Tolsa, C., Mangin, J.F., Hüppi, P.S., 2008a. Mapping the early corticalfolding process in the preterm newborn brain. Cereb. Cortex 18, 1444–1454.
Dubois, J., Benders, M., Borradori-Tolsa, C., Cachia, A., Lazeyras, F., Ha-Vinh Leuchter, R.,Sizonenko, S.V., Warfield, S.K., Mangin, J.F., Hüppi, P.S., 2008b. Primary corticalfolding in the human newborn: an early marker of later functional development.Brain 131, 2028–2041.
Dubois, J., Hertz-Pannier, L., Mangin, J.F., Cachia, A., Le Bihan, D., Dehaene-Lambertz, G.,2009. Structural asymmetries in the infant language and sensori-motor networks.Cereb. Cortex 19, 414–423.
Feess-Higgins, A., Laroche, J.C., 1987. Development of the human foetal brain: ananatomical atlas. Masson, Inserm-CNRS.
Galaburda, A.M., LeMay, M., Kemper, T.L., Geschwind, N., 1978. Right-left asymmetricsin the brain. Science 199, 852–856.
Garel, C., Chantrel, E., Brisse, H., Elmaleh, M., Luton, D., Oury, J.F., Sebag, G., Hassan, M.,2001. Fetal cerebral cortex: normal gestational landmarks identified using prenatalMR imaging. Am. J. Neuroradiol. 22, 184–189.
Geschwind, N., Levitsky, W., 1968. Human brain: left–right asymmetries in temporalspeech region. Science 161, 186–187.
Hüppi, P.S., Schuknecht, B., Boesch, C., Bossi, E., Felblinger, J., Fusch, C., Herschkowitz, N.,1996. Structural and neurobehavioral delay in postnatal brain development ofpreterm infants. Pediatr. Res. 39, 895–901.
Hüppi, P.S., Warfield, S., Kikinis, R., Barnes, P.D., Zientara, G.P., Jolesz, F.A., Tsuji, M.K.,Volpe, J.J., 1998. Quantitative magnetic resonance imaging of brain development inpremature and mature newborns. Ann. Neurol. 43, 224–235.
Im, K., Jo, H.J., Mangin, J.F., Evans, A.C., Kim, S.I., Lee, J.M., 2010. Spatial distribution ofdeep sulcal landmarks and hemispherical asymmetry on the cortical surface. Cereb.Cortex 20, 602–611.
Inder, T.E., Warfield, S.K., Wang, H., Hüppi, P.S., Volpe, J.J., 2005. Abnormal cerebralstructure is present at term in premature infants. Pediatrics 115, 286–294.
Jiang, S., Xue, H., Glover, A., Rutherford, M., Rueckert, D., Hajnal, J.V., 2007. MRI ofmoving subjects using multislice snapshot images with volume reconstruction(SVR): application to fetal, neonatal, and adult brain studies. IEEE Trans. Med.Imaging 26, 967–980.
Kapellou, O., Counsell, S.J., Kennea, N., Dyet, L., Saeed, N., Stark, J., Maalouf, E., Duggan, P.,Ajayi-Obe, M., Hajnal, J., Allsop, J.M., Boardman, J., Rutherford, M.A., Cowan, F.,
Please cite this article as: Dubois, J., et al., Structural asymmetries ofdoi:10.1016/j.neuroimage.2010.03.054
Edwards, A.D., 2006. Anormal cortical development after premature birth shownby altered allometric scaling of brain growth. PLoS Med. 3, e265.
Keller, S.S., Crow, T., Foundas, A., Amunts, K., Roberts, N., 2009. Broca's area:nomenclature, anatomy, typology and asymmetry. Brain Lang. 109, 29–48.
Lefèvre, J., Leroy, F., Khan, S., Dubois, J., Hüppi, P.S., Baillet, S., Mangin, J.F., 2009.Identification of growth seeds in the neonate brain through surfacic Helmholtzdecomposition. Proceedings of the 21st annual meeting of Information Processingin Medical Imaging (IPMI).
Lyttelton, O.C., Karama, S., Ad-Dab'bagh, Y., Zatorre, R.J., Carbonell, F., Worsley, K.,Evans, A.C., 2009. Positional and surface area asymmetry of the human cerebralcortex. Neuroimage 46, 895–903.
Mangin, J.F., Riviere, D., Cachia, A., Duchesnay, E., Cointepas, Y., Papadopoulos-Orfanos,D., Scifo, P., Ochiai, T., Brunelle, F., Regis, J., 2004. A framework to study the corticalfolding patterns. Neuroimage 23, S129–S138.
Ono, M., Kubick, S., Abernathey, C., 1990. Atlas of the cerebral sulci. Georg Thiem Verlag.Regis, J., Mangin, J.F., Ochiai, T., Frouin, V., Riviere, D., Cachia, A., Tamura, M., Samson, Y.,
2005. “Sulcal root” generic model: A hypothesis to overcome the variability of thehuman cortex folding patterns. Neurol. Med. Chir. 45, 1–17.
Rousseau, F., Glenn, O.A., Iordanova, B., Rodriguez-Carranza, C., Vigneron, D.B.,Barkovich, J.A., Studholme, C., 2006. Registration-based approach for reconstruc-tion of high-resolution in utero fetal MR brain images. Acad. Radiol. 13, 1072–1081.
Rutherford, M., Jiang, S., Allsop, J., Perkins, L., Srinivasan, L., Hayat, T., Kumar, S., Hajnal,J., 2008. MR imaging methods for assessing fetal brain development. Dev.Neurobiol. 68, 700–711.
Scifo, P., Cachia, A., Boddaert, N., Sonigo, P., Simon, I., Zilbovicius, M., Lethimonnier, F., LeBihan, D., Brunelle, F., Mangin, J.F., 2003. Antenatal MR imaging for the study offetus brain development. Meeting of Hum. Brain Mapp. 19, S1589.
Simon, S., Lazeyras, F., Sigrist, A.D., Ecoffey, M., Guatieri, S., Van De Ville, D.,Borradori-Tolsa, C., Pelizzone, M., Hüppi, P.S., 2009. Nature vs nurture innewborn voice perception. An fMRI comparison of auditory processing betweenpremature infants at term age and term born neonates. Proceedings of the 17thISMRM meeting, #3443.
Sowell, E.R., Thompson, P.M., Rex, D., Kornsand, D., Tessner, K.D., Jernigan, T.L., Toga,A.W., 2002. Mapping sulcal pattern asymmetry and local cortical surface graymatter distribution in vivo: maturation in perisylvian cortices. Cereb. Cortex 12,17–26.
Thompson, D.K., Wood, S.J., Doyle, L.W., Warfield, S.K., Lodygensky, G.A., Anderson, P.J.,Egan, G.F., Inder, T.E., 2008. Neonate hippocampal volumes: prematurity, perinatalpredictors, and 2-year outcome. Ann. Neurol. 63, 642–651.
Toga, A.W., Thompson, P.M., 2003.Mapping brain asymmetry. Nat. Rev.Neurosci. 4, 37–48.Tolsa, C.B., Zimine, S., Warfield, S.K., Freschi, M., Sancho Rossignol, A., Lazeyras, F.,
Hanquinet, S., Pfizenmaier, M., Huppi, P.S., 2004. Early alteration of structural andfunctional brain development in premature infants born with intrauterine growthrestriction. Pediatr. Res. 56, 132–138.
Van Essen DC, 2005. A population-average, landmark- and surface-based (PALS) atlas ofhuman cerebral cortex. Neuroimage 28, 635–662.
Wada, J.A., Clarke, R., Hamm, A., 1975. Cerebral hemispheric asymmetry in humans.Cortical speech zones in 100 adults and 100 infant brains. Arch. Neurol. 32, 239–246.
Warfield, S.K., Kaus, M., Jolesz, F.A., Kikinis, R., 2000. Adaptive, template moderated,spatially varying statistical classification. Med. Image Anal. 4, 43–55.
Watkins, K.E., Paus, T., Lerch, J.P., Zijdenbos, A., Collins, D.L., Neelin, P., Taylor, J.,Worsley, K.J., Evans, A.C., 2001. Structural asymmetries in the human brain: avoxel-based statistical analysis of 142 MRI scans. Cereb. Cortex 11, 868–877.
Witelson, S.F., Pallie, W., 1973. Left hemisphere specialization for language in thenewborn: neuroanatomical evidence for asymmetry. Brain 96, 641–646.
perisylvian regions in the preterm newborn, NeuroImage (2010),