ARTICLE Heterosis performance in industrial and yield ... · Crop Breeding and Applied...
8
Crop Breeding and Applied Biotechnology 10: 183-190, 2010 183 Crop Breeding and Applied Biotechnology 10: 183-190, 2010 Brazilian Society of Plant Breeding. Printed in Brazil Received 9 January 2009 Accepted 14 November 2009 Heterosis performance in industrial and yield Heterosis performance in industrial and yield Heterosis performance in industrial and yield Heterosis performance in industrial and yield Heterosis performance in industrial and yield components of sweet corn components of sweet corn components of sweet corn components of sweet corn components of sweet corn Aracelle Assunção 1 *, Edward Madureira Brasil 1 , Jaison Pereira de Oliveira 2 , Américo José dos Santos Reis 1 , André Ferreira Pereira 3 , Luíce Gomes Bueno 1 , and Michelle Ribeiro Ramos 4 ABSTRACT - Heterosis and its components were evaluated in a diallel crossing system of sweet corn. In the 38 treatments, eigth parents, 28 hybrids and two controls were used, arranged in a randomized block design with three replications.The diallel analysis followed the methodology of Gardner and Eberhart (1966). The following traits were evaluated: male and female flowering, plant and ear height, ear index (number of ears/number of plants), ºBrix, total ear weight, standard ear weight, industrial yield and total sugar content. There was genetic variability among genotypes, with significant differences except for the traits ear index, industrial yield and ºBrix.Heterosis was found for most traits. The mean heterosis of hybrids compared with the parents was positive for most traits. There was a contribution of additive and dominance effects.The contribution of dominant genes was greatest to flowering, plant and ear height and standard ear weight. Key words: sweet corn, industrial yield, combining ability, heterosis. INTRODUCTION Sweet corn differs from field corn because it contains genes that modify the flavor, tenderness, texture, seed viability, and appearance of plants and ears (Tracy 1994). The world’s area used for corn comprises 900 hectares, and in Brazil, 36 thousand hectares (Barbieri et al. 2005). About 66% of the production is in Goiás where yields reach 14 t ha -1 and the industrial yield is 33%, which may however vary according to the level of technology, seasons and requirements of each industry. The sweet corn produced in Brazil is destined for industrial processing (Barbieri et al. 2005). The short supply of varieties on the market and lack of knowledge among consumers have resulted in a low demand for sweet corn. This crop can potentially increase, since sweet corn is traditionally produced and consumed corn in Brazil, which can facilitate the introduction of other forms of sweet corn consumption. Due to the growing demand for sweet corn and the requirements of producers, industry and consumers, studies for more information about this crop are needed to select and identify genes that confer relevant agronomic and industrial traits for genetic breeding programs and the consumer market. A technique that helps choose the best parents based on their performance, for selection of promising hybrids, is the diallel mating system (Ramalho et al. 1993). Diallel crosses provide information on the type of predominant gene action, assess the heterotic potential and general and specific combining ability of genotypes ARTICLE ARTICLE ARTICLE ARTICLE ARTICLE 1 Universidade Federal de Goiás, Escola de Agronomia e Engenharia de Alimentos, 74.001-970, Goiânia, GO, Brazil. *E-mail: [email protected]. 2 Embrapa Arroz e Feijão, 75.375-000, Santo Antônio de Goiás, GO, Brazil. 3 Instituto Federal de Educação Ciência e Tecnologia de Brasília, Campus Planaltina, 73.380-900, Brasília, DF, Brazil. 4 Universidade Federal do Paraná, Campus III, Jardim Botânico, 80.210-170, Curitiba, PR, Brazil.
Transcript of ARTICLE Heterosis performance in industrial and yield ... · Crop Breeding and Applied...
Crop Breeding and Applied Biotechnology 10: 183-190, 2010 183
Heterosis performance in industrial and yield components of sweet corn
Crop Breeding and Applied Biotechnology 10: 183-190, 2010
Brazilian Society of Plant Breeding. Printed in Brazil
Received 9 January 2009
Accepted 14 November 2009
Heterosis performance in industrial and yieldHeterosis performance in industrial and yieldHeterosis performance in industrial and yieldHeterosis performance in industrial and yieldHeterosis performance in industrial and yieldcomponents of sweet corncomponents of sweet corncomponents of sweet corncomponents of sweet corncomponents of sweet corn
Aracelle Assunção1*, Edward Madureira Brasil1, Jaison Pereira de Oliveira2, Américo José dos Santos Reis1, André Ferreira Pereira 3,Luíce Gomes Bueno1, and Michelle Ribeiro Ramos4
ABSTRACT - Heterosis and its components were evaluated in a diallel crossing system of sweet corn. In the 38 treatments, eigthparents, 28 hybrids and two controls were used, arranged in a randomized block design with three replications.The diallel analysisfollowed the methodology of Gardner and Eberhart (1966). The following traits were evaluated: male and female flowering, plantand ear height, ear index (number of ears/number of plants), ºBrix, total ear weight, standard ear weight, industrial yield and totalsugar content. There was genetic variability among genotypes, with significant differences except for the traits ear index, industrialyield and ºBrix.Heterosis was found for most traits. The mean heterosis of hybrids compared with the parents was positive for mosttraits. There was a contribution of additive and dominance effects.The contribution of dominant genes was greatest to flowering,plant and ear height and standard ear weight.
Key words: sweet corn, industrial yield, combining ability, heterosis.
INTRODUCTION
Sweet corn differs from field corn because it containsgenes that modify the flavor, tenderness, texture, seedviability, and appearance of plants and ears (Tracy1994). The world’s area used for corn comprises 900hectares, and in Brazil, 36 thousand hectares (Barbieri etal. 2005). About 66% of the production is in Goiás whereyields reach 14 t ha-1 and the industrial yield is 33%, whichmay however vary according to the level of technology,seasons and requirements of each industry.
The sweet corn produced in Brazil is destined forindustrial processing (Barbieri et al. 2005). The short supplyof varieties on the market and lack of knowledge amongconsumers have resulted in a low demand for sweet
corn. This crop can potentially increase, since sweet cornis traditionally produced and consumed corn in Brazil,which can facilitate the introduction of other forms of sweetcorn consumption.
Due to the growing demand for sweet corn and therequirements of producers, industry and consumers,studies for more information about this crop are needed toselect and identify genes that confer relevant agronomicand industrial traits for genetic breeding programs andthe consumer market. A technique that helps choose thebest parents based on their performance, for selection ofpromising hybrids, is the diallel mating system (Ramalhoet al. 1993). Diallel crosses provide information on the typeof predominant gene action, assess the heterotic potentialand general and specific combining ability of genotypes
ARTICLEARTICLEARTICLEARTICLEARTICLE
1 Universidade Federal de Goiás, Escola de Agronomia e Engenharia de Alimentos, 74.001-970, Goiânia, GO, Brazil. *E-mail: [email protected] Embrapa Arroz e Feijão, 75.375-000, Santo Antônio de Goiás, GO, Brazil.3 Instituto Federal de Educação Ciência e Tecnologia de Brasília, Campus Planaltina, 73.380-900, Brasília, DF, Brazil.4 Universidade Federal do Paraná, Campus III, Jardim Botânico, 80.210-170, Curitiba, PR, Brazil.

184 Crop Breeding and Applied Biotechnology 10: 183-190, 2010
A Assunção et al.
(Hallauer and Miranda Filho 1981). Information obtainedby diallel crossings are widely used in corn breedingprograms.
Some studies with sweet corn in diallel crosses havebeen conducted. For the trait commercial yield of ears itwas observed that the non-additive genetic effectsexceeded the additive (Scapim et al., 1995). Other resultsshow significance for general and specific combining abilityfor ear weight without straw, indicating the existence ofvariability for both additive and non-additive geneticeffects. If the non-additive genetic effects prevail, there isa greater potential for exploitation of heterosis, and ifadditive effects are predominant, the success forimprovement will be greater with the formation ofsynthetics (Teixeira et al. 2001).
The aim of this study was to evaluate eight sweetcorn populations from crosses, and investigate theperformance per se and of heterosis in industrial and yieldcomponents based on hybrid combinations.
MATERIAL AND METHODS
A field diallel was conducted on the experimentalarea of the Escola de Agronomia e Engenharia de Alimentos,of the Universidade Federal de Goiás, with the followingeight commercial sweet corn hybrids as parents: SWB-551(Dow Agroscience), DO-04 (Dow Agroscience), Tropical(Syngenta), AF-427 (Sakata Seeds), AF-428 (Sakata Seeds),AF-429 (Sakata Seeds), HS1-2004 (Embrapa), and HS2-2104(Embrapa). Ten crosses between eight hybrids wereperformed, taken in pairs, disregarding the reciprocals, with10 crosses per hybrid, to ensure the multiplication of theparental populations.
The experiment was installed in June 2005, in theabove experimental area, in a randomized block design withthree replications, with a total of 38 treatments: eight parents(F2 of crosses of each genotype), 28 generations F1(hybrids derived from crosses between all genotypes,taken two by two), and two commercial hybrids as controls(DO-04 and DAS-451). Each plot consisted of one 5-m row,with 0.75m between-row and 0.25m between-plant spacing. Three to four seeds per hole were sown at a depth of 3-4cm. The plants were thinned to one seedling per hole 25-30 days after planting.
The following traits were evaluated: male flowering(MF), female flowering (FF), plant height (PH), ear height(first ear) (EH), ºBrix (soluble solids) by a refractometer(RT-30ATC 0-32°Brix), sugar (total sugar content) -
determined in a laboratory according to the Lane-Eynonmethod; ear index (EI): total number of ears per plot dividedby the number of plants per plot; total ear weight (TEW),standard ear weight (SEW): total weight of earsdisregarding outliers; and industrial yield (Iy): theproportion of grains in relation to standard ear weight. Thegrain moisture content was corrected to 76%, which isconsidered ideal to harvest sweet corn.
For the analysis of variance the statistical program(SAS Institute 1997) was used. The means adjusted byleast squares obtained by variance analysis wereevaluated by the genetic model of diallel analysis proposedby Gardner and Eberhart (1966), using the GENES program(Cruz 1997). The general model is as follows: Yij = μ +(υi+υj)/2 + θ (h + hi + hj + sij) + εij; where: Yij: valueobserved for the parent i or cross between i and j; overallmean of varieties; υi: effect of the ith variety; υj: effect ofthe j-th variety; h: effect of mean heterosis of all crosses,hi and hj: heterosis of the parents i and j, compared to h,respectively; sij: effect of specific heterosis resulting fromcrosses between parents of the order i and j; εij: meanexperimental error associated to the hybrid or parentalmeans; θ: conditional coefficient, with values of θ = 0,where i = j and θ = 1 when i = j. The general combiningability of the parents (gi) was also estimated by: gi = ½(υii+ hi).
RESULTS AND DISCUSSION
The mean of male flowering (MF) was 83.47 daysafter planting (DAP), and female flowering (FF) 86.28 DAP(Table 1). These values are higher than those found forsweet corn, but since the experiment was planted in June,with lower mean temperature, the growing cycle lastedlonger. For sweet corn in this growing season, harvested90 to 100 DAP, it is best to use cultivars of earlier cycles,mainly for irrigated crops, to reduce the time the crop standsin the field.
All sources of variation showed significant differencesfor the variables MF and FF (Table 1), indicatingdifferences between the genotypes (parents and hybrids)in terms of cycle. For the variety effect (vi), indicatingpredominance of additive genetic effects, the genotypesthat contributed to an earlier flowering were: DO-04 (-3.66DAP), HS1-2004 (-3.00 DAP) and HS2-2104 (-3.00 DAP)for FF, and HS1-2004 (-5.08 DAP), HS2-2104 (-3.42 DAP),DO-04 (-2.08 DAP) and tropical (-2.08 DAP) for MF(Tablem2).

Crop Breeding and Applied Biotechnology 10: 183-190, 2010 185
Heterosis performance in industrial and yield components of sweet corn
The values of mean heterosis (h) were -3.23 DAP(FF) and -2.95 DAP (MF) (Table 2). Significance indicatesvariability between the heterotic responses of the crosses.At least a few of the crosses differed from the hybridmean. According to Vencovsky and Barriga (1973), basedon this significance dominance was inferred and sufficientdivergence of gene frequencies between genotypes in atleast part of the loci with dominance. The negative h valueindicated bidirectional dominance, with the occurrence ofpositive and negative heterosis. Since the mean of thecrossings was lower than the mean of the parents, thesituation is favorable for selection, since a reduction ofthe crop cycle is a breeding target. The means in F1 wereby 3.43% (MF) and 3.62% (FF) lower than for the parents(Table 3).
The effects of variety heterosis (hi) ranged from -2.68 to DAP genotype AF-428 DAP to 1.32 for genotypeDO-04 (FF), DAP and -1.88 for genotype AF-428 DAP to
1.56 for genotype HS2-2104 (MF) (Table 2). Gama etal. (1995) found significance for vi and total heterosis forMF in a diallel of 15 early common maize populations. Inthis case, hi ranged from -0.61 to 3.47 DAP. When hi issignificant, not only additive effects (variety) should beconsidered, so the best genotypes are those with highestnegative general combining ability, tending to reduce thecycle, which were: HS1-2004, Tropical and SWB-551, forMF and FF. Cruz et al. (2004) claimed that low estimates ofpositive or negative gi indicate genotypes withcombinations that do not differ much from the overall meanof the crosses in the diallel system, indicating theimportance of genes with predominantly additiveeffect. Working with maize populations in Hardy-
Table 1. Summary of the analysis of variance of the diallel for thetraits male flowering (MF, in days after planting - DAP), femaleflowering (FF, in DAP), ear index (IE), plant height (PH, in cm)and ear height (EH, in cm), according to the methodology ofGardner and Eberhart (1966)
*,** Significantly superior to the error mean square by the F test,at 5% and 1% probability respectively.
Table 2. Estimates of the mean (μ), of the variety effect (υi), mean heterosis (h), variety heterosis (hi), genotypic effect (gi) and specific
* Pop = populations; ** 1 = SWB-551; 2 = DO-04; 3 = Tropical; 4 = AF-427; 5 = AF-428; 6 = AF-429; 7 = HS1-2004; 8 = HS2-2104; *** Sij=valuesof specific heterosis in the lower half of the table refer to variable MF, and values in the upper half to FF.
Table 3. Means of the parents (G), hybrid means (H) and magnitudeof heterosis expressed in % (h) for the traits male flowering (MF, inDAP), female flowering (FF, in DAP), plant height (PH, in cm), earheight (EH, in cm), ear index (IE), soluble solids content (ºBrix), totalsugar content (sugar, in %), total ear weight (TEW, in kg ha-1), standardear weight (SEW, in kg ha-1), and industrial yield (Iy, in %)
* h = Magnitude of heterosis expressed in percentage for the difference between themeans of parents and their F1 hybrids for each trait. Positive h values indicate thesuperiority (in%) of the F1 hybrids compared with the parents, and the negativevalues express the inferiority of F1 hybrids in relation to the parents.
186 Crop Breeding and Applied Biotechnology 10: 183-190, 2010
A Assunção et al.
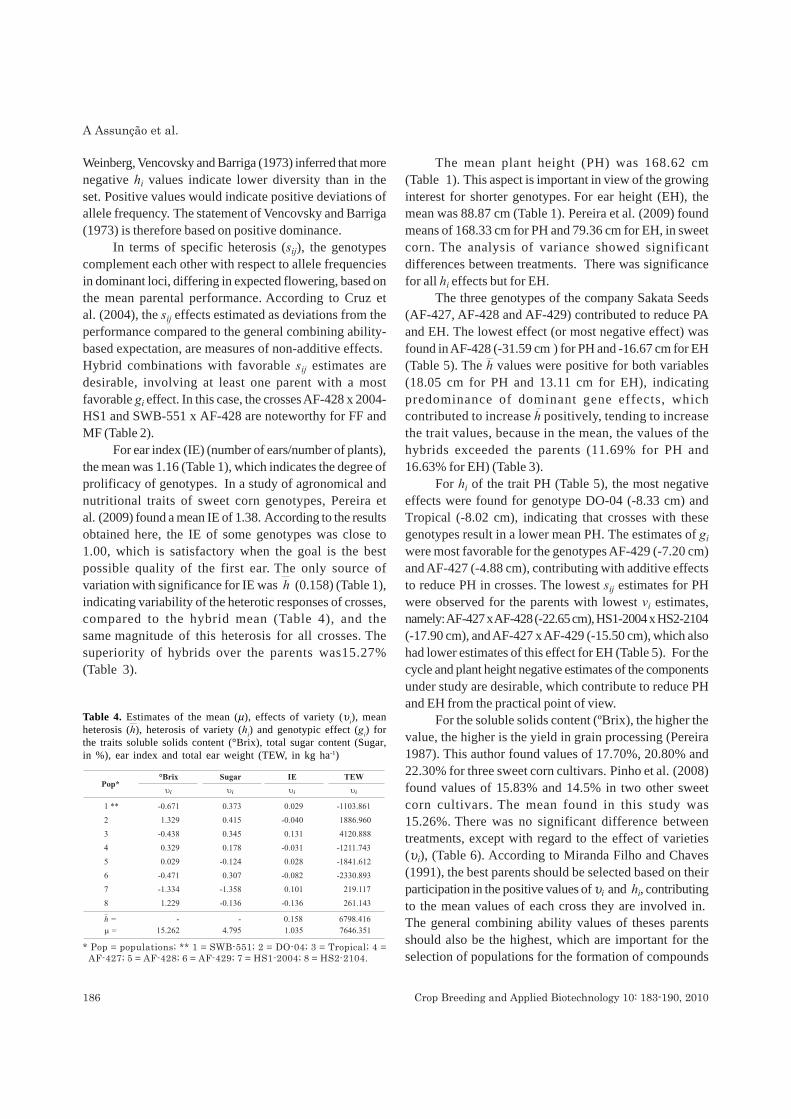
Weinberg, Vencovsky and Barriga (1973) inferred that morenegative hi values indicate lower diversity than in theset. Positive values would indicate positive deviations ofallele frequency. The statement of Vencovsky and Barriga(1973) is therefore based on positive dominance.
In terms of specific heterosis (sij), the genotypescomplement each other with respect to allele frequenciesin dominant loci, differing in expected flowering, based onthe mean parental performance. According to Cruz etal. (2004), the sij effects estimated as deviations from theperformance compared to the general combining ability-based expectation, are measures of non-additive effects. Hybrid combinations with favorable sij estimates aredesirable, involving at least one parent with a mostfavorable gi effect. In this case, the crosses AF-428 x 2004-HS1 and SWB-551 x AF-428 are noteworthy for FF andMF (Table 2).
For ear index (IE) (number of ears/number of plants),the mean was 1.16 (Table 1), which indicates the degree ofprolificacy of genotypes. In a study of agronomical andnutritional traits of sweet corn genotypes, Pereira etal. (2009) found a mean IE of 1.38. According to the resultsobtained here, the IE of some genotypes was close to1.00, which is satisfactory when the goal is the bestpossible quality of the first ear. The only source ofvariation with significance for IE was h (0.158) (Table 1),indicating variability of the heterotic responses of crosses,compared to the hybrid mean (Table 4), and thesame magnitude of this heterosis for all crosses. Thesuperiority of hybrids over the parents was15.27%(Tablea3).
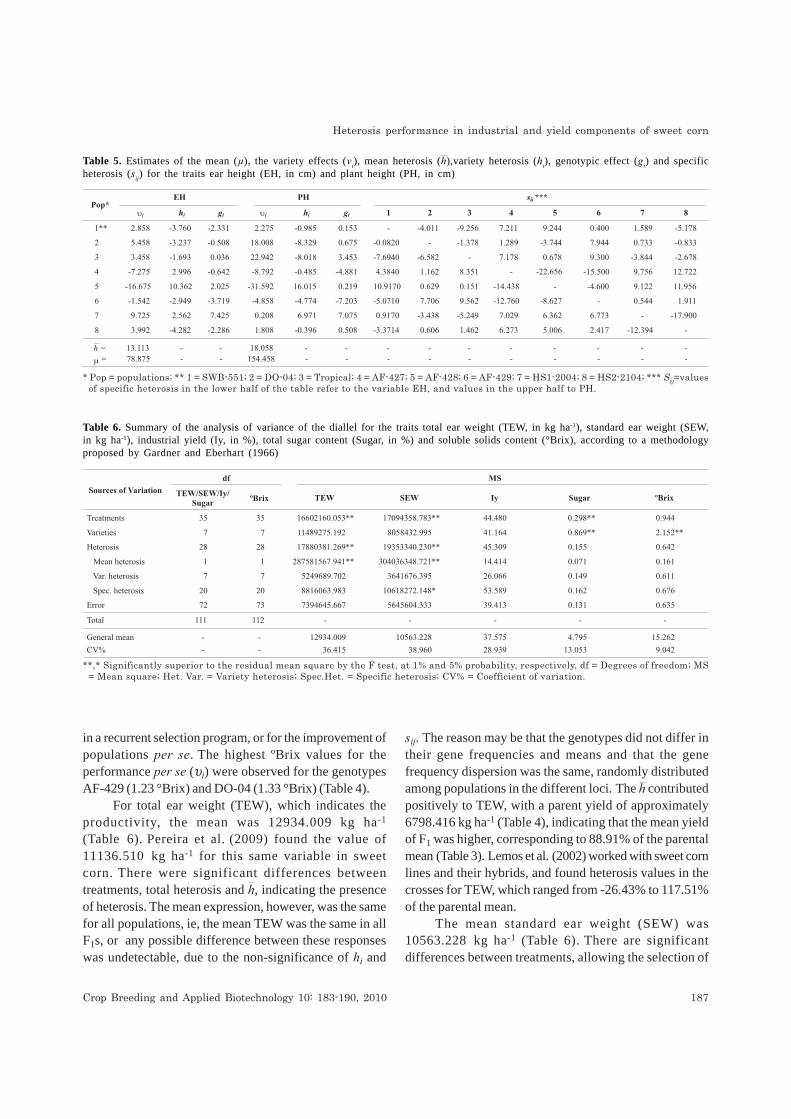
The mean plant height (PH) was 168.62 cm(Tableo1). This aspect is important in view of the growinginterest for shorter genotypes. For ear height (EH), themean was 88.87 cm (Table 1). Pereira et al. (2009) foundmeans of 168.33 cm for PH and 79.36 cm for EH, in sweetcorn. The analysis of variance showed significantdifferences between treatments. There was significancefor all hi effects but for EH.
The three genotypes of the company Sakata Seeds(AF-427, AF-428 and AF-429) contributed to reduce PAand EH. The lowest effect (or most negative effect) wasfound in AF-428 (-31.59 cm ) for PH and -16.67 cm for EH(Table 5). The h values were positive for both variables(18.05 cm for PH and 13.11 cm for EH), indicatingpredominance of dominant gene effects, whichcontributed to increase h positively, tending to increasethe trait values, because in the mean, the values of thehybrids exceeded the parents (11.69% for PH and16.63% for EH) (Table 3).
For hi of the trait PH (Table 5), the most negativeeffects were found for genotype DO-04 (-8.33 cm) andTropical (-8.02 cm), indicating that crosses with thesegenotypes result in a lower mean PH. The estimates of giwere most favorable for the genotypes AF-429 (-7.20 cm)and AF-427 (-4.88 cm), contributing with additive effectsto reduce PH in crosses. The lowest sij estimates for PHwere observed for the parents with lowest vi estimates,namely: AF-427 x AF-428 (-22.65 cm), HS1-2004 x HS2-2104(-17.90 cm), and AF-427 x AF-429 (-15.50 cm), which alsohad lower estimates of this effect for EH (Table 5). For thecycle and plant height negative estimates of the componentsunder study are desirable, which contribute to reduce PHand EH from the practical point of view.
For the soluble solids content (ºBrix), the higher thevalue, the higher is the yield in grain processing (Pereira1987). This author found values of 17.70%, 20.80% and22.30% for three sweet corn cultivars. Pinho et al. (2008)found values of 15.83% and 14.5% in two other sweetcorn cultivars. The mean found in this study was15.26%. There was no significant difference betweentreatments, except with regard to the effect of varieties(υi), (Table 6). According to Miranda Filho and Chaves(1991), the best parents should be selected based on theirparticipation in the positive values of υi and hi, contributingto the mean values of each cross they are involved in. The general combining ability values of theses parentsshould also be the highest, which are important for theselection of populations for the formation of compounds
Table 4. Estimates of the mean (μ), effects of variety (υi), meanheterosis (h), heterosis of variety (hi) and genotypic effect (gi) forthe traits soluble solids content (°Brix), total sugar content (Sugar,in %), ear index and total ear weight (TEW, in kg ha-1)
* Pop = populations; ** 1 = SWB-551; 2 = DO-04; 3 = Tropical; 4 =AF-427; 5 = AF-428; 6 = AF-429; 7 = HS1-2004; 8 = HS2-2104.
Crop Breeding and Applied Biotechnology 10: 183-190, 2010 187
Heterosis performance in industrial and yield components of sweet corn
in a recurrent selection program, or for the improvement ofpopulations per se. The highest ºBrix values for theperformance per se (υi) were observed for the genotypesAF-429 (1.23 °Brix) and DO-04 (1.33 °Brix) (Table 4).
For total ear weight (TEW), which indicates theproductivity, the mean was 12934.009 kg ha-1
(Tableo6). Pereira et al. (2009) found the value of11136.510okg ha-1 for this same variable in sweetcorn. There were significant differences betweentreatments, total heterosis and h, indicating the presenceof heterosis. The mean expression, however, was the samefor all populations, ie, the mean TEW was the same in allF1s, or any possible difference between these responseswas undetectable, due to the non-significance of hi and
sij. The reason may be that the genotypes did not differ intheir gene frequencies and means and that the genefrequency dispersion was the same, randomly distributedamong populations in the different loci. The h contributedpositively to TEW, with a parent yield of approximately6798.416 kg ha-1 (Table 4), indicating that the mean yieldof F1 was higher, corresponding to 88.91% of the parentalmean (Table 3). Lemos et al. (2002) worked with sweet cornlines and their hybrids, and found heterosis values in thecrosses for TEW, which ranged from -26.43% to 117.51%of the parental mean.
The mean standard ear weight (SEW) was10563.228okg ha-1 (Table 6). There are significantdifferences between treatments, allowing the selection of
Table 5. Estimates of the mean (μ), the variety effects (vi), mean heterosis (h),variety heterosis (hi), genotypic effect (gi) and specificheterosis (sij) for the traits ear height (EH, in cm) and plant height (PH, in cm)
* Pop = populations; ** 1 = SWB-551; 2 = DO-04; 3 = Tropical; 4 = AF-427; 5 = AF-428; 6 = AF-429; 7 = HS1-2004; 8 = HS2-2104; *** Sij=valuesof specific heterosis in the lower half of the table refer to the variable EH, and values in the upper half to PH.
Table 6. Summary of the analysis of variance of the diallel for the traits total ear weight (TEW, in kg ha-1), standard ear weight (SEW,in kg ha-1), industrial yield (Iy, in %), total sugar content (Sugar, in %) and soluble solids content (°Brix), according to a methodologyproposed by Gardner and Eberhart (1966)
**,* Significantly superior to the residual mean square by the F test, at 1% and 5% probability, respectively, df = Degrees of freedom; MS= Mean square; Het. Var. = Variety heterosis; Spec.Het. = Specific heterosis; CV% = Coefficient of variation.

188 Crop Breeding and Applied Biotechnology 10: 183-190, 2010
A Assunção et al.
superior genotypes. Significance was observed for totalheterosis, h and sij. Dominant gene effects prevailed forSEW, with a considerable contribution of heterosis to thetrait expression; the selection of parents with highest SEWindicates the best combinations between them, based onsij. Once h and sij were significant, there is heterosis, withdifferentiated responses that suggest the existence ofcomplementary hybrid combinations due to the dominanceeffects.
The positive contribution of h (6990.206 kg ha-1) toSEW (Table 7) indicated that in the mean, the F1 generationproduced 6990.206 kg ha-1 more than the parents, which isequivalent to 136.36% of the parental mean (Table 3). Evenin cases where the magnitude is low, can be exploited inhybrid combinations. In this case, the superiority of thehybrid response is evident, which is relevant, since yieldis one of the main variables in a breeding program. Thecontributions with greatest number of alleles to increasethe SEW for sij were found in the crosses AF-428 x HS1-2004 (4568.14 kg ha-1), SWB-551 x AF-429 (4410.77 kg ha-1),DO-04 x Tropical (3757.01 kg ha-1) and AF-427 x HS2-2104(3058.30 kg ha-1) (Table 7). This indicates greaterdivergence among the parents than compared toother combinations. Bordallo et al. (2005) assessed the totalear weight without straw and found significant specific andgeneral combining ability, showing the variability for bothadditive and non-additive genetic effects. For thegenotypes DO-04 and Tropical the values for υi, hi and giwere simultaneously positive (Table 7), and their higher gi(general combining ability) estimates were favorable sincethey contribute with additive genes to higher yields.
The mean industrial yield (Iy) was 37.57%. Thisindicates that the means of the genotypes meet industrialrequirements, with an Iy of >30% (Pereira Filho et al. 2003).Pinho et al. (2008) obtained values of 29% and 38.95% for Iyin two sweet corn cultivars and Pereira et al. (2009) observeda mean Iy of 31.03% in several sweet corn genotypes. Forthis variable, as well as for ºBrix, no significant difference wasobserved for any of the sources of variation (Table 6).
The mean total sugar content was 4.79% (Table 6),as a wet analysis of grains showed. Pereira (1987) foundtotal sugar contents of 4.30%, 4.60% and 5.20% for thecultivars Doce Cristal, Doce-de-Ouro and Superdoce,respectively. This trait is important, since genotypes withhigher sugar levels in the grain are preferable for industrialpurposes. There were significant differences for treatmentsand υi, indicating the possibility of selecting superiorgenotypes for this trait, and that the performance of F1plants was similar to that of their parents for total sugarcontent in the grain, suggesting a low dominance degreein the genetic control of this trait, with predominantlyadditive effects. The best performance per se was observedfor the genotypes DO-04 (0.41%), SWB-551 (0.37%),Tropical (0.34%), and AF-429 (0.30%) (Table 4), as indicatedby the highest positive υi values.
For total sugar content in grain the hybrid performancewas 2.27% higher than of the parents (Tableo3). Thepositive h values showed that the hybrids performed betterfor all variables (Table 3). Genetic variability was observedin the genotypes and hybrids for most traits under studyas well as heterosis for most traits, which was particularlyhigh for yield.
Table 7. Estimates of the mean (μ), of the effect of variety (υi), mean heterosis (h), variety heterosis (hi), genotypic effect (gi) andspecific heterosis (sij) for the trait standard ear weight (SEW, in kg ha-1)
* Pop = populations; ** 1 = SWB-551; 2 = DO-04; 3 = Tropical; 4 = AF-427; 5 = AF-428; 6 = AF-429; 7 = HS1-2004; 8 = HS2-2104; *** Sij =specific heterosis.

Crop Breeding and Applied Biotechnology 10: 183-190, 2010 189
Heterosis performance in industrial and yield components of sweet corn
ACKNOWLEDGEMENTS
The authors thank the Escola de Agronomia eEngenharia de Alimentos, the Universidade Federal deGoiás (UFG) and the Conselho Nacional de Desenvolvi-mento Científico e Tecnológico (CNPq) for granting ascholarship.
Comportamento da heterose em componentesComportamento da heterose em componentesComportamento da heterose em componentesComportamento da heterose em componentesComportamento da heterose em componentesindustriais e da produção para o milho doceindustriais e da produção para o milho doceindustriais e da produção para o milho doceindustriais e da produção para o milho doceindustriais e da produção para o milho doce
RESUMO - Foi avaliada a heterose e seus componentes através de cruzamentos dialélicos em milho doce utilizando 38tratamentos: oito parentais, 28 híbridos e duas testemunhas. O delineamento experimental foi o de blocos casualizados comtrês repetições e a análise dialélica seguiu a metodologia de Gardner and Eberhart (1966). Foi avaliado o florescimentomasculino e feminino, altura de plantas e espigas, índice de espigas (número de espigas/número de plantas), ºBrix, peso deespigas total, peso de espigas padrão, rendimento industrial e teor de açúcar total. Houve variabilidade genética entre osgenótipos, com diferença significativa para vários caracteres, exceto índice de espigas, rendimento industrial e ºBrix. Háheterose para grande parte dos caracteres avaliados. A heterose média dos híbridos com relação aos genitores foi positivapara a maioria dos caracteres. Houve contribuição de efeito aditivo e de dominância, sendo a maior contribuição dos genesde dominância para florescimento, altura de plantas e espigas e peso de espigas padrão.
Palavras-chave: milho doce, rendimento industrial, capacidade de combinação, heterose.
REFERENCES
Barbieri VHB, Luz JMQ, Brito CH, Duarte JM, Gomes LS andSantana DG (2005) Produtividade e rendimento industrial dehíbridos de milho doce em função de espaçamento e populaçõesde plantas. Horticultura Brasileira 23: 826-830.
Bordallo PN, Pereira MG, Amaral Júnior AT and Gabriel APC (2005)Análise dialélica de genótipos de milho doce e comum paracaracteres agronômicos e proteína total. HorticulturaBrasileira 23: 123-127.
Cruz CD (1997) Programa Genes: aplicativo computacionalem genética e estatística. Editora UFV, Viçosa, 394p.
Cruz CD, Regazzi AJ and Carneiro PCS (2004) Modelosbiométricos aplicados ao melhoramento genético. Vol. I,UFV, Viçosa, 480p.
Gama EEG, Hallauer AR, Lopes MA Parentoni S, Santos MX andGuimarães PEO (1995) Combining ability among fifteen earlycycle maize populations in Brazil. Brazilian Journal ofGenetics 18: 569-577.
Gardner CO and Eberhart SA (1966) Analysis and interpretationof the variety cross diallel and related population. Biometrics22: 439-452.
Hallauer AR and Miranda Filho JB (1981) Quantitative geneticsin maize breeding. Iowa State University Press, Ames, 468p.
Lemos MA, Gama EEG, Menezes D, Santos VF and Tabosa JN(2002) Avaliação de dez linhagens e seus híbridos de milhosuperdoce em um dialelo completo. Horticultura Brasileira20: 167-170.
Miranda Filho JB and Chaves LJ (1991) Procedures for selectingcomposites based on prediction methods. Theoretical andApplied Genetics 81: 265-271.
Pereira AF, Melo PGS, Pereira JM, Assunção A, Nascimento ARand Ximenes PA (2009) Caracteres agronômicos e nutricionaisde genótipos de milho doce. Bioscience Journal 25: 104-112.
Pereira AS (1987) Composição, avaliação organoléptica e padrãode qualidade de cultivares de milho-doce. HorticulturaBrasileira 5: 22-24.
Pereira Filho IA, Cruz JC and Gama EEG (2003) Cultivares para oconsumo verde. In Pereira Filho IA (ed.) (2003) O cultivo domilho-verde. Embrapa Informações Tecnológicas, Brasília,p. 17-30.
Pinho L, Paes MCD, Almeida AC and Costa CA (2008) Qualidadede milho verde cultivado em sistemas de produção orgânico econvencional. Revista Brasileira de Milho e Sorgo 7: 279-29.

190 Crop Breeding and Applied Biotechnology 10: 183-190, 2010
A Assunção et al.
Ramalho MAP, Santos JB and Zimmermann MJ (1993) Genéticaquantitativa em plantas autógamas. Editora UFG, Goiânia,271p.
SAS Institute (1997) SAS/STAT software: changes andenhancements through release 6.12. Statistical Analysis SystemInstitute, Cary. 1167p.
Scapim CA, Cruz CD and Araújo JM (1995) Cruzamentos dialélicosentre sete cultivares de milho-doce. Horticultura Brasileira13: 19-21.
Teixeira FF, Souza IRP, Gama EEG, Pacheco CAP, Parentoni SN,Santos MX and Meirelles WF (2001) Avaliação da capacidadede combinação entre linhagens de milho doce. CiênciaAgrotécnica 25: 483-488.
Tracy WF (1994) Sweet corn. In Hallauer AR (ed.) Specialtycorns. Department of Agronomy, Iowa State University, Iowa,p. 147-187.
Vencovsky R and Barriga P (1973) Heterose da produção de grãose de outros caracteres agronômicos em cruzamentosintervarietais de milho. Ciência e Cultura 25: 880-885.