![IS 14564 (1998): Textiles - Cotton tapes for personnel ... · IS 14564 (1998): Textiles - Cotton tapes for personnel parachutes [TXD 13: Textile Materials for Aerospace Purposes]](https://static.fdocuments.us/doc/165x107/5f07635e7e708231d41cbc64/is-14564-1998-textiles-cotton-tapes-for-personnel-is-14564-1998-textiles.jpg)
Article Galaxy And Mass Assembly (GAMA): refining the...
14
Article Galaxy And Mass Assembly (GAMA): refining the local galaxy merger rate using morphological information Casteels, K. R. V., Conselice, C. J., Bamford, S. P., Salvador-Sole, E., Norberg, P. R., Agius, N. K., Baldry, I., Brough, S., Brown, M. J. I., Drinkwater, M. J., Driver, S. P., Graham, A. W., Bland-Hawthorn, J., Hopkins, A. M., Kelvin, L. S., Lopez-Sanchez, A. R., Loveday, J., Robotham, A. S. G. and Vazquez-Mata, J. A. Available at http://clok.uclan.ac.uk/14564/ Casteels, K. R. V., Conselice, C. J., Bamford, S. P., Salvador-Sole, E., Norberg, P. R., Agius, N. K., Baldry, I., Brough, S., Brown, M. J. I. et al (2014) Galaxy And Mass Assembly (GAMA): refining the local galaxy merger rate using morphological information. Monthly Notices Of The Royal Astronomical Society, 445 (2). pp. 1157-1169. ISSN 0035-8711 It is advisable to refer to the publisher’s version if you intend to cite from the work. http://dx.doi.org/10.1093/mnras/stu1799 For more information about UCLan’s research in this area go to http://www.uclan.ac.uk/researchgroups/ and search for <name of research Group>. For information about Research generally at UCLan please go to http://www.uclan.ac.uk/research/ All outputs in CLoK are protected by Intellectual Property Rights law, including Copyright law. Copyright, IPR and Moral Rights for the works on this site are retained by the individual authors and/or other copyright owners. Terms and conditions for use of this material are defined in the http://clok.uclan.ac.uk/policies/ CLoK Central Lancashire online Knowledge www.clok.uclan.ac.uk
-
Upload
phungtuyen -
Category
Documents
-
view
217 -
download
4
Transcript of Article Galaxy And Mass Assembly (GAMA): refining the...

Article
Galaxy And Mass Assembly (GAMA): refining the local galaxy merger rate using morphological information
Casteels, K. R. V., Conselice, C. J., Bamford, S. P., Salvador-Sole, E., Norberg, P. R., Agius, N. K., Baldry, I., Brough, S., Brown, M. J. I., Drinkwater, M. J., Driver, S. P., Graham, A. W., Bland-Hawthorn, J., Hopkins, A. M., Kelvin, L. S., Lopez-Sanchez, A. R., Loveday, J., Robotham, A. S. G. and Vazquez-Mata, J. A.
Available at http://clok.uclan.ac.uk/14564/
Casteels, K. R. V., Conselice, C. J., Bamford, S. P., SalvadorSole, E., Norberg, P. R., Agius, N. K., Baldry, I., Brough, S., Brown, M. J. I. et al (2014) Galaxy And Mass Assembly (GAMA): refining the local galaxy merger rate using morphological information. Monthly Notices Of The Royal Astronomical Society, 445 (2). pp. 11571169. ISSN 00358711
It is advisable to refer to the publisher’s version if you intend to cite from the work.http://dx.doi.org/10.1093/mnras/stu1799
For more information about UCLan’s research in this area go to http://www.uclan.ac.uk/researchgroups/ and search for <name of research Group>.
For information about Research generally at UCLan please go to http://www.uclan.ac.uk/research/
All outputs in CLoK are protected by Intellectual Property Rights law, includingCopyright law. Copyright, IPR and Moral Rights for the works on this site are retained by the individual authors and/or other copyright owners. Terms and conditions for use of this material are defined in the http://clok.uclan.ac.uk/policies/
CLoKCentral Lancashire online Knowledgewww.clok.uclan.ac.uk

MNRAS 445, 1157–1169 (2014) doi:10.1093/mnras/stu1799
Galaxy And Mass Assembly (GAMA): refining the local galaxy mergerrate using morphological information
Kevin R. V. Casteels,1,2‹ Christopher J. Conselice,1 Steven P. Bamford,1
Eduard Salvador-Sole,2 Peder R. Norberg,3 Nicola K. Agius,4 Ivan Baldry,5
Sarah Brough,6 Michael J. I. Brown,7 Michael J. Drinkwater,8 Simon P. Driver,9,10
Alister W. Graham,11 Joss Bland-Hawthorn,12 Andrew M. Hopkins,6
Lee S. Kelvin,9,10,13 Angel R. Lopez-Sanchez,6,14 Jon Loveday,15
Aaron S. G. Robotham9,10 and Jose A. Vazquez-Mata15
1School of Physics and Astronomy, The University of Nottingham, University Park, Nottingham NG7 2RD, UK2Institut de Ciencies del Cosmos, Universitat de Barcelona, Martı Franques 1, E-08028 Barcelona, Spain3Institute for Computational Cosmology, Department of Physics, Durham University, South Road, Durham DH1 3LE, UK4Jeremiah Horrocks Institute, University of Central Lancashire, Preston PR1 2HE, UK5Astrophysics Research Institute, Liverpool John Moores University, IC2, Liverpool Science Park, 146 Brownlow Hill, Liverpool L3 5RF, UK6Australian Astronomical Observatory, PO Box 915, North Ryde, NSW 1670, Australia7School of Physics, Monash University, Clayton, Victoria 3800, Australia8Department of Physics, University of Queensland, Brisbane, Queensland 4072, Australia9International Centre for Radio Astronomy Research (ICRAR), University of Western Australia, Crawley, WA 6009, Australia10Scottish Universities Physics Alliance (SUPA), School of Physics and Astronomy, University of St Andrews, North Haugh, St Andrews KY16 9SS, UK11Centre for Astrophysics and Supercomputing, Swinburne University of Technology, Hawthorn, Victoria 3122, Australia12Sydney Institute for Astronomy, School of Physics A28, University of Sydney, NSW 2006, Australia13Institut fur Astro- und Teilchenphysik, Universitat Innsbruck, Technikerstrasse 25, 6020 Innsbruck, Austria14Department of Physics and Astronomy, Macquarie University, NSW 2109, Australia15Astronomy Centre, University of Sussex, Falmer, Brighton BN1 9QH, UK
Accepted 2014 September 1. Received 2014 August 29; in original form 2013 December 12
ABSTRACTWe use the Galaxy And Mass Assembly (GAMA) survey to measure the local Universe mass-dependent merger fraction and merger rate using galaxy pairs and the CAS (concentration,asymmetry, and smoothness) structural method, which identifies highly asymmetric mergercandidate galaxies. Our goals are to determine which types of mergers produce highly asym-metrical galaxies and to provide a new measurement of the local galaxy major merger rate. Weexamine galaxy pairs at stellar mass limits down to M∗ = 108 M� with mass ratios of <100:1and line-of-sight velocity differences of �V < 500 km s−1. We find a significant increasein mean asymmetries for projected separations less than the sum of the individual galaxy’sPetrosian 90 radii. For systems in major merger pairs with mass ratios of <4:1, both galaxiesin the pair show a strong increase in asymmetry, while in minor merger systems (with massratios of >4:1) the lower mass companion becomes highly asymmetric, whereas the largergalaxy is much less affected. The fraction of highly asymmetric paired galaxies which havea major merger companion is highest for the most massive galaxies and drops progressivelywith decreasing mass. We calculate that the mass-dependent major merger fraction is fairlyconstant at ∼1.3–2 per cent within 109.5 < M∗ < 1011.5 M�, and increases to ∼4 per centat lower masses. When the observability time-scales are taken into consideration, the majormerger rate is found to approximately triple over the mass range we consider. The total co-moving volume major merger rate over the range 108.0 < M∗ < 1011.5 M� is (1.2 ± 0.5) ×10−3 h3
70 Mpc−3 Gyr−1.
Key words: galaxies: evolution – galaxies: general – galaxies: interactions – galaxies: statis-tics.
� E-mail: [email protected]
C© 2014 The AuthorsPublished by Oxford University Press on behalf of the Royal Astronomical Society
at The L
ibrary on May 17, 2016
http://mnras.oxfordjournals.org/
Dow
nloaded from

1158 K. R. V. Casteels et al.
1 IN T RO D U C T I O N
The most accepted theories of galaxy and structure formationstate that galaxies are formed hierarchically, where smaller galax-ies merge to form larger galaxies (e.g. White & Rees 1978;Kauffmann, White & Guiderdoni 1993; Cole et al. 2000). Essen-tially, all of the galaxies we observe in the local universe are theproducts of mergers or have been influenced by interactions withother galaxies. The mass ratio of the merging progenitor galaxiesis known to have a major effect on the merger remnant. To dis-tinguish between the different types of mergers, those taking placebetween progenitor galaxies with similar masses are referred to asmajor mergers (mass ratio of <4:1), while mergers between galax-ies with large mass ratios are called minor mergers (mass ratioof >4:1).
The strongly fluctuating gravitational forces and shock wavesexperienced during violent relaxation in major mergers are knownto funnel gas into their cores and induce intense starbursts and feedcentral black holes as seen both in simulations and in observations(Barnes & Hernquist 1991, 1996; Mihos & Hernquist 1994, 1996;Di Matteo, Springel & Hernquist 2005; Hopkins et al. 2005a,b; Coxet al. 2008; Lotz et al. 2008b, 2010a,b; Di Matteo et al. 2012; Ellisonet al. 2013; Torrey et al. 2014). This results in a rapid exhaustion ofthe gas supply and can lead to the formation of elliptical galaxies,as well as efficiently creates the spheroidal components of galaxies(e.g. Hopkins et al. 2010a). Understanding the mass dependenceof the major merger rate can help to tell us how the red sequenceand the spheroidal components of galaxies are being built up overdifferent mass ranges.
According to the predictions of merger rates of dark matter haloes(e.g. Fakhouri & Ma 2008; Fakhouri, Ma & Boylan-Kolchin 2010),minor mergers are expected to be much more common than majormergers. Although there is not a direct correlation between halomergers and the galaxies they contain, the same is expected to betrue for galaxies. Indeed, papers such as Lotz et al. (2011), Lopez-Sanjuan et al. (2011), Bluck et al. (2012), and Kaviraj (2014) findthe galaxy minor merger rate to be several times higher than themajor merger rate. The higher frequency of minor mergers playsan important role in the gradual build-up of massive disc galaxies,without the total destruction of the primary galaxy, as is the case inmajor mergers. Hopkins et al. (2010a) showed that minor mergerscan also build up pre-existing bulges in massive galaxies, as well asform new bulges in lower mass galaxies. It is possible that minormergers may sometimes induce bar structures (Skibba et al. 2012),while there is evidence that major mergers have the opposite effect,and destroy bars (Mendez-Hernandez et al. 2011; Lee et al. 2012;Casteels et al. 2013).
Accurately measuring the mass dependence of galaxy mergerrates is important for fully understanding the phenomenon describedabove, as well as providing a way to test hierarchical galaxy forma-tion models and simulations (e.g. Benson et al. 2002). The mergerhistory is known to increase as a function of redshift, often verysteeply (e.g. Le Fevre et al. 2000; Patton et al. 2002; Conselice2003; Lin et al. 2004; Conselice, Rajgor & Myers 2008; Lotz et al.2008b; Jogee et al. 2009; Lopez-Sanjuan et al. 2011; Tasca et al.2014), such that the merger process is a dominant one in the for-mation of at least the most massive galaxies (e.g. Conselice 2006;Lopez-Sanjuan et al. 2011; Tasca et al. 2014). By understandingand having a reliable value for the nearby mass-dependent mergerrate, we can calibrate the increase in the merger rate for galaxiesseen at higher redshifts to obtain a full picture of the role of mergingin galaxies.
Previous attempts to measure the mass-dependent merger fractionusing studies of close pairs have found it to be constant or increaseslightly with mass (e.g. Xu, Sun & He 2004; Patton & Atfield 2008;Domingue et al. 2009; Xu et al. 2012). On the other hand, the studyby Bridge, Carlberg & Sullivan (2010) which selected interactingand merging galaxies based on their morphologies found evidencefor a mildly decreasing interaction fraction with mass. However,these studies may be measuring different aspects of the merger pro-cess, as the Bridge et al. (2010) sample also includes remnants ofmergers identified from tidal features, and not exclusively interact-ing pairs. While many studies have attempted to measure the nearbygalaxy merger fraction and overall merger rate (e.g. De Propris et al.2007), the actual mass-dependent merger rate is not yet known withmuch accuracy. Along with this study, two companion papers byDe Propris et al. (2014) and Robotham et al. (2014) also use Galaxyand Mass Assembly (GAMA) data to study the luminosity andmass-dependent galaxy merger rate using close pairs.
In this study, we use the CAS (concentration, asymmetry, andsmoothness) method of Conselice (2003) to identify highly asym-metric galaxies as merger candidates, and determine which of theseare produced in major mergers (through the examination of closepairs) to obtain a measurement of the major merger fraction and ratefor nearby galaxies. Galaxies are known to become highly asym-metric in major mergers, and sometimes also in minor mergers if theprogenitor cool gas fractions are high enough (Lotz et al. 2010b).Galaxies in very close pairs often have high asymmetries due tothe strong tidal forces at small separations (Hernandez-Toledo et al.2005; Patton et al. 2005; De Propris et al. 2007), and measuringthe mass ratios of highly asymmetric pairs provides us with a wayto estimate the contribution of both major and minor mergers tothe population of morphologically disturbed and highly asymmet-ric galaxies, and thus obtain a clean sample of major mergers in thenearby universe.
In this paper, we present the observed merger fractions for galax-ies in the nearby universe as a function of stellar mass, as well asprojected separation for those which are in galaxy pairs. We de-termine the proportion of highly asymmetric galaxies produced inmajor mergers compared to those produced in minor mergers. Wethen utilize this to obtain a measurement of the merger fraction andrate for nearby galaxies as a function of stellar mass, as well as thetotal merger rate in the nearby universe.
This paper is structured as follows: in Section 2, we describe thedata set and sample selection, in Section 3, we present our methodand results, and in Section 4, we discuss their implications and sum-marize our conclusions in Section 5. A � cold dark matter (CDM)cosmology is assumed throughout, with �� = 0.7, �m = 0.3, andH0 = 70 km s−1 Mpc−1.
2 DATA AND SAMPLE SELECTI ON
2.1 GAMA
GAMA (Driver et al. 2009, 2011) is a galaxy survey cover-ing ∼300 deg2 of sky down to r ∼ 19.8 mag. Galaxy spectrahave been obtained by the 3.9 m Anglo-Australian Telescope usingthe AAOmega multi-object spectrograph. For the brighter galax-ies, GAMA also uses existing spectra from the Sloan Digital SkySurvey (SDSS; York et al. 2000), the 2dF Galaxy Redshift Survey(Colless et al. 2001), and the Millennium Galaxy Catalogue (MGC;Liske et al. 2003). The GAMA I NGP sample (Baldry et al. 2010;Driver et al. 2011) used in this study consists of 114 094 SDSS
MNRAS 445, 1157–1169 (2014)
at The L
ibrary on May 17, 2016
http://mnras.oxfordjournals.org/
Dow
nloaded from

Refining the galaxy merger rate 1159
selected galaxies and is ∼99 per cent spectroscopically complete(Hopkins et al. 2013). This sample consists of three equatorial re-gions of ∼48 deg2 each, two of which are complete for r < 19.4and one which is complete for r < 19.8. This high spectroscopiccompleteness makes GAMA the ideal survey to study galaxies inclose pairs, as there is essentially no dependence of incompletenesson angular separation, as there is in the MGC and SDSS. The pho-tometrically derived galaxy stellar mass estimates of Taylor et al.(2011) are used in this study. The photometry used to determinethe masses is based on an improved reanalysis of SDSS imaging(Hill et al. 2011). Not all galaxies have mass estimates, due to poorphotometric measurements, and so the overall completeness of thesample used here drops slightly to ∼98 per cent.
The sample used here to calculate the mass-dependent mergerfraction and merger rate consists of 51 700 galaxies with stellarmasses M∗ > 106.5 M� and redshifts 0.001 < z < 0.2 (medianz = 0.129). The maximum redshift limit of zmax = 0.2 is cho-sen to ensure that all of the galaxies are sufficiently resolved toprovide robust CAS measurements. Over this redshift range, thesample is approximately ∼95 per cent stellar mass complete forM∗ > 1010 M� (Taylor et al. 2011). The final sample contains 1470highly asymmetric galaxies (defined in Section 2.2), 142 of whichare found to have a very close companion.
2.2 CAS measurements
The CAS method (Conselice, Bershady & Jangren 2000; Conselice2003) was used to obtain quantitative measurements of the mor-phological properties of the galaxies. The CAS parametrizationconsists of three measurements: the galaxy concentration index C,an asymmetry index A, and a clumpiness index S. The parametersA and S are particularly useful for identifying merging galaxies inthe later stages of a merger. How these are measured is definedbelow.
The parameter A is a measure of the rotational symmetry of agalaxy, and is obtained by rotating its image 180 deg and subtractingthe light within 1.5× the Petrosian η = 0.2 radius from the originalmonochromatic fits image. The value of the asymmetry is such thatmore asymmetric systems have a higher value of A, with A > 0.35typically for merging systems. The centre for rotation is decidedby an iterative process which finds the location of the minimumasymmetry. The parameter A is the value measured when taking theratio of the subtracted flux to the original galaxy flux, and is givenby
A = min
(∑ |I0 − I180|∑ |I0|)
− min
(∑ |B0 − B180|∑ |I0|)
, (1)
where I0 is the intensity of the original image, I180 is the intensityof the rotated image, and B0 and B180 are noise corrections obtainedby iteratively repeating the same rotation and subtraction on emptybackground regions. The value of A can range from 0 to 2, whereA = 0 represents a completely symmetrical galaxy and A = 2represents a completely asymmetrical galaxy.
The parameter S is a measure of highly localized, bright struc-tures, and is meant to detect bright star-forming regions. S is definedas the ratio of the amount of light in high spatial frequency struc-tures within 1.5× the Petrosian 90 radius to the total amount oflight within that radius (Conselice 2003). The Petrosian 90 radiusis defined as the radius which contains 90 per cent of the Petrosianflux Fp (Petrosian 1976). To obtain a measure of the high-frequency
structure, a boxcar-smoothed image is produced from the originalimage. S is defined as follows:
S = 10
[∑N,Nx,y=1,1(Ix,y − I s
x,y)∑N,Nx,y=1,1 Ix,y
−∑N,N
x,y=1,1 BSx,y∑N,N
x,y=1,1 Ix,y
], (2)
where Ix, y is the intensity of light in a given pixel, I sx,y is the intensity
of that pixel in the image smoothed by 0.3rPet, and Bx, y is an intensityvalue of a pixel from a smoothed background region.
Merger candidate galaxies are then identified by selecting galax-ies with A > Alimit and by requiring A > S to exclude galaxies withbright star-forming regions which do not have global asymmetriescharacteristic of a merger. Throughout this paper, Alimit = 0.35 (e.g.Conselice 2003). For a detailed description of the CAS method usedin this paper, the reader is referred to Conselice (2003).
2.2.1 Segmentation maps
Soon after beginning work with the GAMA data, it became clearthat there was a problem with the publicly available SDSS seg-mentation maps, which are meant to cleanly separate galaxies fromeach other and define their boundary. It was found that for galaxieswith close angular separations, the public segmentation maps wereconsistently joining clearly separate galaxies together. For studiesof the general population, this may not be a big problem, but whendealing with merging galaxies it is essential that very close andclearly distinct galaxy pairs are cleanly separated. Defining the cor-rect boundaries of a galaxy is integral to obtaining a physicallymeaningful CAS measurement. For example, if two galaxies sharethe same segmentation map (i.e. they have not been separated), thenthe resulting asymmetry measurement (A) will be artificially highregardless of the true asymmetry of the galaxies.
Therefore, the SEXTRACTOR code of Bertin & Arnouts (1996)was used to create new segmentation maps for all of the GAMAgalaxies. Segmentation maps and subsequent CAS measurementswere obtained for the SDSS DR7 r-band images. A random sam-ple of 100 galaxies with small angular separation was selected totest our method, and the SEXTRACTOR parameters were adjustedto optimize the separation of these galaxies. Specifically, the fol-lowing parameters were changed from their default settings: DE-TECT_MINAREA = 10, DETECT_THRESH = 1.8, and ANAL-YSIS_THRESH = 1.8.
To ensure the robustness of our segmentation maps and the re-sultant CAS measurements, the maps of all galaxies identified asbeing highly asymmetric (A > 0.35, A > S) were visually examined.Out of 1455 highly asymmetric galaxies, 116 were found to havebad segmentation maps, mostly due to poor deblending of galax-ies with small angular separations. The GNU Image ManipulationProgram was used to manually edit the problem of segmentationmaps pixel by pixel to ensure that they accurately mapped out thetarget galaxies. CAS measurements were then obtained for galaxieswith the corrected segmentation maps. Of the 116 potentially highlyasymmetric galaxies with bad segmentations maps, 26 continued tohave A > 0.35 and A > S with the corrected maps. Example imagesare shown in Fig. 1, comparing an original SDSS map, an initialSEXTRACTOR map, and a manually corrected map.
The photometry used for the stellar mass estimates (Hill et al.2011; Taylor et al. 2011) makes use of SEXTRACTORs auto photome-try. These segmentation maps have not been manually examined orcorrected, although the resultant photometry should not be nearlyas affected by bad maps as CAS measurements are. In most cases,even when close pairs are not properly deblended, the galaxy centre
MNRAS 445, 1157–1169 (2014)
at The L
ibrary on May 17, 2016
http://mnras.oxfordjournals.org/
Dow
nloaded from

1160 K. R. V. Casteels et al.
Figure 1. Example of an SDSS r-band image compared to the different segmentation maps. The public SDSS map covers two clearly separate galaxies witha single segmentation profile. The raw SEXTRACTOR map does a better job of separating the galaxies, but the profile of the lower galaxy partly covers the centreof the upper galaxy, leading to a non-physical CAS measurement. The manually corrected segmentation map realistically separates the galaxies and results ina correspondingly robust CAS measurement.
will be correctly identified. The photometry is based on a flexi-ble, elliptical aperture and as long as the centre and approximatelight distribution are known, the resultant photometry should bereasonable.
3 M E T H O D A N D R E S U LT S
3.1 Definitions
The main objective of this study is to estimate the mass-dependentgalaxy merger rate. To do so, we first need to measure the numberof highly asymmetric merger candidate galaxies (NA) as a functionof mass as follows:
NA =NT∑i=1
ni(A > 0.35; A > S), (3)
where NT is the total number of galaxies in each stellar mass bin,with ni(A > 0.35; A > S) = 1 if a given galaxy meets the criteriaA > 0.35 and A > S, and 0 otherwise. Galaxies with A > 0.35 andA > S are referred to as highly asymmetric, while those that do notmeet these criteria are referred to as non-asymmetric. The fractionof all highly asymmetric galaxies as a function of mass (fasym) isfound as follows:
fasym = NA
NT. (4)
The actual number of major merger galaxies (Nm) is found asfollows:
Nm = NAftmfA4:1
fam, (5)
where ftm is the fraction of highly asymmetric galaxies which aretruly mergers, fA4:1 is the fraction of highly asymmetric galaxieswhich are caused by major mergers with mass ratios <4:1, and fam
is the fraction of mergers which become highly asymmetric duringthe merger process. ftm is determined by visually examining all ofthe merger candidate galaxies and is discussed in Section 3.3, whilefA4:1 is measured in Section 3.4. In this work, we assume that allgalaxies become highly asymmetric at some point in the merger pro-cess, so fam = 1. Although it is possible that in some high mass ratiomergers the low-mass companion will become highly asymmetricwhile the high-mass companion will not, we statistically correct themerger fraction to select only major mergers, so the assumption thatfam = 1 is still reasonable.
Following the definition in Conselice (2006), the fraction ofgalaxies in major mergers is given by
fmajor = Nmκ
NT + (κ − 1)Nm, (6)
where κ is the average number of galaxies which merged to produceNm. In Conselice (2006), it was argued that κ must be ≥2, but that isnot necessarily true. As we will show in Section 3.4, a small fractionof highly asymmetric galaxies are found in pairs, and in situationswhere both paired galaxies are highly asymmetric, κ < 2. Thus, wedefine κ as follows:
κ = 2 − NPAA/NA, (7)
where NPAA is the number of paired galaxies where both membersare highly asymmetric. The merger rate per galaxy (Rmerger) can thenbe calculated as
Rmajor = fmajor
Tmerger,A, (8)
where Tmerger, A is the time-scale over which merging galaxies areobserved to have A > 0.35 and A > S. As we will discuss further inSection 4.1, Tmerger, A is a strong function of the mass ratios, masses,and gas fractions of the merging galaxies. The comoving volumemerger rate is defined as
�major = fmajor × φ
Tmerger,A, (9)
where φ is the comoving number density of galaxies in a givenmass bin. Note that this is inverse of the notation used in Conselice(2006), but the same as Hopkins et al. (2010a).
3.2 Mass-dependent asymmetry fraction
In Fig. 2, the fraction of galaxies which are asymmetric,fasym, is shown as a function of mass for systems with108.0 < M∗ < 1011.5 M�. Within 1010.0 < M∗ < 1011.5 M�, wesee that fasym is constant at ∼1.2 per cent but for M∗ < 1010.0 M�the fraction increases significantly, up to ∼9 per cent for108.0 < M∗ < 109.0 M�. The errors given for the mean asymme-try measurements are standard errors in the mean, while jackknifeerrors are given for asymmetry fraction measurements.
The complete sample used in this study (0.001 < z < 0.2) beginsto become significantly mass incomplete for the reddest galaxieswith M∗ < 1010.0 M�, which is also the mass where the strongincrease in the merger fraction begins (black solid line in Fig. 2). Atthe same time, red, low-mass galaxies are much less common than
MNRAS 445, 1157–1169 (2014)
at The L
ibrary on May 17, 2016
http://mnras.oxfordjournals.org/
Dow
nloaded from

Refining the galaxy merger rate 1161
Figure 2. The mass-dependent asymmetry fraction (fasym) is plotted fortwo different redshift ranges. The solid black line represents fasym for0.001 < z < 0.2 and the red dashed line represents fasym for 0.001 < z < 0.05.No highly asymmetric galaxies were detected for M∗ > 1010.5 M� in the0.001 < z < 0.05 range sample.
blue, low-mass galaxies, so it is not immediately clear how muchof an effect this mass incompleteness has on the measurement ofthe asymmetry fraction.
To test this, we select a sample of galaxies which is ∼95 per centmass complete for M∗ > 108.0 M� by restricting the redshift rangeto 0.001 < z < 0.05 (Taylor et al. 2011) resulting in a sample of5066 galaxies. The red dashed line in Fig. 2 represents the fractionof galaxies with A > 0.35 and A > S for this smaller sample as afunction of mass. Despite the smaller sample size, it is clear thatthe fraction of highly asymmetric galaxies increases strongly forM∗ < 1010.0 M�, indicating that the mass incompleteness of the0.001 < z < 0.2 sample is not significantly contributing to theincreased fraction of highly asymmetric low-mass galaxies.
3.3 Visual checking for non-merger systems
All galaxies with A > 0.35 and A > S were visually examined todetermine the contamination of non-merger systems to fasym(M∗),which we define as ftm (Section 3.1). Otherwise, undisturbed galax-ies can be scattered to higher asymmetries by image noise andartefacts, edge-on galaxies with dust lanes creating apparent breaksand asymmetries, or a foreground star overlapping a galaxy’s lightprofile, often leading to unrealistic segmentation maps and a highasymmetry measurement.
When visually examining the galaxies, a system was consid-ered to be a merger if there were clear signs of tidal debris, tidaltails or bridges, a clearly offset bulge, double nuclei, or generallydisturbed and clearly highly asymmetrical morphology. Galaxieswhich clearly met these criteria were classified as Mergers, whilegalaxies which were clearly symmetrical, and apparently undis-turbed, were classified as Non-Mergers (see Fig. 3). Galaxies whichappeared to be possible mergers but for which a definitive classifi-cation could not be made (often due to image noise and low surfacebrightness) were classified as Maybe. The fraction of true mergerswas then found as follows:
ftm = NMerger + NMaybe/2
NSample±
√ftm × (1 − ftm)
NSample, (10)
where NSample is the sample size, NMerger is the number of galaxiesclassified as a clear merger, and NMaybe is the number of galaxiesclassified as a possible merger. Here we assume that half of thegalaxies classified as Maybe are mergers, although it is likely that
most of these galaxies are in fact mergers, as an attempt was made tobe conservative in classifying galaxies as a Merger. Errors are cal-culated using the normal approximation of the binomial confidenceinterval. The fraction of true mergers, ftm, is shown as a functionof mass in Fig. 4, and the merger classification results are given inTable 1. We find that ftm depends on mass and decreases towardslower masses. The data in Fig. 4 are fitted using the least-squaresMarquardt–Levenberg algorithm with a linear fit of the form
ftm = m × log10(M∗/M�) + b, (11)
where m = 0.077 ± 0.010 and b = 0.738 ± 0.009.The average level of contamination within 108.0 < M∗
< 1011.5 M� is ∼70 per cent, which is similar to the findings of DePropris et al. (2007), who found that ∼20 per cent of the galaxiesthey selected as being highly asymmetric were false identifications,although their sample consists of more massive galaxies, whichexplains their lower contamination level.
3.4 Separating major and minor mergers
In this section, we investigate the nature of highly asymmetricgalaxies in the nearby universe and determine what fraction ofhighly asymmetric galaxies are produced through major versus mi-nor mergers. This is an outstanding question, as we still do notknow for certain the mass range which produces highly asymmet-ric galaxies, which is vital to understand if we are to apply thistechnique in other samples.
The CAS method is known to primarily identify major mergers,but can also identify minor mergers if the progenitor galaxies’ gasfractions are high enough (Lotz et al. 2010b). In the later stagesof a merger, when the merging galaxies are completely fused, it isdifficult to determine the masses of the progenitors. On the otherhand, it is possible to know their masses while they are still separatedin close pairs. We will now take a detailed look at the effect that themasses and mass ratios of galaxy pairs have on their asymmetry,as well as determine the separation where paired galaxies becomehighly asymmetric. We then use this information to calculate thefraction of highly asymmetric galaxies that are due to major mergers.
3.4.1 The dependence of asymmetry on pair separation, mass,and mass ratio
In order to determine the projected separation where companionsproduce highly asymmetric galaxies, we look at how the meanasymmetry of dynamically close paired galaxies changes as a func-tion of projected physical and relative separation, mass, and massratio. In Casteels et al. (2013), it was found that paired galax-ies show little signs of interaction for rmax > 120 h−1
70 kpc and�V > 500 km s−1. In order to select pairs which are not interacting,as well as find at what projected separation galaxy pairs begin tobecome highly asymmetric, pairs are selected up to a projected sep-aration of rmax = 300 h−1
70 kpc. A maximum line-of-sight velocitydifference of �V < 500 km s−1 is used to clearly see the transi-tion between strongly interacting and non-interacting galaxies withdecreasing separation.
The mean value of A is found for each mass and rp bin as follows:
A(rp,M) = 1
N
N∑i=1
Ai , (12)
where N is the number of galaxies in a given rp and mass bin.
MNRAS 445, 1157–1169 (2014)
at The L
ibrary on May 17, 2016
http://mnras.oxfordjournals.org/
Dow
nloaded from

1162 K. R. V. Casteels et al.
Figure 3. Examples of galaxies classified as Merger, Maybe, and Non-Merger. The galaxy of concern is the one in the centre of each image.
Figure 4. The fraction of galaxies with A > 0.35 and A > S visuallyconfirmed to be mergers as a function of stellar mass. The red dashed linerepresents a constant fit and the green lines represent the 1σ confidenceintervals.
Table 1. Values for the visual checked highly asymmetric galaxies. Eachgalaxy was classified as either Merger, Maybe, or Non-Merger. The frac-tion of highly asymmetric galaxies visually confirmed to be mergers isgiven by ftm which is defined in equation (10).
log(M∗/M�) NA NMerger NMaybe NNon−Merg ftm
8.25 72 25 41 6 0.63 ± 0.068.75 248 90 142 16 0.65 ± 0.039.25 399 167 209 23 0.68 ± 0.029.75 279 135 119 25 0.70 ± 0.0310.25 201 117 66 18 0.75 ± 0.0310.75 102 72 24 6 0.82 ± 0.0411.25 19 14 5 0 0.87 ± 0.08
In Fig. 5, A is shown against physical projected separation forpaired galaxies with mass ratios of <4:1 for a given mass bin.Both members of the pair are included in the calculation of A andeach mass bin includes a mix of heavy and light members fromdifferent pairs. Galaxies in the 1011.0 < M∗ < 1011.5 M� bin showan increase in mean asymmetry for rp < 35 h−1
70 kpc, while the
MNRAS 445, 1157–1169 (2014)
at The L
ibrary on May 17, 2016
http://mnras.oxfordjournals.org/
Dow
nloaded from

Refining the galaxy merger rate 1163
Figure 5. Mean A of major merger pairs versus physical projected sep-aration for a range of masses. These masses correspond to the masses ofthe individual pair members, and can be either the heavy or light mem-ber. Higher mass pairs are becoming highly asymmetric at larger physicalseparations than lower mass pairs.
Figure 6. The mean asymmetry of major merger pairs is plotted versusrelative projected separation, where the physical separation is divided bythe sum of the Petrosian 90 galaxy radii (rp/(r1 + r2)). These massescorrespond to the masses of the individual pair members, and can be eitherthe heavy or light member. All pairs are becoming highly asymmetric as thesame relative separation of rp < (r1 + r2).
1010.5 < M∗ < 1011.0 M� and 1010.0 < M∗ < 1010.5 M� bins showincreases for rp < 25 h−1
70 kpc and rp < 20 h−170 kpc, respectively.
This indicates that the high-mass major merger pairs are highlyasymmetric out to larger physical separations than lower mass pairs.The maximum projected separation identified here agrees with theprevious work by De Propris et al. (2007) and Ellison et al. (2010),who find that the fraction of dynamically close highly asymmetricpairs increases significantly for rp < 40 h−1
70 kpc. Although pairs areonly plotted for rp < 100 h−1
70 kpc in Fig. 5, the mean asymmetriesof galaxies at all masses remain flat out to 300 h−1
70 kpc, at whichseparation the galaxies are essentially isolated.
In Fig. 6, the pairs are instead binned by their relative separation(pair separation divided by the sum of the galaxy’s Petrosian 90radii), and we see that the increase in asymmetry is actually occur-ring at the same relative separation of rp < (r1 + r2) for all galaxymasses. This agrees with the finding by Hernandez-Toledo et al.(2005) that asymmetry increases (relative to isolated galaxies) forpairs with separations less than D25, the photometric diameter ofthe primary.
In Fig. 7, the mean asymmetry of the heavy and light pair mem-bers is shown against relative separation (rp/(r1 + r2)) for mass
Figure 7. The mean asymmetry for galaxy pairs of different mass ratiosis plotted versus relative projected separation (rp/(r1 + r2)). Galaxy pairsare selected from the range 108.0 < M∗ < 1011.5 M�, with the red andorange colours representing the heavy member of a pair, and the blue colourrepresenting the lighter member. In major merger pairs, both members be-come highly asymmetric for rp < (r1 + r2). In minor merger pairs, the lightcompanion becomes highly asymmetric while the heavy companion doesnot. Low-mass members of minor merger pairs show an increase in meanasymmetry at larger separations, up to rp < 1.5 × (r1 + r2).
ratio ranges of <4:1, 4:1–10:1, and 10:1–100:1. Here all galaxieshave been included from the range 108.0 < M∗ < 1011.5 M�. For themajor merger pairs (mass ratio of <4:1), both the heavy and lightcompanions have an increased mean asymmetry for rp < (r1 + r2).As mass ratio increases, light pair members continue to have a highmean asymmetry at small relative separations: rp < (r1 + r2) for the4:1–10:1 and up to rp < 1.5 × (r1 + r2) for the 10:1–100:1 massratio pairs. The heavy members of minor merger pairs also show anincrease in mean asymmetry for rp < (r1 + r2), but it is significantlysmaller than that for major merger pairs. This result is important inthat it shows that the increase in asymmetry for close galaxy pairs isoccurring at approximately the same relative separation regardlessof mass ratio.
3.4.2 The asymmetries of non-interacting projected pairs
The fact that the mean asymmetry of galaxy pairs increases at thesame relative separation regardless of mass and mass ratio raisesthe question of whether this increased asymmetry is simply due tocontaminating light from the nearby companion. To test this, wecompare the fraction of dynamically close pairs which are highlyasymmetric (�V < 500 km s−1) with non-interacting projectedpairs which are highly asymmetric (1000 < �V < 10 000 km s−1).For a given range in �V, the fraction of pairs which are highlyasymmetric is defined as
fPasym = NPasym
NPtotal
=∑N
i=1 wθasym∑Ni=1 wθtotal
, (13)
where NPasym is the number of paired galaxies in a projected sepa-ration bin which satisfy A > 0.35 and A > S for a given mass ratiorange, and NPtotal is the total number of pairs for the same separationbin and mass ratio range. wθ is an angular incompleteness weight(see Patton et al. 2000, 2002) which we define as
wθ = Npp/Nmm, (14)
where Npp is the number of photometric pairs in a given angularseparation bin and Nmm is the number of pairs where both galaxieshave mass measurements. Angular separation bins of 1 arcsec are
MNRAS 445, 1157–1169 (2014)
at The L
ibrary on May 17, 2016
http://mnras.oxfordjournals.org/
Dow
nloaded from
1164 K. R. V. Casteels et al.
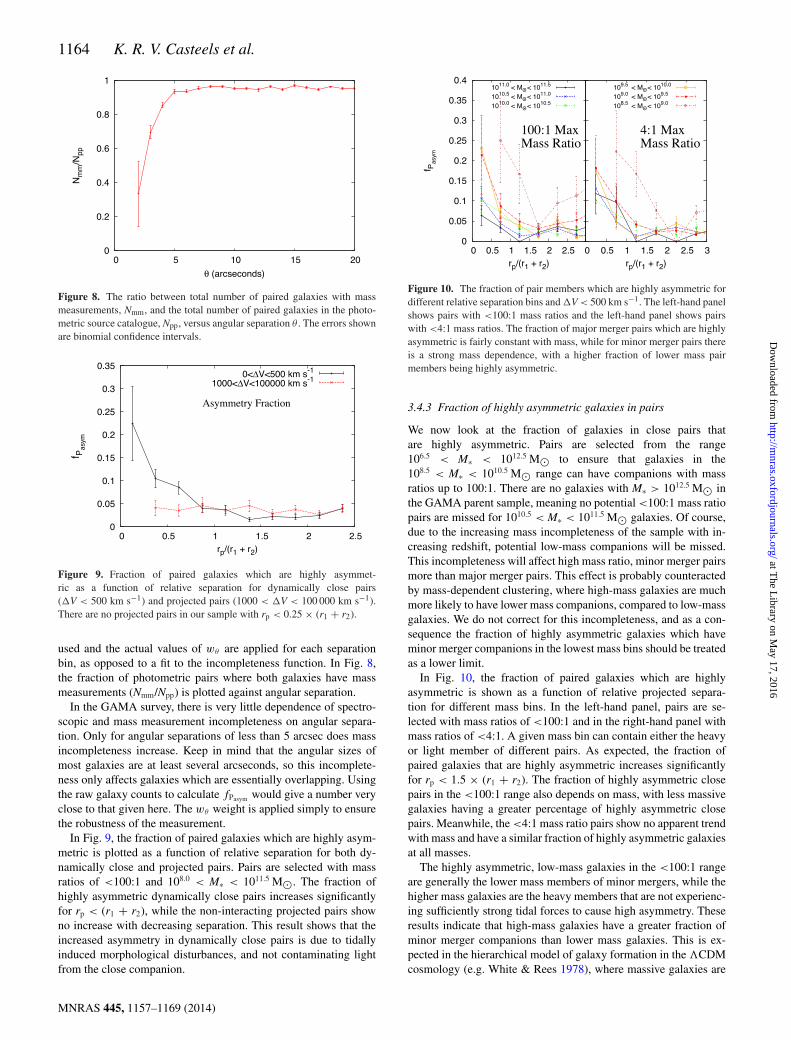
Figure 8. The ratio between total number of paired galaxies with massmeasurements, Nmm, and the total number of paired galaxies in the photo-metric source catalogue, Npp, versus angular separation θ . The errors shownare binomial confidence intervals.
Figure 9. Fraction of paired galaxies which are highly asymmet-ric as a function of relative separation for dynamically close pairs(�V < 500 km s−1) and projected pairs (1000 < �V < 100 000 km s−1).There are no projected pairs in our sample with rp < 0.25 × (r1 + r2).
used and the actual values of wθ are applied for each separationbin, as opposed to a fit to the incompleteness function. In Fig. 8,the fraction of photometric pairs where both galaxies have massmeasurements (Nmm/Npp) is plotted against angular separation.
In the GAMA survey, there is very little dependence of spectro-scopic and mass measurement incompleteness on angular separa-tion. Only for angular separations of less than 5 arcsec does massincompleteness increase. Keep in mind that the angular sizes ofmost galaxies are at least several arcseconds, so this incomplete-ness only affects galaxies which are essentially overlapping. Usingthe raw galaxy counts to calculate fPasym would give a number veryclose to that given here. The wθ weight is applied simply to ensurethe robustness of the measurement.
In Fig. 9, the fraction of paired galaxies which are highly asym-metric is plotted as a function of relative separation for both dy-namically close and projected pairs. Pairs are selected with massratios of <100:1 and 108.0 < M∗ < 1011.5 M�. The fraction ofhighly asymmetric dynamically close pairs increases significantlyfor rp < (r1 + r2), while the non-interacting projected pairs showno increase with decreasing separation. This result shows that theincreased asymmetry in dynamically close pairs is due to tidallyinduced morphological disturbances, and not contaminating lightfrom the close companion.
Figure 10. The fraction of pair members which are highly asymmetric fordifferent relative separation bins and �V < 500 km s−1. The left-hand panelshows pairs with <100:1 mass ratios and the left-hand panel shows pairswith <4:1 mass ratios. The fraction of major merger pairs which are highlyasymmetric is fairly constant with mass, while for minor merger pairs thereis a strong mass dependence, with a higher fraction of lower mass pairmembers being highly asymmetric.
3.4.3 Fraction of highly asymmetric galaxies in pairs
We now look at the fraction of galaxies in close pairs thatare highly asymmetric. Pairs are selected from the range106.5 < M∗ < 1012.5 M� to ensure that galaxies in the108.5 < M∗ < 1010.5 M� range can have companions with massratios up to 100:1. There are no galaxies with M∗ > 1012.5 M� inthe GAMA parent sample, meaning no potential <100:1 mass ratiopairs are missed for 1010.5 < M∗ < 1011.5 M� galaxies. Of course,due to the increasing mass incompleteness of the sample with in-creasing redshift, potential low-mass companions will be missed.This incompleteness will affect high mass ratio, minor merger pairsmore than major merger pairs. This effect is probably counteractedby mass-dependent clustering, where high-mass galaxies are muchmore likely to have lower mass companions, compared to low-massgalaxies. We do not correct for this incompleteness, and as a con-sequence the fraction of highly asymmetric galaxies which haveminor merger companions in the lowest mass bins should be treatedas a lower limit.
In Fig. 10, the fraction of paired galaxies which are highlyasymmetric is shown as a function of relative projected separa-tion for different mass bins. In the left-hand panel, pairs are se-lected with mass ratios of <100:1 and in the right-hand panel withmass ratios of <4:1. A given mass bin can contain either the heavyor light member of different pairs. As expected, the fraction ofpaired galaxies that are highly asymmetric increases significantlyfor rp < 1.5 × (r1 + r2). The fraction of highly asymmetric closepairs in the <100:1 range also depends on mass, with less massivegalaxies having a greater percentage of highly asymmetric closepairs. Meanwhile, the <4:1 mass ratio pairs show no apparent trendwith mass and have a similar fraction of highly asymmetric galaxiesat all masses.
The highly asymmetric, low-mass galaxies in the <100:1 rangeare generally the lower mass members of minor mergers, while thehigher mass galaxies are the heavy members that are not experienc-ing sufficiently strong tidal forces to cause high asymmetry. Theseresults indicate that high-mass galaxies have a greater fraction ofminor merger companions than lower mass galaxies. This is ex-pected in the hierarchical model of galaxy formation in the �CDMcosmology (e.g. White & Rees 1978), where massive galaxies are
MNRAS 445, 1157–1169 (2014)
at The L
ibrary on May 17, 2016
http://mnras.oxfordjournals.org/
Dow
nloaded from

Refining the galaxy merger rate 1165
Figure 11. The fraction of highly asymmetric galaxies with a close com-panion (rp < (r1 + r2)) as a function of mass. Higher mass asymmetricgalaxies are much more likely to have a close companion than lower massasymmetric galaxies.
built up through mergers and large galaxies are predicted to havenumerous smaller companions, which they will eventually mergewith due to a loss of orbital momentum through dynamical friction.
We now look at what fraction of highly asymmetric galaxies havea close companion with rp < 1.5 × (r1 + r2). In Fig. 11, the fractionof highly asymmetric galaxies which have a companion is shownas a function of mass. Around half of the highest mass asymmetricgalaxies have a companion, indicating that about half of the ob-servability time-scale of high asymmetry (Tmerge, A) is spent duringclose passes. For the lowest mass highly asymmetric galaxies, onlyabout ∼3 per cent have a companion, indicating that these galaxiesspend a greater fraction of Tmerge, A in merger proper and post-mergerthan higher mass galaxies. Longer observability time-scales are ex-pected for low-mass galaxies in the final stages of the merger processdue to their much higher gas fractions, as discussed in detail in Sec-tion 4.1. Additionally, in Section 3.3 the contamination of highlyasymmetric galaxies with non-merging systems was found to in-crease with decreasing mass over the range 108.0 < M∗ < 1011.5 M�from approximately ∼15 per cent to ∼40 per cent. These two ef-fects together account for the increase in highly asymmetric pairedgalaxies with mass. Note that for most of these pairs, only one ofthe galaxies is actually highly asymmetric.
We now determine the number of <4:1 mass ratio paired galaxieswith rp < 1.5 × (r1 + r2), where both members are highly asym-metric, NPAA . Using equation (7), we calculate the value of κ , whichtells us the average number of progenitor galaxies which constitutea typical merger, as detected using the CAS method. As can be seenfrom the values in Table 2, higher mass galaxy pairs are more likelyto have both members being highly asymmetric.
Table 2. Values of κ as a function ofmass, using equation (7).
log(M∗/M�) NA NPAA κ
8.25 72 0 2.0008.75 248 2 1.9929.25 399 2 1.9959.75 279 0 2.00010.25 201 1 1.99510.75 102 1 1.99011.25 19 2 1.895
3.4.4 Fraction of highly asymmetric galaxieswhich are major mergers
The relative number of highly asymmetric galaxies that have a com-panion within an appropriate projected separation gives us informa-tion about the contribution of ongoing major and minor mergersto the highly asymmetric galaxy population. If we assume that thefraction of highly asymmetric pairs that are major mergers, fP4:1 , isrepresentative of the fraction of all highly asymmetric galaxies, fA4:1
(pairs and isolated), that are major mergers, then we can define
fA4:1 = fP4:1 . (15)
Note that in this section, we only examine those highly asymmetricgalaxies that are in pairs. While a significant fraction of the highlyasymmetric galaxies are not in pairs, the idea here is that the samefraction of minor versus major mergers that produces an asymmetry(as seen in a pair) is similar to the fraction of systems that havealready merged. The fraction of highly asymmetric galaxies in closepairs will contain two populations: (i) those for which the pair isinteracting and causing the high asymmetry and (ii) those for whichthere is an ongoing merger in addition to the likely future merging ofthe pair. Due to the relatively low occurrence of multimergers (Darget al. 2011), for small separations most of the galaxies will be fromthe first population, and fP4:1 should provide a good approximationof the fraction of all highly asymmetrical galaxies that are majormergers, fA4:1 .
For each galaxy that satisfies A > 0.35 and A > S, close compan-ions are identified where rp < 1.5 × (r1 + r2) and �V < 500 km s−1,with maximum mass ratios of <4:1 (major mergers) and <100:1(major and minor mergers). These galaxies are assumed to givethe fraction of highly asymmetric paired galaxies that are majormergers and it is defined as
fP4:1 = NP4:1
NP100:1
=∑N
i=1 wθ (< 4 : 1)∑Ni=1 wθ (< 100 : 1)
, (16)
where NP4:1 and NP100:1 are the number of paired galaxies in eachmass bin that satisfy A > 0.35 and A > S for the given massratio range and wθ is an angular incompleteness weight defined byequation (14).
The fraction of these pairs that are major mergers is shownin Fig. 12, where the data are fitted with the least-squares
Figure 12. The fraction of highly asymmetric rp < 1.5 × (r1 + r2) pairswhich have mass ratios of <4:1 is plotted as a function of mass. The reddashed line represents a linear regression fit to the data and the green dashedlines represent the 1σ confidence intervals determined through a MonteCarlo iterative method.
MNRAS 445, 1157–1169 (2014)
at The L
ibrary on May 17, 2016
http://mnras.oxfordjournals.org/
Dow
nloaded from
1166 K. R. V. Casteels et al.
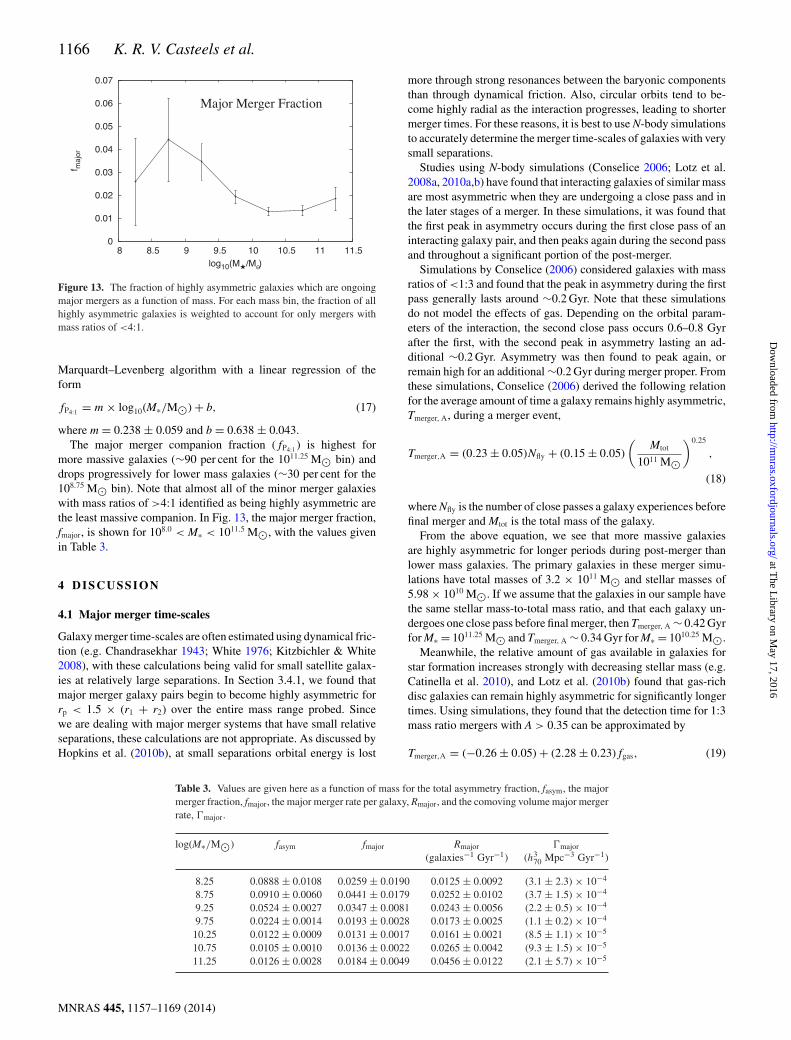
Figure 13. The fraction of highly asymmetric galaxies which are ongoingmajor mergers as a function of mass. For each mass bin, the fraction of allhighly asymmetric galaxies is weighted to account for only mergers withmass ratios of <4:1.
Marquardt–Levenberg algorithm with a linear regression of theform
fP4:1 = m × log10(M∗/M�) + b, (17)
where m = 0.238 ± 0.059 and b = 0.638 ± 0.043.The major merger companion fraction (fP4:1 ) is highest for
more massive galaxies (∼90 per cent for the 1011.25 M� bin) anddrops progressively for lower mass galaxies (∼30 per cent for the108.75 M� bin). Note that almost all of the minor merger galaxieswith mass ratios of >4:1 identified as being highly asymmetric arethe least massive companion. In Fig. 13, the major merger fraction,fmajor, is shown for 108.0 < M∗ < 1011.5 M�, with the values givenin Table 3.
4 D ISCUSSION
4.1 Major merger time-scales
Galaxy merger time-scales are often estimated using dynamical fric-tion (e.g. Chandrasekhar 1943; White 1976; Kitzbichler & White2008), with these calculations being valid for small satellite galax-ies at relatively large separations. In Section 3.4.1, we found thatmajor merger galaxy pairs begin to become highly asymmetric forrp < 1.5 × (r1 + r2) over the entire mass range probed. Sincewe are dealing with major merger systems that have small relativeseparations, these calculations are not appropriate. As discussed byHopkins et al. (2010b), at small separations orbital energy is lost
more through strong resonances between the baryonic componentsthan through dynamical friction. Also, circular orbits tend to be-come highly radial as the interaction progresses, leading to shortermerger times. For these reasons, it is best to use N-body simulationsto accurately determine the merger time-scales of galaxies with verysmall separations.
Studies using N-body simulations (Conselice 2006; Lotz et al.2008a, 2010a,b) have found that interacting galaxies of similar massare most asymmetric when they are undergoing a close pass and inthe later stages of a merger. In these simulations, it was found thatthe first peak in asymmetry occurs during the first close pass of aninteracting galaxy pair, and then peaks again during the second passand throughout a significant portion of the post-merger.
Simulations by Conselice (2006) considered galaxies with massratios of <1:3 and found that the peak in asymmetry during the firstpass generally lasts around ∼0.2 Gyr. Note that these simulationsdo not model the effects of gas. Depending on the orbital param-eters of the interaction, the second close pass occurs 0.6–0.8 Gyrafter the first, with the second peak in asymmetry lasting an ad-ditional ∼0.2 Gyr. Asymmetry was then found to peak again, orremain high for an additional ∼0.2 Gyr during merger proper. Fromthese simulations, Conselice (2006) derived the following relationfor the average amount of time a galaxy remains highly asymmetric,Tmerger, A, during a merger event,
Tmerger,A = (0.23 ± 0.05)Nfly + (0.15 ± 0.05)
(Mtot
1011 M�
)0.25
,
(18)
where Nfly is the number of close passes a galaxy experiences beforefinal merger and Mtot is the total mass of the galaxy.
From the above equation, we see that more massive galaxiesare highly asymmetric for longer periods during post-merger thanlower mass galaxies. The primary galaxies in these merger simu-lations have total masses of 3.2 × 10¹¹ M� and stellar masses of5.98 × 1010 M�. If we assume that the galaxies in our sample havethe same stellar mass-to-total mass ratio, and that each galaxy un-dergoes one close pass before final merger, then Tmerger, A ∼ 0.42 Gyrfor M∗ = 1011.25 M� and Tmerger, A ∼ 0.34 Gyr for M∗ = 1010.25 M�.
Meanwhile, the relative amount of gas available in galaxies forstar formation increases strongly with decreasing stellar mass (e.g.Catinella et al. 2010), and Lotz et al. (2010b) found that gas-richdisc galaxies can remain highly asymmetric for significantly longertimes. Using simulations, they found that the detection time for 1:3mass ratio mergers with A > 0.35 can be approximated by
Tmerger,A = (−0.26 ± 0.05) + (2.28 ± 0.23)fgas, (19)
Table 3. Values are given here as a function of mass for the total asymmetry fraction, fasym, the majormerger fraction, fmajor, the major merger rate per galaxy, Rmajor, and the comoving volume major mergerrate, �major.
log(M∗/M�) fasym fmajor Rmajor �major
(galaxies−1 Gyr−1) (h370 Mpc−3 Gyr−1)
8.25 0.0888 ± 0.0108 0.0259 ± 0.0190 0.0125 ± 0.0092 (3.1 ± 2.3) × 10−4
8.75 0.0910 ± 0.0060 0.0441 ± 0.0179 0.0252 ± 0.0102 (3.7 ± 1.5) × 10−4
9.25 0.0524 ± 0.0027 0.0347 ± 0.0081 0.0243 ± 0.0056 (2.2 ± 0.5) × 10−4
9.75 0.0224 ± 0.0014 0.0193 ± 0.0028 0.0173 ± 0.0025 (1.1 ± 0.2) × 10−4
10.25 0.0122 ± 0.0009 0.0131 ± 0.0017 0.0161 ± 0.0021 (8.5 ± 1.1) × 10−5
10.75 0.0105 ± 0.0010 0.0136 ± 0.0022 0.0265 ± 0.0042 (9.3 ± 1.5) × 10−5
11.25 0.0126 ± 0.0028 0.0184 ± 0.0049 0.0456 ± 0.0122 (2.1 ± 5.7) × 10−5
MNRAS 445, 1157–1169 (2014)
at The L
ibrary on May 17, 2016
http://mnras.oxfordjournals.org/
Dow
nloaded from

Refining the galaxy merger rate 1167
Figure 14. The observation time-scale models of Conselice (2006, redshort-dashed) and Lotz et al. (2010b, blue long-dashed). The Lotz et al.(2010b) relation (equation 19) is calculated using a linear fit to the Catinellaet al. (2010) mean gas fraction data as a function of mass. Gas fractions areavailable for M∗ > 1010.0 M�, and for lower masses an extrapolation to thisfit is used (violet shaded area). The black solid line represents the combinedobservability time-scale and the vertical green dotted line indicates the masswhere the Lotz et al. (2010b) time-scale goes to zero (as a result of the verylow mean gas fraction at this mass).
where fgas is the relative gas fraction. In these simulations, theprimary galaxies have total masses of 1.2 × 10¹² M� and baryonicmasses of 6.2 × 10¹⁰ M� with a range of stellar-to-gas mass ratios.
Catinella et al. (2010) find that the average [MH I/M∗] gas frac-tions increase from fgas ∼ 0.025 for an M∗ = 1011.25 M� galaxy tofgas ∼ 0.32 for an M∗ = 1010.25 M� galaxy. Using these values inequation (19), we find Tmerger, A ∼ −0.20 Gyr for M∗ = 1011.25 M�,meaning it is not detectable, and increases to Tmerger, A ∼ 0.46 Gyrfor M∗ = 1010.25 M�. Looking at our major merger fractionmeasurement in Fig. 13, it is clear that merging galaxies withM∗ ∼ 1011.25 M� are indeed detected using the A > 0.35 and A > Scriteria, implying that massive galaxies with very low gas fractionsare still being detected using this method. Therefore, the detectabil-ity time-scale as a function of mass is likely a combination of theasymmetry time-scale of the stellar component alone (equation 18)and the gas component/star formation asymmetry time-scale (equa-tion 19). If we assume that we can simply sum these two differ-ent estimates of Tmerger, A to obtain the total detection time-scale,then Tmerger, A ∼ 0.42 Gyr for M∗ = 1011.25 M� and Tmerger, A ∼0.80 Gyr for M∗ = 1010.25 M�.
The Tmerger, A mass-dependent relationships of Conselice (2006)and Lotz et al. (2010b) are shown together in Fig. 14. The Lotz et al.(2010b) relation (equation 19) is calculated using a linear fit to theCatinella et al. (2010) mean gas fraction data as a function of mass.
These equations are probably oversimplifications of the detectiontime-scales for galaxies of different masses, but they illustrate thefact that the gas fraction of a galaxy has a much greater effect onit being detected with A > 0.35 than does its mass alone. Sincegas fraction increases strongly with decreasing mass, lower massgalaxies should be detectable in major mergers for significantlylonger periods of time than their more massive counterparts.
In Fig. 15, the galaxy merger rate is shown as a function of massusing equation (8). We find that an M∗ = 1011.25 M� galaxy expe-riences ∼0.046 major mergers per Gyr while an M∗ = 1010.25 M�galaxy experiences ∼0.016 major mergers per Gyr, implying thatthe major merger rate approximately triples over this mass range(see Table 3).
Figure 15. The galaxy merger rate as a function of stellar mass. The solidblue line represents the merger rate measured in this work, and the predictedmerger rate of Hopkins et al. (2010a) is represented by the red dashed line.
Figure 16. The comoving volume galaxy merger rate as a function of stellarmass. The solid blue line represents the merger rate measured in this work,and the predicted merger rate of Hopkins et al. (2010a) is represented by thered dashed line. The comoving volume densities used here are from Baldryet al. (2012).
In Fig. 16, the comoving volume galaxy merger rate is presentedusing equation (9). The galaxy mass function measurements ofBaldry et al. (2012) are used here, specifically equation 6 fromtheir paper. From this, we estimate that the major merger rate is(1.2 ± 0.5) × 10−3 h3
70 Mpc−3 Gyr−1 for 108.0 < M∗ < 1011.5 M�.
4.2 Detection of minor mergers
Studies which use N-body simulations and do not consider the ef-fects of changing gas fraction (Conselice 2006; Lotz et al. 2010a)find that the CAS system is most sensitive to mergers where thegalaxies are of similar mass (mass ratios of <4:1). In these simu-lations, minor mergers with greater mass ratios were generally notdetected as mergers in CAS, or were for only a very short period oftime compared to major mergers. When the gas fraction of a galaxyis taken into consideration, the picture changes considerably, withLotz et al. (2010b) finding that minor merger events were detectableup to mass ratios of 1:9 or greater. As discussed in the previous sec-tion, galaxy gas fraction increases strongly for lower mass galaxies,and so we would expect minor mergers to be more detectable forlower mass pairs.
MNRAS 445, 1157–1169 (2014)
at The L
ibrary on May 17, 2016
http://mnras.oxfordjournals.org/
Dow
nloaded from

1168 K. R. V. Casteels et al.
In Section 3.4.1, we found that with decreasing pair separationthe low-mass galaxy in a minor merger becomes highly asymmetricwhile the more massive companion shows little change. Addition-ally, the fraction of galaxies identified as being in a major mergerwith a mass ratio of <4:1 decreases progressively towards lowermasses. For 1011.0 < M∗ < 1011.5 M�, ∼85 per cent of the highlyasymmetric galaxies with a companion are in a major merger, whilefor 108.5 < M∗ < 109.0 M� this fraction drops to ∼35 per cent.Of course, the smaller companion in a minor merger is usually de-stroyed by the strong tidal field of the larger galaxy so it is expectedthat it will become highly asymmetric at some point. The high gasfractions of lower mass galaxies also likely prolong and enhancethe high asymmetry in low-mass minor mergers.
4.3 Comparison with other studies and theory
In Section 3.4.4, we found that the major merger fraction is fairlyconstant at ∼1.3–2 per cent within 109.5 < M∗ < 1011.5 M�, andincreases to ∼4 per cent for lower masses. This is consistent with theresult of Bridge et al. (2010), who find a decreasing merger fractionwith increasing mass using visually selected mergers, although thelarge errors on our lower mass data make our measurement uncertainfor M∗ < 109.5 M�. For 109.5 < M∗ < 1011.5 M�, our results agreewell with the low-redshift pair fractions of Patton & Atfield (2008),Domingue et al. (2009), and Xu et al. (2012), who all find a relativelyconstant major merger fraction as a function of mass (or luminosity).In Section 4.1, we argued that lower mass major mergers should bedetectable for significantly longer periods than higher mass majormergers, due to the strong increase in gas fraction with decreasingmass. Therefore, we expect the actual major merger rate at lowredshift to increase with mass. Pair fractions are susceptible tointerloper galaxies, and Patton & Atfield (2008) used an N-bodysimulation to determine that this contamination increases stronglywith decreasing luminosity. If the pair fractions mentioned abovewere corrected for interloper contamination, they would all showa positive increase with mass. The technique used in this papershould be much less susceptible to interlopers due to the use ofmorphological information.
The fraction of wet mergers is known to increase with redshift(e.g. Lin et al. 2008), so galaxies equivalent to the high-mass galax-ies probed in this study would have been more gas rich in the past.At higher redshift, one would expect that the detectability time-scale of massive galaxies using the CAS method should be longer,resulting in a positively increasing merger fraction with mass, asfound by Conselice et al. (2008). The studies of Xu et al. (2004)and Bundy et al. (2009) both find evidence that the pair fractionincreases positively with mass, although the errors in these stud-ies are rather large. These observations support the findings ofHopkins et al. (2010a), who found using semi-empirical modelsthat the absolute merger rates at a fixed mass ratio increase withgalaxy mass.
In Figs 15 and 16, the merger rate per galaxy and the comovingvolume galaxy merger rates are compared to the model predic-tions of Hopkins et al. (2010a, for z = 0) . From these figures,it is clear that our measurements generally agree with the modelpredictions, especially for the lower mass galaxies; however, themodels predict a slightly steeper increase in the galaxy merger ratewith increasing mass compared to our results. The simulations ofLotz et al. (2010b) and Conselice (2006) used only disc galax-ies to calculate the values of Tmerger, A, while in reality, early-type,spheroidal systems dominate the populations of higher mass galax-ies. It is possible that Tmerger, A is significantly shorter for mergers
between spheroidal galaxies compared to disc galaxies, resultingin higher merger rates, particularly for higher mass galaxy popula-tions. For this reason, and because of the difficulty in determiningthe morphological types of progenitor galaxies in advanced merg-ers, no effort was made in this study to subdivide the galaxy mergerrates based on morphology. Future work determining what effectthe progenitor galaxy’s morphologies have on Tmerger, A is clearlyneeded. In light of this, the merger rates presented here are likelylower limits, especially for higher mass, spheroidally dominatedpopulations.
As mentioned previously, galaxies selected using the CASmethod are predominantly undergoing a close pass or in post-merger. Therefore, the merger fraction obtained using this methodmisses most of the galaxies which are between close passes and at alarge relative separation, although our estimate of the major mergerrate accounts for these missed galaxies statistically. In Casteels et al.(2013), it was found that galaxies with very loose tidal arms can beidentified with a companion up to ∼120 h−1
70 kpc. Similarly, Pattonet al. (2013) find evidence of interaction enhanced star formationup to ∼150 h−1
70 kpc. Such galaxies are likely near their maximumseparation between their first and second close passes. In order toobtain a definitive measurement of the mass-dependent merger rate,a combination of different methods will need to be used to identifyall merging galaxies, at all stages of the merger process. Futurepair studies will need to accurately account for interloper pairs as afunction of mass, while studies which use morphological methods,such as this one, will need to correctly estimate the effect which gasfraction, mass, and morphology have on the merger detectabilitytime-scales.
5 C O N C L U S I O N S
We study 1470 highly asymmetric galaxies, 142 of which are invery close pairs, as seen in the combination of GAMA data andSDSS imaging. We analyse these data together to derive propertiesof the nearby merging population. Our major results include thefollowing.
(i) Galaxy pairs at all masses and mass ratios are found to show asignificant increase in asymmetry for rp < 1.5 × (r1 + r2). In majormergers with mass ratios of <4:1, both galaxies in a pair show astrong increase in asymmetry, while for minor mergers with massratios greater than 4:1, the lower mass companion becomes highlyasymmetric, while the larger galaxy is much less affected.
(ii) The fraction of highly asymmetric galaxies identi-fied as being in a major merger pair (with mass ratiosof <4:1) decreases progressively towards lower masses. For1011.0 < M∗ < 1011.5 M�, ∼85 per cent of the highly asymmet-ric galaxies with a companion are in a major merger, while for108.5 < M∗ < 109.0 M� this fraction drops to ∼35 per cent.
(iii) We find that the major merger fraction is fairly constantat ∼1.3–2 per cent within 109.5 < M∗ < 1011.5 M� and increasesto ∼4 per cent at lower masses. We argue that lower mass majormergers should be detectable for significantly longer periods thanhigher mass major mergers, due to the strong increase in galaxy gasfraction with decreasing mass. The major merger rate is found toincrease with increasing mass, approximately tripling over the massrange probed, rising from 0.013 ± 0.009 mergers galaxy−1 Gyr−1
at M∗ ∼ 108.25 M� to 0.046 ± 0.012 mergers galaxy−1 Gyr−1
at M∗ ∼ 1011.25 M� The total comoving volume major mergerrate for 108.0 < M∗ < 1011.5 M� is calculated as (1.2 ± 0.5) ×10−3 h3
70 Mpc−3 Gyr−1.
MNRAS 445, 1157–1169 (2014)
at The L
ibrary on May 17, 2016
http://mnras.oxfordjournals.org/
Dow
nloaded from

Refining the galaxy merger rate 1169
AC K N OW L E D G E M E N T S
KRVS would like to thank the Science and Technology FacilitiesCouncil (STFC) for providing funding for this project, as well asthe Government of Catalonia for a research travel grant (ref. 2010BE-00268) to begin this project at the University of Nottingham. PNacknowledges the support of the Royal Society through the awardof a University Research Fellowship and the European ResearchCouncil, through receipt of a Starting Grant (DEGAS-259586).
GAMA is a joint European-Australasian project based arounda spectroscopic campaign using the Anglo-Australian Telescope.The GAMA input catalogue is based on data taken from the SloanDigital Sky Survey and the UKIRT Infrared Deep Sky Survey.Complementary imaging of the GAMA regions is being obtained bya number of independent survey programs including GALEX MIS,VST KiDS, VISTA VIKING, WISE, Herschel-ATLAS, GMRT andASKAP providing UV to radio coverage. GAMA is funded by theSTFC (UK), the ARC (Australia), the AAO, and the participatinginstitutions. The GAMA website is http://www.gama-survey.org/.
R E F E R E N C E S
Baldry I. K. et al., 2010, MNRAS, 404, 86Baldry I. K. et al., 2012, MNRAS, 421, 621Barnes J. E., Hernquist L. E., 1991, ApJ, 370, L65Barnes J. E., Hernquist L., 1996, ApJ, 471, 115Benson A. J., Lacey C. G., Baugh C. M., Cole S., Frenk C. S., 2002, MNRAS,
333, 156Bertin E., Arnouts S., 1996, A&AS, 117, 393Bluck A. F. L., Conselice C. J., Buitrago F., Grutzbauch R., Hoyos C.,
Mortlock A., Bauer A. E., 2012, ApJ, 747, 34Bridge C. R., Carlberg R. G., Sullivan M., 2010, ApJ, 709, 1067Bundy K., Fukugita M., Ellis R. S., Targett T. A., Belli S., Kodama T., 2009,
ApJ, 697, 1369Casteels K. R. V. et al., 2013, MNRAS, 429, 1051Catinella B. et al., 2010, MNRAS, 403, 683Chandrasekhar S., 1943, ApJ, 97, 255Cole S., Lacey C. G., Baugh C. M., Frenk C. S., 2000, MNRAS, 319, 168Colless M. et al., 2001, MNRAS, 328, 1039Conselice C. J., 2003, ApJS, 147, 1Conselice C. J., 2006, ApJ, 638, 686Conselice C. J., Bershady M. A., Jangren A., 2000, ApJ, 529, 886Conselice C. J., Rajgor S., Myers R., 2008, MNRAS, 386, 909Cox T. J., Jonsson P., Somerville R. S., Primack J. R., Dekel A., 2008,
MNRAS, 384, 386Darg D. W., Kaviraj S., Lintott C. J., Schawinski K., Silk J., Lynn S.,
Bamford S., Nichol R. C., 2011, MNRAS, 416, 1745De Propris R., Conselice C. J., Liske J., Driver S. P., Patton D. R., Graham
A. W., Allen P. D., 2007, ApJ, 666, 212De Propris R. et al., 2014, MNRAS, 444, 2200Di Matteo T., Springel V., Hernquist L., 2005, Nature, 433, 604Di Matteo T., Khandai N., DeGraf C., Feng Y., Croft R. A. C., Lopez J.,
Springel V., 2012, ApJ, 745, L29Domingue D. L., Xu C. K., Jarrett T. H., Cheng Y., 2009, ApJ, 695, 1559Driver S. P. et al., 2009, Astron. Geophys., 50, 050000Driver S. P. et al., 2011, MNRAS, 413, 971Ellison S. L., Patton D. R., Simard L., McConnachie A. W., Baldry I. K.,
Mendel J. T., 2010, MNRAS, 407, 1514
Ellison S. L., Mendel J. T., Scudder J. M., Patton D. R., Palmer M. J. D.,2013, MNRAS, 430, 3128
Fakhouri O., Ma C.-P., 2008, MNRAS, 386, 577Fakhouri O., Ma C.-P., Boylan-Kolchin M., 2010, MNRAS, 406, 2267Hernandez-Toledo H. M., Avila-Reese V., Conselice C. J., Puerari I., 2005,
AJ, 129, 682Hill D. T. et al., 2011, MNRAS, 412, 765Hopkins P. F., Hernquist L., Martini P., Cox T. J., Robertson B., Di Matteo
T., Springel V., 2005a, ApJ, 625, L71Hopkins P. F., Hernquist L., Cox T. J., Di Matteo T., Martini P., Robertson
B., Springel V., 2005b, ApJ, 630, 705Hopkins P. F. et al., 2010a, ApJ, 715, 202Hopkins P. F. et al., 2010b, ApJ, 724, 915Hopkins A. M. et al., 2013, MNRAS, 430, 2047Jogee S. et al., 2009, ApJ, 697, 1971Kauffmann G., White S. D. M., Guiderdoni B., 1993, MNRAS, 264, 201Kaviraj S., 2014, MNRAS, 437, L41Kitzbichler M. G., White S. D. M., 2008, MNRAS, 391, 1489Le Fevre O. et al., 2000, MNRAS, 311, 565Lee G.-H., Park C., Lee M. G., Choi Y.-Y., 2012, ApJ, 745, 125Lin L. et al., 2004, ApJ, 617, L9Lin L. et al., 2008, ApJ, 681, 232Liske J., Lemon D. J., Driver S. P., Cross N. J. G., Couch W. J., 2003,
MNRAS, 344, 307Lopez-Sanjuan C. et al., 2011, A&A, 530, A20Lotz J. M., Jonsson P., Cox T. J., Primack J. R., 2008a, MNRAS, 391, 1137Lotz J. M. et al., 2008b, ApJ, 672, 177Lotz J. M., Jonsson P., Cox T. J., Primack J. R., 2010a, MNRAS, 404, 575Lotz J. M., Jonsson P., Cox T. J., Primack J. R., 2010b, MNRAS, 404, 590Lotz J. M., Jonsson P., Cox T. J., Croton D., Primack J. R., Somerville
R. S., Stewart K., 2011, ApJ, 742, 103Mendez-Hernandez H., Magana A. M., Hernandez-Toledo H. M., Valen-
zuela O., 2011, Rev. Mex. Astron. Astrofis. Ser. Conf., 40, 78Mihos J. C., Hernquist L., 1994, ApJ, 431, L9Mihos J. C., Hernquist L., 1996, ApJ, 464, 641Patton D. R., Atfield J. E., 2008, ApJ, 685, 235Patton D. R., Carlberg R. G., Marzke R. O., Pritchet C. J., da Costa L. N.,
Pellegrini P. S., 2000, ApJ, 536, 153Patton D. R. et al., 2002, ApJ, 565, 208Patton D. R., Grant J. K., Simard L., Pritchet C. J., Carlberg R. G., Borne
K. D., 2005, AJ, 130, 2043Patton D. R., Torrey P., Ellison S. L., Mendel J. T., Scudder J. M., 2013,
MNRAS, 433, L59Petrosian V., 1976, ApJ, 209, L1Robotham A. S. G. et al., 2014, preprint (arXiv:1408.1476)Skibba R. A. et al., 2012, MNRAS, 423, 1485Tasca L. A. M. et al., 2014, A&A, 565, A10Taylor E. N. et al., 2011, MNRAS, 418, 1587Torrey P., Vogelsberger M., Genel S., Sijacki D., Springel V., Hernquist L.,
2014, MNRAS, 438, 1985White S. D. M., 1976, MNRAS, 174, 467White S. D. M., Rees M. J., 1978, MNRAS, 183, 341Xu C. K., Sun Y. C., He X. T., 2004, ApJ, 603, L73Xu C. K., Zhao Y., Scoville N., Capak P., Drory N., Gao Y., 2012, ApJ, 747,
85York D. G. et al., 2000, AJ, 120, 1579
This paper has been typeset from a TEX/LATEX file prepared by the author.
MNRAS 445, 1157–1169 (2014)
at The L
ibrary on May 17, 2016
http://mnras.oxfordjournals.org/
Dow
nloaded from