ARTICLE 10.1177/1525822X03259479FIELD …intersci.ss.uci.edu/wiki/pub/23.pdf ·...
32
10.1177/1525822X03259479 ARTICLE FIELD METHODS Stoop / SURVEYING NONRESPONDENTS Surveying Nonrespondents INEKE A. L. STOOP Social and Cultural Planning Office of the Netherlands Nonresponse rates in household surveys in the Netherlands are high. As low re- sponse rates are generally assumed to increase nonresponse bias, doubts have arisen concerning the value of survey research. The costs of fieldwork have substan- tially increased in recent years and will increase even more to compensate for the unfavorable response trends. This article describes a survey in which high response rates were attained and which measures were taken to achieve this. It also studies the differences between respondents who are hard to reach and those who are reluctant to participate in a survey. Additional data from a follow-up survey among refusers cast doubt on the assumption that reluctant respondents are similar to refusers. Keywords: nonresponse; face-to-face surveys; random samples; follow-up survey In the Netherlands, a nonresponse rate of 55% in government face-to-face surveys is not unusual. Low response rates have cast doubt on the value of survey data, not only in academic circles but also among policy makers, poli- ticians, and the general public partly as a result of critical articles in major Dutch newspapers. Deceptive data collection methods have even been pub- licly denounced in parliament. As high response rates are hard to achieve and require large amounts of time and money, Dutch market research organiza- tions increasingly advocate the use of Web-based surveys and access panels composed of cooperative respondents who have promised to regularly fill in questionnaires and thus deliver high response rates (Esomar 2003). Nonresponse, however, though less visible when using access panels, is no less a factor; nonresponses have simply moved to an earlier stage in the pro- cess, namely, the recruitment for these panels. The size of nonresponse error will depend on the rate of nonresponse in a survey and the extent to which nonresponse can be corrected for by weight- ing with sociodemographic variables. De Heer (2000:60–61) winds up a cross-national comparison of fieldwork procedures with the recommenda- tion that to improve response rates and unnecessary variation, persuasion strategies must be improved in the Netherlands and the professionalism of the interview corps and the support and supervision of the interviewers must Field Methods, Vol. 16, No. 1, February 2004 23–54 DOI: 10.1177/1525822X03259479 © 2004 Sage Publications 23
Transcript of ARTICLE 10.1177/1525822X03259479FIELD …intersci.ss.uci.edu/wiki/pub/23.pdf ·...

10.1177/15FIELD METHStoop / SU
25822X03259479 ARTICLEODSRVEYING NONRESPONDENTSSurveying Nonrespondents
INEKE A. L. STOOPSocial and Cultural Planning Office of the Netherlands
Nonresponse rates in household surveys in the Netherlands are high. As low re-sponse rates are generally assumed to increase nonresponse bias, doubts havearisen concerning the value of survey research. The costs of fieldwork have substan-tially increased in recent years and will increase even more to compensate for theunfavorable response trends. This article describes a survey in which high responserates were attained and which measures were taken to achieve this. It also studies thedifferences between respondents who are hard to reach and those who are reluctantto participate in a survey. Additional data from a follow-up survey among refuserscast doubt on the assumption that reluctant respondents are similar to refusers.
Keywords: nonresponse; face-to-face surveys; random samples; follow-up survey
In the Netherlands, a nonresponse rate of 55% in government face-to-facesurveys is not unusual. Low response rates have cast doubt on the value ofsurvey data, not only in academic circles but also among policy makers, poli-ticians, and the general public partly as a result of critical articles in majorDutch newspapers. Deceptive data collection methods have even been pub-licly denounced in parliament. As high response rates are hard to achieve andrequire large amounts of time and money, Dutch market research organiza-tions increasingly advocate the use of Web-based surveys and access panelscomposed of cooperative respondents who have promised to regularly fill inquestionnaires and thus deliver high response rates (Esomar 2003).Nonresponse, however, though less visible when using access panels, is noless a factor; nonresponses have simply moved to an earlier stage in the pro-cess, namely, the recruitment for these panels.
The size of nonresponse error will depend on the rate of nonresponse in asurvey and the extent to which nonresponse can be corrected for by weight-ing with sociodemographic variables. De Heer (2000:60–61) winds up across-national comparison of fieldwork procedures with the recommenda-tion that to improve response rates and unnecessary variation, persuasionstrategies must be improved in the Netherlands and the professionalism ofthe interview corps and the support and supervision of the interviewers must
Field Methods, Vol. 16, No. 1, February 2004 23–54
DOI: 10.1177/1525822X03259479 © 2004 Sage Publications23
be increased. An increase in response rates can be brought about only by sub-stantially increasing fieldwork efforts and thus incurring high costs (De Heer1999). Besides, as Groves and Couper (1998) have shown, even at a responserate of 70%, which is higher than most household surveys in the Netherlandsachieve, a considerable amount of bias is still possible.
This article shows how high response rates were achieved in a follow-upsurvey of refusers, mounted to study bias from nonresponse in a survey spon-sored by the Social and Cultural Planning Office of the Netherlands (SCP).The article also gives an overview of approaches to studying nonresponse asused in this survey. With the available information, the bias due to non-response can be measured by comparing different types of respondents andnonrespondents. The article ends with recommendations for cost-effectivefuture fieldwork.
NONRESPONSE RESEARCH
Enhancing Survey Response
Groves and Couper (1998:31) have developed a conceptual model distin-guishing between factors underlying survey participation:
• factors outside the researchers control such as a booming economy in whichinterviewing is a less attractive job or respondents living in a run-down neigh-borhood, having too tight a schedule, taking care of noisy children, or beingwary and suspicious of governmental meddling;
• factors under the researchers control such as the topic and length of the ques-tionnaire, the number of calls, and the selection and motivation of the inter-viewers; and
• factors related to the interaction between householders and interviewers suchas doorstep behavior, the possibility of coming back at a more opportunemoment or making an appointment, reissuing interviews to other interviewers,and adapting the approach to the characteristics of the interviewee.
Systematically paying attention to these factors underlying survey partici-pation should enhance response rates. Factors outside the researchers controlcannot be controlled but can be taken into account. The interviewer can adaptto neighborhood or household characteristics in preparing for or during theinteraction. On the other hand, some factors seemingly within the researcherscontrol cannot be influenced. Making the questionnaire attractive by chang-ing the topic or reducing the length to five minutes is hardly a viable option.De Heer (2000) suggested several explanations for the low response rates in
24 FIELD METHODS
the Netherlands, some of which are within and some of which are outside theresearchers control.
Factors outside the researchers control are the nonobligatory character ofsurveys, the shortage of labor (which makes it difficult to recruit and retaininterviewers), the negative survey climate, and the emergence of telemarket-ers and address brokers. Factors under the researchers control are a lack ofwell-defined contact strategies, reluctance to reapproach initially noncom-pliant respondents and use refusal conversion, lack of professionalism on thepart of interviewers, and poor supervision and monitoring of interviewers.These inadequacies can clearly be improved. Other factors that can be con-trolled, even when running a longitudinal survey, are design features and, ingeneral, attitude toward respondents (see also Dillman 2000:15). Respect forthe respondent seems to be a central issue in acquiring cooperation. Therespondent is entitled to information on the topic, purpose, and procedures ofthe survey and should be handled with care.
A recent development in the Netherlands may also influence the qualityof fieldwork. The job of interviewer was, until the late 1990s, a low-status,temporary, low-paid job. Due to changing laws and fiscal restrictions, largenumbers of interviewers have now become employees of fieldwork organi-zations. The improved position of interviewers has substantially increasedthe cost of face-to-face research but might also enable the fieldwork organi-zation to introduce and enforce quality criteria that seemed unrealistic in thepast.
Approaches to Study Nonresponse
Groves and Couper (1998:49–51) presented several approaches to study-ing nonresponse, four of which have been used in the 1999 Amenities andServices Utilization Survey (AVO, in Dutch). First, frame data can be used.Sample frames such as population registers often contain information on thesociodemographic characteristics of the intended respondents. StatisticsNetherlands, for instance, draws samples from the population register. Bylinking these registers to a large number of other registers and administrativerecords, a large amount of data is available on nonrespondents and respon-dents with which nonresponse can be analyzed (Te Riele 2002). In the cur-rent study, however, no individual information on sample households wasavailable from registers. What could be used were low-level geographic data-bases, which provided information on the neighborhoods and their population.
A second approach is to study reluctant respondents, based on the as-sumption that reluctant respondents are similar to refusers. Arguments in theliterature suggest, however, that this assumption may be flawed (Guadagnoli
Stoop / SURVEYING NONRESPONDENTS 25
and Cunningham 1989; Lin and Schaeffer 1995). This article will providenew results testing this assumption. Third, observational data can be col-lected on the household and the neighborhood and on the interaction betweeninterviewer and respondent. In general, the interviewer will have to recordinformation on the household and the neighborhood only once. Informationon the interaction and on contact attempts will have to be recorded for everycall. Finally, a survey of nonrespondents can be conducted. This will be ofuse, however, only if the response in such a study is high, which is generallynot the case.
In this article, nonresponse will be studied by using frame data from alow-level geographical database, fieldwork data distinguishing betweenhard-to-reach respondents and reluctant respondents, observational datafrom the interviewers, and data from a follow-up survey with a high responserate among persistent refusers. Other approaches mentioned by Groves andCouper (1998) (i.e., study panel nonrespondents, ask questions about surveyparticipation, and experimental strategies) have not been used in the AVOnonresponse study.
RESPONSE ENHANCEMENT AND DATA COLLECTION
Response Rates in the AVO Survey
As of 1979, data have been collected for the AVO every four years, mea-suring the take-up of a large number of social and cultural amenities andsocial services in connection with household and individual characteris-tics. The sampling strategy is relatively straightforward. A gross sample ofapproximately ten thousand postal addresses is drawn. The interviewer callsin person at the sample addresses. If contact is established with the house-hold, a face-to-face interview of approximately half an hour is conductedwith a knowledgeable adult. Subsequently, the interviewer leaves a long self-completion questionnaire for each member of the household aged six yearsor older. Children aged six to fifteen are given an adapted questionnaire,which might be filled in by a parent. Afterward, the interviewer comes backto collect the questionnaires. In the case of multiple household addresses, upto four families are interviewed. All interviews and questionnaires are inDutch; households in which Dutch is not spoken are excluded (135 in 1999).
The questionnaire comprises background and factual questions almostexclusively (see the appendix for an overview), amounting to about threehundred questions for adults, where one question could consist of a list oftwenty-seven activities or twenty-two complaints and disorders or eleven
26 FIELD METHODS
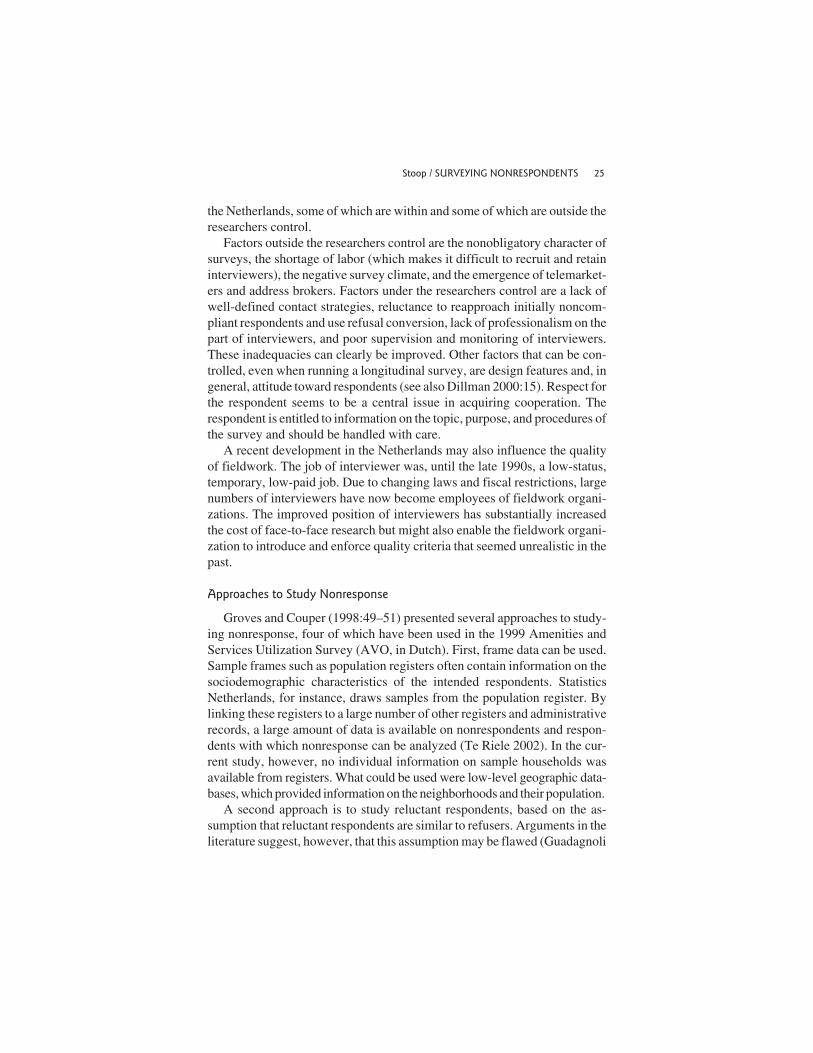
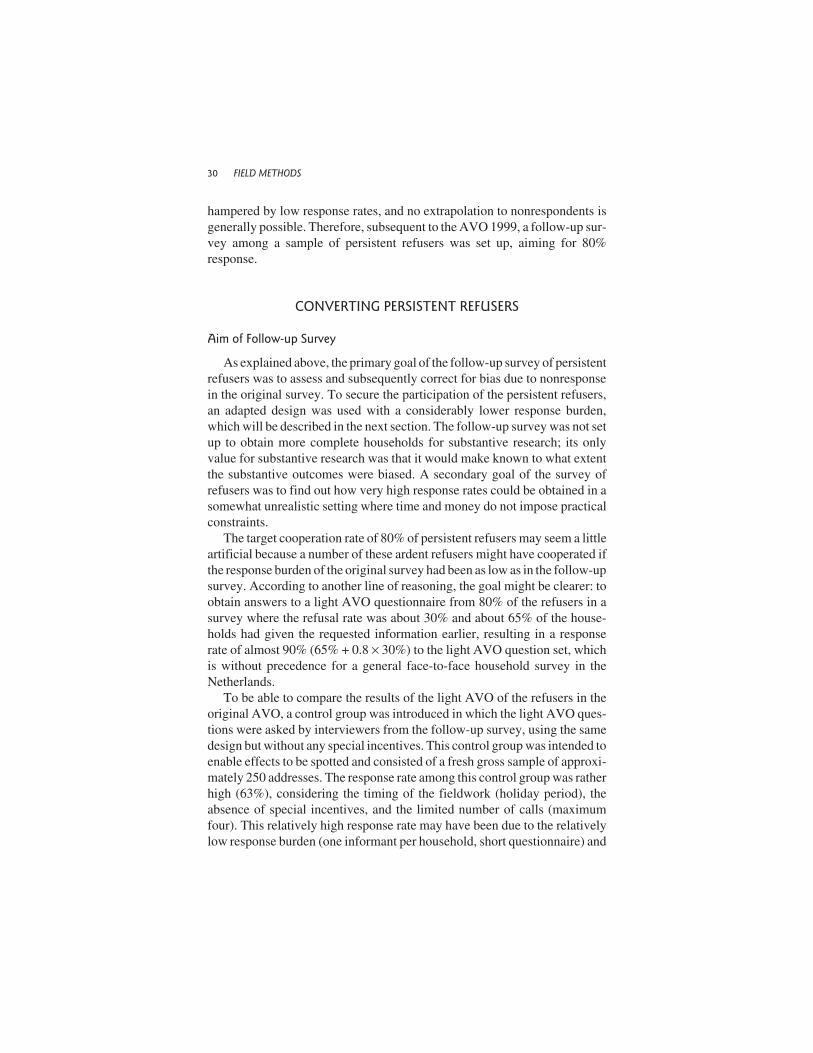
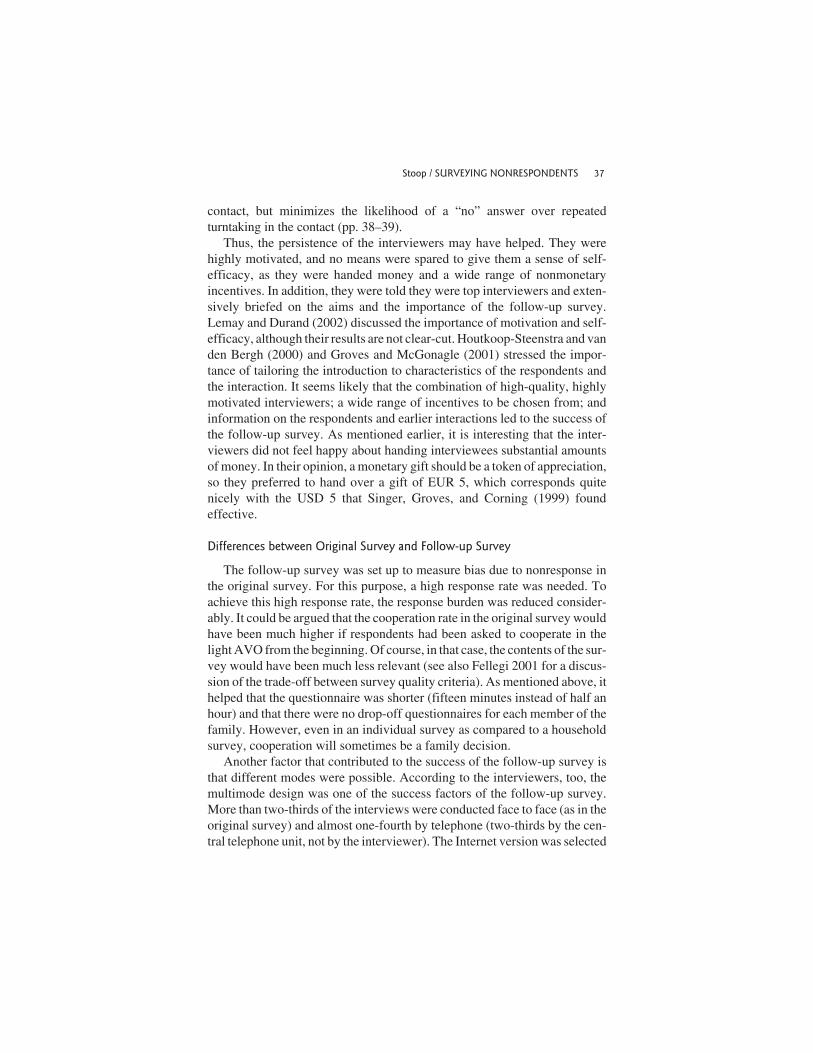
clubs, associations, or societies. Later tests showed that the completion of thepaper-and-pencil questionnaire took between forty-five minutes and onehour. In the first three rounds, response rates in the AVO fluctuated around60%, which is fairly acceptable for a very burdensome survey (see Figure 1).Fieldwork took four to five months, and up to three calls per address weremade. The response rates in 1991 were alarmingly low. In 1995, the field-work was outsourced using a public procurement procedure in which a highresponse rate was a major selection criterion. The organization selected, GfKPanelServices Benelux (GfK), managed to substantially increase responserates.
Response Enhancement in the AVO
In the 1995 AVO survey, response rates were increased by adjusting thesurvey design and by using qualified and experienced interviewers. Thefieldwork organization used an integrated system of response supervision,including a wide range of measures to increase response. These includedmaking a large number of contact attempts and closely monitoring the timingof the calls (time of day, day of the week), noting interviewer characteristics(gender, age, success rate), noting the reason for refusal, and reissuing unsuc-cessful sample units to other interviewers.
Stoop / SURVEYING NONRESPONDENTS 27
0
10
20
30
40
50
60
70
1975 1979 1981 1983 1985 1987 1989 1991 1993 1995 1997 1999 2001
FIGURE 1AVO Survey Response Rates over Time
Shortly before the first contact attempt, an advance letter was sent outtogether with a brochure describing the survey. The original address samplewas enriched, if possible, with respondent names and phone numbers fromthe telephone directory. The names and phone numbers were used to person-alize advance letters and to telephone respondents to make an appointmentafter at least three unsuccessful face-to-face contact attempts. Earlier phonecalls were not allowed on the grounds that a refusal by telephone is easier tomake. Approximately 25% of the gross sample was not listed, either becausethey had no telephone or because they had an unlisted number. They receiveda nonpersonalized advance letter and could not be approached by phone. Thefieldwork was conducted from September 1995 to January 1996. This longperiod made it possible to make appointments with respondents at a time oftheir convenience, to make many calls to reach those not at home, and to reis-sue soft refusals or reluctant respondents to new, more experienced inter-viewers more than once.
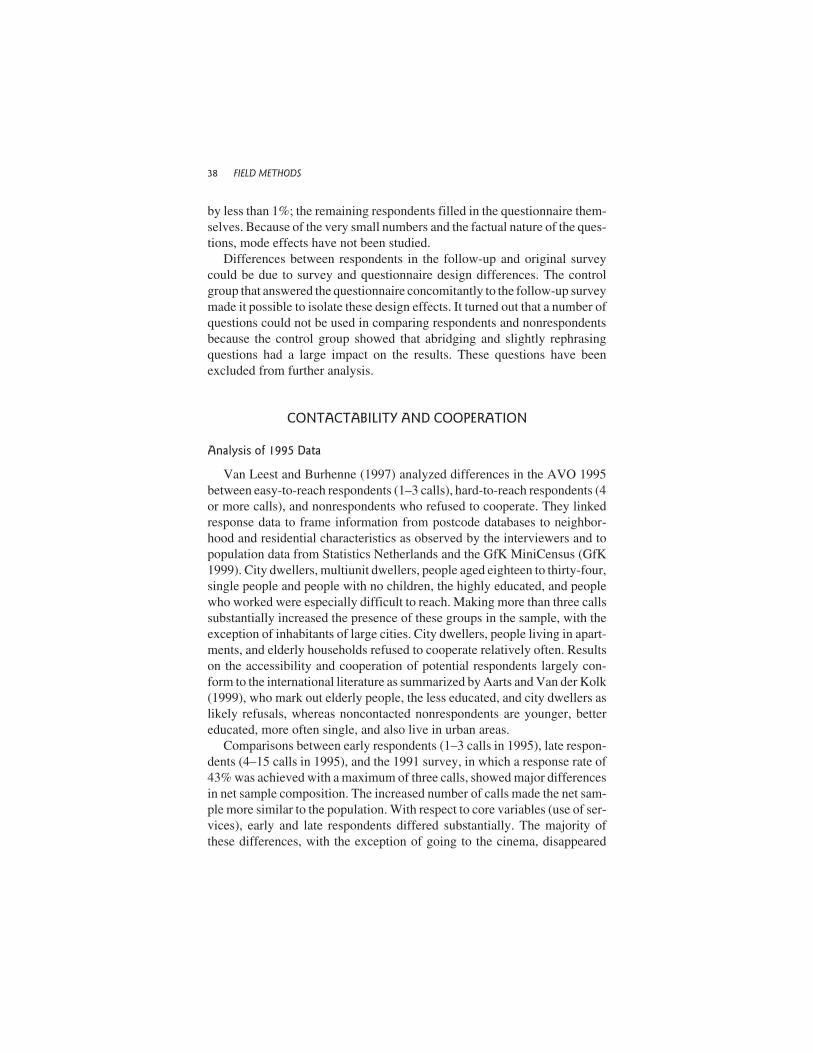
This approach enabled a target response rate of 70% to be achieved in1995 (see Figure 2). In this round, only the total number of calls per respond-ing household had been recorded. This is an imperfect measure of responsepropensity as it may indicate both difficulty of contact and reluctance, requir-ing further visits for refusal conversion purposes. The total number of callsmay also depend on both interviewer behavior and household characteristics(see Lynn, et al. 2002:138). Nonetheless, Figure 2 indicates that responserates might have been as low as 50% in 1995 if the maximum number of callshad been restricted to three, as was quite often the case in the Netherlands. In1991, one of eight households did not cooperate because the interviewer didnot find them at home on one of the three calls allotted to each household. In1995, the noncontacts rate was less than 2%. The percentage of refusals,however, stayed more or less the same, at 25.6% in 1991 compared to 23.6%in 1995. The latter percentage would have been higher without active effortsto achieve refusal conversion.
Response Registration and Data Collection in 1999
In 1999, more detailed contact forms were used, the contact forms werekeyed, and the following characteristics of the sample and the data collectionprocess were recorded
• per address: eligibility (empty dwelling, business or commercial premises),approach by telephone, number of households per address, final outcome (in-eligible, noncontact, incomplete interview, complete set);
• per sample household: characteristics of the neighborhood and the dwelling(building date, high-/low-rise building, state of maintenance of the neighbor-
28 FIELD METHODS

hood and the dwelling, municipality, city center, suburb, type of dwelling, andother characteristics);
• per call: outcome (interview, appointment, not at home, refusal, not able), date,time, age, gender of interviewer; and
• per unsuccessful contact: type of refusal, not able, broken off.
With the information from the contact form, it was possible, among otherthings, to distinguish between ease of contact and reluctance to cooperateand to relate interviewer call behavior to household characteristics (see alsoCampanelli and Purdon 1997).
A response analysis of the 1995 data (see the Analysis of 1995 Datasection below) compared late respondents to early respondents, implicitlyassuming that late respondents are similar to nonrespondents. This can beconsidered as an analysis using a wave or interim design (Goyder 1987:81).As Goyder (1987) stated, this assumption is controversial (see also Grovesand Couper 1998:49; Lynn, et al. 2002:147). The controversy is causedmainly by the relatively large number of unshakable refusals and the bias thatmay result from it. Therefore, in 1999, additional data were collected usingan approach originally discussed by Hansen and Hurwitz (1946), namely, aspecial follow-up survey among refusers. This approach is likewise contro-versial and for a similar reason: Follow-up surveys among refusers are often
Stoop / SURVEYING NONRESPONDENTS 29
0
10
20
30
40
50
60
70
1 2 3 4 5 6 7 8 9 10 11 12 13 14 15 16
1995 1999
FIGURE 2AVO Response Rate per Call Number
hampered by low response rates, and no extrapolation to nonrespondents isgenerally possible. Therefore, subsequent to the AVO 1999, a follow-up sur-vey among a sample of persistent refusers was set up, aiming for 80%response.
CONVERTING PERSISTENT REFUSERS
Aim of Follow-up Survey
As explained above, the primary goal of the follow-up survey of persistentrefusers was to assess and subsequently correct for bias due to nonresponsein the original survey. To secure the participation of the persistent refusers,an adapted design was used with a considerably lower response burden,which will be described in the next section. The follow-up survey was not setup to obtain more complete households for substantive research; its onlyvalue for substantive research was that it would make known to what extentthe substantive outcomes were biased. A secondary goal of the survey ofrefusers was to find out how very high response rates could be obtained in asomewhat unrealistic setting where time and money do not impose practicalconstraints.
The target cooperation rate of 80% of persistent refusers may seem a littleartificial because a number of these ardent refusers might have cooperated ifthe response burden of the original survey had been as low as in the follow-upsurvey. According to another line of reasoning, the goal might be clearer: toobtain answers to a light AVO questionnaire from 80% of the refusers in asurvey where the refusal rate was about 30% and about 65% of the house-holds had given the requested information earlier, resulting in a responserate of almost 90% (65% + 0.8 × 30%) to the light AVO question set, whichis without precedence for a general face-to-face household survey in theNetherlands.
To be able to compare the results of the light AVO of the refusers in theoriginal AVO, a control group was introduced in which the light AVO ques-tions were asked by interviewers from the follow-up survey, using the samedesign but without any special incentives. This control group was intended toenable effects to be spotted and consisted of a fresh gross sample of approxi-mately 250 addresses. The response rate among this control group was ratherhigh (63%), considering the timing of the fieldwork (holiday period), theabsence of special incentives, and the limited number of calls (maximumfour). This relatively high response rate may have been due to the relativelylow response burden (one informant per household, short questionnaire) and
30 FIELD METHODS

to the commitment and dedication of the very motivated group of inter-viewers in the follow-up survey.
Design of Follow-up Survey
In the 1999 AVO, 2,521 householders had told the interviewer they wouldnot (2,339) or could not (182) participate. Of these, 1,063 households hadrefused at least twice. A total of 693 persons had made it abundantly clear thatthey did not want to be interviewed and had not been approached a secondtime. The total group of refusers thus amounted to 1,756 households (765nonrespondents who had refused at least once but who had not been re-approached even though the interviewer had not characterized them as abso-lutely unapproachable). A sample of 350 refusers was drawn from thisgroup. Respondents who had moved were not followed to their new addressas the original sample was based on addresses, and the characteristics of thedwelling and the neighborhood would change after the move, unnecessarilycomplicating the analysis. Of the 350 addresses, 21 were excluded becausethey could not be reached after a great number of calls (12) or were unoccu-pied (5), leaving a net sample of 329 refusers. They were contacted duringthe summer months of 2000.
Key factors in the design were reward, costs, and trust (see Dillman2000:15–21), both toward interviewers and respondents. Highly motivatedinterviewers with a history of high response rates were selected (and toldwhy they were being selected) and trained and received additional monetaryincentives for each successful interview plus an additional bonus if they per-sonally achieved an 80% response rate. Interviewers could spend an averageof approximately EUR 22.50 on each respondent to buy flowers or gifts, payfor respondents’ time, and invite respondents to answer questions in a publicplace. They could spend the money as they deemed fit but were asked toinform the fieldwork organization if a strategy was successful, so it could berecommended in a newsletter. The costs of the interviewers were high, asthey made extraordinary efforts to contact and persuade their respondents.
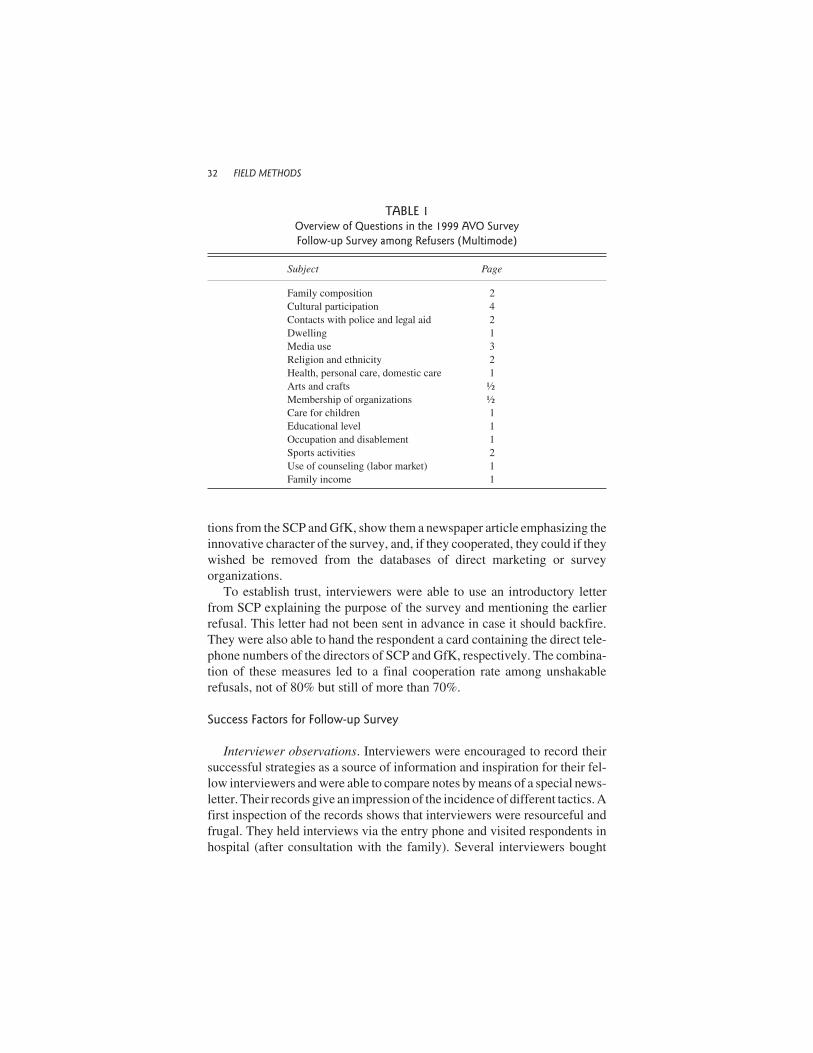
The costs of the respondents for cooperation were minimized. Only oneadult per household was approached with a subset of the original AVO ques-tions (see Table 1) pertaining to background, use of services, and issues pre-sumed to be related to response behavior (religious affiliation, networks, vol-untary work). The household representative also had to answer a smallnumber of questions concerning other household members. Respondentscould answer face to face, by telephone or Internet, or fill in a paper-and-pencil version. A wide range of rewards was available. As explained above,interviewers could and did give them tangible rewards, give them publica-
Stoop / SURVEYING NONRESPONDENTS 31
tions from the SCP and GfK, show them a newspaper article emphasizing theinnovative character of the survey, and, if they cooperated, they could if theywished be removed from the databases of direct marketing or surveyorganizations.
To establish trust, interviewers were able to use an introductory letterfrom SCP explaining the purpose of the survey and mentioning the earlierrefusal. This letter had not been sent in advance in case it should backfire.They were also able to hand the respondent a card containing the direct tele-phone numbers of the directors of SCP and GfK, respectively. The combina-tion of these measures led to a final cooperation rate among unshakablerefusals, not of 80% but still of more than 70%.
Success Factors for Follow-up Survey
Interviewer observations. Interviewers were encouraged to record theirsuccessful strategies as a source of information and inspiration for their fel-low interviewers and were able to compare notes by means of a special news-letter. Their records give an impression of the incidence of different tactics. Afirst inspection of the records shows that interviewers were resourceful andfrugal. They held interviews via the entry phone and visited respondents inhospital (after consultation with the family). Several interviewers bought
32 FIELD METHODS
TABLE 1Overview of Questions in the 1999 AVO SurveyFollow-up Survey among Refusers (Multimode)
Subject Page
Family composition 2Cultural participation 4Contacts with police and legal aid 2Dwelling 1Media use 3Religion and ethnicity 2Health, personal care, domestic care 1Arts and crafts ½Membership of organizations ½Care for children 1Educational level 1Occupation and disablement 1Sports activities 2Use of counseling (labor market) 1Family income 1

flowers, sometimes spending as little as EUR 2.50. A second finding of inter-est was that some respondents were very easily accessible and had no prob-lem at all with being interviewed. From the contact forms, it appears that inalmost 70% of the successful approaches, motivation was used, and that inslightly more than 70% of the cases, monetary incentives were given, rang-ing from EUR 5 to 35, with the average being EUR 15 and generally in theform of gift tokens. Sometimes money was paid into the account of therespondents; sometimes lottery tickets were given. In a small number ofcases, for instance, if the interview was administered by telephone, the inter-viewer called on the respondent with a gift voucher even if no money hadbeen promised earlier. Of the interviews, 70% were conducted face to face,20% by telephone, 8% by paper and pencil, and only 1% via the Internetquestionnaire. Ten percent of the respondents asked to be removed fromdatabases so as to be free from further interviews and telemarketing in thefuture. Of those who refused to cooperate in the follow-up survey, thirty-seven (one-third) agreed to be interviewed by telephone after a call back bythe telephone unit from the organization. Reasons for noncooperation wereobjections of principle and sometimes illness or the recent death of a partner.Remarks by interviewers on their (unsuccessful) efforts to persuade respon-dents to cooperate sometimes betray astonishment: “How can someone notrespond in this survey when cooperation is so profitable?”
Focus groups. Three focus groups consisting of twenty-four of the thirtyinterviewers discussed the follow-up survey, interviewer tactics, and non-respondent characteristics. The interviewers had liked the follow-up survey,especially as they had almost reached the target. Several wondered whyrefusers had not cooperated in the regular survey, as a considerable propor-tion of their allotment of hard refusers cooperated without any reservationsat all. As major success factors, they mentioned the higher-than-usual pay-ment, the multimode character (choice between face-to-face, telephone, self-completion, Internet), and the possibility of giving (monetary) incentives.
Preparation and support. The initial briefing at which they had been con-fronted with the difficult task of converting 80% of the persistent refuserswas very important. The fact that they had been identified and selected as thetop 6% of the interviewer corps, that they had taken up the challenge, the trustput in them, and the resources they received (everybody left with a cash sumof EUR 22.50 per respondent to be spent as they deemed fit) greatly flatteredtheir professional pride. The interviewers were in close contact with the sur-vey organization. Their supervisor appeared to be well informed of the prog-ress of each individual interviewer and their assignment of refusers. The sup-
Stoop / SURVEYING NONRESPONDENTS 33

port and counseling by GfK and the regular newsletter describing the statusand presenting strategies that had been successful helped and motivated theinterviewers to a great extent. They believed it could be done; however, oneperson who inspected the results of the former interviews felt that the situa-tion was hopeless and completed only four out of twelve interviews.
Doorstep behavior. Several interviewers mentioned the significance ofthe first three seconds of interviewer-respondent interaction and the impor-tance of keeping on talking (“the longer the contact, the likelier the success;the wider the door is opened, the more easily you get in”). Almost all empha-sized the value of thorough preparation: From the earlier waves, they hadinformation on the type of household, dwelling, and neighborhood; the ageand gender of the refusing respondent; and the reason for refusal. A numberof interviewers adapted their appearance (clothing) to the neighborhood theyvisited; others tried to look uniformly presentable. Interviewers who spokethe local dialect or were local residents felt this was an advantage. Almost allof them emphasized the detrimental influence of telemarketers on surveycooperation. The name and status of the sponsor of the survey (SCP) and theoffer of the personal telephone number of the directors of both SCP and GfKadded to the success of the survey, even though these numbers were hardlyever used. Several interviewers assured the respondents that great care wouldbe taken to guarantee their privacy. Not many people wanted to be removedfrom sample frames for future research and direct marketing. One respon-dent enjoyed the interview (and the reward) so much that he retracted hisrequest to be removed from these databases.
Monetary incentives. The attitude of interviewers toward giving substan-tial monetary incentives was ambiguous. On one hand, they appreciated thepossibility of giving an incentive, and in some cases the money offered wasthe main reason for the respondents’ willingness to cooperate. As might beexpected, less affluent people and students responded positively to the offerof a cash incentive. On the other hand, the interviewers preferred respondentsto participate because they felt the survey was important, and they felt cheapif they had to bargain about the amount of money to be paid; having to briberespondents wounded their professional pride. In addition, they preferredsmall cash incentives (“I felt 5 euros was more than enough for a fifteen-minute interview”).
Means and efforts. Everyone agreed that they had tried harder than usual.As one respondent said, “You will keep on calling unless I cooperate, won’tyou?” Interviewers did not feel that they had done anything out of the ordi-
34 FIELD METHODS
nary besides using the multiple modes of administration and incentives men-tioned earlier. The availability of incentives had a positive influence in itself.Knowing that they could offer cash rewards boosted their self-confidenceeven if they did not actually proffer money. The same holds for respondents:In many cases, the offer of an incentive was more important than actuallyreceiving one. In the end, several respondents refused the incentive that hadoriginally persuaded them to participate. In one or two cases, the interview-ees offered the gift voucher they had just received to the interviewer.
Pride and prejudice. The professional pride of the interviewers (“theywill cooperate if I ask them”) helped them achieve a high response but couldalso have prevented them from adopting alternative contact strategies. De-spite the special instruction they had all received in advance, each of themseemed to have their own idiosyncratic tactics for obtaining cooperation, andall seemed to succeed in their own way. Strikingly, they ended up by redefin-ing hard refusers as those whom they themselves could not persuade to coop-erate. Hard refusers were not the group allotted to them but the final group ofrefusers (30%–34%) who did not want to cooperate in the follow-up survey.In these cases, even an incentive of EUR 400 would not suffice. Surprisingly,as mentioned earlier, no fewer than a third of these hard refusers could beenticed to take part in an interview by telephone when they were called by thetelephone unit from the survey organization. The dedication and trustworthi-ness of the interviewers made this difficult for them to accept. In a number ofcases in which they had failed and the telephone unit succeeded, they calledon the respondent again to hand over an incentive and ask why the respon-dent had not cooperated with their request. Finally, female interviewersexpected men to have more problems when interviewing (elderly) women.The selected group of successful interviewers, however, contained a slightoverrepresentation of male interviewers.
Difficult Nonrespondents
The interviewers found the following types of respondents difficult topersuade, for different reasons:
• elderly women living alone and afraid to let someone inside (though some[male] interviewers had no problems at all with elderly ladies and were gener-ally welcomed warmly);
• double-earner families with small children (too busy, no time);• the seriously rich, for whom no incentive was of any value and who were too
busy earning money;
Stoop / SURVEYING NONRESPONDENTS 35
• lower-class people who did not want to be bothered, were suspicious of gov-ernmental interference, and distrusted the interviewers; and
• inhabitants of apartment buildings with entry phone (difficult to get inside,interviewers brushed off through the entry phone).
Highly educated or upper-class people presented a different kind of prob-lem, again according to the interviewers. They cooperated or did not cooper-ate. If the latter, eloquence and incentives were of no avail: They refused in afriendly but determined way and did not feel obliged to explain why. This, ofcourse, frustrated the interviewers greatly. Family interaction could also be aproblem. In several cases, one of the spouses would have cooperated if theother had not prevented this. One interviewer recorded the following as a rea-son for a broken-off interview: Stopped during the interview under the influ-ence of the spouse: “See, they want to know about our possessions and we arebeing harassed again.” Scared of burglars. Another one put down the fol-lowing: “Woman in doubt, man refuses.” A third one decided to refrain fromreapproaching the sample household because the husband had just died(although he was the one who refused in the original survey).
Success Factors
Why were almost three-quarters of adamant refusers willing to cooperatein the follow-up survey? From the respondents’ point of view, the lowerresponse burden certainly helped, as did the option of choosing another inter-view mode. For at least some of them, the sizable financial incentive mayhave made a difference, or possibly it was the promise that they would not bebothered again. The focus group results indicate that the respondents werewell aware that the interviewer wanted their cooperation badly. From a theo-retical point of view, the distinction made by Groves and Couper (1998:38–39) between two different optimization targets in developing an intro-ductory strategy may illustrate the difference between interviewer efforts inthe follow-up survey and in ordinary household surveys.
The predominant optimization target of the sampling procedure of Dutchsurveys comes close to quota sampling interviewing: An acceptance of thesurvey request is preferred to a denial, but a lengthy, multicontact prelimi-nary to an acceptance can be as damaging to productivity as a denial. In thefollow-up survey, the second optimization target described by Groves andCouper (1998) was used (i.e., probability sample interviewing in which theprobability of each sample unit accepting is optimized): The odds of successare increased with the continuation of the conversation. Thus, the interviewerdoes not maximize the likelihood of obtaining a “yes” answer in any given
36 FIELD METHODS
contact, but minimizes the likelihood of a “no” answer over repeatedturntaking in the contact (pp. 38–39).
Thus, the persistence of the interviewers may have helped. They werehighly motivated, and no means were spared to give them a sense of self-efficacy, as they were handed money and a wide range of nonmonetaryincentives. In addition, they were told they were top interviewers and exten-sively briefed on the aims and the importance of the follow-up survey.Lemay and Durand (2002) discussed the importance of motivation and self-efficacy, although their results are not clear-cut. Houtkoop-Steenstra and vanden Bergh (2000) and Groves and McGonagle (2001) stressed the impor-tance of tailoring the introduction to characteristics of the respondents andthe interaction. It seems likely that the combination of high-quality, highlymotivated interviewers; a wide range of incentives to be chosen from; andinformation on the respondents and earlier interactions led to the success ofthe follow-up survey. As mentioned earlier, it is interesting that the inter-viewers did not feel happy about handing interviewees substantial amountsof money. In their opinion, a monetary gift should be a token of appreciation,so they preferred to hand over a gift of EUR 5, which corresponds quitenicely with the USD 5 that Singer, Groves, and Corning (1999) foundeffective.
Differences between Original Survey and Follow-up Survey
The follow-up survey was set up to measure bias due to nonresponse inthe original survey. For this purpose, a high response rate was needed. Toachieve this high response rate, the response burden was reduced consider-ably. It could be argued that the cooperation rate in the original survey wouldhave been much higher if respondents had been asked to cooperate in thelight AVO from the beginning. Of course, in that case, the contents of the sur-vey would have been much less relevant (see also Fellegi 2001 for a discus-sion of the trade-off between survey quality criteria). As mentioned above, ithelped that the questionnaire was shorter (fifteen minutes instead of half anhour) and that there were no drop-off questionnaires for each member of thefamily. However, even in an individual survey as compared to a householdsurvey, cooperation will sometimes be a family decision.
Another factor that contributed to the success of the follow-up survey isthat different modes were possible. According to the interviewers, too, themultimode design was one of the success factors of the follow-up survey.More than two-thirds of the interviews were conducted face to face (as in theoriginal survey) and almost one-fourth by telephone (two-thirds by the cen-tral telephone unit, not by the interviewer). The Internet version was selected
Stoop / SURVEYING NONRESPONDENTS 37
by less than 1%; the remaining respondents filled in the questionnaire them-selves. Because of the very small numbers and the factual nature of the ques-tions, mode effects have not been studied.
Differences between respondents in the follow-up and original surveycould be due to survey and questionnaire design differences. The controlgroup that answered the questionnaire concomitantly to the follow-up surveymade it possible to isolate these design effects. It turned out that a number ofquestions could not be used in comparing respondents and nonrespondentsbecause the control group showed that abridging and slightly rephrasingquestions had a large impact on the results. These questions have beenexcluded from further analysis.
CONTACTABILITY AND COOPERATION
Analysis of 1995 Data
Van Leest and Burhenne (1997) analyzed differences in the AVO 1995between easy-to-reach respondents (1–3 calls), hard-to-reach respondents (4or more calls), and nonrespondents who refused to cooperate. They linkedresponse data to frame information from postcode databases to neighbor-hood and residential characteristics as observed by the interviewers and topopulation data from Statistics Netherlands and the GfK MiniCensus (GfK1999). City dwellers, multiunit dwellers, people aged eighteen to thirty-four,single people and people with no children, the highly educated, and peoplewho worked were especially difficult to reach. Making more than three callssubstantially increased the presence of these groups in the sample, with theexception of inhabitants of large cities. City dwellers, people living in apart-ments, and elderly households refused to cooperate relatively often. Resultson the accessibility and cooperation of potential respondents largely con-form to the international literature as summarized by Aarts and Van der Kolk(1999), who mark out elderly people, the less educated, and city dwellers aslikely refusals, whereas noncontacted nonrespondents are younger, bettereducated, more often single, and also live in urban areas.
Comparisons between early respondents (1–3 calls in 1995), late respon-dents (4–15 calls in 1995), and the 1991 survey, in which a response rate of43% was achieved with a maximum of three calls, showed major differencesin net sample composition. The increased number of calls made the net sam-ple more similar to the population. With respect to core variables (use of ser-vices), early and late respondents differed substantially. The majority ofthese differences, with the exception of going to the cinema, disappeared
38 FIELD METHODS
after weighting with sociodemographic variables. The nonresponse analysisthus indicated that striving for a further increase in response rates hardlyseems worth the considerable efforts that will be required. Increasing thenumber of calls is pointless, as almost all respondents have been reachedafter fifteen attempts. Making efforts to achieve refusal conversion yieldsadditional respondents, but instead of trying to increase response rates fur-ther at very high costs, it seemed advisable to investigate the bias caused bythe final 25% or 30% who refuse to cooperate.
ANALYSIS OF 1999 DATA:COMPARING RESPONSE GROUPS
Introduction
Before refusers are compared to respondents, the latter group will be sub-divided according to accessibility and amenability. I make this distinctionbecause it is generally acknowledged (see Goyder 1987:80; Groves andCouper 1998:47) that ease of contact and reluctance to participate are twodistinct dimensions on which sample households can be placed (Lynn, et al.2000:146). Thus, this section starts with an analysis of contactability, contin-ues with an analysis of initial reluctance, and ends with a comparison of hard-to-contact respondents (three or more calls to first contact), reluctant respon-dents (who initially refused to participate at least once), easy respondents(one or two calls to first contact, no refusal), and refusers who participated inthe follow-up survey.
In the analysis of contactability, the call pattern of the interviewers will beincluded next to socioenvironmental variables and sociodemographic andsocioeconomic characteristics of the households and core variables from theAVO that may be related to contactability. The same variables (except callpatterns) will be used in the analysis of reluctance and in the comparison ofrespondent groups and refusers. The selection of variables was inspired bythe research mentioned in the previous chapter and general literature on non-response in face-to-face surveys (see Goyder 1987:84; Groves and Couper1998).
The core variables that were included in the analysis indicate cultural par-ticipation (both culture in general and youth culture (pop concerts, danceevents, and movies), social participation (membership of organizations), andsports activities (both team sports and individual sports). This choice wasbased on the assumption that, first, high rates of participation might ad-versely influence contactability because the activities take people outside the
Stoop / SURVEYING NONRESPONDENTS 39
house, and, second, low rates of participation might adversely influence co-operation, as low participation might reflect low social connectedness, iso-lation, and disengagement, in short, social isolation, which in turn seems tobe an important determinant of refusal to take part in surveys (Groves andCouper 1989:131–41). If nonresponse causes bias, this should be manifest inthe scores on these variables of the refusers in the follow-up survey.
Comparison between groups is complicated by the fact that the AVO is ahousehold survey in which one adult answers a face-to-face questionnaireand subsequently all family members fill in a paper-and-pencil question-naire. Who this person is is not really important. In the follow-up survey,only one adult was approached. To make the data comparable, the analysisfile comprised one person per family from the regular AVO (the face-to-faceperson) and the respondents from the follow-up survey. This final file will beless representative than the complete data file comprising all householdmembers, as the person approached by the interviewer is more often femalethan male (which is no problem in the AVO because all family members haveto cooperate). A further complication is that one family member may haverefused, while another on a later call may have cooperated. This is not a prob-lem in the AVO itself, again because all persons had to cooperate in the end.The selection of one person per household for the sake of comparison may,however, give a skewed view of the net sample.
Hard-to-Reach Respondents
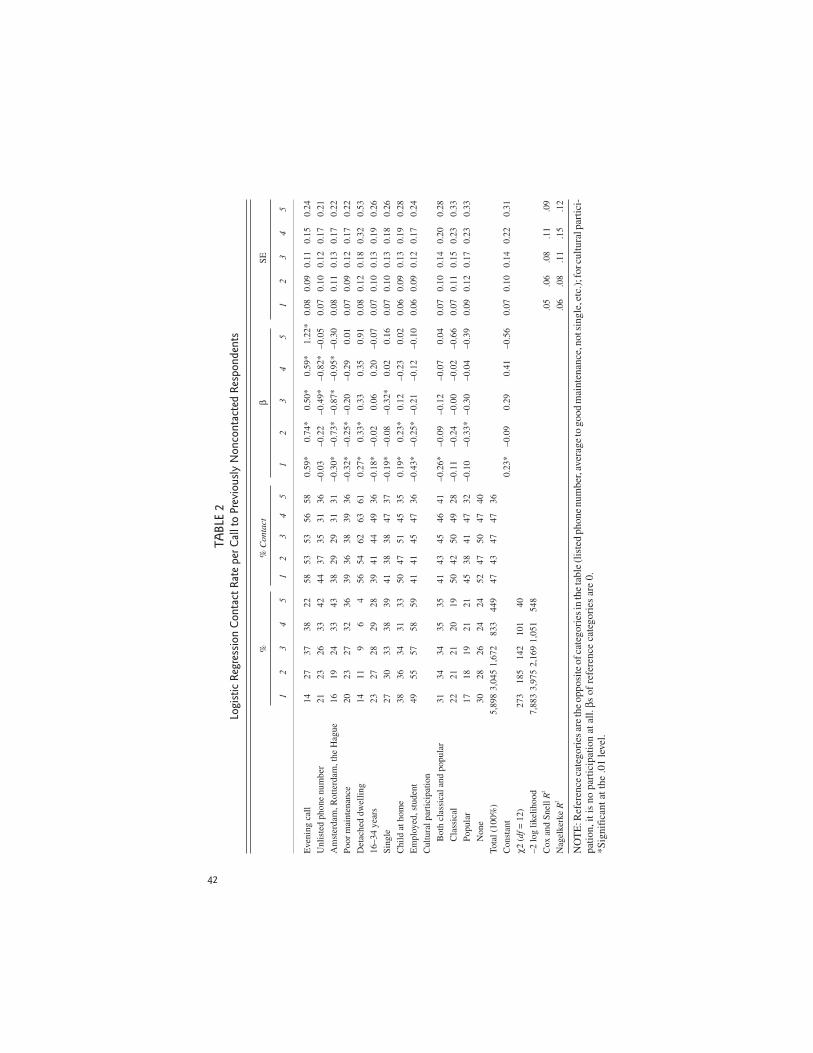
The analyses of contactability are similar to those presented by Grovesand Couper (1989:chap. 4). The contact rate is analyzed per call on thosehouseholds that had not been contacted during an earlier call. This impliesthat on each subsequent call, the more hard-to-reach households remain untilthey, too, have been contacted. An analysis of all eligible sample householdsshowed, as might be expected, that in the evening the contact rate is higher,that the presence of a listed phone number is a help at that stage of the field-work (after three unsuccessful personal calls) when interviewers may tele-phone noncontacts to make an appointment, and that urban environmentsrequire more calls to first contact. The analyses presented below includerespondents only, so ease of contact can be analyzed taking into accountfieldwork characteristics (evening calls, listed phone number), socioen-vironmental characteristics (residence, neighborhood, dwelling), socio-economic and demographic characteristics of the household (familycomposition, age, social status), and topical variables in the AVO (socialparticipation, cultural participation, sports activities).
40 FIELD METHODS

The results of these analyses are presented in Table 2. The first set of val-ues (%) shows the composition of the respondents to be contacted on eachcall. For 14% of the respondents, the first call was made in the evening. Ofthose who were not contacted on the first call, 27% received a second call inthe evening. The percentage of evening calls at previously noncontactedaddresses reaches a maximum on the third (37%) and fourth (38%) call andthen slides back to 22% on the fifth call. Later calls have not been analyzeddue to the increasingly smaller group of as yet uncontacted respondents. Onthe first call, 16% of the respondents lived in one of the Netherlands large cit-ies; on the fifth call, 43%. This indicates that major city dwellers are hard toreach. This is also shown in the second section (% contact) part of Table 2.Here we can see that the average chance of contact for final respondents onthe first call was 47%. For big-city dwellers, however, the contact rate wasmuch lower (i.e., 38% on the first call).
If the first contact was in the evening, the chance of contact was 58%, 56%for residents of detached dwellings, and so forth. The chances of contact onlater calls differ, although the pattern is similar: Evening calls and calls to res-idents of detached dwellings have a relatively high contact rate, whereasmajor-city dwellers are hard to reach. This part of the table also shows thatthose who participate in popular culture (been to the cinema, a pop concert, ora dance event at least once in the past year) are harder to reach on the first call.Those who participate in classical culture only (theatres, concerts, opera,museum) are actually easier to reach, almost as easy as those who do notparticipate at all.
The first two sections (% and % contact) of Table 2 contain only bivariaterelationships with contactability. It is not clear from these whether culturallyparticipating people are hard to contact because they more often live in bigcities (which they do) or if this is an independent effect. The second two sec-tions (β and SE) of Table 2 presents logistic regressions of contactability foreach call. The results show that on any call, the evening is the best time tosecure contact. The presence of a listed telephone number makes contact eas-ier on later calls, when interviewers are allowed to telephone the householdto make an appointment. Urbanicity is important, too, especially for earliercalls.
The analysis also shows that on the first two or three calls, young persons,single persons, and persons who have their daily occupation outside thehome are more difficult to contact and that households with children are eas-ier. This effect will be mitigated by the fact that contact has to be made withan adult in the household and not with a designated person. From the logisticregressions, it can be seen that culturally active persons are less likely to befound at home at all stages, even when fieldwork characteristics, socio-
Stoop / SURVEYING NONRESPONDENTS 41
42
TABL
E 2
Logi
stic
Reg
ress
ion
Con
tact
Rat
e pe
r Cal
l to
Prev
ious
ly N
onco
ntac
ted
Resp
onde
nts
%%
Con
tact
βSE
12
34
51
23
45
12
34
51
23
45
Eve
ning
cal
l14
2737
3822
5853
5356
580.
59*
0.74
*0.
50*
0.59
*1.
22*
0.08
0.09
0.11
0.15
0.24
Unl
iste
d ph
one
num
ber
2123
2633
4244
3735
3136
–0.0
3–0
.22
–0.4
9*–0
.82*
–0.0
50.
070.
100.
120.
170.
21
Am
ster
dam
, Rot
terd
am, t
he H
ague
1619
2433
4338
2929
3131
–0.3
0*–0
.73*
–0.8
7*–0
.95*
–0.3
00.
080.
110.
130.
170.
22
Poor
mai
nten
ance
2023
2732
3639
3638
3936
–0.3
2*–0
.25*
–0.2
0–0
.29
0.01
0.07
0.09
0.12
0.17
0.22
Det
ache
d dw
ellin
g14
119
64
5654
6263
610.
27*
0.33
*0.
330.
350.
910.
080.
120.
180.
320.
53
16–3
4 ye
ars
2327
2829
2839
4144
4936
–0.1
8*–0
.02
0.06
0.20
–0.0
70.
070.
100.
130.
190.
26
Sing
le27
3033
3839
4138
3847
37–0
.19*
–0.0
8–0
.32*
0.02
0.16
0.07
0.10
0.13
0.18
0.26
Chi
ld a
t hom
e38
3634
3133
5047
5145
350.
19*
0.23
*0.
12–0
.23
0.02
0.06
0.09
0.13
0.19
0.28
Em
ploy
ed, s
tude
nt49
5557
5859
4141
4547
36–0
.43*
–0.2
5*–0
.21
–0.1
2–0
.10
0.06
0.09
0.12
0.17
0.24
Cul
tura
l par
ticip
atio
n
Bot
h cl
assi
cal a
nd p
opul
ar31
3434
3535
4143
4546
41–0
.26*
–0.0
9–0
.12
–0.0
70.
040.
070.
100.
140.
200.
28
Cla
ssic
al22
2121
2019
5042
5049
28–0
.11
–0.2
4–0
.00
–0.0
2–0
.66
0.07
0.11
0.15
0.23
0.33
Popu
lar
1718
1921
2145
3841
4732
–0.1
0–0
.33*
–0.3
0–0
.04
–0.3
90.
090.
120.
170.
230.
33
Non
e30
2826
2424
5247
5047
40
Tota
l (10
0%)
5,89
83,
045
1,67
283
344
947
4347
4736
Con
stan
t0.
23*
–0.0
90.
290.
41–0
.56
0.07
0.10
0.14
0.22
0.31
χ2 (
df=
12)
273
185
142
101
40
–2 lo
g lik
elih
ood
7,88
33,
975
2,16
91,
051
548
Cox
and
Sne
llR
2.0
5.0
6.0
8.1
1.0
9
Nag
elke
rke
R2
.06
.08
.11
.15
.12
NO
TE
:Ref
eren
ceca
tego
ries
are
the
oppo
site
ofca
tego
ries
inth
eta
ble
(lis
ted
phon
enu
mbe
r,av
erag
eto
good
mai
nten
ance
,not
sing
le,e
tc.)
;for
cultu
ralp
artic
i-pa
tion,
it is
no
part
icip
atio
n at
all.
βs o
f re
fere
nce
cate
gori
es a
re 0
.*S
igni
fica
nt a
t the
.01
leve
l.
environmental variables, and sociodemographic and socioeconomic charac-teristics are included. Cultural participation was the only topical AVO vari-able that was significant in the multivariate analyses.
Reluctant Respondents
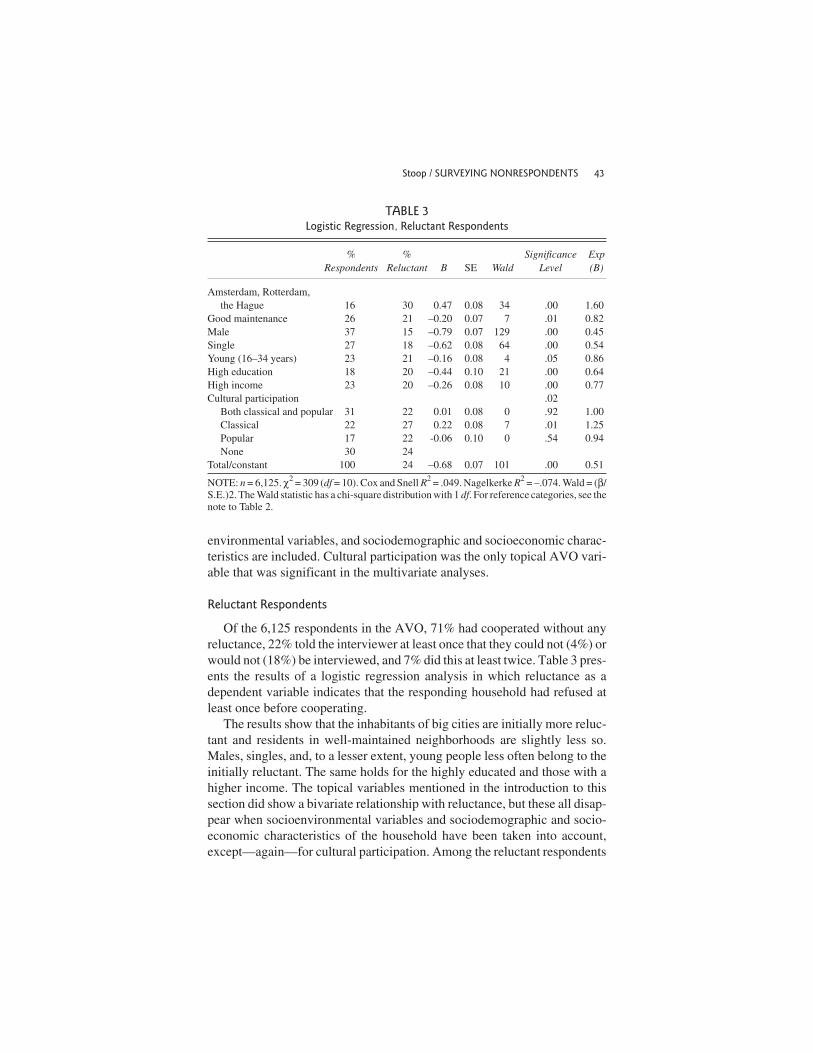
Of the 6,125 respondents in the AVO, 71% had cooperated without anyreluctance, 22% told the interviewer at least once that they could not (4%) orwould not (18%) be interviewed, and 7% did this at least twice. Table 3 pres-ents the results of a logistic regression analysis in which reluctance as adependent variable indicates that the responding household had refused atleast once before cooperating.
The results show that the inhabitants of big cities are initially more reluc-tant and residents in well-maintained neighborhoods are slightly less so.Males, singles, and, to a lesser extent, young people less often belong to theinitially reluctant. The same holds for the highly educated and those with ahigher income. The topical variables mentioned in the introduction to thissection did show a bivariate relationship with reluctance, but these all disap-pear when socioenvironmental variables and sociodemographic and socio-economic characteristics of the household have been taken into account,except—again—for cultural participation. Among the reluctant respondents
Stoop / SURVEYING NONRESPONDENTS 43
TABLE 3Logistic Regression, Reluctant Respondents
% % Significance ExpRespondents Reluctant B SE Wald Level (B)
Amsterdam, Rotterdam,the Hague 16 30 0.47 0.08 34 .00 1.60
Good maintenance 26 21 –0.20 0.07 7 .01 0.82Male 37 15 –0.79 0.07 129 .00 0.45Single 27 18 –0.62 0.08 64 .00 0.54Young (16–34 years) 23 21 –0.16 0.08 4 .05 0.86High education 18 20 –0.44 0.10 21 .00 0.64High income 23 20 –0.26 0.08 10 .00 0.77Cultural participation .02
Both classical and popular 31 22 0.01 0.08 0 .92 1.00Classical 22 27 0.22 0.08 7 .01 1.25Popular 17 22 -0.06 0.10 0 .54 0.94None 30 24
Total/constant 100 24 –0.68 0.07 101 .00 0.51
NOTE: n = 6,125. χ2 = 309 (df = 10). Cox and Snell R2 = .049. Nagelkerke R2 = –.074. Wald = (β/S.E.)2. The Wald statistic has a chi-square distribution with 1 df. For reference categories, see thenote to Table 2.
who had to be converted after an initial refusal, classical culture is relativelypopular.
The results seem counterintuitive: Singles and males are significantly lessreluctant to cooperate than households consisting of more persons andwomen. The instant cooperation rate of single males is more than 80%, andthe cooperation rate of women who are part of a couple with children is onlyslightly higher than 60%. As the AVO is a household survey and more thanone person can be the gatekeeper, it is hard to designate the reluctant individ-ual. It is possible to do so for singles. According to the comparison betweenreluctant and instantly cooperative respondents, it appears that single malesare more eager to be interviewed than single females. Of the latter, 21% areinitially reluctant (not able and refuse, males 14%) and 7% more than once(males only 2%). This finding might be attributable to the reluctance ofsingle women to let a stranger into their homes.
A much simpler explanation is at hand, however: The AVO sample con-sists of 27% single households (10% single males and 17% single females).The Dutch population at that time consisted of 32% single households (14%male and 18% female). Thus, single males are underrepresented among thecooperative respondents but even more so in the final sample. The compari-son of male and female singles and the data on the relevant population sug-gest that soft refusers are predominantly women, who are initially reluctantbut finally are pushovers, whereas hard refusers are more often men who donot turn up in the sample as reluctant respondents at all because they simplydo not respond. Put differently, it seems that response strategies related torefusal conversion are more fruitful for women than for men and that theymay be counterproductive as they seem to work best for those groups that arecooperative and well represented anyway. On the other hand, reluctantrespondents are more similar to refusers (and more similar to hard-to-contactrespondents) because they more often live in big cities than early, easy re-spondents. In this respect, both fieldwork strategies have a positive effecton the sample composition. This outcome also lends support to the conten-tion that converted refusers are not necessarily similar to real refusers, asGuadagnoli and Cunningham (1989) and Lin and Schaeffer (1995) haveshown earlier.
Do Nonrespondents Differ?
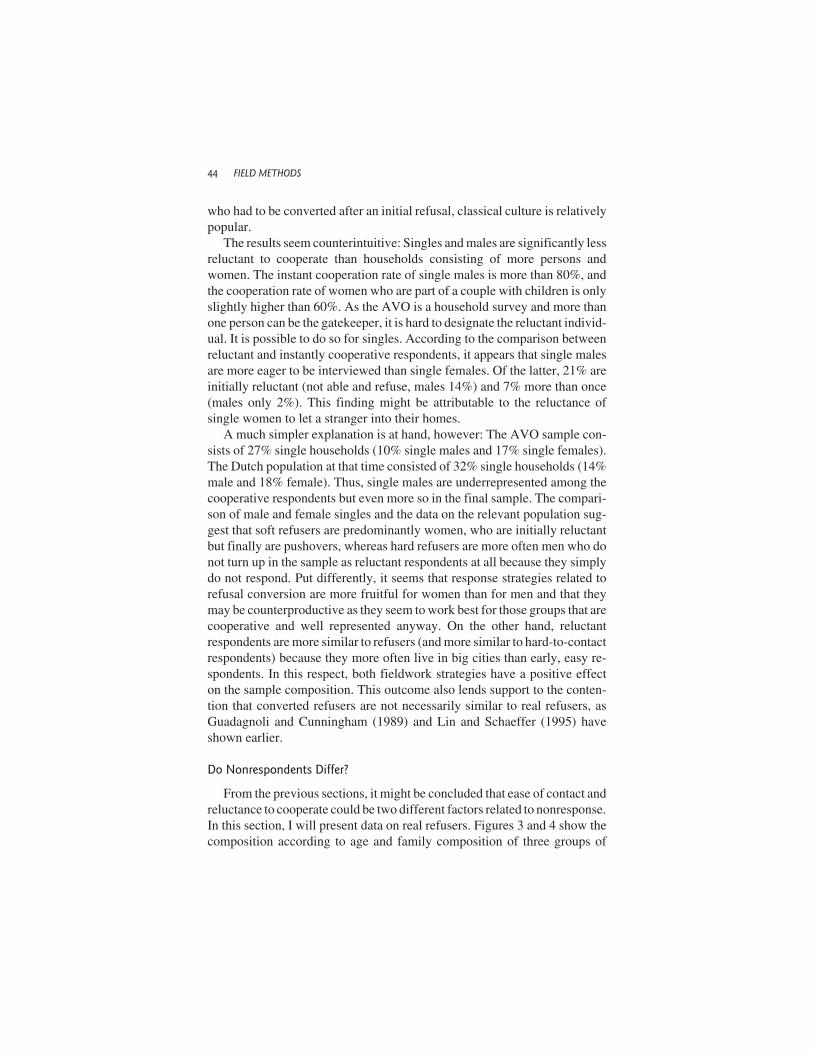
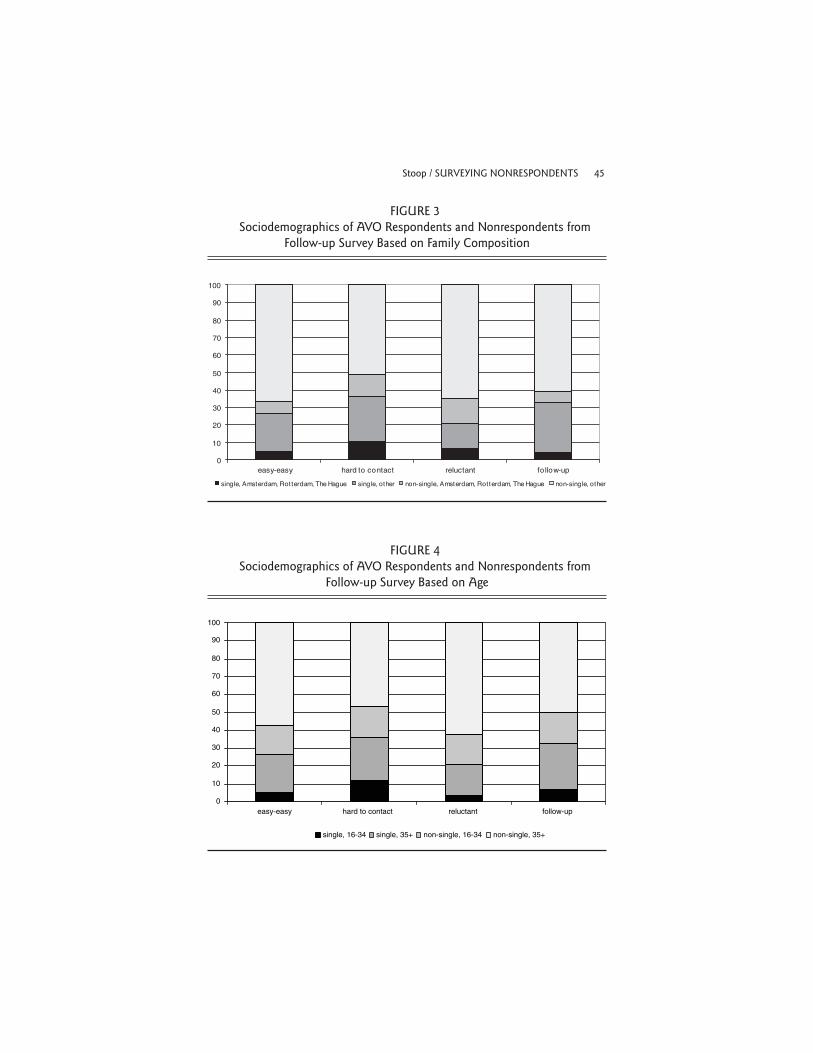
From the previous sections, it might be concluded that ease of contact andreluctance to cooperate could be two different factors related to nonresponse.In this section, I will present data on real refusers. Figures 3 and 4 show thecomposition according to age and family composition of three groups of
44 FIELD METHODS
Stoop / SURVEYING NONRESPONDENTS 45
0
10
20
30
40
50
60
70
80
90
100
easy-easy hard to contact reluctant fo llow-up
single, Amsterdam, Rotterdam, The Hague single, other non-single, Amsterdam, Rotterdam, The Hague non-single, other
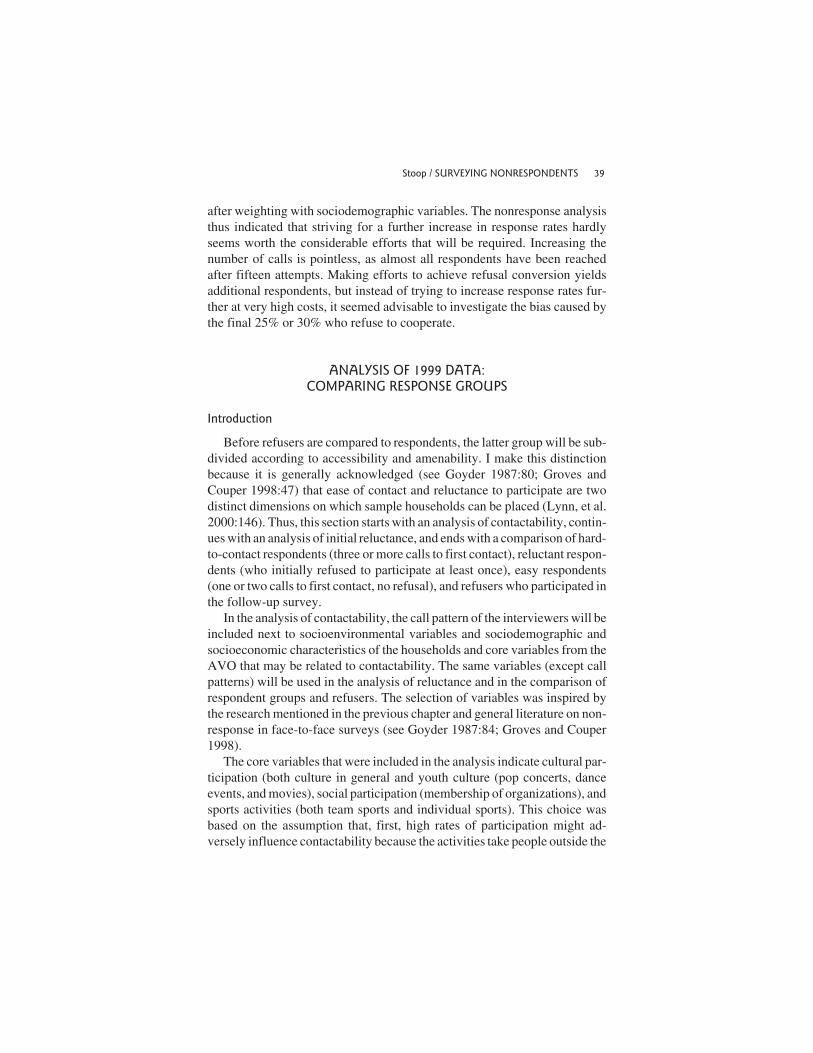
FIGURE 3Sociodemographics of AVO Respondents and Nonrespondents from
Follow-up Survey Based on Family Composition
0
10
20
30
40
50
60
70
80
90
100
easy-easy hard to contact reluctant follow-up
single, 16-34 single, 35+ non-single, 16-34 non-single, 35+
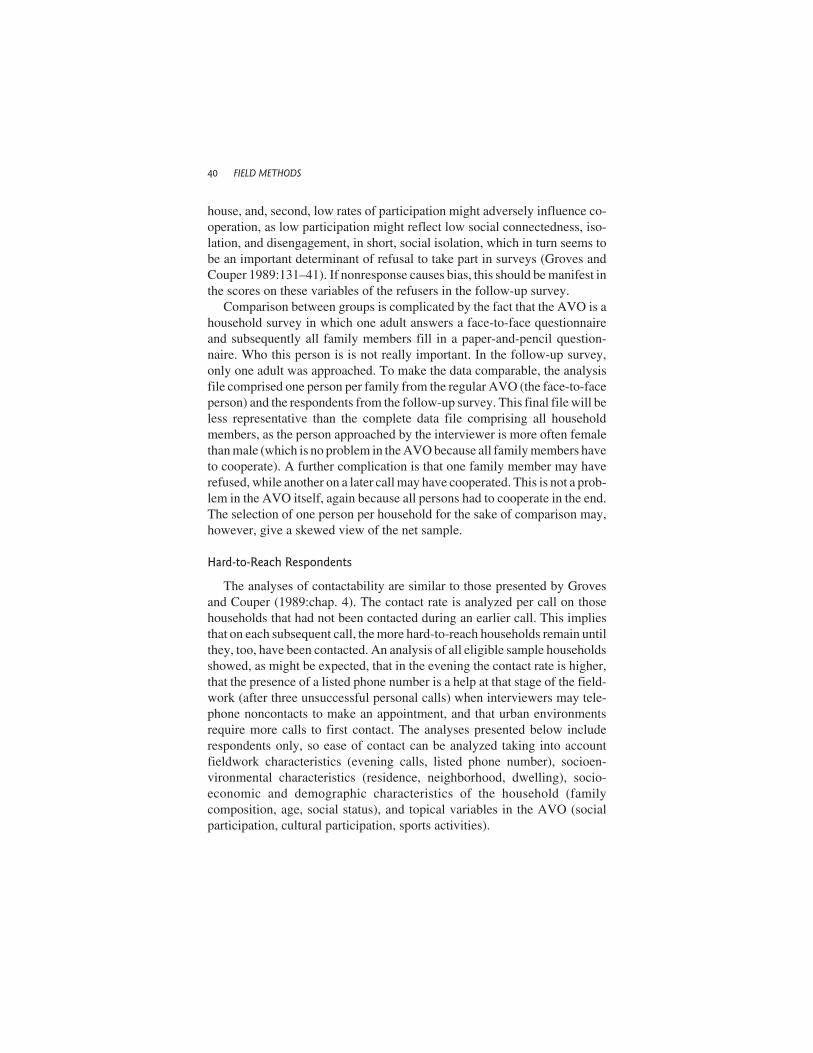
FIGURE 4Sociodemographics of AVO Respondents and Nonrespondents from
Follow-up Survey Based on Age
respondents: those who were contacted on the first or second call and did notrefuse (easy-easy), those who required more than two calls but never refused(hard-to-contact), and those who cooperated after an initial refusal (reluc-tant) and nonrespondents who participated in the follow-up survey. Fromthese figures, it is obvious that hard-to-contact respondents are dissimilarfrom the others (more singles) and that reluctant respondents are not at alllike hard-to-contact respondents. The refusers who finally agreed to respondin the follow-up survey are also more often single, but compared to the hard-to-contact group, the refusing singles less often live in big cities and are lessoften young.
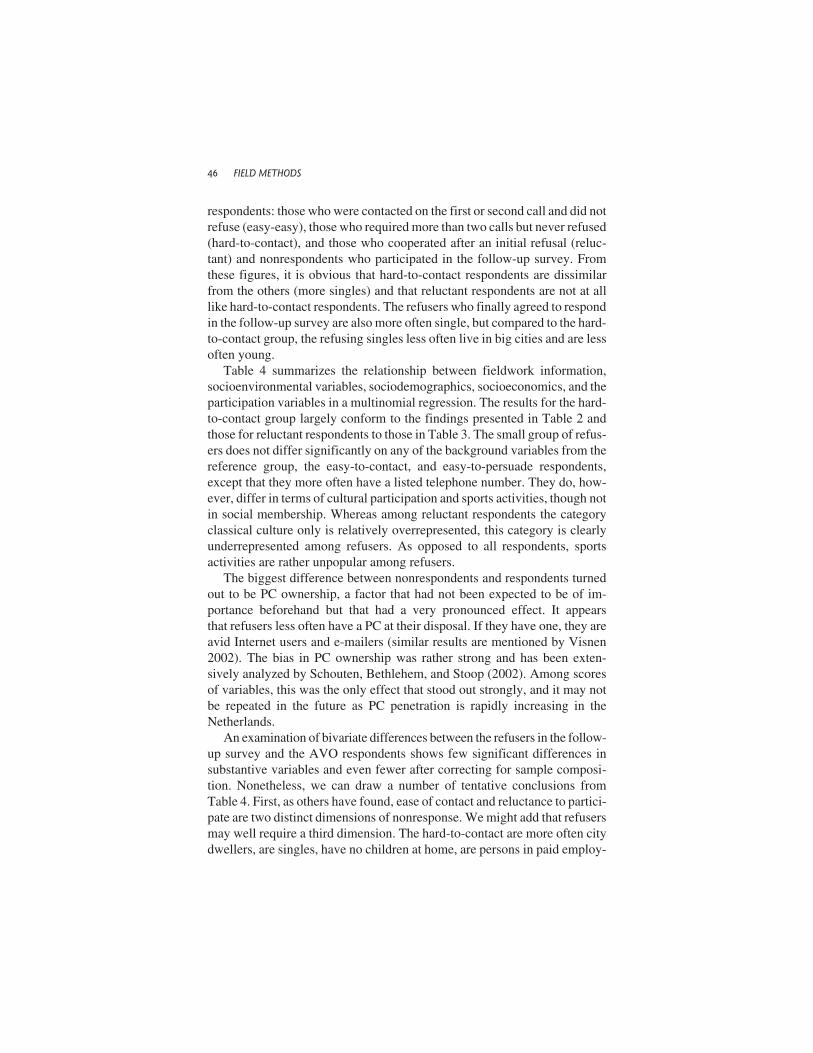
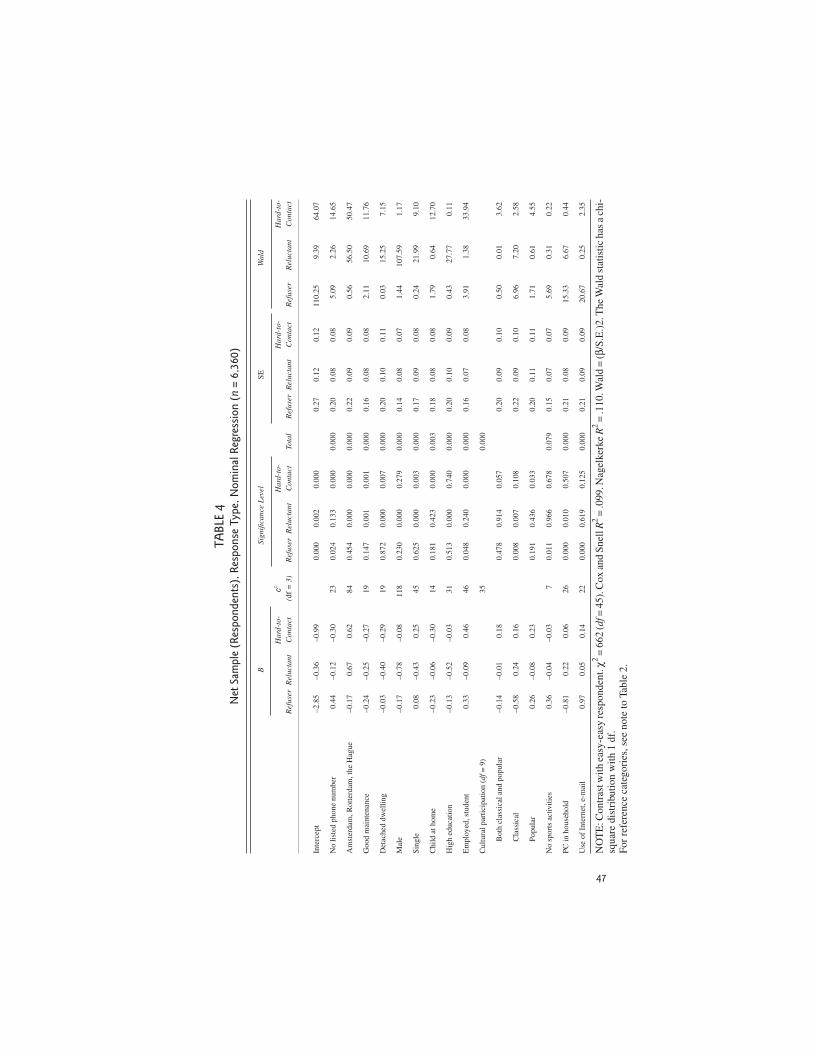
Table 4 summarizes the relationship between fieldwork information,socioenvironmental variables, sociodemographics, socioeconomics, and theparticipation variables in a multinomial regression. The results for the hard-to-contact group largely conform to the findings presented in Table 2 andthose for reluctant respondents to those in Table 3. The small group of refus-ers does not differ significantly on any of the background variables from thereference group, the easy-to-contact, and easy-to-persuade respondents,except that they more often have a listed telephone number. They do, how-ever, differ in terms of cultural participation and sports activities, though notin social membership. Whereas among reluctant respondents the categoryclassical culture only is relatively overrepresented, this category is clearlyunderrepresented among refusers. As opposed to all respondents, sportsactivities are rather unpopular among refusers.
The biggest difference between nonrespondents and respondents turnedout to be PC ownership, a factor that had not been expected to be of im-portance beforehand but that had a very pronounced effect. It appearsthat refusers less often have a PC at their disposal. If they have one, they areavid Internet users and e-mailers (similar results are mentioned by Visnen2002). The bias in PC ownership was rather strong and has been exten-sively analyzed by Schouten, Bethlehem, and Stoop (2002). Among scoresof variables, this was the only effect that stood out strongly, and it may notbe repeated in the future as PC penetration is rapidly increasing in theNetherlands.
An examination of bivariate differences between the refusers in the follow-up survey and the AVO respondents shows few significant differences insubstantive variables and even fewer after correcting for sample composi-tion. Nonetheless, we can draw a number of tentative conclusions fromTable 4. First, as others have found, ease of contact and reluctance to partici-pate are two distinct dimensions of nonresponse. We might add that refusersmay well require a third dimension. The hard-to-contact are more often citydwellers, are singles, have no children at home, are persons in paid employ-
46 FIELD METHODS
47
TABL
E 4
Net
Sam
ple
(Res
pond
ents
), R
espo
nse
Type
, Nom
inal
Reg
ress
ion
(n=
6,36
0)
BSi
gnifi
canc
e L
evel
SEW
ald
Har
d-to
-c
2H
ard-
to-
Har
d-to
-H
ard-
to-
Ref
user
Rel
ucta
ntC
onta
ct(d
f=
3)
Ref
user
Rel
ucta
ntC
onta
ctTo
tal
Ref
user
Rel
ucta
ntC
onta
ctR
efus
erR
eluc
tant
Con
tact
Inte
rcep
t–2
.85
–0.3
6–0
.99
0.00
00.
002
0.00
00.
270.
120.
1211
0.25
9.39
64.0
7
No
liste
d ph
one
num
ber
0.44
–0.1
2–0
.30
230.
024
0.13
30.
000
0.00
00.
200.
080.
085.
092.
2614
.65
Am
ster
dam
, Rot
terd
am, t
he H
ague
–0.1
70.
670.
6284
0.45
40.
000
0.00
00.
000
0.22
0.09
0.09
0.56
56.5
050
.47
Goo
d m
aint
enan
ce–0
.24
–0.2
5–0
.27
190.
147
0.00
10.
001
0.00
00.
160.
080.
082.
1110
.69
11.7
6
Det
ache
d dw
ellin
g–0
.03
–0.4
0–0
.29
190.
872
0.00
00.
007
0.00
00.
200.
100.
110.
0315
.25
7.15
Mal
e–0
.17
–0.7
8–0
.08
118
0.23
00.
000
0.27
90.
000
0.14
0.08
0.07
1.44
107.
591.
17
Sing
le0.
08–0
.43
0.25
450.
625
0.00
00.
003
0.00
00.
170.
090.
080.
2421
.99
9.10
Chi
ld a
t hom
e–0
.23
–0.0
6–0
.30
140.
181
0.42
30.
000
0.00
30.
180.
080.
081.
790.
6412
.70
Hig
h ed
ucat
ion
–0.1
3–0
.52
–0.0
331
0.51
30.
000
0.74
00.
000
0.20
0.10
0.09
0.43
27.7
70.
11
Em
ploy
ed, s
tude
nt0.
33–0
.09
0.46
460.
048
0.24
00.
000
0.00
00.
160.
070.
083.
911.
3833
.94
Cul
tura
l par
ticip
atio
n (d
f= 9
)35
0.00
0
Bot
h cl
assi
cal a
nd p
opul
ar–0
.14
–0.0
10.
180.
478
0.91
40.
057
0.20
0.09
0.10
0.50
0.01
3.62
Cla
ssic
al–0
.58
0.24
0.16
0.00
80.
007
0.10
80.
220.
090.
106.
967.
202.
58
Popu
lar
0.26
–0.0
80.
230.
191
0.43
60.
033
0.20
0.11
0.11
1.71
0.61
4.55
No
spor
ts a
ctiv
ities
0.36
–0.0
4–0
.03
70.
011
0.96
60.
678
0.07
90.
150.
070.
075.
690.
310.
22
PC in
hou
seho
ld–0
.81
0.22
0.06
260.
000
0.01
00.
507
0.00
00.
210.
080.
0915
.33
6.67
0.44
Use
of
Inte
rnet
, e-m
ail
0.97
0.05
0.14
220.
000
0.61
90.
125
0.00
00.
210.
090.
0920
.67
0.25
2.35
NO
TE
:Con
tras
twith
easy
-eas
yre
spon
dent
.χ2
=66
2(d
f=45
).C
oxan
dSn
ellR
2=
.099
.Nag
elke
rke
R2
=.1
10.W
ald
=(β
/S.E
.)2.
The
Wal
dst
atis
ticha
sa
chi-
squa
re d
istr
ibut
ion
with
1 d
f.Fo
r re
fere
nce
cate
gori
es, s
ee n
ote
to T
able
2.

ment, or are following a course of study. They also show a higher participa-tion in cultural activities, both classical and popular. Reluctant respondents,in this survey, seem to be a somewhat conventional group susceptible tointerviewer persuasion strategies. They are similar to noncontacts only inthat they more often live in urban environments. Males, singles, and personswith a higher education are relatively scarce, possibly because they simplysay no. They more often go to classical performances and more often have aPC.
Refusers, perhaps due to the small size of this group, do not differ fromrespondents on sociodemographic and socioeconomic characteristics. Theresults suggest that there might be a cultural difference between respondentsand refusers, as indicated by the higher involvement of the latter in popularculture, low level of sports activities, low PC ownership, and, if they have aPC, their more frequent use of Internet and e-mail. These outcomes may fit inwith the theories of Groves and Couper (1998:131) on social isolation.
CONCLUSIONS AND DISCUSSION
Introduction and Reservations
The previous sections suggest that high response rates are possible, evenin the Netherlands. As a follow-up to a burdensome survey with a responserate of 65%, a substantially less burdensome survey among refusers yielded acooperation rate of more than 70%. From the results, we have gained someinsight into the strategy for obtaining high response rates; we can computebias due to nonresponse, and we can provide suggestions for fieldwork strat-egies in subsequent surveys. Before doing this, a number of reservationsshould be pointed out.
First, this survey was conducted in the Netherlands, where response ratesare generally low. It is not known whether similar response enhancementstrategies might work in other cultures with different survey climates.
Second, the results refer to a face-to-face survey. This data collectionmode is becoming less and less the norm in certain countries, to the extentthat major survey agencies in those countries have disposed of their face-to-face interviewing capacity. Notwithstanding this, a major new cross-nationalsurvey, the European Social Survey (ESS) (www.europeansocialsurvey.org),has opted for the face-to-face approach for the first rounds, as this seemed tobe the only mode that could be assumed to provide comparable results intwenty-four countries.
48 FIELD METHODS

An analysis of nonresponse information from this survey, in which a tar-get response rate of 70% was specified, will also make possible a cross-cultural comparison of response behavior. As the ESS is concerned withopinions and values, it will also address the third reservation about the AVOresults, namely, that they are based on a survey comprising factual questions,whereas a survey on opinions might show greater or other differences bet-ween respondents and nonrespondents.
A final reservation is that because of the small sample size of the follow-up survey, the relationship between response behavior and substantive vari-ables may have been obfuscated.
Enhancing Response Rates
To persuade the refusers to participate in the follow-up survey, a widerange of techniques was used, as described in the Converting PersistentRefusers section. Some of these techniques would not, could not, or perhapsshould not be used in a regular survey (promising respondents that theywould be removed from direct marketing databases, visiting them in the hos-pital, handing out sums of money to interviewers). All the same, the effec-tiveness of the approach gives every reason to transplant feasible response-enhancing techniques from the follow-up survey to future fieldwork. It isimpossible, however, to separate the effectiveness from different compo-nents of the follow-up survey design. The only information we have on therelative effectiveness of the different components is the evaluation of theinterviewers (see the Success Factors section).
The overriding impression from the focus group discussions is that twofactors were very important. First, the interviewers firmly believed that theywere doing something important, a feeling nourished by their being selectedas top interviewers, by the high payments, by the possibility of giving differ-ential incentives to respondents, by the personal involvement of the surveyorganization and sponsor, by the scientific status of the project, and by theimportance of obtaining a response. Second, as explained in the Design ofFollow-up Survey section, a wide range of measures was used to convincerespondents that their cooperation was really important. Interviewers dif-fered in the incentives they preferred to use (lottery tickets, flowers, giftvouchers). Some incentives may have been more effective than others, butthe effect is difficult to ascertain as the small number of interviewers seemedto adopt idiosyncratic contact strategies. These two factors would be diffi-cult (and prohibitively expensive) to maintain in a regular survey, but thegeneral idea will be adhered to in future rounds of the AVO, whereas spe-
Stoop / SURVEYING NONRESPONDENTS 49
cific techniques can be deployed in converting difficult, initially reluctantrespondents.
Bias Due to Nonresponse
Lynn, et al. (2002) concluded from an analysis of three large-scalenational household surveys in Britain that it is the difficult to contact who aremost different from the easy to get. This would appear to suggest thatresources for extended efforts might be better concentrated on making con-tact with difficult to contact households than upon attempting refusal conver-sion (p. 142). Lynn, et al. make one important distinction between contactrate and cooperation rate, however, because the final contact rate was veryhigh in the British studies (96.3% to 98.2%), whereas about a third of thesample remained as refusers. It might be that although converted refusals aresimilar to the easy-to-get, the remaining (harder) refusals are rather different(p. 142).
The AVO survey, where data from real refusals have been obtained, con-firms the Lynn, et al. (2002) conclusion that the hard to contact are more dis-similar than the refusals and that the real refusers differ more from the easy-to-get than the converted refusers. From the analyses in the Contactabilityand Cooperation section, we may conclude that pursuing a high response ratein the AVO would lead to a better representation of severalsociodemographic and socioeconomic groups and thus improve precision.The differences in substantive variables are small, however, and not at all sig-nificant for the major share of the survey variables, which is a reassuringresult. Even so, the results also indicate that easy-to-get respondents, hard-to-get respondents, converted refusers, and persistent refusers show distinc-tive patterns in cultural participation. As a result, high response rates are rec-ommended, not only to improve precision but also to reduce nonresponsebias (and see Lynn, et al. 2002:135).
Fieldwork Strategy and Registration
The results presented so far underline the importance of differentiatingbetween ease of contact and reluctance to cooperate. To make this possible,contact forms should be used that allow for the registration and subsequentkeying in of information on each individual call. With this information, wewere able to describe the benefits of a large number of calls and the benefitsof refusal conversion. The first strategy seems effective in obtaining the par-ticipation of city dwellers and people who spend a larger part of the dayoutside the home.
50 FIELD METHODS

The number of calls can be reduced by making more evening calls. In-creasing the number of evening calls, however, is also likely to increasetravel costs and limit the time available for calling on respondents (see alsoCampanelli and Purdon 1997:3–33).
The yields of refusal conversion are less clear. Certainly, without reissu-ing refusing addresses and converting the initially reluctant, the response ratewould be much lower. It might be more effective, however, to do one’sutmost to convert difficult refusals (e.g., young, single males) instead of easyrefusals that are already overrepresented in the intermediate sample, such asfamilies with children. This strategy might yield lower net returns (i.e., alower final response rate) but might also reduce bias due to nonresponse.
APPENDIXOverview of Questions in the
1999 AVO Survey
Household Questionnaire (Face to Face)
Subject Questions
Family composition(per member)
Year of birth, gender, marital status, and position inhousehold
Dwelling Type, floor, elevator available, size, age of building,length of occupation, extra facilities
Dwelling costs Owned/rented, value, rent, mortgage information,housing benefit
Environmental behavior Separation of waste, information on car(s)
Care received duringpast 12 months
Personal care From whom, type, frequency, period, why, infant wel-fare center, medical appliances
Domestic care From whom, period, amount, reason, costs, home care
For those whoreceive home care
Use of transport and other facilities for the disabled
Child care and education
Number of childrenSeeking help, peda-gogic problems
Stoop / SURVEYING NONRESPONDENTS 51
(continued)
Children 0–4 years(per child)
Parental leave, (in)formal day care per child (type, cost,frequency), nursery, day care facilities
Children 4–12 years(per child)
Type of school per child, child care after or in betweenschool hours, costs
Children 12–30 years(per child)
Living at home, student grants, child benefit, education(type)
Income Number of earners, family income
Informal labor For other households or organizations (participation,remuneration)
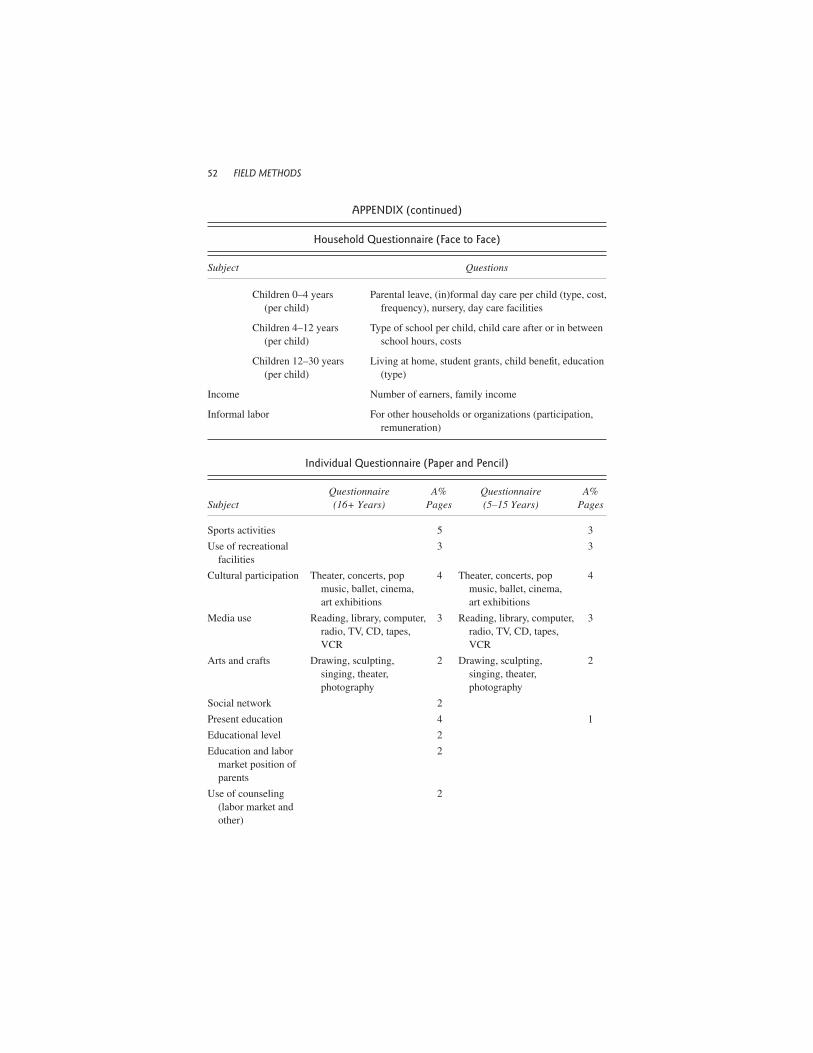
Individual Questionnaire (Paper and Pencil)
Questionnaire A% Questionnaire A%Subject (16+ Years) Pages (5–15 Years) Pages
Sports activities 5 3
Use of recreationalfacilities
3 3
Cultural participation Theater, concerts, popmusic, ballet, cinema,art exhibitions
4 Theater, concerts, popmusic, ballet, cinema,art exhibitions
4
Media use Reading, library, computer,radio, TV, CD, tapes,VCR
3 Reading, library, computer,radio, TV, CD, tapes,VCR
3
Arts and crafts Drawing, sculpting,singing, theater,photography
2 Drawing, sculpting,singing, theater,photography
2
Social network 2
Present education 4 1
Educational level 2
Education and labormarket position ofparents
2
Use of counseling(labor market andother)
2
52 FIELD METHODS
APPENDIX (continued)
Household Questionnaire (Face to Face)
Subject Questions
Miscellaneous Travel cards, membershipof organizations
1 Child helpline; travelcards, membership oforganizations
1
Contacts with policeand legal aid
4
Medical care and healthinsurance
2 1
Health problems Visual, hearing problems,problems with dailyhousehold activities,health problems andailments
6 Visual, hearing problems,problems with dailyactivities, health prob-lems and ailments
4
Care leave 2
Religion, ethnicity 2 2
Occupation 4
Disability 2
Income Wage, benefit, pension,etc.
7
Stoop / SURVEYING NONRESPONDENTS 53
APPENDIX (continued)
Individual Questionnaire (Paper and Pencil)
Questionnaire A% Questionnaire A%Subject (16+ Years) Pages (5–15 Years) Pages
REFERENCES
Aarts, K., and H. Van der Kolk. 1999. Tegen de stroom in? Non-respons en Hawthorne effectenin het Nationaal Kiezersonderzoek. Paper presented at the NVMC spring conference,De waan van de Dag, Utrecht, the Netherlands, April.
Campanelli, P. S., and S. Purdon. 1997. Can you hear me knocking? An investigation into theimpact of interviewer on survey response rates. London: Survey Methods Centre at SCPR.
De Heer, W. 1999. International response trends, results of an international survey. Journal ofOfficial Statistics 15 (2): 129–42.
. 2000. Survey practices in European countries. In Measuring adult literacy. The Interna-tional Adult Literacy Survey (IALS) in the European context, edited by Siobhn Carey, 43–64.London: Office for National Statistics.
Dillman, D. A. 2000. Mail and Internet surveys: The tailored design method. 2nd ed. New York:Wiley.
Esomar. 2003. Research in the Netherlands: The strength is in online research. ESOMARResearch World 11 (1): 4–6.
Fellegi, I. P. 2001. Comment. Journal of Official Statistics 17 (1): 43–50.
54 FIELD METHODS
GfK. 1999. GfK MiniCensus. Retrieved from www.gfk.nl/data/consscop/text/minicens.htm.Goyder, J. 1987. The silent minority: Nonrespondents on sample surveys. Cambridge, UK:
Polity.Groves, R. M., and M. P. Couper. 1998. Nonresponse in household interview surveys. New
York: Wiley.Groves, R. M., and K. A. McGonagle. 2001. A theory-guided interview training protocol regard-
ing survey participation. Journal of Official Statistics 17 (2): 249–66.Guadagnoli, E., and S. Cunningham.1989. The effects of nonresponse and late response on a sur-
vey of physician attitudes. Evaluation & the Health Professions 12 (3): 318–28.Hansen, M. H., and W. N. Hurwitz. 1946. The problem of nonresponse in sample surveys. Jour-
nal of the American Statistical Association 41:517–29.Houtkoop-Steenstra, H., and H. van den Bergh. 2000. Effects of introductions in large-scale tele-
phone survey interviews. Sociological Methods & Research 28 (3): 281–300.Lemay, M., and C. Durand. 2002. The effect of interviewer attitude on survey cooperation. Bul-
letin de Methodologie Sociologique 76:27–44.Lin, I.-F., and N. C. Schaeffer. 1995. Using survey participants to estimate the impact of
nonparticipation. Public Opinion Quarterly 59:236–58.Lynn, P. C., P. Clarke, J. Martin, and P. Sturgis. 2002. The effects of extended interviewer efforts
on nonresponse bias. In Survey nonresponse, edited by Robert M. Groves, Don A. Dillman,J. L. Eltinge, and R. J. A. Little, 135–48. New York: Wiley.
Schouten, B., J. Bethlehem, and I. Stoop. 2002. Respondents, persuadable non-respondents andpersistent non-respondents: A comparison. Paper presented at the Thirteenth InternationalWorkshop on Household Survey Nonresponse, Copenhagen, the Netherlands, August.
Singer, E., R. M. Groves, and A. D. Corning. 1999. Differential incentives. Beliefs about prac-tices, perceptions of equity, and effects on survey participation. Public Opinion Quarterly63:251–60.
Te Riele, S. 2002. Vertekening door non-respons: hoe nauwkeurig zijn de uitkomsten vanpersoonsenqutes? Heerlen, the Netherlands: Centraal Bureau voor de Statistiek. Retrievedfrom www.cbs.nl/nl/publicaties/artikelen/algemeen/non-respons/non-respons.pdf.
Van Leest, J., and W. Burhenne. 1997. Respons en non-respons in het AanvullendVoorzieningengebruikonderzoek(AVO), Werkdocument 42, Rijswijk: Sociaal en CultureelPlanbureau. Retrieved from www.scp.nl/boeken/werkdocumenten/doc42/nl/acrobat/default.htm.
Väisänen, P. 2002. Diary nonresponse in the Finnish time use survey. Paper presented at theThirteenth International Workshop on Household Survey Nonresponse, Copenhagen, theNetherlands, August.
INEKE A. L. STOOP studied methods of psychological research at Leiden University.She was employed by Leiden University and Statistics Netherlands and is currently headof the Department of Data Services and IT of the Social and Cultural Planning Office ofthe Netherlands, a governmental policy–related social research institute (www.scp.nl).She is a member of the Central Coordinating Team of the European Social Survey, theInternational Statistical Institute, and the European Advisory Committee on StatisticalInformation in the Economic and Social Spheres. Her main research interests are surveyquality and nonresponse.