ARTHUR H. LANGlakewoodlaworg.ipage.com/documents/Amended Petition.pdfARTHUR H. LANG 918 East Kennedy...
137
ARTHUR H. LANG 918 East Kennedy Blvd. Lakewood, NJ 08701 (732) 609-5530 [email protected] Attorney for Plaintiffs -------------------------------------- LEONOR ALCANTARA, individually and as Guardian ad Litem for E.A.; LESLIE JOHNSON, individually and as Guardian ad Litem for D.J.; JUANA PEREZ, individually and as Guardian ad Litem for Y.P.; TATIANA ESCOBAR individually; and IRA SCHULMAN, individually and as Guardian ad Litem for A.S. Plaintiffs, v. DAVID HESPE, COMMISSIONER OF THE NEW JERSEY DEPARTMENT OF EDUCATION; the NEW JERSEY STATE BOARD OF EDUCATION; and the NEW JERSEY DEPARTMENT OF EDUCATION Defendants -------------------------------------- ) ) ) )BEFORE THE )COMMISSIONER OF )EDUCATION OF NEW )JERSEY ) ) ) PETITION ) ) ) ) ) ) Petitioners, Leonor Alcantara, individually and on behalf of E.A.; Leslie Johnson, individually and on behalf of D.J.; Juana Perez, individually and on behalf of Y.P.; and Tatiana Escobar; residents of Lakewood, New Jersey who attend or whose children attend Lakewood public schools; and Ira Schulman, individually and on behalf of A.S., resident of Lakewood, New Jersey, whose child attends a Lakewood nonpublic school, by and through their attorney, Arthur H. Lang, Esq., hereby requests the Commissioner of Education to consider a controversy which has arisen between petitioner and 1 AMENDED AGENCY DOCKET 156-6/14
Transcript of ARTHUR H. LANGlakewoodlaworg.ipage.com/documents/Amended Petition.pdfARTHUR H. LANG 918 East Kennedy...

ARTHUR H. LANG 918 East Kennedy Blvd. Lakewood, NJ 08701 (732) 609-5530 [email protected] Attorney for Plaintiffs
--------------------------------------
LEONOR ALCANTARA, individually and as Guardian ad Litem for E.A.; LESLIE JOHNSON, individually and as Guardian ad Litem for D.J.; JUANA PEREZ, individually and as Guardian ad Litem for Y.P.; TATIANA ESCOBAR individually; and IRA SCHULMAN, individually and as Guardian ad Litem for A.S.
Plaintiffs, v.
DAVID HESPE, COMMISSIONER OF THE NEW JERSEY DEPARTMENT OF EDUCATION; the NEW JERSEY STATE BOARD OF EDUCATION; and the NEW JERSEY DEPARTMENT OF EDUCATION
Defendants --------------------------------------
) ) ) )BEFORE THE )COMMISSIONER OF )EDUCATION OF NEW )JERSEY ) ) ) PETITION ) ) ) ) ) )
Petitioners, Leonor Alcantara, individually and on behalf of
E.A.; Leslie Johnson, individually and on behalf of D.J.;
Juana Perez, individually and on behalf of Y.P.; and Tatiana
Escobar; residents of Lakewood, New Jersey who attend or whose
children attend Lakewood public schools; and Ira Schulman,
individually and on behalf of A.S., resident of Lakewood, New
Jersey, whose child attends a Lakewood nonpublic school, by
and through their attorney, Arthur H. Lang, Esq., hereby
requests the Commissioner of Education to consider a
controversy which has arisen between petitioner and
1
AMENDED
AGENCY DOCKET156-6/14

respondents whose address is the New Jersey Department of
Education, P.O. Box 500, Trenton, NJ 08625-0500, pursuant to
the authority of the Commissioner to hear and determine
controversies under the school laws (N.J.S.A. 18A:6-9), by
reason of the following facts:
BACKGROUND STATEMENT
Lakewood, New Jersey is the fastest growing city in the
United States. Its population is expected to reach 230,000 by
2030, of which over 100,000 will be school age children.1 Two
out of every 100 children in New Jersey currently go to school
in Lakewood. This ratio is projected to increase to one out
every ten within a generation. Many of these children will
become the future political and economic leaders of New
Jersey. The resolution of the issues raised in this petition
will affect their welfare and the wellbeing of the entire
state.
The relief plaintiffs seek will not open a floodgate of
litigation because Lakewood is unique and its facts and
circumstances are unlike any other district in New Jersey.
Approximately 5,500 students have annually attended Lakewood
public schools for the last two decades. By contrast, 25,000
students attended nonpublic schools in 2013-14 reflecting a
steady annual increase of approximately fifteen per. The Board
of Education has run deficits year for the last two decades in
!!!!!!!!!!!!!!!!!!!!!!!!!!!!!!!!!!!!!!!!!!!!!!!!!!!!!!!!1 “Lakewood’s population is anticipated to increase by another 50,000 between 2010 and 2020 and yet another 80,000 between 2020 and 2030, for a total increase over the next two decades of 130,000 persons, resulting in a total population of 230,000 by 2030.” S. Slachetka & M. Truscott, Lakewood Smart Growth Plan Prepared for Lakewood Township, T&M Associates, (2009).
2
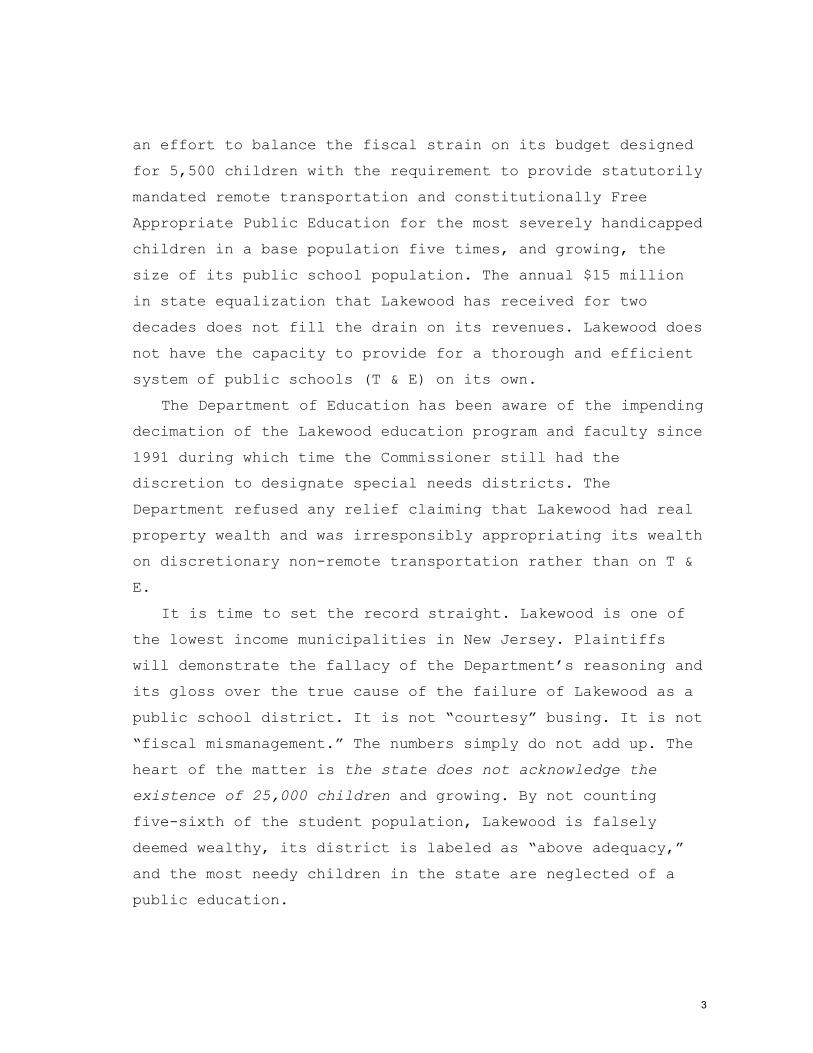
an effort to balance the fiscal strain on its budget designed
for 5,500 children with the requirement to provide statutorily
mandated remote transportation and constitutionally Free
Appropriate Public Education for the most severely handicapped
children in a base population five times, and growing, the
size of its public school population. The annual $15 million
in state equalization that Lakewood has received for two
decades does not fill the drain on its revenues. Lakewood does
not have the capacity to provide for a thorough and efficient
system of public schools (T & E) on its own.
The Department of Education has been aware of the impending
decimation of the Lakewood education program and faculty since
1991 during which time the Commissioner still had the
discretion to designate special needs districts. The
Department refused any relief claiming that Lakewood had real
property wealth and was irresponsibly appropriating its wealth
on discretionary non-remote transportation rather than on T &
E.
It is time to set the record straight. Lakewood is one of
the lowest income municipalities in New Jersey. Plaintiffs
will demonstrate the fallacy of the Department’s reasoning and
its gloss over the true cause of the failure of Lakewood as a
public school district. It is not “courtesy” busing. It is not
“fiscal mismanagement.” The numbers simply do not add up. The
heart of the matter is the state does not acknowledge the
existence of 25,000 children and growing. By not counting
five-sixth of the student population, Lakewood is falsely
deemed wealthy, its district is labeled as “above adequacy,”
and the most needy children in the state are neglected of a
public education.
3

COUNT I
1) The State does not provide for a system of Thorough and
Efficient Public Schools (hereafter T & E) in Lakewood
because not all of its children count. The School Finance
Reform Act of 2008 (hereafter SFRA) counts 5,500 children
registered in Lakewood public schools for the purpose of
determining educational adequacy and state funding. The
district actually provides mandated services for 30,500 K-12
children. The neglect of the state to acknowledge the
existence of 82% of Lakewood’s K-12 children in the
calculation of the adequacy budget and the local fair share
has devastated the capacity of one of the lowest income
municipalities in the state to provide for its public school
students.
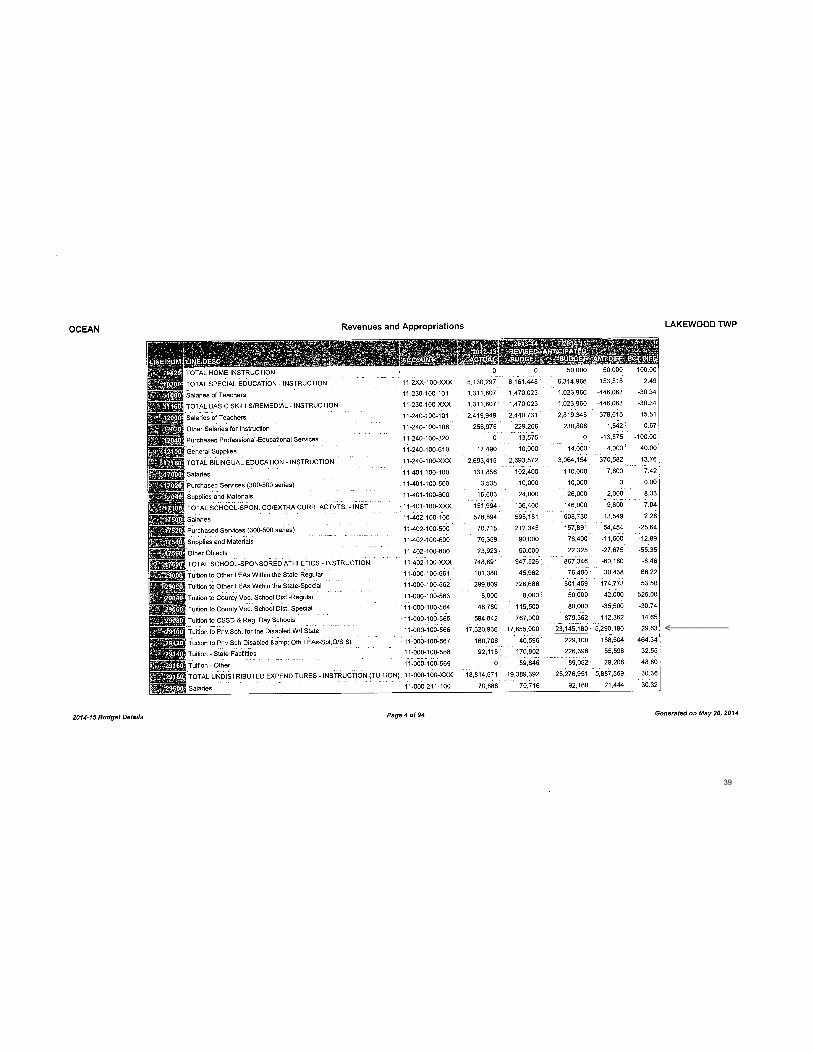
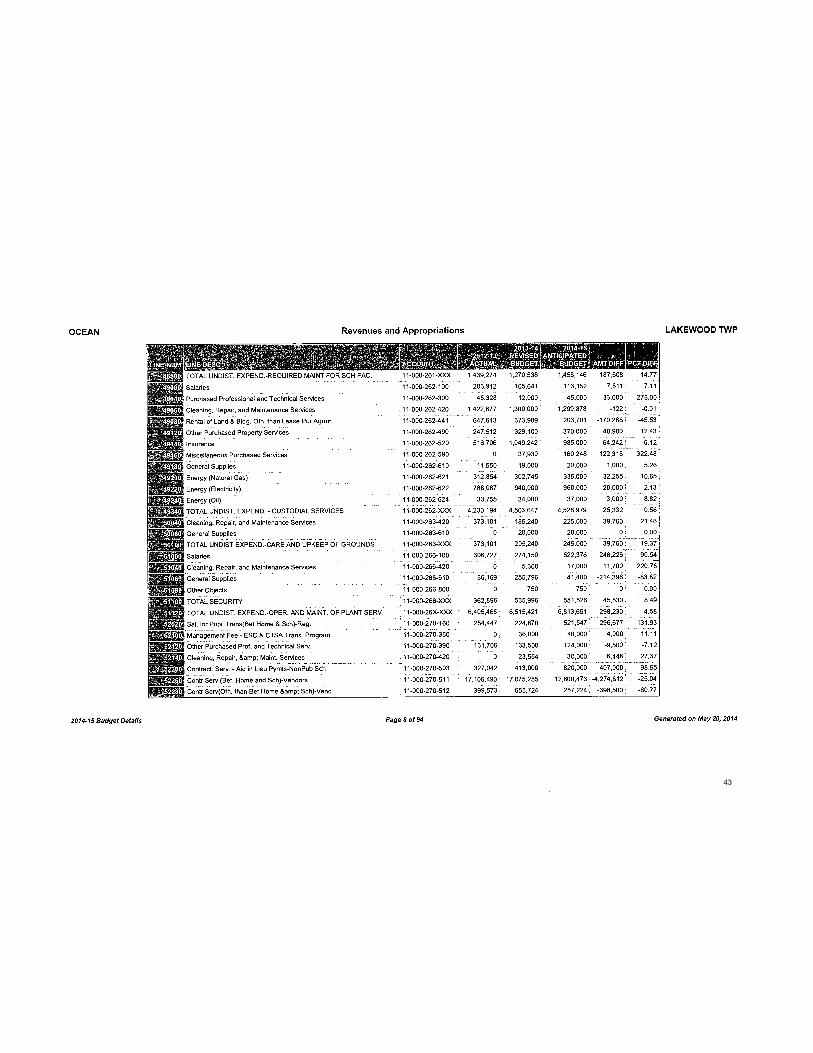
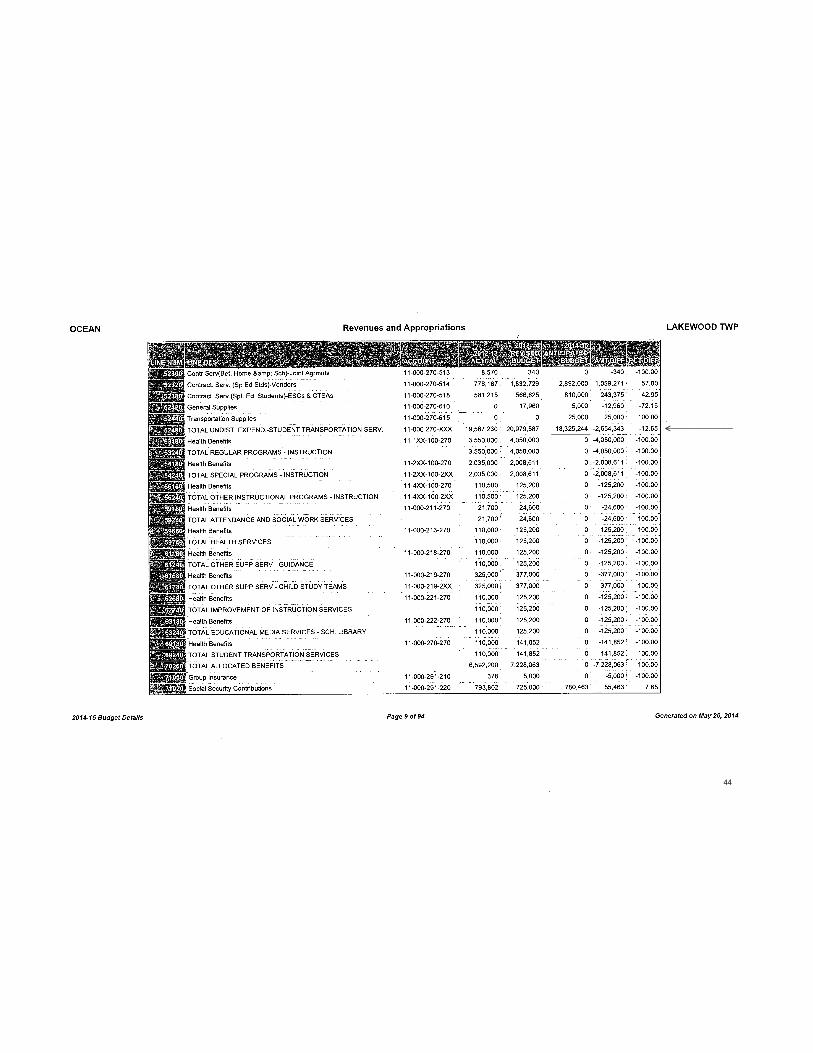
2) The 2014-15 local Board of Education budget allocates
$23,145,180 for extraordinary special education tuition and
$18,325,244 for transportation, of which $15,000,000 is for
mandated remote bussing, serving a population of 30,000
resident children out of a total operating budget of
$114,661,752. The appropriation of $38 million dollar in
mandated services will deplete one third of the operating
budget next year from T & E. (Exhibit 1)
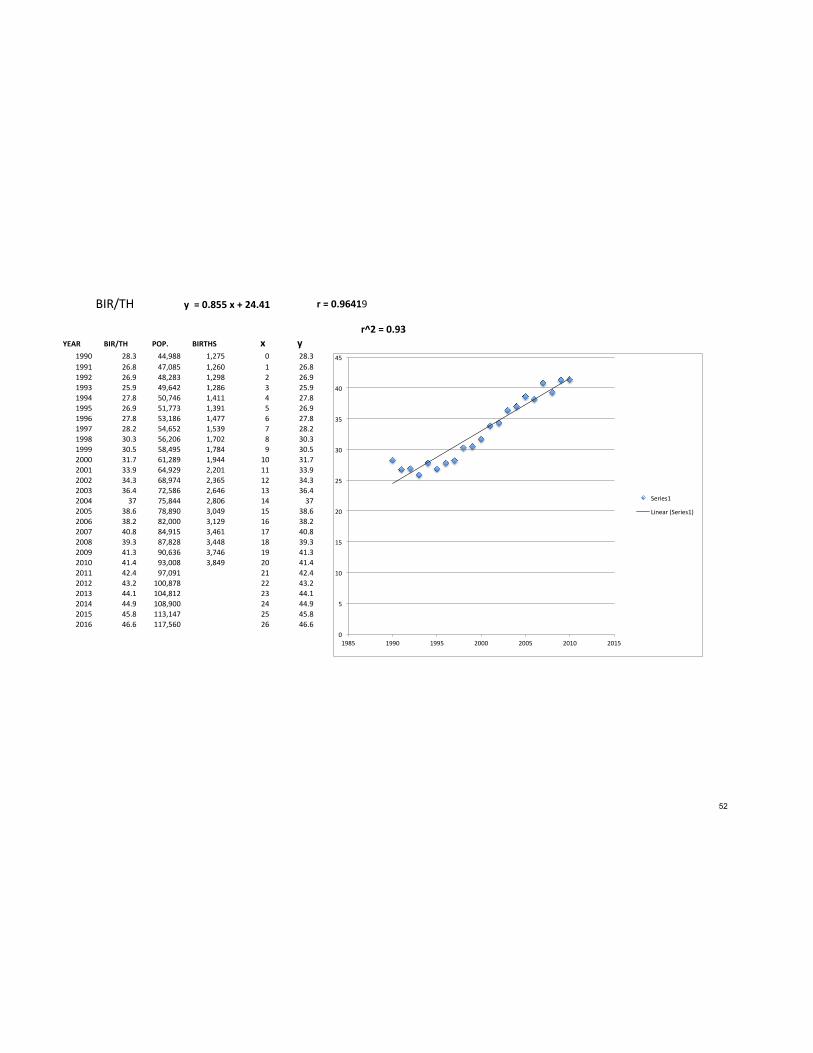
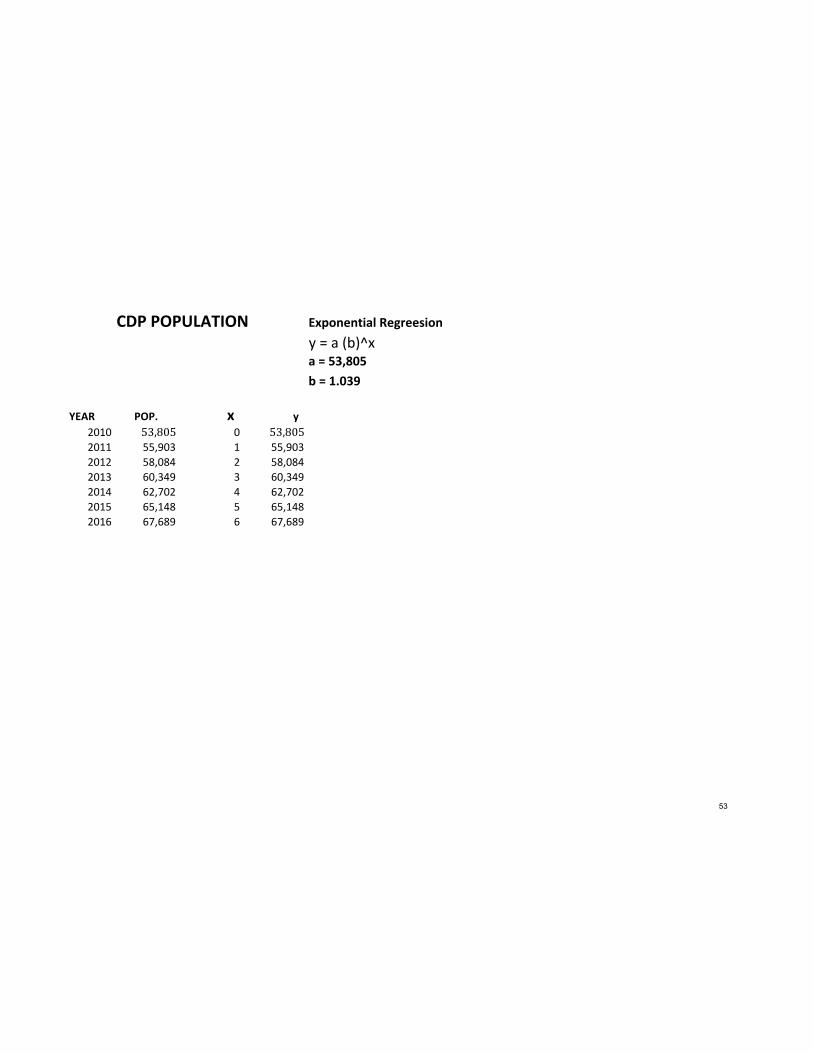
3) This imbalance increases every year. Lakewood is the
fastest growing municipality in New Jersey with an estimated
population of 108,900 in 2014. (Exhibit 2). The birthrate of
1,539 in 1995 increased to 3,849 in 2010, or 41.4 births per
thousand people. To put this number in perspective, in 2010
there were 4,294 births, or 17.3 per thousand in Jersey City,
and 4,202, or 15.2 per thousand in Newark. The Lakewood
4

population is expected to reach 131,857 in 2019. Spending on
mandated transportation and extraordinary special education
services for this multitude will increase to $58,017,045.
(Exhibit 3).
4) By contrast, public school enrollment has been relatively
constant over the last 18 years despite a small increase in
2014-15. (Exhibit 4). Hence, the operating budget and SFRA
adequacy is not expected to increase significantly. Moreover,
the state aid and tax levy growth limitations lag behind any
increase in enrollment. It is fair to conclude that the
transportation and extraordinary special education expenses
projected at $58 million will consume over half the operating
budget in 2019 requiring drastic reductions in force of
teachers.
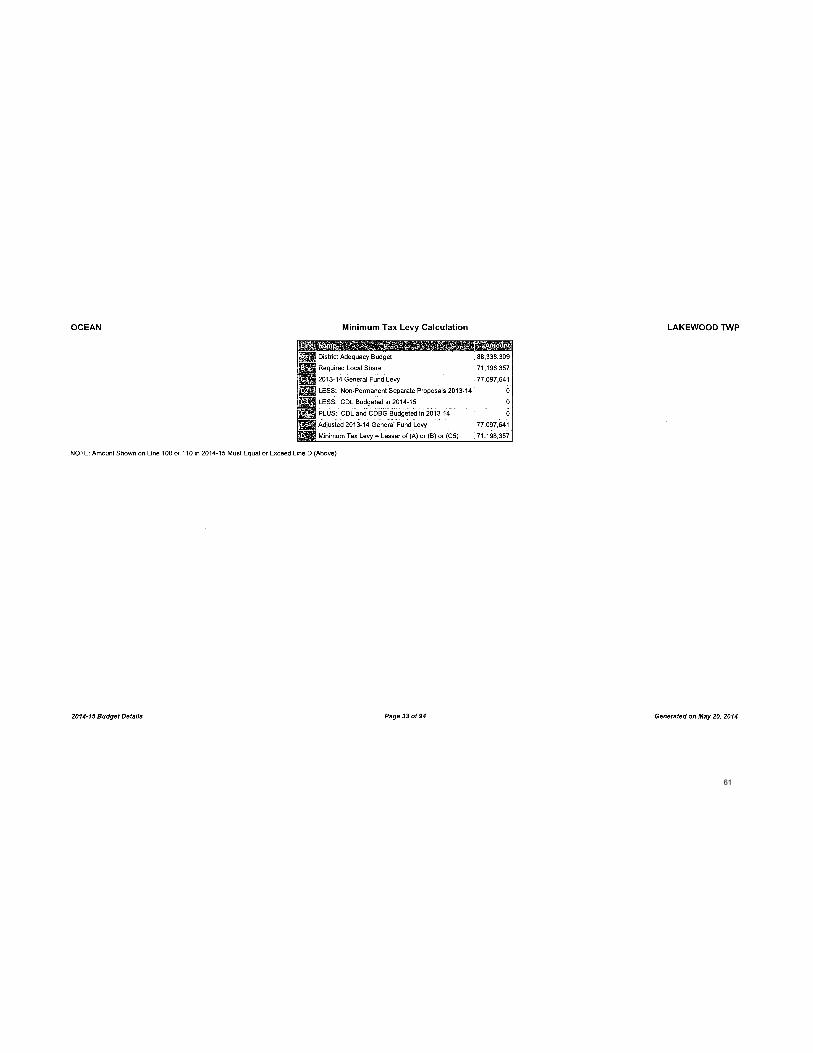
5) Lakewood taxpayers have been stretched to the limit of
their financial capacity to try to fill the gap. The
$84,693,837 general fund levy for 2014-15 is 18.8% more than
the local fair share of $71,198,357 under the SFRA (Exhibit
5).
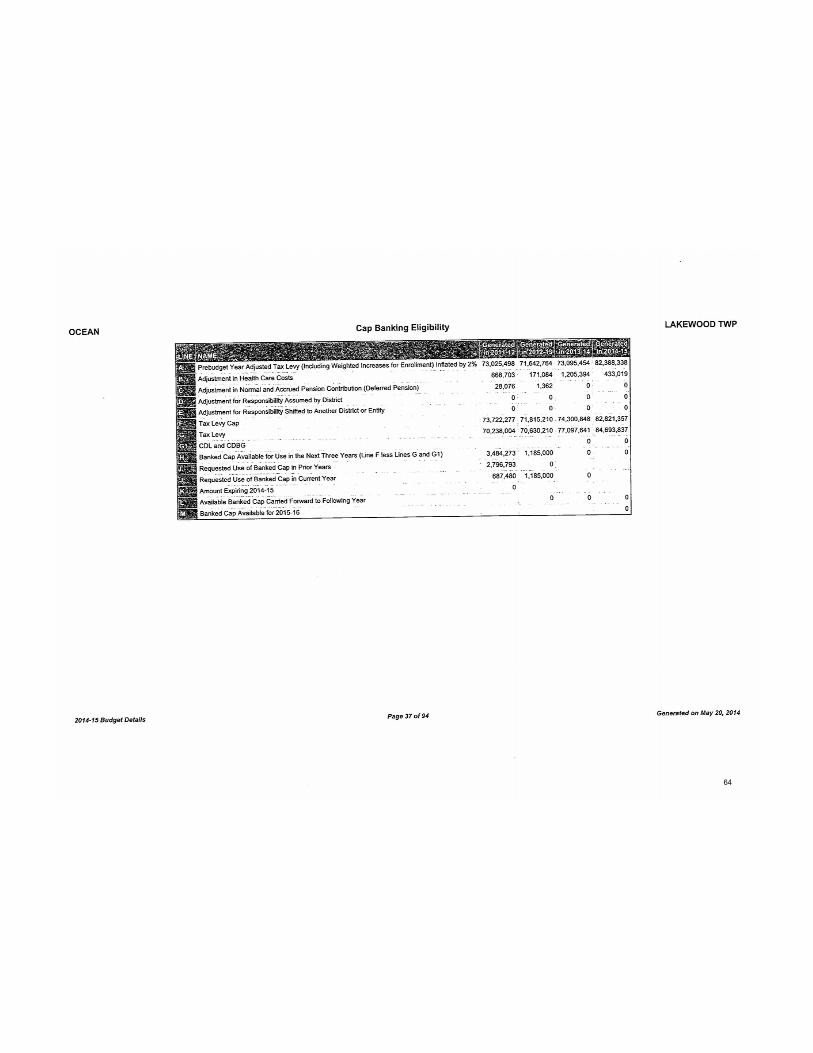
6) The levy of $84,693,837 is the maximum local taxation
allowable under NJSA 18A:7F-38. The Board of Education
exhausted its $1,872,480 in banked cap under NJSA 18A:7F-39.
These statutes limit the authority a board of education to
levy additional taxation. (Exhibit 6).
7) The Lakewood adequacy budget pursuant to N.J.S.A. 18A:7F-
51 is $88,338,309 for the purpose of educational adequacy and
state funding. (Exhibit 5). Lakewood is considered to be
5

spending “above adequacy” because the sum of its local levy
of $84,693,837 and equalization aid of $15,263,034 is
$99,956,871. (Exhibit 7). This is $11,618,562 more than
adequacy calculated according to this statute.
8) Subtracting the $40,184,235 spent on transportation and
extraordinary special education expenses from the adequacy
budget leaves only $59,772,636 for T & E. It is clear that
Lakewood is significantly below adequacy.
9) Adequacy is defined by another statute for the purpose of
the 10% state aid growth limitation. The Lakewood adequacy
budget pursuant to NJSA 18A:7F-47 is $93,476,013. This
statute defines adequacy as the sum of the local fair share,
equalization aid, special education categorical aid and
security aid. (Exhibit 8). Lakewood is considered to be
spending “above adequacy” according to NJSA 18A:7F-47 because
the $107,701,339 operating budget in 2013-14 is more than the
said sum. Subtracting the $40,184,235 spent on transportation
and special education expenses from the operating budget
leaves only $67,517,104, an amount that is $25,958,909 below
adequacy of $93,476,013.
10) Lakewood sent 207 students with extraordinary needs to
private schools for the disabled in 2013-14. The number
increased to 276 in 2014-15 budget. All of these children are
registered as public school students. The numbers are
consistent with the Abbott/SDA urban districts (hereafter
“urban districts”) of one out of every 114 children because
the 207 and 276 Lakewood students with extraordinary needs
opting for a FAPE came out of respective base populations of
6

27,000 in 2013-14 and 30,500 in 2014-15. Paterson, by way of
example, has a regular enrollment of 26,994 and sends 236
students to schools for the disabled.
11) The SFRA does not contemplate expenses of such magnitude
and their effect on T & E in Lakewood because it fails to
count all the children in its adequacy formula. Certainly
many districts suffer insufficient state aid for
transportation and extraordinary special education expenses
but the deficiency in those districts is offset by a
proportional and commensurate regular public school student
count in the T & E budget. Lakewood, by contrast, serves a
base of 30,500 resident children while its SFRA student count
is 5,500.
12) The 2013-14 total of $40,184,235 for extraordinary
special education and transportation services consumed 37.3%
of its $107,701,339 operating budget. This percent is
substantially more than that of any other large district or
any regular operating district not in a sending/receiving
relationship with another district (for which high tuition
expenses are expected for regular education). The average
transportation and tuition expense in urban districts is
11.9% of the operating budget.
13) The 2013-14 local tax levy of $77,097,641 represented a
five million dollar tax increase over 2012-13 tax levy and
was 8.3% more than the SFRA local fair share of $71,198,357.
This excess taxation was yet insufficient to cover expenses
resulting in a midyear deficit necessitating the district to
7
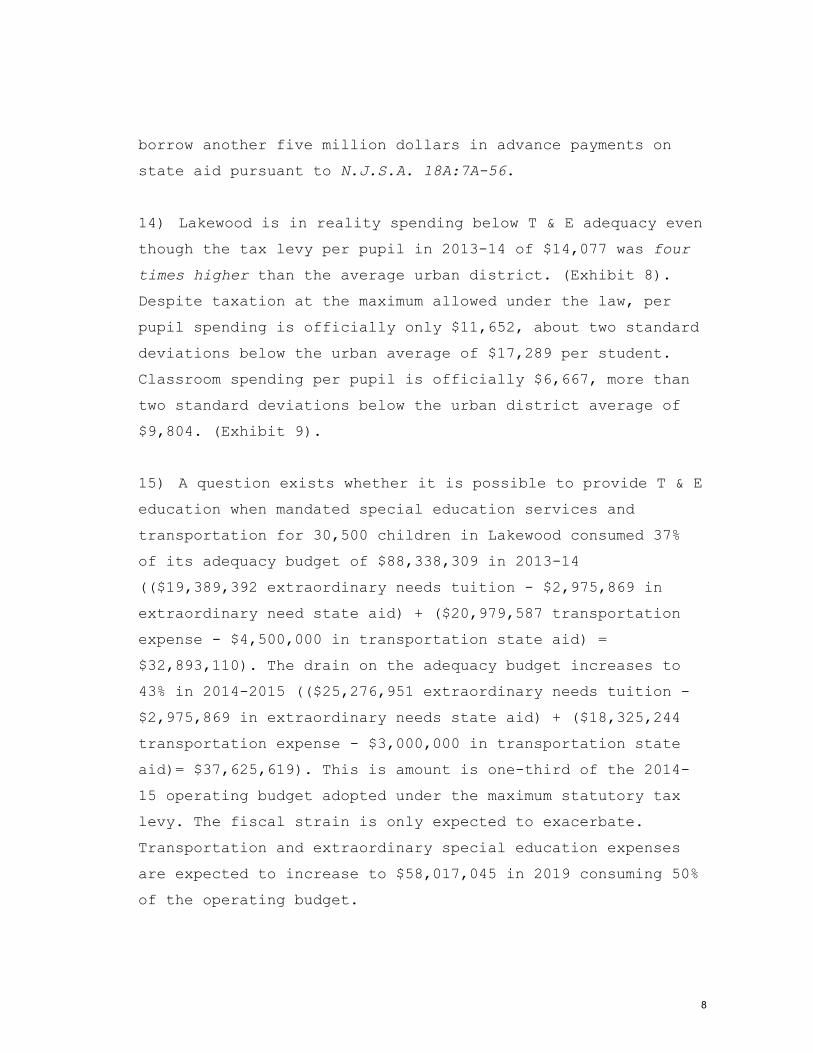
borrow another five million dollars in advance payments on
state aid pursuant to N.J.S.A. 18A:7A-56.
14) Lakewood is in reality spending below T & E adequacy even
though the tax levy per pupil in 2013-14 of $14,077 was four
times higher than the average urban district. (Exhibit 8).
Despite taxation at the maximum allowed under the law, per
pupil spending is officially only $11,652, about two standard
deviations below the urban average of $17,289 per student.
Classroom spending per pupil is officially $6,667, more than
two standard deviations below the urban district average of
$9,804. (Exhibit 9).
15) A question exists whether it is possible to provide T & E
education when mandated special education services and
transportation for 30,500 children in Lakewood consumed 37%
of its adequacy budget of $88,338,309 in 2013-14
(($19,389,392 extraordinary needs tuition - $2,975,869 in
extraordinary need state aid) + ($20,979,587 transportation
expense - $4,500,000 in transportation state aid) =
$32,893,110). The drain on the adequacy budget increases to
43% in 2014-2015 (($25,276,951 extraordinary needs tuition -
$2,975,869 in extraordinary needs state aid) + ($18,325,244
transportation expense - $3,000,000 in transportation state
aid)= $37,625,619). This is amount is one-third of the 2014-
15 operating budget adopted under the maximum statutory tax
levy. The fiscal strain is only expected to exacerbate.
Transportation and extraordinary special education expenses
are expected to increase to $58,017,045 in 2019 consuming 50%
of the operating budget.
8

WHEREFORE, Plaintiffs petition the Commissioner to recommend
to the governor the creation of new categorical aid in his
budget and/or to implement any and all remedies within his
authority to fill the deficiencies in the adequacy budget of
Lakewood.
PLAINTIFFS further petition the Commissioner to recommend
that the legislature provides for an adjustment to the SFRA to
account for all of the children in Lakewood either directly in
the calculation of the adequacy budget or indirectly in the
calculation of the local fair share because the SFRA as
applied to Lakewood is currently unconstitutional as it is
impossible to provide T & E under provisions designed for
5,500 children when in reality the district serves a resident
population of 30,500 children and growing.
PLAINTIFFS further petition the Commissioner for a declaratory
ruling pursuant to N.J.A.C. 6A:3-2.1 that the state aid growth
limitation is inapplicable to any and all possible remedies.
COUNT II
16) All of the allegations contained in the paragraphs above
and below are hereby incorporated by reference as if fully
set out herein.
17) The failure of the State to provide adequate funding has
dramatically affected T & E in Lakewood and is deleterious to
the achievement of its most needy public school students. 92%
of Lakewood public school students are “at risk” as defined
by the SFRA.
9

18) The district has inadequate funding and does not provide
special education students with pullout support in Lakewood
High School (hereafter LHS). Surrounding districts with much
lower percentages of low-income children provide special
education students with small group or individualized pullout
instruction.
19) LHS provides some special education students with an in-
class support teacher in addition to a regular subject
instructor while other students are provided only with a
special education teacher without a regular education
teacher.
20) The district has inadequate funding and does not provide
Limited English Proficiency (LEP) students with pullout
support in LHS. Surrounding districts with much lower
percentages of low-income children provide LEP students with
small group or individualized pullout instruction.
21) The district has inadequate funding and does not provide
special education students in LHS with in-class support or
any special education services for science or social studies.
22) The district has inadequate funding and does not provide
LEP students in LHS with in-class support or any LEP services
for science or social studies.
23) The district has inadequate funding and does not employ
intervention and remediation specialists in LHS.
10
24) The deficiencies in funding have affected achievement in
the elementary schools, middle school and high school.
Lakewood students score substantially lower than the state
average in every grade level on the NJ ASK. (Exhibit 10).
44.8% of students in LHS were proficient or advanced
proficient in the 2013 mathematics HSPA, almost half the
state average of 79.7%, and substantially below the 60.8%
median of the urban districts and substantially below the
55.2% average of the urban districts. 70.7% of students were
proficient or advanced proficient in the 2013 language arts
HSPA, substantially below the state average of 91.6%, and
below the urban median of 77.8% and the urban average of
75.5%.
25) LHS is ranked 324 out of 328 New Jersey high schools in
the New Jersey Monthly high school rankings of School
Environment, Student Outcomes and Student Performance.
(Exhibit 11)
26) The district has inadequate funding and employs only one
supervisor of curriculum and instruction in charge of both
mathematics and science for all its elementary schools,
middle school and high school. The district has inadequate
funding and employs only one supervisor of curriculum and
instruction in charge of both language arts and bilingual
education for all its elementary schools, middle school and
high school. Other districts employ supervisors for each
subject and/or employ supervisors in each school building.
27) Heating, air conditioning and the roofs in the public
schools are deteriorated. The district proposed a facilities
11

rehabilitation project with an eligible cost of $29,371,401
but it is unlikely that the voters will approve these repairs
given the 2014-15 school tax increase of seven million
dollars and the extremely low income of the tax base.
“[D]eficiencies in these areas directly affect the health and
safety of the children. . . .” Abbott by Abbott v. Burke
(Abbott V), 153 N.J. 480, 520 (N.J., 1998).
28) The popular wood shop, metal shop, and auto shop in LHS
were closed due to the financial strains of inadequate
funding. Their teachers were dismissed and the industrial
arts wing of the high school was renovated to make room for
the board office last year. For the “many students in poor
urban districts [who] presently do not continue their
education beyond high school (and many do not even finish
high school), vocational education is particularly important
in providing entry level job skills.” Abbott v. Burke, EDU
5581-85 (initial decision), August 24, 1988,
http//:njlegallib.rutgers.edu/legallib/njar/v13/p0001.pdf
(hereafter Lefelt) at 179.
29) Inadequate funding has made the marching band and music
program of LHS a shadow of its former glory as one the finest
equipped and best instructed in the state a decade ago. “For
students who are interested in music, urban students are
taught in poorer facilities, and are offered fewer courses
and performance opportunities and a later start in music
education than their suburban counterparts.” Id. at 224
Moreover, LHS formerly employed a Latin teacher, a media
production teacher, and teacher aids to help with instruction
in general. The rich curriculum of a decade ago has been
12

reduced to meeting basic requirements for graduation due to
inadequate funding.
30) LHS has had a new principal every year or second year for
almost a decade. New teacher turnover is extremely high. The
average years of service of veteran Lakewood teachers has
drastically declined over the last decade. The median salary
of $49,639 in Lakewood was the lowest of any large K-12
districts (3501 + students) in 2011 due to the inadequate
funding. The 2012 median salary of $50,069 was substantially
lower than the state average median salary of $62,683.
31) Out of 83 first to third grade classes, fifty have 22 or
more students in the classroom, 32 have 25 or more, 19 have
27 or more. Out of 45 fourth and fifth grade classes, 18 have
24 or more. (Exhibit 12). Since 92% of Lakewood students are
defined as “at-risk,” Lakewood class sizes exceed the maximum
number as set by N.J.A.C. 6A:13-3.1. “Class size in school
districts in which 40 percent or more of the students are
‘at–risk’ as defined in P.L. 2007, c. 260 shall not exceed 21
students in grades kindergarten through three, 23 in grades
four and five and 24 students in grades six through 12.” Id.
32) Other deficiencies in T & E, particularly those in the
middle school and elementary schools, will be disclosed
during discovery.
WHEREFORE Plaintiffs petition the Commissioner to make a
declaratory ruling that Lakewood is inadequately funded.
13

Plaintiffs further petition the Commissioner to provide any
and all administrative remedies and to recommend any and all
legislation that will correct the SFRA as applied to Lakewood
because its students actually do not receive the
constitutionally mandated T & E education.
Plaintiffs further petition the Commissioner to recommend to
the legislature the full financing of the rehabilitation of
Lakewood schools or the building of new facilities pursuant to
N.J.S.A. 18A:7G-5(k) which provides that a “district factor
group A or B . . . district may apply to the commissioner to
receive 100% State support for the project and the
commissioner may request the approval of the Legislature to
increase the State share of the project to 100%.” Lakewood
meets the eligibility requirements under N.J.A.C. 6A:26-3.7(j)
and was “district factor group A or B as of July 18, 2000.”
Id.
COUNT III
33) All of the allegations contained in the paragraphs above
and below are hereby incorporated by reference as if fully
set out herein.
34) Lakewood is an urban district and is recognized by the
Department of Education as a peer of the Abbott/SDA urban
districts (“urban districts”) for the purpose of comparative
achievement in the Department’s performance reports. One
hundred forty seven schools from almost every former Abbott
district are listed as peers of Lakewood schools. Only four
non-Abbott DFG A or B schools are peers of any Lakewood
school. (Exhibit 13)
14

35) The population of Lakewood, estimated at 108,900, is more
than twice the median population of the average urban
district supporting the conclusion that Lakewood is an urban
district and should be treated as such.
36) The Department formerly used population density to aid in
its designation of lower income urban districts. The density
of Lakewood Census Designated Place (CDP), in which the
majority of the 30,500 resident student live, is 7,602
persons per square mile, slightly less than the median urban
district, but almost seven times denser the New Jersey
average. (Exhibit 9)
37) 94% of Lakewood public school students are Hispanic or
African American. (Exhibit 16). The poverty rate of Lakewood
is 33.1%, almost two standard deviations more than the urban
average of 20.72%. (Exhibit 9). 92% of Lakewood public school
students are eligible for free and reduced lunch
substantially more than the urban district average of 76%.
(Id.)
38) The labor force of New Jersey is 51.3% of its population.
The labor force of the average urban district is 38.1% of
population. The labor force of Lakewood is only 30.3% of the
population. Only 30 working people provide for the shelter
and subsistence of every 100 people in Lakewood. This is due
to the fact that almost half, 48.4% of the population of
Lakewood CDP, is under 18, whereas the state average is
23.5%. The ratio of working adults to young K-12 children is
too small and the income supporting their large households is
15

too low to provide adequate T & E in the public schools
without help from the state. To wit, the median household
income in Lakewood is $41,527 and the median household income
of Lakewood CDP is $36,516. The state average median
household income is $113,162 and the urban average is
$44,967.
39) The typically large Lakewood family shares its home with
another family because it cannot otherwise afford to pay its
property taxes. This is not wealth. It is clear to anyone
familiar with housing in Lakewood that a large percent of
households reside in “single family dwellings turned into
multiple family dwellings.” Lefelt at 32.
40)
41) The failure to fund Lakewood as a low income urban
district has affected achievement. Only 43% of Lakewood High
School graduates are in postsecondary school after 18 months,
more than two standard deviations below the urban average of
61.84%. The dropout rate of Lakewood High School is 4.7%
almost double the urban median of 2.3%. The graduation rate
is 71%, slightly below the urban average of 72.5%.
42) The Robinson and Abbott cases coined the term “municipal
overburden” to denote the excess expense of maintaining
adequate police, fire and sanitary services in the urban
areas. The cost of these services in urban areas causes
fiscal pressures on the tax base that strain its capacity to
adequately provide funding for T & E. The expenses of the
Abbott districts PALE IN COMPARISON to the fiscal pressures
on the Lakewood tax base, that of one of lowest household and
16

per capita income municipalities in New Jersey, in providing
mandatory services for all its children under a statute that
counts only 5,500, while independently paying hundreds of
millions for the nonpublic education of 25,000 of its
children.
43) The SFRA cost of educating all 30,000 children in
Lakewood would be $553,513,871 ($455 million using 2011-12
numbers, exhibit 14) or 43% of Lakewood’s aggregate income of
$1,280,273,414. The true expenditure of Lakewood families for
the K-12 education of 25,000 nonpublic children is probably
closer to $300 million per year, one quarter of the aggregate
income of the whole tax base. By contrast, the state average
local cost of education is 4.5% of aggregate income. The
education of the non-public school students “must also be met
out of the same tax base and the total demands exceed what
the local taxpayers are willing or able to endure.” Robinson
v. Cahill, 62 N.J. 473, 499 (N.J. 1973).!
44) Moreover, the local school levy is $84.5 million, 6.6% of
income; the municipal levy is $49.1 million, 3.8% of income;
and the county levy is $28.3 million, 2.2% of income. The
municipal, school and county taxes in Lakewood are 12.1% of
aggregate income whereas the average in the urban districts
is 10.2%. !
45) Municipal overburden ought not to be limited to the de
jure expenses of municipal government but indicative of the
de facto inability of the local capacity to support T & E
education due to the competition for and depletion of the
financial resources of the tax base. It “is a factual
17

conclusion.” Abbott II, 119 N.J. 287, 357 (June 1990). Hence,
the municipal overburden of the local school, county and
municipal taxes and the local educational cost of 30,500
children amounts to one third of the aggregate income of
Lakewood residents.
46) The method formerly used by the Department to determine
the financial capacity of the local tax base by dividing
property valuation and income by registered pupils rather
than per capita property value and per capita income
projected a false perception of wealth in Lakewood. It failed
to account for the true number of K-12 children competing for
the paltry financial resources of Lakewood families and of
the district, thereby unconstitutionally depriving public
school students of adequate state equalization aid and of T &
E.
47) Administrative Law Judge Lefelt in the original Abbott
case specifically ruled “urban aid municipalities had
considerably less fiscal capacity when measured by per capita
income and property taxes per capita.” Lefelt at 262
(emphasis added). The equalized property per capita of
Lakewood is $65,525 whereas the urban average is $61,135. The
state average is $130,334. The per capita income of Lakewood
is $16,430, ranking 555 out 564 municipalities in New Jersey.
The per capita income in Lakewood CDP is $11,654. Both are
substantially lower than the urban average per capita income
of $22,585 and the state average of $39,940.
48) Local taxpayers in Lakewood have been forced to lease
their personal living space in order to pay their taxes
18

because the Department determined local capacity using an
arbitrary and capricious methodology without analysis as to
its validity in Lakewood. Ability to adequately support T & E
was determined not by per capita property wealth in which all
of the children would count, but by the ratio of property
value to K-12 registered public school students, a number
that fails to account for over 82% of the children.
49) If all of the children of Lakewood attended the public
schools costing the state an extra $500 million a year,
equalized property value per student would be only $237,857
using the capricious former methodology, far below the
average urban district property value per student of
$377,021. As if by the wave of the wand, since the vast
majority of children in reality attend nonpublic schools, the
Lakewood tax base, that would have otherwise been considered
to be one of the poorest in the state had those children
attended public schools, is determined by this arbitrary and
capricious methodology (of dividing Lakewood property wealth
by enrollment) to be “property wealthy.”
50) It is not the taxpayer who has suffered the most under
this irrational methodology of determining wealth, but the
children in Lakewood public schools that are not provided
with T & E.
51) Chief Justice Wilentz could have been describing the
public school children of Lakewood and their need for
adequate state aid when he described urban students as living
“in a culture where schools, studying, and homework are
secondary. Their test scores, their dropout rate, their
19

attendance at college, all indicate a severe failure. . . .”
Abbott v. Burke (Abbott II), 119 N.J. 287, 295 (N.J. 1990).
WHEREFORE Plaintiffs petition the Commissioner for a
declaratory ruling that Lakewood is and ought be designated an
urban district with special needs as great or greater than the
urban districts that are entitled to full SFRA funding because
of their "status akin to that given to wards of the State."
Abbott v. Burke, 206 N.J. 332, 340 (Abbott XXI, 2011).
Plaintiffs further petition the Commissioner for any and all
administrative remedies to address the special needs of
Lakewood students and to make any and all recommendations to
the legislature to adequately rectify the years of neglect.
COUNT IV
52) All of the allegations contained in the paragraphs above
and below are hereby incorporated by reference as if fully
set out herein.
53) The Department of Education was arbitrary and capricious
in 2004 when it removed Lakewood from the list of District
Factor Groups (DFG) that categorizes districts according to
socio-economic status. Lakewood was declassified because
“methodological decisions were made to avoid classifying a
school district in an inappropriate DFG category[;]. . .
districts in which more than half of the school-aged
population is enrolled in non-public schools were not
classified in a DFG."
http://www.state.nj.us/education/finance/rda/dfg.shtml
20

54) On its face, the "methodological decision" to exclude
Lakewood from the DFGs is seemingly consistent with a
subsequent 2010 Education Law Center report, “Is School
Funding Fair?” The report lists four Fairness Measures in
state school funding, one of which is Coverage.
Coverage is “[t]he share of the state’s students in public schools, and the median household income of those students, is an important indicator of the distribution of funding relative to student poverty (especially where more affluent households simply opt out of public schooling), and the overall effort to provide fair school funding."
http://www.schoolfundingfairness.org/National_Report_Card_2010
.pdf at 9.(Exhibit 15). Coverage assumes that a “higher
percentage of students in public schools requires a greater
state funding effort.” Id. at 29. This is certainly valid for
New Jersey in the aggregate, in which the median household
income of nonpublic school families is $131,709 and the median
household income of public school families is $100,837.
55) It is fallacy to conclude the inverse: a lower percentage
of students in public schools requires a decreased state
funding effort. This is particularly false in Lakewood where
the median household income is $41,527 and the median
household income of Lakewood CDP, where the vast majority of
public and nonpublic school students live, is $36,516. The
state average median household income is $113,162 and the
urban average is $44,967. It is highly unlikely that the
median household income limited to nonpublic families should
differ significantly when 83% of children attend nonpublic
schools.
56) The United States Census American Community Survey
reports that the population of Lakewood was 92,443 in 2010.
21

The per capita income of $15,584 is the ninth lowest in New
Jersey. If Leisure Village CDP and other largely senior
citizen census designated places in Lakewood are eliminated
from the data, we are left with Lakewood CDP, where the per
capita income is $11,654, the lowest in any CDP or area in
the state.
57) 70% of 25,0000 nonpublic school students receive free and
reduced lunch and are from families below the poverty line.
(Exhibit 16). They are not from “more affluent households
[that] simply opt out of public schooling” but together with
their parent taxpayers constitute a single class of citizens
that have been unfairly discriminated against and
capriciously determined to have disposable wealth because
their children attend nonpublic schools in order to get a
religious education.
58) This arbitrary and capricious generality bolstered the
ancient and commonly heard stereotype of the class of
citizens making up the majority of taxpayers in Lakewood as
wealthy, and created the popular misconception that Lakewood
has sufficient capacity to provide T & E without increased
state aid effectively denying its public school children an
adequate education. It precluded the perception of its
special needs status, and chilled any effort by legislators
in 2007 to designate Lakewood as eligible for 100% state
financing as a School Development Authority district and/or
to adjust the funding statute to address the unique
challenges of the district.
59) The Department erred and overgeneralized thereby
eliminating any and all socio-economic indicators "relative
22

to student poverty" in Lakewood in its policy. Lakewood was
simply declassified. Its taxpayers have money. Its children
do not count in the eyes of the Department. Nor does their
district.
WHEREFORE Plaintiffs petition the Commissioner to
retroactively classify Lakewood as a DFG A urban district.
PLAINTIFFS further petition the Commissioner to issue a
declaratory ruling that Lakewood was otherwise eligible for
“education opportunity aid or preschool expansion aid in the
2007-2008 school year,” that Lakewood qualifyies for 100%
facility financing under the School Development Authority
pursuant to NJSA 18A:7G-3 and that going forward, Lakewood
shall receive the same full preschool expansion aid as the
other urban districts.!
COUNT V
60) All of the allegations contained in the paragraphs above
and below are hereby incorporated by reference as if fully
set out herein.
61) The SFRA does not fund special education in New Jersey
based on the actual count of students opting for FAPE, but by
a fixed ratio of 14.69% of total public school enrollment.
This underfunds Lakewood children in violation of the Equal
Protection Clause of the Fourteenth Amendment. The base K-12
population of 30,500 students with the right to FAPE is
almost six times greater than regular enrollment. A student
23
can reasonable expect to receive a viable FAPE without resort
to expensive litigation given that funding is adequate for
only 809 students (14.69% of 5,500) while 4,407 children
(14.69% of 30,000) are assumed to be eligible for FAPE. In
actuality, 3,547 nonpublic students and about 750 public
school students were eligible for FAPE in 2010. Hence, the
actual count of students eligible for FAPE is not 14.69% of
district enrollment, but a number equal to almost 80% of the
entire public school enrollment.
62) The Department of Education misled the Abbott XX Court
stating that the “census-based method only accounts for one-
third of the special education funding. SFRA funds the other
two-thirds of special education costs by allocating an excess
dollar amount for each special education student in a
district.” Abbott v. Burke 199 N.J. 140 (2009) (Abbott XX).
Census-funding accounts not for only one-third of special
education funding but for all special education funding.
There is not provision in the formula to count “each special
education student in a district.”
63) The consultant hired pursuant to N.J.S.A. 18A:7F-55(f) to
study the impact of census-funding “drew two tentative
conclusions from the existing data: (1) New Jersey might need
to consider funding special education based on the actual
enrollment of special education students in districts and (2)
the state might need to consider some differentiation of
funding for higher cost students before the extraordinary aid
threshold is reached .” Augenblick, Palaich and Associates,
Analysis of New Jersey’s Census-Based Special Education
Funding System, Prepared for the New Jersey Department of
24

Education. (2011) at 49. Both recommendations are pertinent
to Lakewood.
64) 207 children with extraordinary needs in Lakewood were
found and evaluated out of the population of 30,500 children
and provided with an FAPE at a cost of $19,053,992 in school
year 2013-14 and 276 children at a cost of $25,275,951 in
2014-15. These children are registered public school
children. The number and cost has increased every year as the
population has increased. The cost, which was 11% of the
operating budget in 2006, is now 22% for 2014-15. Yet, the
addition of each one of these children brings in only 14.69%
of the base cost allocated by the SFRA for special education
children.
65) The urban districts average 114 enrolled students for
each child they send to a private school for the disabled.
The total number of enrolled resident students funded in the
typical district adequacy budget more or less offsets the
expenses of students in need of extraordinary services send
to private schools for the disabled. Lakewood, by contrast,
had only 26 enrolled students for each student sent to a
private school for the disabled in 2013-14 and only 22 in the
2014-15 operating budget. (Exhibit 8). By counting only the
5,500 enrolled students in special education funding, the
Department ignores the fact that the pool of Lakewood
students offered an FAPE is 30,500.
66) Lakewood is not over classifying. Large districts such as
Paterson, with an enrollment of 26,423, sends 236 students to
private schools for the disabled; Newark, with an enrollment
25
of 45,327, sends 432 students. The 207 students in need of
extraordinary services in Lakewood sent to private schools
for the disabled is one out of 130 given the base population
of 27,000 in 2013-14, well within a standard deviation of the
urban average of one out of 114.
67) The Department violates the right of all students with
disabilities of equal protection of the law under the
Fourteenth Amendment to the Federal Constitution because the
local capacity in Lakewood cannot provide the extraordinary
special education expenses for a population of 30,500 on a
budget designed for 5,500. The Department also indirectly
violates the T & E Clause of the New Jersey Constitution
every time a classified special education child wins a court
order affirming his or her constitutional right to FAPE
because the addition of each new student disproportionately
decreases funds available for T & E of all public school
regular and special education students in Lakewood.
68) The deficiency of funding has lead to less support of
special education students in the public schools and has
affected their achievement. 38.5% of special education
students in Lakewood were proficient or advanced proficient
in the 2014 language arts HSPA. 2.6% special education
students were proficient or advanced proficient in the 2014
mathematics HSPA. (Exhibit 17). Both percentages are
substantially below the State average of special educations
students in 2013 of 67.8% in language arts and 38.2% in
mathematics.
26
69) Failing to provide adequate education to public school
children with special needs is discriminatory under the
United States Constitution, §504 of the Rehabilitations Act,
and the Americans with Disabilities Act.
WHEREFORE Plaintiffs petition the Commissioner for declaratory
ruling that the SFRA census count is unconstitutional as
applied to Lakewood.
PLAINTIFFS further petition the Commissioner for a declaratory
ruling that the provision of $3,000,000 in extraordinary aid
is inadequate given that extraordinary costs are depleting the
operating budget in Lakewood and to recommend to the
legislature the provision of full extraordinary aid under the
SFRA for Lakewood.
PLAINTIFFS further petition the Commissioner for additional
special education categorical aid pursuant to N.J.S.A. 18A:7F-
55 (g)due to “the impact of the unusually high rate of low-
incidence disabilities on the school district budget and the
extent to which the costs to the district are not sufficiently
addressed through special education aid and extraordinary
special education aid.”
PLAINTIFFS further petition the Commissioner to remedy the
drain of extraordinary tuition costs on T & E by recommending
to the legislature to fully finance the building of an in-
district facility for students with extraordinary special
education needs pursuant to N.J.S.A. 18A:7G-5(k) so that
students with those needs may remain in-district allowing 90%
of costs above $40,000 to be coverable by the state under NJSA
27
18A:7F-5 rather than 75% of expenses above $55,000 currently
coverable for students sent to private schools for the
disabled.
COUNT VI
70) All of the allegations contained within the paragraphs
above and below are hereby incorporated by reference as if
fully set out herein.
71) The state formula rewards the taxpayers in districts with
large ratios of public school students to nonpublic school
students while it has been apathetic toward the fiscal strain
of the unique circumstances of Lakewood. Newark, 554 in per
capita income, with 93.1% of its K-12 population in public
schools, taxed $46 million below its local share in 2013
returning 6.2% of its adequacy budget to its taxpayers.
Paterson, 556 in per capita income, with 97.7% in public
schools, taxed itself 44.7 million less than its share
returning 9.9% of its adequacy budget to taxpayers. Among the
districts bordering Lakewood, Toms River Regional with 95% in
public schools taxed itself $67.7 million less than its share
returning 28% of its adequacy budget to its taxpayers. Brick
with 93.7% in public schools taxed itself $23.6 million below
its share returning 18.3% of its adequacy budget to
taxpayers. Jackson with 95.9% in public schools taxed itself
$6.1 million below its local share returning 5.1% of its
adequacy budget to its taxpayers. These districts were able
to lower taxes because their SFRA adequacy budgets and
commensurate state funding by and large reflected their true
28

operating costs. Extraordinary special education and
transportation costs were more than offset by a sufficient
count of enrolled regular education students.
72) Had all 30,500 K-12 children registered for the public
schools, Lakewood would be eligible for over $400 million in
equalization aid while the local fair share would remain $72
million. Like its sister districts, Lakewood also would be
sufficiently funded to cut into its adequacy budget and tax
itself below its local fair share. But in reality, Lakewood,
with only 16.7% of its K-12 population in public schools, not
only foregoes over $385 million in equalization aid, it taxed
itself $5.9 million more than its local share in 2013-14 and
$13.4 million or 18.8% more than its fair share in 2014-15.
73) The failure of the state to provide adequate funding in
Lakewood has deprived the citizens and taxpayers of the
discretion, not to return millions dollars from their
adequacy budget to their pockets, but to provide non-remote
hazardous route transportation to all 30,500 of its students
under N.J.S.A. 18A:39-1.5. The loss of discretionary spending
has endangered the safety of its children, and their safety
ought to count even if the children themselves do not count.
The loss of the bussing will cause traffic and logistical
problems beyond the capacity of the municipal infrastructure
to handle.
74) Irreparable harm will result and an overriding public
interest calls for relief on this issue because the failure
of the state to provide T & E in Lakewood has forced the
Lakewood Board of Education to tax its already overburdened
29
base up to the statutory maximum, $13.5 million above the
local fair share, yet still insufficient for T & E given the
extraordinary special education and remote transportation
expenses, with nothing left over for the transportation for
10,450 of its children who must walk to school along
hazardous nonremote routes.
WHEREBY Plaintiffs petition the Commissioner for relief by
fully funding the Lakewood Board of Education with its full
$9,027,679 of transportation aid under the SFRA and/or to
recommend to the legislature for other categorical aid that
will remedy to transportation crisis in Lakewood.
COUNT VII
75) All of the allegations contained within the paragraphs
above and below are hereby incorporated by reference as if
fully set out herein.
76) The district administration has been warning the state of
its unique circumstances asking for special needs status for
over two decades. (Exhibit 18). The state has turned a blind
eye for too long.
77) A statute that determines the financial capacity of the
local tax base by its income and property value without
counting 25,000 K-12 children that it must support and serve
is irrational under the due process clause of the United
States Constitution and the New Jersey Constitution, and
perhaps even discriminatory.
30

78) The legislature cannot constitutionally remedy the
deficiency of T & E in Lakewood by simply eliminating its
mandate for remote transportation without having a disparate
impact, if not disparate treatment, toward a protected class
of citizens. Nor is it rational to deprive families that send
their children to nonpublic schools in Lakewood of the same
services such as remote bussing offered to families similarly
situated in other areas in the state in which they are less
concentrated.
79) The argument that families that generally send their
children to nonpublic schools should forfeit the right to
FAPE for their most needy children is repugnant to the Equal
Protection Clause of the Fourteenth Amendment to the United
States Constitution. The argument that the Board of Education
should not provide nonpublic children with remote
transportation to and from school is not only unrealistic and
contrary to the statute, but “it has never been judicially
suggested that the exercise of the basic right to forgo a
public education in favor of equivalent instruction precludes
a person of availing himself of any state supported
educational service or facility.” Alpert v. Wachtung, 13
N.J.A.R 110, 117 (1986). It is counter-intuitive and
irrational that a municipality that saves the state over $400
million dollars a year in equalization aid should be forced
to abandon “any state supported educational service or
facility” for 25,000 of its children because the legislature
inadequately performs its constitutional duty of providing a
T & E for 5,500 children.
31

WHEREBY Plaintiffs petition the Commissioner for a declaratory
ruling that all of Lakewood students are entitled to the same
services for which students similarly situated elsewhere in
New Jersey are entitled and to foreclose the possibility of a
remedy that disparately impacts the children of Lakewood or
that forces them to forego their rights and privileges under
the current law.
/s/Arthur H. Lang Arthur H. Lang Attorney for Plaintiffs
Dated June 16, 2014
32
PETITION CERTIFICATION
I, Arthur H. Lang, Attorney at Law, 918 East Kennedy
Blvd., Lakewood, NJ 08701, being of full age and duly certify
and say:
1. I am the counsel for Plaintiffs in this matter. As
such I am fully familiar with all of the facts of this case
and am authorized to make this Verification.
2. I have written the foregoing complaint and the
factual allegations set forth herein are true and correct to
the best of my knowledge, except those facts alleged upon
information and belief. As to the facts alleged upon
information and belief, they are true and correct to the best
of my information and belief.
I certify that the foregoing statements made by me are
true. I am aware that in any of the foregoing statements made
by me are willingly false, I am subject to punishment.
/s/Arthur H. Lang Arthur H. Lang, Esq.
Dated June 16, 2014
33

PETITION CERTIFICATION
I, Arthur H. Lang, Attorney at Law, 918 East Kennedy
Blvd., Lakewood, NJ 08701, being of full age and duly
certify and say:
1. I am the counsel for Plaintiffs in this matter.
As such I am fully familiar with all of the facts of this
case and am authorized to make this Verification.
2. I have written the foregoing complaint and the
factual allegations set forth herein are true and correct
to the best of my knowledge, except those facts alleged
upon information and belief. As to the facts alleged upon
information and belief, they are true and correct to the
best of my information and belief.
I certify that the foregoing statements made by me are
true. I am aware that in any of the foregoing statements
made by me are willingly false, I am subject to punishment.
BBBBBBBBBBBBBBBBBB Arthur H. Lang, Esq.
Dated June 16, 2014
34

Exhibit!1!
35

36

37

38
39

40

41

42
43
44

45

46

47

48

Exhibit!2!
49

Exponential+Regreesion
POPULATION y"="a"(b)^x r+=+0.993+++r^2+=+0.986a+=+43,476.42
b+=+1.039
YEAR POP. BIRTHS BIR/TH 95%+CI+LL 95%+CI+UL +++++++++++++x ++++++++++y BIRTHS1990 44,988 1,275 28.3 26.8 29.9 0 44,988 1,2751991 47,085 1,260 26.8 25.3 28.2 1 47,085 1,2601992 48,283 1,298 26.9 25.4 28.3 2 48,283 1,2981993 49,642 1,286 25.9 24.5 27.3 3 49,642 1,2861994 50,746 1,411 27.8 26.4 29.2 4 50,746 1,4111995 51,773 1,391 26.9 25.5 28.3 5 51,773 1,3911996 53,186 1,477 27.8 26.4 29.2 6 53,186 1,4771997 54,652 1,539 28.2 26.8 29.6 7 54,652 1,5391998 56,206 1,702 30.3 28.9 31.7 8 56,206 1,7021999 58,495 1,784 30.5 29.1 31.9 9 58,495 1,7842000 61,289 1,944 31.7 30.3 33.1 10 61,289 1,9442001 64,929 2,201 33.9 32.5 35.3 11 64,929 2,2012002 68,974 2,365 34.3 32.9 35.6 12 68,974 2,3652003 72,586 2,646 36.4 35.1 37.8 13 72,586 2,6462004 75,844 2,806 37 35.6 38.3 14 75,844 2,8062005 78,890 3,049 38.6 37.3 40 15 78,890 3,0492006 82,000 3,129 38.2 36.8 39.5 16 82,000 3,1292007 84,915 3,461 40.8 39.4 42.1 17 84,915 3,4612008 87,828 3,448 39.3 38 40.5 18 87,828 3,4482009 90,636 3,746 41.3 40 42.6 19 90,636 3,7462010 93,008 3,849 41.4 40.1 42.7 20 93,008 3,8492011 97,091 21 97,0912012 100,878 22 100,8782013 104,812 23 104,8122014 108,900 24 108,9002015 113,147 25 113,1472016 117,560 26 117,5602017 122,144 27 122,1442018 126,908 28 126,9082019 131,857 29 131,857
0"
10,000"
20,000"
30,000"
40,000"
50,000"
60,000"
70,000"
80,000"
90,000"
100,000"
1985" 1990" 1995" 2000" 2005" 2010" 2015"
Series1"
Expon."(Series1)"
50

BIRTHS
Exponential1Regression Linear1Regressiony1=1,092.211(1.066)^x y1=1142.231x1+1818.99
r^21=10.972911r1=10.9864YEAR BIRTHS POP. BIR/TH 1111111111111x 1111111111y
1990 1,275 44,988 28.3 0 1,2751991 1,260 47,085 26.8 1 1,2601992 1,298 48,283 26.9 2 1,2981993 1,286 49,642 25.9 3 1,2861994 1,411 50,746 27.8 4 1,4111995 1,391 51,773 26.9 5 1,3911996 1,477 53,186 27.8 6 1,4771997 1,539 54,652 28.2 7 1,5391998 1,702 56,206 30.3 8 1,7021999 1,784 58,495 30.5 9 1,7842000 1,944 61,289 31.7 10 1,9442001 2,201 64,929 33.9 11 2,2012002 2,365 68,974 34.3 12 2,3652003 2,646 72,586 36.4 13 2,6462004 2,806 75,844 37 14 2,8062005 3,049 78,890 38.6 15 3,0492006 3,129 82,000 38.2 16 3,1292007 3,461 84,915 40.8 17 3,4612008 3,448 87,828 39.3 18 3,4482009 3,746 90,636 41.3 19 3,7462010 3,849 93,008 41.4 20 3,8492011 4,180 97,091 21 3,8062012 4,456 100,878 22 3,9482013 4,750 104,812 23 4,0902014 5,064 108,900 24 4,2332015 5,398 113,147 25 4,3752016 5,754 117,560 26 4,5172017 6,134 27 4,6522018 6,539 28 4,8012019 6,971 29 4,944
0-
500-
1,000-
1,500-
2,000-
2,500-
3,000-
3,500-
4,000-
4,500-
1985- 1990- 1995- 2000- 2005- 2010- 2015-
Series1-
Expon.-(Series1)-
51
BIR/TH y""="0.855"x"+"24.41 r"="0.96419
r^2"="0.93YEAR BIR/TH POP. BIRTHS """""""""""""x """"""""""y
1990 28.3 44,988 1,275 0 28.31991 26.8 47,085 1,260 1 26.81992 26.9 48,283 1,298 2 26.91993 25.9 49,642 1,286 3 25.91994 27.8 50,746 1,411 4 27.81995 26.9 51,773 1,391 5 26.91996 27.8 53,186 1,477 6 27.81997 28.2 54,652 1,539 7 28.21998 30.3 56,206 1,702 8 30.31999 30.5 58,495 1,784 9 30.52000 31.7 61,289 1,944 10 31.72001 33.9 64,929 2,201 11 33.92002 34.3 68,974 2,365 12 34.32003 36.4 72,586 2,646 13 36.42004 37 75,844 2,806 14 372005 38.6 78,890 3,049 15 38.62006 38.2 82,000 3,129 16 38.22007 40.8 84,915 3,461 17 40.82008 39.3 87,828 3,448 18 39.32009 41.3 90,636 3,746 19 41.32010 41.4 93,008 3,849 20 41.42011 42.4 97,091 21 42.42012 43.2 100,878 22 43.22013 44.1 104,812 23 44.12014 44.9 108,900 24 44.92015 45.8 113,147 25 45.82016 46.6 117,560 26 46.6
03
53
103
153
203
253
303
353
403
453
19853 19903 19953 20003 20053 20103 20153
Series13
Linear3(Series1)3
52
CDP$POPULATION Exponential$Regreesiony"="a"(b)^xa$=$53,805b$=$1.039
YEAR POP. $$$$$$$$$$$$$x $$$$$$$$$$$$$$$$y2010 53,805 0 53,8052011 55,903 1 55,9032012 58,084 2 58,0842013 60,349 3 60,3492014 62,702 4 62,7022015 65,148 5 65,1482016 67,689 6 67,689
53

!!!!!!!!!!!!
Exhibit!3!
54

TUITION&AND&TRANSPORTATION/OPERATING&BUDGET
TRANSPORTATIONTUITION TOTALOPERATINGBUDGET
PERCENT&OFOPERATING&BUDGET
2003 $7,387,726 $5,388,323 $12,776,0502004 $8,615,512 $5,471,075 $14,086,5872005 $9,855,586 $7,806,215 $17,661,8012006 $11,631,701 $8,995,160 $20,626,861 $80,557,895 25.6%2007 $13,061,860 $10,663,218 $23,725,078 $87,912,032 27.0%2008 $14,849,926 $15,271,616 $30,121,542 $94,917,251 31.7%2009 $15,356,692 $15,497,723 $30,854,415 $96,232,713 32.1%2010 $16,560,794 $14,978,022 $31,538,816 $95,192,866 33.1%2011 $16,035,448 $15,798,337 $31,833,785 $97,487,122 32.7%2012 $18,284,218 $18,814,571 $37,098,789 $104,362,574 35.5%2013 $20,312,121 $19,389,392 $39,701,513 $107,701,339 36.9%2014 $21,122,288 $25,275,951 $46,398,239 $114,661,752 40.5%2015 $22,340,373 $24,255,050 $46,595,4232016 $23,558,458 $25,892,370 $49,450,8282017 $24,776,543 $27,529,691 $52,306,2342018 $25,994,628 $29,167,012 $55,161,6402019 $27,212,713 $30,804,332 $58,017,045
55

BIRTHYEAR BIRTHS
TRANSP,ACT.,&EST,X=YEARY=TRANSPy,=,1,218,085,x,+,7,723,353
TRANSP,,X=BIRTHSY=TRANSPy,=,6,285.59,x,?2,491,605.3 Actual,year TRANSPORTATION,EXPENSES
1998 1,702 $7,387,726 $8,206,469 2003
1999 1,784 $8,615,512 $8,721,887 2004 y,=,1,218,085,x,+,7,723,3532000 1,944 $9,855,586 $9,727,582 20052001 2,201 $11,631,701 $11,342,978 20062002 2,365 $13,061,860 $12,373,815 20072003 2,646 $14,849,926 $14,140,066 20082004 2,806 $15,356,692 $15,145,760 20092005 3,049 $16,560,794 $16,673,159 20102006 3,129 $16,035,448 $17,176,006 20112007 3,461 $18,284,218 $19,262,822 20122008 3,448 $20,312,121 $19,181,109 20132009 3,746 $21,122,288 $21,054,215 20142010 3,849 $22,340,373 $21,701,631 20152011 3,878 $23,558,458 $21,883,913 20162012 4,154 $24,776,543 $23,618,736 20172013 4,263 $25,994,628 $24,303,865 20182014 4,349 $27,212,713 $24,844,426 20192015 4,4102016 4,443 PEARSON
0.99180304 r=.9779289
y,=,6,285.59,x,?2,491,605.3
r^2=.9446
$0,
$5,000,000,
$10,000,000,
$15,000,000,
$20,000,000,
$25,000,000,
2002, 2004, 2006, 2008, 2010, 2012, 2014,
Series1,
Linear,(Series1),
$0,
$5,000,000,
$10,000,000,
$15,000,000,
$20,000,000,
$25,000,000,
$30,000,000,
0, 2,000, 4,000, 6,000,
Series1,
Linear,(Series1),
56

TUITION&EXPENSES
Transp Tuitiony&=&8,525.67&X&=&9,322,308.5 0.97043623
Actual&year BIRTHS BIRTHYEAR2003 $5,388,323 1,702 1998 $5,188,3812004 $5,471,075 1,784 1999 $5,887,4872005 $7,806,215 1,944 2000 $7,251,594
0.11166081 $80,557,895 2006 $8,995,160 2,201 2001 $9,442,6910.12129418 $87,912,032 2007 $10,663,218 2,365 2002 $10,840,9010.160894 $94,917,251 2008 $15,271,616 2,646 2003 $13,236,614
0.16104423 $96,232,713 2009 $15,497,723 2,806 2004 $14,600,7220.15734395 $95,192,866 2010 $14,978,022 3,049 2005 $16,672,4590.16205563 $97,487,122 2011 $15,798,337 3,129 2006 $17,354,5130.18028083 $104,362,574 2012 $18,814,571 3,461 2007 $20,185,0350.18002926 $107,701,339 2013 $19,389,392 3,448 2008 $20,355,5490.22043925 $114,661,752 2014 $25,275,951 3,746 2009 $22,614,851
2015 $24,255,050 3,849 2010 $23,492,9952016 $25,892,370 3,878 2011 $23,740,2402017 $27,529,691 4,154 2012 $26,093,3252018 $29,167,012 4,263 2013 $27,022,6232019 $30,804,332 4,349 2014 $27,755,830
r=.9704y&=&7,522.07&x&=&7,046,407.6
y&=&1,637,320.5&x&+&4,607,204
$0&
$5,000,000&
$10,000,000&
$15,000,000&
$20,000,000&
$25,000,000&
$30,000,000&
$35,000,000&
2000& 2005& 2010& 2015& 2020&
Series1&
Linear&(Series1)&
0&
500&
1,000&
1,500&
2,000&
2,500&
3,000&
3,500&
4,000&
4,500&
5,000&
$0& $10,000,000&$20,000,000&$30,000,000&$40,000,000&
Series1&
Linear&(Series1)&
57

!!!!!!!!!!!!
Exhibit!4!
58

The Disthct provides a full range of educational services appropriate to grade levels PK through 12. These include regular and vocational, as well as special education for handicapped youngsters. The District completed the 2012-2013 fiscal year with an enrollment of 5,166 students.
The following details the changes in the student enrollment of the District over the last several years:
Average Daily Enrollment
Fiscal Year Student Enrollment Percent Change
2012113 5,166 (3.65%) 2011/12 5,362 (1.36%) 2010111 5,436 6.62% 2009/10 5,076 (4.19%) 2008/09 5,298 .94% 2007/08 5,249 (1.20%) 2006/07 5,313 2.06% 2005/06 5,206 6.20% 2004/05 4,902 (7.89%) 2003/04 5,322 .42% 2002/03 5,300 (3.46%) 2001/02 5,490 (3.89%) 2000/0 I 5,712 0.97% 1999/00 5,657 1.67% 1998/99 5,546 2.52% 1997198 5,427 0.17% 1996/97 5,418 (1.08%) 1995/96 5,477 (1.73%)
2. ECONOMIC CONDITION AND OUTLOOK
Lakewood Township is located in Central New Jersey, just 15 miles west of some of New Jersey's most beautiful beaches and about a 1-1/2 hour drive from New York, Philadelphia, Trenton and Atlantic City. Its population of about 93,000 represents peoples of all ethnic and national origins and socio-economic levels. Industrial development in the Township has been centered around two large industrial parks. One is located around a municipality-owned airpmi in the southeast section of the Township, and the second has the advantage of railroad access in the southwest portion of the Township. Lakewood, among the area communities is the only one with an Urban Enterprise Zone. Lakewood is home to Paul Kimball Medical Center which has 350 licensed beds, 310 physicians on staff and more than 1,800 employees. Post-secondary education is served by Georgian Court University, a four-year college for women, and Beth Medrash Govoha, a rabbinical college. The Township of Lakewood provides for a variety of municipal services including the operation of a municipal building and complex, library and excellent recreation facilities through a system of township-owned parks and playgrounds. Development and expansion is expected to continue which suggests that Lakewood will continue to prosper and grow.
The Lakewood School District has a Superintendent of Schools who is the Chief Administrative Officer. The Business Administrator oversees the Board's business functions and repmis through the Superintendent to the Board.
The Lakewood School District encompasses one Kindergarten school, and three 1-5 elementary schools, a Middle School (grades 6-8), a High School and a pre-school campus, serving a student population of approximately 5, 700. Lakewood High School is known for the harmonious way the various segments of its population work together, as well as its fine academic programs.
ii 59

!!!!!!!!!!!!
Exhibit!5!
60
61

Exhibit!6!
62

63
64

Exhibit!7!
65

66

Exhibit!8!
67

COUNTY DFG
DIFFERENCE-
BETWEEN-TAX-
LEVY-AND-LOCAL
FIAR-SHARE
FTE-RES.-
ENR.
2013;14-LOCAL
-FAIR-SHARE
Tax-levy/
pupil
2013;14-
TAX-LEVY
LOCAL-
TAX-
EFFORT--
2013;14
ADEQUACY-
BUDGET
2013;14
ADEQ-BUDGET,-
CAT-SPEC-ED,-
SEC-AID
SPENDING-ON-T-
&-E
Above/below-
Adeq
2013;14
OPERATING-
BUDGET
OPERATING-
BUDGET
/PUPIL
TRANPOR
TATION
OF-PUPILS
URBAN-DISTRICTS
CUMBERLAND BRIDGETON/CITY A 14,845,091.0 5,209 $8,482,235 $698.31 $3,637,144 157.1% $87,454,483 $92,177,295 $82,919,984 1$9,257,311 $91,758,620 $17,617.09 551CAMDEN CAMDEN/CITY A 116,635,645.0 14,921 $24,084,654 $499.23 $7,449,009 169.1% $245,000,844 259194064 $300,445,374 $41,251,310 $326,556,365 $21,885.69 3,372PASSAIC PASSAIC/CITY A 122,450,935.0 13,414 $39,269,512 $1,253.81 $16,818,577 157.2% $236,152,459 $249,811,325 $229,701,903 1$20,109,422 $268,180,875 $19,992.61 733PASSAIC PATERSON/CITY A 144,730,971.0 26,944 $83,686,927 $1,445.81 $38,955,956 153.5% $451,469,695 $478,610,323 $436,144,508 1$42,465,815 $490,825,287 $18,216.50 3,705MIDDLESEX NEW/BRUNSWICK/CITY A 13,437,982.0 8,571 $30,764,573 $3,188.45 $27,326,591 111.2% $153,715,530 $162,200,323 $153,876,524 1$8,323,799 $168,305,568 $19,637.78 1,305OCEAN LAKEWOOD-TWP 5,899,284.0 5,767 $71,198,357 $13,369.92 $77,097,641 -----+-8.3% $88,338,309 $93,476,013 $67,517,104 ;$25,958,909 $107,701,339 $19,664 16,618
OCEAN LAKEWOOD-TWP-2014;15-Budget 13,395,480.0 6,166 $71,198,357 $13,719.40 $84,593,837 ----+18.8% $88,338,309 $93,476,013 $71,060,557 ;$22,415,456 $114,661,752 $18,595.81 16,618
ESSEX NEWARK/CITY A 146,140,733.0 47,433 $157,300,061 $2,343.53 $111,159,328 129.3% $745,128,153 $792,618,336 $781,583,790 1$11,034,546 $866,285,174 $18,263.54 11,668MERCER TRENTON/CITY A 114,945,551.0 13,620 $36,061,213 $1,550.40 $21,115,662 141.4% $228,885,371 $242,233,691 $226,745,521 1$15,488,170 $266,918,101 $19,598.23 3,220SALEM SALEM/CITY A 1304,586.0 985 $2,696,907 $2,428.75 $2,392,321 111.3% $16,119,337 $17,062,461 $21,390,826 $4,328,365 $22,036,445 $22,372.03 87HUDSON UNION/CITY A 122,782,904.0 11,336 $38,201,541 $1,360.15 $15,418,637 159.6% $211,476,584 $223,427,717 $189,989,388 1$33,438,329 $203,397,266 $17,942.60 220ATLANTIC PLEASANTVILLE/CITY A 14,201,914.0 3,696 $12,190,681 $2,161.46 $7,988,767 134.5% $63,686,477 $67,175,463 $65,522,543 1$1,652,920 $74,017,368 $20,026.34 697ESSEX EAST/ORANGE A 122,412,756.0 9,916 $41,362,806 $1,911.06 $18,950,050 154.2% $168,409,212 $178,641,169 $191,477,975 $12,836,806 $214,058,963 $21,587.23 794UNION ELIZABETH/CITY A 127,428,142.0 22,957 $79,741,266 $2,278.79 $52,313,124 134.4% $409,009,914 $432,189,386 $392,917,894 1$39,271,492 $434,428,334 $18,923.98 2,916ESSEX CITY/OF/ORANGE/TWP A 17,452,429.0 4,904 $18,113,997 $2,174.06 $10,661,568 141.1% $85,472,736 $90,171,725 $76,827,173 1$13,344,552 $85,663,515 $17,468.09 365MIDDLESEX PERTH/AMBOY/CITY A 114,023,199.0 9,784 $35,785,752 $2,224.30 $21,762,553 139.2% $172,494,403 $182,645,243 $222,275,280 $39,630,037 $242,807,377 $24,816.78 202MONMOUTH ASBURY/PARK/CITY A 15,737,078.0 2,391 $12,115,140 $2,667.53 $6,378,062 147.4% $38,409,315 $40,802,408 $60,707,473 $19,905,065 $67,559,592 $28,255.79 324ESSEX IRVINGTON/TOWNSHIP A 117,751,409.0 7,155 $35,210,938 $2,440.36 $17,459,529 150.4% $113,676,023 $120,509,213 $109,537,628 1$10,971,585 $135,343,767 $18,917.29 185MONMOUTH KEANSBURG/BORO A 13,010,009.0 1,443 $7,300,160 $2,974.11 $4,290,151 141.2% $23,269,932 $24,706,745 $29,951,690 $5,244,945 $35,234,161 $24,425.76 95WARREN PHILLIPSBURG/TOWN B 12,003,857.0 2,441 $11,371,226 $3,837.51 $9,367,369 117.6% $38,300,523 $40,440,800 $55,919,470 $15,478,670 $60,596,843 $24,824.60 189HUDSON HARRISON/TOWN B 13,162,022.0 1,959 $12,391,935 $4,711.54 $9,229,913 125.5% $37,082,367 $39,159,814 $32,305,719 1$6,854,095 $38,522,233 $19,664.23 .CAMDEN GLOUCESTER/CITY B 14,216,280.0 1,817 $7,632,160 $1,879.96 $3,415,880 155.2% $27,821,049 $29,401,526 $37,490,268 $8,088,742 $41,005,581 $22,567.74 81CUMBERLAND MILLVILLE/CITY A 112,783,785.0 5,001 $23,597,179 $2,162.46 $10,813,394 154.2% $76,281,035 $80,522,717 $83,385,541 $2,862,824 $91,041,487 $18,206.48 2,141UNION PLAINFIELD/CITY B 112,183,406.0 8,494 $34,914,406 $2,676.28 $22,731,000 134.9% $146,283,373 $154,257,227 $134,294,246 1$19,962,981 $147,839,677 $17,406.21 1,727BERGEN GARFIELD/CITY B 1432,881.0 4,812 $24,953,469 $5,096.25 $24,520,588 11.7% $76,783,078 $81,173,112 $74,392,224 1$6,780,888 $83,482,718 $17,350.66 451HUDSON WEST/NEW/YORK/TOWN A 118,212,618.0 7,147 $32,781,832 $2,038.51 $14,569,214 155.6% $127,316,218 $134,319,398 $97,523,177 1$36,796,221 $112,749,825 $15,775.83 82CUMBERLAND VINELAND/CITY A 134,225,284.0 10,006 $55,956,723 $2,171.95 $21,731,439 161.2% $152,502,885 $160,721,906 $155,131,395 1$5,590,511 $171,905,189 $17,181.07 6,369BURLINGTON BURLINGTON/CITY B 1,940,428.0 1,408 $8,342,401 $7,303.15 $10,282,829 23.3% $22,625,621 $23,927,900 $28,053,274 $4,125,374 $31,509,711 $22,379.06 122BURLINGTON PEMBERTON/TWP B 18,935,072.0 4,586 $20,493,708 $2,520.42 $11,558,636 143.6% $70,273,101 $74,030,853 $86,182,290 $12,151,437 $94,981,463 $20,711.18 3,678MONMOUTH LONG/BRANCH/CITY B 19,516,144.0 4,740 $42,907,188 $7,044.52 $33,391,044 122.2% $79,386,562 $84,005,203 $73,972,373 1$10,032,830 $79,989,473 $16,875.42 849HUDSON JERSEY/CITY B 1137,807,409.0 30,421 $246,144,257 $3,561.31 $108,336,848 156.0% $517,593,230 $547,260,097 $533,365,969 1$13,894,128 $566,725,369 $18,629.72 3,692MONMOUTH NEPTUNE/TWP CD 13,714,523.0 3,887 $38,350,865 $8,910.82 $34,636,342 19.7% $62,338,131 $65,965,343 $63,967,620 1$1,997,723 $73,510,019 $18,911.76 1,527HUDSON HOBOKEN/CITY FG 189,561,449.0 2,431 $127,507,926 $15,609.41 $37,946,477 170.2% $38,126,371 $40,315,835 $48,464,934 $8,149,099 $51,518,317 $21,192.23 90NEW/JERSEY/ 1913,362,185.0 1,307,390 $14,293,677,130 $10,234.37 $13,380,314,945 16.4% $19,447,454,757 $22,624,094,325 $22,624,094,325 $17,304.78 496,341
AVERAGE-SDA 117,994,268.8 9,265 $45,215,465 $3,946 $27,221,196 139.2% $154,521,837 $163,534,262 $158,031,565 1$5,502,697 $177,609,630 $19,996 2,646STAND-DEV-SDA 121,101,148.9 9,885 $49,744,742 $3,794 $28,643,593 +/1/21.5% $162,408,093 $172,336,010 $163,055,975 1$9,280,035 $182,502,763 $2,756 4,366SUM-SDA 1593,810,872.0 305,756 $1,492,110,352 $2,937.97 $898,299,480 139.8% $5,861,117,774 19,169 84,671
BACON-DISTRICTS
CUMBERLAND MAURICE/RIVER/TWP B 11,139,957.0 547 $3,752,594 $4,780.67 $2,612,637 130.4% $7,350,227 $7,728,261 $4,784,607 1$2,943,654 $8,028,591 $14,691 434CUMBERLAND COMMERCIAL/TWP A 11,424,484.0 804 $3,157,271 $2,156.55 $1,732,787 145.1% $12,216,300 $12,969,760 $6,942,570 1$6,027,190 $12,390,598 $15,421 790CAPE/MAY WOODBINE/BORO A 1519,854.0 229 $1,889,663 $5,981.70 $1,369,809 127.5% $3,706,018 $3,913,837 $2,767,634 1$1,146,203 $4,359,390 $19,037 72CUMBERLAND FAIRFIELD/TWP A 11,968,103.0 504 $2,693,119 $1,438.52 $725,016 173.1% $7,760,894 $8,213,841 $6,015,824 1$2,198,017 $7,006,410 $13,902 292ATLANTIC EGG/HARBOR/CITY A 218,196.0 469 $2,152,662 $5,055.13 $2,370,858 ////+10.1% $7,607,374 $7,907,000 $7,484,666 1$422,334 $8,097,412 $17,265 30CUMBERLAND UPPER/DEERFIELD/TWP B 907,367.0 845 $5,478,877 $7,557.69 $6,386,244 ////+16.6% $11,857,013 $12,460,281 $12,120,510 1$339,771 $13,023,615 $15,413 581ATLANTIC HAMMONTON/TOWN B 1723,622.0 2,664 $16,936,007 $6,085.73 $16,212,385 14.3% $39,347,016 $40,872,254 $45,852,861 $4,980,607 $49,005,721 $18,396 953OCEAN LAKEHURST/BORO B 11,220,929.0 501 $2,289,705 $2,133.29 $1,068,776 153.3% $8,048,095 $8,487,982 $5,755,033 1$2,732,949 $8,577,447 $17,121 46BERGEN WALLINGTON/BORO B 1,733,625.0 1,255 $11,882,738 $10,854.02 $13,616,363 14.6% $18,834,176 $19,603,027 $13,894,180 1$5,708,847 $17,359,698 $13,838 26ATLANTIC BUENA/REGIONAL A 708,835.0 1,894 $11,477,802 $6,434.34 $12,186,637 //////+6.2% $30,428,399 $32,120,113 $29,783,848 1$2,336,265 $35,833,432 $18,919 1,479GLOUCESTER CLAYTON/BORO CD 527,125.0 1,301 $7,032,831 $5,810.88 $7,559,956 //////+7.5% $19,780,571 $20,681,006 $16,562,137 1$4,118,869 $18,801,403 $14,452 320CUMBERLAND LAWRENCE/TWP A 11,059,080.0 588 $2,986,771 $3,281.18 $1,927,691 135.5% $7,839,595 $8,329,101 $5,842,887 1$2,486,214 $8,579,760 $14,604 436CAPE/MAY LOWER/TWP B 12,807,141.0 1,660 $18,058,705 $9,187.69 $15,251,564 115.5% $23,150,549 $24,485,697 $24,253,680 1$232,017 $26,185,058 $15,774 1,340MIDDLESEX SOUTH/RIVER/BORO CD 13,155,071.0 2,343 $16,549,728 $5,718.10 $13,394,657 119.1% $36,902,865 $38,610,202 $24,574,419 1$14,035,783 $27,683,490 $11,818 328CAPE/MAY LOWER/CAPE/MAY/REGIONAL B 14,835,536.0 1,472 $23,334,618 $12,567.31 $18,499,082 120.7% $22,082,326 $23,286,540 $23,950,157 $663,617 $28,928,765 $19,653 1,367OCEAN LITTLE/EGG/HARBOR/TWP B 13,901,505.0 1,383 $14,454,779 $7,630.71 $10,553,274 127.0% $20,282,995 $21,464,894 $19,899,294 1$1,565,600 $21,599,390 $15,618 1,431SALEM QUINTON/TWP A 1193,405.0 360 $2,501,014 $6,410.03 $2,307,609 17.7% $5,775,179 $6,056,814 $4,417,799 1$1,639,015 $6,006,073 $16,684 287OCEAN OCEAN/TWP CD 13,655,408.0 899 $13,599,954 $11,061.79 $9,944,546 126.9% $13,351,769 $13,994,336 $9,978,793 1$4,015,543 $18,006,202 $20,029 536
0.0AVERAGE 11,250,497.1 1,095 $8,901,602 $6,341 $7,651,105 126.5% $16,462,298 $17,288,053 $14,715,606 1$2,572,447 $17,748,470 $16,257 597STAND-DEV 1803,559.3 703 $6,908,196 $3,127 $6,104,637 21.6% $10,716,355 $11,194,003 $11,440,354 $3,792,769 $12,015,880 $2,284 509SUM-BACON 122,508,947.0 19,716 $160,228,838 $6,985.36 $137,719,891 114.0% $296,321,361 $311,184,946 $264,880,899 1$46,304,047 $319,472,455 $16,204.13 10,747
68

URBAN-DISTRICTS
BRIDGETON/CITYCAMDEN/CITYPASSAIC/CITYPATERSON/CITYNEW/BRUNSWICK/CITYLAKEWOOD-TWP
LAKEWOOD-TWP-2014;15-Budget
NEWARK/CITYTRENTON/CITYSALEM/CITYUNION/CITYPLEASANTVILLE/CITYEAST/ORANGEELIZABETH/CITYCITY/OF/ORANGE/TWPPERTH/AMBOY/CITYASBURY/PARK/CITYIRVINGTON/TOWNSHIPKEANSBURG/BOROPHILLIPSBURG/TOWNHARRISON/TOWNGLOUCESTER/CITYMILLVILLE/CITYPLAINFIELD/CITYGARFIELD/CITYWEST/NEW/YORK/TOWNVINELAND/CITYBURLINGTON/CITYPEMBERTON/TWPLONG/BRANCH/CITYJERSEY/CITYNEPTUNE/TWPHOBOKEN/CITY
BACON-DISTRICTS
MAURICE/RIVER/TWPCOMMERCIAL/TWPWOODBINE/BOROFAIRFIELD/TWPEGG/HARBOR/CITYUPPER/DEERFIELD/TWPHAMMONTON/TOWNLAKEHURST/BOROWALLINGTON/BOROBUENA/REGIONALCLAYTON/BOROLAWRENCE/TWPLOWER/TWPSOUTH/RIVER/BOROLOWER/CAPE/MAY/REGIONALLITTLE/EGG/HARBOR/TWPQUINTON/TWPOCEAN/TWP
2013;14
TRANSP-AID
TRANSP-
AID/PUPIL
TRANSP
TRANSPORT
ATION-COST
TRANSP-
COST/PUPIL
TRANSP
TRANSP-
COST/
PUPIL-
ENR
PUPILS-
SENT
PRIV-SCH-
DISABLED
ENROLLE
MNT/PUP
ILS-SENT-
TO-PRIV-
SCH-
-DISABLED TUTION-
TRASNP-AND
TUITION
TRANS-AND
TUITION/
OPER-BUDG.
TUITION/
ENROLL;
MENT
CHILD-
STUDY
TEAM
CHILD-
STUDY
TEAM/
EN;
ROLLM
ENT
PT,-OT,-SPEC-
SERV
PT,-OT,-
SPEC-
SERV/E
N;
ROLLM
ENT
ADJUSTED
OPERATING
BUDGET/
PUPIL
$619,579 $1,125 $3,748,539 $6,809 $720 29.0 179.6 $5,090,097 $8,838,636 9.6% $977 $1,281,410 $246 $794,227 $152 $15,887$4,410,994 $1,308 $9,144,417 $2,712 $613 164.0 91.0 $16,966,574 $26,110,991 8.0% $1,137 $5,020,089 $336 $2,361,526 $158 $20,273$1,930,549 $2,636 $7,211,593 $9,845 $538 258.0 52.0 $31,267,379 $38,478,972 14.3% $2,331 $6,224,616 $464 $7,492,955 $559 $16,709$3,152,967 $851 $16,996,724 $4,588 $514 236.0 114.2 $37,684,055 $54,680,779 11.1% $1,399 $10,291,735 $382 $4,047,316 $150 $16,154$1,170,854 $898 $7,034,880 $5,393 $684 44.5 192.6 $7,394,164 $14,429,044 8.6% $863 $4,061,603 $474 $0 $18,091$3,043,050 $183 $21,130,243 $1,272 $3,137 207.0 26.5 $19,053,992 $40,184,235 37.3% $3,479 $2,642,890 $458 $4,092,851 $710 $11,526
$3,934,658 $237 $18,325,244 $1,521 $3,461 276.0 22.3 $25,275,951 $43,601,195 38.0% $4,099.25 $3,059,530 $496 $3,713,417 $602 $11,560
$6,501,117 $557 $32,793,451 $2,811 $554 431.5 109.9 $51,907,933 $84,701,384 9.8% $1,094 $18,003,156 $380 $6,293,327 $133 $16,482$2,490,610 $773 $6,900,803 $2,143 $324 143.5 94.9 $33,271,777 $40,172,580 15.1% $2,443 $5,140,423 $377 $2,174,046 $160 $16,672$155,244 $1,784 $616,106 $7,082 $468 12.0 82.1 $29,513 $645,619 2.9% $30 $495,427 $503 $476,387 $484 $21,391$471,331 $2,142 $4,531,161 $20,596 $358 72.0 157.4 $8,876,717 $13,407,878 6.6% $783 $4,462,652 $394 $0 $16,801$557,709 $800 $2,364,261 $3,392 $489 18.0 205.3 $6,130,564 $8,494,825 11.5% $1,659 $1,352,238 $366 $1,069,641 $289 $17,589
$1,211,524 $1,526 $7,275,572 $9,163 $612 146.0 67.9 $15,305,416 $22,580,988 10.5% $1,544 $5,595,842 $564 $1,504,764 $152 $19,280$2,369,754 $813 $14,485,723 $4,968 $528 176.0 130.4 $27,024,717 $41,510,440 9.6% $1,177 $7,092,959 $309 $4,399,263 $192 $17,027$543,155 $1,488 $3,017,027 $8,266 $504 57.0 86.0 $5,819,315 $8,836,342 10.3% $1,187 $2,882,966 $588 $20,000 $4 $15,773
$1,814,574 $8,983 $5,507,997 $27,267 $377 61.0 160.4 $15,024,100 $20,532,097 8.5% $1,536 $2,999,848 $307 $0 $22,904$388,891 $1,200 $2,247,500 $6,937 $777 54.0 44.3 $4,604,619 $6,852,119 10.1% $1,926 $1,757,329 $735 $741,043 $310 $25,243
$1,181,024 $6,384 $4,457,590 $24,095 $458 211.0 33.9 $21,348,549 $25,806,139 19.1% $2,984 $2,247,893 $314 $262,343 $37 $15,439$240,291 $2,543 $1,566,713 $16,579 $920 42.0 34.3 $3,715,758 $5,282,471 15.0% $2,576 $1,276,469 $885 $578,170 $401 $20,530$170,872 $904 $2,184,799 $11,560 $825 16.0 152.6 $2,492,574 $4,677,373 7.7% $1,021 $1,456,447 $597 $534,096 $219 $22,760$151,267 $2,713,031 $1,308 31.0 63.2 $3,503,483 $6,216,514 16.1% $1,788 $876,944 $448 $103,789 $53 $16,515$228,565 $2,822 $1,169,200 $14,435 $518 31.0 58.6 $2,346,113 $3,515,313 8.6% $1,291 $1,313,589 $723 $0 $20,759
$1,597,558 $746 $3,824,170 $1,786 $445 21.0 238.1 $3,831,776 $7,655,946 8.4% $766 $2,854,256 $571 $181,086 $36 $16,959$1,242,823 $720 $4,269,641 $2,472 $356 55.0 154.4 $9,275,790 $13,545,431 9.2% $1,092 $2,464,467 $290 $45,488 $5 $15,952$698,250 $1,548 $2,141,596 $4,749 $300 37.0 130.0 $6,948,898 $9,090,494 10.9% $1,444 $2,711,565 $564 $592,286 $123 $15,483$465,703 $5,679 $9,946,337 $121,297 $1,327 42.0 170.2 $5,280,311 $15,226,648 13.5% $739 $2,894,919 $405 $1,553,679 $217 $13,493
$4,246,900 $667 $9,264,283 $1,455 $501 66.0 151.6 $7,509,511 $16,773,794 9.8% $751 $2,163,689 $216 $1,221,298 $122 $15,807$196,297 $1,609 $798,570 $6,546 $428 10.0 140.8 $2,657,867 $3,456,437 11.0% $1,888 $1,090,767 $775 $417,936 $297 $19,767
$2,306,750 $627 $4,724,661 $1,285 $527 39.0 117.6 $4,074,512 $8,799,173 9.3% $888 $2,995,382 $653 $901,433 $197 $19,099$606,569 $714 $3,144,317 $3,704 $535 42.5 111.5 $2,872,783 $6,017,100 7.5% $606 $2,816,074 $594 $191,600 $40 $15,694
$2,896,455 $785 $13,610,782 $3,687 $352 121.0 251.4 $19,748,618 $33,359,400 5.9% $649 $14,207,124 $467 $4,925,326 $162 $17,466$1,341,979 $879 $2,617,499 $1,715 $328 91.5 42.5 $6,924,900 $9,542,399 13.0% $1,782 $1,073,503 $276 $793,696 $204 $16,598$123,186 $1,369 $1,188,492 $13,205 $438 25.0 97.2 $1,864,891 $3,053,383 5.9% $767 $1,373,680 $565 $804,457 $331 $19,656
$118,129,603 $238 10,396.0 125.8
$1,589,729 $1,728 $6,998,573 $11,042 $734 99.0 114.4 $12,579,491 $19,578,065 11.9% $1,476 $3,823,681 $476 $1,803,015 $197 $17,616$1,545,128 $1,897 $7,060,451 $21,224 $705 98.2 61.1 $12,386,337 $18,598,770 7.4% $876 $3,813,340 $162 $2,021,489 $184 $3,017
$52,461,049 $620 $191,497,435 $191,497,436 $455 3,267 94 $370,793,273 $370,793,274 6.3% ///////////$1,283 $120,479,061 //////////////$417$52,287,446 $171 $581,339
$280,301 $646 $668,714 $1,540.82 $711 1.0 546.5 $2,575,270 $3,243,984 40.4% $4,712 $33,975 $62 $66,500 $122 $9,146$92,732 $117 $880,161 $1,114.13 $980 2.0 401.8 $4,567,867 $5,448,028 44.0% $5,685 $87,000 $108 $141,000 $175 $8,580
$173,414 $2,409 $232,948 $3,235.39 $260 0.0 $1,358,808 $1,591,756 36.5% $5,934 $40,000 $175 $18,035 $79 $12,764$154,606 $529 $518,951 $1,777.23 $723 0.0 $471,635 $990,586 14.1% $936 $1,500 $3 $68,000 $135 $12,108
$0 $201,836 $6,727.87 $430 1.0 469.0 $410,910 $612,746 7.6% $876 $307,740 $656 $130,166 $278 $15,681$0 $690,605 $1,188.65 $817 2.0 422.5 $212,500 $903,105 6.9% $251 $306,238 $362 $101,844 $121 $14,223$0 $1,780,863 $1,868.69 $668 11.0 242.2 $1,371,997 $3,152,860 6.4% $515 $1,200,400 $451 $294,127 $110 $17,102
$125,479 $2,728 $288,036 $6,261.65 $324 1.0 501.0 $2,534,378 $2,822,414 32.9% $5,059 $230,735 $461 $109,490 $219 $11,519$0 $476,450 $18,325.00 $380 7.0 179.2 $2,989,068 $3,465,518 20.0% $2,383 $346,787 $276 $86,378 $69 $11,007$0 $2,657,916 $1,797.71 $1,403 21.0 90.2 $3,391,668 $6,049,584 16.9% $1,791 $703,487 $371 $350,961 $185 $15,540$0 $946,813 $2,958.79 $728 9.0 144.6 $1,292,453 $2,239,266 11.9% $993 $444,459 $342 $233,745 $180 $12,551
$6,419 $15 $813,714 $1,866.32 $1,374 3.0 195.8 $1,923,159 $2,736,873 31.9% $3,273 $3,866 $7 $205,815 $350 $9,606$756,830 $565 $1,376,156 $1,026.98 $373 0.0 $555,222 $1,931,378 7.4% $334 $1,035,715 $624 $373,980 $225 $14,841
$0 $1,504,068 $4,592.57 $642 11.0 213.0 $1,605,003 $3,109,071 11.2% $685 $990,647 $423 $254,805 $109 $10,382$1,201,101 $879 $1,532,692 $1,121.62 $225 4.0 368.0 $3,445,916 $4,978,608 17.2% $2,341 $663,858 $451 $50,345 $34 $17,052$1,020,960 $713 $1,500,096 $1,048.29 $346 2.0 691.5 $200,000 $1,700,096 7.9% $145 $373,635 $270 $917,098 $663 $14,464$189,107 $659 $1,052,774 $3,668.20 $2,399 3.0 120.0 $535,500 $1,588,274 26.4% $1,488 $83,445 $232 $94,025 $261 $12,536$326,693 $610 $1,013,161 $1,890.23 $764 3.0 299.7 $7,014,248 $8,027,409 44.6% $7,802 $315,682 $351 $372,105 $414 $11,049
$0$240,425 $897 $1,007,553 $3,445 $753 4.5 325.7 $2,025,311 $3,032,864 21.3% $2,511 $398,287 $312 $214,912 $207 $12,786$369,160 $866 $631,758 $4,100 $534 5.5 177.3 $1,787,929 $2,419,687 13.7% $2,346 $375,057 $191 $209,624 $151 $2,624
$4,327,642 $402.70 $18,135,954 $1,687.61 $700 81.0 243.4 $36,455,602 $54,591,556 17.1% $1,849 $7,169,169 $364 $4,292,956 $218 $230,151 69

!!!!!!!!!!!!
Exhibit!9!
70

!DistrictCounty
Enrollment
2013!CAFR
DFG
A=1
B=2!
CD=
Budgetary!
cst/
pupil
spndg!
clrm/
pupil
Cost!
per
!pupil
Spndg
/cost
Per!Capita!
Income
Per
Capita!
Income!
Rank
Median!
Household!
Income
Median!
Family
Income
Census!DataLatest!Est.!EP2013I14
TAX!LEVYEqual.!!Prop
TAX!
LEVY/
EQ!
PROP
Eq!Prop/
pupil
Eq#Prop/pop
Eq#Prop/EP
Urban!Bridgeton Cumberland 5766.5 1 14,918 8,738 18,074 0.83 12,418 564 31,044 38,750 25,349 25,290 $3,637,144 $479,805,872 0.8% $83,206 $18,928 $18,972Camden=City Camden 11,913 1 19,710 10,812 30,941 0.64 12,807 563 27,027 29,118 77,344 77,250 $7,449,009 $1,573,022,272 0.5% $132,042 $20,338 $20,363Passaic=City Passaic 13,154 1 15,145 9,462 22,766 0.67 14,424 562 31,135 34,934 69,781 70,218 $16,818,577 $3,185,363,088 0.5% $242,159 $45,648 $45,364Paterson Passaic 26,782 1 16,223 9,214 20,528 0.79 15,543 560 34,086 39,003 146,199 145,219 $38,955,956 $6,817,844,166 0.6% $254,568 $46,634 $46,949New=Brunswick= Middlesex 8,347 1 17,280 10,329 20,786 0.83 16,395 556 44,543 44,555 55,181 56,160 $27,326,591 $3,135,660,325 0.9% $375,663 $56,825 $55,834Lakewood Ocean 5,493 12,651 7,486 27,005 0.47 16,430 555 41,527 45,420 92,843 108,900 $77,097,641 $7,135,714,385 1.1% $1,299,056 $76,858 $65,525
Lkwd!CDP!or!14!bud Ocean 6,116 11,682 6,680 11,895 36,516 38,493 53,805 62,702 $84,593,837 $7,135,714,385 1.2% $1,166,729Newark Essex 46,773 1 18,448 9,182 23,832 0.77 17,367 554 35,659 41,684 277,140 277,727 $111,159,328 $13,899,679,560 0.8% $297,173 $50,154 $50,048Trenton Mercer 13,702 1 16,732 9,373 21,541 0.78 17,400 553 36,601 41,491 84,913 84,477 $21,115,662 $2,301,397,039 0.9% $167,961 $27,103 $27,243Salem Salem 1,206 1 17,839 9,930 21,822 0.82 17,733 552 25,682 38,286 5,146 5,165 $2,392,321 $214,058,162 1.1% $177,494 $41,597 $41,444Union=City Hudson= 12,632 1 17,176 8,724 17,814 0.96 18,506 549 40,173 43,101 66,455 67,744 $15,418,637 $2,952,662,105 0.5% $233,745 $44,431 $43,586Pleasantville Atlantic 3,901 1 18,117 10,571 22,727 0.80 18,527 548 39,560 48,873 20,249 20,750 $7,988,767 $967,213,734 0.8% $247,940 $47,766 $46,613East=Orange Essex 9,756 1 17,911 9,353 23,398 0.77 20,298 540 40,358 50,995 64,270 64,268 $18,950,050 $2,974,801,220 0.6% $304,920 $46,286 $46,287Elizabeth Union 24,122 1 17,923 10,723 21,354 0.84 19,196 546 43,770 46,891 124,969 126,458 $52,313,124 $6,451,274,687 0.8% $267,444 $51,623 $51,015Orange Essex 5,526 1 15,718 9,337 17,723 0.89 19,816 544 40,818 44,645 32,868 $10,661,568 $1,384,268,688 0.8% $250,501 $42,116Perth=Amboy Middlesex 10,707 1 15,183 9,706 17,665 0.86 20,162 541 47,696 53,792 50,814 51,744 $21,762,553 $3,217,847,364 0.7% $300,537 $63,326 $62,188Asbury=Park Monmouth 2,452 1 26,340 13,661 31,882 0.83 20,368 538 33,527 33,140 16,116 15,865 $6,378,062 $1,222,318,020 0.5% $498,498 $75,845 $77,045Irvington Essex 7,195 1 16,027 8,940 20,437 0.78 20,520 536 42,580 50,798 53,926 53,926 $17,459,529 $2,445,274,470 0.7% $339,857 $45,345 $45,345Keansburg Monmouth 1,659 1 21,472 12,914 22,285 0.96 21,246 530 39,206 52,128 10,105 10,013 $4,290,151 $536,656,340 0.8% $323,482 $53,108 $53,596Phillipsburg Warren 3,628 2 15,821 9,470 18,998 0.83 21,291 529 42,825 51,334 14,950 14,699 $9,367,369 $824,088,850 1.1% $227,147 $55,123 $56,064Harrison=town Hudson 2,213 1 15,049 7,897 21,364 0.70 21,857 527 51,193 53,006 13,620 13,874 $9,229,913 $1,060,058,220 0.9% $479,014 $77,831 $76,406Gloucester=City Camden 2,075 2 18,296 10,344 21,354 0.86 22,718 522 52,222 58,825 11,456 11,440 $3,415,880 $96,470,976 3.5% $46,492 $8,421 $8,433Millville Cumberland 6,034 2 14,473 8,217 18,006 0.80 23,364 516 44,925 55,000 28,400 28,619 $10,813,394 $1,714,934,000 0.6% $284,212 $60,385 $59,923Plainfield Union 9,525 2 16,430 9,211 18,040 0.91 23,767 514 52,056 58,942 49,808 50,524 $22,731,000 $2,587,475,792 0.9% $271,651 $51,949 $51,213Garfield Bergen 5,254 2 14,155 8,505 18,302 0.77 24,022 512 51,407 56,701 30,487 30,872 $24,520,588 $2,111,102,802 1.2% $401,809 $69,246 $68,382West=New=York Hudson 8,047 1 15,244 9,158 17,276 0.88 24,419 50ͺ 44,657 42,534 49,708 51,464 $14,569,214 $2,164,336,028 0.7% $268,962 $43,541 $42,055Vineland Cumberland 9,758 2 16,002 9,345 20,671 0.77 24,512 506 54,024 64,185 60,724 60,724 $21,731,439 $4,058,852,884 0.5% $415,951 $66,841 $66,841Burlington=City Burlington 1,779 2 16,793 9,443 20,288 0.83 24,612 503 48,317 62,049 9,920 9,879 $10,282,829 $638,699,200 1.6% $359,021 $64,385 $64,652Pemberton=Twp. Burlington 5,048 3 19,240 11,376 23,539 0.82 26,240 475 63,309 73,757 27,912 27,912 $11,558,636 $1,488,658,608 0.8% $294,901 $53,334 $53,334Long=Branch Monmouth 5,494 2 14,988 9,286 17,730 0.85 30,381 395 52,792 56,778 30,719 30,646 $33,391,044 $4,373,126,121 0.8% $795,982 $142,359 $142,698Jersey=City Hudson= 26,615 1 18,773 10,807 25,679 0.73 30,490 388 54,280 58,533 247,597 254,441 $108,336,848 $18,570,517,791 0.6% $697,746 $75,003 $72,986Neptune=Twp. Monmouth 4,450 3 15,697 8,280 18,236 0.86 30,656 382 58,630 74,422 27,935 27,935 $34,636,342 $3,515,927,035 1.0% $790,096 $125,861 $125,861Hoboken Hudson 2,352 2 22,848 11,625 26,929 0.85 69,085 29 101,782 121,614 50,005 52,034 $37,946,477 $11,098,759,765 0.3% $4,718,860 $221,953 $213,298NJ 1,311,629 18,891 39,940 39,941 113,162 114,265 8,791,894 8,899,339 $13,380,314,945 $1,159,888,199,738 1.2% $884,311 $131,927 $130,334
average!SDAs 9,378.02 1.42 16,978.91 9,639.36 21,531.00 0.80 22,074.70 491.84 44,967.48 51,629.61 60,021.64 62,154.34 $27,221,196 $3,808,584,741 0.9% $406,118 $61,568 $61,276
Standard!Dev 9,461.32 0.62 2,827.60 1,422.86 3,740.08 0.09 9,731.60 128.11 13,563.25 16,512.83 61,596.87 63,390.36 $28,643,593 $2,449,446,670 0.5% $258,891 $39,342 $38,641
MEDIAN 6,034.00 16,430.00 9,353.00 21,070.00 0.82 20,368.00 537.00 42,825.00 50,798.00 49,808.00 51,604.00 17,459,529.00 2,445,274,470.00 0.01 $297,173 $52,529 $53,334
Bacon4DistrictsMaurice4River Cumberland 433 2 11,931 7,107 19,423 0.61 15,705 559 69,419 78,713 7,976 7,965 $2,612,637 $309,564,512 0.8% $714,930 $38,812 $38,866Woodbine Cape4May 235 1 15,219 9,973 24,964 0.61 15,734 558 28,125 25,254 2,472 2,448 $1,732,787 $157,404,600 1.1% $669,807 $63,675 $64,299Commercial Cumberland 602 1 12,382 7,390 24,323 0.51 19,242 545 45,323 46,790 5,178 5,195 $1,369,809 $249,890,280 0.5% $415,100 $48,260 $48,102FaIrfield Cumberland 602 1 11,498 7,626 15,307 0.75 20,619 535 46,895 55,286 6,295 6,426 $725,016 $309,185,220 0.2% $513,597 $49,116 $48,115Egg4Harbor4City Atlantic 492 2 14,519 8,410 19798 0.73 22,294 525 52,893 67,654 4,243 4,246 $2,370,858 $236,971,550 1.0% $481,649 $55,850 $55,811Upper4Deerfield Cumberland 904 2 13,771 8,366 16,057 0.86 26,033 482 53,646 61,974 7,660 7,697 $6,386,244 $618,675,220 1.0% $684,375 $80,767 $80,379Hammonton Atlantic 3,605 2 10,663 6,495 13,240 0.81 26,130 480 55,725 72,621 14,791 14,799 $16,212,385 $1,315,008,646 1.2% $364,774 $88,906 $88,858Lakehurst Ocean 572 2 12,254 7,704 14,415 0.85 27,171 464 67,872 67,838 2,654 2,700 $1,068,776 $172,663,932 0.6% $301,860 $65,058 $63,950Wallington Bergen 1,191 2 10,920 5,879 15,487 0.71 27,350 458 58,724 66,414 11,335 11,545 $13,616,363 $979,559,365 1.4% $822,468 $86,419 $84,847Buena4Regional Atlantic 2,201 1 13,318 8,222 17,160 0.78 12,173 $12,186,637 $0Clayton Gloucester 1,384 2 10,896 6,351 15,624 0.70 27,437 456 70,299 70,989 8,179 8,216 $7,559,956 $480,917,021 1.6% $347,483 $58,799 $58,534Lawrence Cumberland 504 1 12,446 8,346 17,971 0.69 27,934 446 70,948 72,014 3,290 3,268 $1,927,691 $219,285,080 0.9% $435,089 $66,652 $67,101Lower4Township Cape4May 1,804 2 13,033 8,021 16,496 0.79 28,175 441 51,101 62,587 22,866 22,722 $15,251,564 $3,708,636,540 0.4% $2,055,785 $162,190 $163,218South4River Middlesex 2,329 2 10,094 6,015 13,009 0.78 28,178 440 62,284 78,109 16,008 16,236 $13,394,657 $1,312,095,720 1.0% $563,373 $81,965 $80,814Lower4Cape4May4Reg. Cape4May 1,480 2 15,147 8,996 20,475 0.74 27,492 27,163 $18,499,082 $0Little4Egg4Harbor Ocean 1,751 2 13,284 8,383 17,690 0.75 28,566 434 59,365 66,345 20,065 19,992 $10,553,274 $2,386,109,735 0.4% $1,362,713 $118,919 $119,353Quinton Salem 370 2 11,105 6,474 12,236 0.91 29,805 409 65,061 75,833 2,666 2,673 $2,307,609 $193,181,026 1.2% $522,111 $72,461 $72,271Ocean4Twn. Ocean 541 2 15,974 9,356 31,304 0.51 36,895 252 74,736 75,815 8,332 8,333 $9,944,546 $1,302,724,864 0.8% $2,407,994 $156,352 $156,333
AVERAGE 1,271 1.75 12,582 7,627 17,537 0.74 26,314 455 58,254 66,911 10,827 10,747 $8,335,904.19 $842,806,512.44 $0 $805,598 $85,122 $84,835STANDARD4DEV. 897 0.45 1,703 1,082 4,779 0.11 71 7,580 7,768 $6,140,663.09 $1,004,432,349.75 0.4% $664,076 $36,490 $36,836MEDIAN 753 2 12414 7862.5 16828 0.7455 27393.5 461 55808.5 67034 8077.5 7965 $6,973,100.00 $309,374,866.00 0.9% $542,742 $69,557 $69,686
71

!District
Urban!BridgetonCamden=CityPassaic=CityPatersonNew=Brunswick=Lakewood
Lkwd!CDP!or!14!bud
NewarkTrentonSalemUnion=CityPleasantvilleEast=OrangeElizabethOrangePerth=AmboyAsbury=ParkIrvingtonKeansburgPhillipsburgHarrison=townGloucester=CityMillvillePlainfieldGarfieldWest=New=YorkVinelandBurlington=CityPemberton=Twp.Long=BranchJersey=CityNeptune=Twp.HobokenNJ
average!SDAs
Standard!Dev
MEDIAN
Bacon4DistrictsMaurice4RiverWoodbineCommercialFaIrfieldEgg4Harbor4CityUpper4DeerfieldHammontonLakehurstWallingtonBuena4RegionalClaytonLawrenceLower4TownshipSouth4RiverLower4Cape4May4Reg.Little4Egg4HarborQuintonOcean4Twn.
AVERAGESTANDARD4DEV.MEDIAN
INCOME
SCHOOL#TAX#LEVY/
INCOME
MUNICPAL#TAX#LEVY
MUNI#TAX#
LEVY/INCOM
COUNTY#TAX#LEVY
COUNTY#TAX#LEVY/INCOME
TOTAL#OVERBURDEN
FRL%Poverty#rate
Unempl#rate
Labor#2012Labor/EP
Pop/sq.#michldn
<18/poppost#
sec.ed.dropXout#rt.
Grad.#rt.
Person!
per!
houseI
hold
2013=HSPA=
Lang=Arts
2013=HSPAMath
$236,255,063 1.5% $5,296,832 2.2% $5,296,832 2.2% 6.0% 93 30.8 14.8 8,300 32.8 1,195.50 27.9 46 5.1 68 3.48 75.9% 51.7%$621,115,149 1.2% $24,443,358 3.9% $13,206,281 2.1% 7.3% 90 38.6 18.1 27,100 35.1 8,669.90 31 49 7.7 50 3.01 41.2% 19.7%$901,354,695 1.9% $22,086,845 2.5% $58,604,107 6.5% 10.8% 80 29.7 13.1 29,600 42.2 22,180.90 31.5 65 1.3 71 3.45 68.5% 53.2%
$1,822,974,662 2.1% $45,703,465 2.5% $148,289,271 8.1% 12.8% 85 27.6 16.5 49,600 34.2 17,346.80 27.9 98 0.4 71.9 3.29 71.8% 49.7%$571,090,959 4.8% $28,987,442 5.1% $11,873,767 2.1% 11.9% 93 31.4 7.5 29,900 53.2 10,556.90 21.1 64 4 61 3.28 75.6% 52.2%$1,280,273,414 6.0% $49,101,420 3.8% 28,228,039.60 2.2% 12.1% 92 33.1 7.7 33,000 30.3 43 4.7 71 #############70.7%43.8%
6.6% 33.8 7,601.70 48.4 4.74
$3,069,726,763 3.6% $193,711,013 6.3% $74,907,035 2.4% 12.4% 89 28 14.8 106,900 38.5 11,458.20 25.6 54 0.8 73 2.85 77.8% 60.8%$924,498,007 2.3% $73,627,022 8.0% $15,354,897 1.7% 11.9% 89 26.6 12.4 40,100 47.5 11,102.60 25.1 62 5.4 51 2.84 67.9% 36.4%$60,807,518 3.9% $4,192,700 6.9% 2,153,876.17 3.5% 14.4% 87 33.1 2,196.30 28.2 51 9 75 2.55 70.1% 42.7%$908,125,190 1.7% $16,690,719 1.8% $64,255,799 7.1% 10.6% 92 22.4 13.2 29,100 43.0 51,796.60 23.7 69 2.1 79 2.9 80.5% 67.3%$250,307,521 3.2% $20,013,337 8.0% $4,570,492 1.8% 13.0% 84 20.3 18.5 3,556.20 27.5 49 2.4 70 3.08 65.9% 32.0%$899,729,166 2.1% $84,250,301 9.4% 17,091,959.78 1.9% 13.4% 77 19.8 13.2 28,700 44.7 16,378.70 25.7 50 5.2 70 2.55 71.1% 46.8%
$1,743,043,344 3.0% $128,889,101 7.4% $33,265,028 1.9% 12.3% 88 18.8 12.6 56,600 44.8 10,144.40 25.6 56 4.6 61 3.14 77.2% 63.2%$417,560,827 2.6% $37,995,076 9.1% $7,033,640 1.7% 13.3% 86 21.4 11.9 14,400 57 0.4 80 69.2% 46.6%$721,793,399 3.0% $56,546,855 7.8% $11,720,075 1.6% 12.5% 64 21.2 15.1 24,200 46.8 62 3.6 59 3.04 65.5% 61.4%$208,783,963 3.1% $14,477,117 6.9% $3,440,919 1.6% 11.6% 92 30 19.8 11,317.40 23.8 68 4.4 51 2.35 41.1% 29.5%$807,253,390 2.2% $69,451,781 8.6% $12,851,507 1.6% 12.4% 69 20.5 12.7 26,200 48.6 64 2.8 60 59.9% 32.2%$163,489,851 2.6% $9,967,578 6.1% $1,666,096 1.0% 9.7% 51 17.2 15.1 9,452.80 23.4 65 3.2 76 2.49 79.8% 62.6%$246,317,274 3.8% $10,896,083 4.4% $6,199,373 2.5% 10.7% 50 18.2 12.9 4,682.10 25.8 69 2.9 83 2.49 92.8% 74.3%$280,103,129 3.3% $5,745,710 2.1% $8,892,686 3.2% 8.5% 81 16.6 12.2 11,321.70 20.8 58 0 91 2.81 84.5% 71.1%$191,473,969 1.8% $10,010,000 5.2% $4,329,079 2.3% 9.3% 68 13.4 16.5 4,937.90 24.5 55 1.1 83 2.71 91.9% 76.3%$547,629,083 2.0% $18,614,053 3.4% $17,585,933 3.2% 8.6% 66 17.1 13.8 13,700 47.9 676.2 25.8 62 3.1 82 2.74 81.2% 64.0%$846,175,487 2.7% $52,472,671 6.2% $12,960,966 1.5% 10.4% 87 19.4 11.7 27,000 53.4 8,269.60 25.8 60 1.7 80 3.25 77.6% 48.6%$544,194,648 4.5% $23,266,381 4.3% $4,840,113 0.9% 9.7% 61 12.7 13.2 16,800 54.4 14,524.50 23.3 65 0.8 78 2.76 84.4% 69.2%$906,134,753 1.6% $33,859,028 3.7% $12,360,777 1.4% 6.7% 84 18.8 11.5 22,600 43.9 49,362.50 21 70 0.1 78 2.73 85.5% 74.6%
$1,246,487,641 1.7% $30,743,200 2.5% $39,385,883 3.2% 7.4% 68 13.7 13.5 29,000 47.8 887.5 24.5 62 4.4 74 2.84 83.1% 67.0%$183,607,176 5.6% $7,482,251 4.1% $2,506,989 1.4% 11.0% 59 10.5 13.2 3,238.70 23.9 60 2.3 78 2.46 81.8% 58.8%$472,101,328 2.4% $13,903,448 2.9% $5,982,729 1.3% 6.7% 55 11 11.1 14,300 51.2 56 1.6 84 85.6% 63.8%$668,081,628 5.0% $36,942,431 5.5% $12,877,847 1.9% 12.5% 70 15.5 10.5 15,600 50.9 5,824.60 21.7 71 1.2 92 2.55 83.3% 60.9%
$6,832,672,379 1.6% $223,632,806 3.3% $96,345,473 1.4% 6.3% 75 17.6 10.7 118,700 46.7 16,736 21.1 67 2 53 2.57 80.5% 63.2%$709,521,710 4.9% $25,497,906 3.6% $10,518,730 1.5% 10.0% 59 9.6 11.9 14,800 53.0 75 1.8 77 85.6% 62.6%
$3,415,470,361 1.1% $54,634,529 1.6% $53,105,119 1.6% 4.3% 72 10.9 4.9 35,200 67.6 39,219.60 12.2 58 0.3 85 2.02 84.3% 60.7%$297,925,408,020 4.5% $7,882,336,524 2.6% $4,776,611,471 1.6% 8.7% 37 9.9 9.3 4,561,800 51.3 1,195.50 23.5 1.5 86 2.7
518,059/1,368,517$1,021,817,295 3.1% $44,785,389 4.9% $25,053,166 2.4% 10.3% 76.74 21.49 13.05 33,808.33 46.01 13,134.66 25.44 61.25 2.83 72.37 2.89 75.5% 55.2%
$1,307,359,265 1.5% $51,003,227 2.3% $32,630,816 1.7% 2.5% 13.47 7.87 3.11 26,886.22 8.34 13,414.49 5.90 10.25 2.19 11.44 0.50 12.10% 14.3%
$688,801,669 0.03 $27,242,674 4.3% $12,606,142 1.9% 10.7% 80.50 19.80 13.10 27,900.00 46.77 10,144.40 25.10 62.00 2.35 74.50 2.83 77.8% 60.8%
$74,112,016 3.5% $1,265,184 1.7% $3,180,010 4.3% 9.5% 41 28.5 11.3 85.7 2.62$67,931,455 2.6% $415,658 0.6% $465,179 0.7% 3.8% 57 15.8 13.9 308.2 2.61$31,847,283 4.3% $1,703,936 5.4% $2,471,573 7.8% 17.4% 80 23.6 17.2 161.2 2.74$61,380,709 1.2% $3,091,560 5.0% $1,213,465 2.0% 8.2% 73 30 22 152.60 2.67$48,573,596 4.9% $4,046,623 8.3% 1,189,024.34 2.4% 15.7% 77 27.6 9.2 388.1 2.64 91.5% 76.0%$127,438,312 5.0% $6,075,986 4.8% $280,000 0.2% 10.0% 50 27.3 13.5 246.3 2.65$379,747,435 4.3% $7,639,340 2.0% $6,511,998 1.7% 8.0% 38 22.5 16.8 361.8 68 0.8 90 2.68 94.8% 84.3%$44,982,818 2.4% $2,095,645 4.7% $782,585 1.7% 8.8% 50 6.4 14.9 2,900.80 3.01$261,474,386 5.2% $8,151,675 3.1% $2,301,554 0.9% 9.2% 30 23.3 12.5 11,528.60 68 1.3 95 2.44 91.6% 80.7%$273,103,996 4.5% 0.0% 0.0% 4.5% 49 9 607.4 61 0.7 85 2.66 92.1% 70.3%$173,663,643 4.4% $4,314,742 2.5% $3,134,093 1.8% 8.6% 51 27.3 9.8 1,145.50 2.8 96.0% 75.0%$66,432,452 2.9% $884,715 1.3% $2,270,921 3.4% 7.7% 56 27.6 16 33.1 2.95$250,791,543 6.1% $19,222,668 7.7% $9,182,632 3.7% 17.4% 57 10.6 16.3 824.3 2.38$364,167,553 3.7% $8,119,923 2.2% $5,087,423 1.4% 7.3% 46 28.8 11.7 5,781.40 78 1.6 80 2.83 90.9% 71.0%$235,664,079 7.8% 0.0% 0.0% 7.8% 40 26.6 14.7 824.3 65 2.3 89 2.38 88.5% 64.1%$243,648,394 4.3% $15,365,305 6.3% $9,335,920 3.8% 14.5% 43 26.6 8.9 423.6 2.46$53,525,635 4.3% $401,325 0.7% $1,830,455 3.4% 8.5% 46 9.7 11.7 110.7 2.57$220,529,384 4.5% $10,358,602 4.7% $6,881,195 3.1% 12.3% 35 16.7 13.4 208.8 2.39
$165,500,816 4.2% $5,822,055 3.4% $3,507,377 2.4% 10.0% 51 22 14 1,606 68 1.34 88 2.64$115,334,022 1.5% $5,494,150 2.6% $2,988,131 1.9% 4.0% 15 7.7 3.7 3,024 6 0.65 6 0.20$150,550,978 4.3% $4,180,683 2.8% $2,386,564 1.9% 8.7% 49.5 26.6 13.45 374.95 68 1.3 89 2.645 91.6% 75.0%
72

SDA/Urban*information*from*Quick*Facts***http://quickfacts.census.gov/qfd/states/34/3438580.html*for*urban*area.*Bacon*districts*listed*on*American*
Factfinder*http://factfinder2.census.gov/faces/nav/jsf/pages/community_facts.xhtml*poverty*on*table*s1701.**
List*of*municipalities*at:*http://njsda.gov/GI/SDA_Districts.html*Income*data*for*2010*found*at:*
http://lwd.dol.state.nj.us/labor/lpa/industry/incpov/income2010/income.xls*
Equalized*property*values*for*2013*are*found*at:*http://www.state.nj.us/treasury/taxation/lpt/lptvalue.shtml*Lakewood*estimated*population*(EP)*and*
equalized*property*values*are*for*2014.*Latest*population*estimates*(municipal*2012,*NJ*2013),*poverty*rates,*urban,*children*under*18,*density*and*
family*density*were*taken*from*the*US*Census*werbsite:*http://quickfacts.census.gov/qfd/states/34000.html*2011Y2012*list*of*Free*and*Reduced*lunch*
found*at*http://www.state.nj.us/education/techno/teleact/*
Graduation,*dropYYYout*and*postYYYsecondary*data*is*found*in*the*School*Report*Cards*at:http://education.state.nj.us/pr/*The*following*are*peer*schools*of*
Lakewood*High*School:*Woodrow*Wilson*High*School*(Camden*City),*Rosa*Parks*High*School,*Trenton*High*School*Main*Campus,*East*Side*HS*(Newark),*
Henry*Snyder*(Jersey*City),*Adm.*Halsey*Leadership*Academy*(Elizabeth)*Paterson*district*10.8%*drop*out*rate*and*71.9%*graduation*rate:*
http://www.paterson.k12.nj.us/departments/superintendent/reports/Annua*l%20Report%20SBOE%201%208%2014c.pdf*Spending*pp*and*classroom*
spending*pp*in*"User*Friendly*Budget,"*2011YYY12,*revised*budget*column,*found*at*:*http://www.state.nj.us/education/finance/fp/ufb/2012/01.html*2013*
cost*per*pupil,*(operating*expenses)/(pupis)*on*exhbit*JYYY17*in*the*2013*CAFR*at:*http://www.state.nj.us/education/finance/fp/cafr/search/13/*** .***
Pleasantville*** 2011* cost*pp.*New*Brunswick*ccp*012YYY13*User*Friendly*Budget*http://www.nbpschools.net/site_res_view_folder.aspx?id=d4026685YYYaef1YYY4240Y
YY8c3cYYY* 73b5a889d7f6**.**Lakewood**2012**operating**expense**$148,340,371/5,493**pupils.*
NJ*average*expenditure*pp*reported*at:**http://www.nj.com/education/2014/05/average_nj_per_pupil_spending_almost_19k*
_new_report_finds.html*Spending*pp*and*classroom*spending*pp*in*User*Friendly*Budget*2011YYY12*revised*budgetat*:*
http://www.state.nj.us/education/finance/fp/ufb/2012/01.html*Free**and**Reduced**lunch**at:http://www.edlawcenter.org/research/dataYYYresearch.html*
2014* Urban* district* unemployment* data* at:*http://lwd.dol.state.nj.us/labor/lpa/employ/uirate/lfest_index.html**Asbury*** Park*(2011),* Salem,**Pleasantville,**
Phillipsburg,**Keansberg,**Harrison**town,* Gloucester**City,* Burlington*City*and*Bacon*district*unemployment*2013*CAFR*JY14.*
73

!!!!!!!!!!!!
Exhibit!10!
74

2013 NJ ASK Grade 3 State Summary09/18/2013
nj ask/hspa 2013.xls (Total and Instructional Groups) 1
District Name
TotalPPELA
TotalPELA
TotalAPELA Passing
TotalPPMath
TotalPMath
TotalAPMath Passing
Grade 3STATE AVE 33.6 62.4 4.0 66.4 22.3 36.2 41.5 77.7LAKEWOOD TOWNSHIP 73.1 26.9 0.0 26.9 62.2 29.4 8.4 37.8
Grade 4STATE AVE 40.6 51.0 8.4 59.4 21.7 43.8 34.5 78.3LAKEWOOD TOWNSHIP 76.1 23.0 0.9 23.9 44.0 46.6 9.3 55.9
Grade 5STATE AVE 38.8 52.6 8.7 61.3 20.1 36.9 43.0 79.9LAKEWOOD TOWNSHIP 71.5 26.9 1.6 28.5 43.7 42.1 14.1 56.2
Grade 6STATE AVE 33.9 61.5 4.7 66.2 21.2 47.9 31.0 78.9LAKEWOOD TOWNSHIP 66.4 33.6 0.0 33.6 40.4 46.6 12.9 59.5
Grade 7STATE AVE 34.8 52.4 12.8 65.2 36.4 38.1 25.4 63.5LAKEWOOD TOWNSHIP 76.1 22.8 1.1 23.9 67.9 26.9 5.2 32.1
Grade 8STATE AVE 18.1 70.5 11.4 81.9 30.7 38.0 31.3 69.3LAKEWOOD TOWNSHIP 51.9 47.8 0.3 48.1 63.8 31.4 4.8 36.2
HSPASTATE AVE 8.4 65.0 26.6 91.6 20.4 50.6 29.1 79.7LAKEWOOD TOWNSHIP 29.3 68.9 1.8 70.7 56.2 41.0 2.8 43.8
75

!!!!!!!!!!!!
Exhibit!11!
76

2012 2010 School County DFG*Grade 12
enrollmentAverage class size
Student/ faculty
ratio
% of faculty with masters or doctorate
Average combined SAT score
% advanced proficient:
HSPA-language
% advanced proficient: HSPA-math
Number of AP tests
offered
% of AP tests
resulting in 3+
Adjusted cohort grad
rate
1 5 New Providence Union I 171.5 17.7 10.6 75.0 1737 41.7 61.8 24 92.5 97.7
2 2 McNair Academic (Jersey City) Hudson B 156 13.1 10.8 52.2 1749 56.3 73 22 63.7 99.36
3 3 Tenafly Bergen I 303 17.7 11.2 88.8 1814 40.6 60.3 24 90.3 97.43
4 28 Glen Rock Bergen J 183 18.4 10.0 62.7 1696 27.8 48 22 81.5 99.47
5 21 Kinnelon Morris I 182.5 17.6 10.7 67.2 1663 39.9 39.3 21 76.0 98.91
6 15 Madison Morris I 205 20.3 10.5 81.7 1700 46 42.2 23 90.1 97.16
7 9 Mountain Lakes Morris J 159.5 19.5 10.5 67.5 1738 39.3 43.3 22 81.3 96.97
8 1 Millburn Essex J 389 21.3 10.9 81.6 1851 51.6 69 27 95.5 98.72
9 12 Ridge (Bernards Township) Somerset J 394.5 19.4 11.2 68.7 1750 43.1 56.1 29 88.6 98.77
10 31 Rumson-Fair Haven Regional Monmouth J 215.5 18.8 10.3 60.4 1702 47.1 54.9 22 86.2 96.51
11 32 Bernards Somerset I 208 19.4 11.3 74.3 1677 37.6 51 24 81.6 96.7
12 4 Glen Ridge Essex I 122 19.3 10.3 66.3 1684 40.5 53 15 94.0 95.16
13 17 Holmdel Monmouth I 266.5 20.8 11.0 68.5 1785 34.2 50.2 23 91.1 99.26
14 18 Park Ridge Bergen I 70.5 16.7 10.0 63.6 1600 26.6 34 12 73.6 98.68
15 25 Summit Union I 219 20.0 10.1 72.5 1719 36.6 45.8 23 88.1 93.25
16 36 West Essex (North Caldwell) Essex I 256.5 18.4 9.6 63.7 1590 33.6 34 19 84.5 98.13
17 19 Ramapo Bergen I 329 20.9 9.4 65.1 1655 39.2 42.9 21 82.7 96.77
18 7 Pascack Hills (Montvale) Bergen I 210 22.8 10.3 81.8 1633 36 52.5 20 95.6 97.72
19 54 Metuchen Middlesex I 124.5 17.0 9.6 45.8 1648 41.1 42.3 16 89.9 95.21
20 8 Chatham Morris J 245 19.2 12.3 68.0 1748 54.1 54.4 20 92.2 96.83
21 74 South Hunterdon Regional (West Amwell) Hunterdon G 74.5 15.6 7.8 52.1 1558 33.3 25.5 9 86.6 100
22 6 Northern Highlands Regional (Allendale) Bergen J 309 22.3 10.6 81.6 1731 36.5 49 24 91.7 96.53
23 50 Parsippany Hills Morris G 268 18.2 10.0 64.3 1629 33.9 36.4 24 88.8 95.45
24 22 Livingston Essex I 451 23.0 11.1 76.9 1725 43.6 51.1 28 94.5 97.81
25 46 Pequannock Township Morris G 211.5 19.0 10.0 52.7 1571 33.5 35.2 18 74.2 99.08
26 40 Jonathan Dayton (Springfield) Union G 144 20.3 8.7 79.7 1473 30.1 41.8 21 62.4 97.08
27 39 Moorestown Burlington I 349 17.8 10.9 59.2 1706 36.3 51.4 21 87.7 95.66
28 20 Ridgewood Bergen J 419 21.0 11.8 72.0 1777 40.9 56.1 27 75.8 97.41
29 55 Cresskill Bergen I 146.5 19.5 12.1 61.3 1655 40 47.9 22 74.0 96.55
30 33 Ramsey Bergen I 224.5 22.4 10.3 69.5 1632 42.3 41 19 90.0 96.93
31 38 Hopewell Valley Cental (Pennington) Mercer I 279.5 20.7 10.8 61.6 1706 37.2 46.8 22 93.1 95.95
32 29 West Windsor-Plainsboro North Mercer J 339 22.4 11.8 69.5 1845 48.4 60 31 90.2 96.05
33 11 Haddonfield Memorial Camden J 210 19.9 11.1 45.1 1714 62.9 65.4 20 90.1 97.24
34 14 North Valley Regional (Demarest) Bergen I 318 20.8 12.1 73.3 1772 50.7 54.4 21 69.9 97.26
35 51 Wayne Hills Passaic G 335 21.2 10.6 73.2 1634 33.7 42.1 20 86.5 97.08
36 24 Governor Livingston (Berkeley Heights) Union I 242.5 22.3 10.7 65.6 1609 42.5 47.1 20 85.5 96.46
37 52 Randolph Morris I 431 18.2 11.1 65.4 1655 38.8 43.6 26 91.5 93.53
38 42 Whippany Park Morris G 150 19.1 9.2 43.4 1611 35 40 13 89.3 96.67
39 47 Montville Morris I 332 23.9 11.2 74.0 1655 29.9 40.3 27 87.3 98.81
40 101 Arthur L. Johnson (Clark) Union F 199.5 16.9 10.1 57.8 1496 20.5 26.5 18 66.0 97.79
41 61 Red Bank Regional Monmouth F 243.5 16.9 9.0 72.5 1553 27.3 29.6 15 50.9 94.55
42 70 Morris Hills Morris G 256 19.2 8.9 82.2 1518 28.5 38.1 20 90.0 91.97
43 35 Indian Hills (Oakland) Bergen I 293 21.1 10.8 65.3 1614 40 38.6 24 86.7 94
44 48 Watchung Hills Regional (Warren) Somerset I 518 21.9 11.1 68.7 1695 38.9 38 27 88.0 96.51
45 26 West Morris Mendham Morris I 309 20.3 11.9 67.8 1703 57.3 51.3 19 80.2 97.48
46 45 James Caldwell (West Caldwell) Essex I 211 18.2 10.2 56.1 1585 27.5 32.1 14 85.5 95.43
47 75 Columbia (Maplewood) Essex I 406 19.9 9.9 62.3 1556 33.7 37 24 83.8 91.9
48 59 Voorhees Hunterdon I 261 20.2 9.9 52.1 1633 34.1 40.2 23 76.2 91
49 41 Westfield Union I 457.5 20.0 11.7 63.4 1732 46.2 54.8 21 89.2 97.2
50 97 Haddon Township Camden F 146 10.6 9.6 74.5 1485 31.7 37.9 12 56.9 93.49
COMPLETE RANKINGS OF 328 HIGH SCHOOLS, 2012
* DFG stands for District Factor Group. For the complete methodology, see last page.
NJ’s TOP Public High Schools
© 2012 by New Jersey Monthly, LLC
77

COMPLETE RANKINGS OF 328 HIGH SCHOOLS, 2012
NJ’s TOP Public High Schools
2012 2010 School County DFG*Grade 12
enrollmentAverage class size
Student/ faculty
ratio
% of faculty with masters or doctorate
Average combined SAT score
% advanced proficient:
HSPA-language
% advanced proficient: HSPA-math
Number of AP tests
offered
% of AP tests
resulting in 3+
Adjusted cohort
grad rate
51 13 Cranford Union I 261 20.3 9.9 37.7 1605 40.8 43.5 27 80.7 93.11
52 49 Leonia Bergen G 151 19.2 9.2 61.0 1643 21 24.8 21 54.5 88.89
53 30 Northern Valley Regional (Old Tappan) Bergen I 340.5 22.8 12.2 83.3 1722 39.2 46 22 69.9 97.13
54 68 Waldwick Bergen G 105 20.6 10.1 59.5 1570 27.7 25.2 10 78.4 94.59
55 56 Mahwah Bergen I 250 25.0 10.7 66.4 1656 34.7 42.6 21 84.0 96.17
56 43 West Morris Central (Chester) Morris I 373 21.8 11.5 69.3 1659 35.2 41.9 22 80.4 97.31
57 96 Hanover Park Morris G 204 19.8 9.8 46.6 1558 32.8 37 18 77.0 93.9
58 92 Westwood Bergen G 195.5 19.4 10.1 62.6 1511 23.9 28.7 14 71.4 94.69
59 44 Princeton Mercer I 339 23.6 11.9 65.3 1832 54.4 65.5 26 90.3 92.71
60 62 Scotch Plains-Fanwood Union I 348.5 18.9 12.3 61.6 1604 27.3 41.8 20 80.1 96.61
61 10 Montgomery Somerset J 416.5 21.4 12.5 53.2 1784 48.7 56 29 90.6 97.45
62 16 West Windsor-Plainsboro South Mercer J 409 24.2 13.1 65.9 1857 51.2 63.4 31 91.9 98.05
63 99 Ocean City Cape May D 328.5 20.1 10.8 74.8 1495 23.2 27.3 16 75.6 96.83
64 63 Wayne Valley (Wayne) Passaic G 365 19.8 10.8 69.4 1555 30.2 34.2 17 85.6 93.72
65 76 Fair Lawn Bergen G 400 20.7 12.6 77.8 1585 29.5 33 24 79.1 95.44
66 60 North Hunterdon Regional (Clinton) Hunterdon I 449.5 21.9 11.2 47.6 1687 43.2 50.4 26 79.6 98.12
67 37 Highland Park Middlesex G 96 27.4 10.3 61.1 1614 36.9 40.8 14 86.6 88.29
68 116 Midland Park Bergen G 66 23.6 11.0 61.2 1554 37.2 34.6 10 64.2 95.65
69 90 Mt. Olive Morris G 351 18.3 12.1 70.5 1567 33 40.6 18 83.0 93.12
70 53 Verona Essex I 148 21.0 11.4 51.8 1562 23.7 27.6 16 66.7 99.35
71 73 Rutherford Bergen G 178 17.6 9.7 59.8 1489 19.7 28.3 15 64.0 93.79
72 107 Hasbrouck Heights Bergen F 103 20.1 10.9 63.8 1501 27 31.3 10 85.7 95.54
73 23 Pascack Valley (Hillsdale) Bergen I 289.5 26.6 11.8 82.5 1647 30.7 44.1 19 80.4 97.59
74 103 Cedar Grove Essex I 102.5 20.3 10.5 63.6 1494 37.7 25 8 74.6 96.08
75 66 Morristown Morris G 357 21.0 11.0 67.6 1578 27.8 31 22 79.4 91.82
76 77 Somerville Somerset F 308.5 19.0 12.3 54.8 1617 30.8 38.8 22 85.5 93.29
77 34 Emerson Bergen G 91.5 20.3 11.0 55.7 1534 25 25 8 72.2 93.68
78 58 Point Pleasant Beach Ocean F 97 20.4 12.0 48.7 1525 38.5 30.2 11 40.5 98.17
79 79 Morris Knolls Morris G 397.5 21.5 10.5 67.9 1555 26.9 33.6 23 79.3 92.15
80 65 J.P. Stevens (Edison) Middlesex G 589 17.8 14.2 60.0 1764 45.4 51.1 26 92.2 91.24
81 139 Mainland Regional (Linwood) Atlantic D 364.5 21.2 11.0 52.0 1568 32.5 37.1 25 73.9 91.77
82 120 Lawrence Mercer G 252 16.0 10.1 49.1 1527 27.8 28.4 14 82.2 90.6
83 78 Sparta Sussex I 315.5 23.2 11.5 73.4 1566 33.2 30.9 16 83.1 96.98
84 85 Hunterdon Central (Flemington) Hunterdon I 720 21.2 10.8 67.7 1646 33.1 40.3 25 89.1 94.33
85 173 Pompton Lakes Passaic F 160.5 18.3 10.9 62.1 1517 17.1 19.3 9 56.9 95.32
86 84 Parsippany Morris G 260 19.2 10.4 44.3 1587 26.7 28.3 19 83.9 91.61
87 145 Lakeland Regional (Wanaque) Passaic F 292 19.6 11.9 69.2 1546 19.8 17.8 19 56.9 94.33
88 125 High Point Regional (Sussex) Sussex D 280.5 18.1 10.0 69.9 1507 21.2 23.9 12 84.0 89.44
89 149 Kittatinny Regional (Newton) Sussex F 186.5 18.9 9.9 52.4 1517 21.9 23 9 65.7 93.51
90 102 Secaucus Hudson D 156 22.8 10.0 65.0 1509 18.2 23.5 12 51.1 93.37
91 104 Weehawken Hudson C 65 16.7 10.0 46.4 1459 13.5 17.6 11 74.3 85.37
92 126 Matawan Regional Monmouth F 228.5 16.1 10.7 67.0 1435 18.9 21.4 14 76.9 89.1
93 115 Roxbury Morris G 405 15.7 11.3 52.3 1565 24.6 23.5 18 90.2 93.98
94 176 Butler Morris D 143.5 18.2 9.7 40.0 1490 24.4 18.9 8 69.0 93.46
95 64 Ocean Township Monmouth F 308.5 23.6 11.1 66.1 1529 23.3 26.2 19 61.1 94.44
96 112 Ridgefield Memorial Bergen D 142 19.9 7.7 64.8 1543 11.2 32.7 8 67.3 75.9
97 72 Fort Lee Bergen F 230 23.1 11.5 59.0 1610 28.1 32.2 15 69.3 95.08
98 57 Cherry Hill East Camden G 547 23.0 13.2 62.7 1677 39.6 51.8 21 88.3 97.5
99 94 Montclair Essex I 447 21.3 11.3 56.4 1629 31.7 35.1 27 82.2 88.98
100 119 Pitman Gloucester F 96.5 13.3 9.7 42.2 1496 11.3 21.7 8 80.4 84.62
78
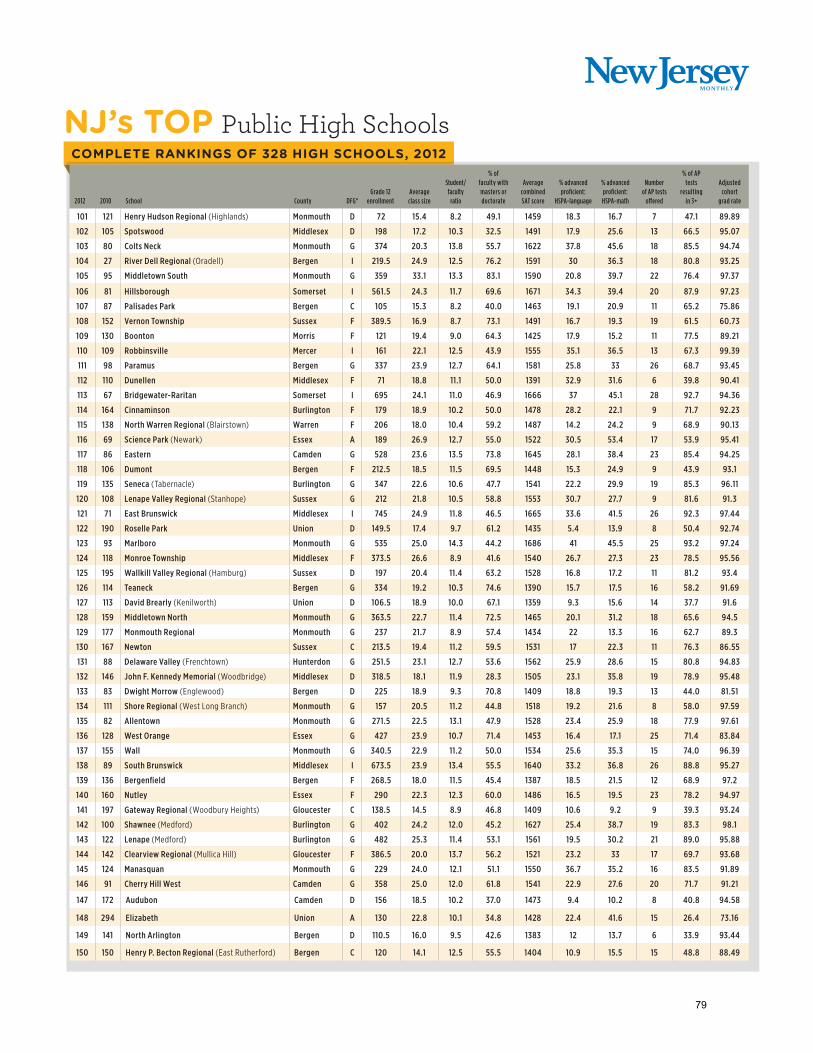
COMPLETE RANKINGS OF 328 HIGH SCHOOLS, 2012
NJ’s TOP Public High Schools
2012 2010 School County DFG*Grade 12
enrollmentAverage class size
Student/ faculty
ratio
% of faculty with masters or doctorate
Average combined SAT score
% advanced proficient:
HSPA-language
% advanced proficient: HSPA-math
Number of AP tests
offered
% of AP tests
resulting in 3+
Adjusted cohort
grad rate
101 121 Henry Hudson Regional (Highlands) Monmouth D 72 15.4 8.2 49.1 1459 18.3 16.7 7 47.1 89.89
102 105 Spotswood Middlesex D 198 17.2 10.3 32.5 1491 17.9 25.6 13 66.5 95.07
103 80 Colts Neck Monmouth G 374 20.3 13.8 55.7 1622 37.8 45.6 18 85.5 94.74
104 27 River Dell Regional (Oradell) Bergen I 219.5 24.9 12.5 76.2 1591 30 36.3 18 80.8 93.25
105 95 Middletown South Monmouth G 359 33.1 13.3 83.1 1590 20.8 39.7 22 76.4 97.37
106 81 Hillsborough Somerset I 561.5 24.3 11.7 69.6 1671 34.3 39.4 20 87.9 97.23
107 87 Palisades Park Bergen C 105 15.3 8.2 40.0 1463 19.1 20.9 11 65.2 75.86
108 152 Vernon Township Sussex F 389.5 16.9 8.7 73.1 1491 16.7 19.3 19 61.5 60.73
109 130 Boonton Morris F 121 19.4 9.0 64.3 1425 17.9 15.2 11 77.5 89.21
110 109 Robbinsville Mercer I 161 22.1 12.5 43.9 1555 35.1 36.5 13 67.3 99.39
111 98 Paramus Bergen G 337 23.9 12.7 64.1 1581 25.8 33 26 68.7 93.45
112 110 Dunellen Middlesex F 71 18.8 11.1 50.0 1391 32.9 31.6 6 39.8 90.41
113 67 Bridgewater-Raritan Somerset I 695 24.1 11.0 46.9 1666 37 45.1 28 92.7 94.36
114 164 Cinnaminson Burlington F 179 18.9 10.2 50.0 1478 28.2 22.1 9 71.7 92.23
115 138 North Warren Regional (Blairstown) Warren F 206 18.0 10.4 59.2 1487 14.2 24.2 9 68.9 90.13
116 69 Science Park (Newark) Essex A 189 26.9 12.7 55.0 1522 30.5 53.4 17 53.9 95.41
117 86 Eastern Camden G 528 23.6 13.5 73.8 1645 28.1 38.4 23 85.4 94.25
118 106 Dumont Bergen F 212.5 18.5 11.5 69.5 1448 15.3 24.9 9 43.9 93.1
119 135 Seneca (Tabernacle) Burlington G 347 22.6 10.6 47.7 1541 22.2 29.9 19 85.3 96.11
120 108 Lenape Valley Regional (Stanhope) Sussex G 212 21.8 10.5 58.8 1553 30.7 27.7 9 81.6 91.3
121 71 East Brunswick Middlesex I 745 24.9 11.8 46.5 1665 33.6 41.5 26 92.3 97.44
122 190 Roselle Park Union D 149.5 17.4 9.7 61.2 1435 5.4 13.9 8 50.4 92.74
123 93 Marlboro Monmouth G 535 25.0 14.3 44.2 1686 41 45.5 25 93.2 97.24
124 118 Monroe Township Middlesex F 373.5 26.6 8.9 41.6 1540 26.7 27.3 23 78.5 95.56
125 195 Wallkill Valley Regional (Hamburg) Sussex D 197 20.4 11.4 63.2 1528 16.8 17.2 11 81.2 93.4
126 114 Teaneck Bergen G 334 19.2 10.3 74.6 1390 15.7 17.5 16 58.2 91.69
127 113 David Brearly (Kenilworth) Union D 106.5 18.9 10.0 67.1 1359 9.3 15.6 14 37.7 91.6
128 159 Middletown North Monmouth G 363.5 22.7 11.4 72.5 1465 20.1 31.2 18 65.6 94.5
129 177 Monmouth Regional Monmouth G 237 21.7 8.9 57.4 1434 22 13.3 16 62.7 89.3
130 167 Newton Sussex C 213.5 19.4 11.2 59.5 1531 17 22.3 11 76.3 86.55
131 88 Delaware Valley (Frenchtown) Hunterdon G 251.5 23.1 12.7 53.6 1562 25.9 28.6 15 80.8 94.83
132 146 John F. Kennedy Memorial (Woodbridge) Middlesex D 318.5 18.1 11.9 28.3 1505 23.1 35.8 19 78.9 95.48
133 83 Dwight Morrow (Englewood) Bergen D 225 18.9 9.3 70.8 1409 18.8 19.3 13 44.0 81.51
134 111 Shore Regional (West Long Branch) Monmouth G 157 20.5 11.2 44.8 1518 19.2 21.6 8 58.0 97.59
135 82 Allentown Monmouth G 271.5 22.5 13.1 47.9 1528 23.4 25.9 18 77.9 97.61
136 128 West Orange Essex G 427 23.9 10.7 71.4 1453 16.4 17.1 25 71.4 83.84
137 155 Wall Monmouth G 340.5 22.9 11.2 50.0 1534 25.6 35.3 15 74.0 96.39
138 89 South Brunswick Middlesex I 673.5 23.9 13.4 55.5 1640 33.2 36.8 26 88.8 95.27
139 136 Bergenfield Bergen F 268.5 18.0 11.5 45.4 1387 18.5 21.5 12 68.9 97.2
140 160 Nutley Essex F 290 22.3 12.3 60.0 1486 16.5 19.5 23 78.2 94.97
141 197 Gateway Regional (Woodbury Heights) Gloucester C 138.5 14.5 8.9 46.8 1409 10.6 9.2 9 39.3 93.24
142 100 Shawnee (Medford) Burlington G 402 24.2 12.0 45.2 1627 25.4 38.7 19 83.3 98.1
143 122 Lenape (Medford) Burlington G 482 25.3 11.4 53.1 1561 19.5 30.2 21 89.0 95.88
144 142 Clearview Regional (Mullica Hill) Gloucester F 386.5 20.0 13.7 56.2 1521 23.2 33 17 69.7 93.68
145 124 Manasquan Monmouth G 229 24.0 12.1 51.1 1550 36.7 35.2 16 83.5 91.89
146 91 Cherry Hill West Camden G 358 25.0 12.0 61.8 1541 22.9 27.6 20 71.7 91.21
147 172 Audubon Camden D 156 18.5 10.2 37.0 1473 9.4 10.2 8 40.8 94.58
148 294 Elizabeth Union A 130 22.8 10.1 34.8 1428 22.4 41.6 15 26.4 73.16
149 141 North Arlington Bergen D 110.5 16.0 9.5 42.6 1383 12 13.7 6 33.9 93.44
150 150 Henry P. Becton Regional (East Rutherford) Bergen C 120 14.1 12.5 55.5 1404 10.9 15.5 15 48.8 88.49
79

COMPLETE RANKINGS OF 328 HIGH SCHOOLS, 2012
NJ’s TOP Public High Schools
2012 2010 School County DFG*Grade 12
enrollmentAverage class size
Student/ faculty
ratio
% of faculty with masters or doctorate
Average combined SAT score
% advanced proficient:
HSPA-language
% advanced proficient: HSPA-math
Number of AP tests
offered
% of AP tests
resulting in 3+
Adjusted cohort
grad rate
151 129 Haddon Heights Camden G 178 18.6 9.5 41.1 1459 12.6 21.1 8 65.9 88.11
152 127 Manalapan Monmouth G 491.5 25.4 13.4 48.6 1585 23.3 38.9 22 86.2 96.66
153 170 Saddle Brook Bergen D 111 17.0 11.9 60.0 1417 17.2 8.3 7 64.3 91.67
154 133 Point Pleasant Ocean F 254.5 21.0 11.6 37.1 1477 24.9 27.4 18 67.2 92.39
155 183 Middlesex Middlesex F 188 22.8 10.7 50.8 1487 24.8 43.9 9 58.8 91.53
156 186 North Burlington County Regional (Columbus) Burlington D 270 22.0 11.3 36.8 1499 22.6 26.5 21 68.9 93.45
157 134 Cherokee (Marlton) Burlington G 531 24.9 11.2 51.9 1536 19.7 32.8 19 80.9 97.47
158 143 North Brunswick Township Middlesex F 479 23.8 11.8 52.4 1568 22.7 29.4 22 81.7 90.24
159 209 Pennsville Memorial Salem C 138 16.8 8.9 37.9 1427 12.4 14.9 5 48.3 92.31
160 214 Belleville Essex C 41 15.8 9.1 60.8 1323 11.3 9.3 10 34.5 85.92
161 180 Hightstown Mercer G 306 23.2 11.2 38.1 1531 22.4 24.9 25 85.3 84.4
162 178 Lyndhurst Bergen D 162 22.8 10.2 58.6 1367 15.3 20.5 10 38.8 91.62
163 185 West Milford Passaic F 345 27.7 11.3 68.1 1474 19.9 20.3 16 69.4 90.66
164 132 Freehold Borough Monmouth G 337 27.6 13.7 43.0 1621 28.6 38.1 18 88.3 90.96
165 175 Washington Township Gloucester F 647.5 18.5 11.1 35.9 1491 24.7 29.6 19 76.4 93.91
166 217 Hillside Union C 160.5 15.0 9.4 74.8 1222 6.3 6.8 9 20.0 66.12
167 206 Long Branch Monmouth B 234 15.2 8.0 45.0 1270 8.1 5.9 13 22.3 83.12
168 202 Warren Hills Regional Warren F 315 22.4 12.3 52.4 1473 22.2 23.4 16 67.1 90.99
169 161 New Milford Bergen F 152.5 23.0 12.5 52.7 1452 22.8 22.8 9 47.9 92.9
170 229 Woodbridge Middlesex D 364 18.9 10.6 36.7 1394 19.3 29.3 17 67.5 91.33
171 131 University (Newark) Essex A 112 21.6 10.4 56.3 1344 11.1 18.5 5 34.8 92.68
172 165 South Amboy Middlesex C 59 17.6 11.4 34.1 1436 12.8 13.8 5 77.1 88.46
173 262 Pinelands Regional (Little Egg Harbor) Ocean B 275 15.6 9.2 36.1 1428 11.9 12.5 10 65.8 86.98
174 169 Edison Middlesex G 484 25.3 11.8 64.8 1530 20.1 23.6 21 80.3 85.88
175 166 Raritan Monmouth D 245.5 21.6 12.6 41.2 1520 13.9 23.2 12 34.2 97.05
176 137 Wood-Ridge Bergen F 81.5 22.3 10.5 56.7 1455 13.9 20 5 63.4 83
177 280 Asbury Park Monmouth A 98.5 12.1 5.5 63.4 1021 3.7 0 12 16.2 59.46
178 162 Old Bridge Middlesex F 789.5 22.2 12.2 61.5 1512 18.9 21.9 18 73.8 94.78
179 194 Glouchester City Camden B 135 16.9 8.0 30.9 1387 8.5 15.4 7 19.8 83.02
180 117 Creative & Performing Arts (Camden) Camden A 45 18.6 4.9 31.3 1082 2.9 0 3 0.0 95.45
181 184 Keansburg Monmouth A 101 11.0 7.2 61.7 1289 4.2 7.3 3 15.8 82.84
182 192 Colonia Middlesex D 356.5 20.8 10.7 44.9 1454 15.3 25 15 72.4 90.5
183 193 Barnegat Ocean C 217 17.7 11.3 28.1 1449 16.1 22.9 13 66.7 89.19
184 224 Clayton Gloucester C 90 19.0 9.4 38.5 1409 11.8 17.6 4 37.5 87.1
185 147 Woodstown Salem F 185.5 22.8 11.6 35.1 1517 22 26.1 9 61.0 95.12
186 163 Liberty (Jersey City) Hudson B 36 15.9 7.3 40.7 1183 2.7 2.7 4 41.7 74
187 174 Howell Monmouth G 596.5 24.8 12.5 46.8 1500 24.8 27.6 19 75.5 96.18
188 181 Jackson Memorial Ocean D 390.5 23.8 12.4 38.1 1478 21.1 23 19 77.0 93.59
189 250 Belvidere Warren D 153 19.5 11.8 37.5 1477 24 23.8 7 48.9 91.67
190 156 Technology (Newark) Essex A 107 21.6 9.2 42.3 1269 8 6.2 8 8.9 92.31
191 261 Rahway Union C 241.5 18.4 10.0 53.1 1281 7.1 9.3 10 27.5 85.37
192 199 Woodbury Gloucester B 111.5 20.7 10.7 37.5 1386 5.1 14.3 11 29.9 82.17
193 203 New Egypt Ocean D 151 22.9 10.9 30.7 1469 18.3 22.2 6 52.9 96.84
194 263 Middle Township Cape May B 244 17.0 10.7 38.1 1413 15 19.6 9 60.6 80.9
195 266 Pemberton Township Burlington B 288 18.7 7.8 49.0 1364 6.1 10.7 10 45.1 85.37
196 254 Lindenwold Camden B 115 20.8 8.6 47.8 1248 4.7 5.6 11 20.8 75.16
197 268 Burlington City Burlington B 168 19.8 8.5 41.5 1297 6.3 7.8 9 25.0 85.94
198 N/A American History (Newark) Essex A 53 20.9 11.9 57.7 1208 10.5 14 4 3.9 94.83
199 212 Freehold Township Monmouth G 595 25.8 15.2 39.9 1544 26.6 29.1 20 73.2 93.68
200 218 Bordentown Regional Burlington F 207 17.8 11.5 52.4 1455 12.5 16.7 4 78.8 91.16
80

COMPLETE RANKINGS OF 328 HIGH SCHOOLS, 2012
NJ’s TOP Public High Schools
2012 2010 School County DFG*Grade 12
enrollmentAverage class size
Student/ faculty
ratio
% of faculty with masters or doctorate
Average combined SAT score
% advanced proficient:
HSPA-language
% advanced proficient: HSPA-math
Number of AP tests
offered
% of AP tests
resulting in 3+
Adjusted cohort
grad rate
201 196 Manville Somerset C 90.5 9.9 9.1 37.2 1365 9.2 11.2 3 38.1 86.96
202 144 Passaic Valley Passaic D 317 19.0 11.2 51.2 1416 17.1 15.7 10 64.5 92.51
203 153 Burlington Township Burlington F 41 21.7 12.1 41.1 1412 14.8 24.9 9 56.0 95.13
204 189 Hamilton East-Steinert Mercer F 334 24.1 13.4 43.8 1484 23.8 22.8 13 68.9 95.17
205 213 Harrison Hudson B 158 18.7 10.4 46.2 1243 8.2 8.2 7 24.0 92.44
206 198 Hackensack Bergen C 423.5 20.6 12.4 69.9 1371 10.9 9.7 19 58.3 88.1
207 256 North Plainfield Somerset D 221.5 19.2 10.0 50.3 1318 9.2 13.4 9 41.2 86.42
208 157 Brimm Medical Arts (Camden) Camden A 66 17.3 8.3 32.3 1208 4 0 3 2.7 92.42
209 168 Arthur P. Schalick (Elmer) Salem C 118.5 23.5 11.3 37.7 1357 12.8 13.5 9 56.9 93.02
210 216 Kingsway Regional Gloucester F 370 24.9 13.8 44.1 1511 17.2 25.6 11 76.1 96.52
211 158 Jefferson Township Morris G 246 49.1 11.3 60.9 1453 17.6 18.4 10 67.6 89.23
212 245 Ewing Mercer D 246.5 16.5 11.1 44.7 1348 14.9 11.2 10 79.3 85.67
213 227 Egg Harbor Township Atlantic C 632 20.8 12.6 38.7 1449 14.2 22 24 67.7 93.54
214 247 Atlantic City Atlantic A 492.5 14.8 11.8 52.4 1314 9.6 10.6 20 46.3 67.98
215 276 Phillipsburg Warren B 397 23.2 12.5 25.7 1517 25.7 21.8 18 84.5 88.65
216 191 Hackettstown Warren D 266 25.1 13.1 58.6 1501 23 25.4 10 45.7 92.83
217 140 Piscataway Township Middlesex G 517 22.1 12.2 47.4 1456 17 25.5 22 67.8 88.25
218 215 Jackson Liberty Ocean D 340 24.8 11.9 46.0 1457 12.9 16 18 60.4 93.22
219 182 West Deptford Gloucester D 238 24.4 12.7 43.4 1445 20.3 26.1 13 76.0 89.29
220 237 Florence Township Memorial (Florence) Burlington D 98 18.3 11.2 30.2 1442 13.6 11.9 6 46.8 83.62
221 226 Bloomfield Essex D 396.5 19.1 10.5 53.0 1363 12.8 15 10 40.9 89.17
222 208 Palmyra Burlington D 86 14.2 8.4 16.7 1357 14.8 13.6 3 41.2 83.84
223 220 Dover Morris A 190 22.0 9.7 44.4 1394 12.5 19.8 7 73.1 76.99
224 230 Kearny Hudson B 431 20.1 10.0 56.0 1381 8.4 10.4 10 59.1 88.45
225 239 Toms River East Ocean D 382.5 23.8 11.6 29.4 1508 15.3 20.9 14 82.9 90.7
226 249 Keyport Monmouth C 106 18.1 9.9 30.0 1314 7.5 11.2 5 37.5 85.95
227 148 South Plainfield Middlesex F 303 21.6 11.5 42.0 1423 16.3 21.9 10 75.6 93.29
228 222 Toms River North Ocean D 547.5 20.8 13.6 32.6 1511 17.6 20.3 18 82.1 90.41
229 269 Toms River South Ocean D 358.5 20.6 11.9 39.0 1476 7.9 15.9 16 63.6 88.48
230 179 Delran Burlington F 210 22.8 12.0 40.8 1436 12.8 24.7 9 67.6 93.45
231 188 Glassboro Gloucester B 142.5 21.1 10.2 47.5 1389 8.4 10.5 7 54.9 83.65
232 315 Orange Essex A 188 15.7 8.2 54.9 1107 2.6 1 5 5.0 58.28
233 221 Cicley Tyson (East Orange) Essex A 85.5 25.7 10.4 56.3 1170 5.5 6.6 5 4.3 96.51
234 171 Hawthorne Passaic D 172 23.8 11.4 45.0 1516 6.3 10.7 8 70.0 88.59
235 246 Delsea Regional (Franklinville) Gloucester C 272.5 24.9 12.5 31.6 1420 16.5 25 17 67.3 93.23
236 154 Southern Regional (Manahawkin) Ocean D 441.5 24.5 11.9 62.7 1474 13 21.1 11 62.6 88.33
237 207 Ridgefield Park Bergen D 239.5 23.1 11.9 50.9 1390 11.3 15.4 9 67.5 93.36
238 228 International (Paterson) Passaic A 66 17.6 8.7 53.5 1097 1.2 0 2 23.6 77.78
239 204 Wallington Bergen B 89 23.8 11.9 51.9 1423 9.2 14.3 5 33.3 94.62
240 205 Arts (Newark) Essex A 107 21.6 10.0 46.7 1216 6 7.5 5 27.0 93.91
241 232 War Memorial (Sayreville/Parlin) Middlesex D 405.5 19.1 14.1 39.1 1468 16.3 17.8 13 79.5 89.02
242 255 Deptford Township Gloucester C 260.5 15.0 10.7 31.4 1384 12.8 19.5 9 57.6 82.82
243 236 Lower Cape May Regional Cape May B 253 21.3 11.3 36.5 1455 15.1 14.3 10 59.6 87.2
244 279 Wildwood Cape May A 56.5 20.3 8.1 21.9 1288 2.7 9.3 4 34.6 81.25
245 260 Manchester Ocean B 264 18.8 11.1 30.5 1432 13.5 15.9 9 46.7 89.18
246 219 Timber Creek Camden D 375 23.1 14.0 39.4 1456 13.1 14.9 11 49.7 93.37
247 244 Oakcrest Atlantic C 370 24.0 12.1 43.8 1409 15.1 17.7 14 52.8 89.2
248 210 Memorial (Elmwood Park) Bergen C 196 17.0 12.4 37.9 1399 7.4 12.8 9 49.4 86.57
249 234 South River Middlesex C 172 21.1 12.0 40.4 1414 12.9 19.9 7 76.2 89.77
250 243 Union Senior Union D 612.5 18.4 10.9 35.4 1374 7.2 9.5 18 81.0 84.28
* Due to incorrect data on class size recorded by the Department of Education, the ranking for Jefferson Township High School is incorrect. The school should be ranked in a tie at number 167.
*
81

COMPLETE RANKINGS OF 328 HIGH SCHOOLS, 2012
NJ’s TOP Public High Schools
2012 2010 School County DFG*Grade 12
enrollmentAverage class size
Student/ faculty
ratio
% of faculty with masters or doctorate
Average combined SAT score
% advanced proficient:
HSPA-language
% advanced proficient: HSPA-math
Number of AP tests
offered
% of AP tests
resulting in 3+
Adjusted cohort
grad rate
251 253 Penns Grove Salem A 150 19.1 9.0 38.5 1304 4.7 5.6 6 13.8 74.03
252 295 Willingboro Burlington D 179 17.9 9.9 40.4 1135 2.7 1.8 10 7.7 69.82
253 300 Overbrook Camden B 190 17.0 10.3 39.8 1350 8.9 8.9 6 36.8 82.47
254 123 Rosa Parks Arts (Paterson) Passaic A 52 24.0 6.3 61.5 1279 5.6 5.6 1 23.6 92.86
255 223 Rancocas Valley Regional (Mount Holly) Burlington D 505 26.3 14.2 40.8 1455 18.9 25.2 16 68.2 89.6
256 235 Cliffside Park Bergen B 262 20.8 11.1 62.3 1388 6.7 11.3 7 47.5 79.42
257 225 Lacey Township Ocean D 335 20.8 10.9 24.3 1459 16 16.4 9 65.2 90.77
258 310 Weequahic Essex A 134 16.7 9.0 41.7 1057 2.3 0.8 4 0.0 78.28
259 151 Bogota Bergen D 100 22.2 12.3 53.1 1363 8.9 5.6 4 35.9 94.34
260 238 Absegami Atlantic C 501.5 23.5 13.2 34.2 1452 17.2 18.3 15 69.3 87.32
261 248 Brick Township Ocean D 300.5 20.4 10.6 28.7 1447 13.9 16.2 10 73.3 84.31
262 267 Collingswood Camden F 217 20.8 12.6 48.5 1433 11.4 16.1 8 42.3 86.55
263 201 Franklin Township Somerset G 454 23.2 11.5 43.8 1410 15.2 17.1 19 66.0 82.39
264 257 Central Regional (Bayville) Ocean B 263.5 20.4 10.8 32.8 1354 12 17.8 10 44.9 88.48
265 277 Salem Salem A 108 20.4 7.5 30.0 1362 9 9.8 5 53.3 67.88
266 231 Sterling Camden D 243 18.5 11.6 37.3 1399 13.3 13.8 4 43.3 89.86
267 299 Pleasantville Atlantic A 172 11.7 7.3 35.7 1130 0 1 4 15.0 64.29
268 319 West Side Essex A 223 19.9 9.4 51.8 1014 0 0.9 9 19.1 53.71
269 251 Brick Township Memorial Ocean D 428 21.4 12.1 30.7 1455 12.1 19.1 9 79.2 89.74
270 320 James J. Ferris (Jersey City) Hudson B 339 19.9 10.6 61.0 1165 2.5 2.2 7 24.0 83.11
271 278 Triton Camden D 366 24.1 14.5 37.2 1475 13.5 16.4 11 69.3 87.74
272 241 Manchester Regional Passaic B 166 20.5 11.8 54.9 1370 10.9 9.2 6 51.2 73.42
273 303 Bridgeton Cumberland A 220 13.3 9.1 33.1 1230 3.8 5.7 4 14.3 67.96
274 259 Clifton Passaic C 764 21.3 13.2 52.4 1424 10.6 12.9 21 65.9 80
275 258 Hamilton West-Watson Mercer F 293.5 20.5 12.7 42.3 1359 9.3 11 12 53.7 90.83
276 264 Hamilton North-Nottingham Mercer F 297 19.6 12.7 44.8 1380 11.4 11.5 12 68.6 86.93
277 274 Central (Newark) Essex A 163 20.1 10.1 49.4 1039 0.6 3 5 2.0 82.61
278 265 Paulsboro Gloucester A 106 19.4 8.8 26.9 1235 2.6 2.6 4 29.0 62.16
279 312 Henry Snyder (Jersey City) Hudson B 214 21.6 9.2 52.4 1111 7 4 6 25.5 51.58
280 307 Plainfield Union B 293.5 17.8 11.1 41.2 1136 0 1 13 18.0 70.12
281 301 Maple Shade Burlington C 125 19.3 12.9 26.7 1422 10.2 20.4 4 52.1 89.47
282 313 Passaic Passaic A 470 16.5 11.6 55.4 1265 3.6 4.6 11 29.5 62.7
283 283 Neptune School Monmouth C 323 19.2 12.0 42.3 1317 9.3 13.6 10 57.3 83.76
284 252 Highland Regional (Blackwood) Camden D 300 24.5 13.7 36.3 1389 12.6 15.3 11 67.8 91.37
285 211 Met East (Camden) Camden A 17 14.0 5.2 26.4 1061 0 0 0 0 76.19
286 240 Lodi Bergen B 203 22.4 12.8 64.5 1384 7.4 7.8 9 47.0 77.51
287 322 Camden Camden A 166 13.7 8.5 35.4 1042 0.7 6.14 0 0 44.69
288 233 Hammonton Atlantic B 310 24.7 14.0 36.3 1442 14.6 20.4 12 74.5 82.9
289 200 Hopatcong Sussex F 183.5 25.3 11.8 61.9 1430 11.2 11.2 4 39.4 87.82
290 288 Bound Brook Somerset B 124 21.5 10.2 41.2 1376 5.1 11.1 3 10.7 86.76
291 314 Malcolm X Shabazz (Newark) Essex A 187 20.0 9.5 51.0 1014 0 0.6 5 0.0 63.66
292 304 Newark Vocational Essex A 37 18.6 9.8 44.4 1008 0 0 0 0 78.57
293 282 New Brunswick Middlesex A 270 18.6 12.9 52.0 1263 5.1 10.2 8 25.3 58.76
294 305 Lincoln Hudson B 197 21.7 8.1 52.4 1084 0 1 4 6.7 55.39
295 270 Williamstown Gloucester C 432.5 21.4 12.9 36.5 1409 12.4 16.6 11 54.2 84.14
296 302 Carteret Middlesex B 224 18.7 12.5 46.1 1343 7.9 14.8 5 40.0 82.04
297 275 Vineland Cumberland A 565.5 21.6 10.6 39.8 1357 7.1 10 17 32.5 82.84
298 187 Hoboken Hudson F 150 20.0 11.4 56.4 1151 2.1 1.4 0 0 81.99
299 309 Winslow Township Camden C 364 20.5 11.0 42.5 1294 8.3 5.3 10 36.8 78.84
300 321 Woodrow Wilson Camden A 163 15.1 9.3 32.7 998 0.5 0 1 23.6 55.26
82

COMPLETE RANKINGS OF 328 HIGH SCHOOLS, 2012
NJ’s TOP Public High Schools
2012 2010 School County DFG*Grade 12
enrollmentAverage class size
Student/ faculty
ratio
% of faculty with masters or doctorate
Average combined SAT score
% advanced proficient:
HSPA-language
% advanced proficient: HSPA-math
Number of AP tests
offered
% of AP tests
resulting in 3+
Adjusted cohort
grad rate
301 281 Riverside Burlington B 98 18.7 11.5 35.1 1367 3.9 3.9 3 10.0 87.07
302 308 William L. Dickinson (Jersey City) Hudson B 538 21.2 11.1 51.6 1213 4.7 8.2 11 34.0 69.96
303 N/A Alexander Hamilton Preparatory Academy (Elizabeth)
Union A 137 22.9 13.1 41.8 1222 6.7 6.7 0 0 96.15
304 290 John F. Kennedy (Paterson) Passaic A 399 24.0 8.4 57.9 1089 1.5 2.1 4 5.0 57.39
305 N/A Government & Public Administration (Paterson)
Passaic A 109 24.0 5.6 53.8 1032 2.2 2.2 0 0 60.9
306 N/A John E. Dwyer Technical Academy (Elizabeth) Union A 126 20.0 8.6 38.9 1135 0 2 0 0 55.88
307 273 Memorial (West New York) Hudson A 345 22.8 11.2 51.5 1266 3.4 5.8 9 40.6 72.77
308 306 Millville Senior Cumberland A 443.5 22.4 11.4 37.4 1393 7.1 12.4 11 60.3 84.64
309 287 Irvington School Essex A 276 18.4 10.9 42.1 1105 2.1 1.7 5 9.7 50.47
310 298 Pennsauken Camden C 318 19.7 12.4 45.1 1258 4.7 10.8 10 18.8 81.52
311 N/A Adm. W. F. Halsey Leadership (Elizabeth) Union A 157 19.4 10.1 41.3 1129 0.6 0.6 0 0 60.27
312 291 Cumberland Regional (Bridgeton) Cumberland B 245.5 23.5 12.9 35.4 1436 10.4 10.1 6 50.8 82.45
313 311 Barringer Essex A 295.5 21.3 10.3 55.7 1006 0.3 1.4 0 0 35.91
314 N/A Information Technology (Paterson) Passaic A 103 24.0 8.3 49.4 1032 1 1 0 0 61.82
315 272 Abraham Clark (Roselle) Union B 180.5 20.2 11.7 43.2 1189 3.6 5.2 5 24.4 80
316 297 Buena Regional (Buena) Atlantic A 195 22.1 12.9 29.3 1425 7.2 7.2 5 52.4 83.86
317 242 Bayonne Hudson C 576 23.7 12.0 19.9 1360 12.3 12.2 16 54.9 78.53
318 292 East Orange Campus Essex A 449 24.1 11.6 66.0 1100 3.9 2.8 7 11.1 60.58
319 293 East Side Essex A 257 25.5 11.3 48.0 1188 1.7 3.7 10 31.9 75.83
320 318 Perth Amboy Middlesex A 536.5 23.2 13.0 45.1 1262 4.1 7.4 15 37.4 83.02
321 286 Garfield Bergen B 245.5 25.4 10.9 47.1 1311 3.5 5.1 5 34.8 78.62
322 296 North Bergen Hudson B 551.5 26.4 15.1 54.1 1323 7.4 6.3 6 42.7 86.17
323 285 Union City Hudson A 565 26.8 12.1 51.8 1217 4.7 7.5 0 0 89.46
324 316 Lakewood Ocean N 243.5 20.3 11.8 40.0 1148 1.7 2.9 7 14.7 70.11
325 N/A Culinary Arts (Paterson) Passaic A 129 24.0 9.3 44.9 1032 0 0 0 0 62.32
326 284 Linden Union B 420 24.3 12.0 44.3 1254 4.9 8 13 17.2 81.17
327 N/A T.A. Edison Academy (Elizabeth) Union A 145 22.3 9.3 24.4 1134 0 1.6 0 0 73.89
328 N/A Thomas Jefferson Arts Academy (Elizabeth) Union A 106 23.6 10.9 35.4 1136 2.4 4.7 0 0 53.55
Data for the New Jersey Monthly ranking of the state’s high schools were
obtained from the state Department of Education’s most recent New Jersey
School Report Card (covering the 2010-2011 school year). Only public high
schools were included in the Top 100 list. Due to a lack of data, charter schools
were excluded from the rankings. A handful of other schools lacking report-
card data also were excluded.
Leflein Associates, an independent research company in Ringwood, analyzed
the data by first standardizing individual indicator scores so that small differenc-
es did not have a disproportionate impact on the ranking, but very large differ-
ences were not minimized in the relative scores. These indicators were grouped
into three categories. Two of the categories—Student Performance and Student
Outcomes—were given a weight of 1.5; School Environment was given a weight
of 1. The weighted summary scores for each category were added together to
arrive at the final overall score. The schools were ranked according to this score.
Here are the categories and indicators used in the ranking:
School Environment: The sum of the standardized rank scores for average
class size; student/faculty ratio; percentage of faculty with advanced degrees;
and number of AP tests offered, which was calculated as a ratio of grade 11 and 12
enrollment in order not to penalize smaller schools. (Senior class size is shown in
the published charts for reference only; it is not part of the ranking calculation.)
Student Performance: The sum of the standardized rank scores for average
combined SAT score; percentage of students showing advanced proficiency
on HSPA; and students scoring a 3 or higher on AP tests as a percentage of all
juniors and seniors.
Student Outcomes: A single score based on a new graduation-rate calcula-
tion (four-year adjusted cohort graduation rate) introduced by New Jersey in
2011, as mandated by the federal government. Essentially, the adjusted cohort
formula divides a school’s number of four-year graduates by the number of
first-time ninth-graders who entered the cohort four years earlier. For further
information, visit state.nj.us/education/data/.
Special Notes: Some schools were missing only AP-related data, particularly
the number of students who scored a 3 or higher on AP tests. For these schools
(which had fewer than 10 students who took an AP test) a value was imputed
for purposes of the ranking using an average of other schools in their DFG. Also,
for certain districts where there were obvious errors in the data (Midland Park,
Elizabeth and Paterson), corrections were obtained directly from the districts.
Methodology: How the School Rankings Are Compiled
83

!!!!!!!!!!!!
Exhibit!12!
84

Clifton Clarke OAKGRADE HOMEROOM TOTALCOUNT GRADE HOMEROOM TOTALCOUNT GRADE HOMEROOM TOTALCOUNT
1 119 27 1 102 24 1 105A 271 120 26 1 103 22 1 106A 211 121 27 1 104 24 1 108A 221 128 23 1 105 23 1 109A 211 129 24 1 106 24 1 10B 281 130 26 1 201 13 1 113B 191 131 26 1 206 19 1 116B 231 213 21 1 208 7 1 12B 52 111 33 2 101 18 1 212A 212 113 27 2 107 29 1 220B 252 126 4 2 108 21 1 221B 202 206 27 2 111 32 1 224B 202 207 28 2 112 26 1 226B 212 208 32 2 114 21 2 112B 202 209 29 2 208 9 2 114B 273 126 11 3 110 21 2 115B 263 201 27 3 204 21 2 118B 203 202 27 3 209 27 2 119B 253 203 25 3 211 27 2 11B 63 204 28 3 213 25 2 120B 233 205 25 4 202 32 2 121B 203 214 25 4 203 17 2 12B 23 215 27 4 205 32 2 222B 223 216 8 4 207 31 2 227B 224 200 12 5 210 24 3 101A 234 216 8 5 212 19 3 103A 24 223 27 5 214 22 3 104A 14 224 28 5 215 24 3 107A 264 225 30 3 117B 244 226 29 3 11B 44 227 26 3 122B 195 103 29 3 123B 1
85

5 104 30 3 125B 25 105 32 3 12B 25 109 30 3 219B 225 110 18 3 223B 235 116 30 3 225B 225 200 4 3 228B 265 217 15 3 229B 22
4 104A 84 11B 24 123B 44 125B 14 201A 214 202A 254 203A 244 207A 234 208A 204 209A 244 211A 235 102A 105 104A 15 123B 25 204A 215 205A 215 206A 225 210A 215 OATR 225 OATR1 235 OATR2 215 OATR3 22
86

!!!!!!!!!!!!
Exhibit!13!
87

12
This table presents the list of peer schools in alphabetical order by county name that was created specifically for this school (highlighted in yellow). Peer schools are drawn from across the state and represent schools that have similar grade configurations and that are educating students of similar demographic characteristics, as measured by enrollment in Free/Reduced Lunch Programs, Limited English Proficiency or Special Education Programs.
SCHOOL NAMEDISTRICT NAMECOUNTY NAME FRPL LEP SpED09-12ATLANTIC 79.6% 2.6% 16.6%
09-12ATLANTIC 82.3% 8.5% 18.0%
09-12CAMDEN 88.3% 0.5% 2.4%
09-12CAMDEN 85.5% 20.9% 29.8%
09-12CAPE MAY 72.2% 6.2% 29.7%
KG-12CHARTERS 90.4% 3.7% 4.6%
KG-12CHARTERS 83.4% 0.0% 7.8%
09-12CHARTERS 82.8% 0.0% 6.7%
09-12CHARTERS 74.5% 0.0% 15.8%
09-12ESSEX 82.4% 9.9% 18.7%
07-12ESSEX 82.2% 0.1% 6.3%
09-12ESSEX 76.7% 0.0% 5.2%
09-12ESSEX 85.9% 17.9% 14.3%
09-12ESSEX 81.0% 2.6% 18.5%
07-12ESSEX 83.6% 0.0% 7.9%
09-12HUDSON 84.9% 6.9% 14.7%
08-12HUDSON 80.9% 2.2% 12.5%
09-12HUDSON 71.2% 0.2% 31.5%
09-12HUDSON 91.7% 13.3% 12.7%
09-12HUDSON 83.5% 3.0% 15.1%
09-12MERCER 82.6% 10.6% 17.9%
09-12MERCER 79.7% 0.0% 15.3%
09-12MONMOUTH 85.8% 20.9% 22.6%
09-12OCEAN 82.5% 5.9% 14.4%
09-12PASSAIC 74.4% 2.3% 16.0%
09-12PASSAIC 81.3% 2.0% 8.3%
09-12PASSAIC 77.7% 18.5% 28.3%
09-12PASSAIC 89.4% 5.5% 7.3%
09-12SALEM 72.1% 0.0% 24.9%
09-12UNION 88.5% 13.0% 11.9%
09-12UNION 87.9% 4.2% 6.8%
29-2520-050Lakewood High SchoolSCHOOL PEER GROUP
GRADESPAN
CDS CODE
ATLANTIC CITY HIGH SCHOOL
PLEASANTVILLE HIGH SCHOOL
DR. CHARLES E. BRIMM MEDICAL ARTS HIGH SCHOOLWOODROW WILSON HIGH SCHOOL
WILDWOOD HIGH SCHOOL
LEAP ACADEMY UNIVERSITY CHARTER SCHOOLNORTH STAR ACADEMY CHARTER SCHOOLS OF NEWARKTHE BARACK OBAMA GREEN CHARTER HIGHUNIVERSITY ACADEMY CHARTER HIGH SCHOOLORANGE HIGH SCHOOL
ARTS HIGH SCHOOL
BARD EARLY COLLEGE HIGH SCHOOLEAST SIDE HIGH SCHOOL
NEWARK BRIDGES HIGH SCHOOL: A DIPLOMA PLUS SCHOOLUNIVERSITY HIGH SCHOOL
HARRISON HIGH SCHOOL
HOBOKEN HIGH SCHOOL
HENRY SNYDER
UNION CITY HIGH SCHOOL
MEMORIAL HIGH SCHOOL
TRENTON CENTRAL HIGH SCHOOL - MAIN CAMPUSTRENTON CENTRAL HIGH SCHOOL - WEST CAMPUSASBURY PARK HIGH SCHOOL
LAKEWOOD HIGH SCHOOL
PASSAIC COUNTY-MANCHESTER REGIONAL HIGH SCHOOLROSA L. PARKS SCHOOL OF FINE AND PERFORMING ARTSSCHOOL OF ARCHITECTURE AND CONSTRUCTION TRADESSCHOOL OF HEALTH SCIENCE
SALEM HIGH SCHOOL
ADMIRAL WILLIAM F. HALSEY JR. LEADERSHIP ACADEMYALEXANDER HAMILTON PREPARATORY ACADEMY
01-0110-010
01-4180-050
07-0680-029
07-0680-040
09-5790-050
80-7109-931
80-7320-960
80-6033-902
80-8060-990
13-3880-050
13-3570-010
13-3570-304
13-3570-040
13-3570-305
13-3570-057
17-2060-050
17-2210-005
17-2390-050
17-5240-055
17-5670-050
21-5210-050
21-5210-051
25-0100-010
29-2520-050
31-3980-010
31-4010-020
31-4010-307
31-4010-004
33-4630-050
39-1320-402
39-1320-405
ATLANTIC CITY
PLEASANTVILLE CITY
CAMDEN CITY
CAMDEN CITY
WILDWOOD CITY
LEAP ACADEMY UNIVERSITY CSNORTH STAR ACAD. CS OF NEWARKTHE BARACK OBAMA GREEN CHARTER HIGHUNIVERSITY ACADEMY CS
CITY OF ORANGE TWP
NEWARK CITY
NEWARK CITY
NEWARK CITY
NEWARK CITY
NEWARK CITY
HARRISON TOWN
HOBOKEN CITY
JERSEY CITY
UNION CITY
WEST NEW YORK TOWN
TRENTON CITY
TRENTON CITY
ASBURY PARK CITY
LAKEWOOD TWP
PASSAIC CO MANCHESTER REGPATERSON CITY
PATERSON CITY
PATERSON CITY
SALEM CITY
ELIZABETH CITY
ELIZABETH CITY
88

13
CUMBERLAND
CUMBERLAND
CUMBERLAND
This table presents the list of peer schools in alphabetical order by county name that was created specifically for this school (highlighted in yellow). Peer schools are drawn from across the state and represent schools that have similar grade configurations and that are educating students of similar demographic characteristics, as measured by enrollment in Free/Reduced Lunch Programs, Limited English Proficiency or Special Education Programs.
SCHOOL NAMEDISTRICT NAMECOUNTY NAME FRPL LEP SpEDPK-08CAMDEN 96.0% 20.2% 12.4%
PK-08CAMDEN 91.5% 6.9% 18.9%
05-08CHARTERS 93.2% 4.6% 11.4%
KG-08CHARTERS 93.2% 11.6% 10.1%
KG-08CHARTERS 91.2% 0.0% 11.9%
KG-08CHARTERS 91.7% 0.4% 9.2%
KG-08CHARTERS 91.3% 5.1% 5.5%
04-08CHARTERS 91.3% 0.0% 11.4%
KG-08 97.9% 27.6% 9.6%
KG-08 91.3% 0.2% 6.2%
KG-08 91.8% 0.1% 6.6%
03-08ESSEX 92.2% 0.0% 35.7%
KG-08ESSEX 95.8% 19.0% 7.0%
PK-08ESSEX 90.1% 0.2% 9.7%
PK-08ESSEX 97.4% 16.6% 23.2%
PK-08ESSEX 91.0% 2.1% 23.2%
PK-08MERCER 89.9% 0.0% 11.5%
PK-08MERCER 90.2% 0.2% 17.9%
PK-08MERCER 91.5% 0.2% 19.5%
PK-08MERCER 92.5% 3.7% 10.3%
PK-08MIDDLESEX 90.7% 1.7% 14.0%
06-08MIDDLESEX 94.7% 10.4% 13.8%
05-08MONMOUTH 93.9% 5.7% 25.9%
07-08OCEAN 92.3% 5.1% 15.0%
02-08PASSAIC 92.9% 11.5% 12.7%
KG-08PASSAIC 91.8% 6.1% 10.2%
KG-08PASSAIC 91.9% 8.1% 11.1%
03-08SALEM 92.3% 1.1% 18.2%
KG-08UNION 93.7% 14.0% 6.6%
PK-08UNION 94.1% 14.1% 10.4%
KG-08UNION 94.5% 17.0% 14.9%
29-2520-083Lakewood Middle SchoolSCHOOL PEER GROUP
GRADESPAN
CDS CODE
OCTAVIO V. CATTO FAMILY SCHOOLWOODLYNNE BORO PUBLIC SCHOOLCAMDEN'S PROMISE CHARTER SCHOOLHOPE ACADEMY CHARTER SCHOOLJOHN P. HOLLAND CHARTER SCHOOLLADY LIBERTY ACADEMY CHARTER SCHOOLMARIA VARISCO ROGERS CHARTER SCHOOLPAUL ROBESON CHARTER SCHOOL FOR THE HUMANITIESBROAD STREET SCHOOL
BUCKSHUTEM ROAD SCHOOL
WEST AVENUE SCHOOL
CHANCELLOR AVENUE SCHOOL
DR WILLIAM H HORTON ELEMENTARY SCHOOLLINCOLN
MILLER STREET SCHOOL
THIRTEENTH AVENUE SCHOOL MARTIN LUTHER KINGGREGORY ELEMENTARY SCHOOL
JOYCE KILMER ELEMNTARYSCHOOLMONUMENT ELEMENTARY SCHOOLP.J. HILL ELEMENTARY
MCKINLEY COMMUNITY SCHOOL
NEW BRUNSWICK MIDDLE SCHOOL
ASBURY PARK MIDDLE SCHOOL
LAKEWOOD MIDDLE SCHOOL
SCHOOL 12
SCHOOL 27
SCHOOL 6/ACADEMY OF PERFORMING ARTSSALEM MIDDLE SCHOOL
JOHN MARSHAL SCHOOL NO. 20
LOUVERTURE-LAFAYETTE SCHOOL NO. 6NICHOLAS S. LACORTE-PETERSTOWN SCHOOL NO. 3
07-0680-145
07-5900-050
80-6215-910
80-6740-950
80-6079-964
80-7100-936
80-7735-975
80-6025-907
11-0540-030
11-0540-050
11-0540-130
13-3570-330
13-3570-440
13-3570-490
13-3570-530
13-3570-715
21-5210-210
21-5210-235
21-5210-250
21-5210-265
23-3530-110
23-3530-055
25-0100-070
29-2520-083
31-4010-160
31-4010-300
31-4010-100
33-4630-090
39-1320-230
39-1320-120
39-1320-110
CAMDEN CITY
WOODLYNNE BORO
CAMDEN'S PROMISE CS
HOPE ACADEMY CS
JOHN P HOLLAND CHARTER SCHOOLLADY LIBERTY ACADEMY CSMARIA L. VARISCO-ROGERS CSPAUL ROBESON HUMANITIES CSBRIDGETON CITY
BRIDGETON CITY
BRIDGETON CITY
NEWARK CITY
NEWARK CITY
NEWARK CITY
NEWARK CITY
NEWARK CITY
TRENTON CITY
TRENTON CITY
TRENTON CITY
TRENTON CITY
NEW BRUNSWICK CITY
NEW BRUNSWICK CITY
ASBURY PARK CITY
LAKEWOOD TWP
PATERSON CITY
PATERSON CITY
PATERSON CITY
SALEM CITY
ELIZABETH CITY
ELIZABETH CITY
ELIZABETH CITY
89

17
This table presents the list of peer schools in alphabetical order by county name that was created specifically for this school (highlighted in yellow). Peer schools are drawn from across the state and represent schools that have similar grade configurations and that are educating students of similar demographic characteristics, as measured by enrollment in Free/Reduced Lunch Programs, Limited English Proficiency or Special Education Programs.
SCHOOL NAMEDISTRICT NAMECOUNTY NAME FRPL LEP SpEDKG-05ATLANTIC 90.5% 39.0% 10.0%
PK-06CAMDEN 95.0% 19.6% 12.0%
PK-07CAMDEN 98.1% 32.0% 13.9%
PK-05CAMDEN 98.1% 13.4% 12.9%
KG-05ESSEX 92.3% 17.9% 1.4%
PK-04ESSEX 91.9% 35.2% 17.8%
PK-04ESSEX 91.4% 23.7% 3.7%
PK-04ESSEX 94.4% 27.3% 7.5%
KG-05HUDSON 91.1% 32.6% 5.8%
PK-06HUDSON 94.0% 28.9% 5.6%
PK-04HUDSON 95.0% 35.7% 17.3%
PK-06HUDSON 95.1% 34.1% 8.3%
PK-05HUDSON 89.2% 25.5% 5.7%
PK-05MERCER 95.9% 34.2% 15.3%
KG-05MIDDLESEX 97.0% 29.6% 11.0%
PK-05MIDDLESEX 94.3% 20.1% 11.5%
KG-05MIDDLESEX 94.5% 26.1% 6.8%
PK-05MIDDLESEX 98.0% 19.6% 9.6%
PK-05MIDDLESEX 95.5% 13.8% 5.1%
PK-05MIDDLESEX 97.3% 28.5% 11.1%
PK-05MONMOUTH 89.7% 22.6% 7.4%
PK-03MONMOUTH 82.8% 47.2% 7.4%
01-06OCEAN 95.1% 27.0% 10.5%
PK-06PASSAIC 83.3% 49.0% 9.6%
03-05PASSAIC 89.0% 42.9% 11.7%
01-06PASSAIC 85.5% 51.5% 12.5%
PK-05PASSAIC 91.6% 26.9% 9.4%
KG-04PASSAIC 88.7% 30.5% 8.4%
PK-05UNION 89.3% 50.5% 13.4%
PK-05UNION 89.9% 47.9% 10.8%
01-04UNION 83.6% 40.2% 5.1%
29-2520-080Ella G Clarke Elementary SchoolSCHOOL PEER GROUP
GRADESPAN
CDS CODE
WASHINGTON AVENUE ELEMENTARY SCHOOLALFRED CRAMER COLLEGE PREPARATORY LAB SCHOOLCHARLES SUMNER ELEMENTARY SCHOOLRAFAEL CORDERO MOLINA ELEMENTARY SCHOOLFLORENCE AVENUE SCHOOL
BENJAMIN FRANKLIN ELEMENTARY SCHOOLELLIOTT STREET ELEMENTARY SCHOOLROBERTO CLEMENTE ELEMENTARY SCHOOLCOLIN POWELL ELEMENTARY SCHOOLGEORGE WASHINTON ELEMENTARY SCHOOLJEFFERSON ELEMENTARY SCHOOL
THEODORE ROOSEVELT ELEMENTARY SCHOOLVETERANS' MEMORIAL ELEMENTARY SCHOOLGRANT ELEMENTARY SCHOOL
A CHESTER REDSHAW SCHOOL
LINCOLN ELEMENTARY SCHOOL
LIVINGSTON ELEMENTARY SCHOOLLORD STLRLING ELEMENTARY SCHOOLPAUL ROBESON COMMUNITY SCHOOLROOSEVELT ELEMENTARY SCHOOLAUDREY W. CLARK ELEMENTARY SCHOOLRED BANK PRIMARY SCHOOL
ELLA G CLARKE ELEMENTARY SCHOOLMARTIN LUTHER KING JR. SCHOOL # 6SCHOOL # 5
WILLIAM B. CRUISE MEMORIAL SCHOOL # 11SCHOOL 15
SCHOOL 29
JEFFERSON ELEMENTARY SCHOOL
WASHINGTON COMMUNITY SCHOOLHARRISON ELEMENTARY SCHOOL
01-4180-060
07-0680-170
07-0680-310
07-0680-250
13-2330-100
13-3570-430
13-3570-390
13-3570-615
17-5240-300
17-5240-120
17-5240-100
17-5240-110
17-5240-118
21-5210-200
23-3530-060
23-3530-080
23-3530-090
23-3530-100
23-3530-123
23-3530-125
25-2770-090
25-4360-075
29-2520-080
31-3970-100
31-3970-097
31-3970-140
31-4010-190
31-4010-311
39-4160-150
39-4160-180
39-4540-020
PLEASANTVILLE CITY
CAMDEN CITY
CAMDEN CITY
CAMDEN CITY
IRVINGTON TOWNSHIP
NEWARK CITY
NEWARK CITY
NEWARK CITY
UNION CITY
UNION CITY
UNION CITY
UNION CITY
UNION CITY
TRENTON CITY
NEW BRUNSWICK CITY
NEW BRUNSWICK CITY
NEW BRUNSWICK CITY
NEW BRUNSWICK CITY
NEW BRUNSWICK CITY
NEW BRUNSWICK CITY
LONG BRANCH CITY
RED BANK BORO
LAKEWOOD TWP
PASSAIC CITY
PASSAIC CITY
PASSAIC CITY
PATERSON CITY
PATERSON CITY
PLAINFIELD CITY
PLAINFIELD CITY
ROSELLE BORO
90

17
This table presents the list of peer schools in alphabetical order by county name that was created specifically for this school (highlighted in yellow). Peer schools are drawn from across the state and represent schools that have similar grade configurations and that are educating students of similar demographic characteristics, as measured by enrollment in Free/Reduced Lunch Programs, Limited English Proficiency or Special Education Programs.
SCHOOL NAMEDISTRICT NAMECOUNTY NAME FRPL LEP SpEDPK-05ATLANTIC 91.4% 6.4% 8.5%
PK-05ATLANTIC 91.4% 12.0% 8.3%
PK-05CAMDEN 95.0% 2.2% 11.5%
PK-06CAMDEN 94.9% 3.5% 13.8%
PK-06CAMDEN 94.6% 2.0% 12.5%
KG-05CHARTERS 91.9% 0.0% 2.3%
KG-04CHARTERS 93.3% 1.3% 8.8%
KG-04CHARTERS 92.1% 0.0% 10.1%
KG-04CHARTERS 89.1% 0.0% 5.2%
KG-05CHARTERS 94.6% 0.0% 7.0%
KG-07ESSEX 87.9% 10.5% 10.5%
PK-07ESSEX 85.6% 15.4% 8.8%
KG-07ESSEX 88.9% 19.5% 17.8%
KG-05ESSEX 87.8% 5.7% 2.1%
KG-04ESSEX 90.9% 2.6% 7.1%
PK-07HUDSON 96.5% 0.0% 16.8%
PK-05HUDSON 84.4% 11.7% 6.6%
PK-06HUDSON 92.4% 11.7% 10.8%
PK-04HUDSON 81.0% 24.6% 7.9%
PK-06HUDSON 91.7% 9.8% 8.8%
PK-05MERCER 94.8% 0.3% 13.2%
KG-05MERCER 92.5% 7.0% 9.9%
PK-05MERCER 91.6% 16.6% 12.1%
PK-04MONMOUTH 91.2% 5.8% 10.2%
PK-06OCEAN 91.9% 14.6% 12.7%
02-06OCEAN 92.1% 10.0% 14.0%
PK-05PASSAIC 79.8% 30.4% 11.2%
PK-06PASSAIC 81.2% 28.3% 9.5%
KG-05PASSAIC 94.0% 12.9% 14.5%
PK-05UNION 81.9% 27.5% 13.4%
PK-05UNION 83.7% 28.2% 7.9%
29-2520-084Oak Street Elem SchoolSCHOOL PEER GROUP
GRADESPAN
CDS CODE
LEEDS AVENUE ELEMENTARY SCHOOLNORTH MAIN ST ELEMENTARY SCHOOLFRANCIS X. MCGRAW ELEMENTARY SCHOOLHARRY C. SHARP ELEMENTARY SCHOOLYORKSHIP ELEMENTARY SCHOOL
BURCH CHARTER SCHOOL OF EXCELLENCECAMDEN'S PRIDE CHARTER SCHOOLINTERNATIONAL CHARTER SCHOOL OF TRENTONKNOWLEDGE A TO Z CHARTER SCHOOLNEW HORIZONS COMMUNITY CHARTER SCHOOLCLEVELAND STREET ELEMENTARY SCHOOLFOREST STREET ELEMENTARY SCHOOLLINCOLN AVENUE ELEMENTARY SCHOOLUNIVERSITY ELEMENTARY SCHOOLROSEVILLE AVENUE SCHOOL
THOMAS G. CONNORS
ALEXANDER D. SULLIVAN SCHOOL
OLLIE CULBRETH JR. SCHOOL
PS # 33
PUBLIC SCHOOL NUMBER FIVE
COLUMBUS ELEMENTARY SCHOOL
FRANKLIN ELEMENTARY SCHOOL
MOTT ELEMENTARY SCHOOL
BRADLEY ELEMENTARY SCHOOL
CLIFTON AVE GRADE SCHOOL
OAK STREET ELEM SCHOOL
DANIEL F. RYAN ELEMENTARY SCHOOL # 19MARIO DRAGO SCHOOL # 3
SCHOOL 28
EMERSON ELEMENTARY SCHOOL
WOODLAND ELEMENTARY SCHOOL
01-4180-080
01-4180-085
07-0680-230
07-0680-300
07-0680-360
80-6022-990
80-6024-906
80-6810-940
80-6083-968
80-7290-957
13-3880-070
13-3880-080
13-3880-100
13-2330-136
13-3570-630
17-2210-065
17-2390-320
17-2390-160
17-2390-270
17-5670-090
21-5210-170
21-5210-190
21-5210-260
25-0100-040
29-2520-070
29-2520-084
31-3970-200
31-3970-090
31-4010-310
39-4160-130
39-4160-190
PLEASANTVILLE CITY
PLEASANTVILLE CITY
CAMDEN CITY
CAMDEN CITY
CAMDEN CITY
BURCH CHARTER SCHOOL OF EXCELLENCECAMDEN'S PRIDE CHARTER SCHHOLINTERNATIONAL CS OF TRENTONKNOWLEDGE A TO Z CHARTER SCHOOLNEW HORIZONS COMM. CS
CITY OF ORANGE TWP
CITY OF ORANGE TWP
CITY OF ORANGE TWP
IRVINGTON TOWNSHIP
NEWARK CITY
HOBOKEN CITY
JERSEY CITY
JERSEY CITY
JERSEY CITY
WEST NEW YORK TOWN
TRENTON CITY
TRENTON CITY
TRENTON CITY
ASBURY PARK CITY
LAKEWOOD TWP
LAKEWOOD TWP
PASSAIC CITY
PASSAIC CITY
PATERSON CITY
PLAINFIELD CITY
PLAINFIELD CITY
91

17
This table presents the list of peer schools in alphabetical order by county name that was created specifically for this school (highlighted in yellow). Peer schools are drawn from across the state and represent schools that have similar grade configurations and that are educating students of similar demographic characteristics, as measured by enrollment in Free/Reduced Lunch Programs, Limited English Proficiency or Special Education Programs.
SCHOOL NAMEDISTRICT NAMECOUNTY NAME FRPL LEP SpEDPK-05ATLANTIC 91.4% 6.4% 8.5%
PK-05ATLANTIC 91.4% 12.0% 8.3%
PK-07CAMDEN 97.3% 3.5% 11.0%
PK-05CAMDEN 95.0% 2.2% 11.5%
PK-06CAMDEN 94.9% 3.5% 13.8%
PK-06CAMDEN 94.6% 2.0% 12.5%
PK-05CAPE MAY 85.4% 39.4% 12.8%
KG-05CHARTERS 91.9% 0.0% 2.3%
KG-04CHARTERS 93.3% 1.3% 8.8%
KG-05CHARTERS 94.6% 0.0% 7.0%
PK-07ESSEX 85.6% 15.4% 8.8%
PK-07ESSEX 90.2% 21.3% 11.6%
KG-05ESSEX 87.8% 5.7% 2.1%
KG-04ESSEX 96.9% 22.8% 23.2%
KG-04ESSEX 90.9% 2.6% 7.1%
PK-05ESSEX 87.3% 23.9% 7.4%
PK-06HUDSON 92.4% 11.7% 10.8%
PK-04HUDSON 81.0% 24.6% 7.9%
PK-06HUDSON 91.7% 9.8% 8.8%
KG-05MERCER 92.5% 7.0% 9.9%
PK-05MERCER 91.6% 16.6% 12.1%
KG-05MERCER 94.2% 19.8% 13.0%
PK-04MONMOUTH 91.2% 5.8% 10.2%
PK-04MONMOUTH 94.4% 11.9% 11.2%
PK-06OCEAN 91.9% 14.6% 12.7%
02-06OCEAN 92.1% 10.0% 14.0%
PK-05PASSAIC 79.8% 30.4% 11.2%
PK-06PASSAIC 81.2% 28.3% 9.5%
KG-05PASSAIC 90.9% 22.6% 14.2%
KG-05PASSAIC 94.0% 12.9% 14.5%
PK-05UNION 83.7% 28.2% 7.9%
29-2520-070Clifton Ave Grade SchoolSCHOOL PEER GROUP
GRADESPAN
CDS CODE
LEEDS AVENUE ELEMENTARY SCHOOLNORTH MAIN ST ELEMENTARY SCHOOLDR. HENRY H. DAVIS ELEMENTARY SCHOOLFRANCIS X. MCGRAW ELEMENTARY SCHOOLHARRY C. SHARP ELEMENTARY SCHOOLYORKSHIP ELEMENTARY SCHOOL
GLENWOOD AVE ELEMENTARY SCHOOLBURCH CHARTER SCHOOL OF EXCELLENCECAMDEN'S PRIDE CHARTER SCHOOLNEW HORIZONS COMMUNITY CHARTER SCHOOLFOREST STREET ELEMENTARY SCHOOLROSA PARKS/CENTRAL COMMUNITY SCHOOLUNIVERSITY ELEMENTARY SCHOOLFOURTEENTH AVENUE SCHOOL
ROSEVILLE AVENUE SCHOOL
SOUTH STREET ELEMENTARY SCHOOLOLLIE CULBRETH JR. SCHOOL
PS # 33
PUBLIC SCHOOL NUMBER FIVE
FRANKLIN ELEMENTARY SCHOOL
MOTT ELEMENTARY SCHOOL
PARKER ELEMENTARY
BRADLEY ELEMENTARY SCHOOL
THURGOOD MARSHALL ELEMENTARY SCHOOLCLIFTON AVE GRADE SCHOOL
OAK STREET ELEM SCHOOL
DANIEL F. RYAN ELEMENTARY SCHOOL # 19MARIO DRAGO SCHOOL # 3
EDWARD W KILPATRICK
SCHOOL 28
WOODLAND ELEMENTARY SCHOOL
01-4180-080
01-4180-085
07-0680-180
07-0680-230
07-0680-300
07-0680-360
09-5790-060
80-6022-990
80-6024-906
80-7290-957
13-3880-080
13-3880-105
13-2330-136
13-3570-420
13-3570-630
13-3570-640
17-2390-160
17-2390-270
17-5670-090
21-5210-190
21-5210-260
21-5210-270
25-0100-040
25-0100-100
29-2520-070
29-2520-084
31-3970-200
31-3970-090
31-4010-047
31-4010-310
39-4160-190
PLEASANTVILLE CITY
PLEASANTVILLE CITY
CAMDEN CITY
CAMDEN CITY
CAMDEN CITY
CAMDEN CITY
WILDWOOD CITY
BURCH CHARTER SCHOOL OF EXCELLENCECAMDEN'S PRIDE CHARTER SCHHOLNEW HORIZONS COMM. CS
CITY OF ORANGE TWP
CITY OF ORANGE TWP
IRVINGTON TOWNSHIP
NEWARK CITY
NEWARK CITY
NEWARK CITY
JERSEY CITY
JERSEY CITY
WEST NEW YORK TOWN
TRENTON CITY
TRENTON CITY
TRENTON CITY
ASBURY PARK CITY
ASBURY PARK CITY
LAKEWOOD TWP
LAKEWOOD TWP
PASSAIC CITY
PASSAIC CITY
PATERSON CITY
PATERSON CITY
PLAINFIELD CITY
92

Exhibit!14!
93

STATE OF NEW JERSEY - DEPARTMENT OF EDUCATION 04/30/2014 1 DIVISION OF ADMINISTRATION AND FINANCE
OFFICE OF SCHOOL FINANCECOUNTY: ���2&($1�DISTRICT: 2����/$.(:22'�7:3CITY
***EST. 2014-15 STATE SCHOOL AID (FULL SFRA FUNDING)*** Page ENR BUDGET: K-12 PROJECTED ENROLLMENT REPORT
PRIOR YEAR RESIDENT ENROLLMENT TOTAL WEIGHTED ENROLLMENT CALCULATION
October 2013 Projected Projected October 2012 Enrollment Weighted October 2011 10/15/2014 Weight Enrollment October 2010 October 2009 0 (Q-1) 0.50 (R-1) 0 (S-1) October 2008
������� (A)������� (B) Enrollment with��������(C) Base Weight�����.0 (D)��������(E) Half day Kindergarten�������� (F) Elementary - Full K & Gr. 1-5 2�������� (Q-2) 1.00 (R-2) ������(S-2)
Middle School - Gr. 6-8 ����� (Q-3) 1.04 (R-3) �����(S-3)High School - Gr. 9-12 ����� (Q-4) 1.16 (R-4) ������(S-4)
GROWTH RATE CALCULATION Total - Based on Grade Level ������ (S)
Sum of Items (A), (B) and (C) At Risk Only LEP Only LEP & Low Inc Sum of Items (D), (E) and (F)
1������� (G)�1������� (H) ------------ ------------ -------------
Item (G) Divided by three (3) ������� (I) Projected Enrollment Projected Projected Projected Item (H) Divided by three (3) ������� (J) by Student Characteristics Enrollment Enrollment Enrollment Item (I) Divided by Item (J) Third Root of Item (K) 0 (T-1) 0 (U-1) 0 (V-1) Item (L) Minus one (1)
1.������ (K)1.0����� (L) Half day Kindergarten�0.0����� (M) Elementary - Full K & Gr. 1-5 ������ (T-2) �� (U-2) ������(V-2)
Growth Rate - Item (M) as a % ������%(N) Middle School - Gr. 6-8 ��� (T-3) ���(U-3) �� (V-3)����� (T-4) �� (U-4) �� (V-4)
10/15/2013 RESIDENT ENROLLMENTHigh School - Gr. 9-12
������� (O) Subtotal ������ (T) �� (U) ����� (V)
PROJ. 10/2014 RESIDENT ENROLLMENT (FTE) At Risk Only LEP Only LEP & Low Inc Item (O) Adjusted by the Growth Rate ------------ ------------ ------------- minus half of Item (Q-1) Projected Projected Projected
Enrollment with Weighted Weighted Weighted* 1/2 Day Kindergarten pupil is counted as half. Additional Weights Enrollment Enrollment Enrollment
Above the Base @ 0.57000 @ 0.50 @ (0.57000 + 0.125)
Half day Kindergarten 0 (W-1) 0 (X-1) 0 (Y-1)Elementary - Full K & Gr. 1-5 ����� (W-2) ����� �X-2) ��� (Y-2)Middle School - Gr. 6-8 ��� (W-3) �� (X-3) �� (Y-3)High School - Gr. 9-12 ����� (W-4) �� (X-4) �� (Y-4)Subtotal ������ (W) �� (X) ��� (Y)
������� (O-1)Projected Weighted
94

��� ���������������������
�����������
����������
����������
����������
95

96

97
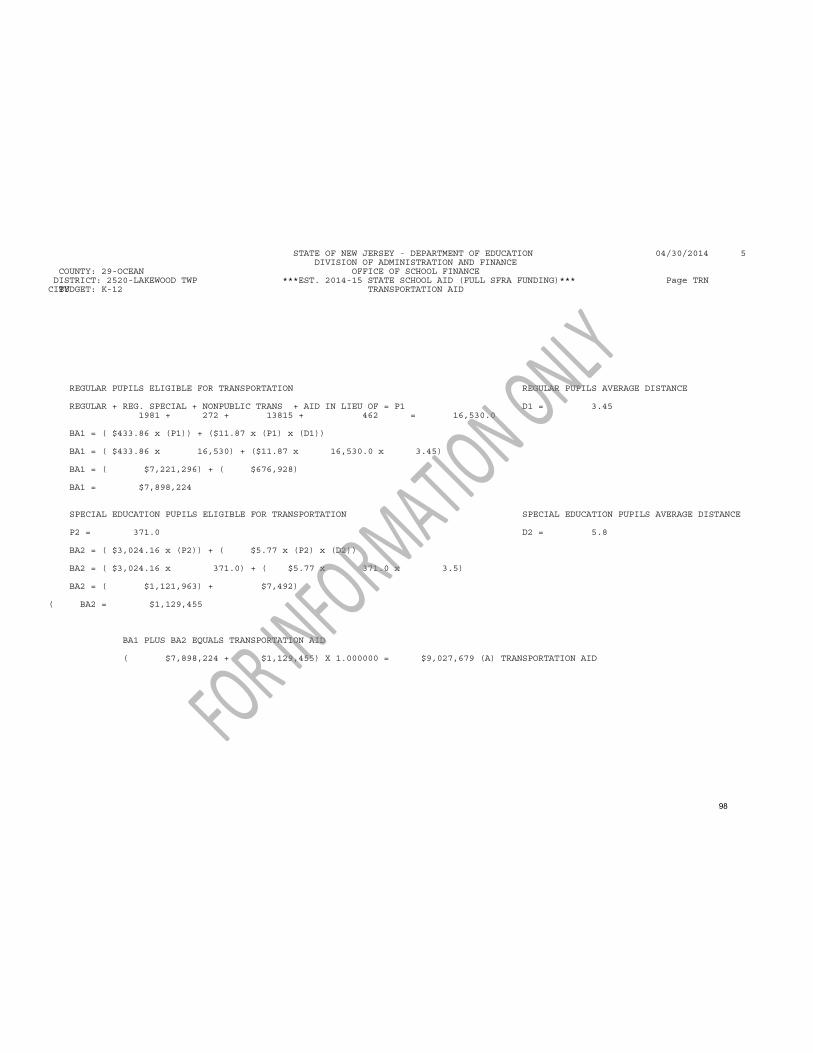
98
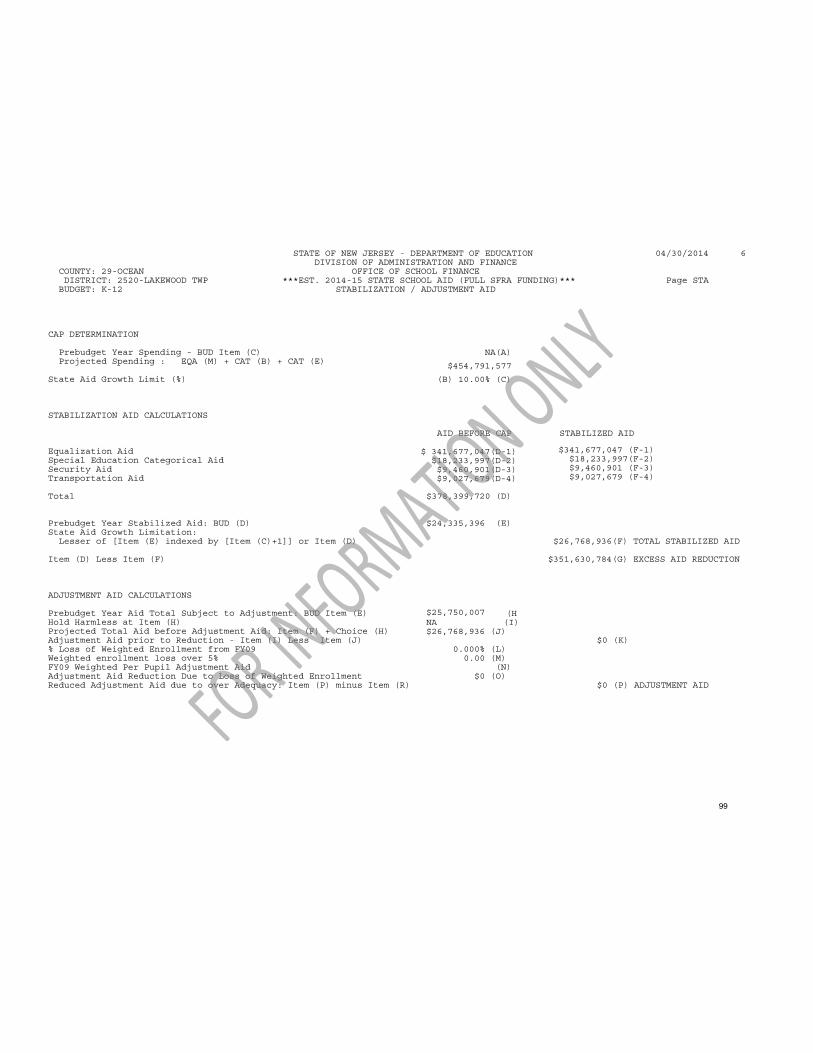
99

100

2&($1� �����/$.(:22'�7:3
������������ ��� �� �
��� �� �
����������
����������
���������
�����������
101

2&($1� �����/$.(:22'�7:3
����������� �����������������
����������
����������
����������
���������
��
������������ '
������������
�����������
102

Exhibit!15!
103

• Coverage: This measures the proportion of school-age children attending the state's public schools, as compared with those not attending the state's public schools (primarily parochial and private schools, but also home schooling). The share of the state's students in public schools, and the median household income of those students, is an important indicator of the distribution of funding relative to student poverty (especially more affluent households simply opt out of public schooling), and the overall effort to provide fair school funding.
It is important to note that not all of these fairness measures are entirely within the control of state policymakers. For example, the level of funding is a function of both the state's effort and wealth. When evaluating a state's funding level, it is important to consider whether the funding level is a function of effort, wealth (that is, fiscal capacity), or a combination of the two. In addition, the extent to which children attend public schools is not entirely a function of the quality of the public system. Some states historically have a larger supply of private schools and higher degree of private-school attendance. However, numerous empirical studies do validate that the quality of a state's public education system can influence coverage. 15
Research Method
The fairness measures use a combination of simple descriptive and more complex statistical model-ing methods. Effort and Coverage are straightforward descriptive measures. State-level indicators are calculated from available descriptive data, allowing states to be graded and ranked from most to least fair.
Funding Level and Funding Distribution require more advanced statistical techniques. The purpose of these measures is to compare school funding both across and within states. Because education costs vary based on a number of factors - for example, regional differences in teacher salaries, school district size, population density, and various student characteristics - a research method is needed that 1) simulates comparable conditions, or holds variables constant, across states to ensure a fair comparison, and 2) characterizes the relationship between revenue (funding) and poverty within states, while controlling for variations in other cost-affecting conditions.
A regression analysis achieves these goals by predicting an outcome - in this case, school funding levels - based on relevant variables such as student poverty, regional wage variation, and school district size and density. The regression model provides an estimate that quantifies the relationship between the outcome and each variable in the model. The model also allows for an examination of pertinent issues, such as changes in spending in relation to student poverty, or changes in relation to school district size. It is important to note, however, that additional measures of student char-acteristics, such as disability rates and limited English proficiency, are not included in the statistical model. The current measures of these characteristics are weak and irregular across states, and they complicate the interpretation of the poverty effect within states, a critical focus of the model. 16
Funding Level: The regression model predicts an average per-pupil funding level for each state, while holding all other factors constant. The model eliminates the variation in funding associated with characteristics that vary between districts and across states, and determines average funding at the state level under a hypothetical, yet meaningful, set of conditions. The model simulates
15 See, for example, Thomas Downes & David Schoeman (1998), School Finance Reform and Private School Enrollment: Evidence from California. Journal of Public Economics, 43 (3) 418-443.
16 It is also important to note that this regression model is only able to compare expenditure differences across similar settings, and cannot fully control for the "costs" of achieving "comparable outcomes." A true education cost model requires a common outcome measure across all settings in the model, and such outcome measures are not currently available for all scllool districts nationally.
Is School Funding Fair? A National Report Card 9
104

Fairness Measure #4: Coverage
The share of school-aged children attending the state's public schools, and the median household income of those children, is a critical but often overlooked factor affecting school funding fairness. As previously noted, the extent to which school-age children attend public school is only partially within the control of state policymakers. However, the extent of public school coverage in a given state, and the overall income level of those students, impacts the effort necessary to fairly fund its public schools. A higher percentage of students in public schools requires a greater state funding effort. Further, a high concentration of children from low-income households in public schools requires not only more state funding effort, but also fair funding distribution. Perhaps most impor-tantly, a high share of private school students from higher-income households affects the public and political will necessary to generate fair funding through the state's finance system. 25
The Coverage measure for all states is shown in Table 5, including data on the difference in house-hold income between public and private school students. The states are ranked by a combined score of the percentage of students who attend public schools and the household income ratio between public and private school students.
Table 5: P'airness Measure #4: Coverage26
State
I Utah
Idaho
f Alaska_
Arizona
I. · . West Virginia
i \lermofit New !"lampshire
i. [?a.k<:ita North Dakota
:: Michigan
I
t.Kansas··
% 6- to 16-Year-Olds in Public School
Median Household Income
(Public School)
Median Household Income
(Private School) --, , 'i .• -:.: .. 93;8.o/O :·ll;::; : .• $73 .• j · 93:4% 1 -.- .,., • :._ -. - '! 2
·a9.6•io " ii· .. :.L_-Jk ·.. 3I2··. ··•< ·i.:;.' - 1i'L ' -1 32 . . 4
--·.:··_••.1.!.--:.. -$81,_21_._1 __ : . : -,.r,_. ·.•· · -----$···1---o-·s··:.··s·--·3·"··a··:··· ' ' ': ··· · · 1 >:s.· .. ., ... : .. • .. , __ .. · $67,949 · M2 .e
90,60/o
91.1%
;r ,. · · .59:o% · ·-·· · M .. ·· __ ... '. ... ,. _1:35 ·Jt _:·t,, ,·J 91.4% ,' ;.::$87,681 '' 8
89.6%; •. :_._, J!i:_ . ·\.42 .:r:'X , .9 L' 11:' ${12;241 88.0%
88.4%
88.8% · · 1 • - · :::·
88.4% 92.4%
88.2%
87.5%'
86.7%
'$89,756
$70;522 ' ' . ' .,, '
$7'9,736
1.25, ·to ·-11 - -.•
25 The Coverage measure Is a significant equity concern In many of the state fairness profiles. In states that have a high proportion of private school students, the fairness profiles do not include a significant portion of the school population. To the extent that these private school students are disproportionately from higher-income households, a degree of bias is introduced into the fairness profiles.
26 Data on coverage is based on American Community SuNey Data from 2005 to 2007 on 6- to 16-year-olds.
Is School Funding Fair? A National Report Card 29
105

30
Table 5: Fairness Measure #4: Coverage (continued)
State % 6-to
16-Year-Olds in Public School
Median Household Income
(Public School)
Median Household Income
(Private School)
Private/Public Income Ratio II
, , .. , ... ... : $'1_31,109. ·J: · r:2·1, Massachusetts
I Oklahoma
Texas ' ' '
. Virginia
86.1% r · · 1-· ·• :. , , .. ,T.49' 22
,90:2% )'..· .. ·;• :':!''.:,_, tair ,,, ·1.t •·.·• 85.7% . $66,411 .. ·.· . . .. $92,3$1 .· ·. : , ... 24 ' .
88.0%· · 1:.·> ... · '. .. r ·· :}t\)'25 >:) 9.1.4% , . .·.·•• ...... ,.·.. .$12?,6aa 2.00 , ..
.·.ll:: ... Jr: · ,211·• ·., 81.1% · 1 •• ' ·-·:·:i ............. , ... · 1.66 28
............................................. ·1r ..... ·: .. : :1:·: · .. ·· 1: . ·29· :, Arkansas
i Nortti car<;>llna California
Illinois f South 9arolina ·
Wisconsin
i Ohio Rhode Island
[.Alabama Georgia
I MIS?IS_SIJ?Pf ,, Kentucky
: New 'fork
i Missouri,
Tennessee
: Florida·
Maryland
[88:Vl11,11. Louisiana
District. of Columbia
89;9%' t.94 · 30 8s:e·Yo· 'Ji', > ... !( __ :I 31 89.2% : . ' '. ·. ; : : 1.88 , 32
·. 87• .1% •• ·• ·; ·' :i ·' ; > ·::1 85.8% $713,oo·h· _ ,,, . L55 ·. 33 .
ai .. 1% •·JI.;.• ;;,:'.>1·?·1. r;T:: 3.i;,·, 83.7% $72,277 .. $99,272 L37 . 35
:·· ::nc::.:.> ·· _Jc -?' 1.50 ·. , T alF 85.5% .... . . $123,75?, 1.62 31
.. 86.5% ·.:·:' rn: < l:. :· 88.2% , $65,as:r:·: ... . · 1.96 s9 8.7.7%, .· · .. :. ·· .. .... <J, .. ·'.·.: .• ;! ·1; 8M% "$5()j127< $10()11327 '1 • ):7s 41 83.5%.
82.5% . . $71.1143,: .. , $10·M01 ... · · · ·· ·ai2% : · .. ·:.
, $59;&89 ··· ·· ······· · .··· a5;a0(6 ·. ;'$as;,fr1: '>:,·rcu . 81.0% •. . ,· $1471465 ?9-·?fa....... . ;·. · $7M.1.2.. ,: J: ...... ·.•. jigg;§F: ·.···.·• .1L ..... 8D.6% . . . , . , 1.99
..... '.' ..... 1',1"·.-..... · .... , •. .......... • ·1'' , ., ......... ,. ... , .... _,.,. ... , .. . ,, . ,: .... , , ';' ' !I. ,•]:; J;SS
,,
78.6.%
77.9% .. ,. $52,106 . $185,93:,l
';45 . : 4g:'\i·
47 , .]';"' J
49
. 51
Coverage rates vary significantly among the states, from a low of 78% in Washington, D.C., to 94% in Wyoming. In addition, the median household income of public and private school students varies widely. Washington, D.C., also has the highest income ratio (3.57), with a median household Income of $185,933 for private school students to $52, 106 for public school students.
The Coverage data further illuminate the state fairness profiles. Public schools in Louisiana and Delaware, for example, enroll 80% of their school-age children, with those students dispropor-tionately from lower-income households. As a result, the fairness profile in these states - funding level and distribution to districts relative to poverty - does not capture one-fifth of the school-age children in private schools who are disproportionately higher income.
Is School Funding Fair? A National Report Card
106

Exhibit!16!
107
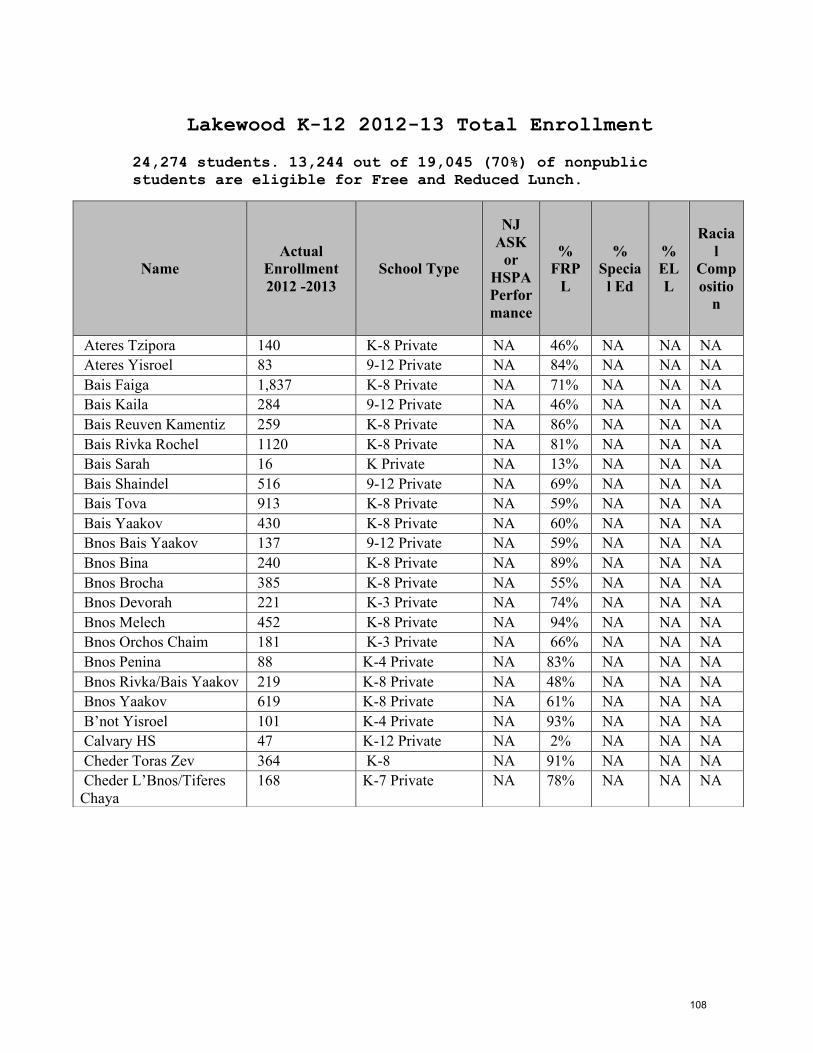
Lakewood K-12 2012-13 Total Enrollment
24,274 students. 13,244 out of 19,045 (70%) of nonpublic students are eligible for Free and Reduced Lunch.
Name Actual
Enrollment 2012 -2013
School Type
NJ ASK
or HSPA Performance
% FRP
L
% Specia
l Ed
% ELL
Racial
Compositio
n
Ateres Tzipora 140 K-8 Private NA 46% NA NA NA Ateres Yisroel 83 9-12 Private NA 84% NA NA NA Bais Faiga 1,837 K-8 Private NA 71% NA NA NA Bais Kaila 284 9-12 Private NA 46% NA NA NA Bais Reuven Kamentiz 259 K-8 Private NA 86% NA NA NA Bais Rivka Rochel 1120 K-8 Private NA 81% NA NA NA Bais Sarah 16 K Private NA 13% NA NA NA Bais Shaindel 516 9-12 Private NA 69% NA NA NA Bais Tova 913 K-8 Private NA 59% NA NA NA Bais Yaakov 430 K-8 Private NA 60% NA NA NA Bnos Bais Yaakov 137 9-12 Private NA 59% NA NA NA Bnos Bina 240 K-8 Private NA 89% NA NA NA Bnos Brocha 385 K-8 Private NA 55% NA NA NA Bnos Devorah 221 K-3 Private NA 74% NA NA NA Bnos Melech 452 K-8 Private NA 94% NA NA NA Bnos Orchos Chaim 181 K-3 Private NA 66% NA NA NA Bnos Penina 88 K-4 Private NA 83% NA NA NA Bnos Rivka/Bais Yaakov 219 K-8 Private NA 48% NA NA NA Bnos Yaakov 619 K-8 Private NA 61% NA NA NA B’not Yisroel 101 K-4 Private NA 93% NA NA NA Calvary HS 47 K-12 Private NA 2% NA NA NA Cheder Toras Zev 364 K-8 NA 91% NA NA NA Cheder L’Bnos/Tiferes Chaya
168 K-7 Private NA 78% NA NA NA
108

2!
Name
Actual Enrollment 2012 -2013
School Type
NJ ASK or
HSPA Performance
% FRPL
% Special Ed
% ELL
Racial Composition
Clifton Avenue Grade School 888 K-6 Traditional Public
3L 26% 3M 45% 4L 30% 4M 57% 5L 31% 5M 63% 6L 41% 6M 68%
88%
17%
10%
W09% B15% H75%
Derech Hatorah 7 6-7 Private NA 57%
NA NA NA
Ella G. Clark Elem. School 820 K-6 Trad. Public 3L 28% 3M 60% 4L 30% 4M69% 5L 38% 5M81% 6L 52% 6M 81%
89%
13%
24%
W02% B13% H85%
Holy Family School 110 K-8 Private NA 15%
NA NA NA
Lakewood Cheder School 1,777 K-8 Private NA 78%
NA NA NA
Lakewood High School 1,033 9-12 Traditional Public
66%L 37%M
64%
19%
8% W10% B27% H62%
Lakewood Middle School 637 7-8 Traditional Public 7 L 25% 7M 35% 8L 54% 8M 35%
78%
18%
6% W05% B24% H68%
Mesivta Mikor Hatorah 31 9-12 Private NA 68%
NA NA NA
Mesivta Nachlas Yisroel 87 9-12 Private NA 70%
NA NA NA
Mesivta Torah Temima 94 9-12 Private NA 41%
NA NA NA
109

Name
Actual Enrollment 2012 -2013
School Type
NJ ASK or
HSPA Performance
% FRPL
% Special Ed
% ELL
Racial Composition
Oak Street Elem. Sch. 1,009 K-6 Trad. Public 3L 50% 3M 79% 4L 59% 4M 80% 5L 37% 5M 67% 6L 41% 6M 74%
90%
17%
13%
W07% B15% H71% A01%
Ocean Day School 5 K-8 Private NA 40%
NA NA NA
Oros Bais Yaakov 168 9-12 Private NA 61%
NA NA NA
Ruach Chaim/Mesivta Nezer Hatorah
20 9-12 Private NA 35%
NA NA NA
School for Chldren with Hidden Intelligence
143 Private NA NA NA NA NA
NA NA NA NA NA Shiras Devorah 57 9-12 Private NA 72
% NA NA NA
Spruce Street Elem. Schl. 842 K-6 Trad. Public 3L 55% 3M 89% 4L 35% 4M 67% 5L 12% 5M 66% 6L 36% 6M 79%
90%
15%
36%
W03% B10% H86%
Talmud Torah Bais Avrohom 538 K-8 Private
NA 74%
NA NA NA
Talmud Torah Darchei Avosenu 15 K Private NA 80%
NA NA NA
Talmud Torah Ohr Elchonon 194 K-8 Private NA 94%
NA NA NA
Tashbar of Lakewood 359 K-8 Private NA 61%
NA NA NA
Tiferes Bais Yaakov 587 K-8 Private NA 78%
NA NA NA
110
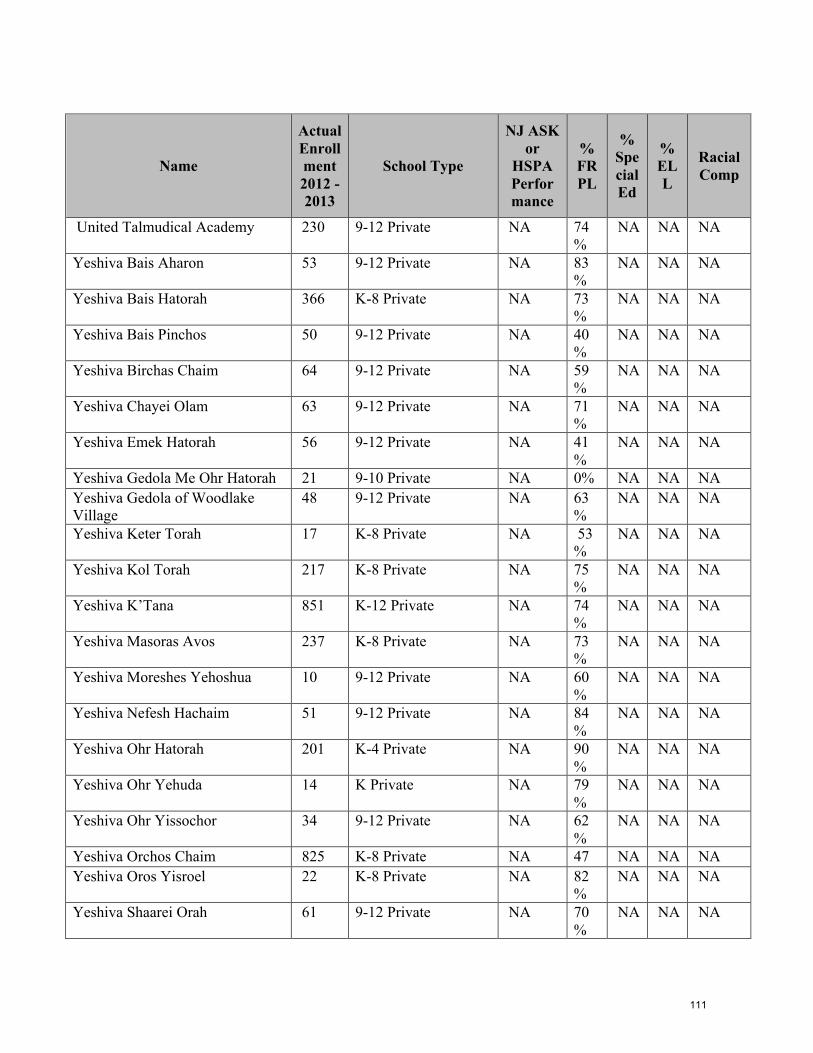
!
Name
Actual Enrollment 2012 -2013
School Type
NJ ASK or
HSPA Performance
% FRPL
% Special Ed
% ELL
Racial Comp
United Talmudical Academy 230 9-12 Private NA 74%
NA NA NA
Yeshiva Bais Aharon 53 9-12 Private NA 83%
NA NA NA
Yeshiva Bais Hatorah 366 K-8 Private NA 73%
NA NA NA
Yeshiva Bais Pinchos 50 9-12 Private NA 40%
NA NA NA
Yeshiva Birchas Chaim 64 9-12 Private NA 59%
NA NA NA
Yeshiva Chayei Olam 63 9-12 Private NA 71%
NA NA NA
Yeshiva Emek Hatorah 56 9-12 Private NA 41%
NA NA NA
Yeshiva Gedola Me Ohr Hatorah 21 9-10 Private NA 0% NA NA NA Yeshiva Gedola of Woodlake Village
48 9-12 Private NA 63%
NA NA NA
Yeshiva Keter Torah 17 K-8 Private NA 53%
NA NA NA
Yeshiva Kol Torah 217 K-8 Private NA 75%
NA NA NA
Yeshiva K’Tana 851 K-12 Private NA 74%
NA NA NA
Yeshiva Masoras Avos 237 K-8 Private NA 73%
NA NA NA
Yeshiva Moreshes Yehoshua 10 9-12 Private NA 60%
NA NA NA
Yeshiva Nefesh Hachaim 51 9-12 Private NA 84%
NA NA NA
Yeshiva Ohr Hatorah 201 K-4 Private NA 90%
NA NA NA
Yeshiva Ohr Yehuda 14 K Private NA 79%
NA NA NA
Yeshiva Ohr Yissochor 34 9-12 Private NA 62%
NA NA NA
Yeshiva Orchos Chaim 825 K-8 Private NA 47 NA NA NA Yeshiva Oros Yisroel 22 K-8 Private NA 82
% NA NA NA
Yeshiva Shaarei Orah 61 9-12 Private NA 70%
NA NA NA
111
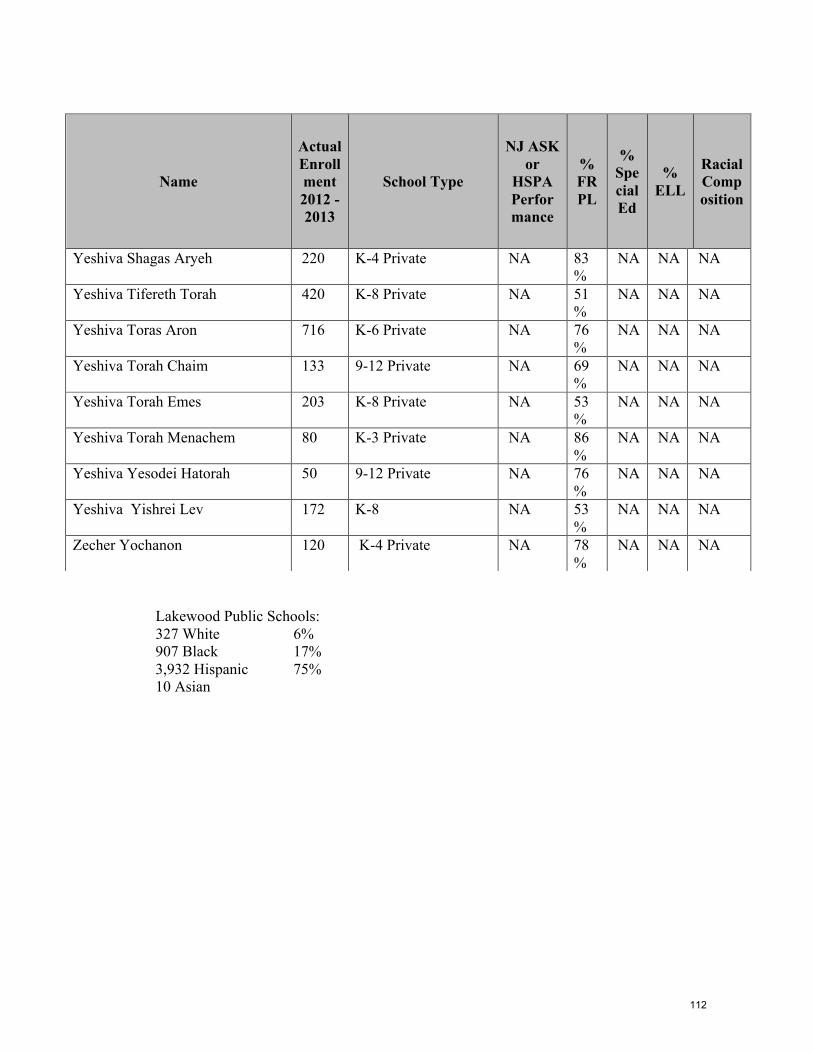
Lakewood Public Schools: 327 White 6% 907 Black 17% 3,932 Hispanic 75% 10 Asian
Name
Actual Enrollment 2012 -2013
School Type
NJ ASK or
HSPA Performance
% FRPL
% Special Ed
% ELL
Racial Composition
Yeshiva Shagas Aryeh 220 K-4 Private NA 83%
NA NA NA
Yeshiva Tifereth Torah 420 K-8 Private NA 51%
NA NA NA
Yeshiva Toras Aron 716 K-6 Private NA 76%
NA NA NA
Yeshiva Torah Chaim 133 9-12 Private NA 69%
NA NA NA
Yeshiva Torah Emes 203 K-8 Private NA 53%
NA NA NA
Yeshiva Torah Menachem 80 K-3 Private NA 86%
NA NA NA
Yeshiva Yesodei Hatorah 50 9-12 Private NA 76%
NA NA NA
Yeshiva Yishrei Lev 172 K-8 NA 53%
NA NA NA
Zecher Yochanon 120 K-4 Private NA 78%
NA NA NA
112

!!!!!!!!!!!!
Exhibit!17!
113

New Jersey High School Proficiency Assessment Summary of District Performance - Mathematics
Grade 11CYCLE IREPORT PRINTED: 5/12/2014
COUNTY:DISTRICT: LAKEWOOD TOWNSHIP
292520
STUDENTS PROCESSED: 231 Excludes students who took Braille, alternate and special forms other than large print.
OCEAN
TEST DATE: MARCH 2014
ProficientPartially Proficient
PERFORMANCE DATA FOR STUDENTS WITH VALID SCALE SCORES 1
PercentNumberPercentNumberPercentNumberValid Scale
ScoresAdvanced ProficientAPA
StudentsNot
Present VoidsDEMOGRAPHIC GROUP 2Enrolled
Total Students 57.513 3.2 9 70 127 39.4 87 231 221 General Education 46.21 4 4.1 0 70 78 49.7 84 170 169 Special Education 97.40 0.0 9 00 38 2.6 1 48 39 Not Exempt From Passing 97.20 0.0 0 00 35 2.8 1 36 36 Exempt From Passing 100.00 0.0 0 00 3 0.0 0 3 3 Exempt From Taking (APA) -- 5 9 -- 9 -- Limited English Proficient 76.50 6 0.0 0 00 13 23.5 4 17 17 Current LEP 84.60 0.0 0 00 11 15.4 2 13 13 Former LEP 50.00 0.0 0 00 2 50.0 2 4 4Students Coded SE & Current LEP 0 0 0 00
Scale ScoreMean
Total Points PossibleJust Proficient Mean
7 12 15 14 48 422.3 3.5 6.9 5.2 18.0 14.0
SCALE SCORE MEANS & CLUSTER MEANS FOR STUDENTS WITH VALID SCALE SCORES
7
8
Number & Numerical Operations
Geometry & Measurement
Patterns & Algebra
Data Analysis, Probability & Discrete
Mathematics Knowledge
Mathematical Processes -
Problem Solving
48
Total Students 194.63 2.3 17.3 3.1 6.7 5.2 13.5 General Education 201.2 4 2.6 19.1 3.5 7.4 5.7 15.0 Special Education 169.8 1.3 10.4 1.7 4.0 3.5 7.9 Not Exempt From Passing 170.3 1.3 10.5 1.7 4.0 3.5 8.0 Exempt From Passing 164.3 1.0 9.0 1.3 3.3 3.3 7.0 Limited English Proficient 186.1 6 2.3 14.8 3.1 5.6 3.8 11.1 Current LEP 182.4 2.3 13.9 2.8 5.2 3.6 10.3 Former LEP 198.3 2.3 17.9 4.1 7.0 4.5 13.6
29-2520
Page 1 of 1
Percentages may not total 100 due to rounding.Includes students coded Medical Emergency.Students are included in Total Students only once, but they appear in all other categories that apply.Includes students coded Former LEP who are not Special Education.Students coded IEP Exempt From Taking the HSPA are required to take the Alternate Proficiency Assessment (APA).Includes students coded Current and Former LEP.The range of scale scores is 100 to 300.The numbers in this row are the statewide raw score means for students whose scale score is 200.
1
2
3
4
5
6
7
8
114
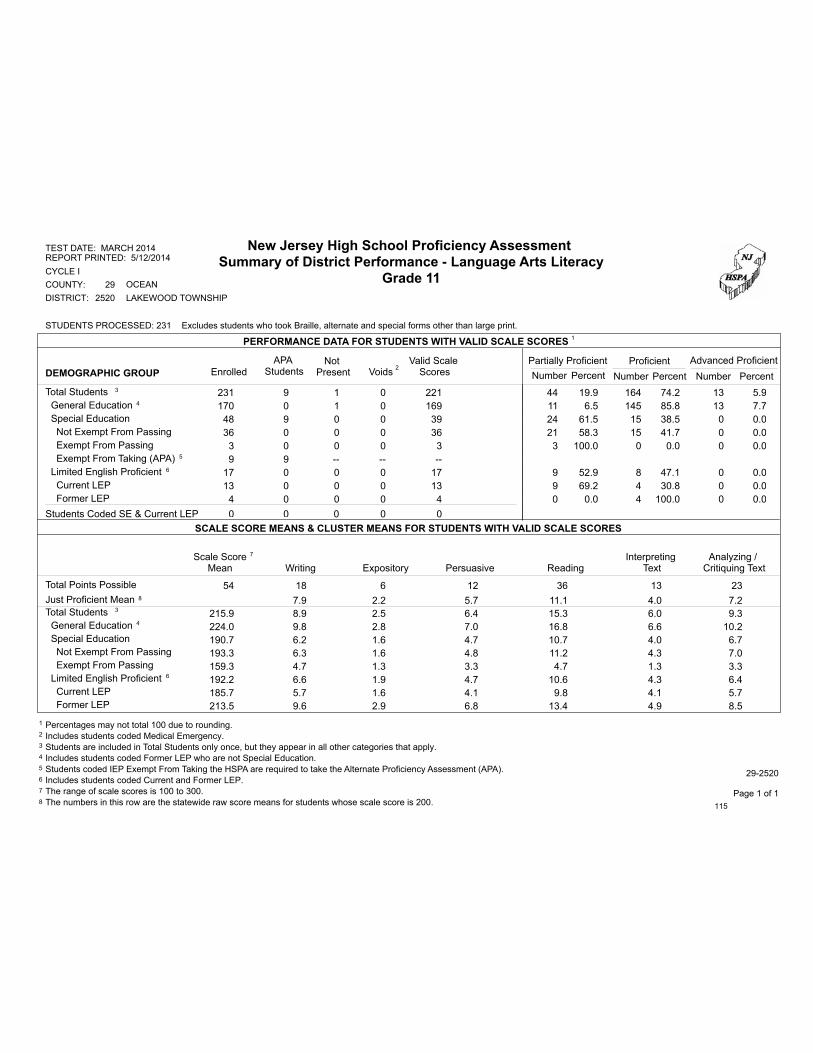
New Jersey High School Proficiency Assessment Summary of District Performance - Language Arts Literacy
Grade 11CYCLE IREPORT PRINTED: 5/12/2014
COUNTY:DISTRICT: LAKEWOOD TOWNSHIP
292520
STUDENTS PROCESSED: 231 Excludes students who took Braille, alternate and special forms other than large print.
OCEAN
TEST DATE: MARCH 2014
ProficientPartially Proficient
PERFORMANCE DATA FOR STUDENTS WITH VALID SCALE SCORES 1
PercentNumberPercentNumberPercentNumberValid Scale
ScoresAdvanced ProficientAPA
StudentsNot
Present VoidsDEMOGRAPHIC GROUP 2Enrolled
Total Students 19.913 5.9 9 130 44 74.2 164 231 221 General Education 6.51 4 7.7 0 130 11 85.8 145 170 169 Special Education 61.50 0.0 9 00 24 38.5 15 48 39 Not Exempt From Passing 58.30 0.0 0 00 21 41.7 15 36 36 Exempt From Passing 100.00 0.0 0 00 3 0.0 0 3 3 Exempt From Taking (APA) -- 5 9 -- 9 -- Limited English Proficient 52.90 6 0.0 0 00 9 47.1 8 17 17 Current LEP 69.20 0.0 0 00 9 30.8 4 13 13 Former LEP 0.00 0.0 0 00 0 100.0 4 4 4Students Coded SE & Current LEP 0 0 0 00
Scale ScoreMean
Total Points PossibleJust Proficient Mean
18 6 12 36 13 237.9 2.2 5.7 11.1 4.0 7.2
SCALE SCORE MEANS & CLUSTER MEANS FOR STUDENTS WITH VALID SCALE SCORES
7
8
Writing Expository Persuasive ReadingInterpreting
TextAnalyzing /
Critiquing Text
54
Total Students 215.93 8.9 6.0 2.5 6.4 15.3 9.3 General Education 224.0 4 9.8 6.6 2.8 7.0 16.8 10.2 Special Education 190.7 6.2 4.0 1.6 4.7 10.7 6.7 Not Exempt From Passing 193.3 6.3 4.3 1.6 4.8 11.2 7.0 Exempt From Passing 159.3 4.7 1.3 1.3 3.3 4.7 3.3 Limited English Proficient 192.2 6 6.6 4.3 1.9 4.7 10.6 6.4 Current LEP 185.7 5.7 4.1 1.6 4.1 9.8 5.7 Former LEP 213.5 9.6 4.9 2.9 6.8 13.4 8.5
29-2520
Page 1 of 1
Percentages may not total 100 due to rounding.Includes students coded Medical Emergency.Students are included in Total Students only once, but they appear in all other categories that apply.Includes students coded Former LEP who are not Special Education.Students coded IEP Exempt From Taking the HSPA are required to take the Alternate Proficiency Assessment (APA).Includes students coded Current and Former LEP.The range of scale scores is 100 to 300.The numbers in this row are the statewide raw score means for students whose scale score is 200.
1
2
3
4
5
6
7
8
115

!!!!
Exhibit!18!
116

117

118

119

120

121

122

123
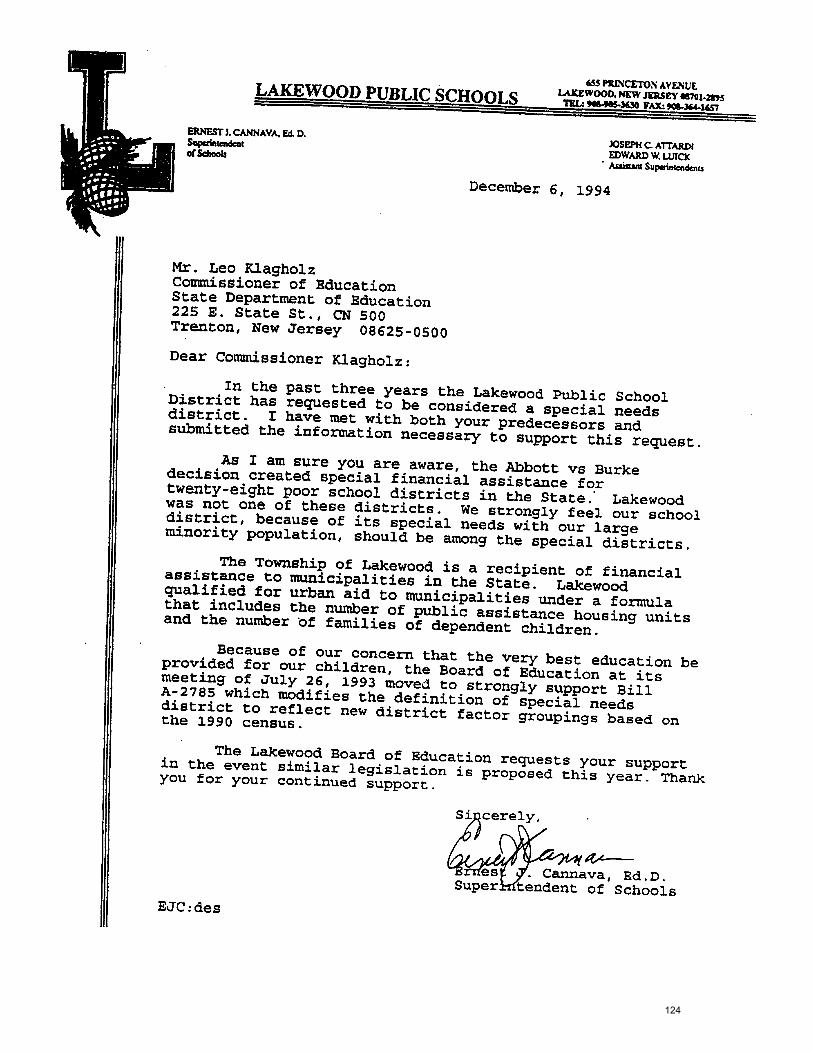
124

125

126

127

128

129

130

131

132

133

134

135

136

137